Submitted:
27 February 2025
Posted:
28 February 2025
You are already at the latest version
Abstract
This study investigates the synthesis and application of Hydroxyapatite (HAp)-modified zeolite materials for efficient fluoride removal from groundwater-based drinking water. The characterization confirmed the successful incorporation of HAp onto the zeolite surface and the formation of a stable composite. EDS analysis revealed the presence of Ca and P after modification, while FTIR and XRD confirmed the structural integrity of HAp during adsorption. The ZH8 exhibited the highest F- removal efficiency of 92.23% at pH 3. Meanwhile, the HAp-modified zeolite showed high F- selectivity, the competing ions, like chloride and bromide, had limited interference. Isotherm studies revealed that the Langmuir model best described the adsorption process, suggesting monolayer adsorption with a maximum capacity of 39.38 mg/g for ZH8. Kinetic studies indicated that the process followed pseudo-first-order kinetics, with equilibrium achieved within 4 hours. Regeneration studies demonstrated that ZH8 maintained over 85% efficiency for three cycles, highlighting its reusability. Column studies validated the material’s practical applicability, with breakthrough times of up to 23 hours under optimal conditions (flow rate: 8 cm³ min-1, bed depth: 30 cm, feed concentration: 7.5 ppm). Thomas model best described the column adsorption process, indicating chemical adsorption as the dominant mechanism. These findings demonstrate the potential of HAp-modified zeolite, particularly ZH8, as an effective adsorbent for fluoride removal in real-world applications.
Keywords:
1. Introduction
2. Materials and Methods
2.1. Materials
2.2. Surface modification of raw zeolite
2.3. Characterization
2.4. Batch Study
2.5. Isotherm Study
2.6. Kinetic Study
2.7. Column Study
3. Results and Discussion
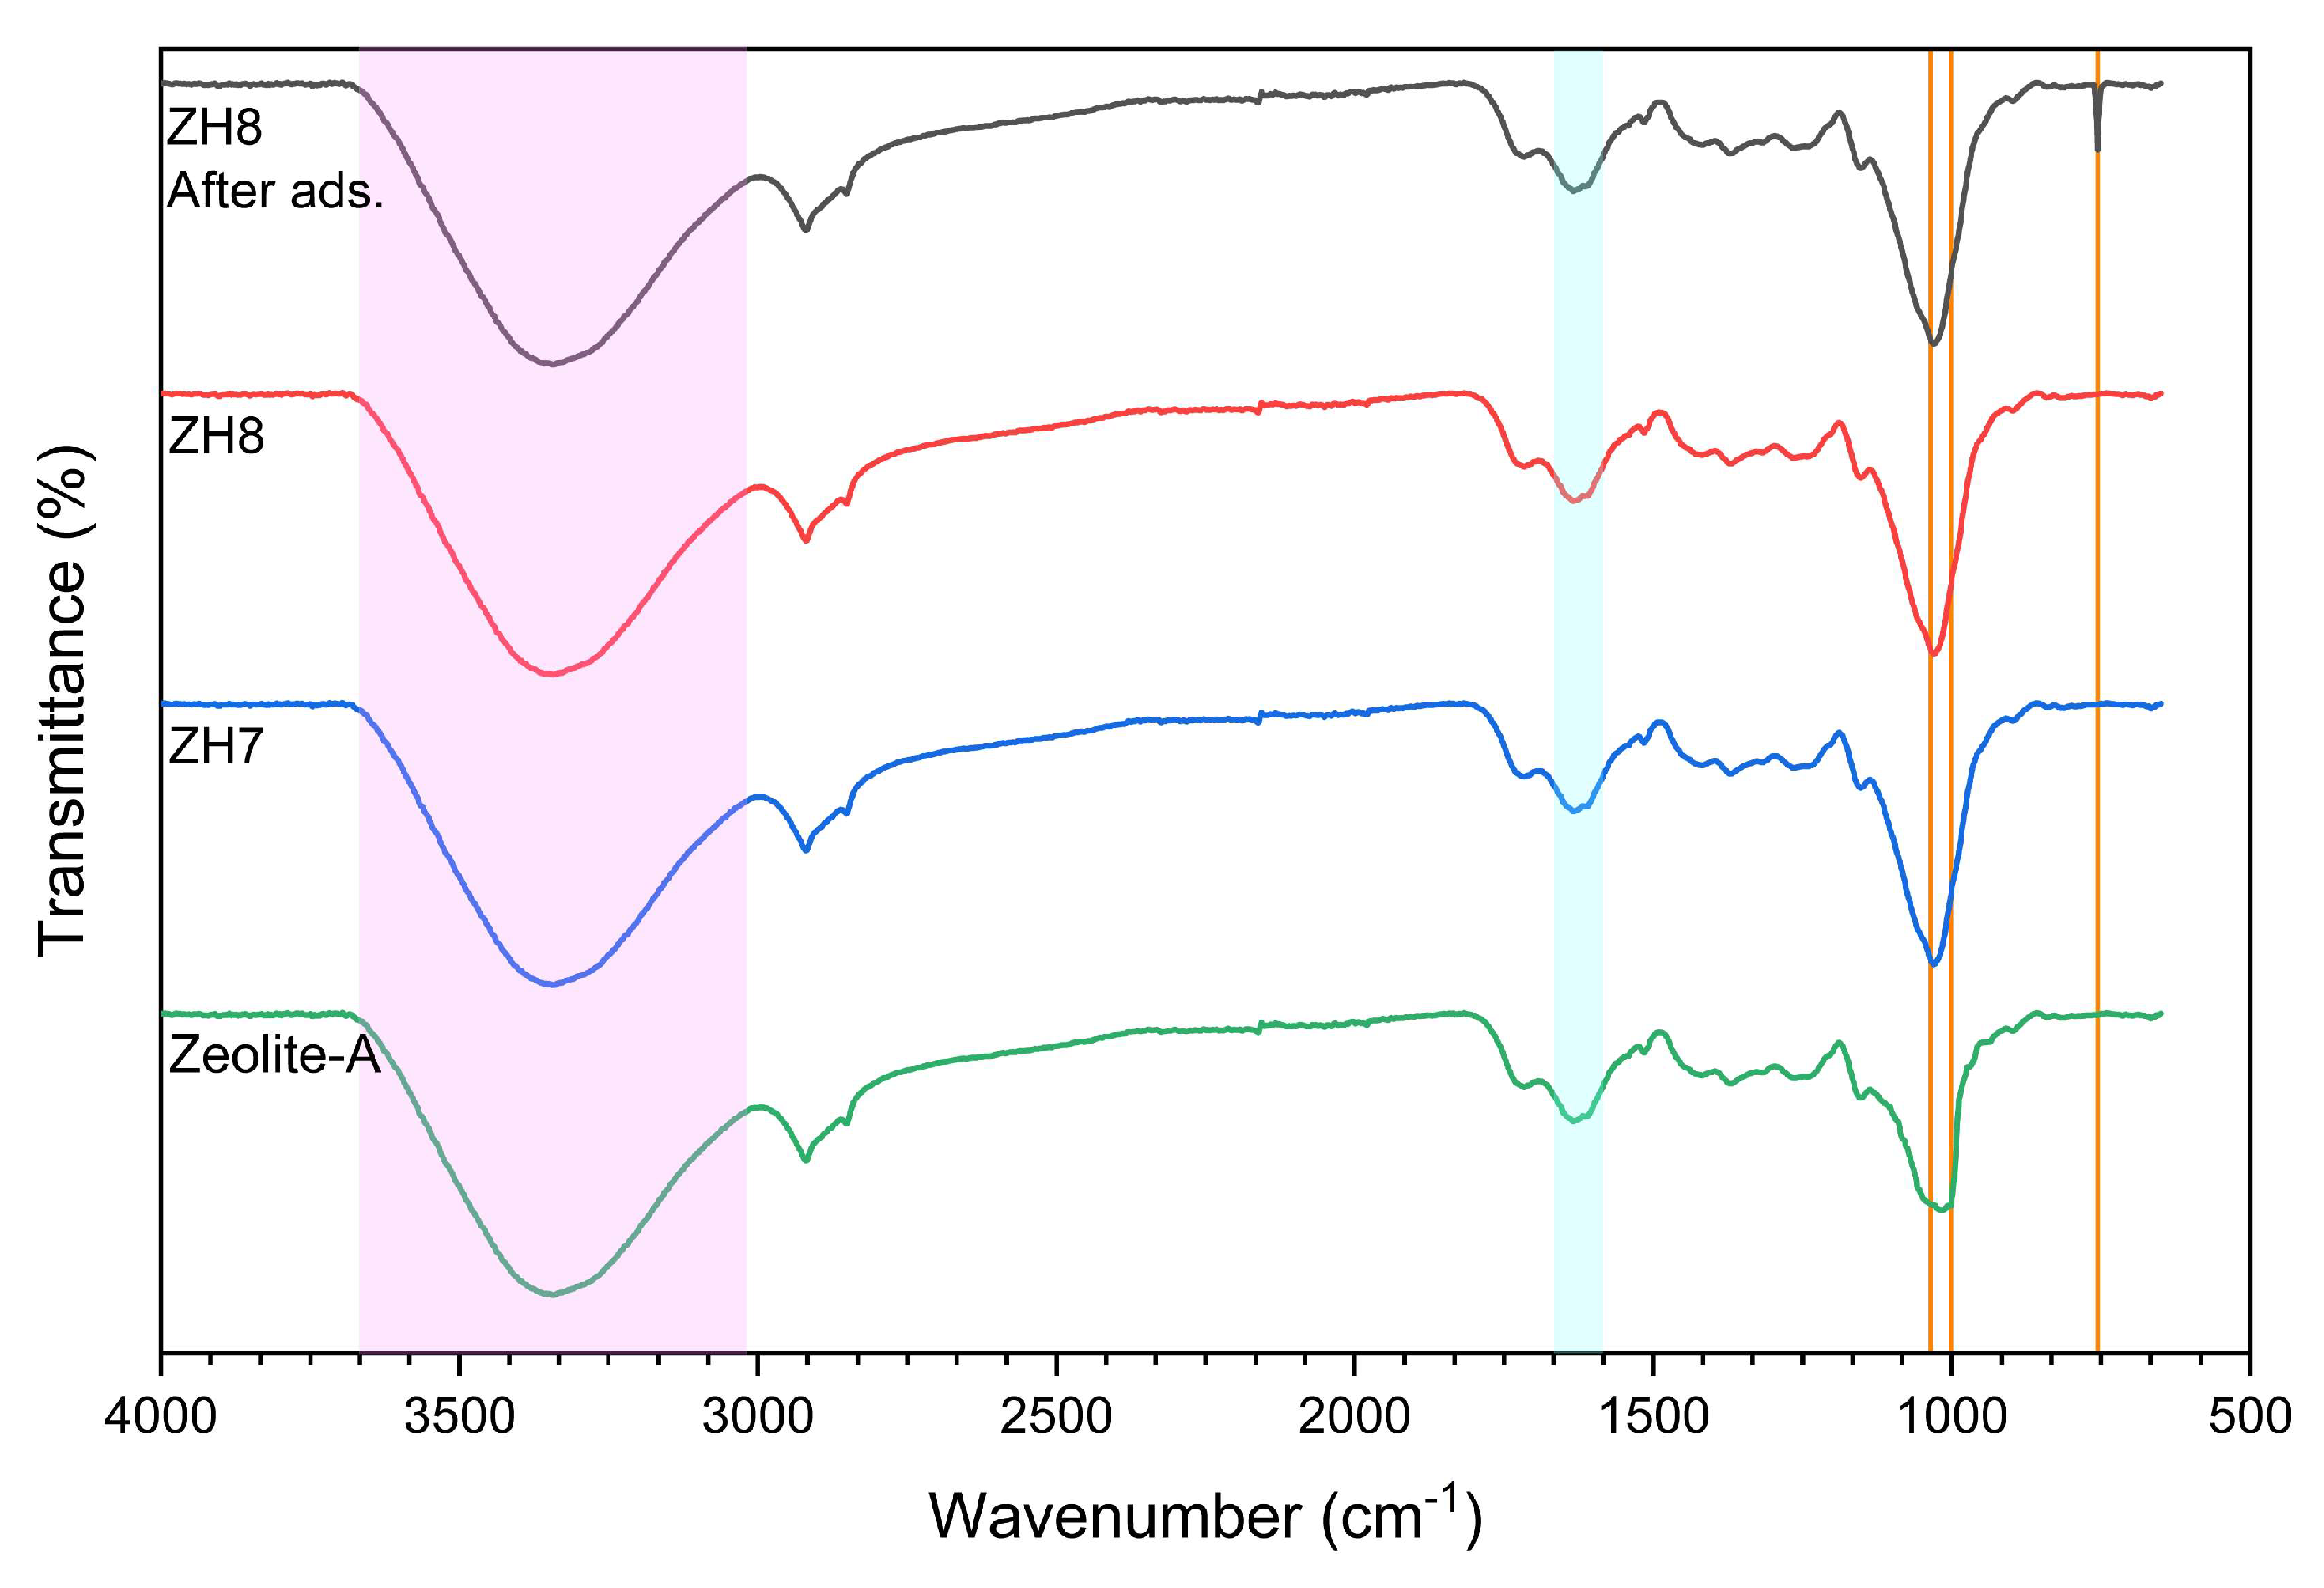
3.1. Characterization of the modified zeolite
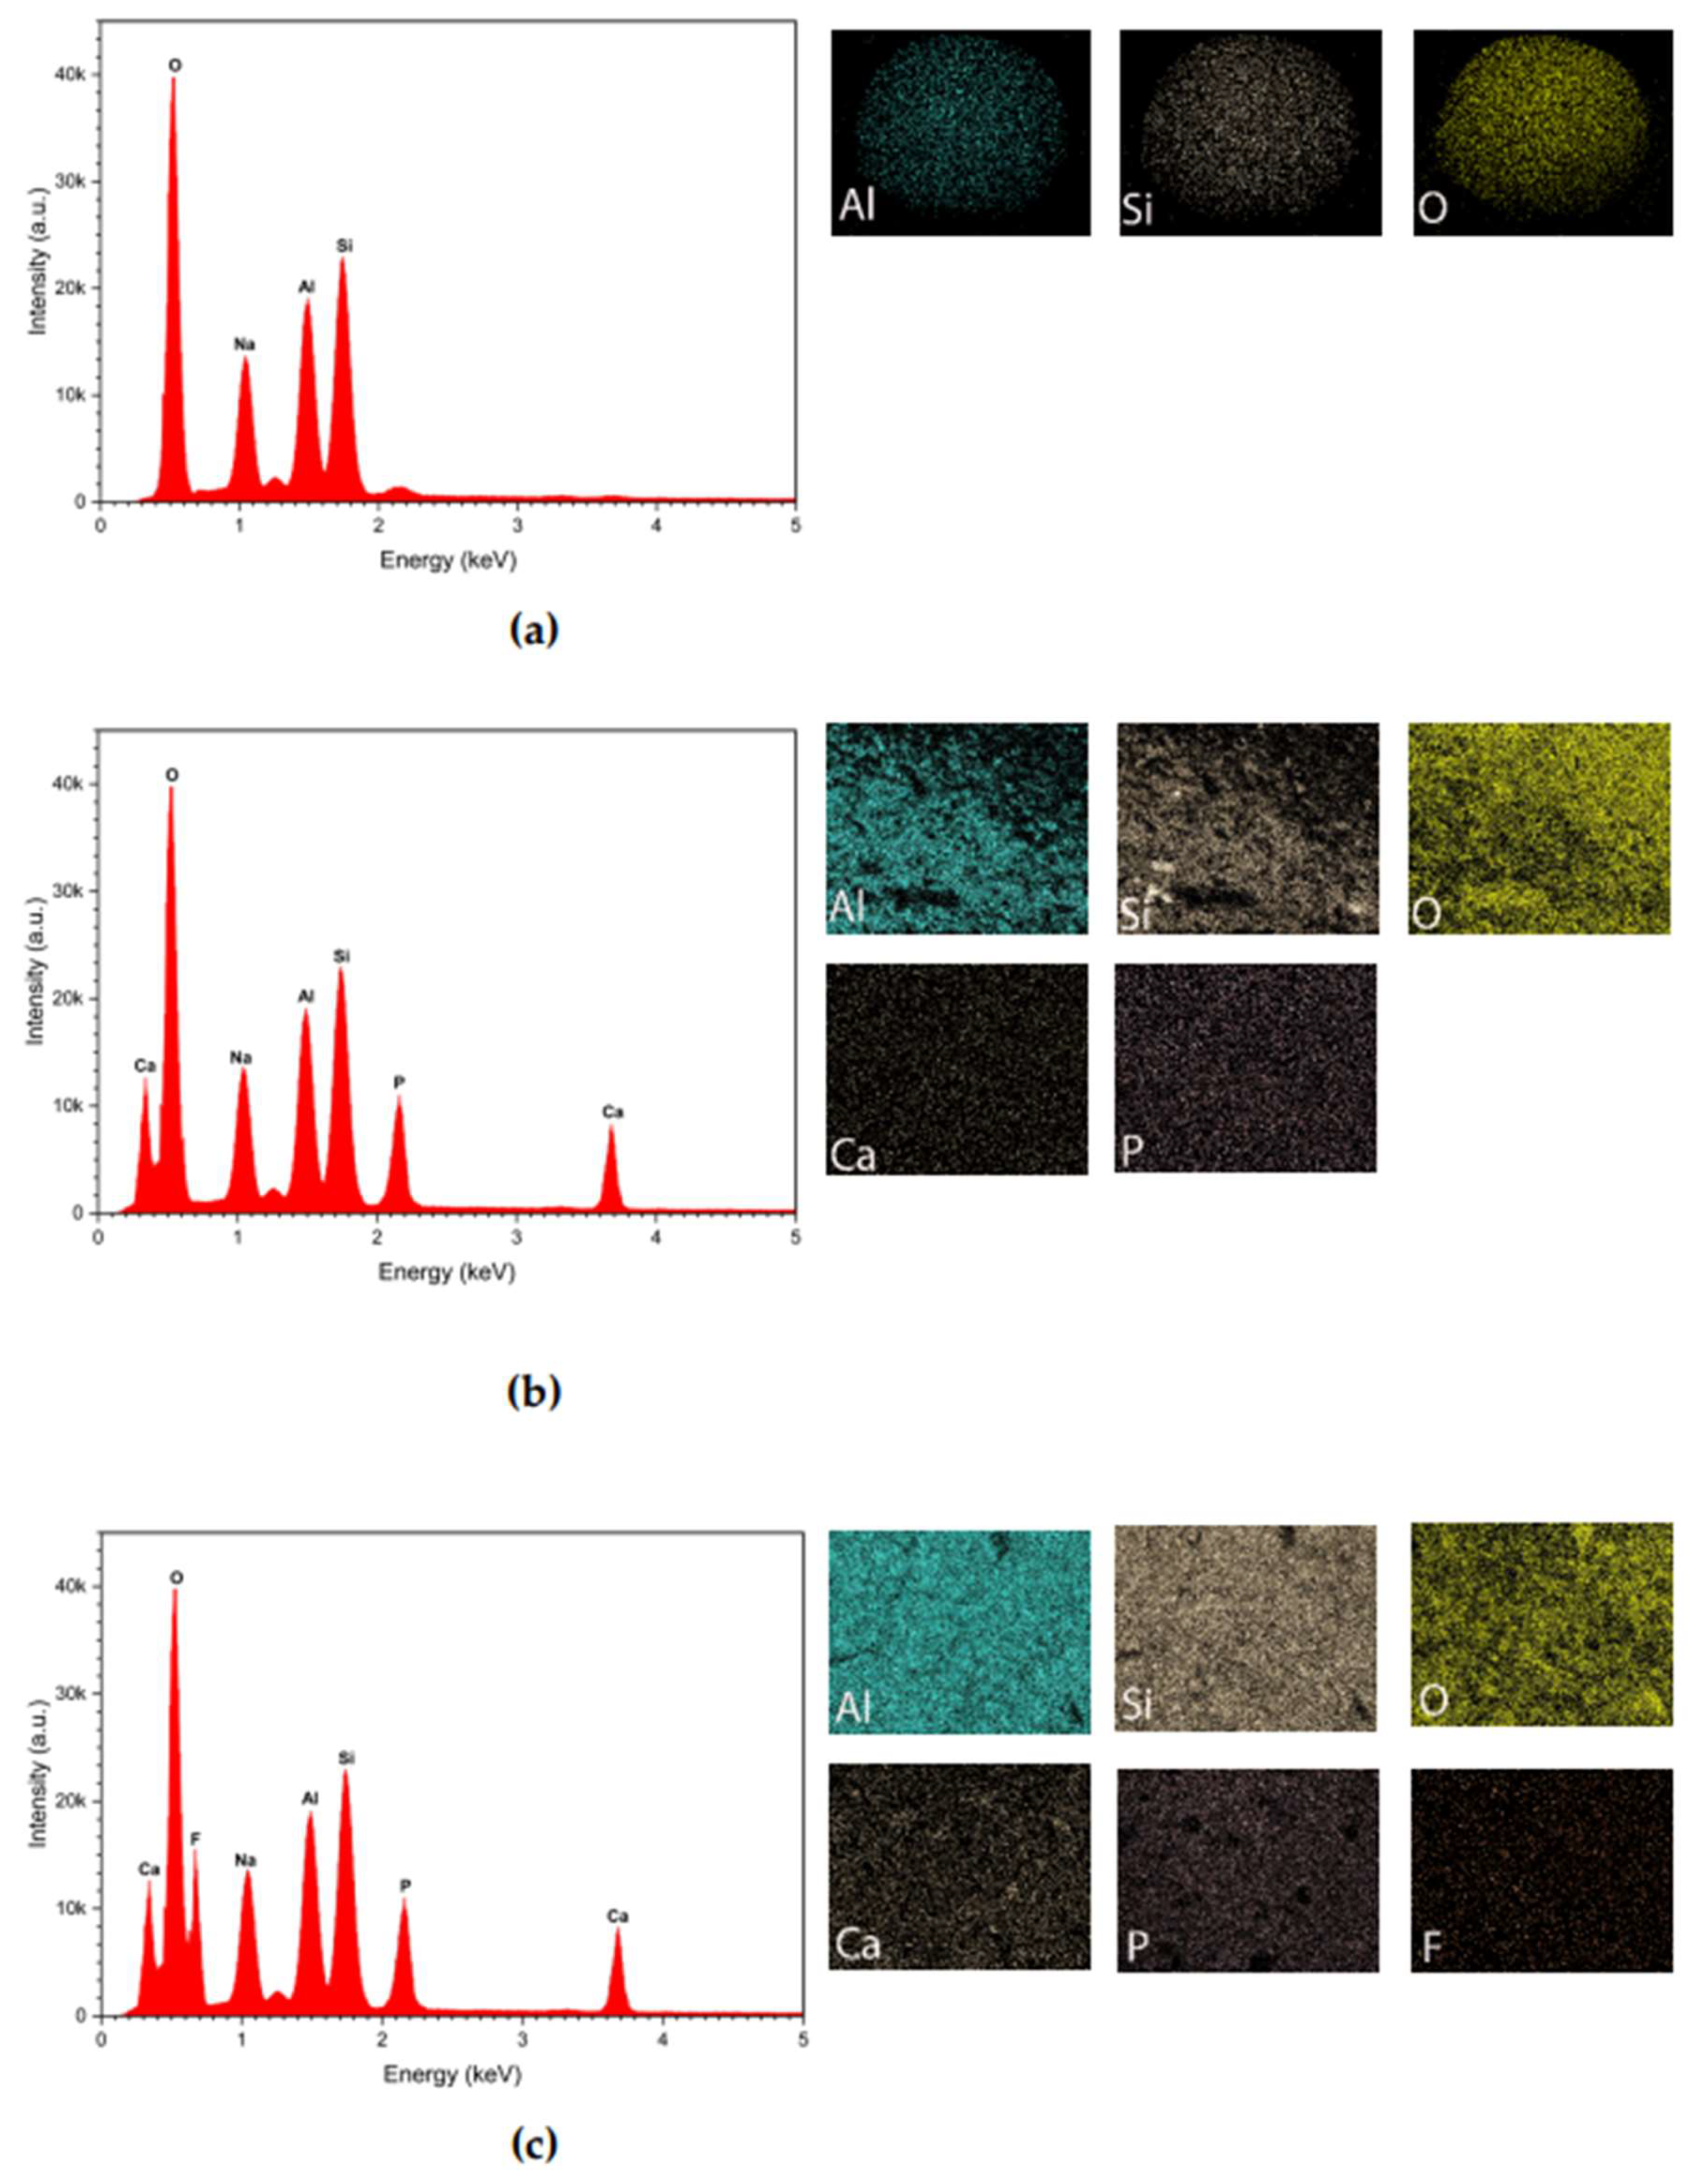
3.1.1. EDS
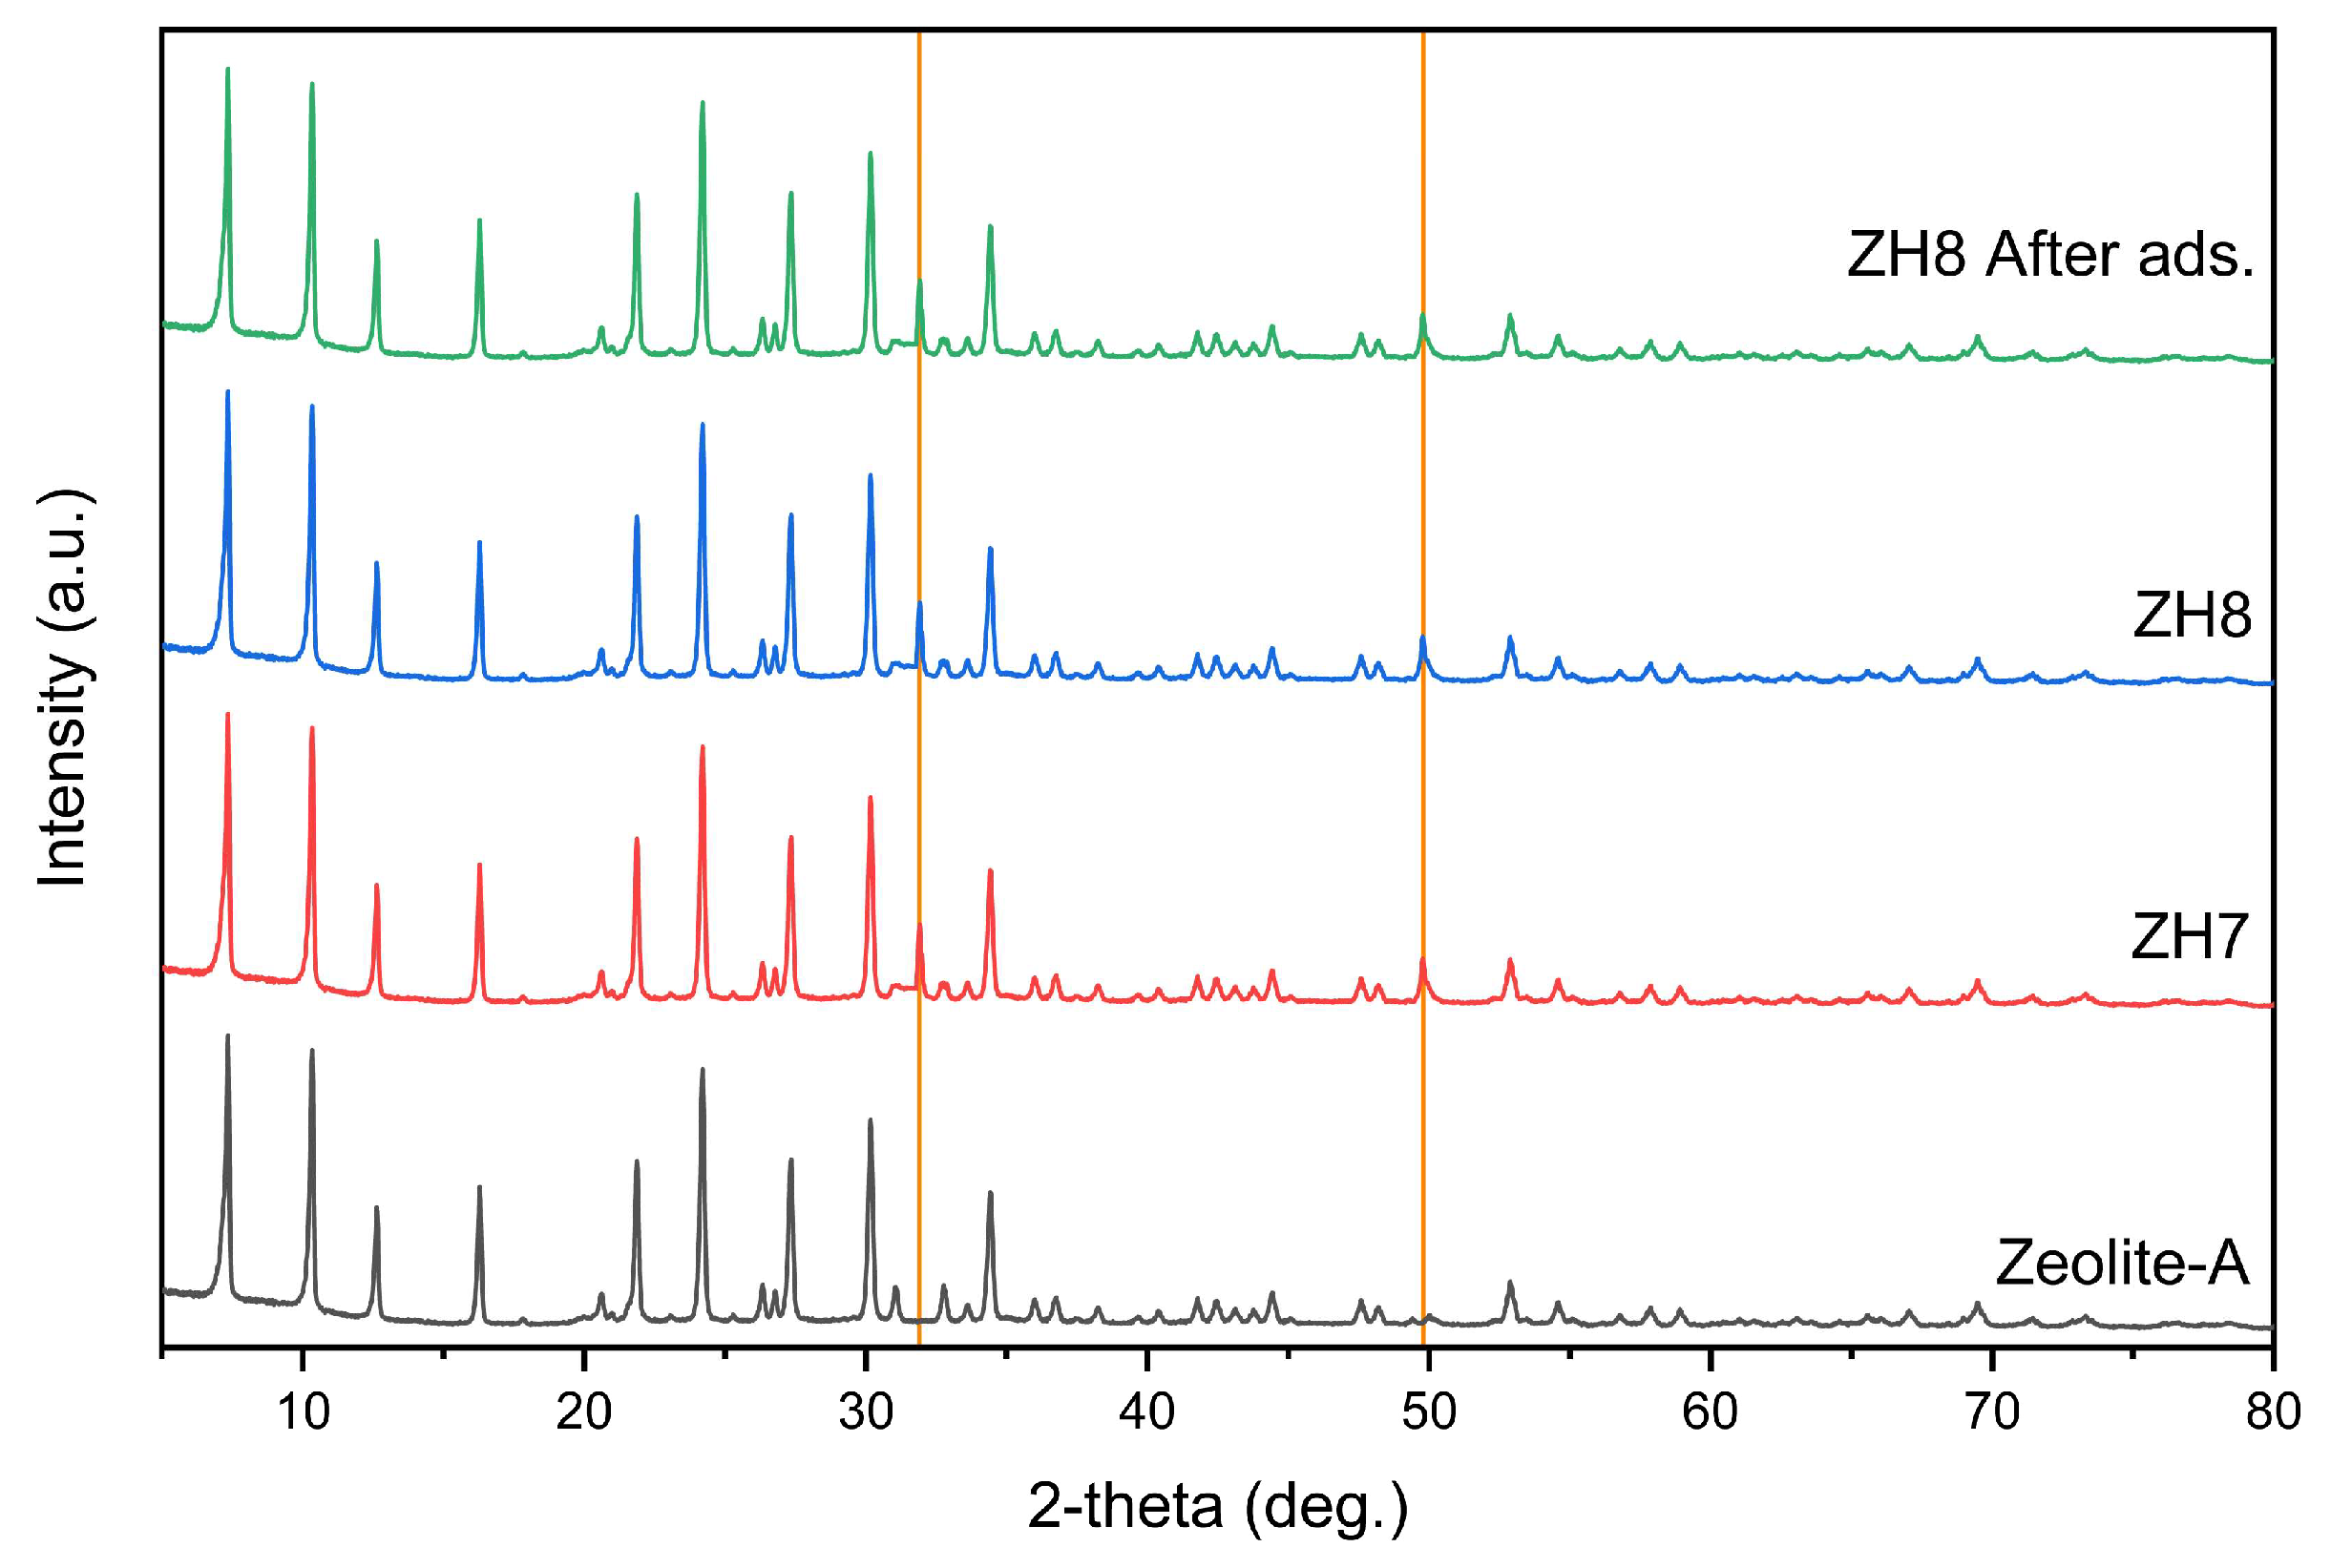
3.1.3 XRD
3.2 Adsorption performance
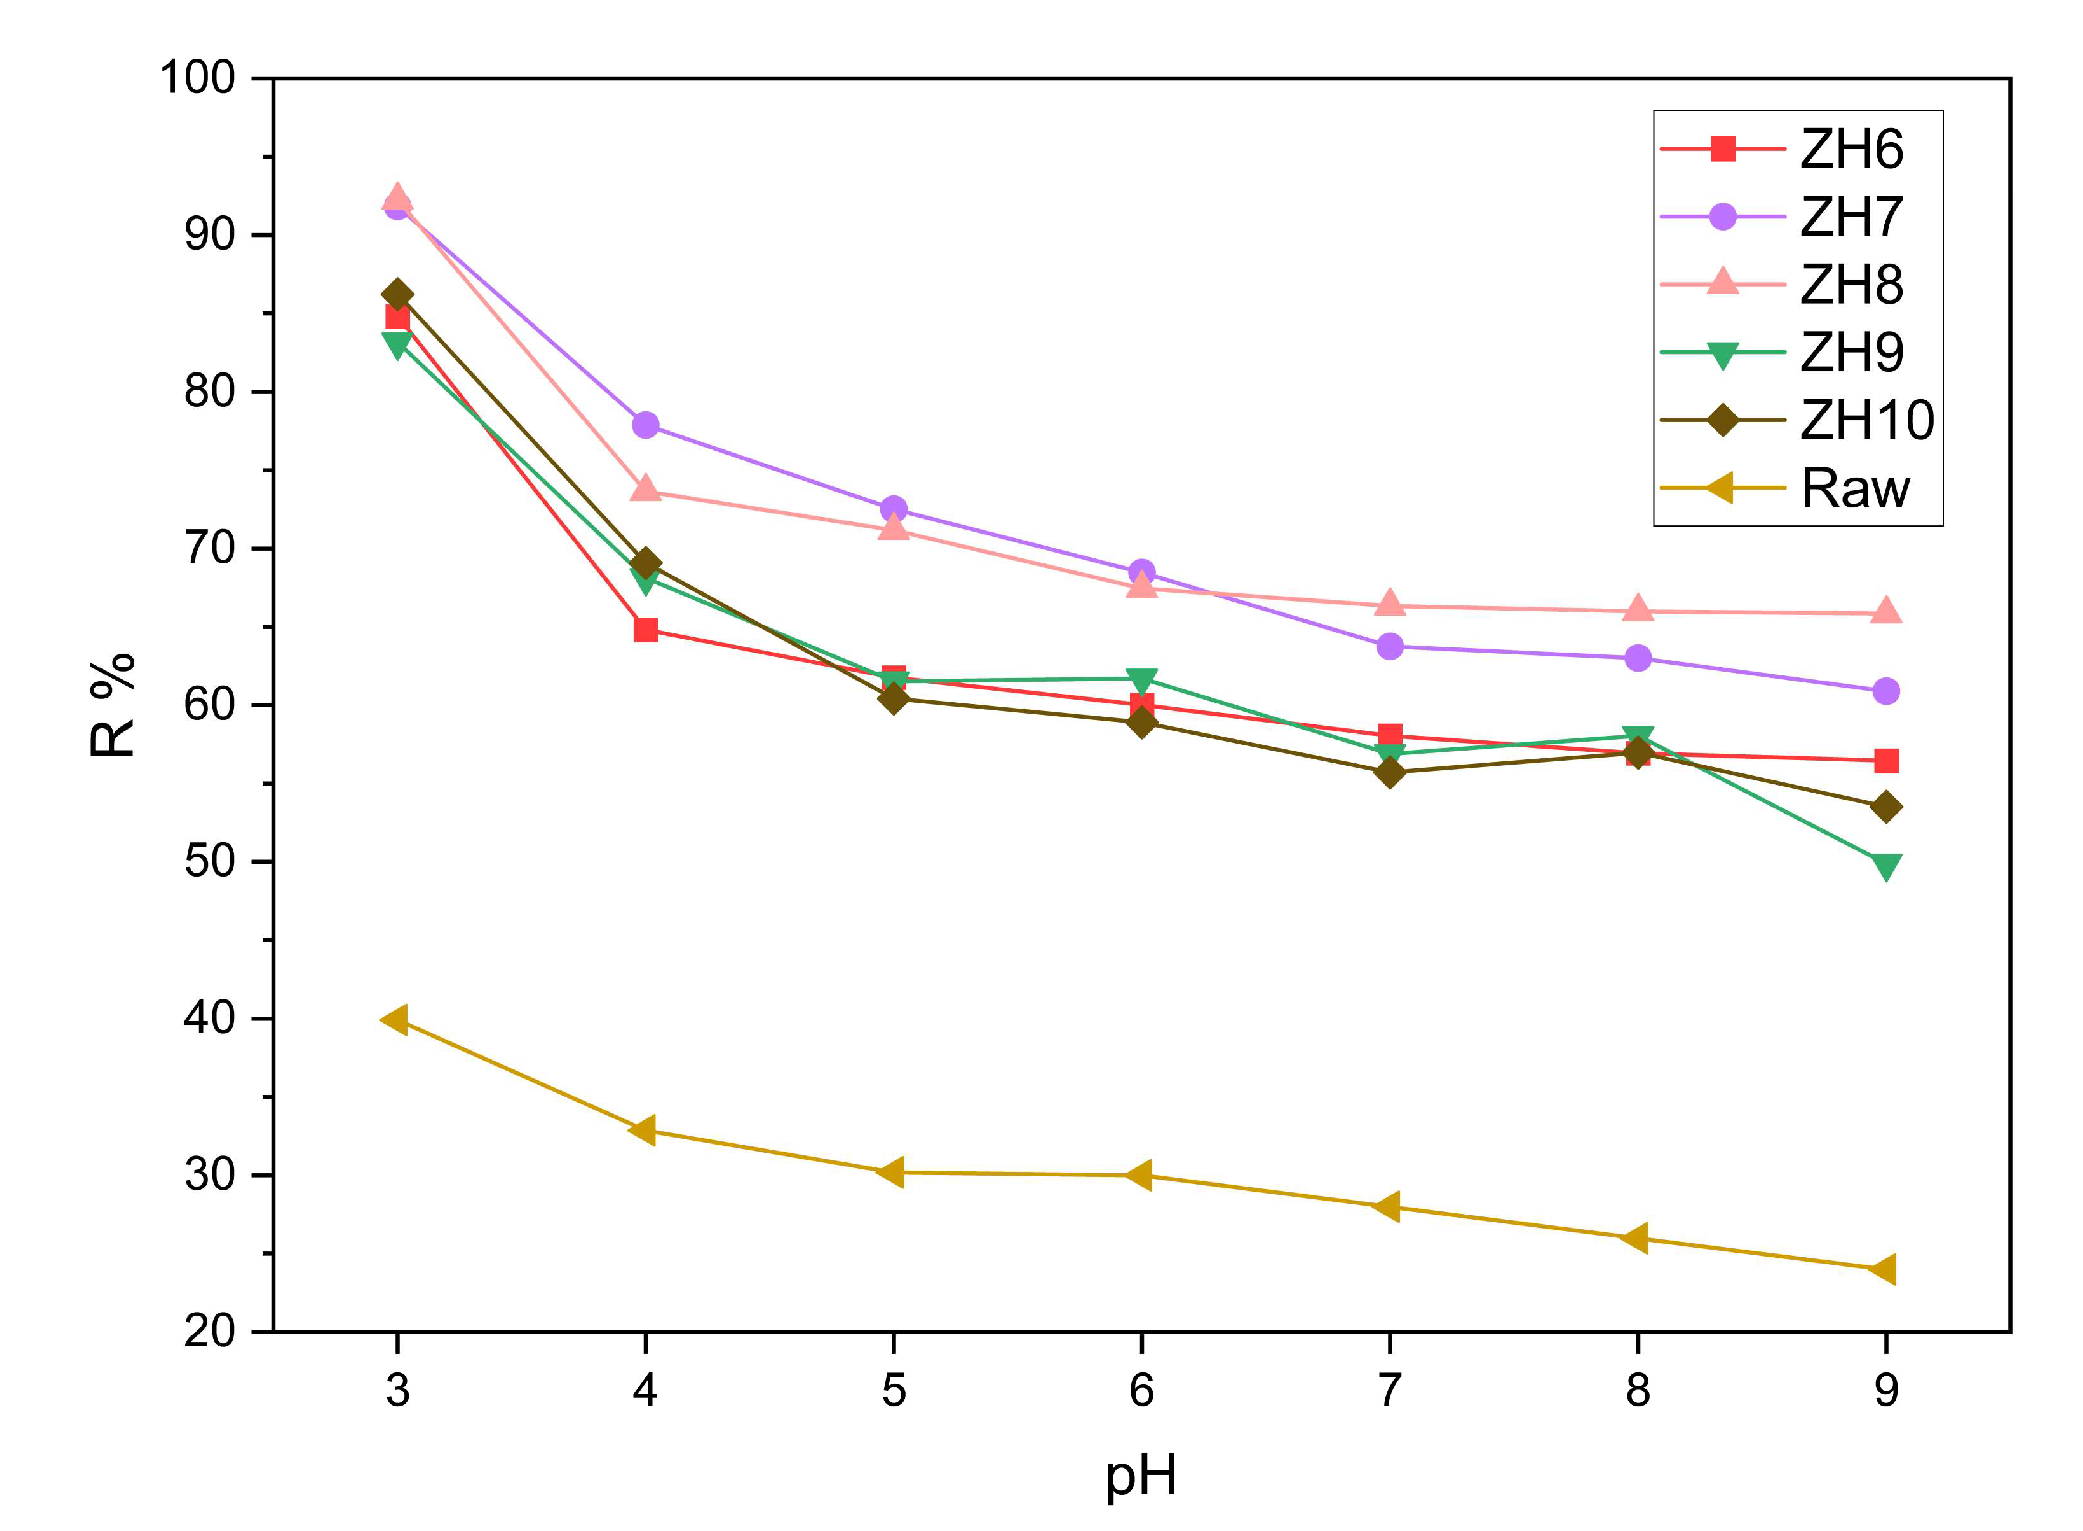
3.2.1 Effect of pH on removal efficiency
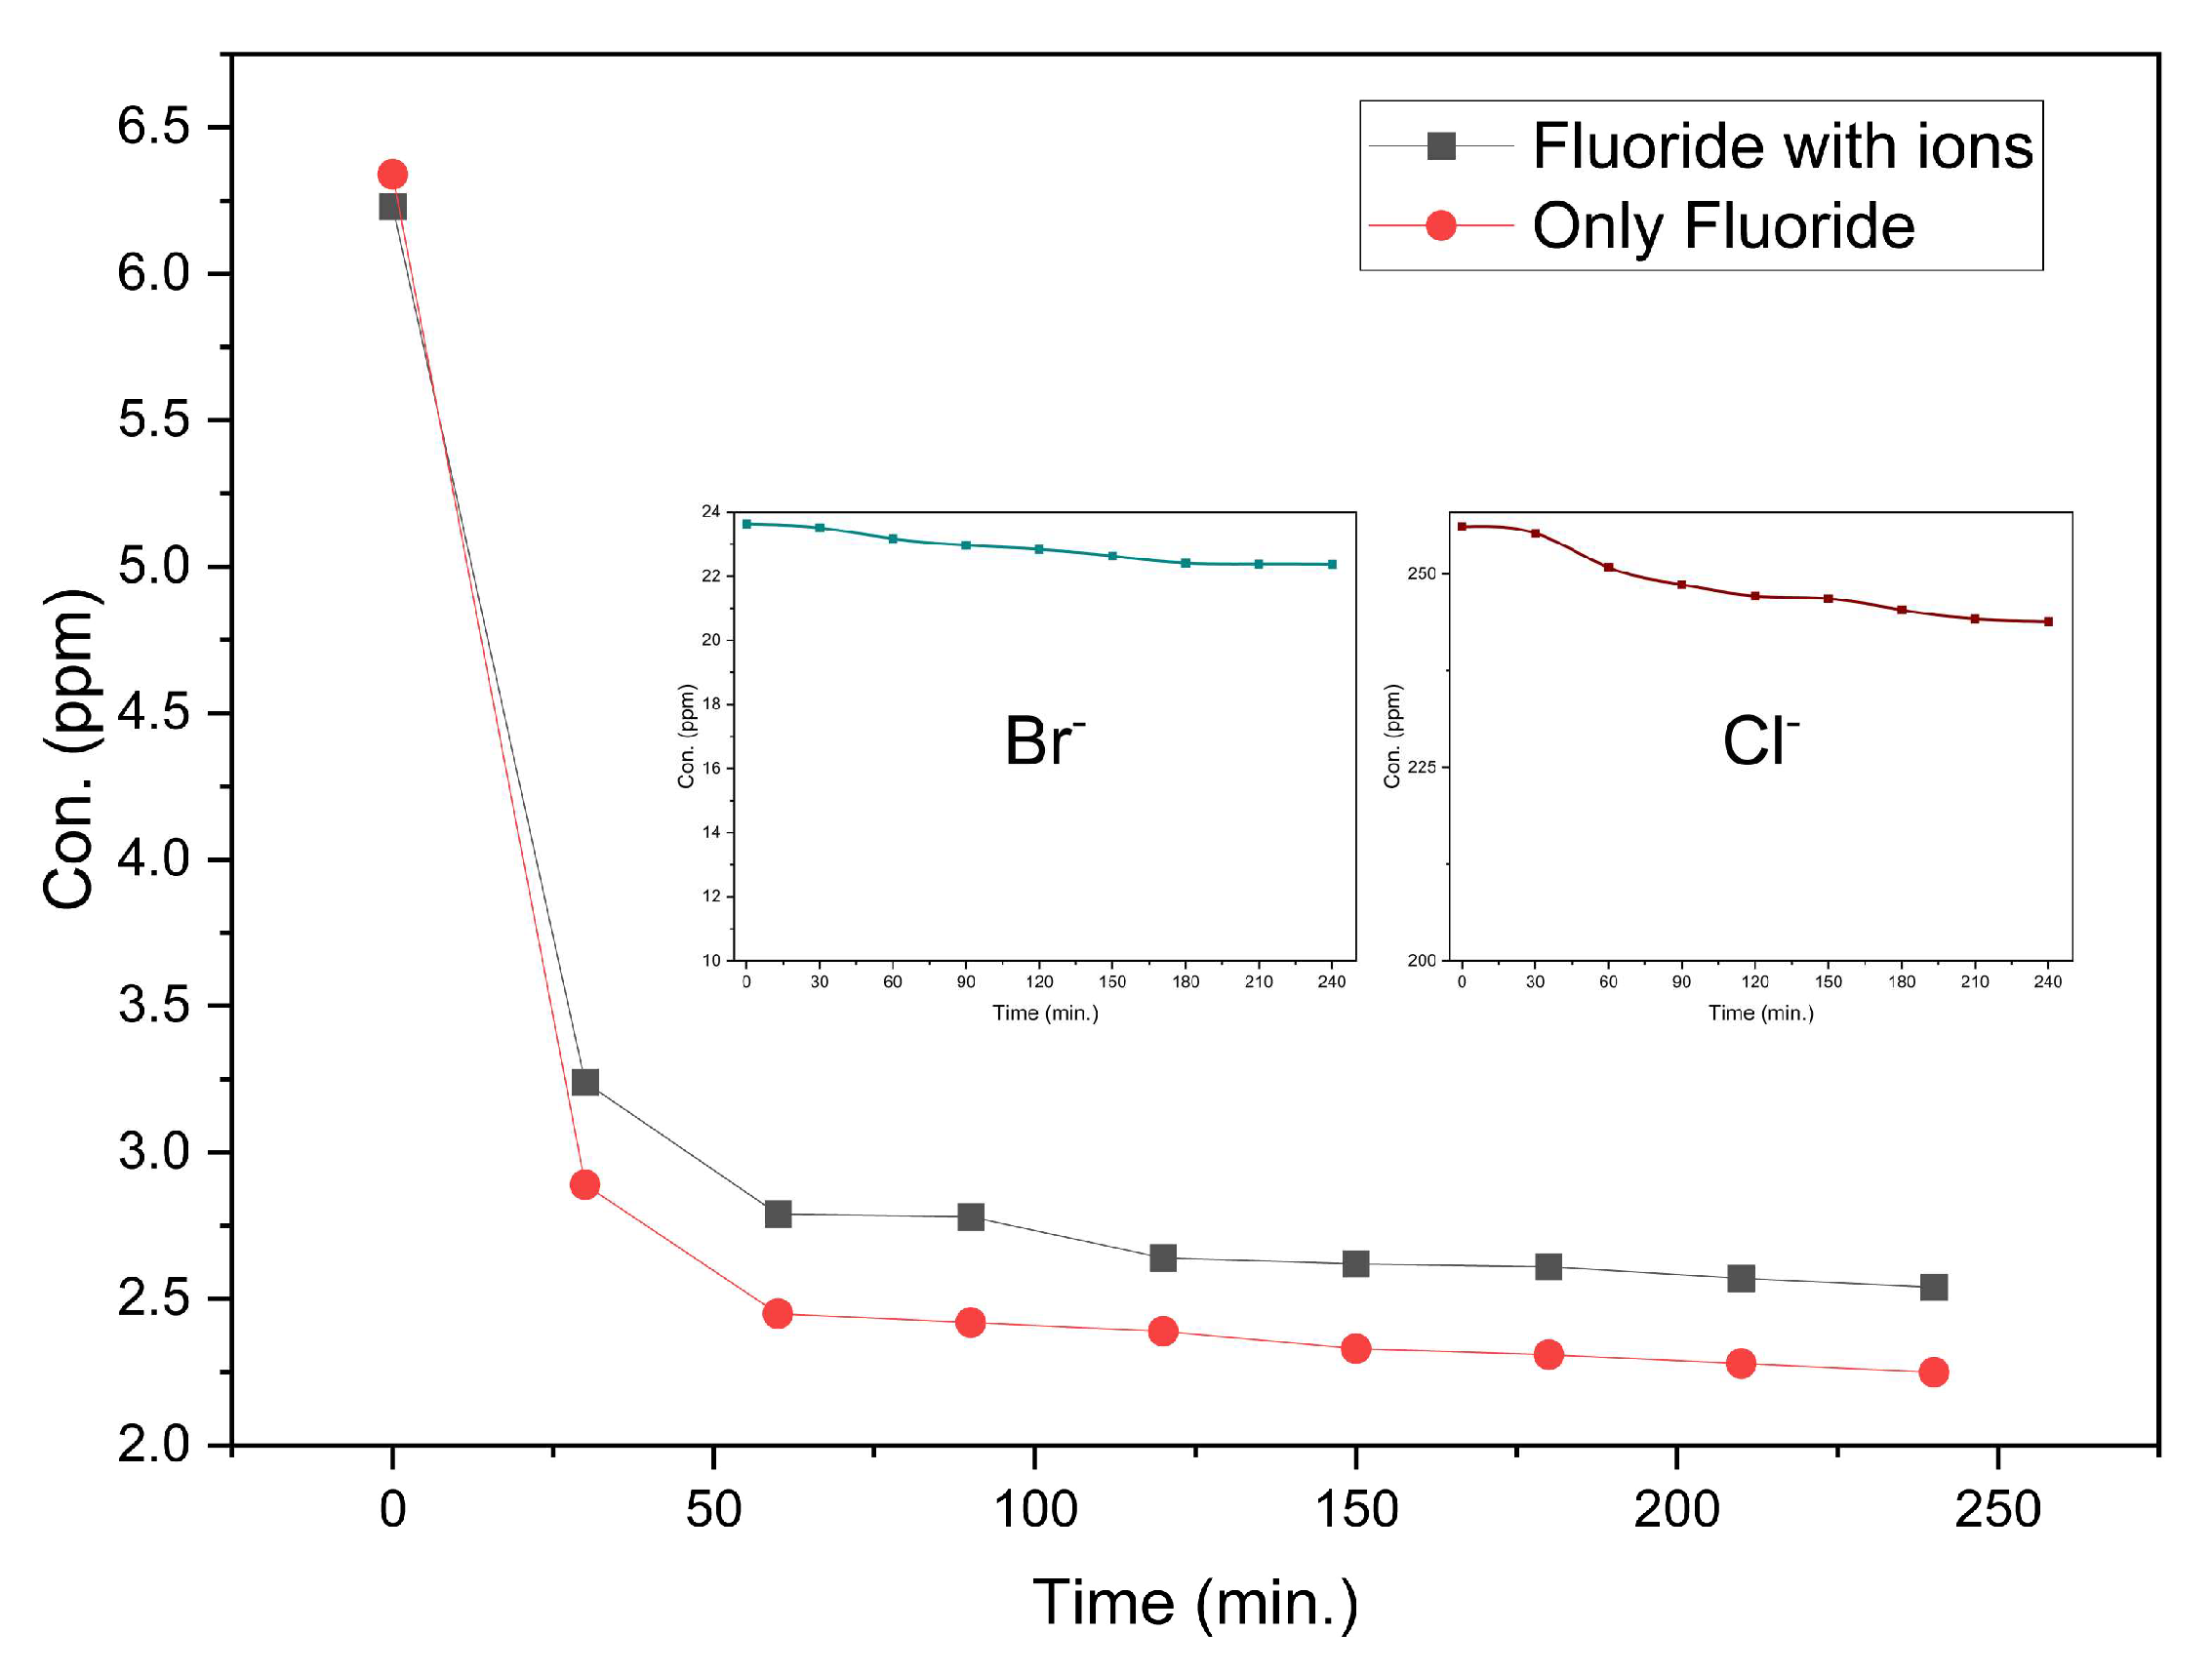
3.2.2. Effect of competing ions
3.3 Adsorption mechanism
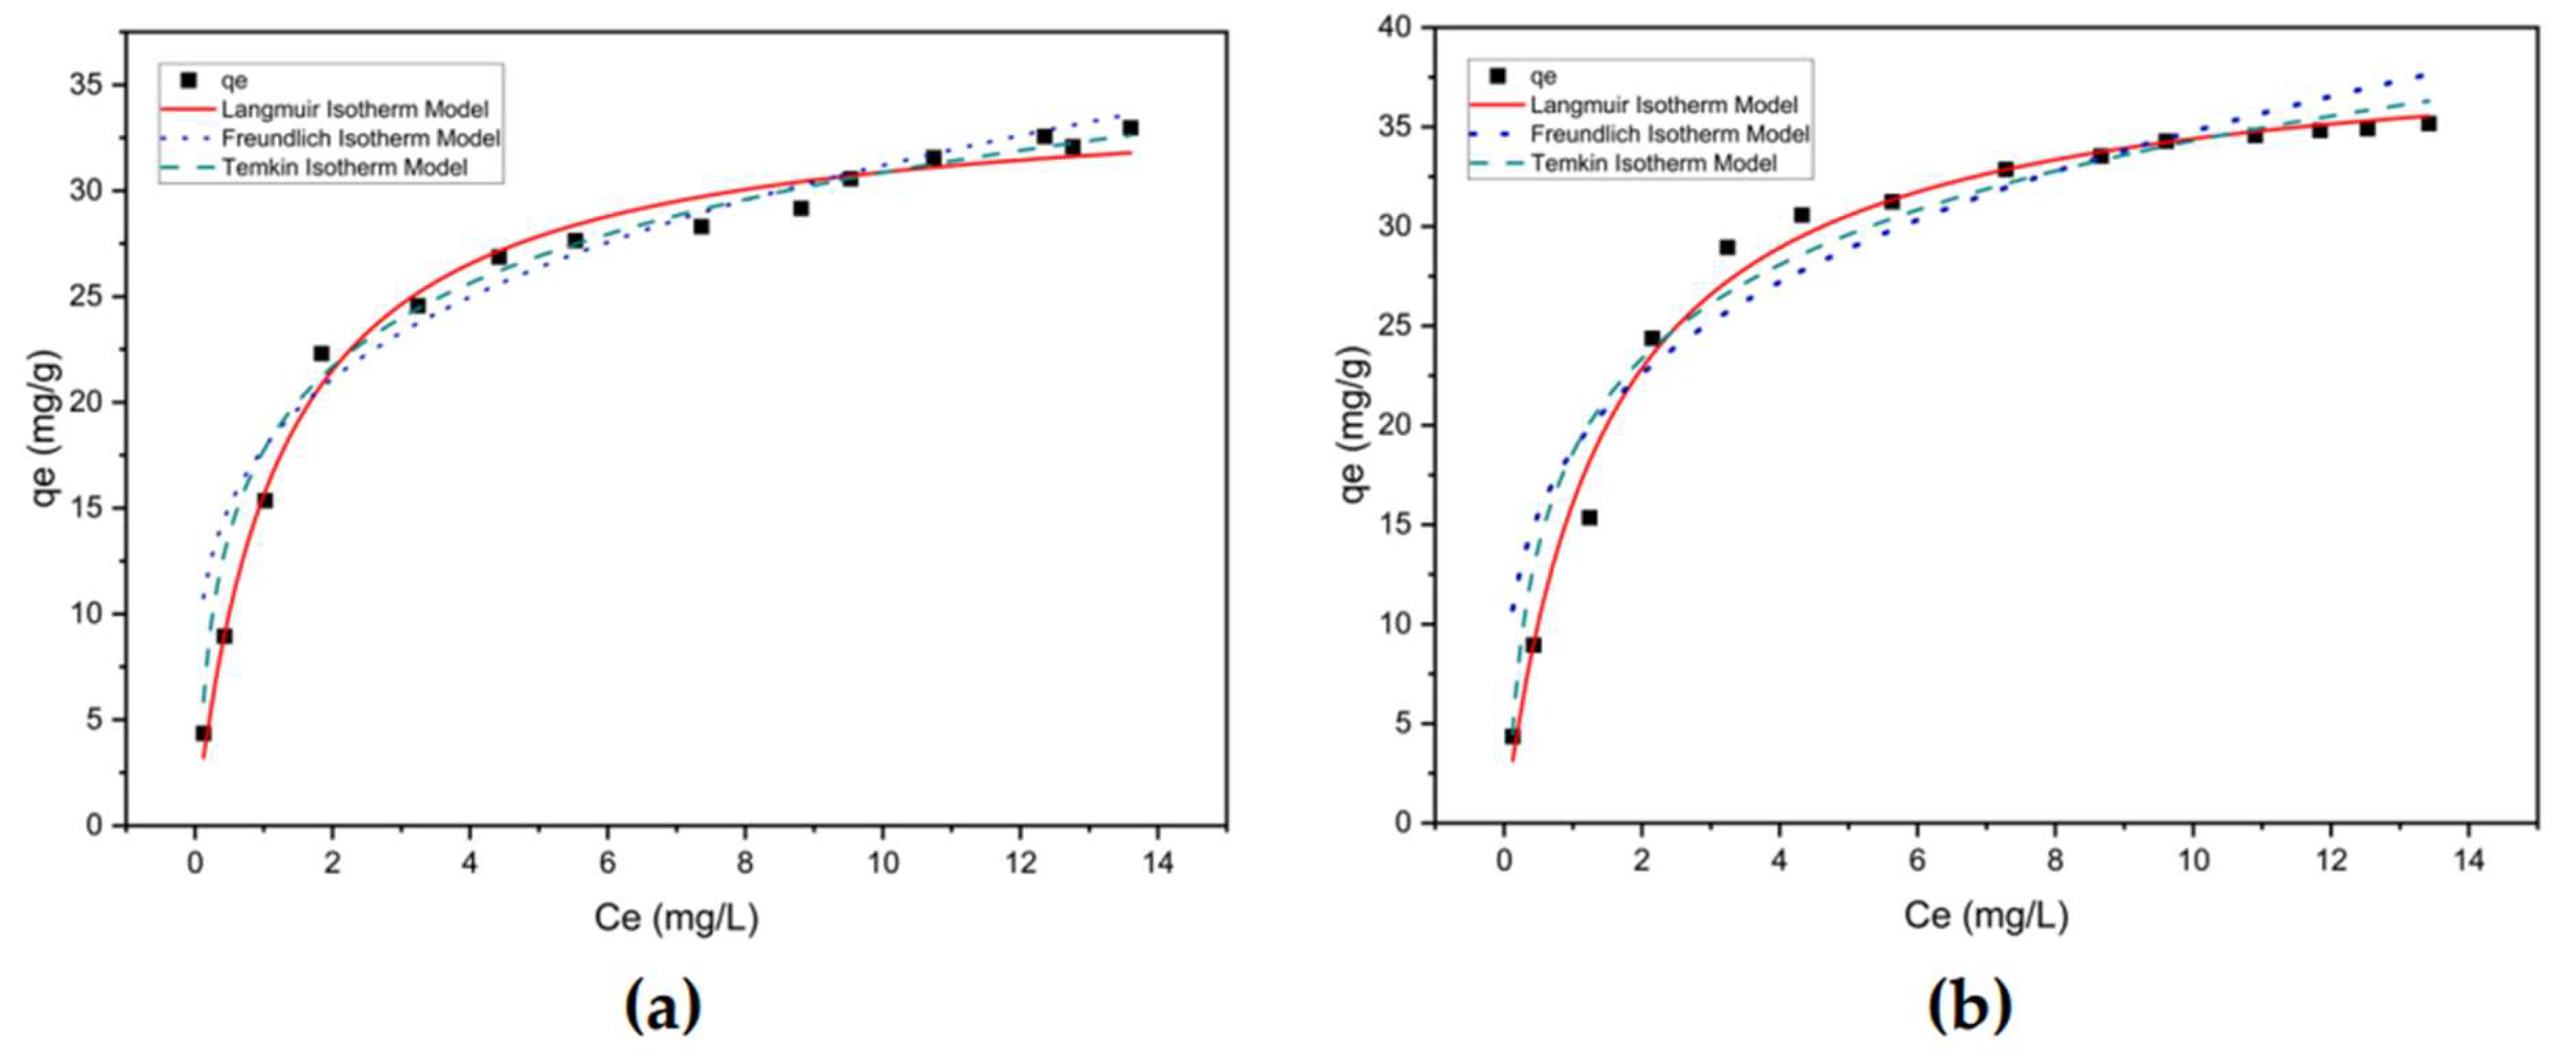
3.3.1 Isotherm study
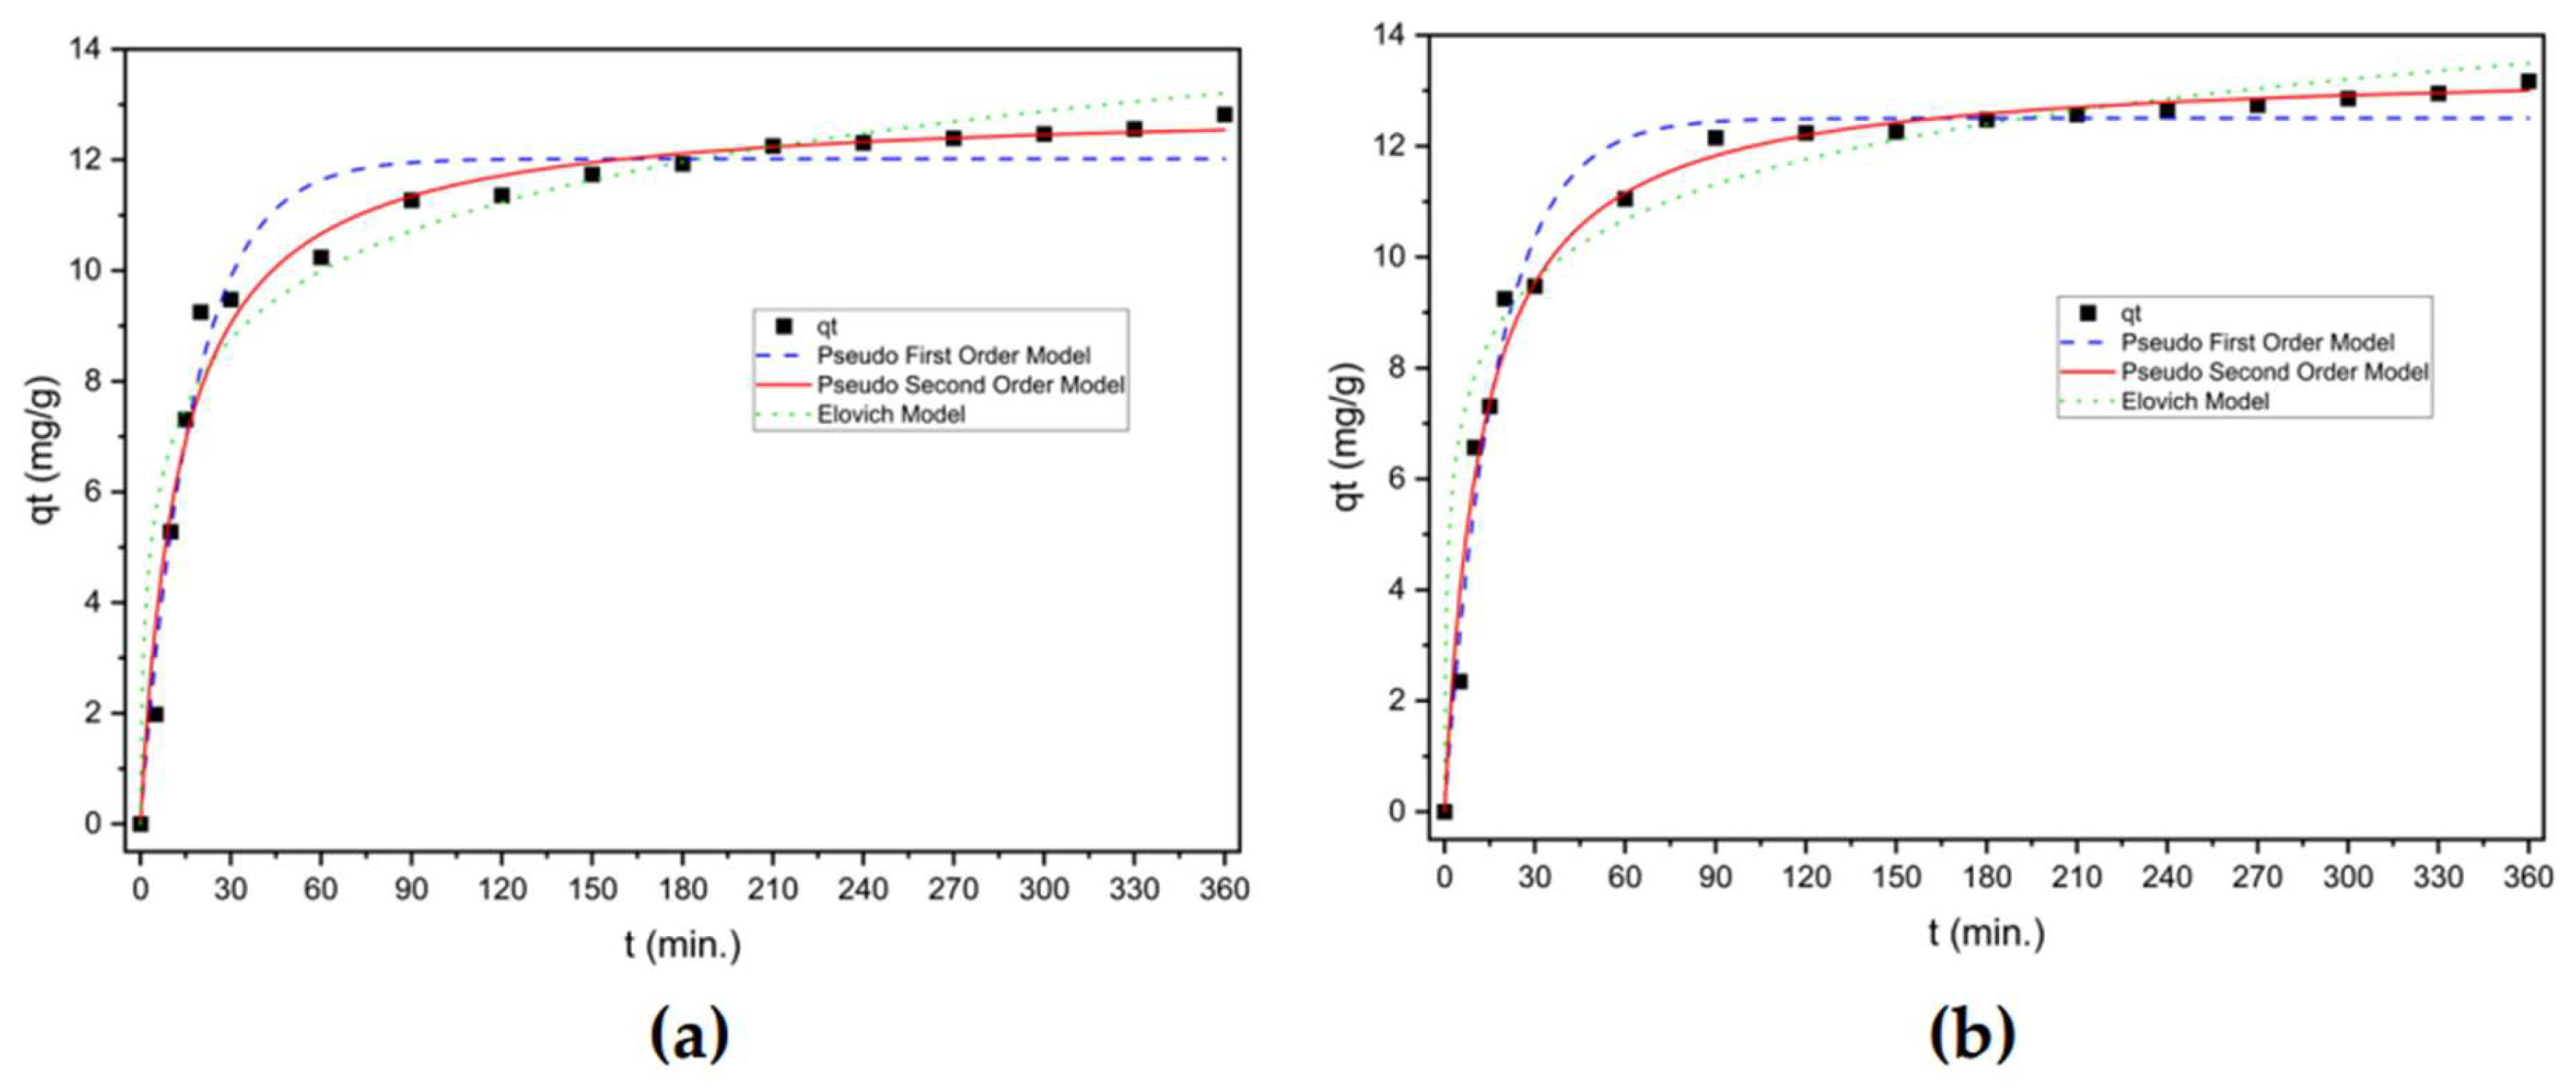
3.3.2 Kinetic study
3.4 Practical application study
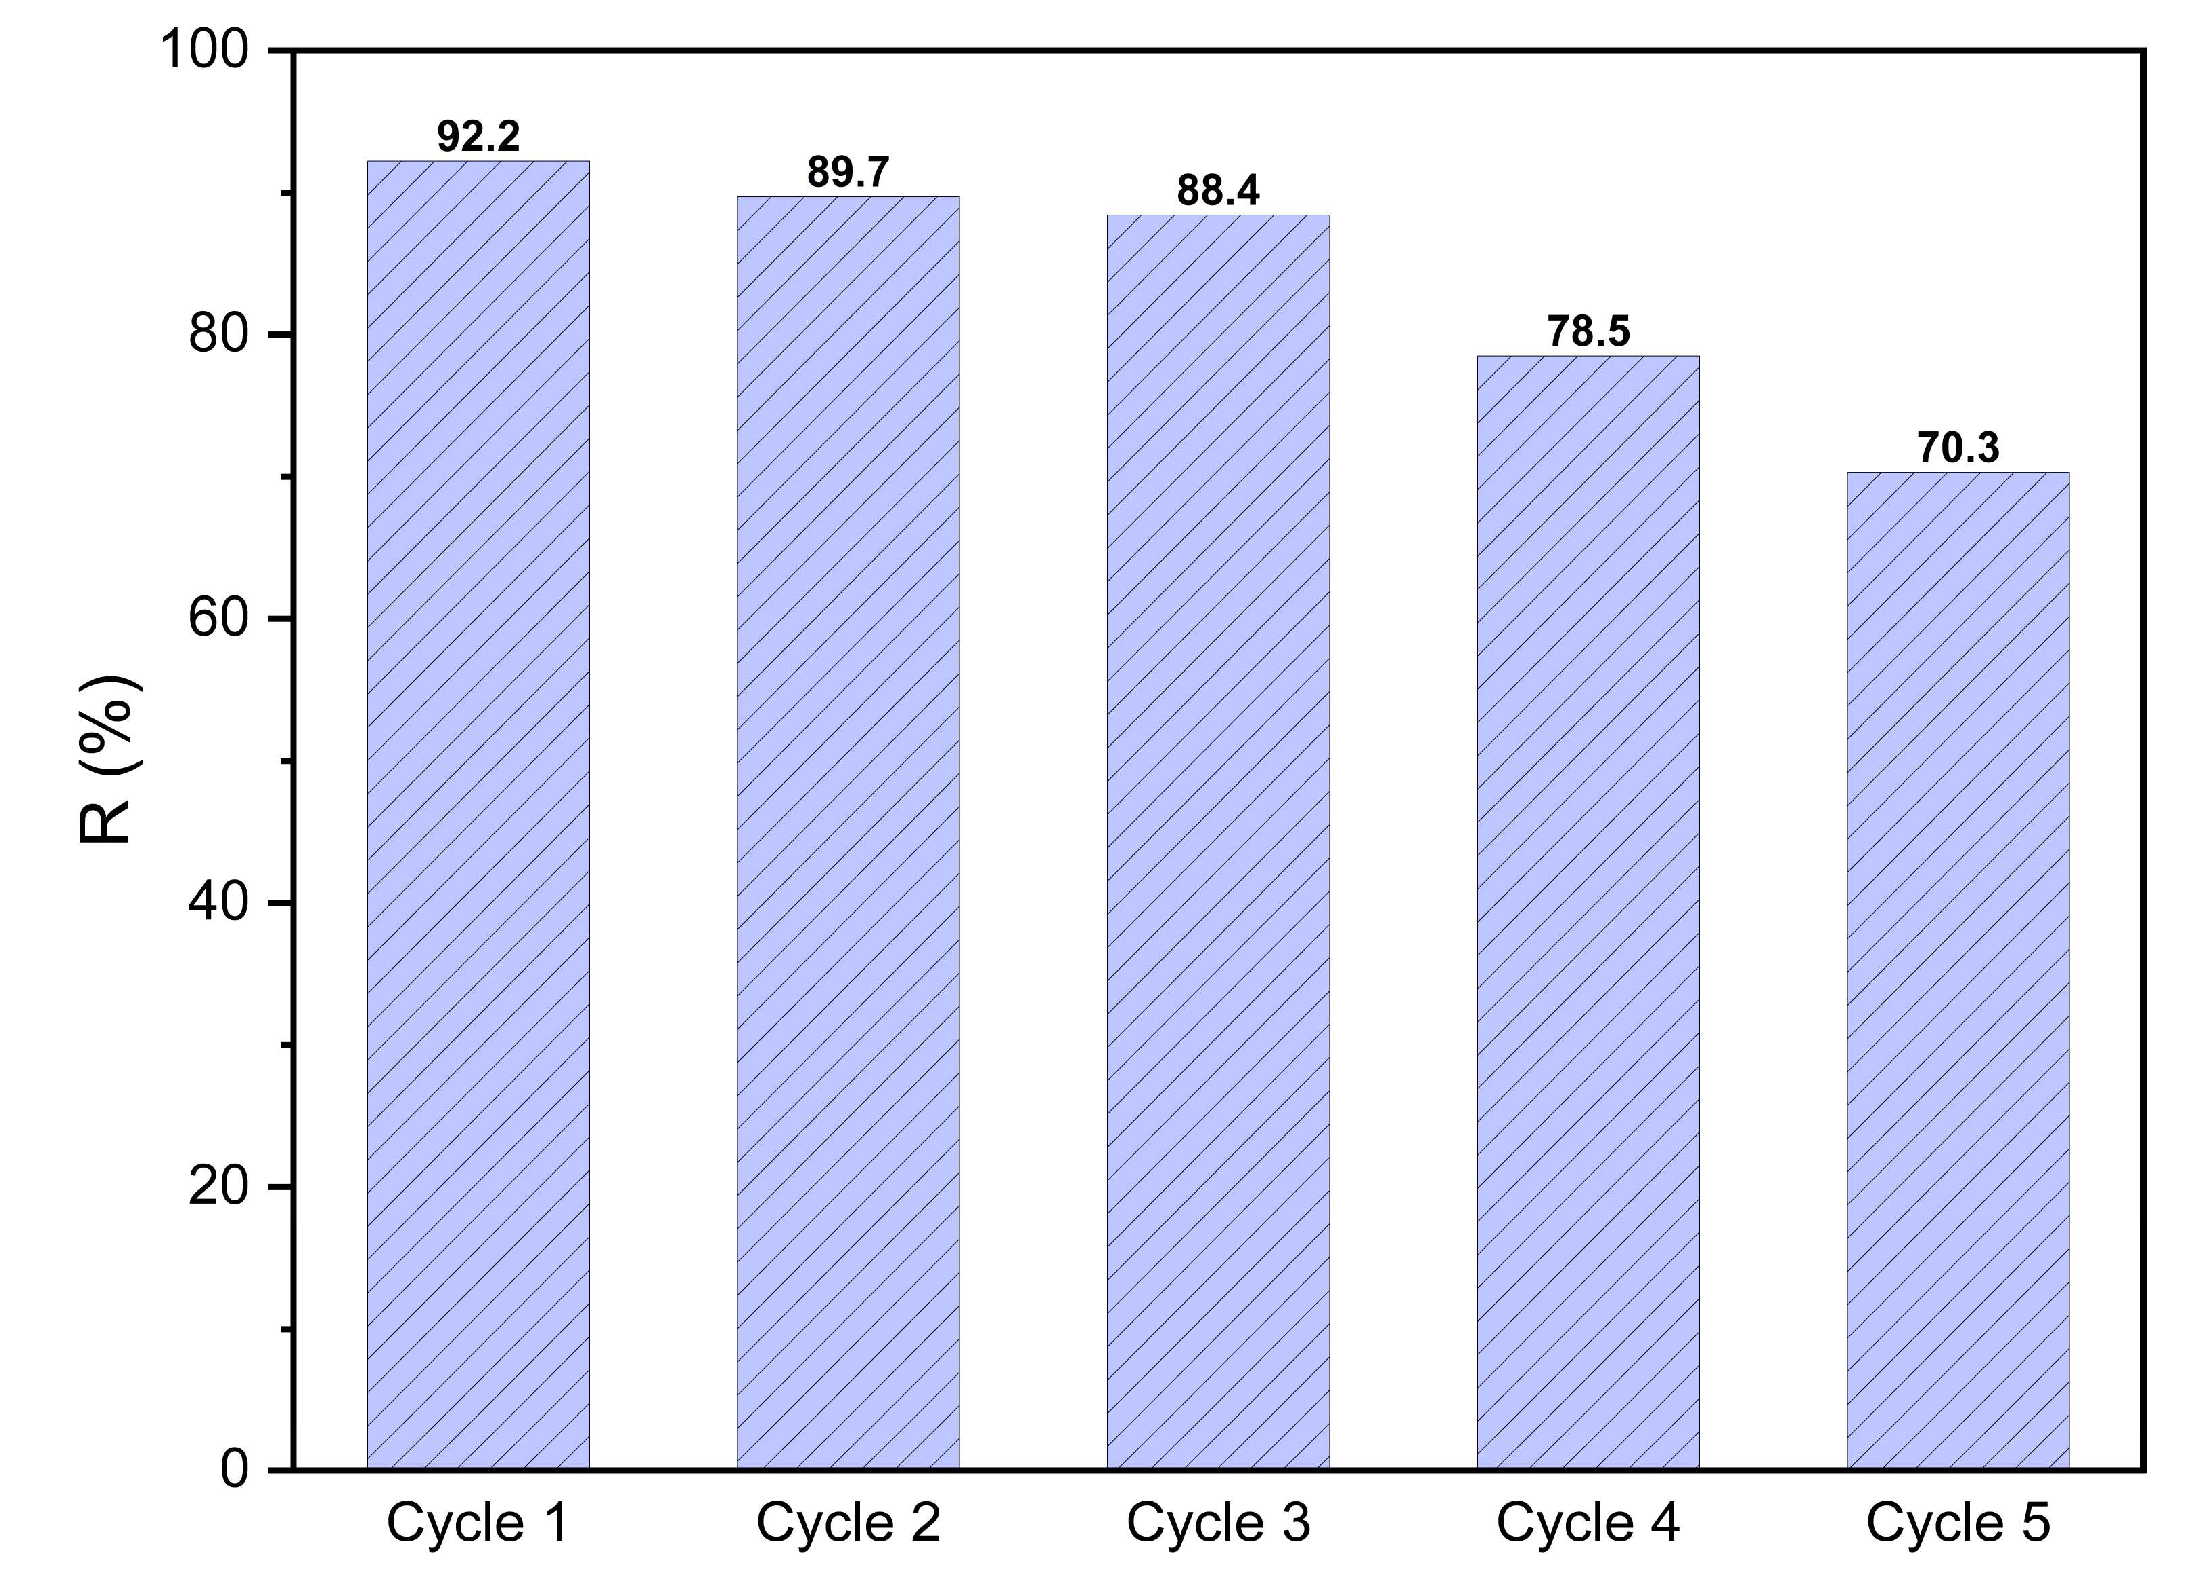
3.4.1 Regeneration and re-use
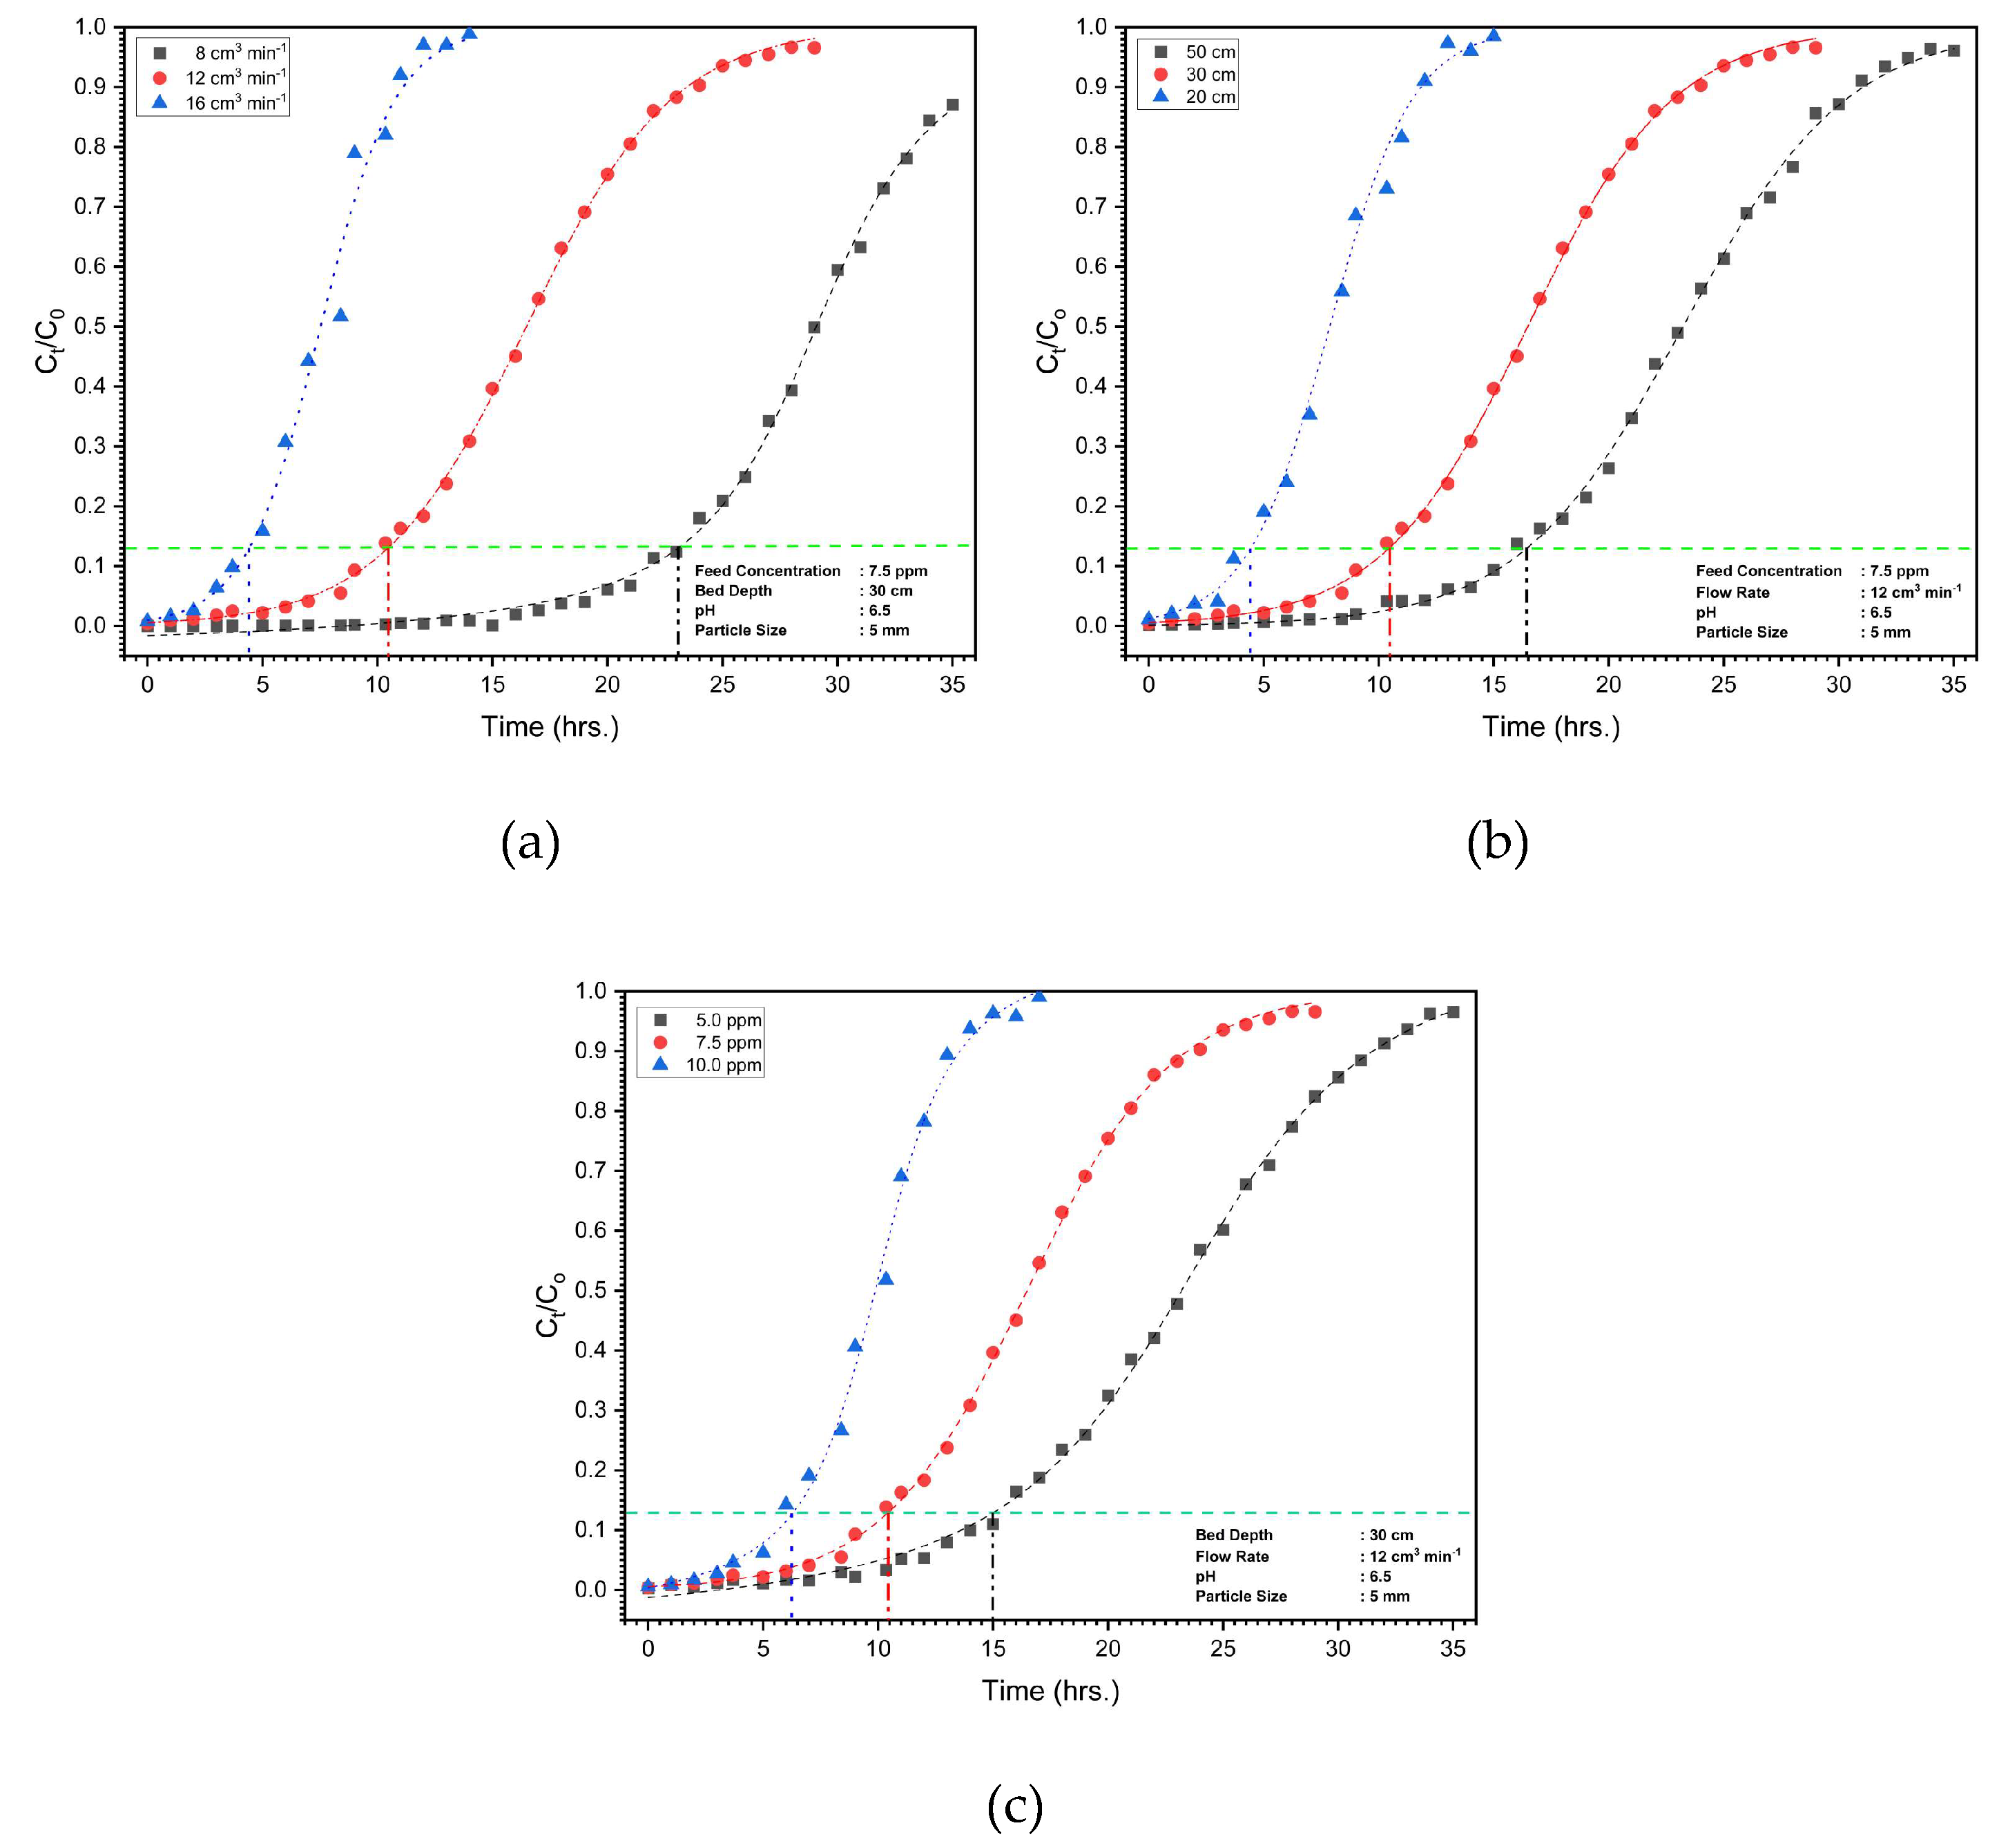
3.4.2 Column study
5. Conclusions
Supplementary Materials
Author Contributions
Funding
Data Availability Statement
Conflicts of Interest
References
- Dar, F.A.; Kurella, S. Fluoride in Drinking Water: An in-Depth Analysis of Its Prevalence, Health Effects, Advances in Detection and Treatment. Mater Today Proc 2024. [CrossRef]
- Ahmad, S.; Singh, R.; Arfin, T.; Neeti, K. Fluoride Contamination, Consequences and Removal Techniques in Water: A Review. Environmental Science: Advances 2022, 1, 620–661. [Google Scholar] [CrossRef]
- Din, I.U.; Ali, W.; Muhammad, S.; Shaik, M.R.; Shaik, B.; Rehman, I. ur; Tokatli, C. Spatial Distribution and Potential Health Risk Assessment for Fluoride and Nitrate via Water Consumption in Pakistan. J Geochem Explor 2024, 259. [Google Scholar] [CrossRef]
- Huang, S.; Guo, J.; Xie, Y.; Bian, R.; Wang, N.; Qi, W.; Liu, H. Distribution, Sources, and Potential Health Risks of Fluoride, Total Iodine, and Nitrate in Rural Drinking Water Sources of North and East China. Science of the Total Environment 2023, 898. [Google Scholar] [CrossRef]
- Tashauoei, H.R.; Mahdavi, M.; Mahvi, A.H.; Fatehizadeh, A. Dataset of Fluoride Concentration and Health Risk Assessment in Drinking Water in the Saveh City of Markazi Province, Iran. Data Brief 2023, 50. [Google Scholar] [CrossRef]
- Indika, S.; Hu, D.; Wei, Y.; Yapabandara, I.; Cooray, T.; Makehelwala, M.; Jinadasa, K.B.S.N.; Weragoda, S.K.; Weerasooriya, R.; Pang, Z. Spatiotemporal Variation of Groundwater Quality in North Central Province, Sri Lanka. ACS ES and T Water 2023, 3, 1687–1698. [Google Scholar] [CrossRef]
- Wasana, H.M.S.; Aluthpatabendi, D.; Kularatne, W.M.T.D.; Wijekoon, P.; Weerasooriya, R.; Bandara, J. Drinking Water Quality and Chronic Kidney Disease of Unknown Etiology (CKDu): Synergic Effects of Fluoride, Cadmium and Hardness of Water. Environ Geochem Health 2016, 38, 157–168. [Google Scholar] [CrossRef]
- Imbulana, S.; Oguma, K.; Takizawa, S. Evaluation of Groundwater Quality and Reverse Osmosis Water Treatment Plants in the Endemic Areas of Chronic Kidney Disease of Unknown Etiology (CKDu) in Sri Lanka. Science of the Total Environment 2020, 745. [Google Scholar] [CrossRef]
- Dar, F.A.; Kurella, S. Recent Advances in Adsorption Techniques for Fluoride Removal – An Overview. Groundw Sustain Dev 2023, 23. [Google Scholar] [CrossRef]
- Jha, P.K.; Tripathi, P. Arsenic and Fluoride Contamination in Groundwater: A Review of Global Scenarios with Special Reference to India. Groundw Sustain Dev 2021, 13. [Google Scholar] [CrossRef]
- Behbahani, M.; Moghaddam, M.R.A.; Arami, M. Techno-Economical Evaluation of Fluoride Removal by Electrocoagulation Process: Optimization through Response Surface Methodology. Desalination 2011, 271, 209–218. [Google Scholar] [CrossRef]
- Haldar, D.; Duarah, P.; Purkait, M.K. MOFs for the Treatment of Arsenic, Fluoride and Iron Contaminated Drinking Water: A Review. Chemosphere 2020, 251. [Google Scholar] [CrossRef]
- Gangani, N.; Joshi, V.C.; Sharma, S.; Bhattacharya, A. Fluoride Contamination in Water: Remediation Strategies through Membranes. Groundw Sustain Dev 2022, 17. [Google Scholar] [CrossRef]
- Kabay, N.; Arar, Ö.; Samatya, S.; Yüksel, Ü.; Yüksel, M. Separation of Fluoride from Aqueous Solution by Electrodialysis: Effect of Process Parameters and Other Ionic Species. J Hazard Mater 2008, 153, 107–113. [Google Scholar] [CrossRef] [PubMed]
- Lakshmi, M.V.V.C.; Chandana Lakshmip, M.V. V; Karthikp, K.V.S. Removal of Fluoride from Groundwater Using Various Technologies: A Review; 2019; Vol. 6;
- El Messaoudi, N.; Franco, D.S.P.; Gubernat, S.; Georgin, J.; Şenol, Z.M.; Ciğeroğlu, Z.; Allouss, D.; El Hajam, M. Advances and Future Perspectives of Water Defluoridation by Adsorption Technology: A Review. Environ Res 2024, 252. [Google Scholar] [CrossRef]
- Gebrewold, B.D.; Werkneh, A.A.; Kijjanapanich, P.; Rene, E.R.; Lens, P.N.L.; Annachhatre, A.P. Low Cost Materials for Fluoride Removal from Groundwater. J Environ Manage 2024, 370. [Google Scholar] [CrossRef]
- He, J.; Yang, Y.; Wu, Z.; Xie, C.; Zhang, K.; Kong, L.; Liu, J. Review of Fluoride Removal from Water Environment by Adsorption. J Environ Chem Eng 2020, 8. [Google Scholar] [CrossRef]
- Yadav, K.K.; Gupta, N.; Kumar, V.; Khan, S.A.; Kumar, A. A Review of Emerging Adsorbents and Current Demand for Defluoridation of Water: Bright Future in Water Sustainability. Environ Int 2018, 111, 80–108. [Google Scholar] [CrossRef]
- Manna, S.; Das, P.; Basak, P.; Sharma, A.K.; Singh, V.K.; Patel, R.K.; Pandey, J.K.; Ashokkumar, V.; Pugazhendhi, A. Separation of Pollutants from Aqueous Solution Using Nanoclay and Its Nanocomposites: A Review. Chemosphere 2021, 280. [Google Scholar] [CrossRef]
- Bahmanzadegan, F.; Ghaemi, A. A Comprehensive Review on Novel Zeolite-Based Adsorbents for Environmental Pollutant. Journal of Hazardous Materials Advances 2025, 17. [Google Scholar] [CrossRef]
- Luo, Q.; Wei, J.; Guo, Z.; Song, Y. Adsorption and Immobilization of Phosphorus from Water and Sediments Using a Lanthanum-Modified Natural Zeolite: Performance, Mechanism and Effect. Sep Purif Technol 2024, 329. [Google Scholar] [CrossRef]
- Sifuna Wanyonyi, F.; Fidelis, T.T.; Louis, H.; Kyalo Mutua, G.; Orata, F.; Rhyman, L.; Ramasami, P.; Pembere, A.M.S. Simulation Guided Prediction of Zeolites for the Sorption of Selected Anions from Water: Machine Learning Predictors for Enhanced Loading. J Mol Liq 2022, 355. [Google Scholar] [CrossRef]
- Zhao, M.; Zhou, X.; Li, J.; Li, F.; Li, X.; Yu, J.; Guo, L.; Song, G.; Xiao, C.; Zhou, F.; et al. Efficient Removal of Phosphate and Fluoride from Phosphogypsum Leachate by Lanthanum-Modified Zeolite: Synchronous Adsorption Behavior and Mechanism. J Environ Chem Eng 2024, 12. [Google Scholar] [CrossRef]
- Yang, R.; Chen, J.; Zhang, Z.; Wu, D. Performance and Mechanism of Lanthanum-Modified Zeolite as a Highly Efficient Adsorbent for Fluoride Removal from Water. Chemosphere 2022, 307. [Google Scholar] [CrossRef] [PubMed]
- LAI, Y. qing; YANG, K.; YANG, C.; TIAN, Z. liang; GUO, W. chang; LI, J. Thermodynamics and Kinetics of Fluoride Removal from Simulated Zinc Sulfate Solution by La(III)-Modified Zeolite. Transactions of Nonferrous Metals Society of China (English Edition) 2018, 28, 783–793. [Google Scholar] [CrossRef]
- Chen, J.; Chen, H.; Li, X.; He, X. Adsorption Characteristics of Chitosan Loaded Zirconium-Zeolite Composite Adsorbents for Removal of F from Water. Lizi Jiaohuan Yu Xifu/Ion Exchange and Adsorption.
- Chen, J.; Yang, R.; Zhang, Z.; Wu, D. Removal of Fluoride from Water Using Aluminum Hydroxide-Loaded Zeolite Synthesized from Coal Fly Ash. J Hazard Mater 2022. [CrossRef]
- Ebsa, D.G. Defluoridation of Drinking Water by Modified Natural Zeolite with Cationic Surfactant, in the Case of Ziway Town, Ethiopia. Clean Eng Technol 2023, 12. [Google Scholar] [CrossRef]
- Gao, Y.; Li, M.; Ru, Y.; Fu, J. Fluoride Removal from Water by Using Micron Zirconia/Zeolite Molecular Sieve: Characterization and Mechanism. Groundw Sustain Dev 2021, 13. [Google Scholar] [CrossRef]
- Ma, Z.; Zhang, Q.; Weng, X.; Mang, C.; Si, L.; Guan, Z.; Cheng, L.; Ma, Z.; Weng, X. Fluoride Ion Adsorption from Wastewater Using Magnesium(II), Aluminum(III) and Titanium(IV) Modified Natural Zeolite: Kinetics, Thermodynamics, and Mechanistic Aspects of Adsorption. Journal of Water Reuse and Desalination 2018, 8, 479–489. [Google Scholar] [CrossRef]
- Bera, B.; Saha Chowdhury, S.; Sonawane, V.R.; De, S. High Capacity Aluminium Substituted Hydroxyapatite Incorporated Granular Wood Charcoal (Al-HApC) for Fluoride Removal from Aqueous Medium: Batch and Column Study. Chemical Engineering Journal 2023, 466. [Google Scholar] [CrossRef]
- Joe-Wong, C.; Alemán-Reyes, A.; Le, N.Q.; Salerno, K.M.; Johnson, J.K.; Xia, Z.; Nachman, D.R. Fluoride Removal by Calcite and Hydroxyapatite. Environ Sci (Camb) 2023, 9, 1683–1689. [Google Scholar] [CrossRef]
- Rathnayake, A.; Hettithanthri, O.; Sandanayake, S.; Mahatantila, K.; Rajapaksha, A.U.; Vithanage, M. Essence of Hydroxyapatite in Defluoridation of Drinking Water: A Review. Environmental Pollution 2022, 311. [Google Scholar] [CrossRef]
- Russo, V.; D’Angelo, A.; Salvi, C.; Paparo, R.; Fortunato, M.E.; Cepollaro, E.M.; Tarallo, O.; Trifuoggi, M.; Di Serio, M.; Tesser, R. Fluoride Adsorption on Hydroxyapatite: From Batch to Continuous Operation. J Environ Chem Eng 2024, 12. [Google Scholar] [CrossRef]
- Bakhta, S.; Sadaoui, Z.; Bouazizi, N.; Samir, B.; Cosme, J.; Allalou, O.; Le Derf, F.; Vieillard, J. Successful Removal of Fluoride from Aqueous Environment Using Al(OH)3@AC: Column Studies and Breakthrough Curve Modeling. RSC Adv 2024, 14, 1–14. [Google Scholar] [CrossRef] [PubMed]
- Hu, Q.; Yang, X.; Huang, L.; Li, Y.; Hao, L.; Pei, Q.; Pei, X. A Critical Review of Breakthrough Models with Analytical Solutions in a Fixed-Bed Column. Journal of Water Process Engineering 2024, 59. [Google Scholar] [CrossRef]
- Asrori, M.R.; Santoso, A.; Sumari, S. Proofing the Presence of Metal Oxide Impregnated into Zeolite A without Calcination: XRD and FTIR Studies. Case Studies in Chemical and Environmental Engineering 2024, 9. [Google Scholar] [CrossRef]
- Chen, W.; Tang, H.; Li, H.; Zhao, Y.; Wang, X.; Chen, J.; Chen, Z.; Zhu, Y.; Yang, W. Efficient Defluoridation of Water by Utilizing Nanosized Ce-Fe Bimetal Oxyhydroxides Encapsulated inside Porous Polystyrene Anion Exchanger. Chemical Engineering Journal 2023, 461. [Google Scholar] [CrossRef]
- Adamu, D.B.; Tufa, L.T.; Lee, J.; Zereffa, E.; Segne, T.A.; Razali, M.H. Facile Synthesis of Bismuth and Iron Co-Doped Hydroxyapatite Nanomaterials for High-Performance Fluoride Ions Adsorption. J Environ Chem Eng 2023, 11. [Google Scholar] [CrossRef]
- Mishima, K.; Du, X.; Miyamoto, N.; Kano, N.; Imaizumi, H. Experimental and Theoretical Studies on the Adsorption Mechanisms of Uranium (VI) Ions on Chitosan. J Funct Biomater 2018, 9. [Google Scholar] [CrossRef]
- Sharma, P.K.; Ayub, S.; Tripathi, C.N. Isotherms Describing Physical Adsorption of Cr(VI) from Aqueous Solution Using Various Agricultural Wastes as Adsorbents. Cogent Eng 2016, 3. [Google Scholar] [CrossRef]
- Nguyen, D.A.; Nguyen, V.B.; Jang, A. Integrated Adsorption Using Ultrahigh-Porosity Magnesium Oxide with Multi-Output Predictive Deep Belief Networks: A Robust Approach for Fluoride Treatment. Chemical Engineering Journal 2024, 484. [Google Scholar] [CrossRef]

| Parameter | Thomas Model | Yoon-Nelson Model | Bohart-Adams Model | ||||||
|---|---|---|---|---|---|---|---|---|---|
| R2 | R2 | R2 | |||||||
| Bed Depth (cm) | |||||||||
| 20 | 0.074 | 0.94 | 0.998 | 0.539 | 7.98 | 0.995 | 0.029 | 198.7 | 0.985 |
| 30 | 0.042 | 3.29 | 0.999 | 0.316 | 16.48 | 0.995 | 0.042 | 185.4 | 0.989 |
| 50 | 0.037 | 6.96 | 0.996 | 0.280 | 23.22 | 0.995 | 0.061 | 138.6 | 0.985 |
| Flow Rate (cm3 min-1) | |||||||||
| 8 | 0.020 | 5.84 | 0.998 | 0.230 | 24.81 | 0.988 | 0.055 | 124.5 | 0.985 |
| 12 | 0.042 | 3.29 | 0.999 | 0.316 | 16.48 | 0.999 | 0.042 | 185.4 | 0.988 |
| 16 | 0.081 | 1.00 | 0.988 | 0.613 | 7.53 | 0.988 | 0.032 | 218.2 | 0.985 |
| Feed Concentration (mg dm-3) | |||||||||
| 5 | 0.031 | 6.43 | 0.998 | 0.250 | 23.0 | 0.998 | 0.025 | 218.6 | 0.985 |
| 7.5 | 0.042 | 3.29 | 0.999 | 0.316 | 16.48 | 0.998 | 0.042 | 185.4 | 0.989 |
| 10 | 0.051 | 1.32 | 0.995 | 0.572 | 9.799 | 0.995 | 0.057 | 146.9 | 0.995 |
| Variation with Bed Depth (cm) | Variation with Flow Rate (cm3 min-1) | Variation with Feed Concentration (ppm) | |||||||
|---|---|---|---|---|---|---|---|---|---|
| 20 | 30 | 50 | 8 | 12 | 16 | 5 | 7.5 | 10 | |
| 4.5 | 10.5 | 16.5 | 23 | 10.5 | 4.5 | 15 | 10.5 | 6.5 | |
| 24.3 | 56.7 | 89.1 | 82.8 | 56.7 | 32.4 | 54 | 56.7 | 35.1 | |
| 23.02 | 54.37 | 86.4 | 64.99 | 54.37 | 30.81 | 53.87 | 54.37 | 23.65 | |
| 3.24 | 7.56 | 11.88 | 11.04 | 7.56 | 4.32 | 10.80 | 7.56 | 4.68 | |
| 94.73 | 95.88 | 96.94 | 78.48 | 95.88 | 95.1 | 99.77 | 95.88 | 67.37 | |
Disclaimer/Publisher’s Note: The statements, opinions and data contained in all publications are solely those of the individual author(s) and contributor(s) and not of MDPI and/or the editor(s). MDPI and/or the editor(s) disclaim responsibility for any injury to people or property resulting from any ideas, methods, instructions or products referred to in the content. |
© 2025 by the authors. Licensee MDPI, Basel, Switzerland. This article is an open access article distributed under the terms and conditions of the Creative Commons Attribution (CC BY) license (http://creativecommons.org/licenses/by/4.0/).


