4.1. Comparison of Wind Vibration Results Between High Rise Buildings with and Without Podiums
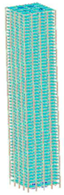
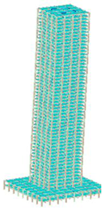
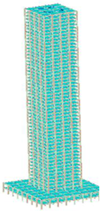
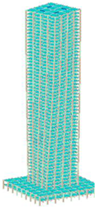
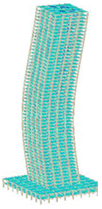
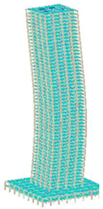
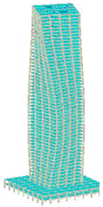
Prior to performing the time analysis, the modal analysis of the finite element model’s first 16 orders of vibration patterns is performed using the eigenvalue analysis method in Midas Gen, which may guarantee the model’s plausibility. Under the condition of calculating the vibration mode to the 16th order, the Table4 shows the first six orders of the vibration mode diagram for the high building without podium.
According to
Table 4, the fact that each order’s vibration type essentially complies with the requirements listed for the first six high-rise building vibration types in the Technical Specification for Concrete Structures of High-rise Buildings[
15] shows that the finite element model is properly set.
The numerical simulation results of wind-induced vibration response for two working conditions (high-rise buildings with and without podiums) are visualized and compared through post-processing, as shown in
Figure 6 to
Figure 9.
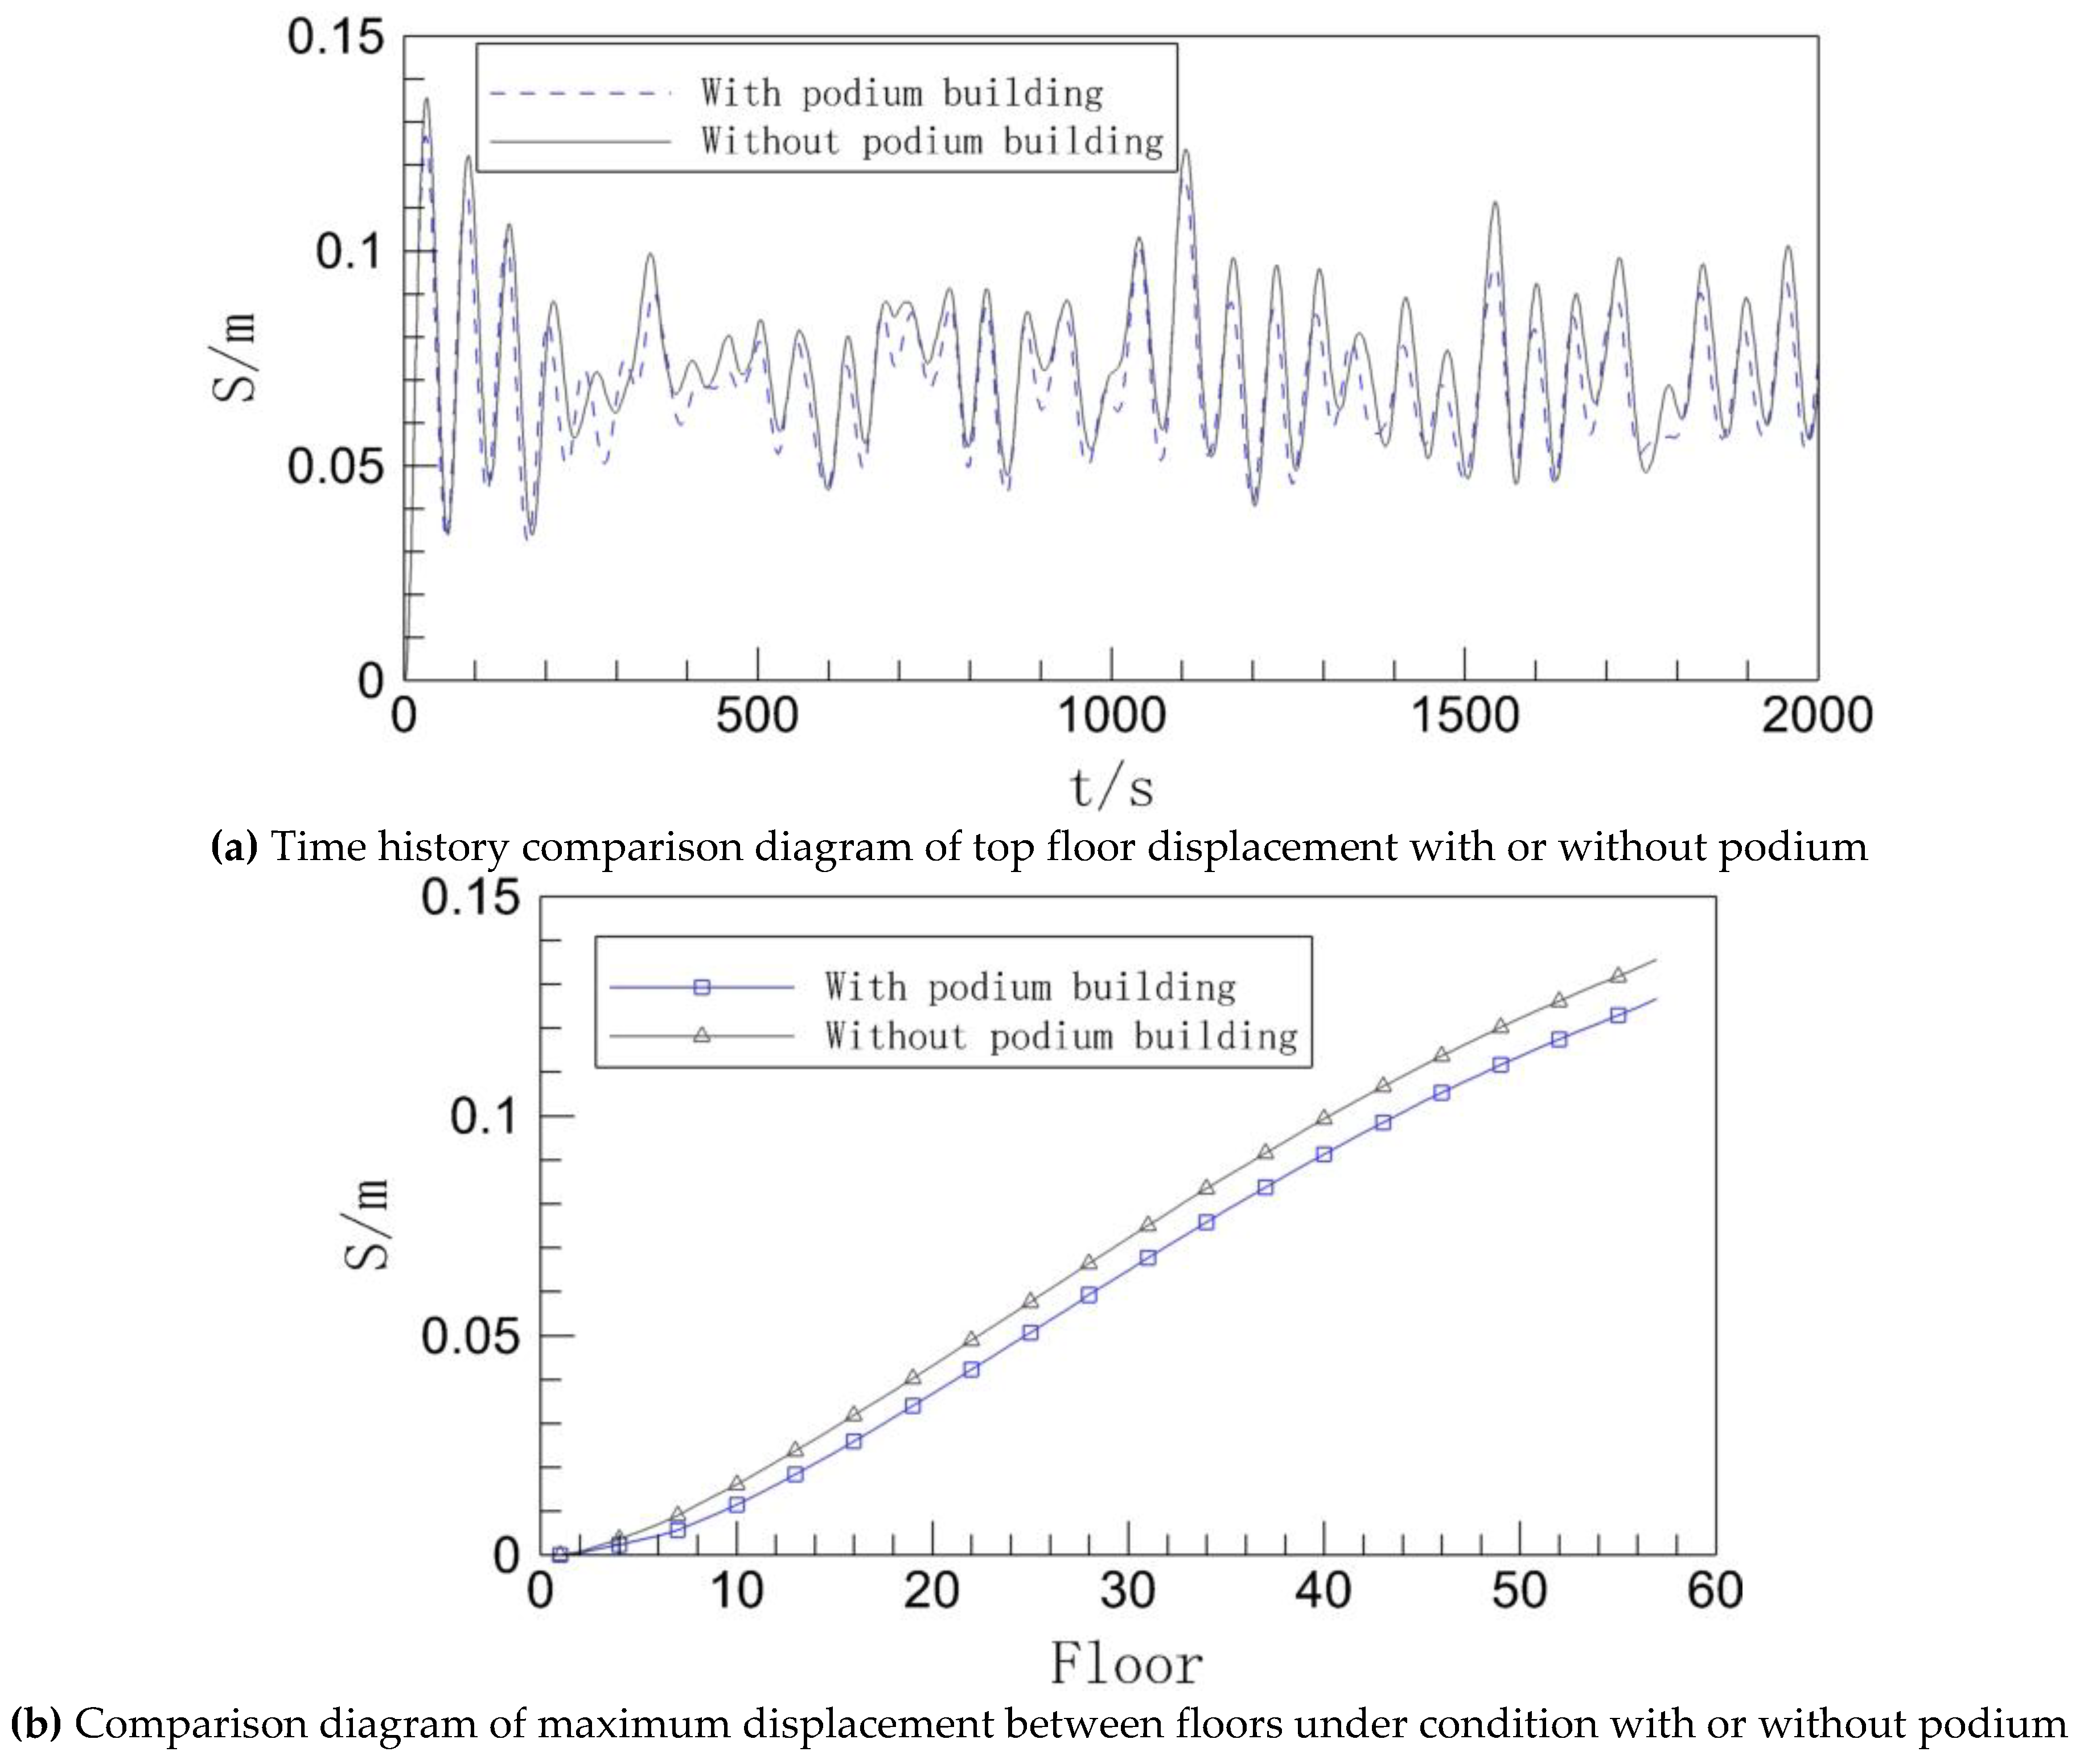
Figure 6 shows the variation of top displacement over time and the comparison of maximum displacement for each floor.
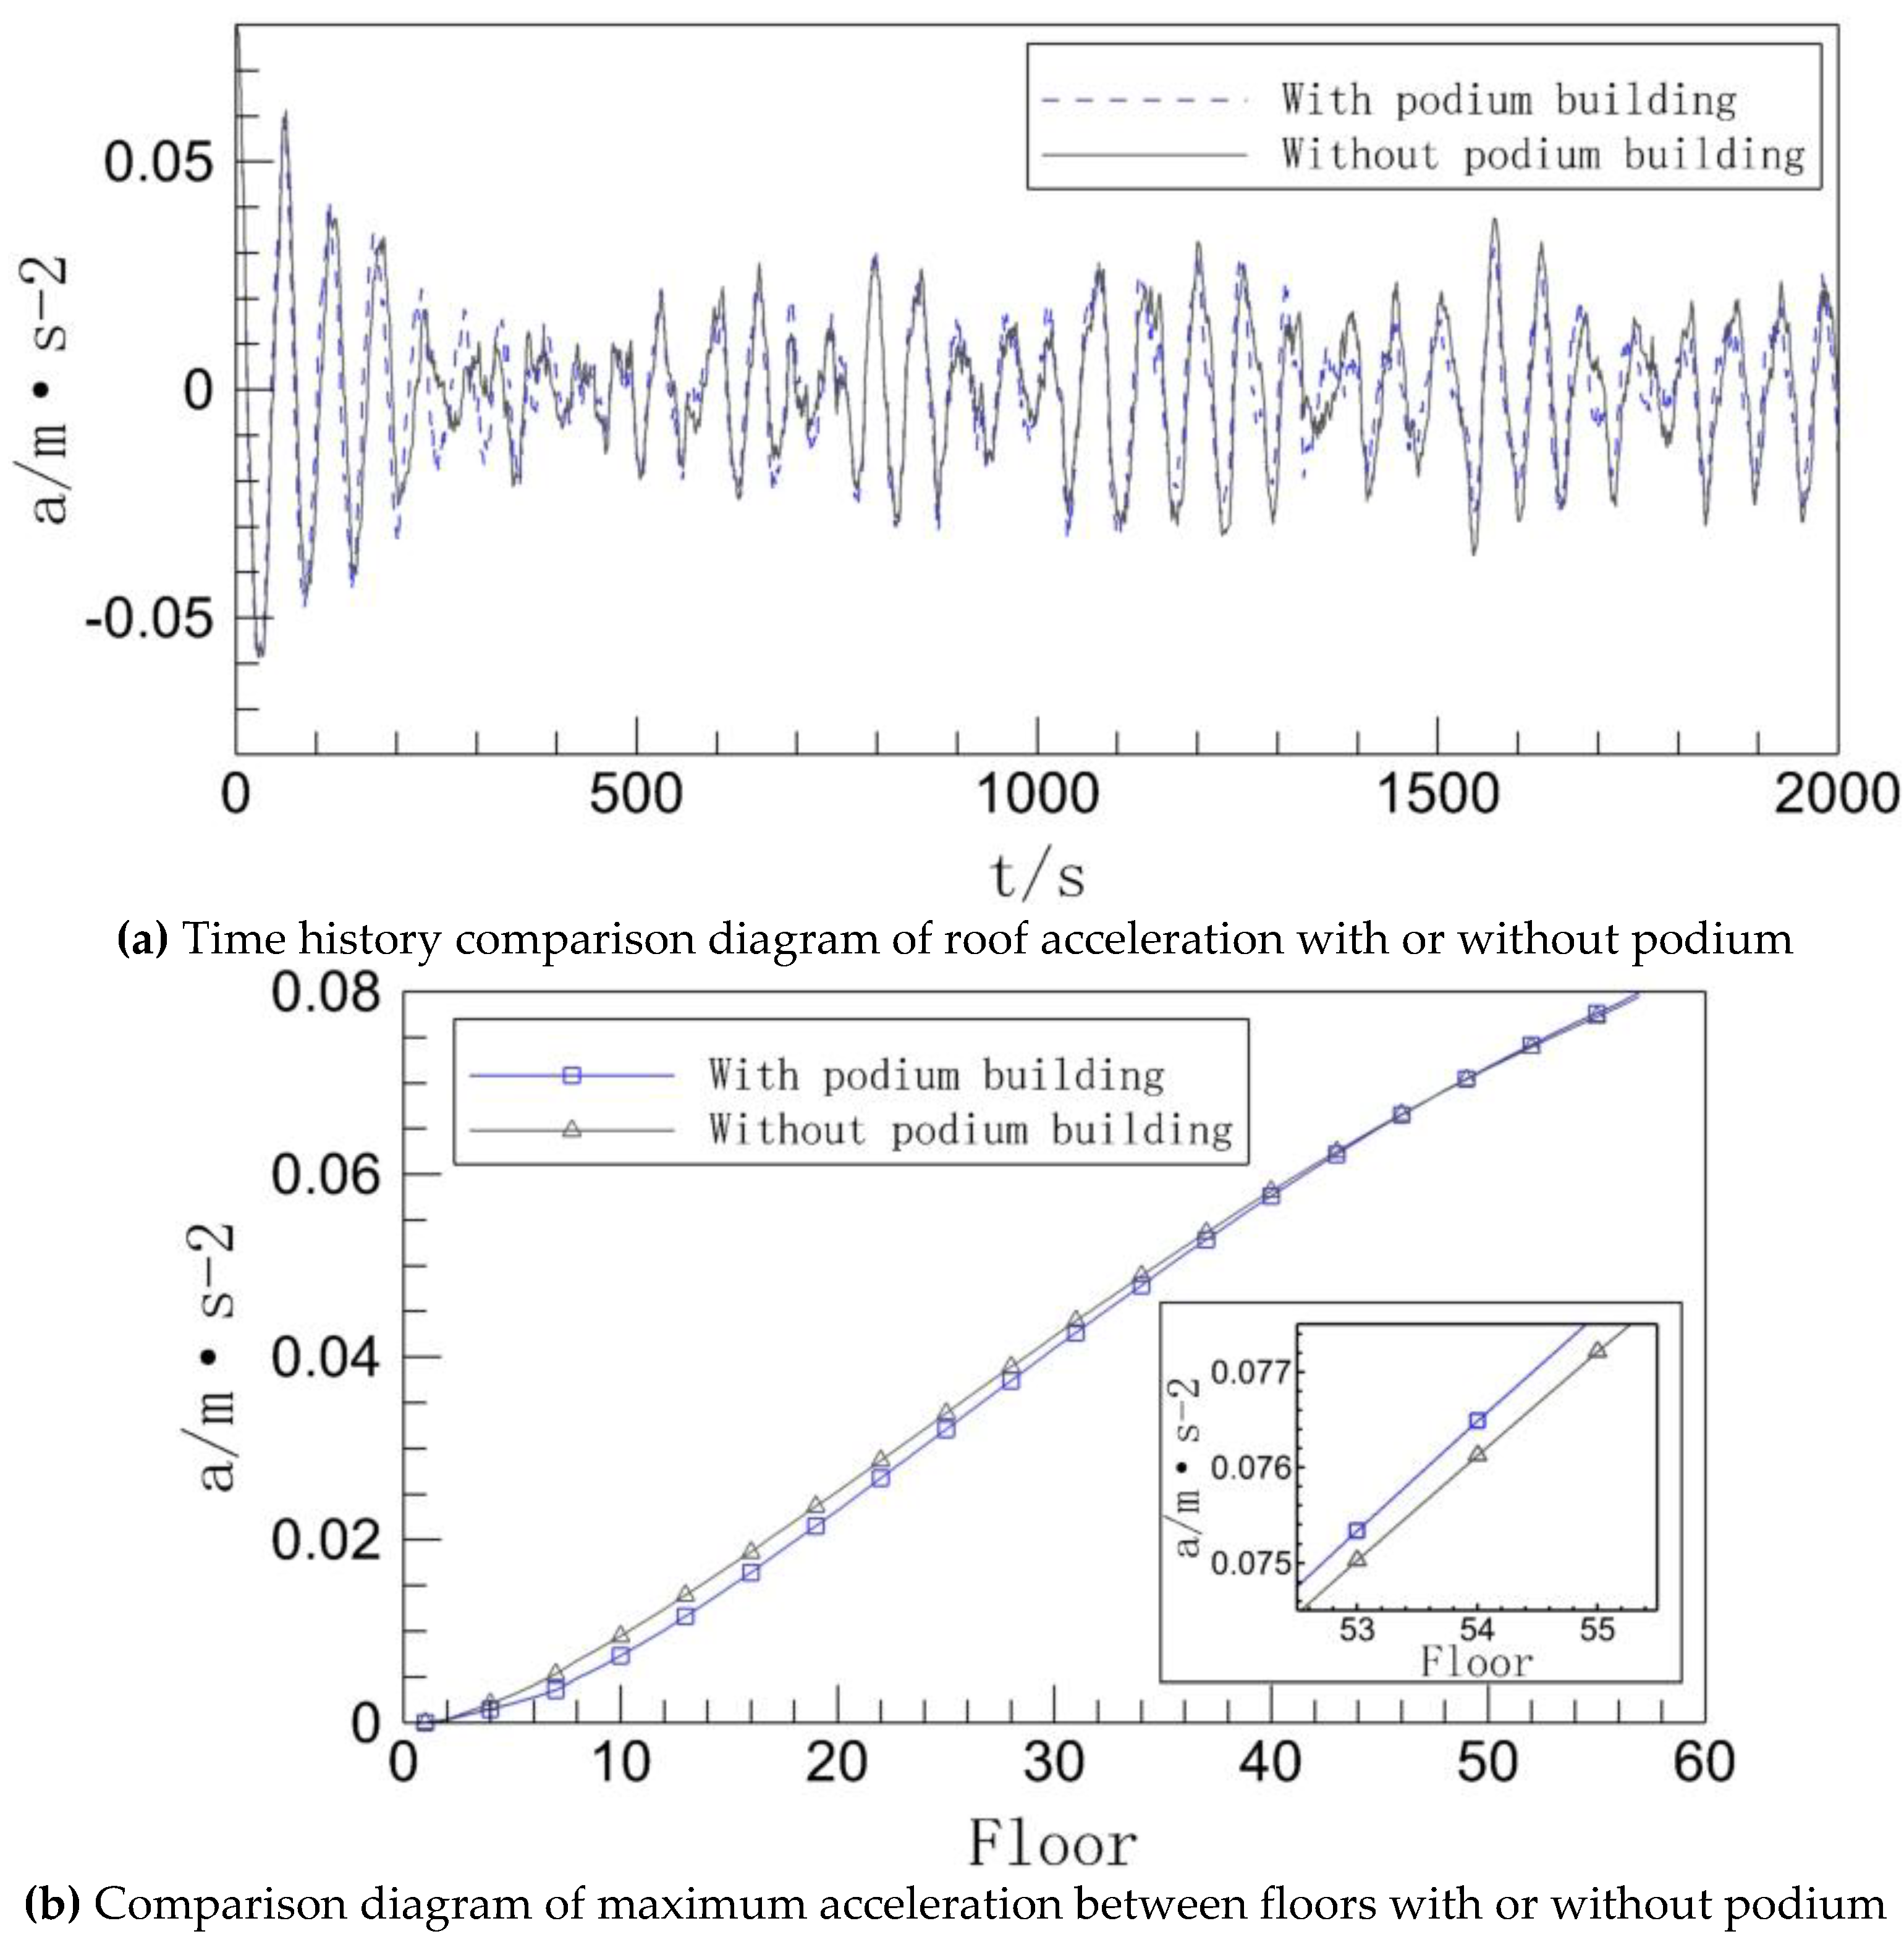
Figure 7 shows the comparison of the highest acceleration of each floor and the variation of the top floor acceleration over time.
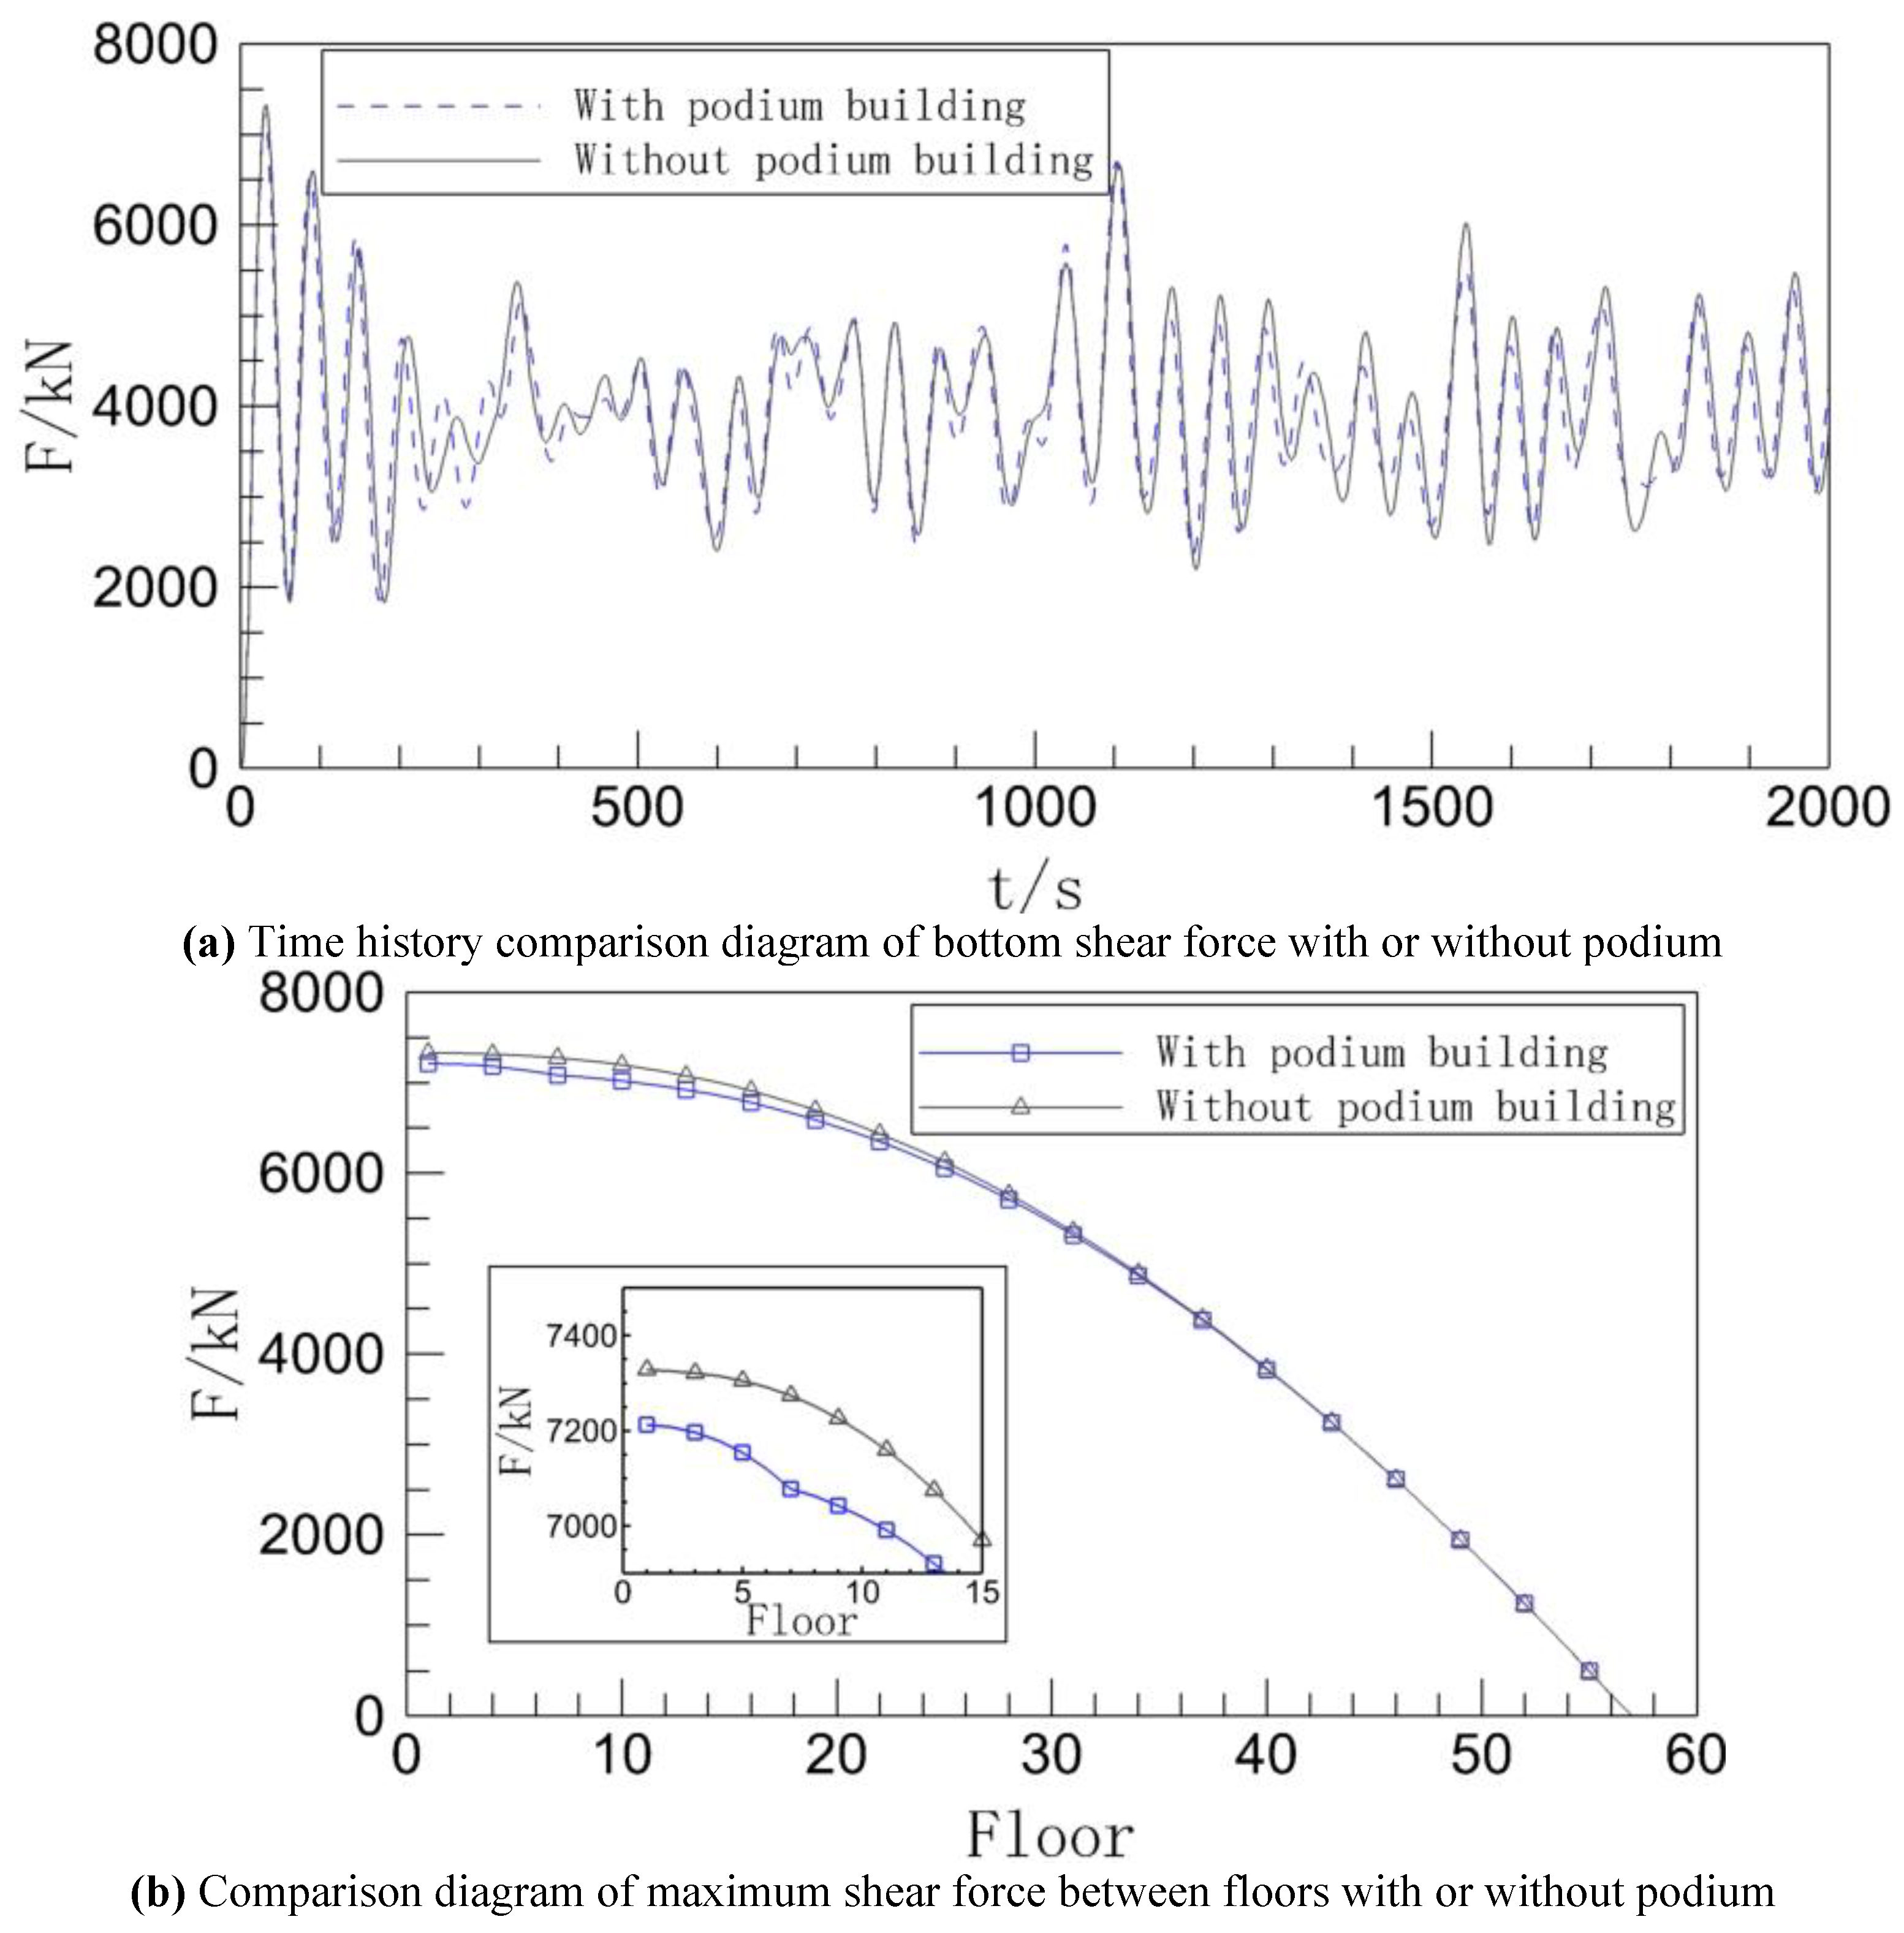
Figure 8 shows the comp`arison of maximum shear forces on each floor and the variation of bottom shear force over time.
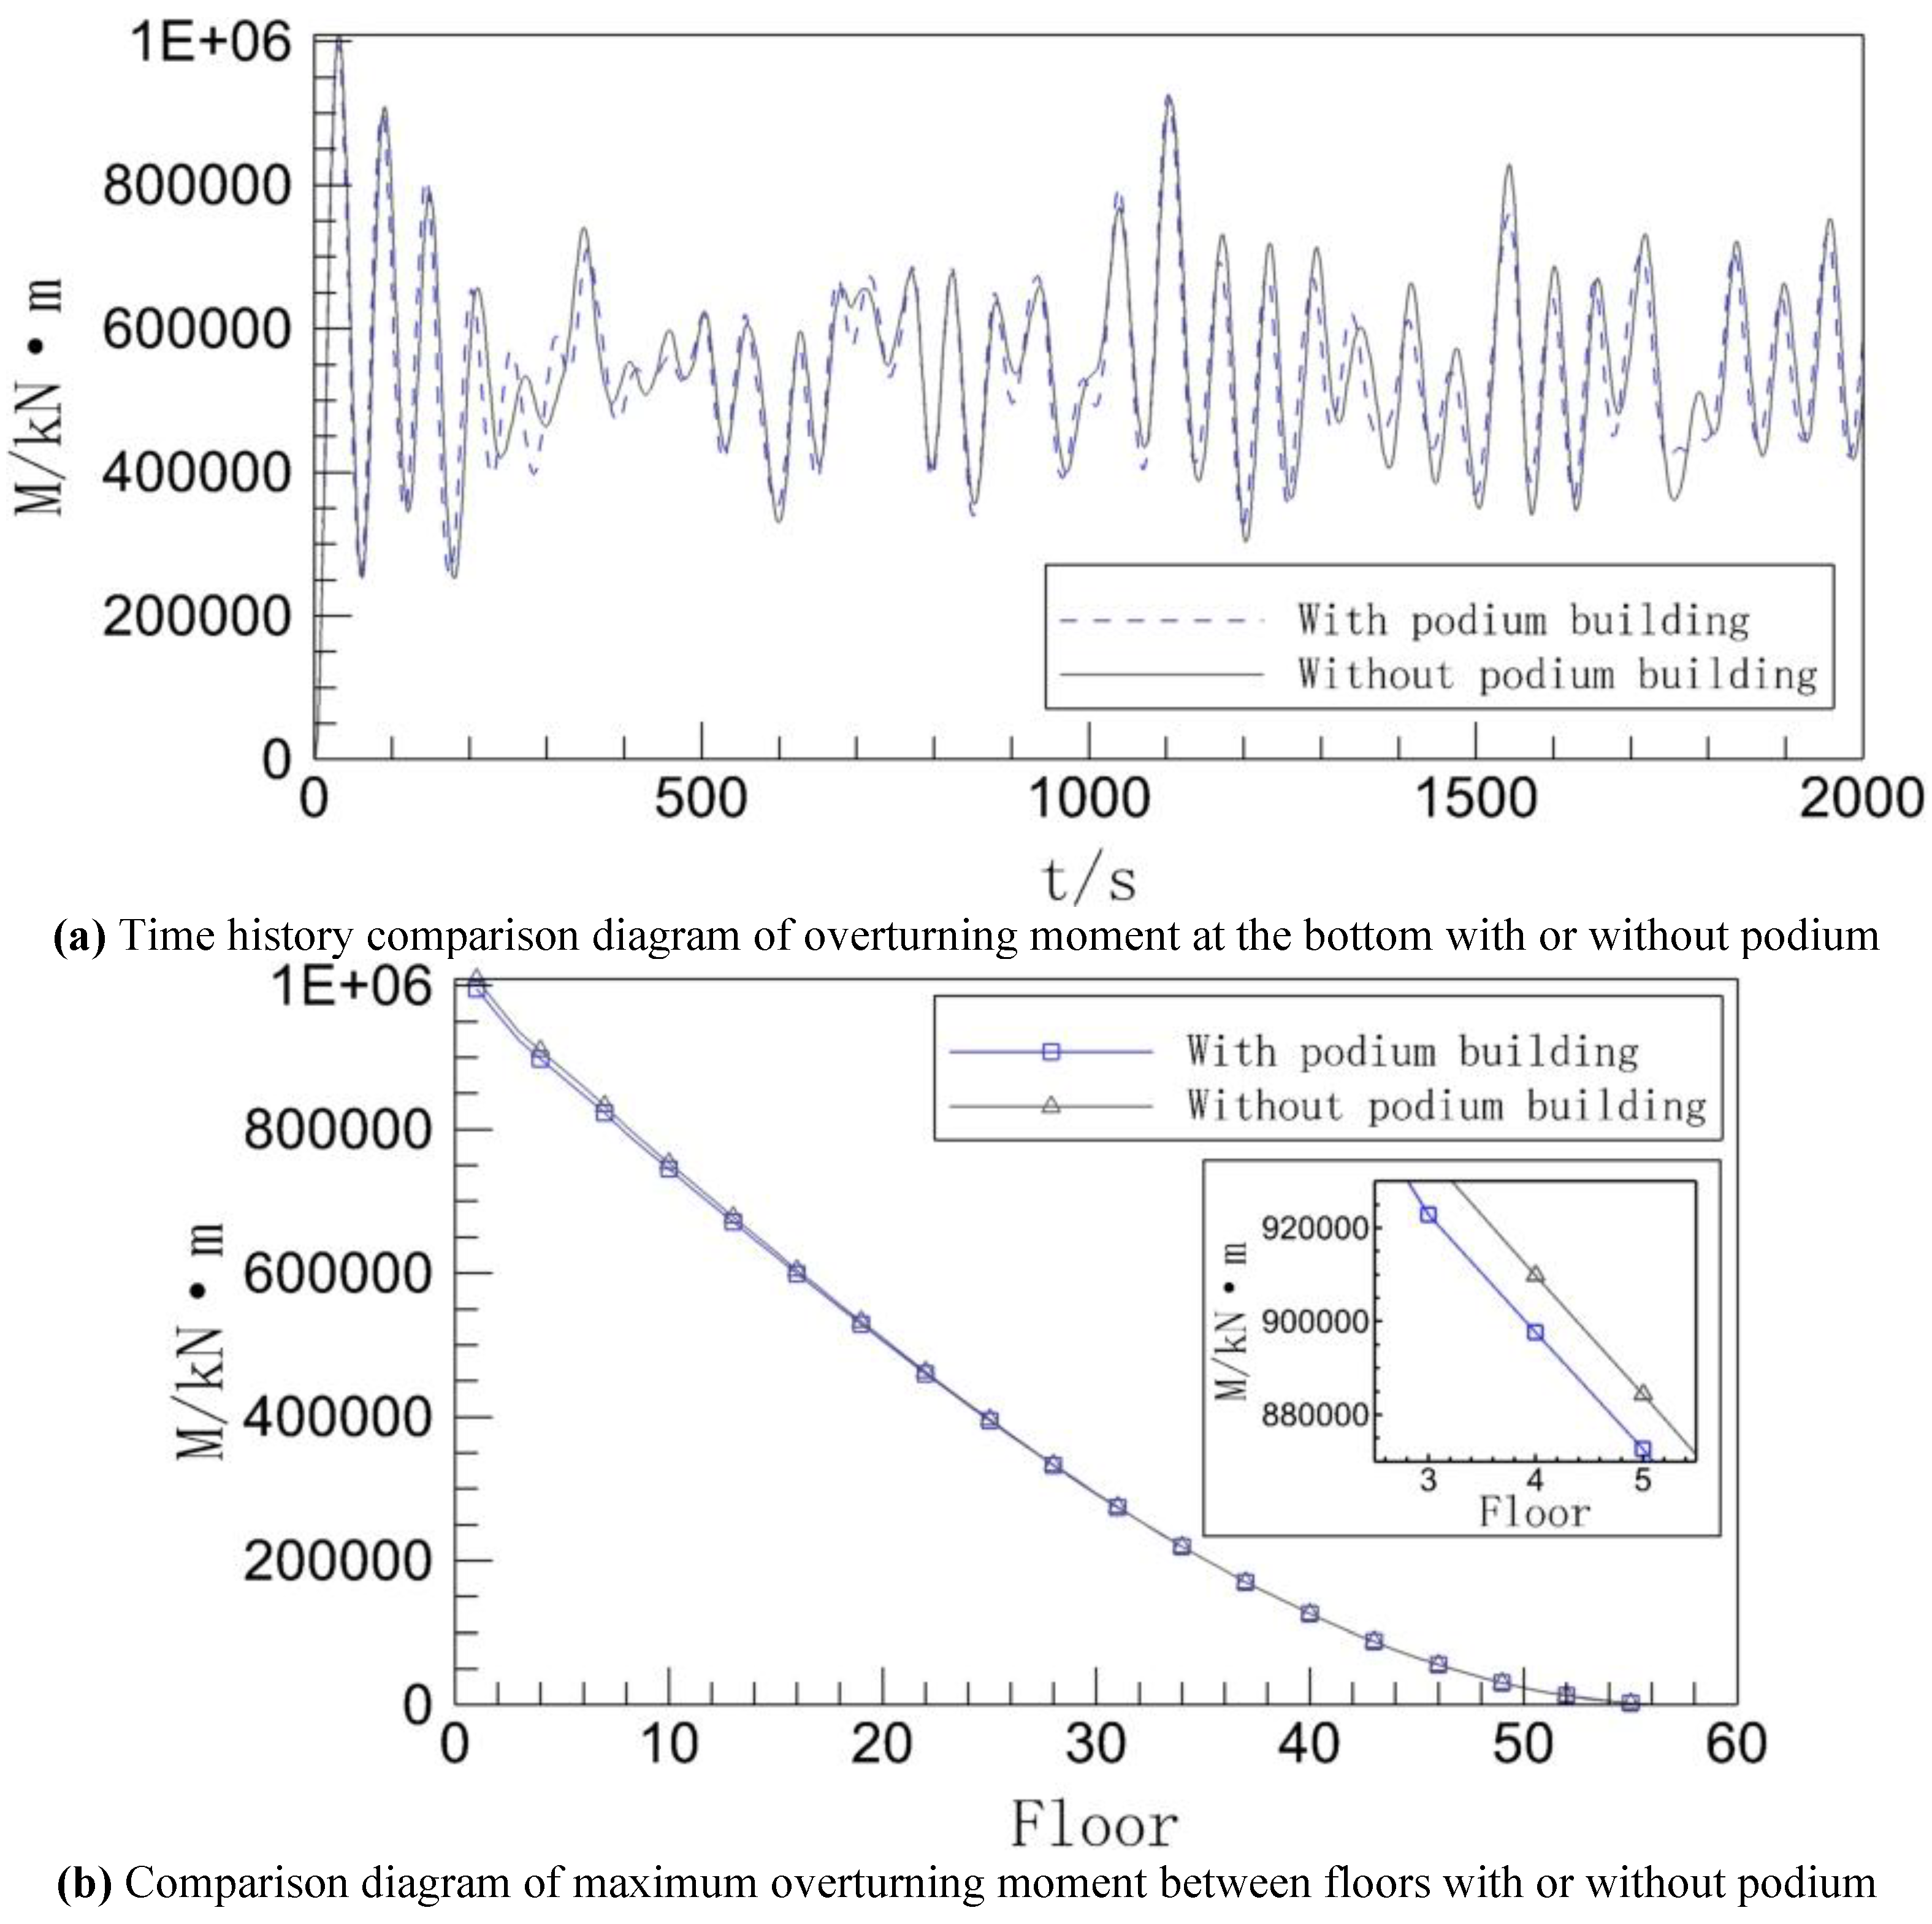
Figure 9 depicts the time history of the bottom overturning moment and the comparison of the maximum overturning moment on each floor.
When looking at
Figure 6(
a), it is clear that there aren’t many differences between the two working conditions, as evidenced by the displacement time history curves of the top level of the building with and without a podium. Even still, the peak of the curve shows that the curve without a podium has a slightly bigger overall numerical magnitude than the one with a podium, showing that the displacement pulsation of the top floor of the building without a podium is larger.
In both operating situations, the maximum inter-story displacement can be seen in
Figure 6(
b) to significantly increase as the floor height increases. This is in keeping with the general rule of wind load on high-rise buildings since as a building’s height increases, so does its flexibility, making it more susceptible to wind stress. When the displacement curves for the two working conditions are compared, it is clear that the maximum displacement between each floor in the working condition without a podium is greater than that in the working condition with a podium, and the difference between the two gradually grows as the floor increases.
In general, adding a podium at the base of a high-rise building helps to reduce the wind-induced vibration displacement response of the entire structure because the podium structure at the base increases the building’s bottom stiffness to some extent, increasing the building’s overall wind resistance.
Figure 7(
a) demonstrates that the acceleration time history curves of the top level of the building with and without the podium are still very comparable in both situations, much like the displacement time history scenario. The maximum acceleration difference between the two working conditions does not increase with the height of the building, but instead begins at zero and increases until it reaches its maximum value around the tenth floor, after which it decreases until the two curves essentially coincide, and finally, the acceleration of the working condition without a podium is lower than the acceleration of the working condition with a podium, as can be seen from the detailed diagram in the lower right corner of the
Figure 7 (
b). The stiffness difference is what drives the curve’s development tendency. The inter-story acceleration of a building drops as its stiffness rises, and the inter-story acceleration of a building with a podium condition is lower from the bottom level than it would be without a podium condition because the podium makes the bottom of the building stiffer. The influence of the bottom podium on the building’s interstory stiffness then steadily reduces as the number of floors rises. Overall, the podium predominantly suppresses inter-story acceleration in the middle and lower floors, and the strength of the suppression weakens as the number of storeys rises.
The time history curves for bottom shear in the two operating circumstances are essentially the same, as can be seen in
Figure 8 (a). The difference between the peaks of the time history curves for the cases with and without podiums demonstrates that the effect of the podium on the building’s bottom shear is not immediately apparent. The maximum acceleration between floors in both working circumstances drops noticeably with an increase in floor height, as shown in
Figure 8(b). The difference in maximum acceleration between floors is primarily visible in the lower floors, and the inter-story shear force without podium condition is greater than that with podium condition. However, the difference in shear force between the two does not increase with the height of the building; instead, it starts at zero until the maximum value is reached around the tenth floor, then it gradually decreases until the two curves essentially coincide. Overall, the middle and low levels still represent the majority of the podium’s effect on the building’s inter-story shear, and the strength of the impact will continue to diminish as the number of storeys rises.
Because there is a transformation relationship between the shear force and the overturning moment, it can be seen from
Figure 9(a) that the shape of the bottom overturning moment time history curve under the two working conditions is essentially the same as the bottom shear time history curve in
Figure 8(a). This indicates that the podium’s influence on the building’s bottom overturning moment is as minimal as the bottom shear force.
Figure 9(b) demonstrates that the amplitude and variety of the two curves’ differences are still comparable to
Figure 8(b). This means that rather than increasing as a building’s height rises, the difference between the two overturning moments instead increases from 0 until it reaches its greatest value around the 10
th story, then reduces until the two curves almost converge. The scale in the
Figure is too tiny and the overturning moment values are quite great, which reduces the distance between the two, causing the curves to be very similar.
Overall, the middle and lower floors still reflect the majority of the podium’s shear stress on the overturning moment between the building’s floors, and the severity of the effect reduces as the number of stories rises.
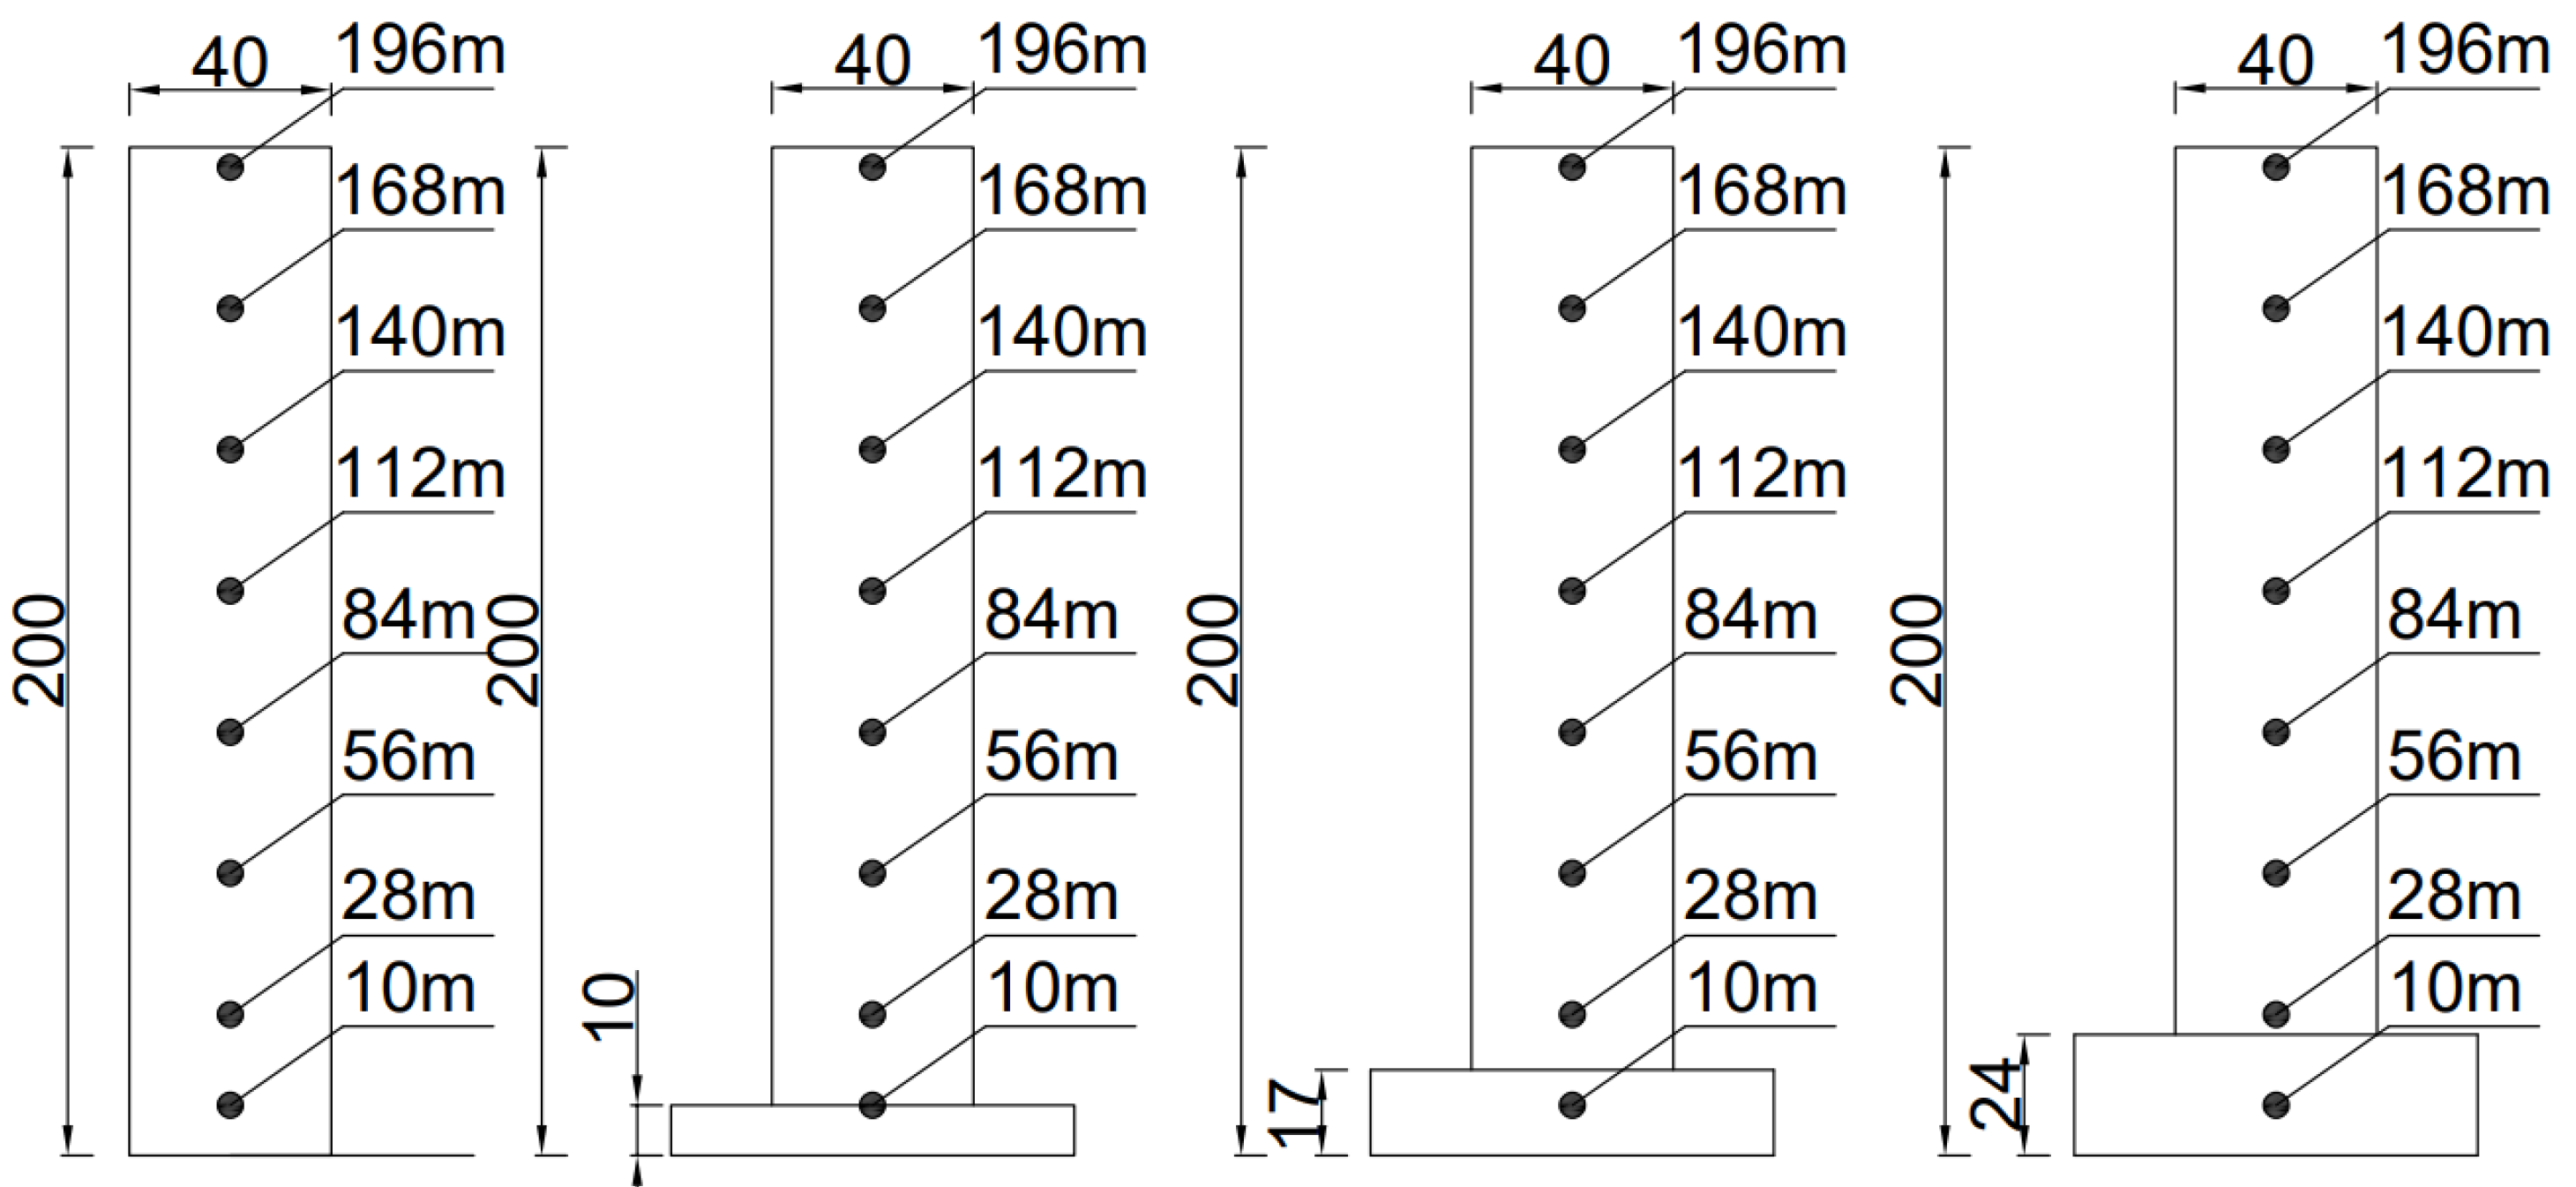
To better analyze the data, important nodes in the building model were selected for quantitative comparison to highlight the podium effect. The data comparison is shown in
Table 5. From
Table 5 it can be seen that the average values of various parameters for buildings with podiums and the parameters for the middle floor are lower than those for buildings without podiums under the same conditions. But in the case of a podium on the top floor, except for the top floor displacement being smaller than that without podium, all other parameters are higher than those without a podium. It can be inferred that one of the reasons for this phenomenon is the relative weakening of the stiffness effect of the upper part of the building.
4.2. The Influence of Podium Height on Wind-Induced Vibration Results
Modal analysis was conducted on the finite element models of high-rise buildings with podium heights of 10 meters, 17 meters, and 24 meters, respectively. The analysis is shown in
Table 6. This indicates that the vibration modes of each order basically meet the standard of the first six natural vibrations of high-rise buildings, proving that the finite element model is properly set.
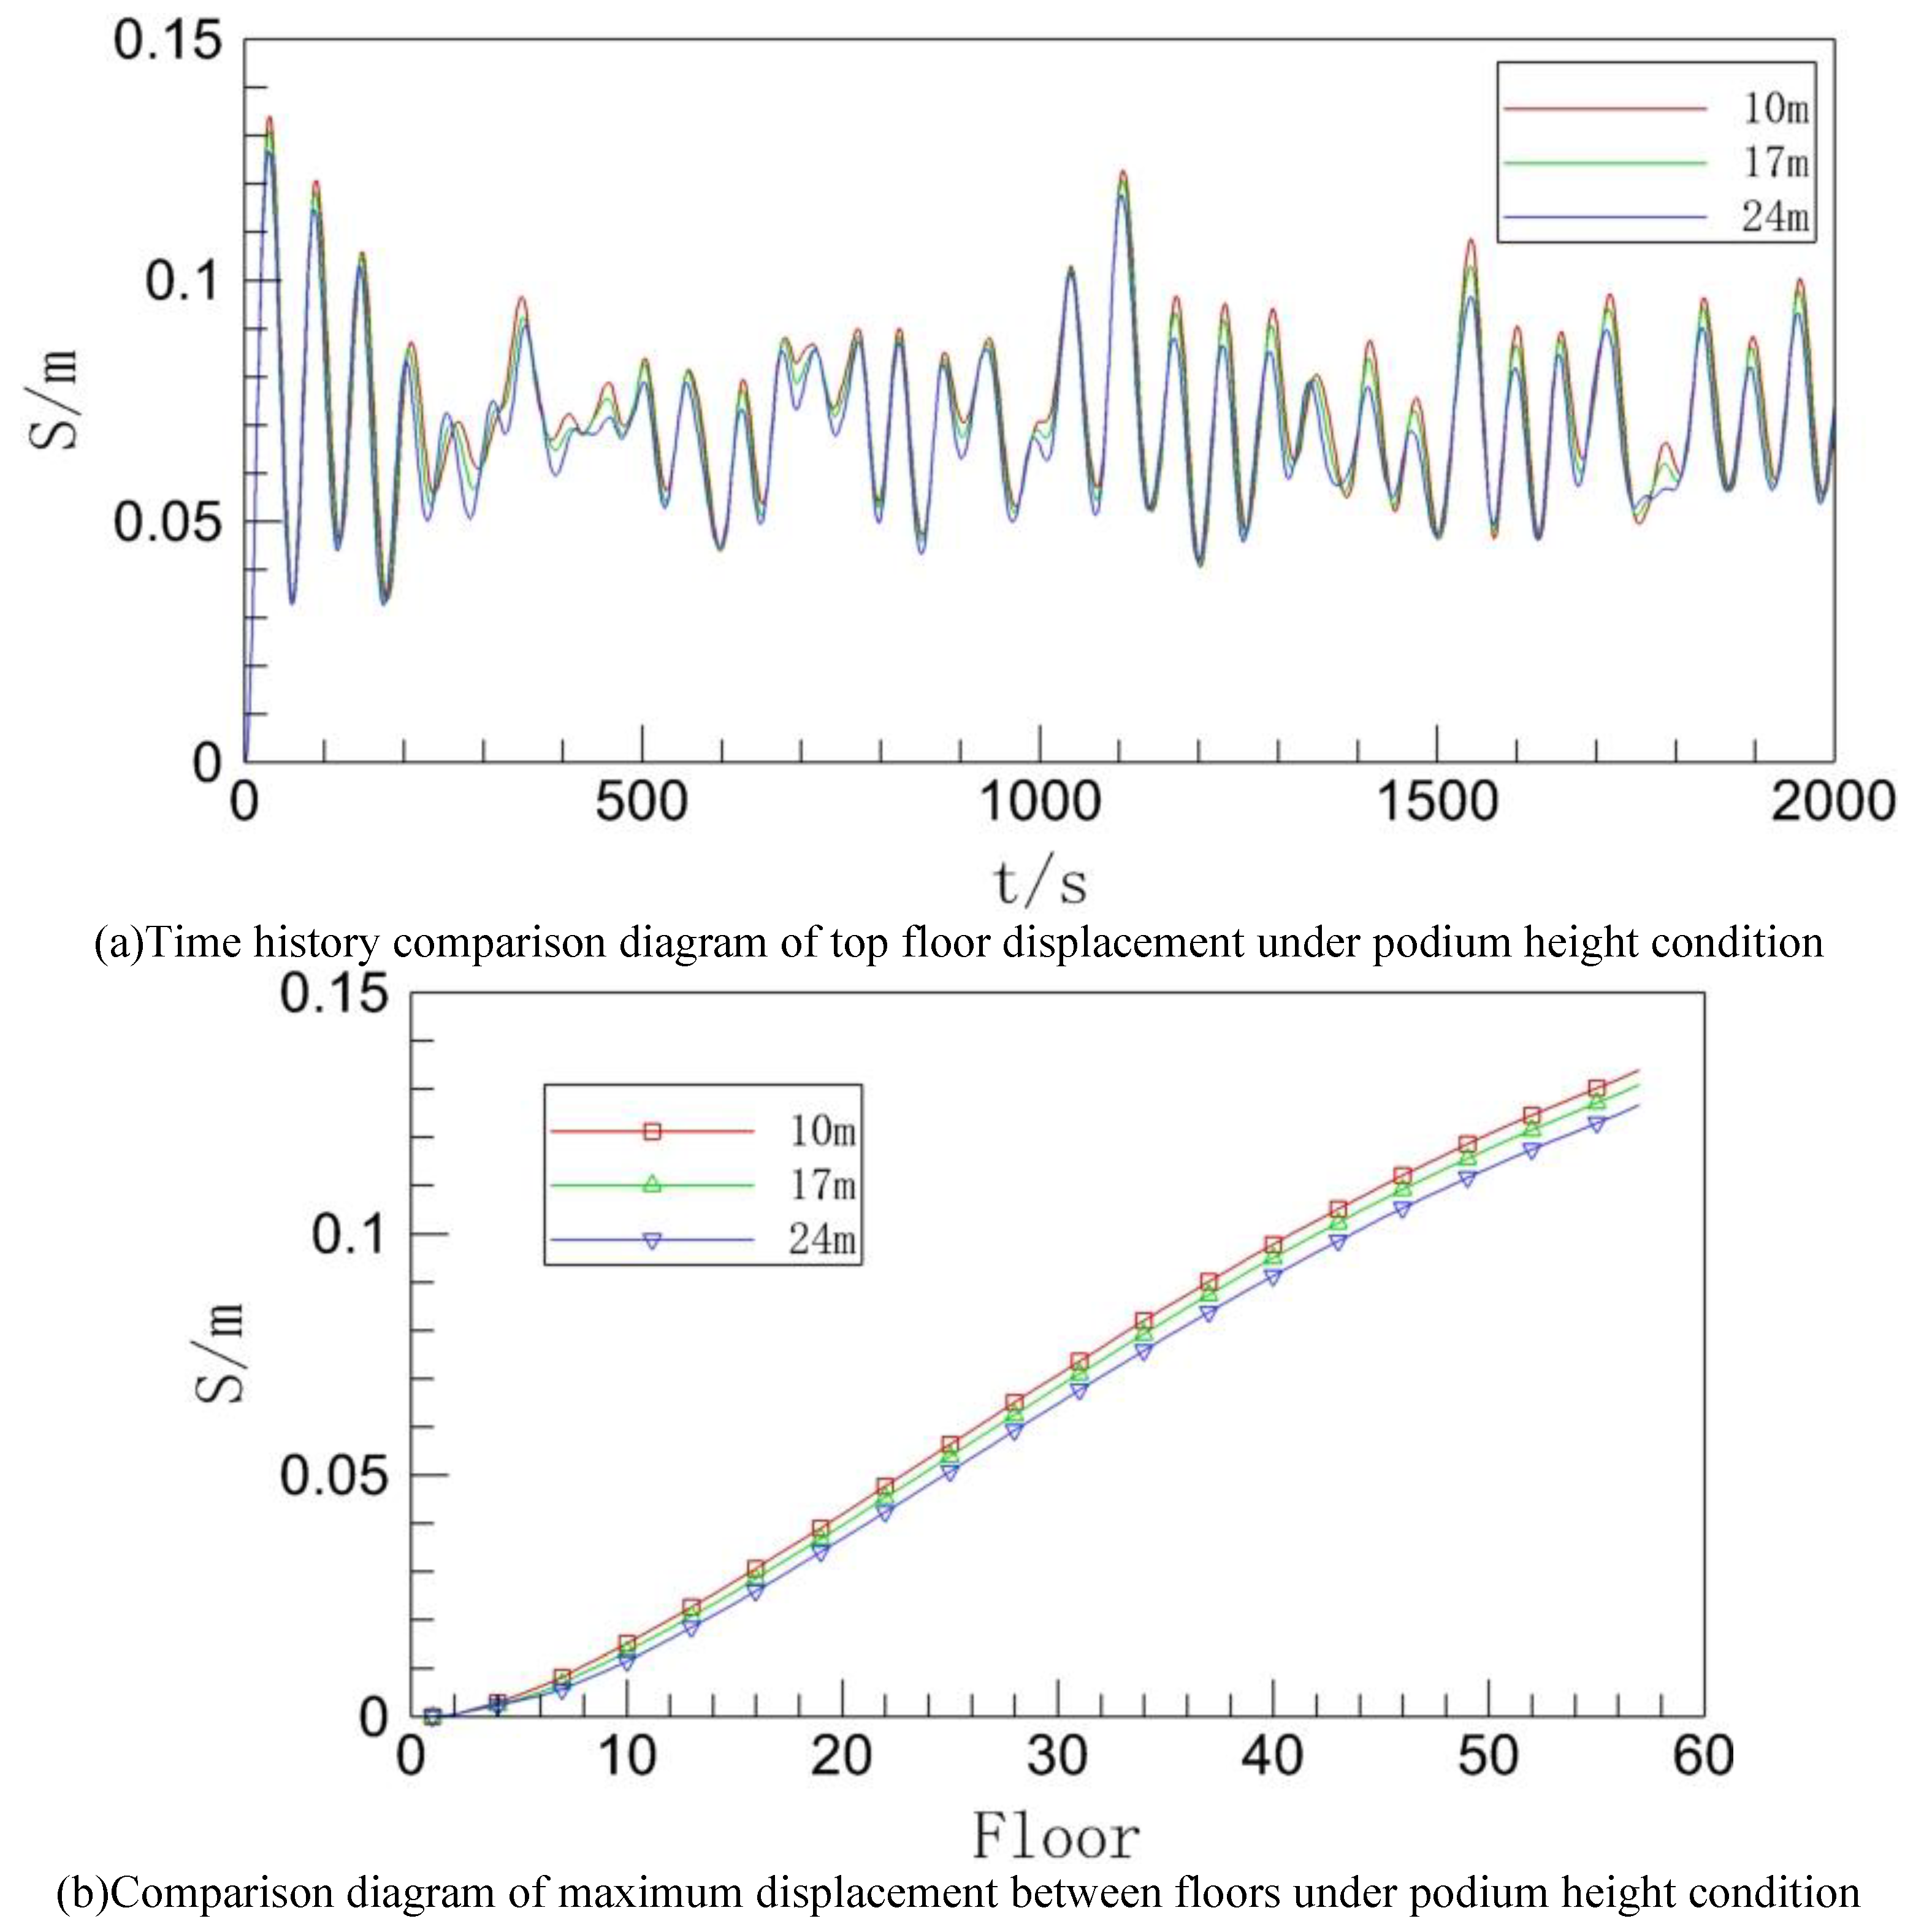
Figure 10 shows the time history of the top floor displacement and the maximum displacement of each floor under the three working conditions.
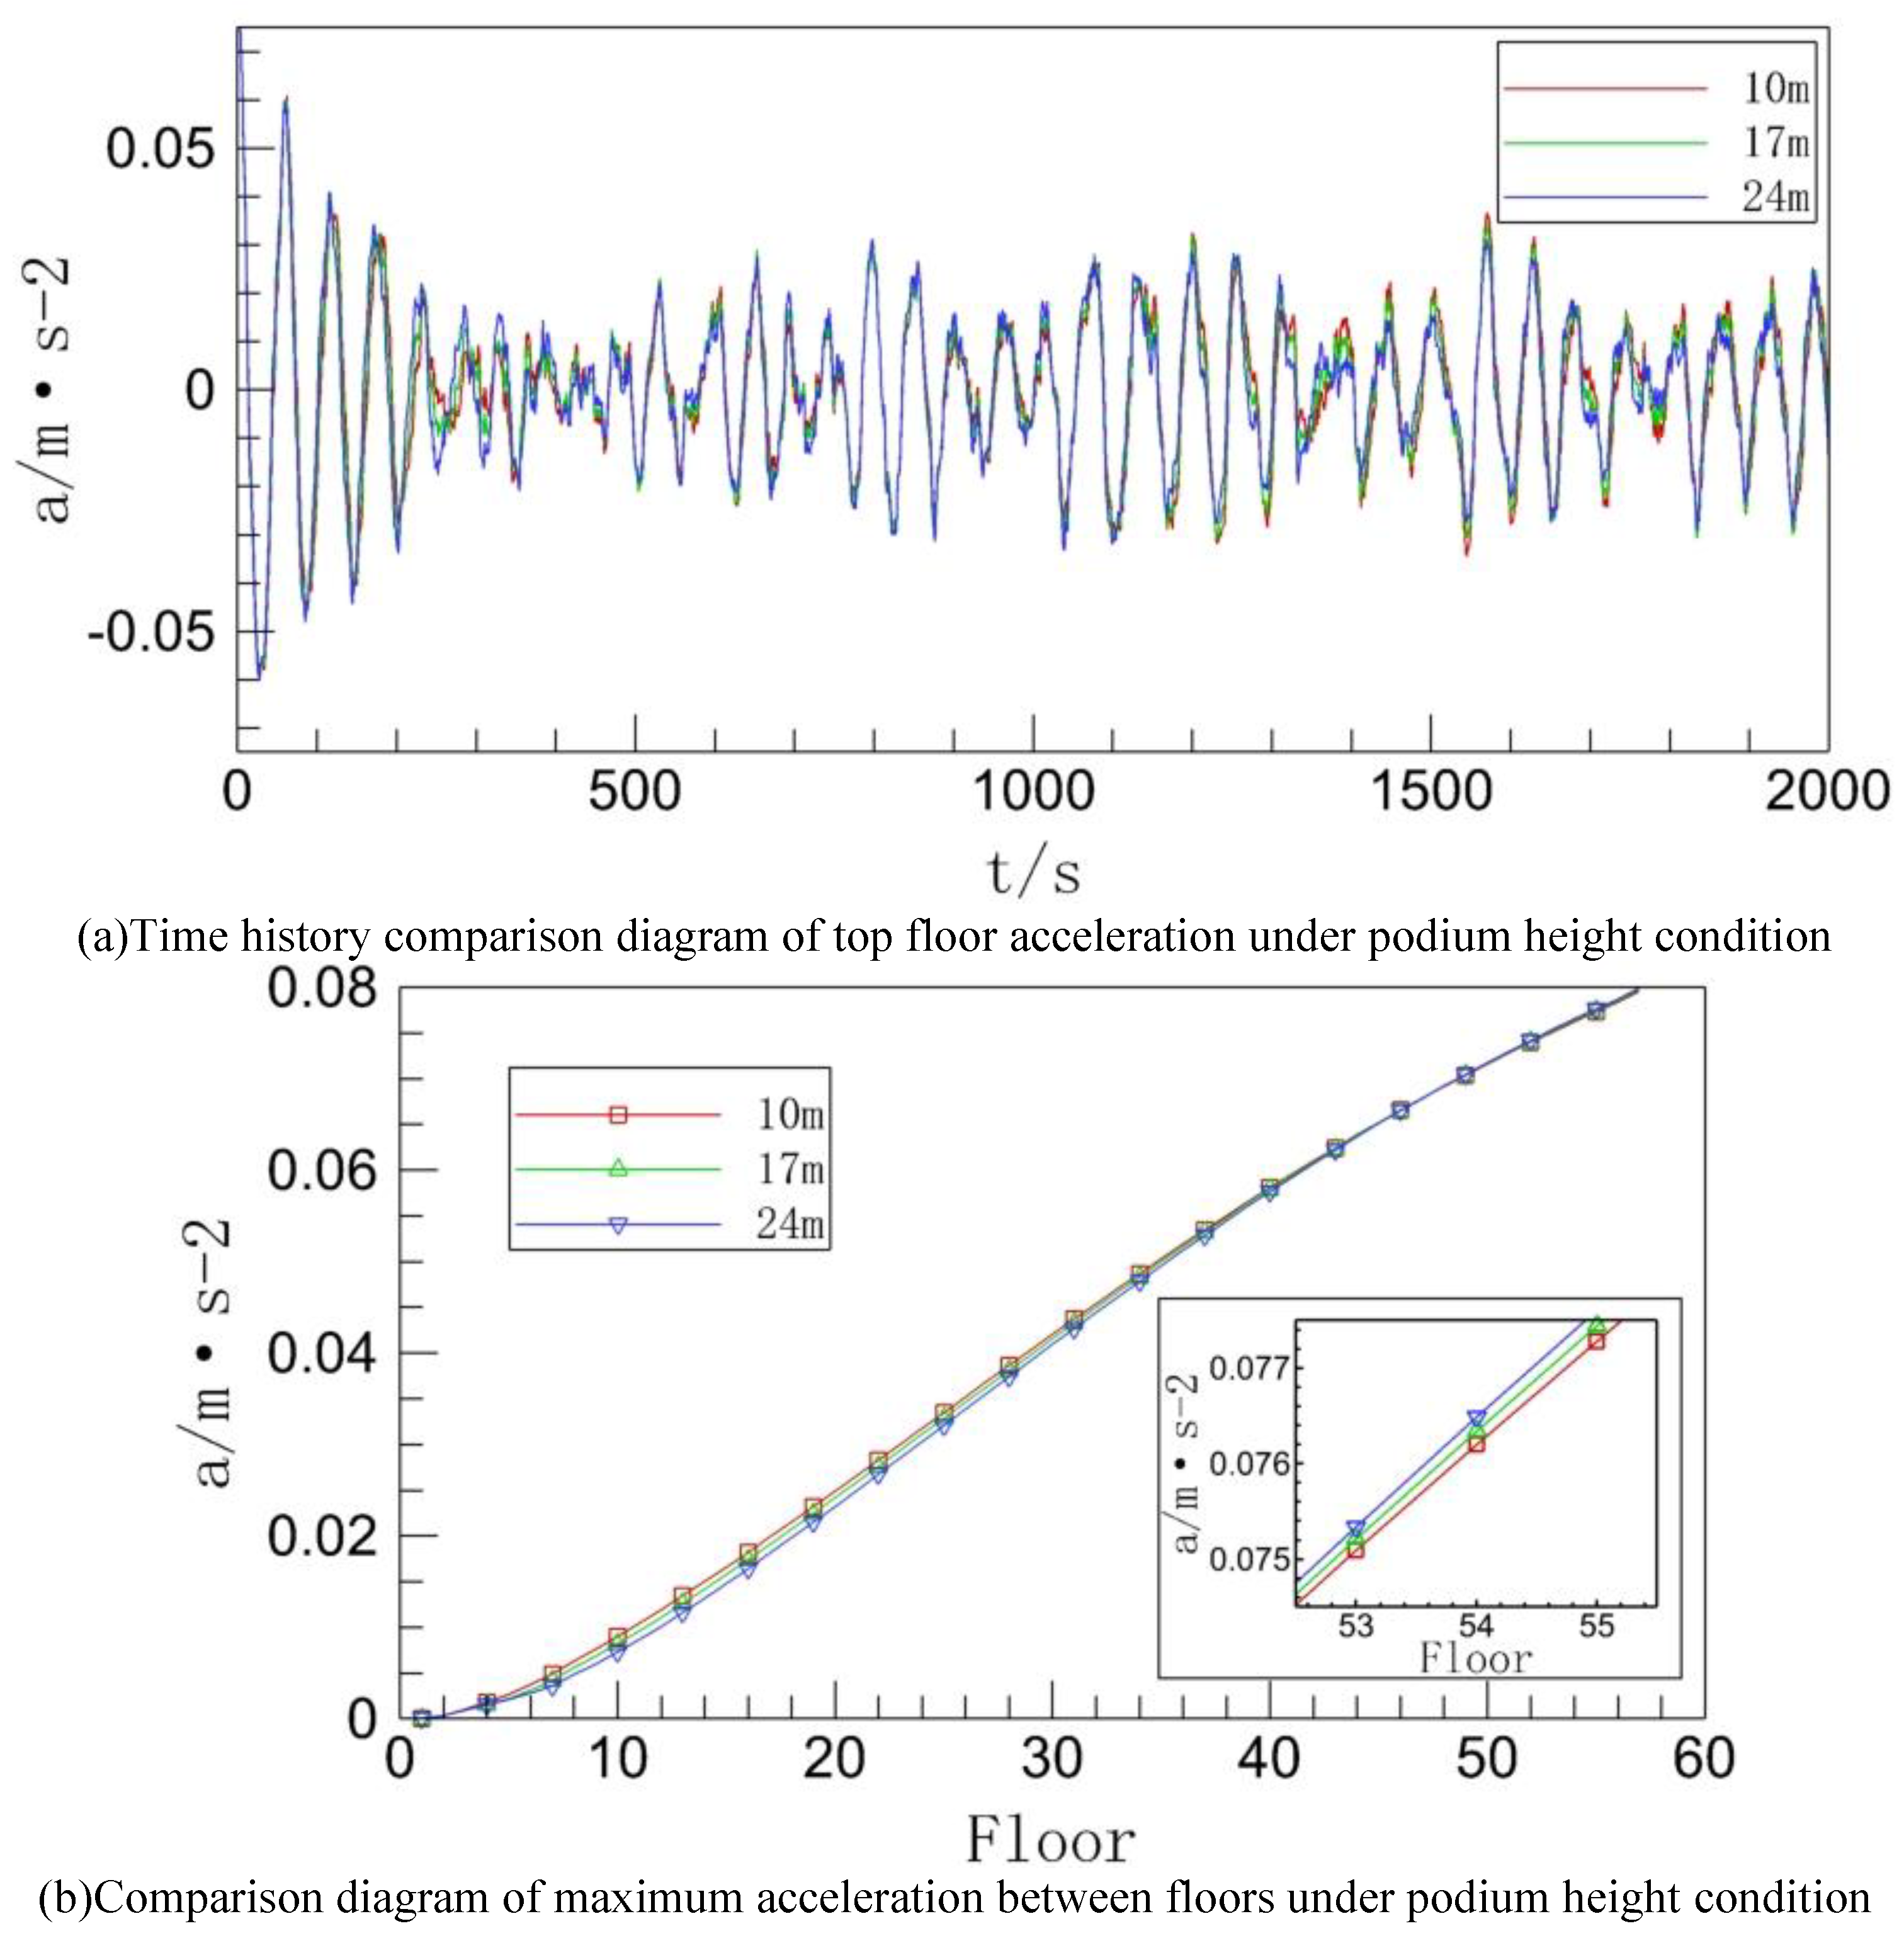
Figure 11 shows the time history of the top floor acceleration and the maximum acceleration of each floor.
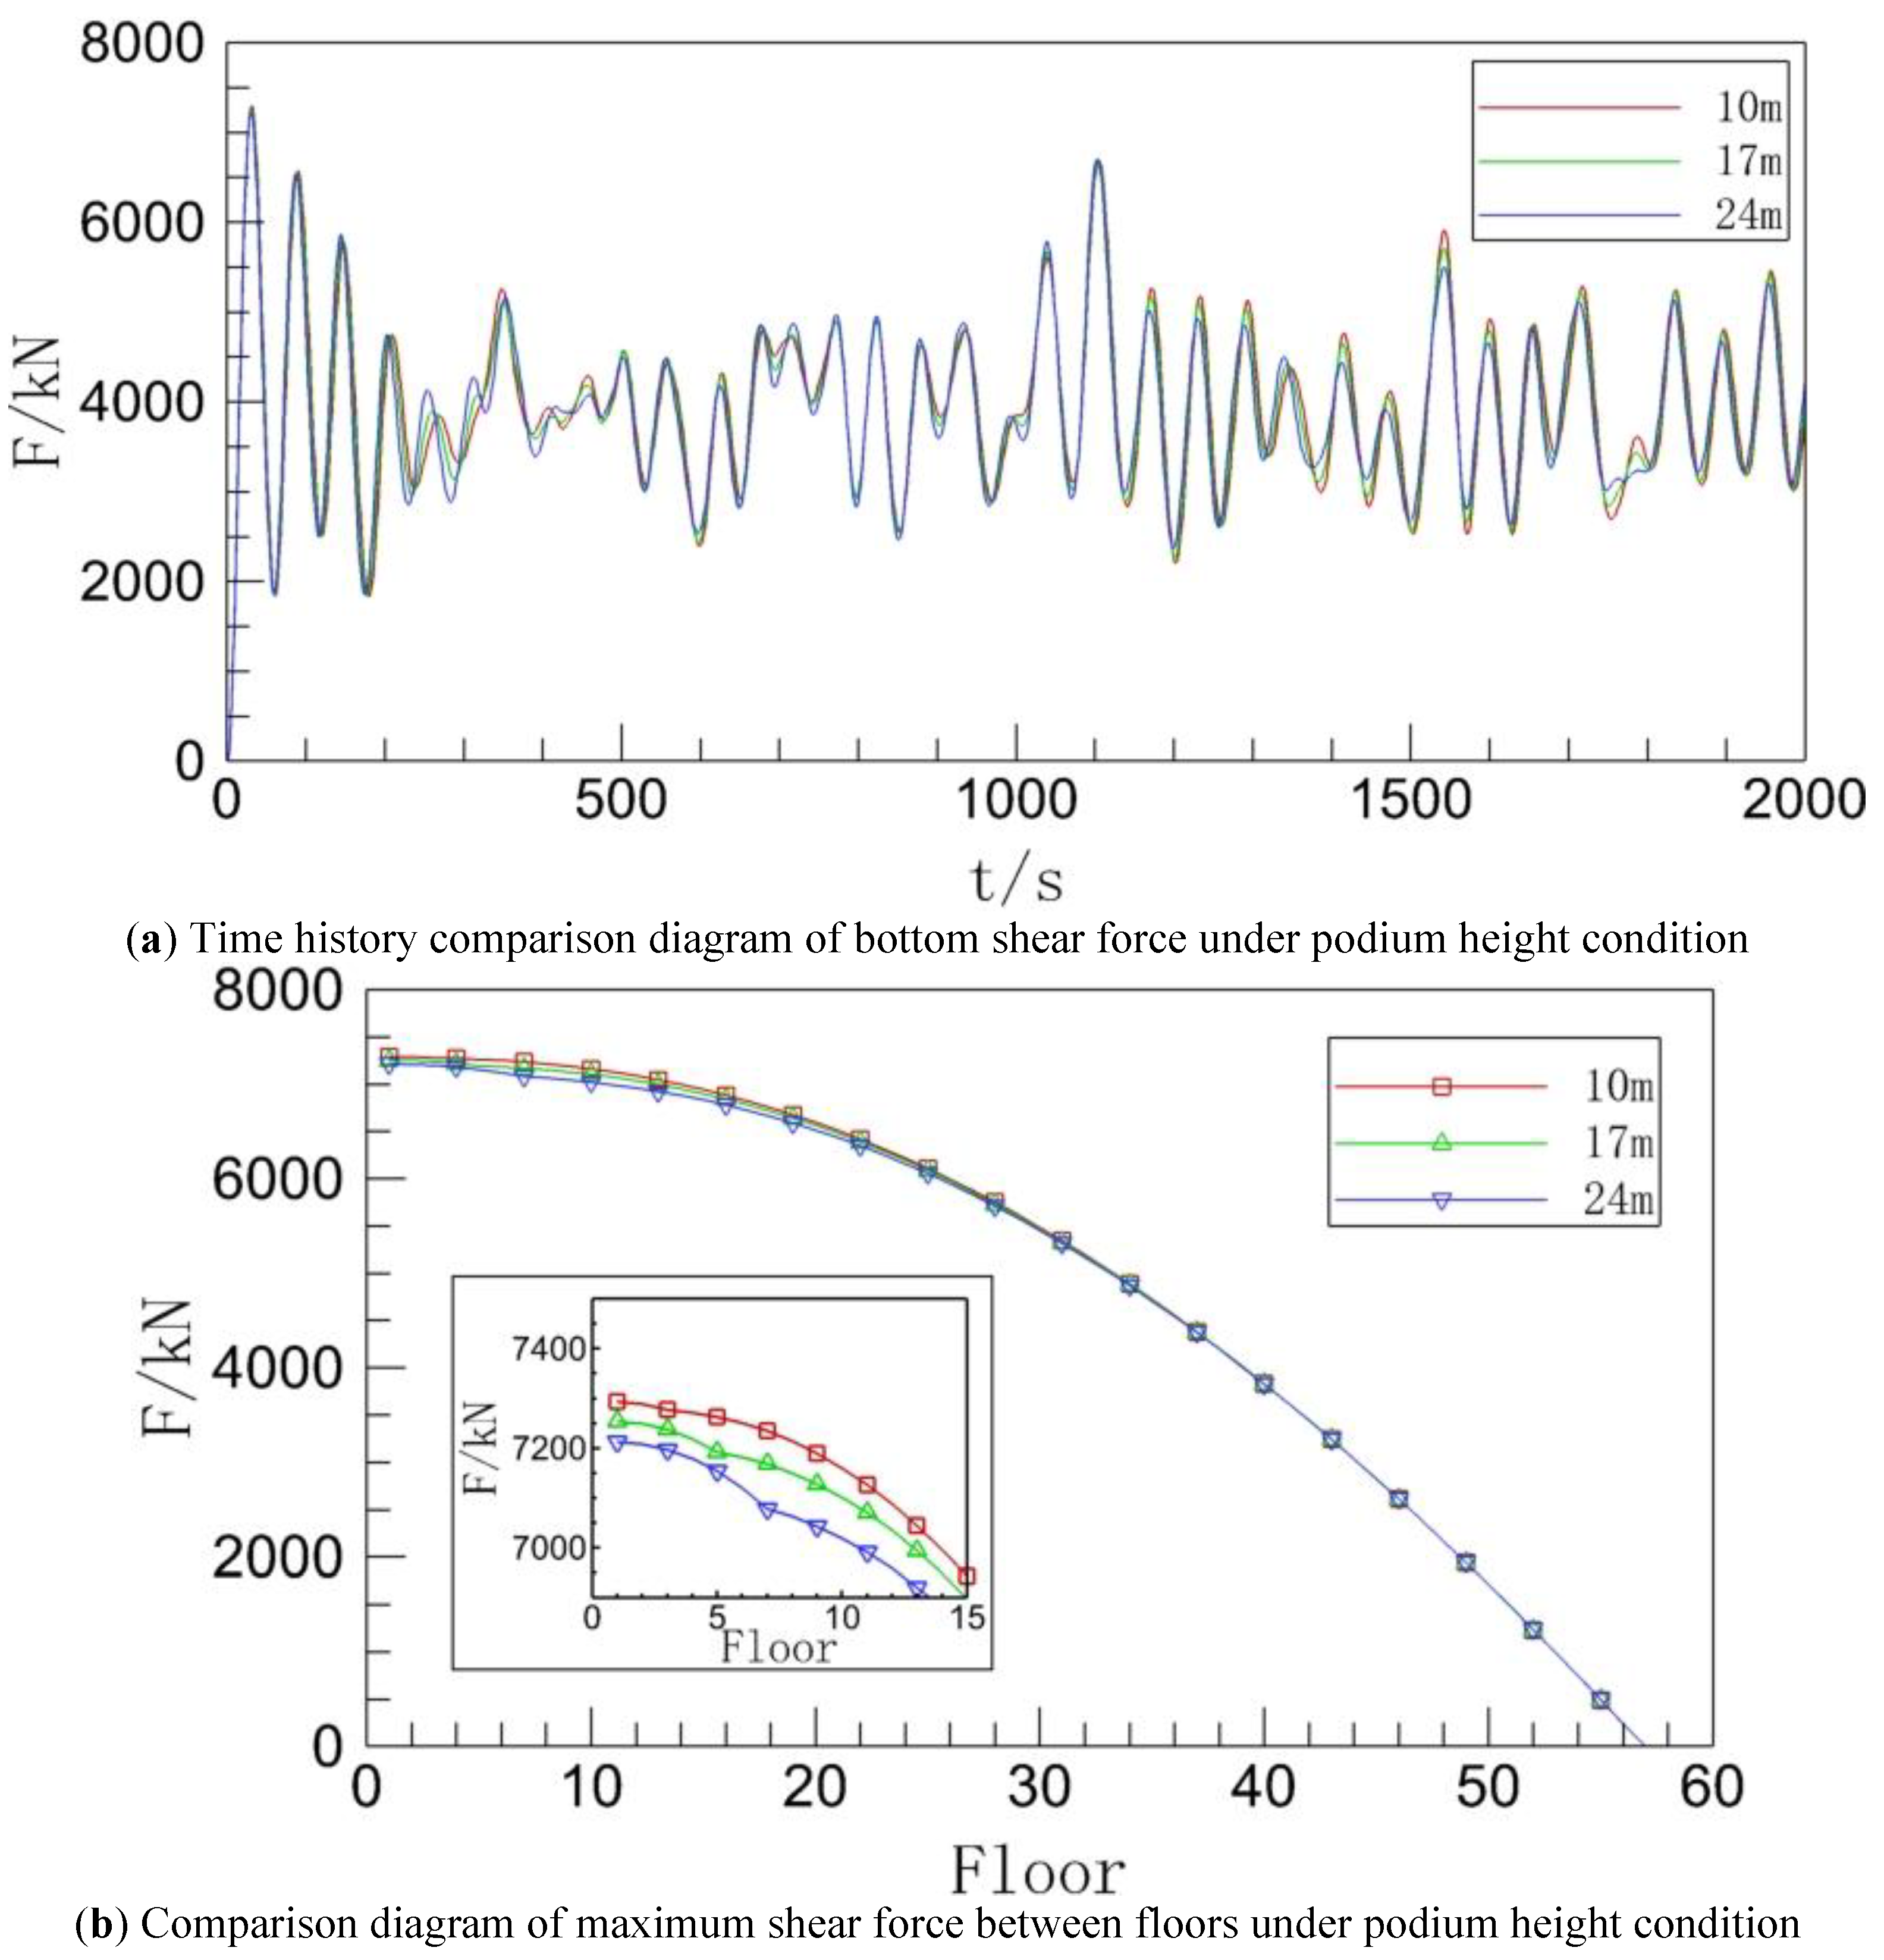
Figure 12 shows the time history of the bottom shear force and the maximum inter-story shear force of each floor.
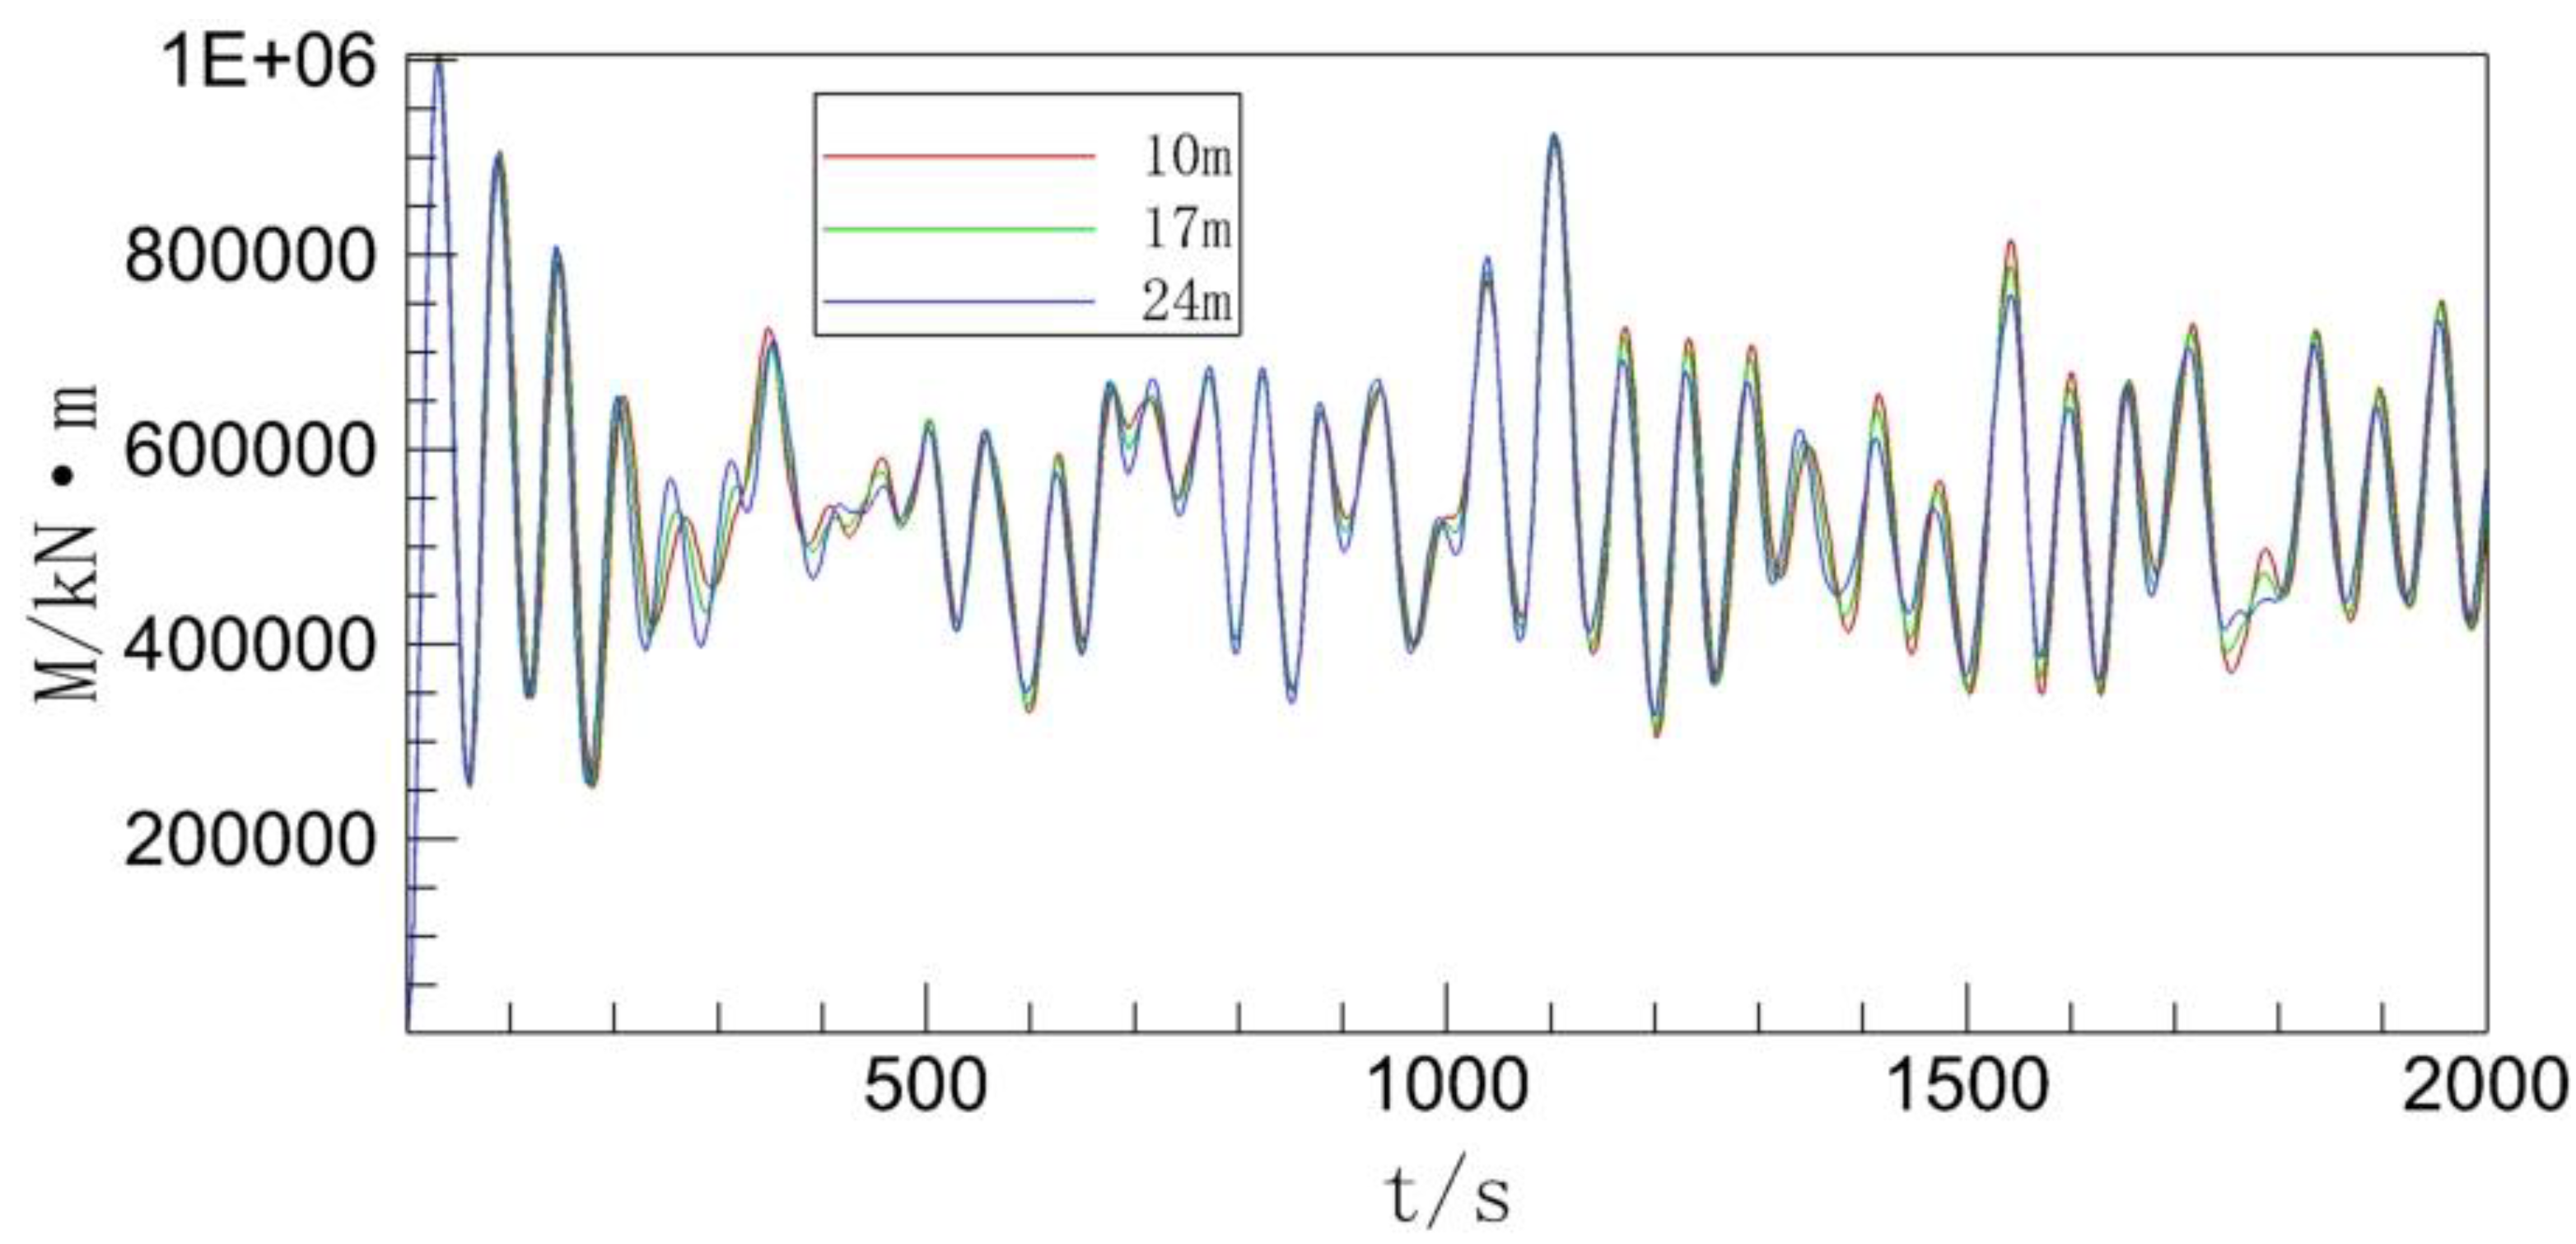
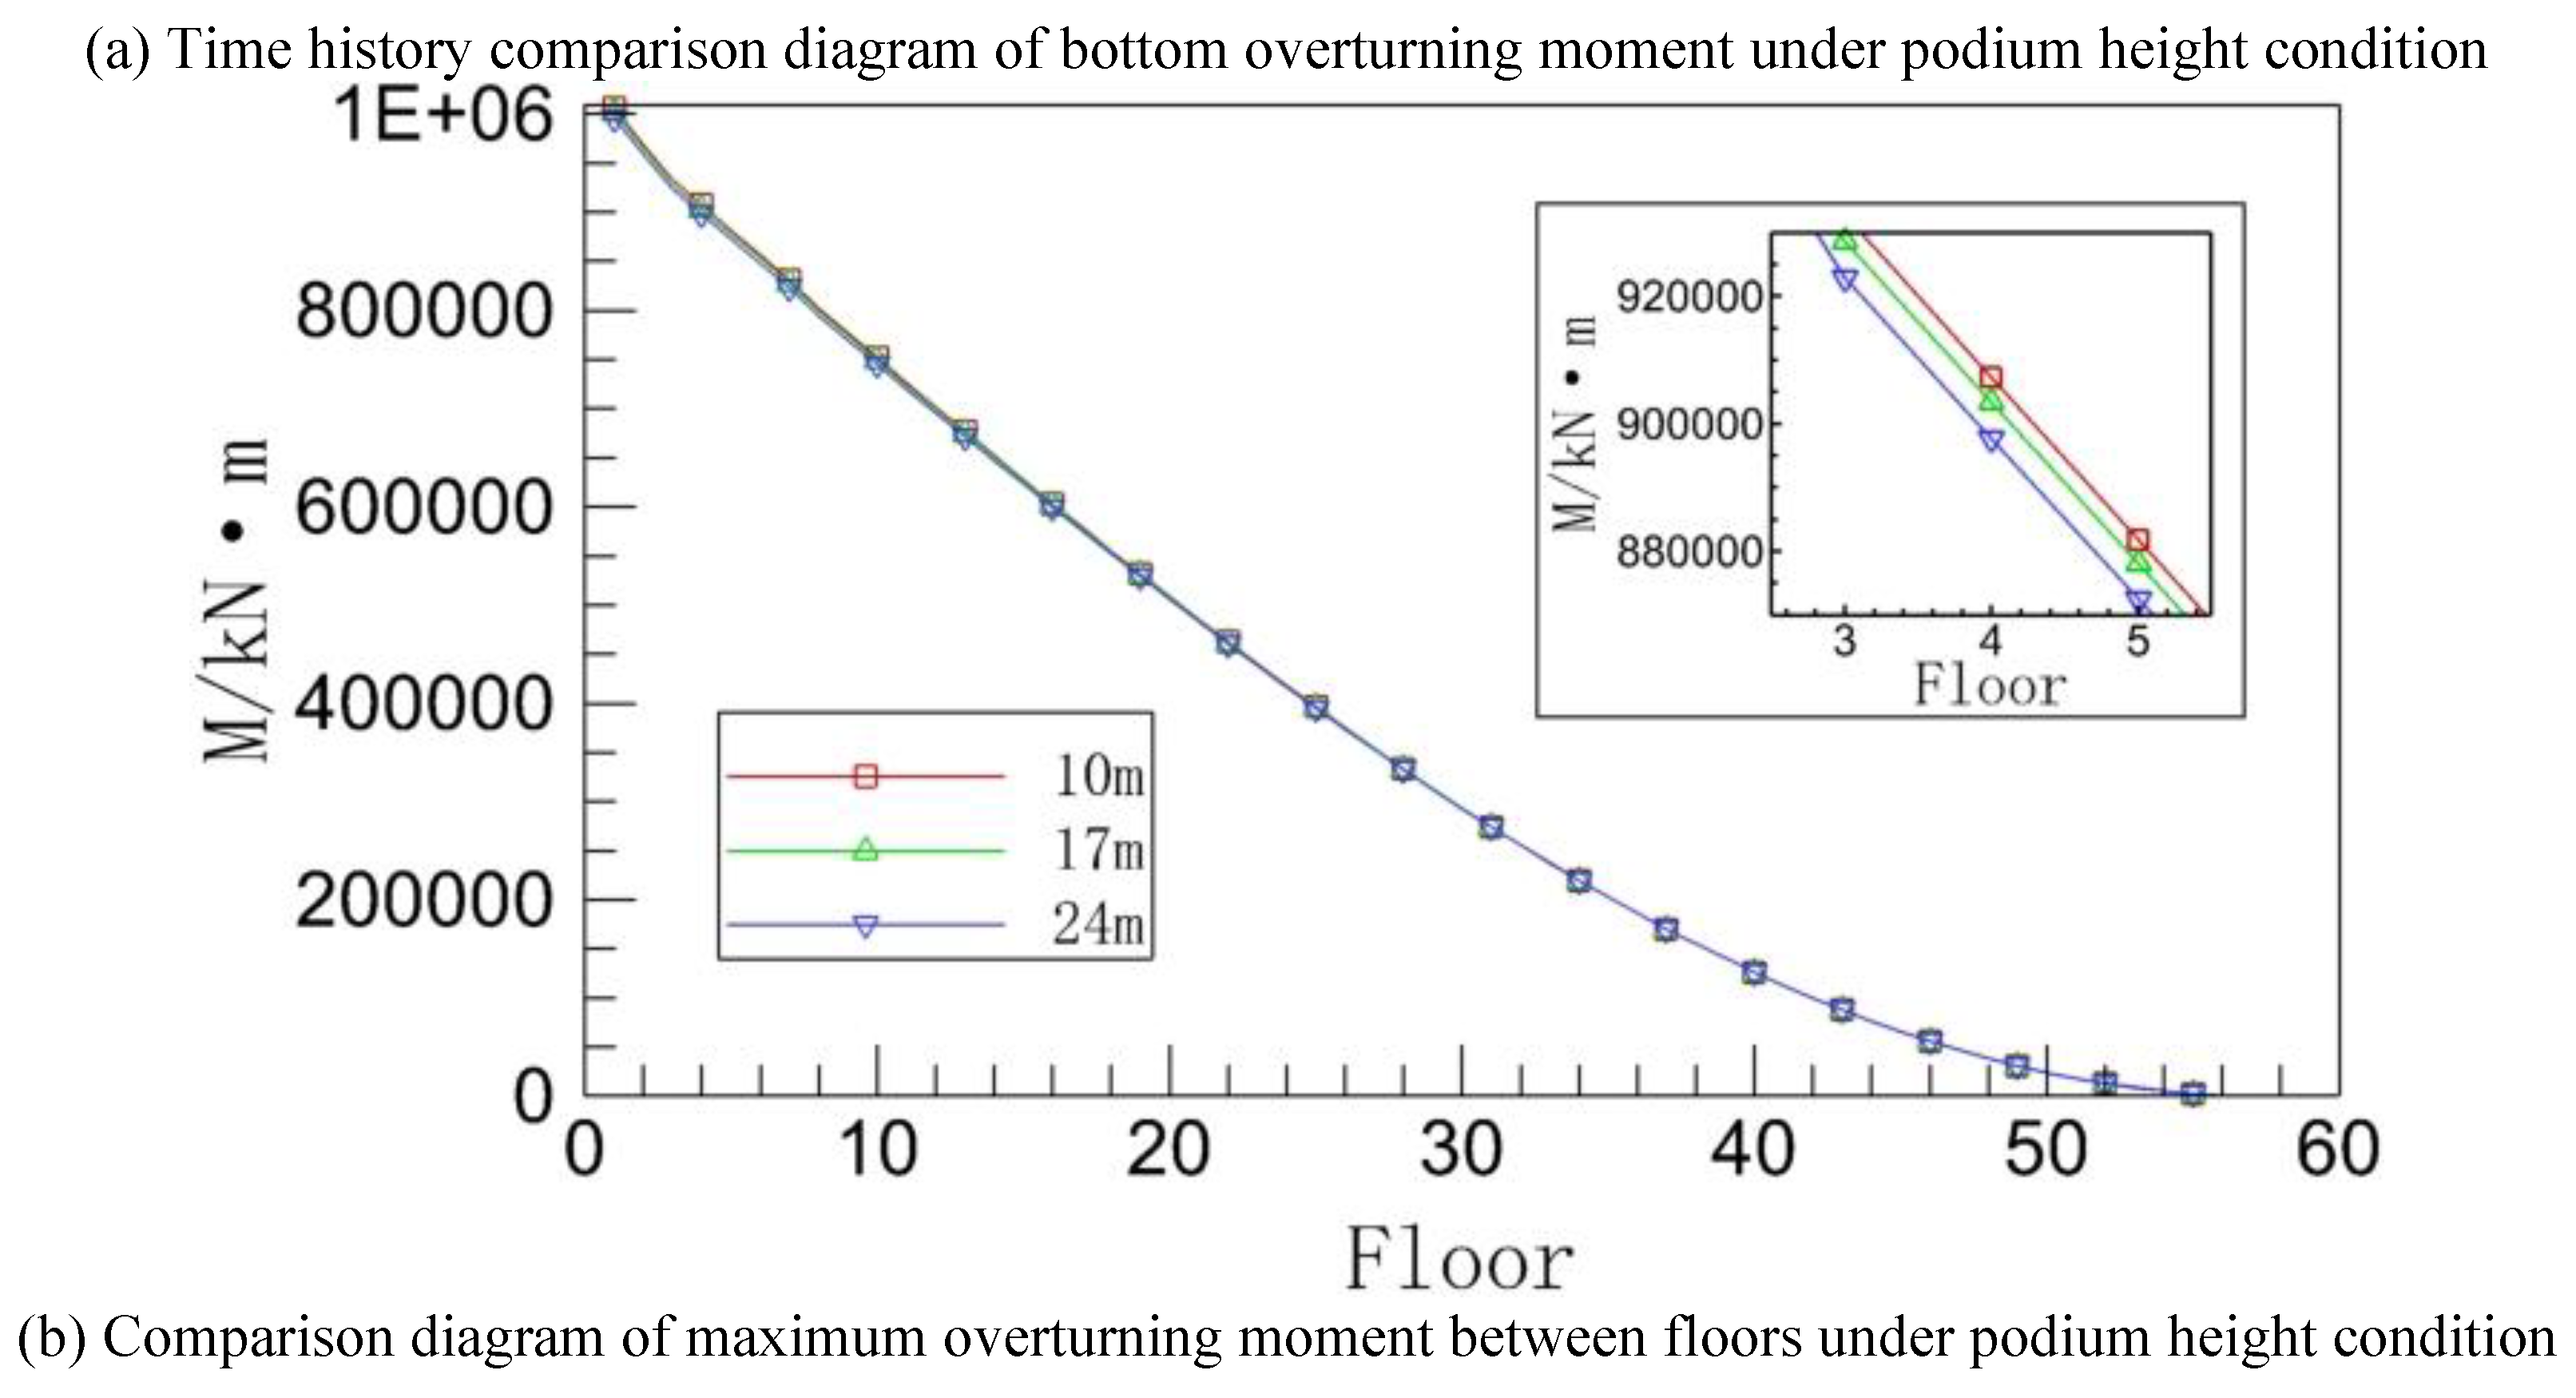
Figure 14 shows the time history of the bottom overturning moment and the maximum overturning moment of each floor.
It can be seen from
Figure 10(a) that with the increase of the podium height, the overall value of the displacement time history curve of the top floor is gradually decreasing, and from the peak value of the curve under the three working conditions, the overall amplitude of the curve is also decreasing. This shows that the higher the podium, the smaller the displacement fluctuation amplitude of the top floor of the building. By observing
Figure 10(b), it can be seen that with the increase of the building floor, the maximum inter floor displacement under the three working conditions shows an obvious increasing trend. Secondly, comparing the maximum displacement curves between the floors under the three working conditions, it can be clearly seen that the maximum displacement between the floors of the building gradually decreases with the increase of the podium height, and the curve difference between the three working conditions gradually increases with the increase of the floors.
The podium structure at the bottom of the high-rise building can boost the bottom stiffness of the building to a certain level, improving the building’s total wind resistance, according to the research of the working conditions with and without the podium. Similar to this, the research of the podium height condition revealed that as the podium height increased, the stiffness of the building’s main body increased. As a result, the building’s inter-story displacement decreased and the displacement pulsation amplitude increased.
As the podium’s height increases, it is evident from
Figure 11(a) that both the amplitude and period of the pulsation of the acceleration time history curve are gradually diminishing. As can be observed from
Figure 11(b), the acceleration rises noticeably as the floor height rises, and the maximum acceleration curve between floors follows the expected trend. The acceleration difference between each curve, which starts at zero and increases until it reaches its maximum value around the tenth floor, then gradually decreases until the two curves essentially coincide, can be seen in
Figure 11(b). During this time, the maximum acceleration magnitude between building floors gradually decreases with the increase in podium height. The acceleration numbers are in the opposite order of magnitude as before starting at about the 45
th story of the building, and the difference in acceleration is growing. The detailed
Figure in
Figure 12(b)’s lower right corner makes it easy to determine the magnitude difference between the acceleration values. Following analysis of the podium height scenario, it was discovered that elevating the podium can successfully reduce inter-story acceleration in the building’s middle and lower floors, similar to the cases with and without a podium. Reaching the middle and upper stories, this suppression effect is totally reversed as the floors rise higher.
Figure 11.
Inter-storey displacement under podium height condition.
Figure 11.
Inter-storey displacement under podium height condition.
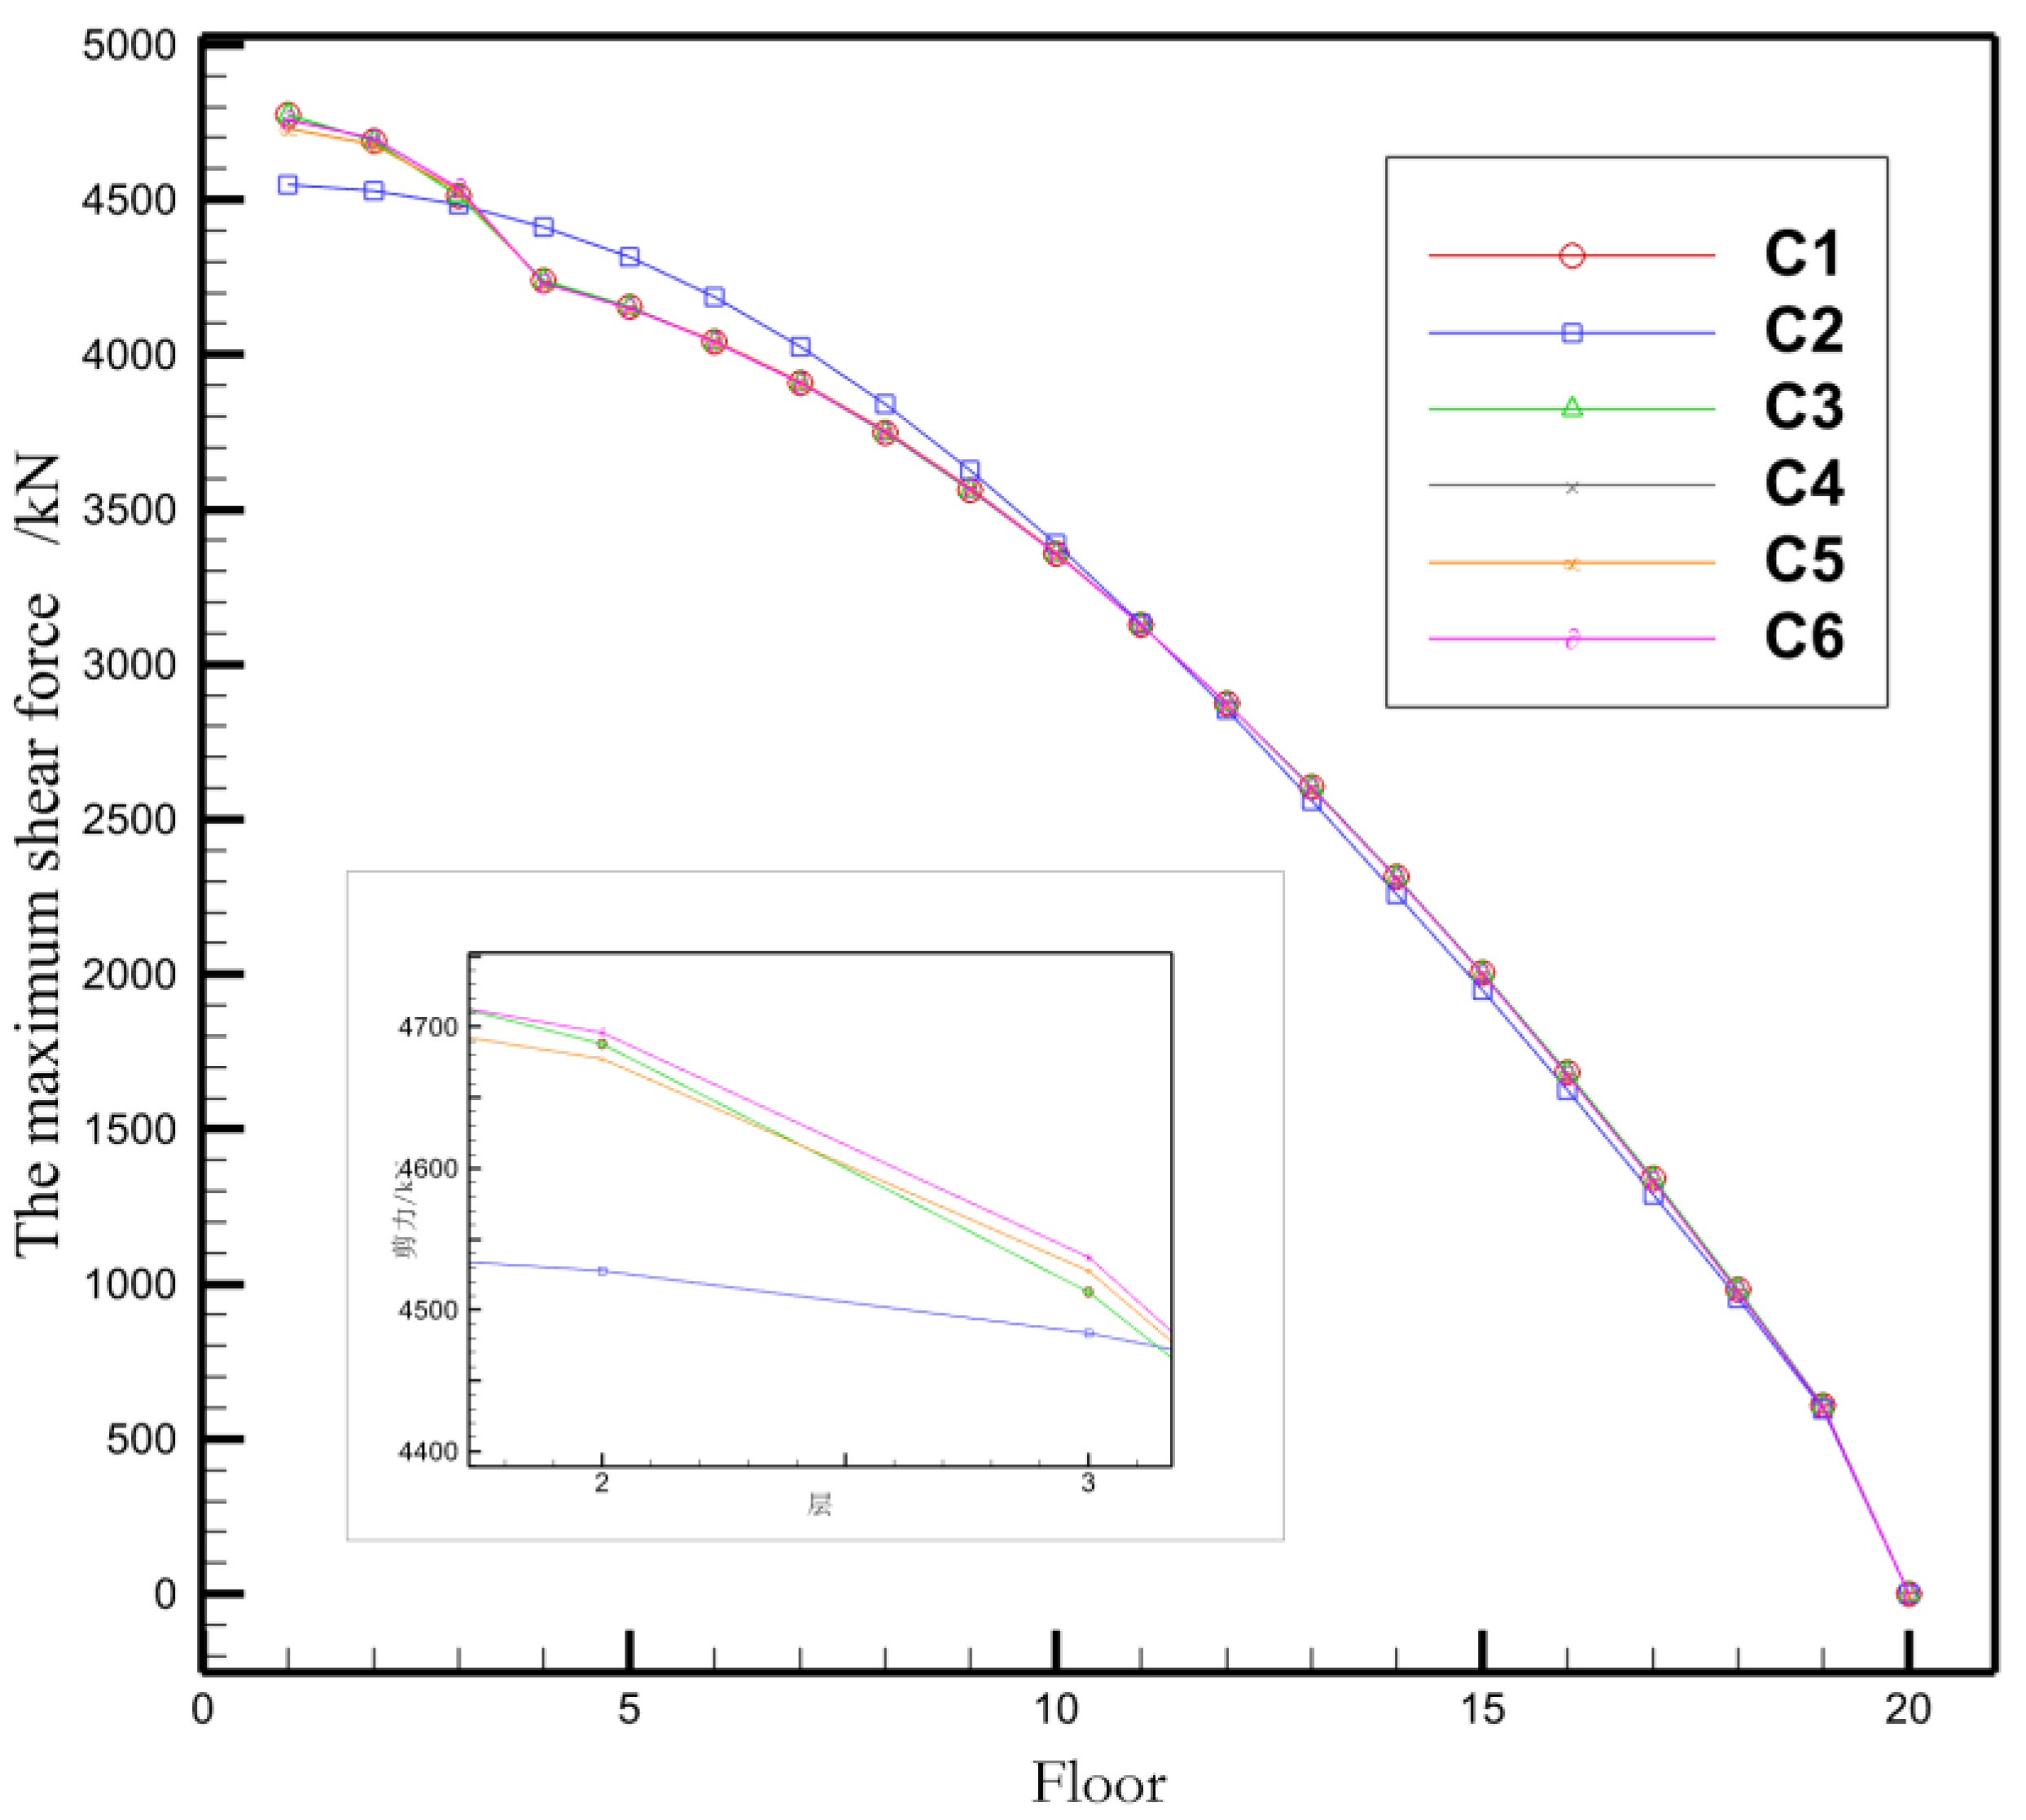
The bottom shear time history curves for the three working conditions are extremely similar, as can be shown in
Figure 12(a). The three have different pulsation amplitudes, but there isn’t a very noticeable difference between them, so it can be concluded that altering the podium’s height doesn’t significantly affect the building’s bottom shear.
As the floors rise higher, it is clear from
Figure 12(b) that the maximum inter-story shear forces for the three operating conditions only differ marginally at the lower floors. The shear force difference between the curves in the
Figure is not as noticeable as it would be in the case with and without the podium because the value of the shear force at the base of the building does not vary significantly as a result of the little increase in podium height. However, as can be seen from the detail diagram in the lower right corner of
Figure 12(b), the maximum inter-story shear force close to the intersection level of the main structure of the building and the podium gradually reduces with an increase in podium height.
Figure 12.
Inter-storey shear under podium height condition.
Figure 12.
Inter-storey shear under podium height condition.
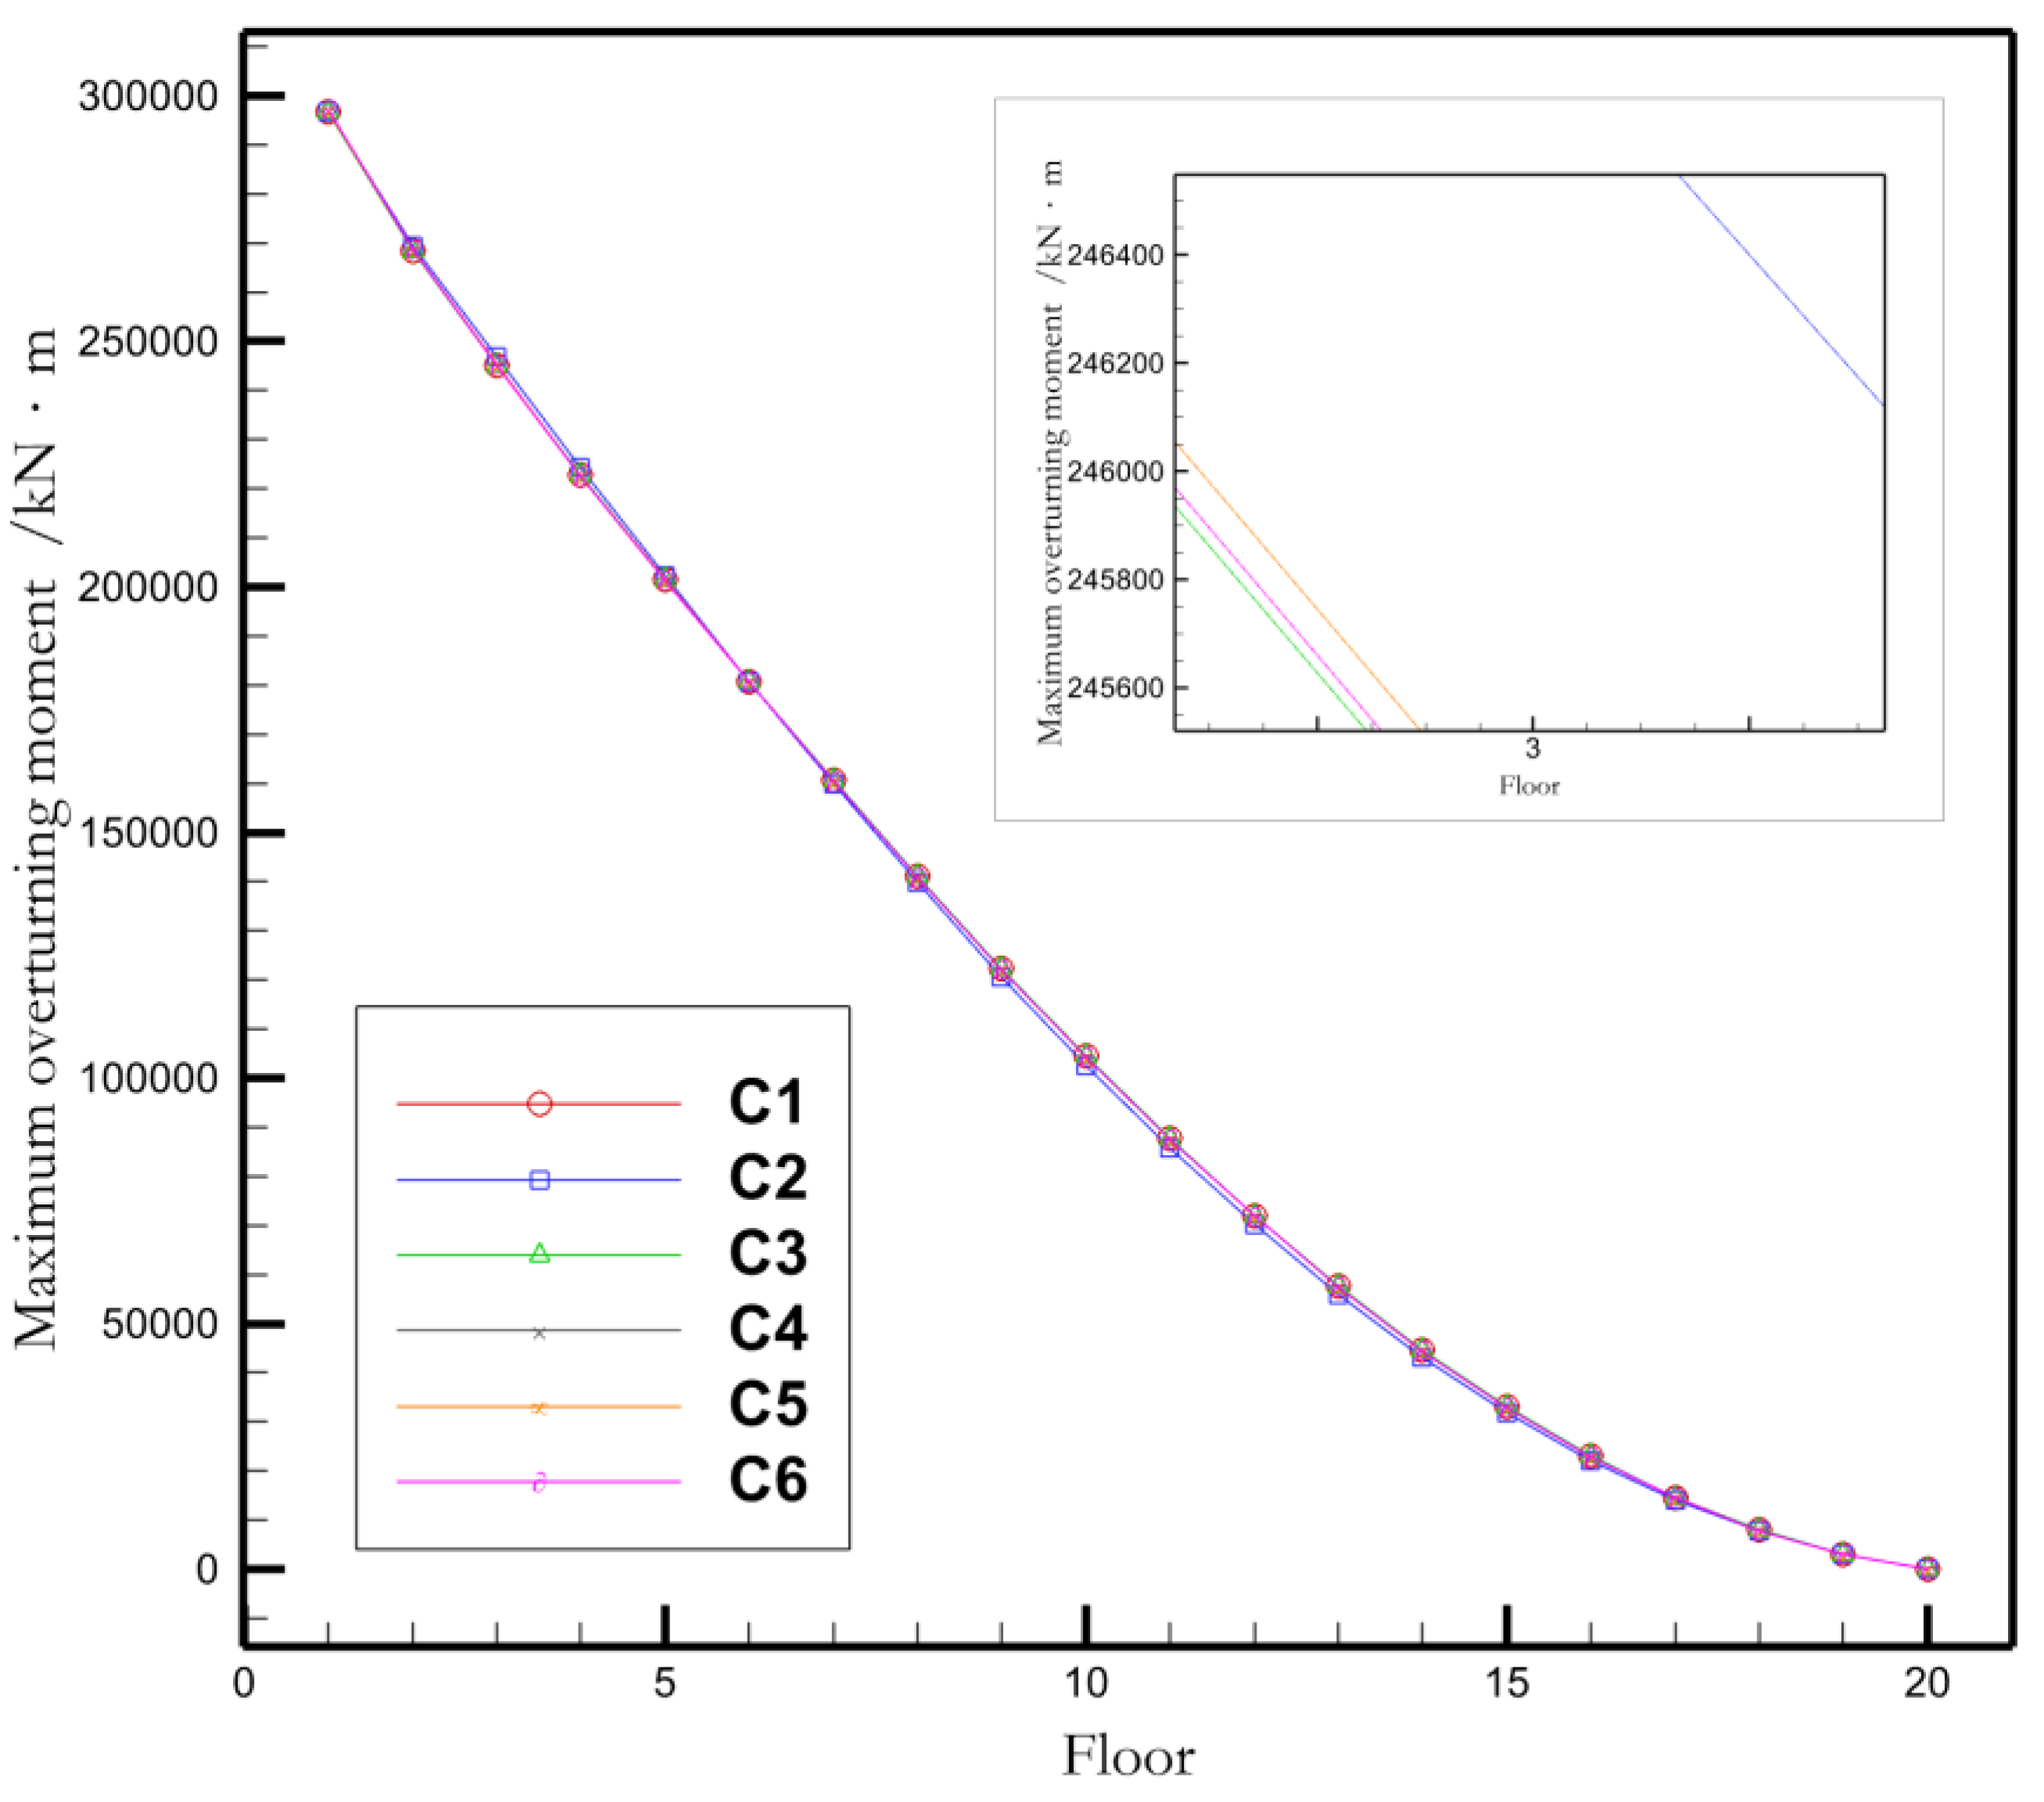
Figure 13(a) reveals that the bottom overturning moment time history curve’s trend and period for the three working conditions are essentially identical to those of
Figure 11(a). This is due to the fact that shear force and overturning moment have a transformation connection that is comparable to the situation in operating conditions with and without podium. Because the overturning moment values in
Figure 13(b) are quite high and the shear forces between the layers for the three working conditions have been somewhat near. The three curves’ differences are thus barely discernible and even close to overlapping. The inter-story overturning moment of the middle and lower floors of the building does, however, gradually decrease with an increase in podium height, as shown by the detail diagram in
Figure 13(b)’s right corner.
Figure 13.
Overturning bending moment between building floors under podium height condition.
Figure 13.
Overturning bending moment between building floors under podium height condition.
Similarly, in order to better analyze the data, important location nodes in the building model were selected for quantitative comparison to highlight the effect of podium height. The data comparison is shown in
Table 7.
From
Table 7, it can be seen that as the height of the podium increases, the average values of various parameters and the parameters of the middle floor decrease. But at the top level, except for displacement, all other parameters increase with the height of the podium building. It can be inferred that one of the reasons for this phenomenon is still the relative weakening of the stiffness effect on the upper part of the building.
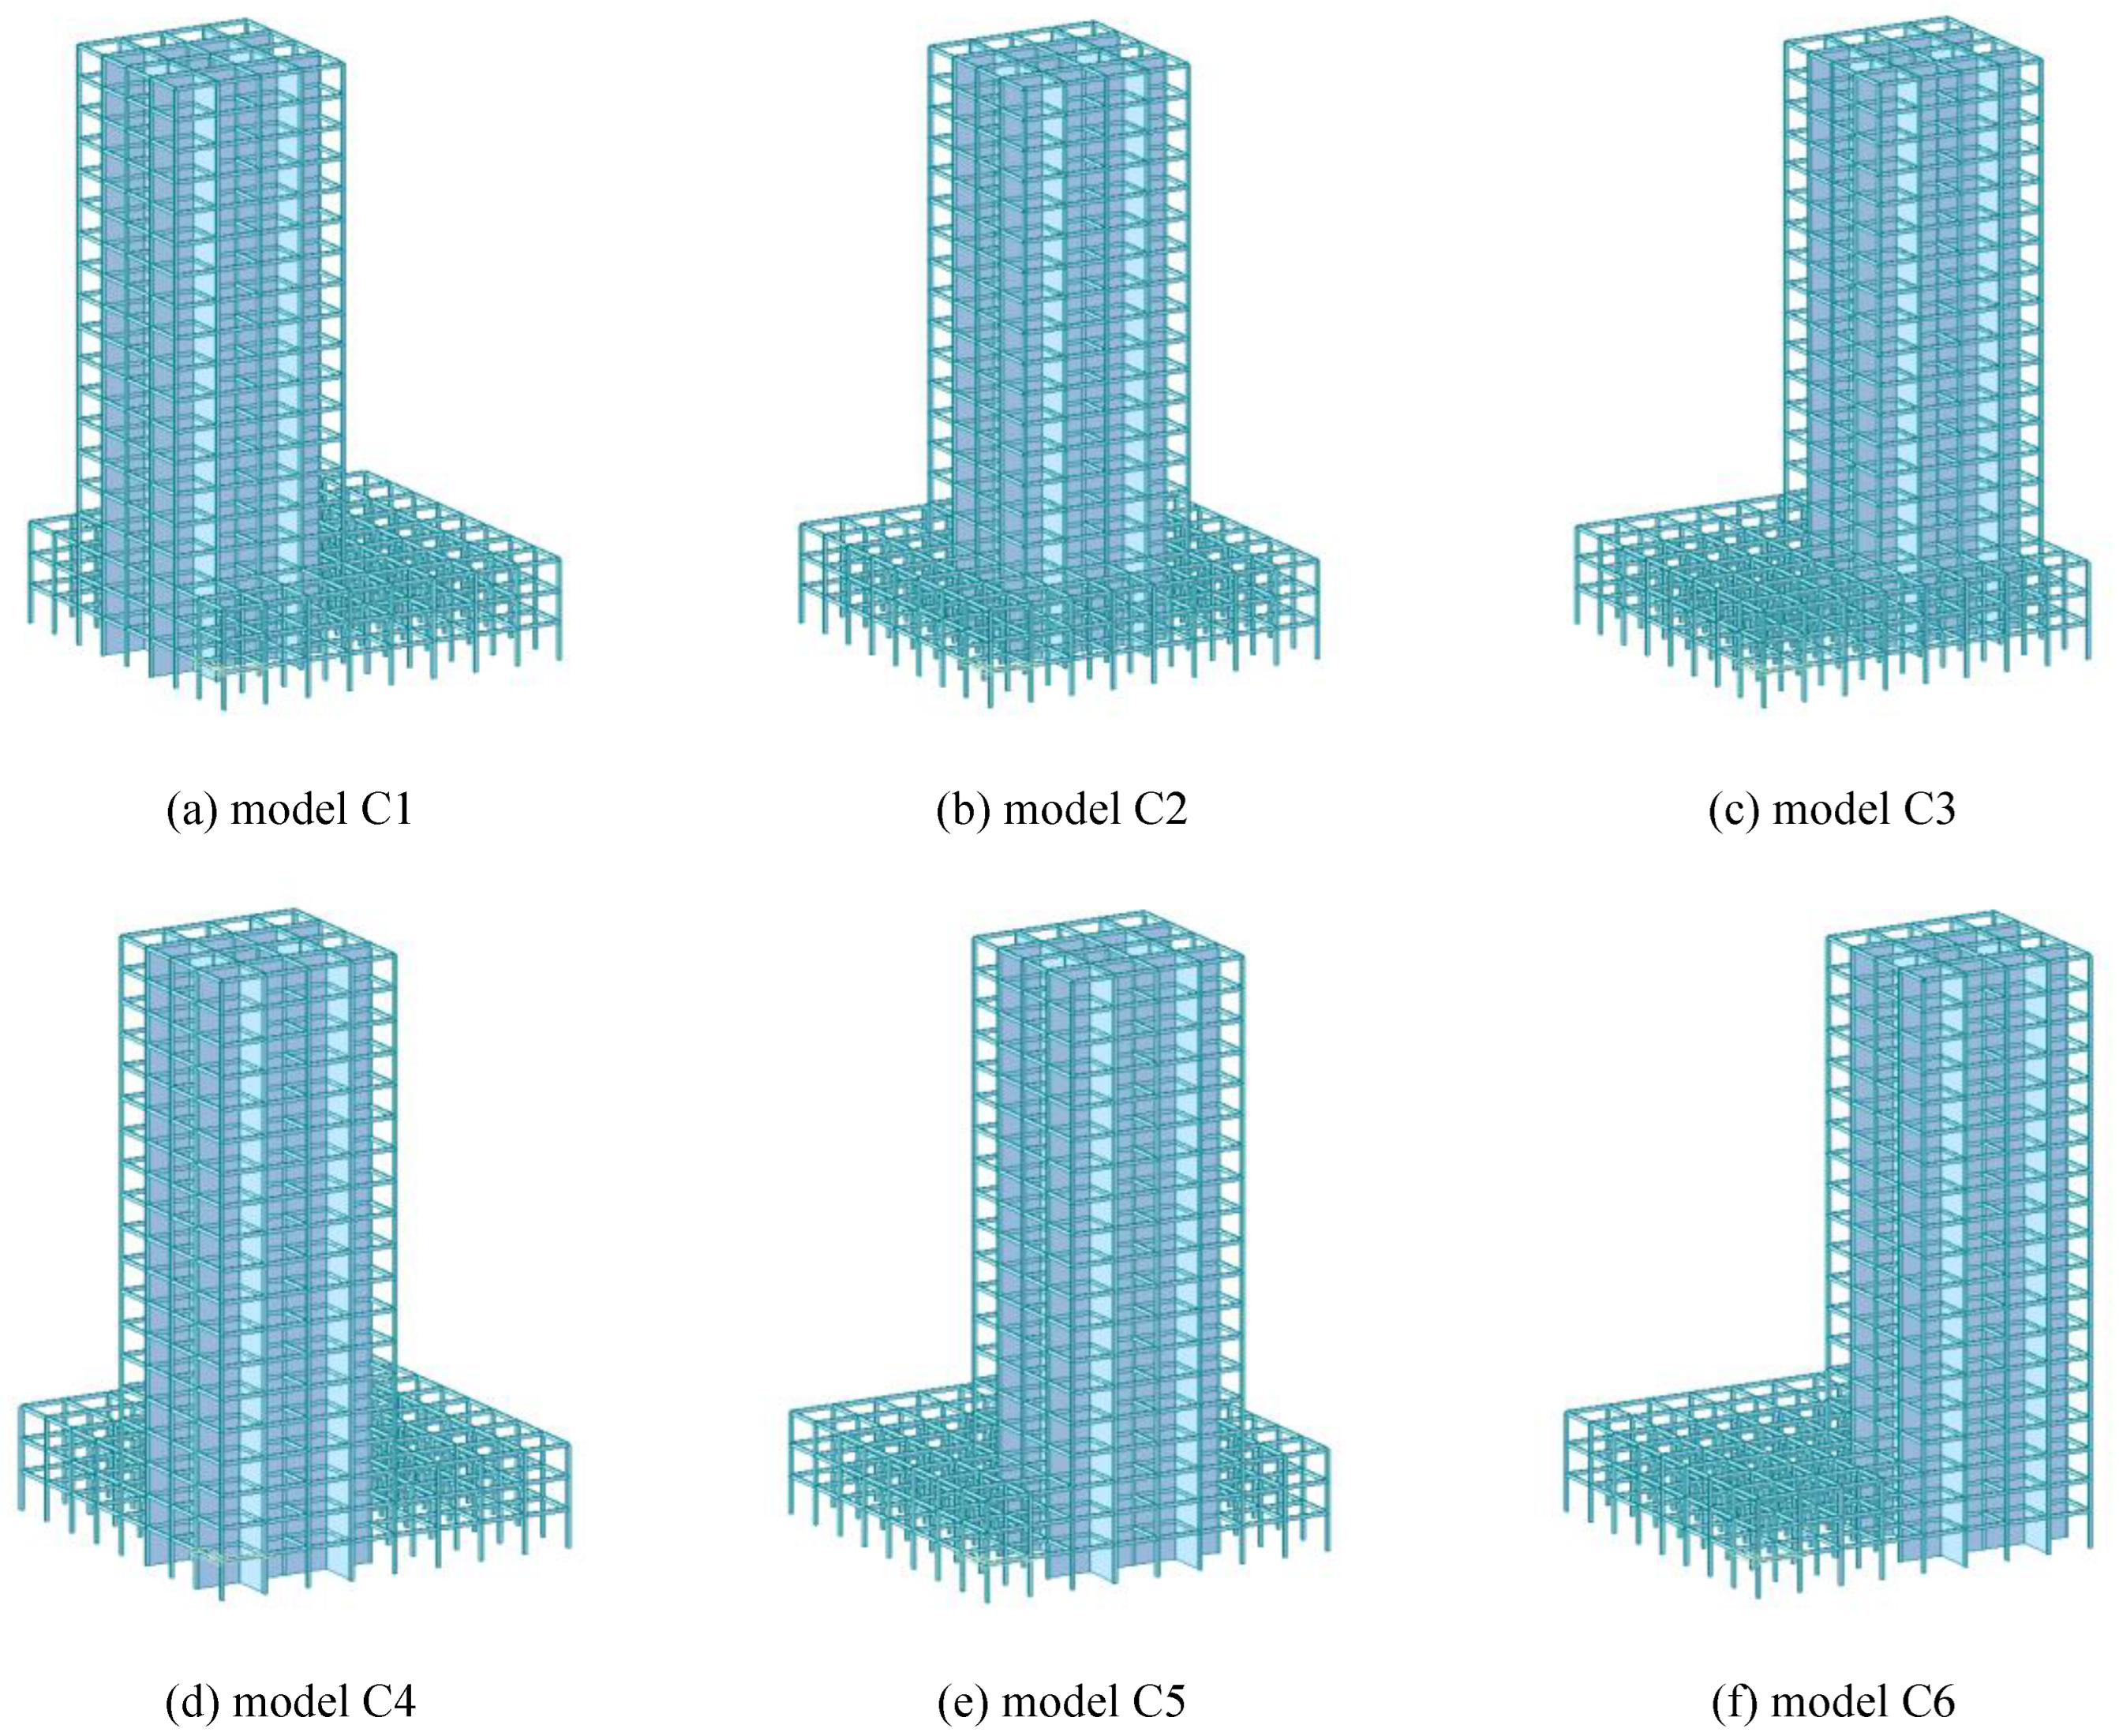
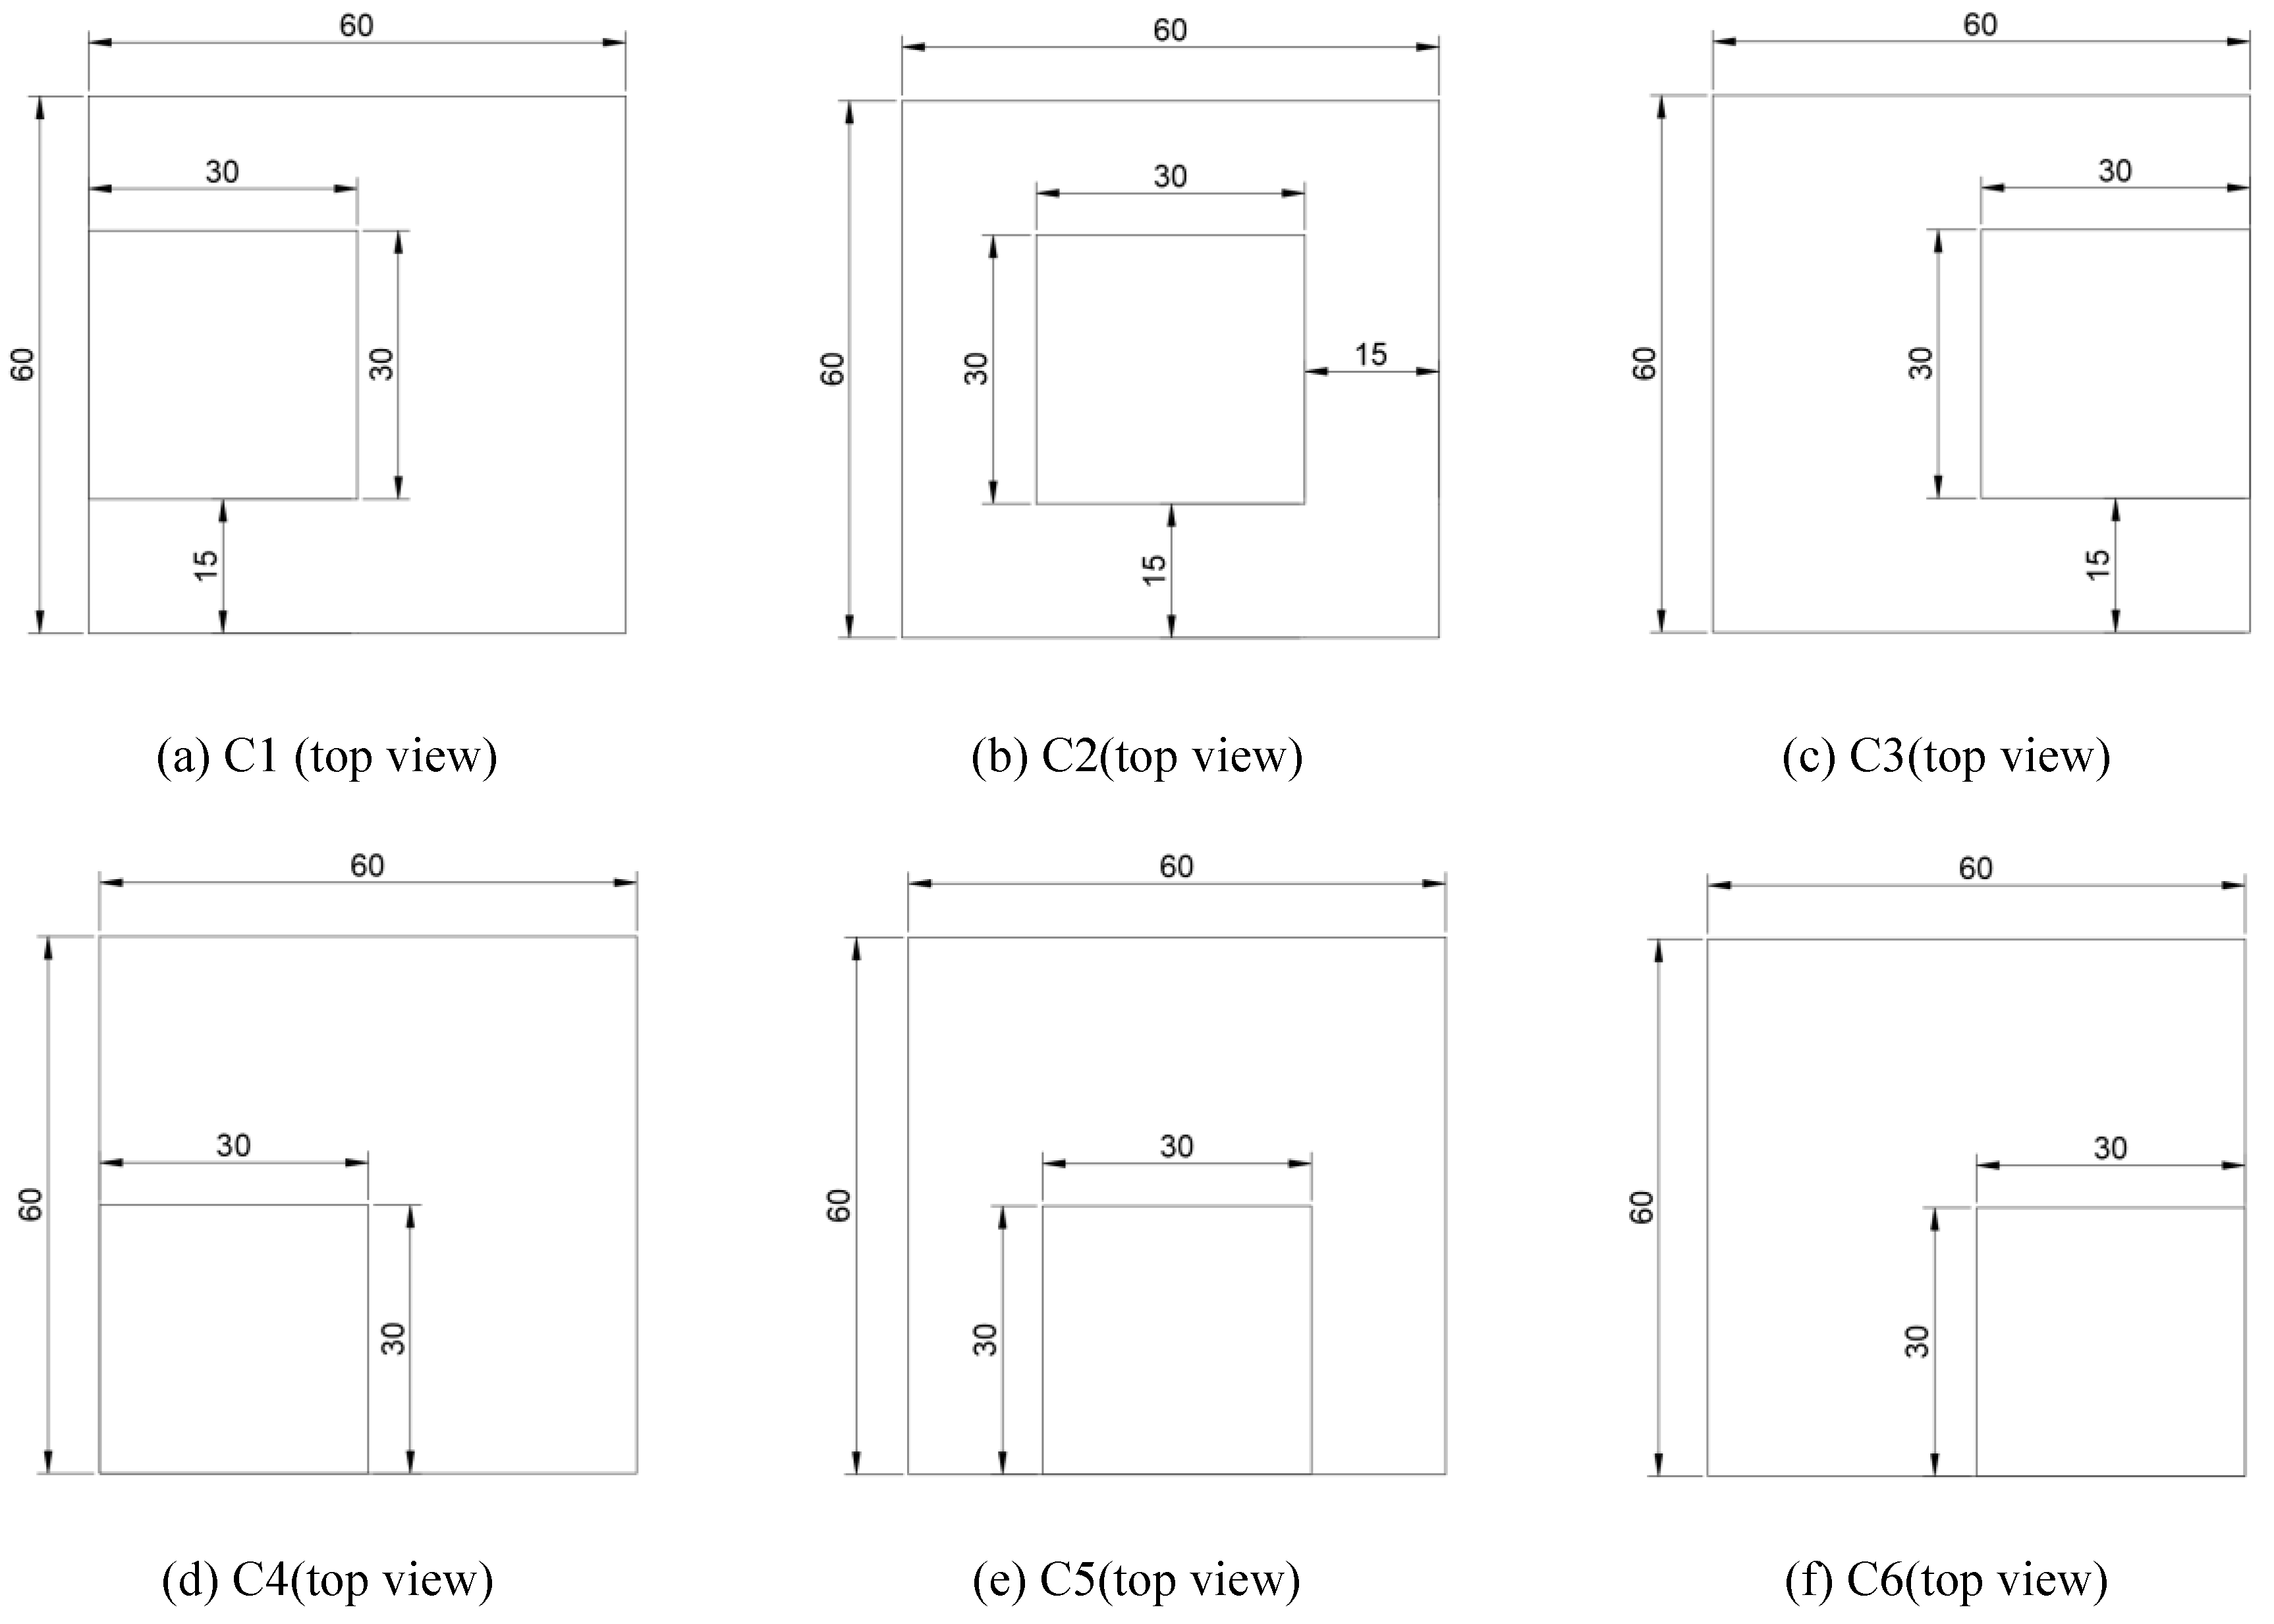
4.3. The Influence of Podium Area on Wind-Induced Vibration Results
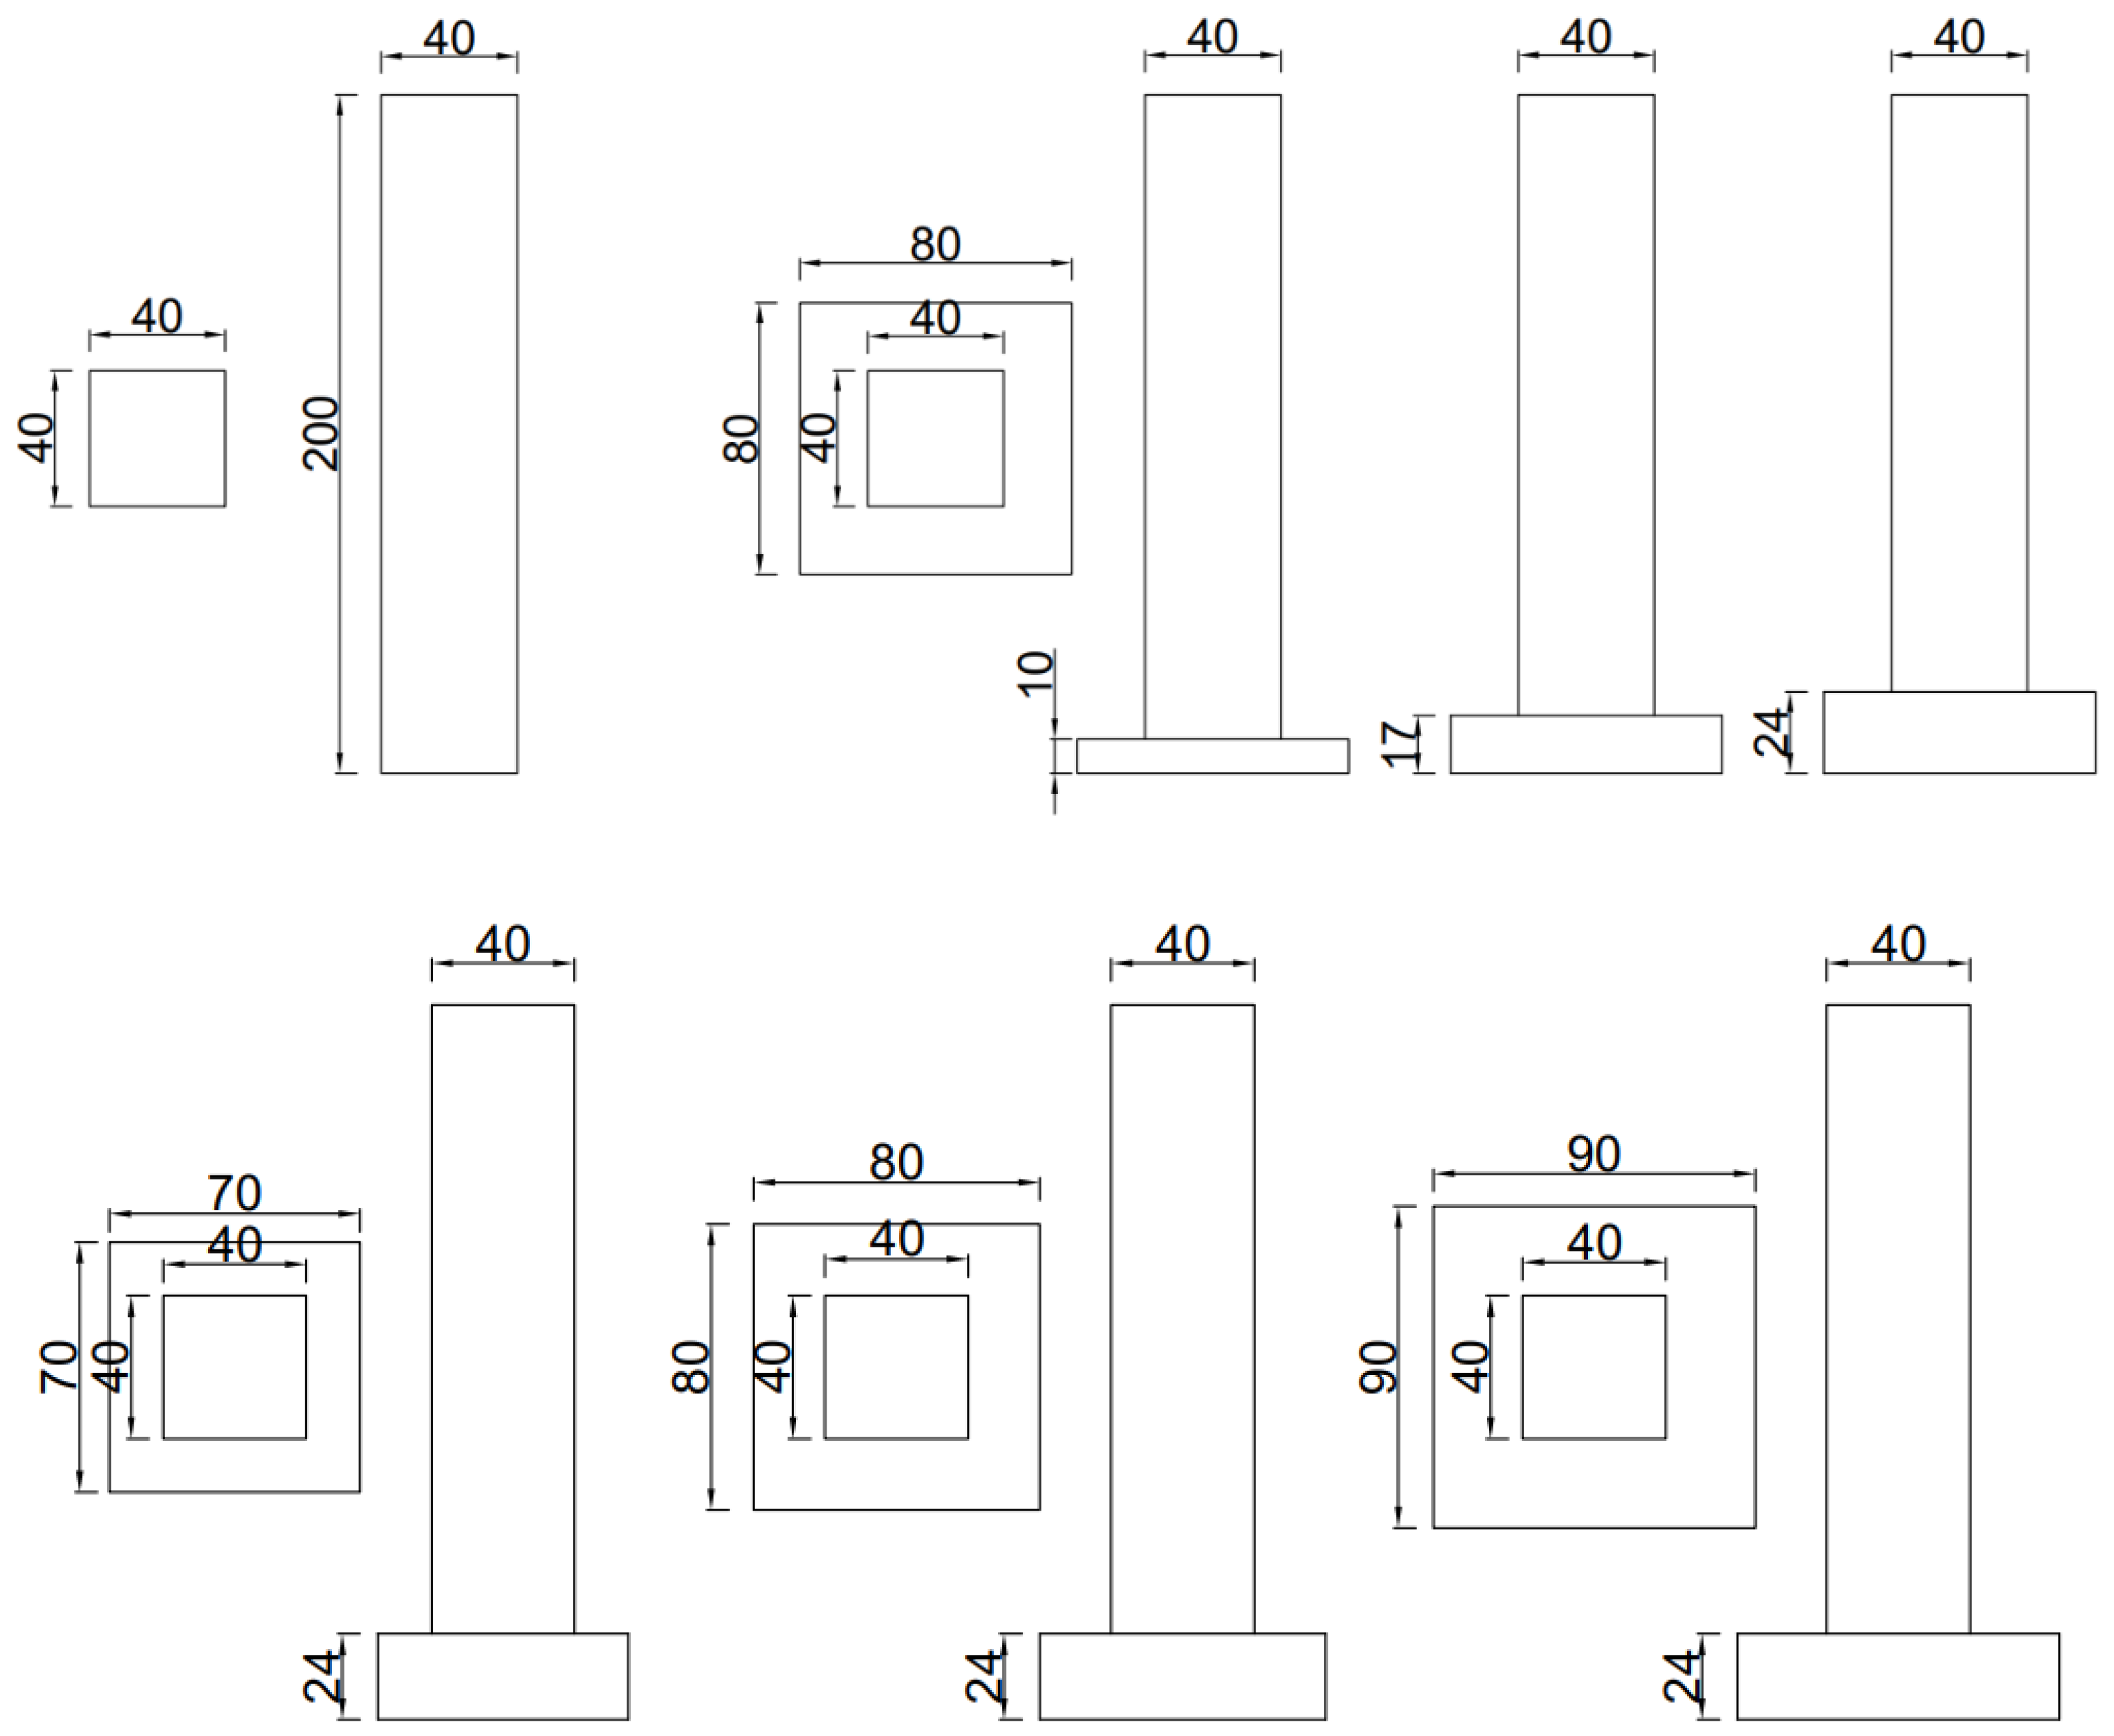
The finite element models of the three podium area working conditions perform modal analysis, The specific settings for the three area conditions are shown in
Table 1. Perform wind vibration response calculation and post-processing analysis on finite element models under three types of podium floor area conditions.
Following the time history analysis,
Figure 14,
Figure 15, and
Figure 16 show the time history of the top floor acceleration and the maximum acceleration of each floor under the three working conditions, the time history of the bottom shear force and the maximum inter-story shear force of each floor under the three working conditions, and
Figure 19 shows the time history of the bottom shear force.
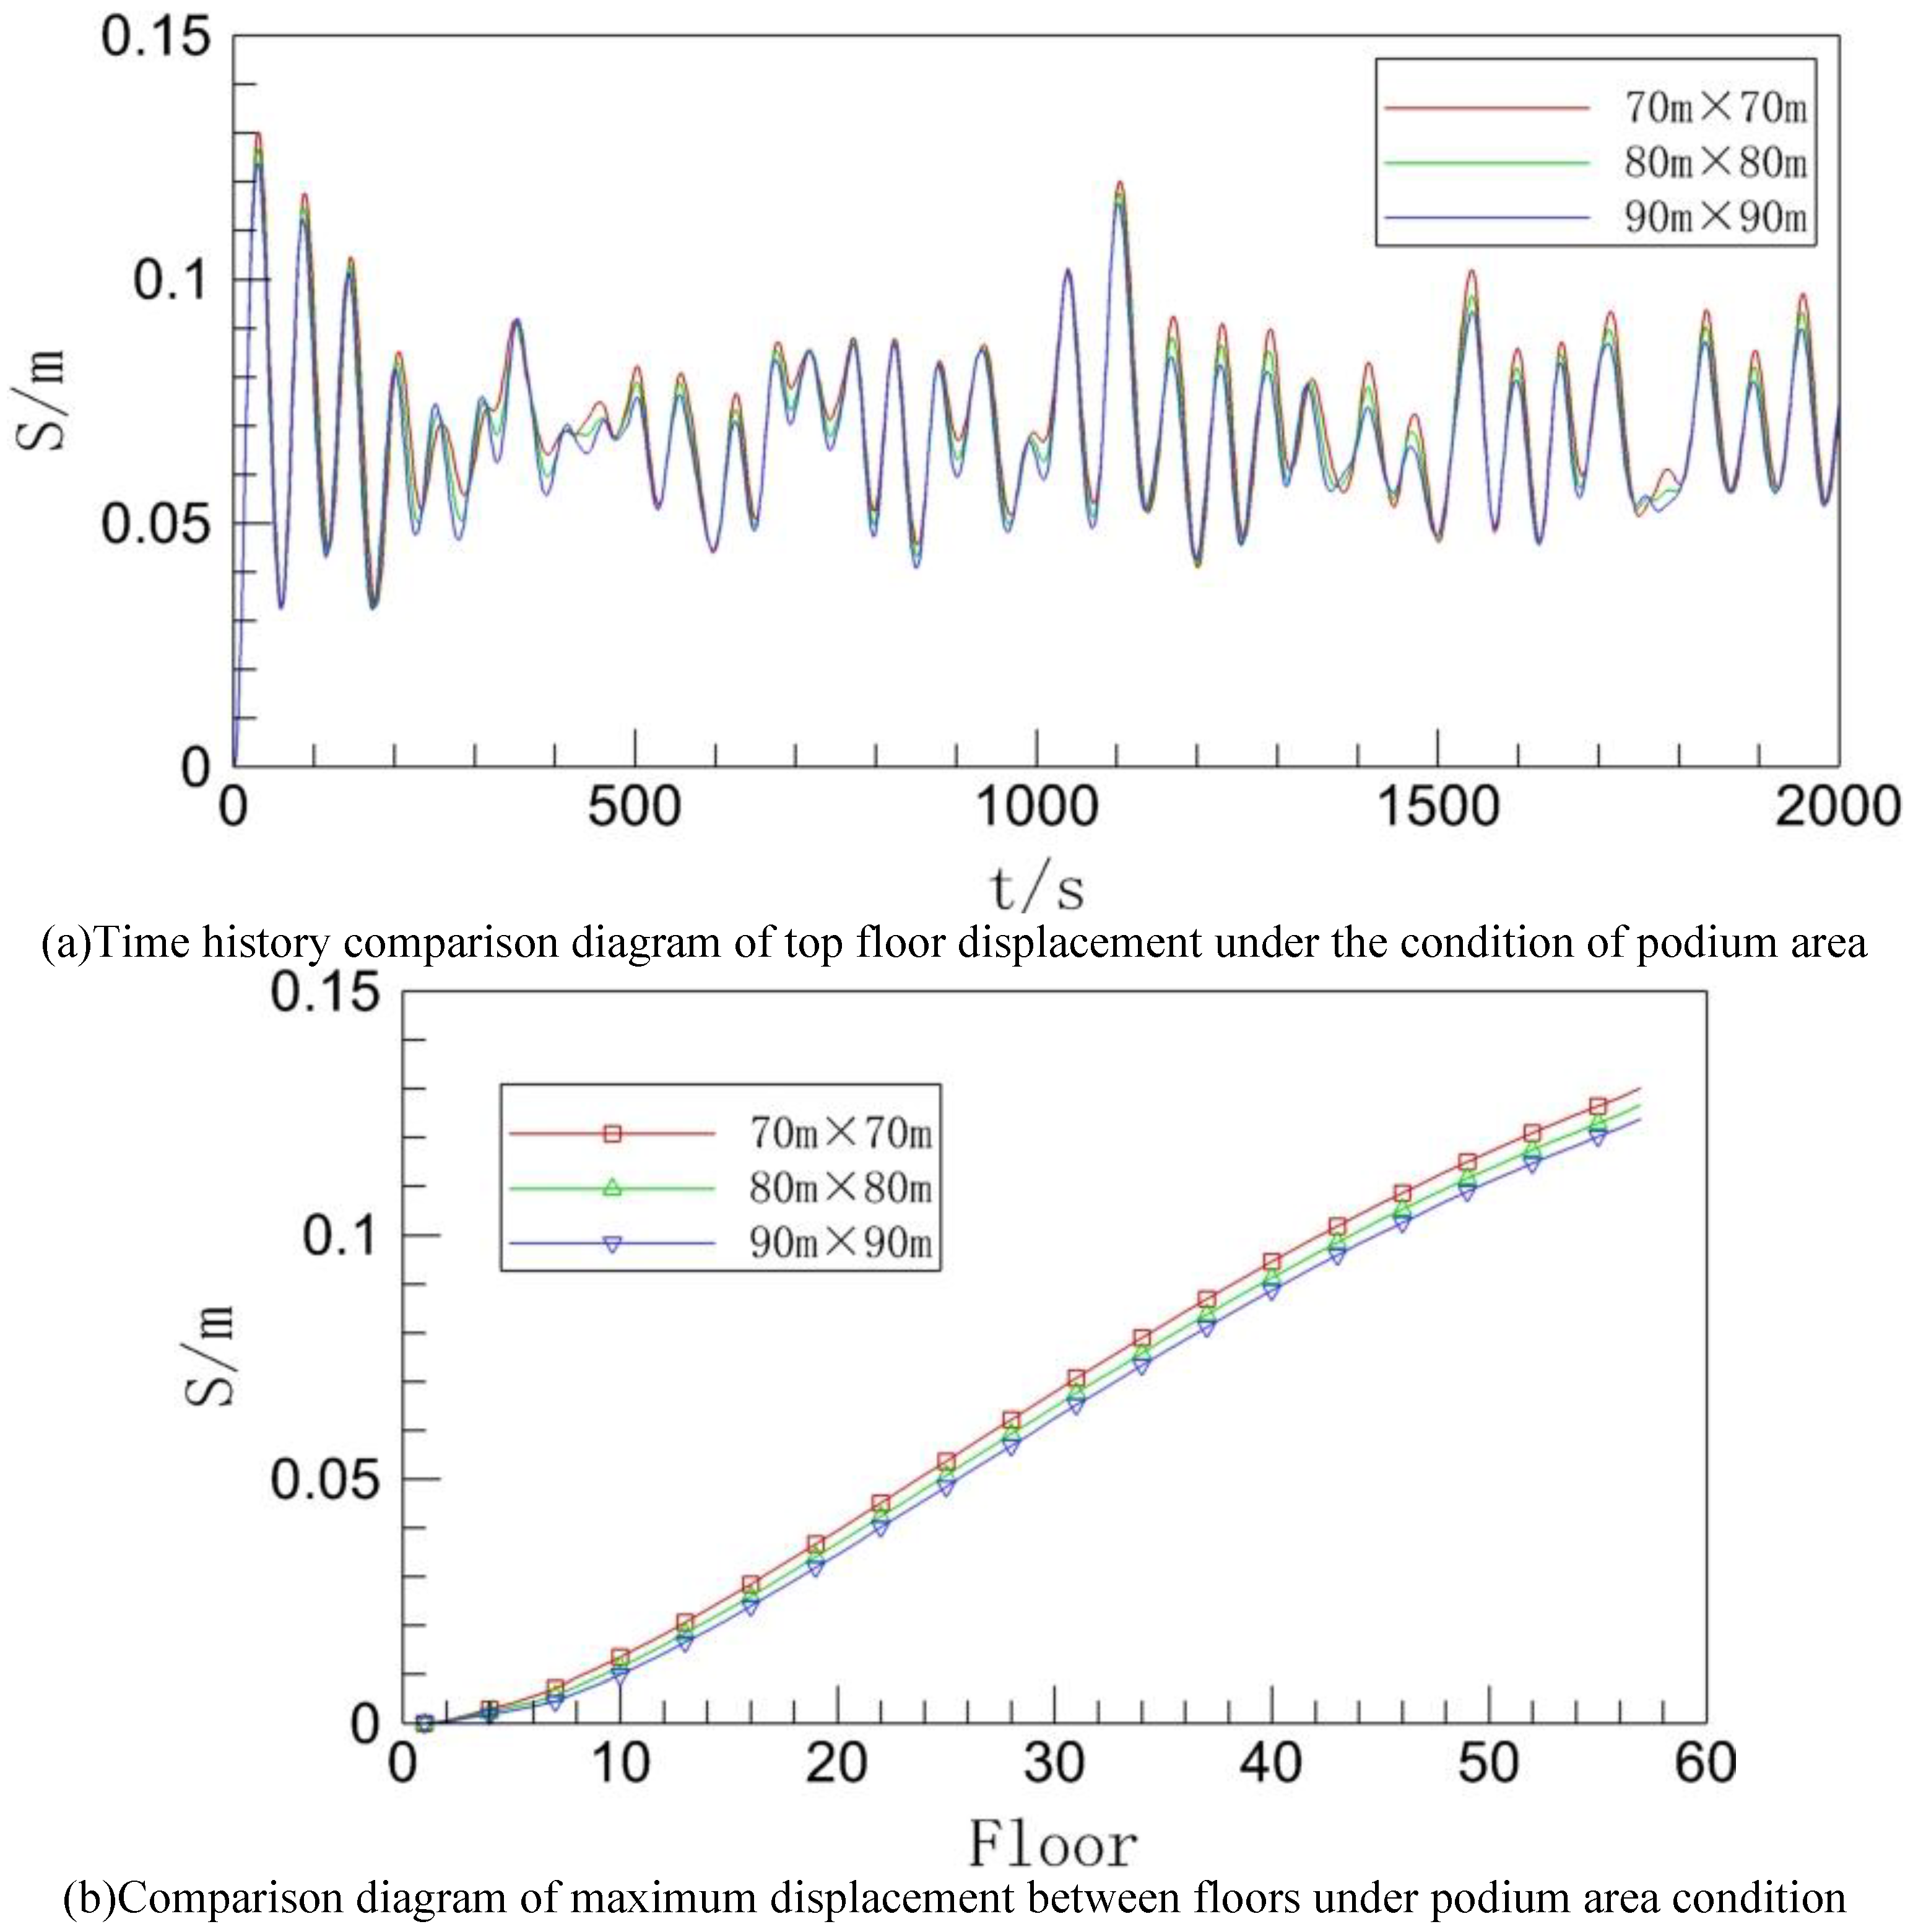
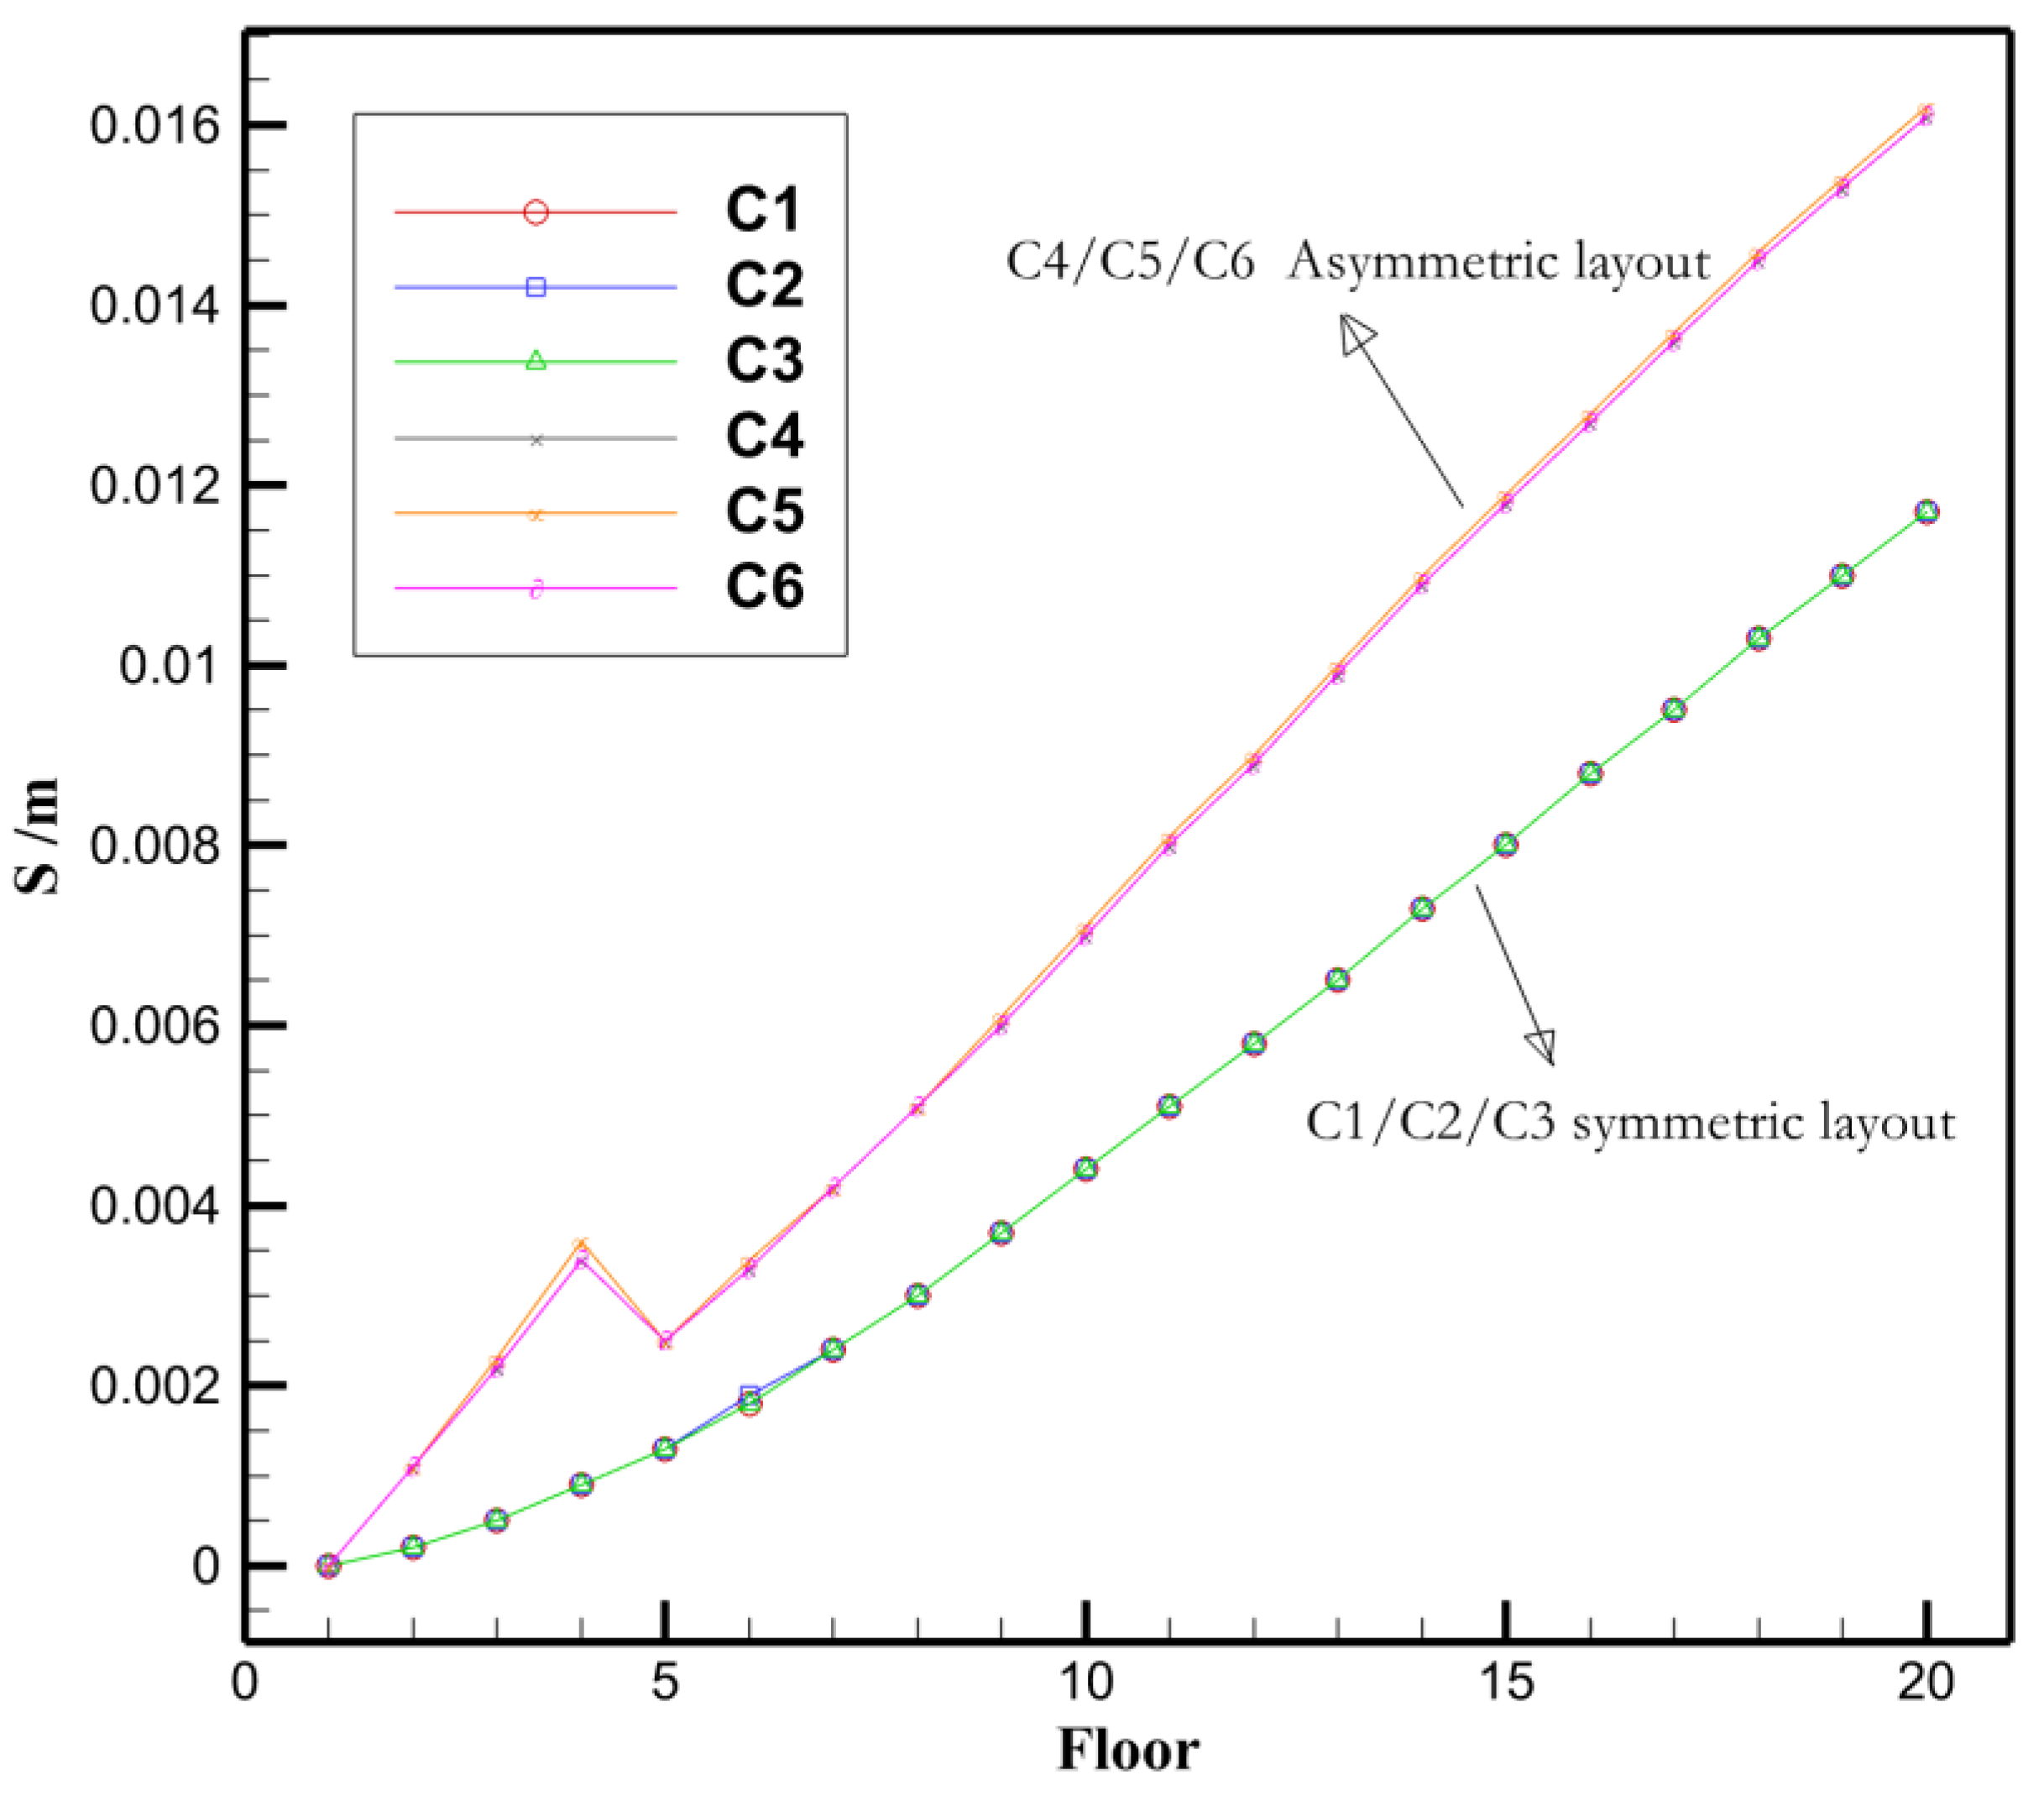
The displacement time history curve for the top floor of the building under the three operating conditions has a very similar trend and period, as can be shown in
Figure 14(a). The overall value of the displacement time history curve of the top level, however, gradually declines as the podium’s surface area grows. Additionally, under the three operating conditions, the overall amplitude of the curve is likewise falling from the apex of the curve. This suggests that the displacement pulsation amplitude of the building’s top floor decreases as the podium’s area increases. The maximum displacement between floors in all three sets of working situations grows dramatically with the addition of building floors, as can be seen by first looking at
Figure 14(b). Second, when comparing the three curves, it is clear that as the height of the podium rises, the maximum displacement between floors of the building progressively reduces, and as floors rise, the disparity in the curves between the three groups of working circumstances gradually grows.
Combining the two sets of displacement diagrams, it is clear that expanding the podium area in the main podium one-story high-rise building is a good way to reduce the building’s overall response to wind-induced vibration displacement. This is because the inter-story displacement of the building will decrease and the displacement pulsation amplitude will weaken as the size of the podium increases, increasing the stiffness of the main body of the building. This situation is comparable to the former working condition, and the outcomes are as anticipated.
Figure 14.
Inter-storey displacement under podium area condition.
Figure 14.
Inter-storey displacement under podium area condition.
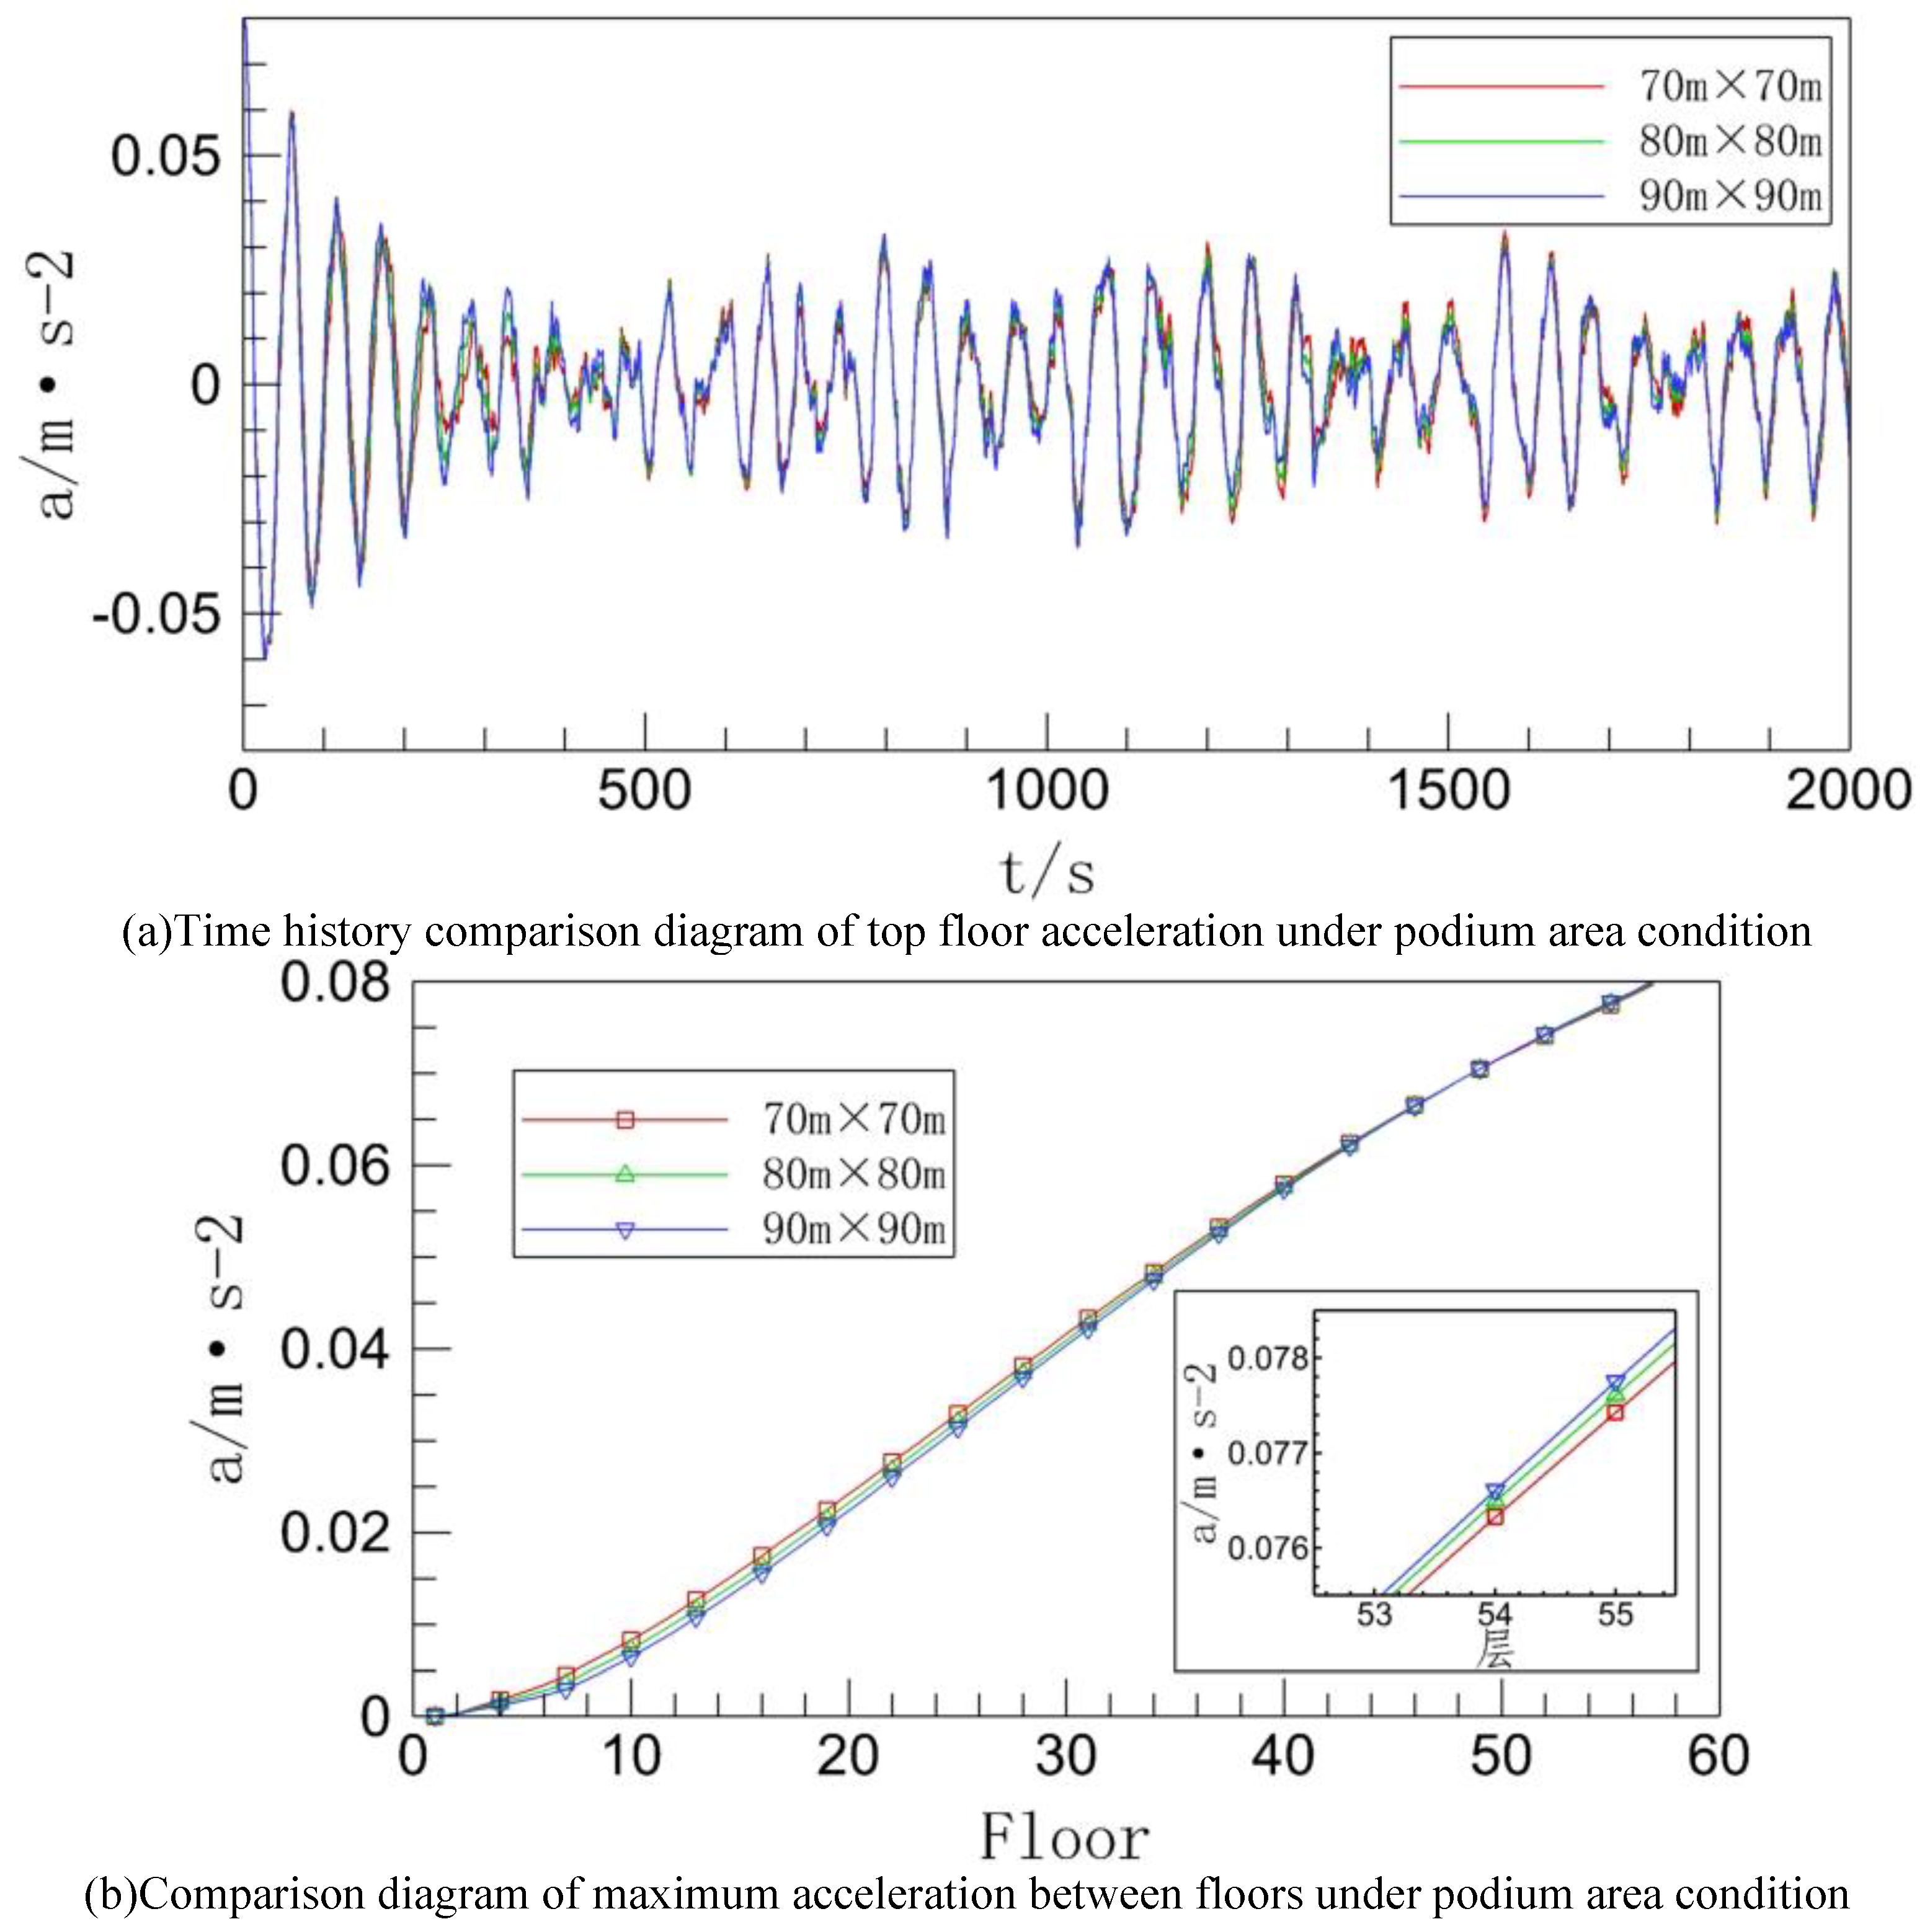
As demonstrated in
Figure 15(a), with an increase in podium floor area, the acceleration time history curves’ pulsation amplitude increases. As can be observed from
Figure 15(b), the maximum acceleration curves between floors grow significantly as the number of floors increases, and these changes essentially fulfill the expected requirements. The acceleration difference between each curve doesn’t increase as the building height rises; instead, it increases from zero until it reaches its maximum value somewhere around the tenth floor, then it starts to decline until the two curves essentially coincide, during which point the acceleration magnitude decreases as the podium area grows. Beginning at the 45
th level, the magnitude sequence of the acceleration values is reversed from what it was, followed by a growing discrepancy in the acceleration values, which lasts all the way to the building’s top floor. The detail graphic shows the magnitude and sequence of the acceleration values close to the top floor.In general, expanding the podium’s area can successfully reduce the building’s middle and lower floors’ inter-story acceleration. Reaching the middle and upper floors, however, this suppression effect will be completely contrary to the prior one, while the difference is still minimal. Similar results to this one have been seen in previous working conditions.
Figure 15.
Inter-storey displacement under podium area condition.
Figure 15.
Inter-storey displacement under podium area condition.
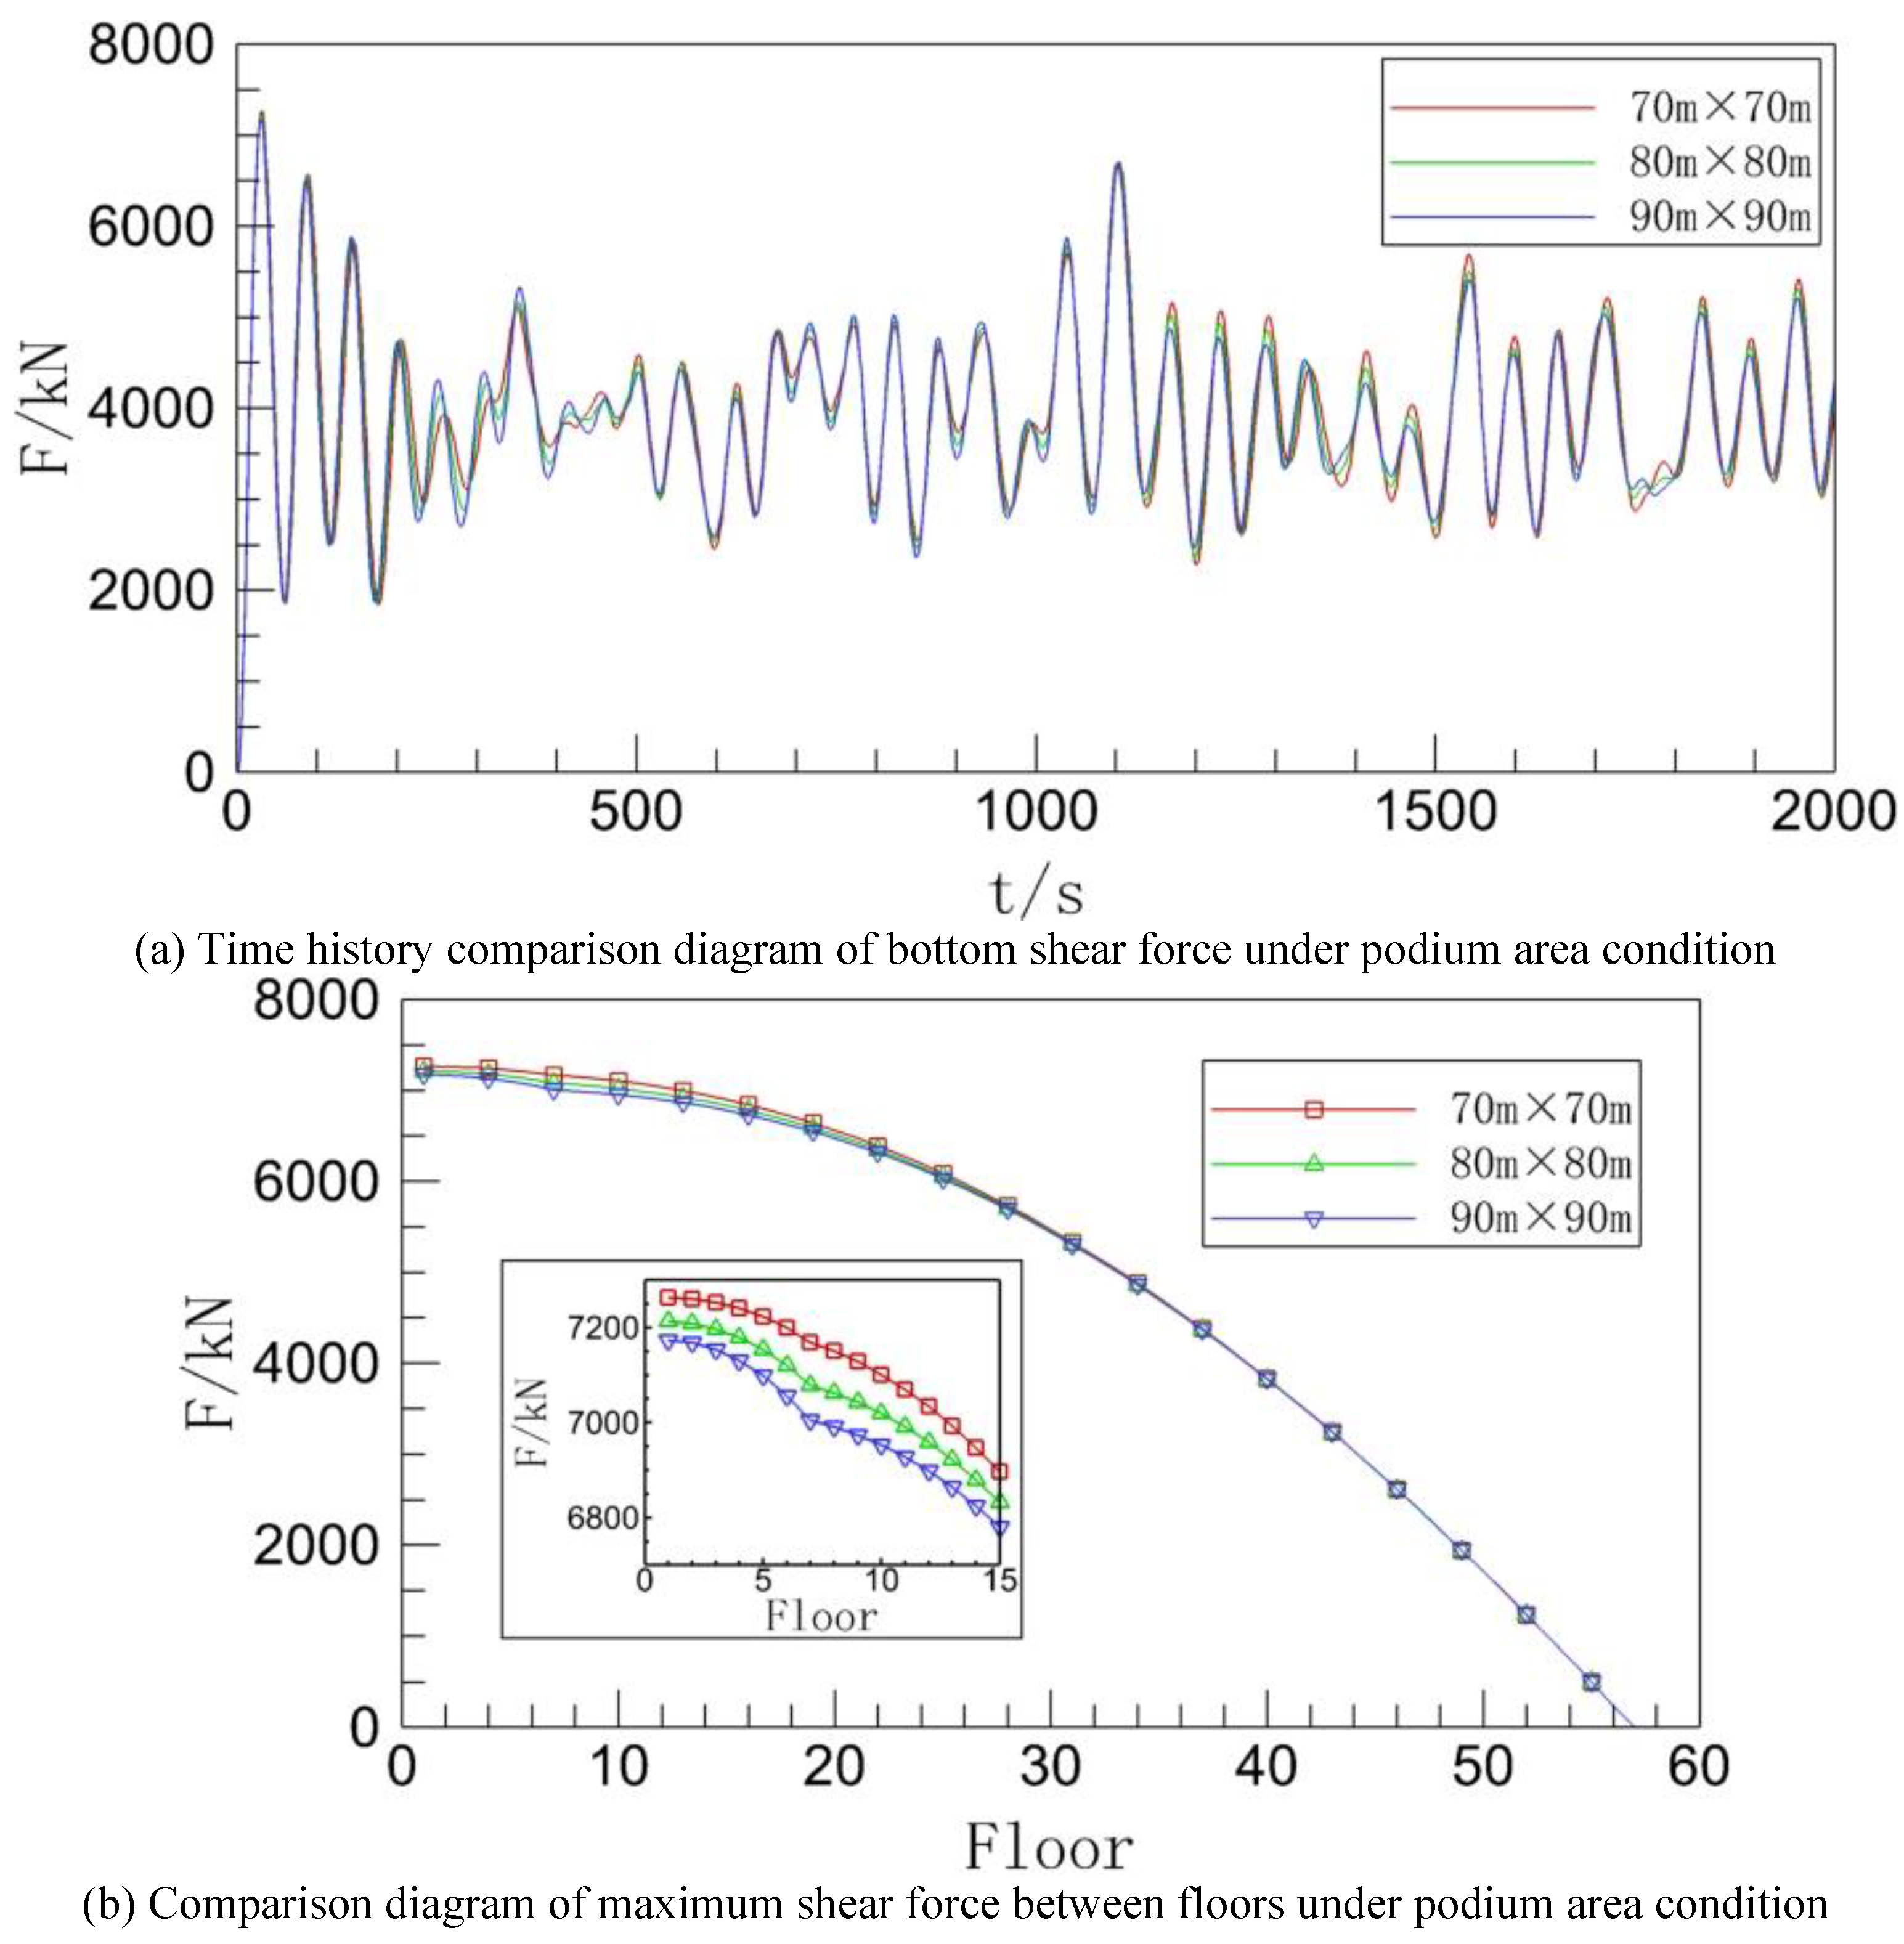
The bottom shear time history curves for the three working conditions are quite similar to one another, as can be seen in
Figure 16(a). It can be seen that the podium height of a slight modification for the building bottom shear does not have a very visible impact since the overall difference in the pulsation amplitude of the three is not very great.
The maximum acceleration between floors under the three operating circumstances only minimally varies at the lower floors, as can be shown in
Figure 16(b), as the floor area increases. Due to the relatively slight change in the area of the podium, the change in the shear force at the base of the building is not obviously evident. However, as can also be seen from the detail diagram in the lower left corner of
Figure 16(b), the value of the largest inter-story shear force in the area around the location where the building’s main structure and the podium meet diminishes as the area of the podium increases.
Figure 16.
Inter-storey shear under podium area condition.
Figure 16.
Inter-storey shear under podium area condition.
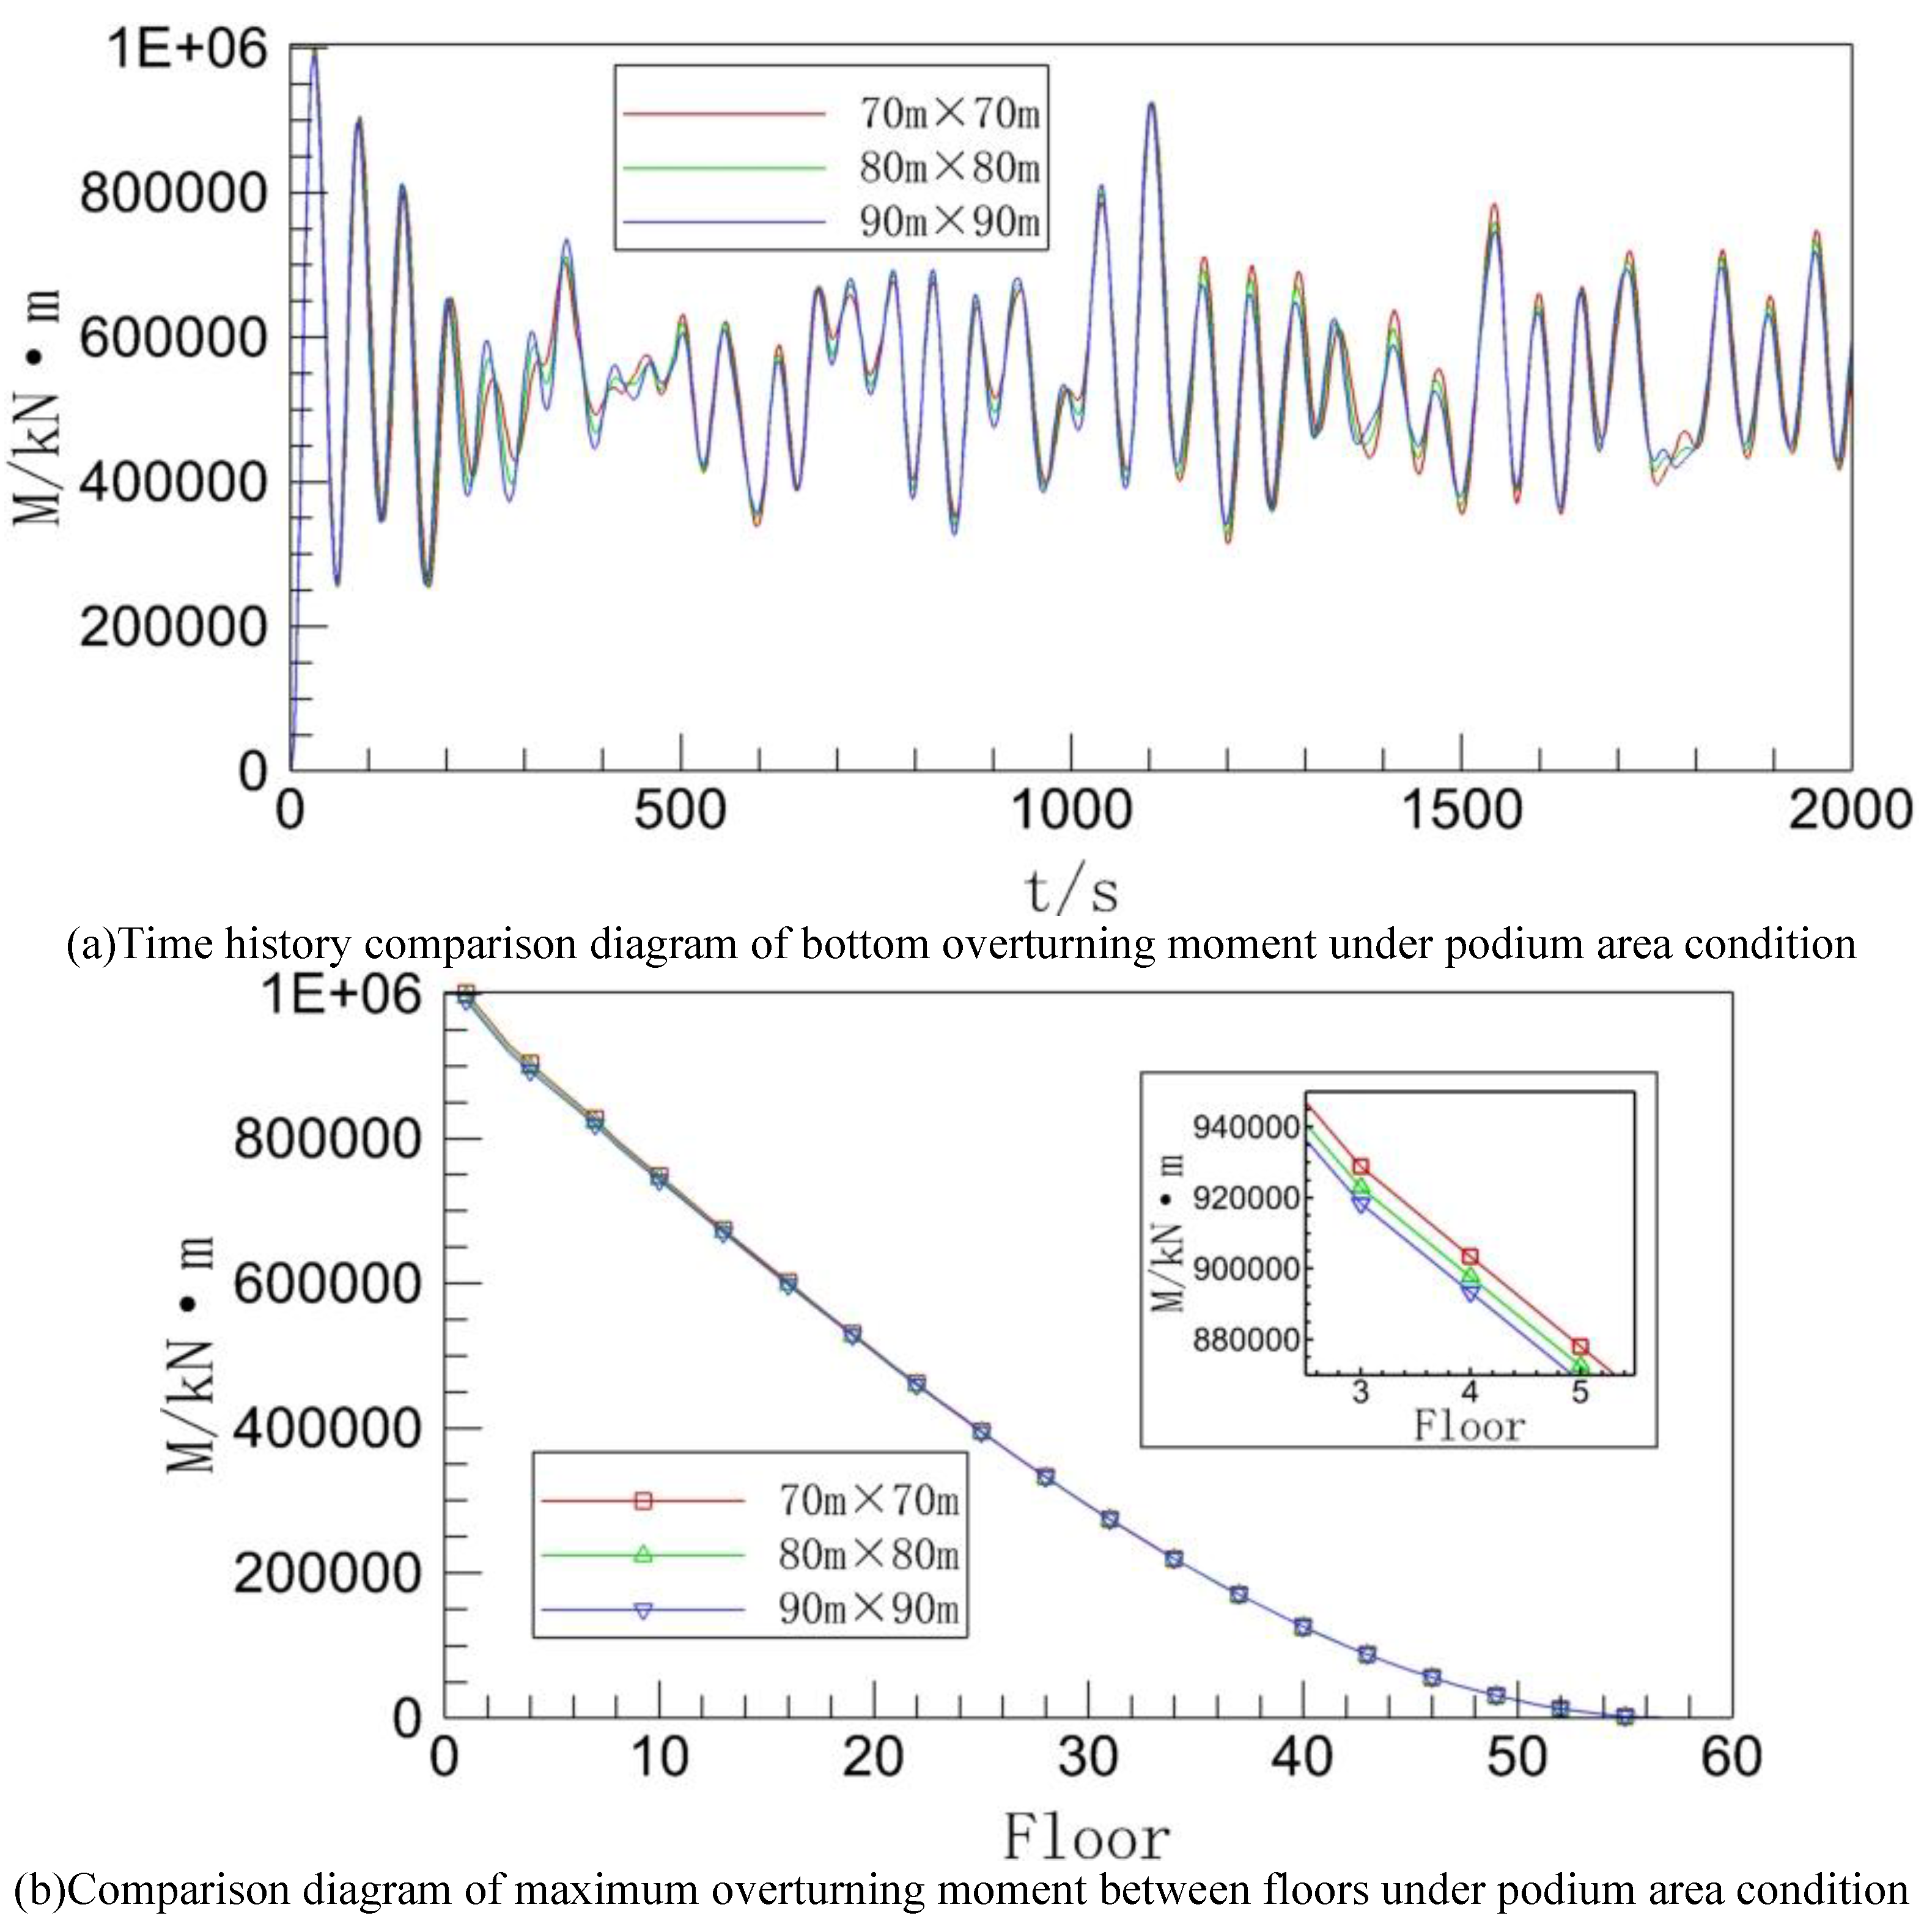
It is evident from
Figure 17(a) that the bottom overturning moment time history curves under the three working conditions have a trend and period that are essentially the same as the bottom shear time history curves in
Figure 16(a) due to a transformation relationship between the shear force and the overturning moment. The value of the overturning moment at the base of the building does not vary obviously because the change in the area of the podium is rather minor.
In
Figure 17 (b), the distinctions between the three curves are not immediately apparent and have even come very close to overlapping since the shear forces between the layers in the three operating conditions have been extremely close and the values of the overturning moments have been quite large. The inter-story overturning moment of the building’s middle and lower floors, however, nevertheless gradually reduces with an increase in podium area, as shown by the detailed
subfigure in right corner of
Figure 17(b), and the law is compatible with this change in the condition of the podium height.
Figure 17.
Overturning bending moment between building floors under podium area condition.
Figure 17.
Overturning bending moment between building floors under podium area condition.
The following is a summary of the research results on different podium area working conditions. Nodes from important parts of each model are selected for quantitative comparison, highlighting the podium effect. The data comparison is shown in
Table 8.
From
Table 8, it can be seen that as the area of the podium increases, the average values of various parameters and the parameters of the middle floor decrease. But at the top level, except for displacement, all other parameters increase with the increase of the podium area, which is similar to the first two working conditions, once again verifying the reliability of the simulation results. And the three parameters of acceleration, shear force, and bending moment decrease with the increase of podium area at the lower level of the building, but increase with the increase of podium area at the middle and upper levels, showing the opposite variation. It can be inferred that one of the reasons for this phenomenon is still the weakening of the stiffness effect of the upper part of the building.