Submitted:
26 February 2025
Posted:
27 February 2025
You are already at the latest version
Abstract
Traditional Internet e-commerce advertising optimization methods mainly rely on rules and experience, and have problems such as insufficient accuracy, inability to adjust in real time, and lack of personalized recommendations. In order to overcome these shortcomings, this paper proposed an advertising optimization method based on machine learning. First, through user behavior data analysis and feature extraction, accurate modeling of personalized recommendations was achieved; then, the model was trained using a reinforcement learning algorithm; finally, real-time bidding optimization was performed by combining the Q-learning algorithm and the epsilon-greedy strategy to achieve the maximum return on investment (ROI) within the budget limit. Through these steps, this paper improved the accuracy, flexibility and personalization of advertising, and optimizes advertising effects and ROI. The experimental results show that it has a good effect on click-through rate (CTR) and conversion rate, and the highest CTR of interstitial ads has reached 8.40%. The conversion rates of various types of ads in the evening are all 6.9% or above.
Keywords:
Ad Placement Optimization
; Machine Learning Algorithm
; CTR Prediction
; Conversion Rate Improvement
; Return on Investment
Introduction
With the rapid development of the Internet e-commerce industry, advertising has become one of the key factors in promoting the commercial success of the platform. E-commerce platforms use advertising to increase product exposure, attract consumer clicks and ultimately promote conversions, which directly affects the sales performance of merchants. Traditional advertising optimization methods mainly rely on manual rules and experience, and lack real-time analysis and personalized optimization of massive data [1,2]. This method is not only inaccurate and unable to make flexible adjustments based on user behavior in real time, but also easily ignores the individual needs of users, resulting in a significant reduction in advertising effectiveness and ROI [3,4]. Therefore, a more accurate and efficient advertising delivery optimization method is urgently needed to deal with these problems.
In order to solve the shortcomings of traditional advertising delivery methods, academia and industry have carried out a lot of research [5,6]. Many studies have proposed machine learning-based advertising optimization methods, using collaborative filtering, deep learning, reinforcement learning and other algorithms to improve the personalization and accuracy of advertising delivery [7,8]. Gharibshah Z et al. [9] proposed an advertising prediction model based on deep learning, which improved the accuracy of advertising CTR prediction by using user historical behavior data. Liao M et al. [10] applied collaborative filtering algorithms to achieve personalized advertising recommendations and improve advertising conversion rates. Most existing studies focus on a single algorithm or model, lacking comprehensive optimization solutions for different advertising scenarios [11,12]. Existing methods still face problems such as complex data processing, difficulty in real-time adjustment, and insufficient personalized recommendations.
In order to overcome the limitations of traditional methods, optimization research combining machine learning with advertising has gradually received widespread attention. Machine learning can analyze large amounts of user data, explore potential user interests and behavior patterns, and provide personalized advertising recommendations [13,14]. Studies have shown that the application of deep learning and reinforcement learning in advertising has achieved relatively significant results [15,16]. These studies have demonstrated the great potential of machine learning in advertising optimization, but there are still problems such as high model complexity, poor real-time performance, and lack of comprehensive optimization solutions [17,18].
Recent advancements in Generative AI (GAI) and computer vision have significantly improved advertising optimization by enabling intelligent content synthesis, multimodal interaction, and real-time audience analysis [19,20,22,23]. Studies have demonstrated that GANs, machine vision-based automatic detection, and reinforcement learning models can enhance ad personalization and engagement in virtual environments and interactive platforms, but challenges such as high computational complexity and real-time efficiency remain, necessitating further innovations in lightweight deep learning architectures and multimodal data fusion [19,20,21,22,23]
The purpose of this study is to use an advertising delivery optimization algorithm based on machine learning to solve the problems of insufficient accuracy, poor real-time performance, and insufficient personalized recommendations in traditional methods. Specifically, this paper uses a variety of machine learning algorithms such as ensemble learning, deep learning, and reinforcement learning to optimize advertising delivery strategies and content display by analyzing user behavior data, advertising display data, and historical feedback data. The research steps include data preprocessing, feature extraction, model training and tuning, real-time optimization and feedback adjustment, etc. Through these methods, this paper not only improves the accuracy of advertising delivery, but also achieves higher personalized recommendation capabilities, and ultimately improves the CTR and conversion rate of advertisements, bringing higher ROI to e-commerce platforms.
1. User Behavior Data Collection and Processing
First, the user behavior data can be obtained through the API interface or crawler technology of the e-commerce platform. Specific data collection includes: user browsing history, click behavior, search history, purchase history, stay time, ad display history, etc. In addition, it is also necessary to collect the characteristic information of the advertisement itself, such as advertisement type, display location, delivery time, etc. In order to ensure the timeliness and integrity of the data, all data are collected in real-time stream processing, encrypted and deduplicated through the data transmission layer to avoid loss or duplication of collected information.
Table 1 shows that by collecting and recording key behavior data of users on e-commerce platforms, it can fully understand users’ interests and shopping habits. Combined with machine learning algorithms, these data can be used to establish personalized advertising strategies, achieve precise delivery and optimization, and improve advertising effectiveness and ROI.
The collected raw data usually contains noise and incomplete information, so it needs to be cleaned and preprocessed. The data cleaning steps include removing duplicate records, processing missing values and outliers. For missing values, the KNN (K-Nearest Neighbors) interpolation method is used to fill the missing parts by calculating the nearest neighbor data of similar users or behaviors to ensure the integrity of the data. For outliers, the interquartile range method is used to detect and remove data that does not conform to normal behavior patterns. Through these preprocessing operations, the quality of the data is ensured, thereby improving the prediction effect of the model.
The horizontal axis of Figure 1 represents the ad type, indicating different ad types. There are four ad types in the figure: Banner, Video, Popup and Interstitial. These ad types are usually used in different ad display strategies, and CTR may be different. CTR refers to the ratio between the number of times users click on an ad and the number of times the ad is displayed, and is often used to measure the effectiveness of an ad. The higher the CTR, the more attractive the ad is and the more frequent the user interaction. It can be observed that video ads generally perform better and have relatively higher CTRs, while interstitial ads perform worse and show more fluctuations and outliers. The performance of banner video ads is between the two, with strong appeal, but also some abnormal behavior.
The characteristics of user behavior data have different scales and distributions, so they need to be standardized and normalized. Z-score standardization is used to process numerical features (such as dwell time, number of clicks, etc.) and convert the data into a standard normal distribution with a mean of 0 and a standard deviation of 1. For features with clear upper and lower limits (such as advertising time, user age, etc.), Min-Max normalization is used to map the data to the range of [0,1]. Through these data preprocessing steps, the influence between different dimensions is eliminated, so that the data can be analyzed and modeled under the same standard.
The effect of advertising is closely related to user behavior, especially in the time dimension, where user behavior patterns change over time. To this end, time series analysis methods are introduced to extract patterns of user behavior over time through technologies such as moving windows and sliding windows. For example, data such as user browsing frequency, CTR, and purchase conversion rate in different time periods can show different characteristics in different time periods. Therefore, for each user’s behavior, the paper sliced it according to the time series, and weighted the behavior data of different periods by the time-weighted average method to ensure that the importance of time features in the data is effectively reflected.
In the actual data collection process, it may encounter abnormal user behavior or data entry errors, which can affect the accuracy of the model. To this end, a density-based anomaly detection algorithm is used to automatically identify outliers in the data and remove these abnormal data. At the same time, for some high-noise data, weighted averaging and data smoothing methods are used to reduce the impact of abnormal data on model training and ensure the rigor and reliability of data processing.
2. Feature Extraction and Modeling
The purpose of feature extraction is to extract effective variables from the original user behavior data in order to provide high-quality input for subsequent modeling. In the feature extraction process, combined with the characteristics of advertising delivery, multi-dimensional user behavior features and advertising-related features are extracted, as follows:
User behavior features include user browsing behavior (such as the category of goods browsed, dwell time, and visit frequency), click behavior (such as the number of ad clicks and ad location clicks), purchase behavior (such as purchase frequency and purchase amount), etc. These behavioral characteristics can reflect the user’s interest preferences and purchasing tendencies. Ad features include the ad display location, display time period, ad type (such as text ads, image ads), etc., reflecting the advertising environment. It also takes into account the match between the ad and the user, such as whether the user has interacted with the advertiser before. Time features consider the relationship between advertising and time, extract the user’s behavior patterns in different time periods (such as the difference between daytime, nighttime, weekends and weekdays), and extract time period features through timestamp conversion.
In order to ensure the effectiveness and simplicity of features, feature selection algorithms such as information gain and chi-square test are used to screen out features that are highly correlated with advertising effects and avoid the impact of redundant information on model training.
For multi-dimensional user behavior data, principal component analysis (PCA) is used to reduce the dimension, reduce the complexity of the data, and retain the most discriminative features. The PCA method compresses high-dimensional user behavior features into a few principal components, effectively improving the training efficiency of the model. The reduced-dimensional features can reduce noise and improve the model’s ability to predict the effect of advertising.
In addition, One-Hot encoding is used to process categorical variables (such as ad type, user gender, etc.) and convert them into numerical data for use in machine learning models.
As shown in Figure 2, the correlation between “Stay Time” and “Click Count” shows a high positive correlation. This means that the longer the user stays on the page, the more clicks may be made, indicating that a longer stay time may be accompanied by more interactive behaviors. “Purchase Amount” and “Match Level”: The correlation between the two is high, which means that the ad matching degree has a significant impact on the user’s purchasing behavior. The higher the matching degree, the higher the purchase amount may be. “Browse Frequency” and “Purchase Amount” mean that the more times a user browses, the higher the possibility or amount of the final purchase may be. In this case, browsing behavior can be seen as a potential indicator of purchasing behavior, especially when the advertisement or product display is appropriate, and increased browsing may lead to more conversions. Some features show negative correlation, such as “Ad Type” and “Browse Frequency”: The negative correlation is obvious, which may indicate that users have become fatigued by repeated exposure to certain ad types, so the number of browsing times has decreased. For example, repeated similar ads (such as pop-up ads) can affect the user’s browsing experience, thereby reducing the frequency of active browsing.
After feature extraction and processing, multiple machine learning models are used for training, and the most suitable algorithm for advertising optimization is selected, with Logistic regression, XGBoost, and deep learning models being used. The Logistic regression model is used to predict the probability of a user clicking on an ad (CTR). The model can make quick estimates through linear relationships and provide good interpretability, which is convenient for interpreting advertising effects. In order to improve the prediction accuracy, the XGBoost model is used. XGBoost has strong performance in processing large-scale data and can effectively capture the complex nonlinear relationship between user behavior and advertising effects. The model improves the accuracy of advertising delivery optimization by integrating multiple decision trees. In the face of complex user behavior data, this paper also uses a deep neural network (DNN). This model can deeply explore the potential patterns in user behavior data through the calculation of multiple layers of neurons. Through multi-level learning of user portraits, advertising content, and interaction history, DNN can automatically capture the complex relationship between users and ads, and further improve the accuracy of CTR prediction.
3. Real-Time Bidding Optimization
First, based on the goal of advertising (such as maximizing conversion rate or CTR), a bidding strategy model is defined. In the advertising bidding process, the bidding amount is not only constrained by the advertiser’s budget limit, but also closely related to the CTR, conversion rate of the advertisement, and the expected behavior of the user. In order to effectively evaluate the value of each ad display, the potential click and conversion probability after the ad display is predicted through a machine learning model, and these factors are integrated into the bidding strategy.
In order to adjust the bidding strategy in real time, this paper introduces the Q-learning algorithm, which is a classic method in reinforcement learning. In ad bidding, the Q value represents the expected benefit of taking a certain action (i.e., the bidding amount) in a certain state. The specific implementation steps are as follows: Each state is composed of multiple factors, including user characteristics (such as age, gender, historical behavior, etc.), ad characteristics (such as ad type, display location), market environment (such as the degree of competition for ad display, time factors), etc. The state space takes into account the changes in these factors, enabling the model to make bidding decisions based on different scenarios. In each state, the model needs to select a bid amount as an action. The choice of bid amount is dynamically generated by the reinforcement learning model and adjusted based on historical ad performance to ensure the maximum ROI under a limited budget. The reward value is calculated based on the actual performance of the ad, mainly based on a combination of CTR and conversion rate. If the ad generates high clicks or high conversions after display, a high reward is given, otherwise a low reward is given. This reward mechanism enables the model to gradually adjust the bidding strategy during the learning process and optimize the advertising effect.
In the actual delivery process, the bidding amount needs to be adjusted according to real-time market changes. For example, competitors’ bidding and real-time user behavior changes may affect the effect of advertising display. To this end, a time-series decision-making method is adopted to update the bidding strategy based on the feedback (clicks and conversions) after each bidding.
Through the exploration-exploitation balance (epsilon-greedy strategy), “exploration” of bidding amounts is carried out under a certain probability to discover new bidding strategies; in other cases, more reliance is placed on the current optimal strategy for “exploitation” to ensure that the choice of bidding amount can both stably obtain efficient ad display and avoid budget waste due to excessive exploration.
In order to avoid over-consumption of budget, budget constraint optimization is introduced, so that the bidding amount depends not only on the actual effect of the advertisement, but also on the advertiser’s budget limit. In each bidding, the system can dynamically adjust the maximum bidding amount according to the remaining budget to ensure the best advertising effect within the budget range. In addition, by monitoring the cost-effectiveness ratio of each advertisement, the bidding strategy is further adjusted to ensure the optimal input-output ratio of each bid.
In the actual environment of e-commerce advertising, the performance of advertisements is often the result of multiple rounds of interaction. The user’s response to the advertisement may change with multiple displays of the advertisement. To this end, a multi-round bidding feedback mechanism was established. By modeling historical advertising data and combining users’ long-term behavior patterns, the changing trend of advertising effects is dynamically predicted. In subsequent advertising displays, the model can adjust the bidding strategy to avoid advertising fatigue caused by too frequent displays and improve the long-term effect of advertising.
4. Evaluation of Advertising Delivery Effects
In the evaluation of advertising delivery effects, the following core indicators are focused on:
CTR refers to the proportion of users clicking after the ad is displayed. CTR is the most direct indicator to measure the attractiveness of an ad. It reflects the degree of attractiveness of the ad and the degree of match between the user’s interests. The higher the CTR, the more attractive the ad is and the more positive the user’s response to the ad.
The conversion rate is the proportion of users who actually complete a purchase or other desired behavior after clicking on the ad. The conversion rate not only measures whether the ad effectively attracts the target user, but also reflects the degree of match between the ad content and the user’s needs.
Table 2 shows that the CTR of banner ads is relatively low, averaging about 4.98%. This suggests that banner ads may be less attractive or that users fail to pay enough attention to them when browsing. Video ads perform better, with an average CTR of 5.71%. Video ads may be more likely to attract users to click through richer content, especially in terms of interactivity and visual performance. Pop-up ads have the lowest CTR, averaging 3.24%. This may be related to the interruptive nature of pop-up ads. Although pop-ups can immediately attract users’ attention, excessive interruption may cause users to feel disgusted and reduce the CTR. Interstitial ads have the highest CTR, reaching 8.40%. This type of ad often appears when content or pages are switched, has a high exposure, and therefore may attract more clicks.
The X-axis of Figure 3 represents different ad types, including Banner, Video, Popup, Interstitial. Each ad type corresponds to a bar, and the height of the bar represents the conversion rate of the ad type in different time periods. The Y-axis represents the percentage of conversion rate. Conversion rate is usually used to measure the effectiveness of advertising, that is, the proportion of successful conversions to target behaviors (such as purchases, clicks, etc.) after the ad is displayed. For example, a conversion rate of 4.5% means that the target behavior is achieved approximately 4.5 times out of 100 ad displays. The bar of each ad type is divided into four parts, corresponding to different time periods: morning, noon, afternoon and evening.
It can be seen that the conversion rate of each ad type varies in different time periods. For example, the conversion rate of Video ads is higher in the midday period (6.8%), while the conversion rate of Popup ads is lower in the afternoon period (3.2%). The conversion rates of each ad type in different time periods also show obvious differences. For example, the conversion rate of Interstitial ads is higher in both midday (6.1%) and evening (7.1%), while the conversion rate of Popup ads is lower. The conversion rate difference in different time periods is also significant. For example, the conversion rate of Video ads in the afternoon (3.6%) is lower than that in other time periods.
5. Conclusions
This paper combines machine learning to optimize advertising delivery. Through user behavior data analysis, feature extraction and modeling, real-time bidding optimization and other technologies, it significantly improves the accuracy and ROI of Internet e-commerce advertising delivery. First, the real-time bidding strategy based on reinforcement learning enables advertising bidding to be dynamically adjusted according to the real-time market environment and user behavior, maximizing advertising effects and reducing costs. Secondly, through comprehensive evaluation indicators, the advertising effect is comprehensively measured to provide advertisers with effective optimization basis.
However, this study also has certain limitations, such as there is still room for improvement in the accuracy of data collection and processing, and the model training process may be limited by the diversity of data samples. Future research can further optimize the robustness and adaptability of the model, explore more combinations of deep learning and big data technologies, and improve the overall performance of the advertising optimization system.
References
- Zhou, L. Product advertising recommendation in e-commerce based on deep learning and distributed expression[J]. Electronic Commerce Research, 2020, 20(2): 321-342. [CrossRef]
- Yan M, Kwok A P K, Chan A H S, et al. An empirical investigation of the impact of influencer live-streaming ads in e-commerce platforms on consumers’ buying impulse[J]. Internet Research, 2023, 33(4): 1633-1663. [CrossRef]
- Geng R, Wang S, Chen X, et al. Content marketing in e-commerce platforms in the internet celebrity economy[J]. Industrial Management & Data Systems, 2020, 120(3): 464-485. [CrossRef]
- Sharma A, Singh B. Measuring impact of e-commerce on small scale business: A systematic review[J]. Journal of Corporate Governance and International Business Law, 2022, 5(1): 34-38. [CrossRef]
- Angeloni S, Rossi C. An analytical model for comparing the profitability of competing online marketing channels: Search engine marketing versus e-commerce marketplace[J]. Journal of Marketing Theory and Practice, 2021, 29(4): 534-549. [CrossRef]
- Billewar S R, Jadhav K, Sriram V P, et al. The rise of 3D E-Commerce: the online shopping gets real with virtual reality and augmented reality during COVID-19[J]. World Journal of Engineering, 2021, 19(2): 244-253. [CrossRef]
- Purnomo Y, J. Digital marketing strategy to increase sales conversion on e-commerce platforms[J]. Journal of Contemporary Administration and Management (ADMAN), 2023, 1(2): 54-62. [CrossRef]
- Qin X, Jiang Z. The impact of AI on the advertising process: The Chinese experience[J]. Journal of Advertising, 2019, 48(4): 338-346. [CrossRef]
- Gharibshah Z, Zhu X, Hainline A, et al. Deep learning for user interest and response prediction in online display advertising[J]. Data Science and Engineering, 2020, 5(1): 12-26. [CrossRef]
- Liao M, Sundar S S. When e-commerce personalization systems show and tell: Investigating the relative persuasive appeal of content-based versus collaborative filtering[J]. Journal of Advertising, 2022, 51(2): 256-267. [CrossRef]
- Valerio C, William L, Noémier Q. The impact of social media on E-Commerce decision making process[J]. International Journal of Technology for Business (IJTB), 2019, 1(1): 1-9. [CrossRef]
- Ferrera C, Kessedjian E. Evolution of E-commerce and Global Marketing[J]. International Journal of Technology for Business (IJTB), 2019, 1(1): 33-38. [CrossRef]
- Thompson F M, Tuzovic S, Braun C. Trustmarks: Strategies for exploiting their full potential in e-commerce[J]. Business Horizons, 2019, 62(2): 237-247. [CrossRef]
- Ge J, Sui Y, Zhou X, et al. Effect of short video ads on sales through social media: the role of advertisement content generators[J]. International Journal of Advertising, 2021, 40(6): 870-896. [CrossRef]
- Han, X. Historicising wanghong economy: Connecting platforms through wanghong and wanghong incubators[J]. Celebrity studies, 2021, 12(2): 317-325. [CrossRef]
- Sun T, Yuan Z, Li C, et al. The value of personal data in internet commerce: A high-stakes field experiment on data regulation policy[J]. Management Science, 2024, 70(4): 2645-2660. [CrossRef]
- Rahman S S, Dekkati S. Revolutionizing Commerce: The Dynamics and Future of E-Commerce Web Applications[J]. Asian Journal of Applied Science and Engineering, 2022, 11(1): 65-73. [CrossRef]
- Simakov, V. History of formation of e-commerce enterprises as subjects of innovative entrepreneurship[J]. Three seas economic journal, 2020, 1(1): 84-90. [CrossRef]
- Lyu, S. The application of generative AI in virtual reality and augmented reality[J]. Journal of Industrial Engineering and Applied Science, 2024, 2(6): 1-9. [CrossRef]
- Lyu, S. The technology of face synthesis and editing based on generative models[J]. Journal of Computer Technology and Applied Mathematics, 2024, 1(4): 21-27. [CrossRef]
- Lyu, S. Machine vision-based automatic detection for electromechanical equipment[J]. Journal of Computer Technology and Applied Mathematics, 2024, 1(4): 12-20. [CrossRef]
- Lin, W. A review of multimodal interaction technologies in virtual meetings[J]. Journal of Computer Technology and Applied Mathematics, 2024, 1(4): 60-68. [CrossRef]
- Lin, W. A systematic review of computer vision-based virtual conference assistants and gesture recognition[J]. Journal of Computer Technology and Applied Mathematics, 2024, 1(4): 28-35. [CrossRef]
Figure 1.
Data Cleaning.
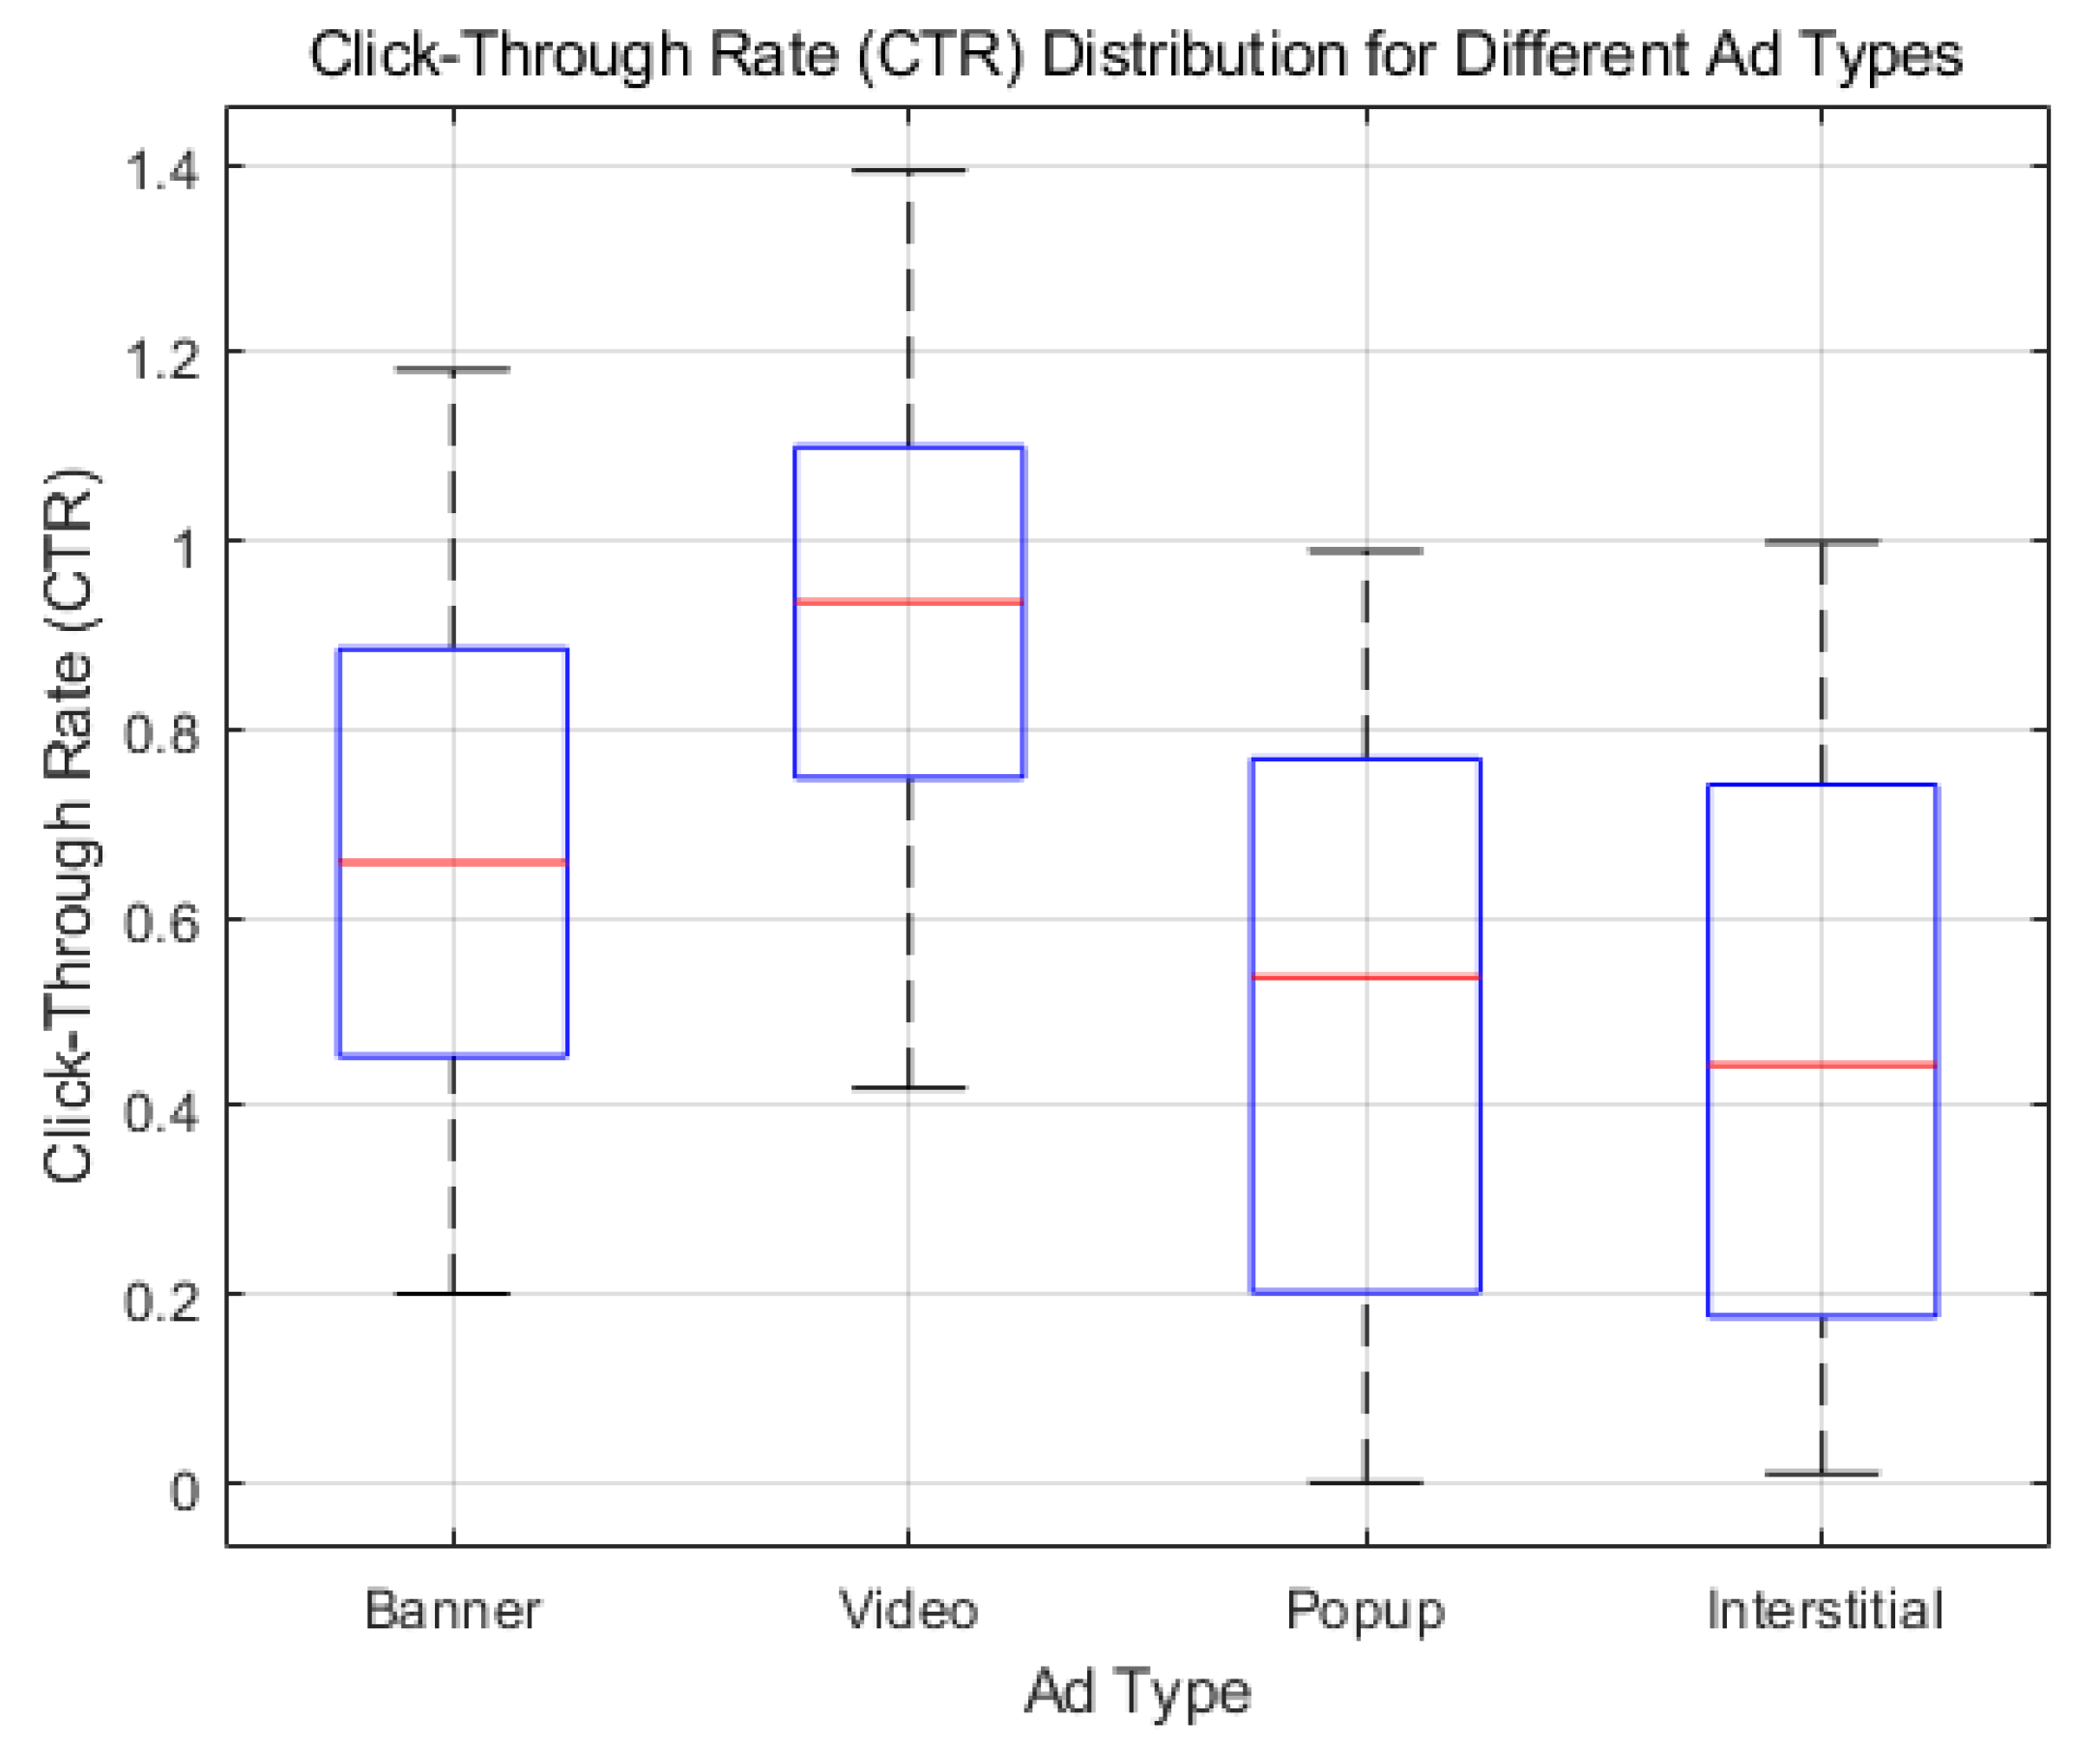
Figure 2.
Feature Correlation.
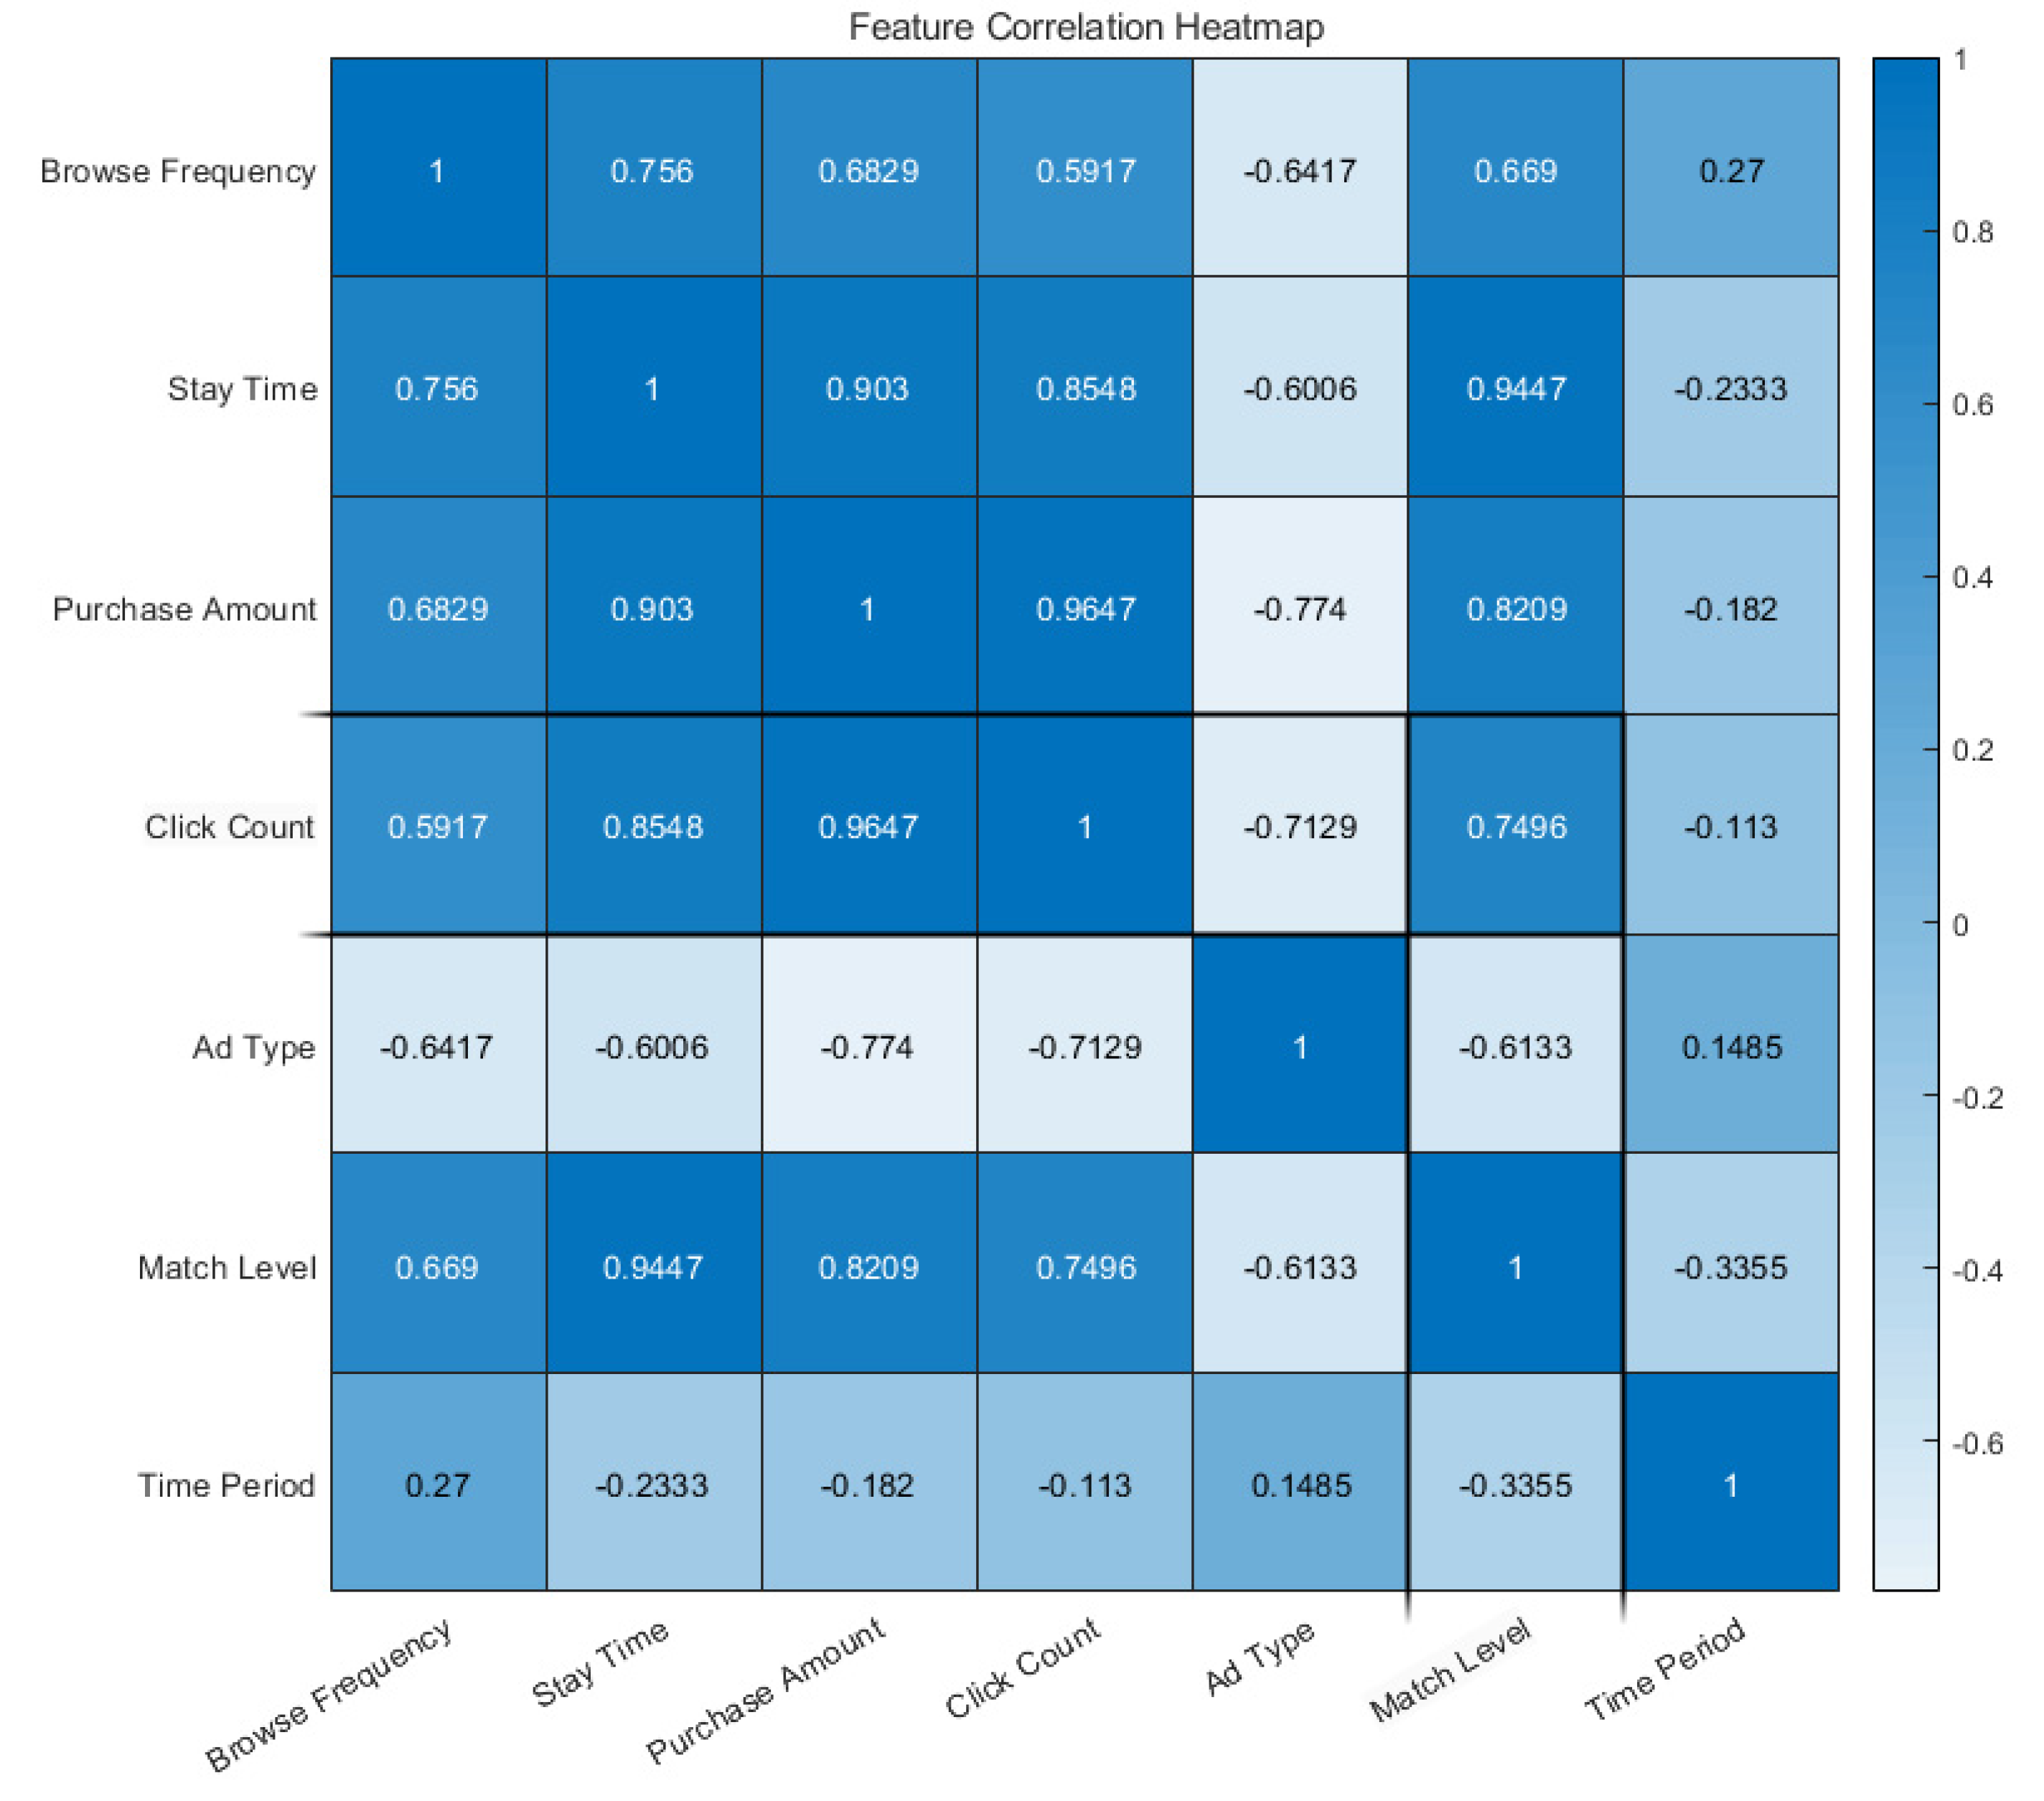
Figure 3.
Conversion rate evaluation.
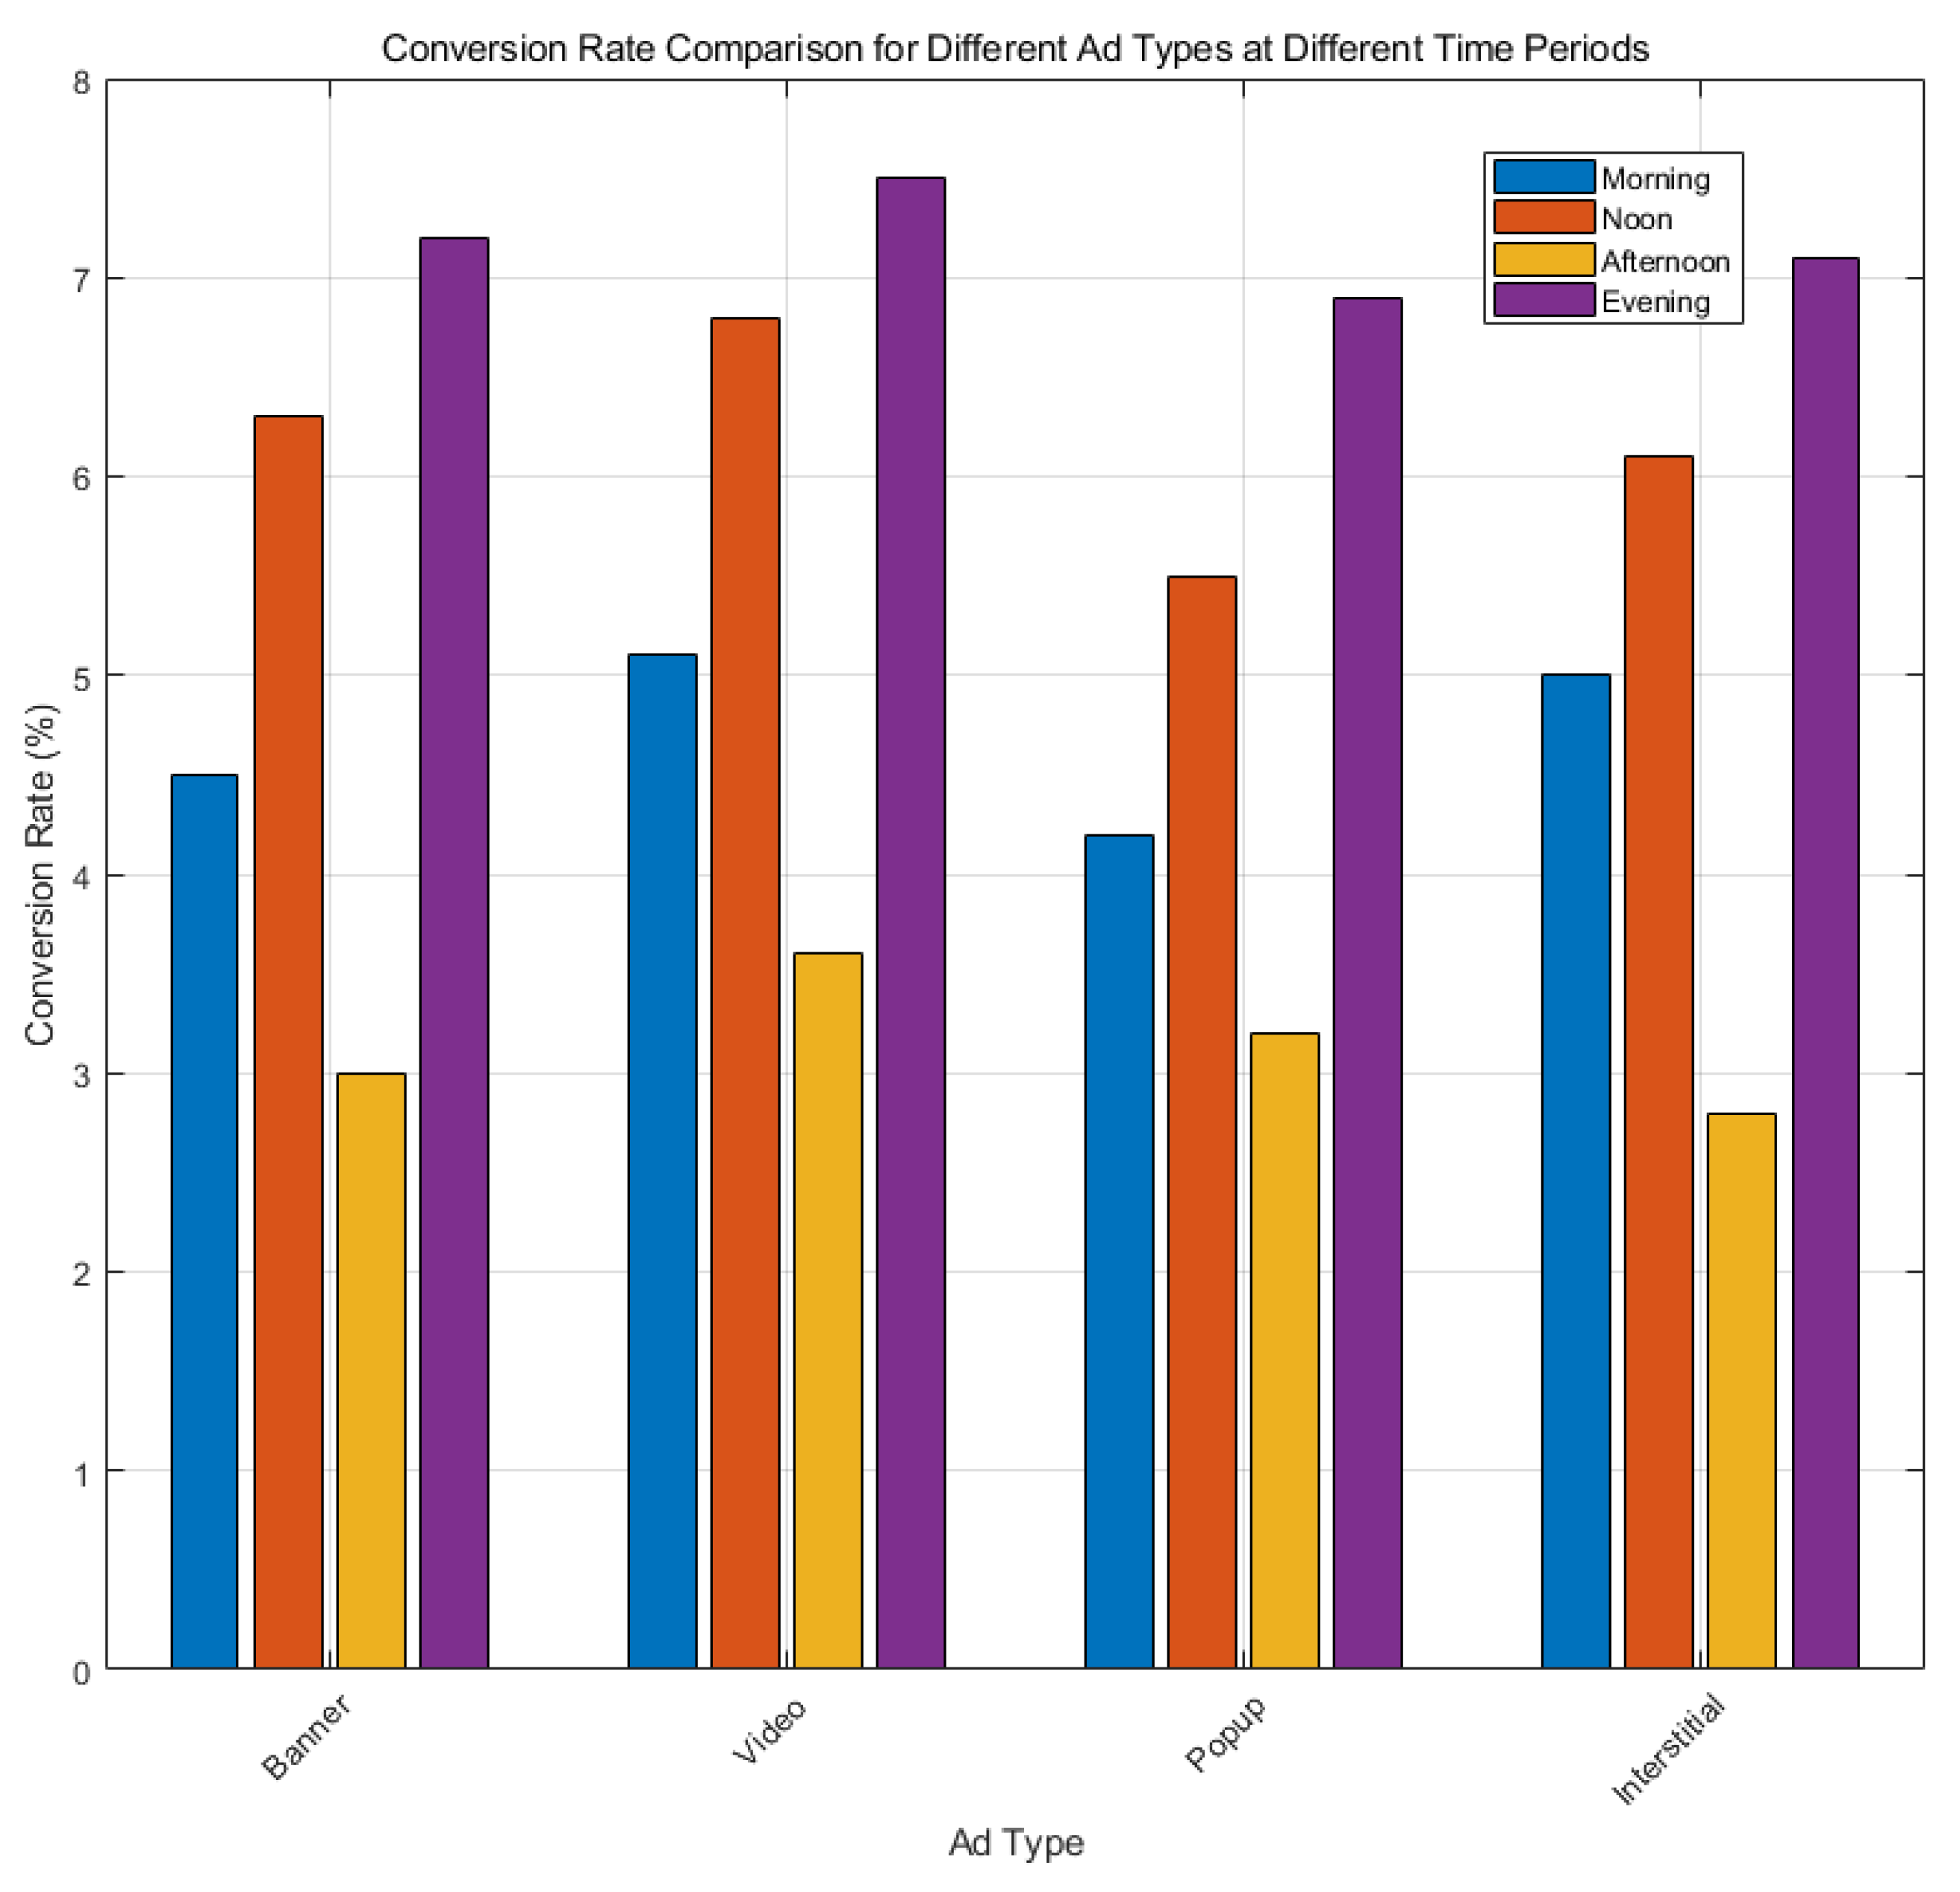

Table 1.
Data collection.
| User ID | Browsing History | Search History | Purchase History | Stay Time (seconds) | Ad Display Record |
| U001 | Electronics > Mobile > Accessories | Mobile, Headphones, Audio | Mobile, Headphones | 180 | Mobile ad (10:00, Homepage) |
| U002 | Apparel > Women’s Wear > Dresses | Dresses, Summer Wear | Dress | 220 | Dress ad (12:30, Category Page) |
| U003 | Furniture > Sofa > Nightstands | Sofa, Nightstand, Living Room Decor | Sofa, Nightstand | 250 | Sofa ad (15:45, Recommendation Page) |
| U004 | Electronics > Laptops | Laptops, Office Equipment | Laptop | 300 | Laptop ad (08:00, Homepage) |
| U005 | Sports > Treadmills > Running Shoes | Treadmills, Sports Shoes | Running Shoes | 150 | Treadmill ad (11:00, Category Page) |
| U006 | Baby > Strollers > Accessories | Stroller, Baby Seat | Stroller | 280 | Stroller ad (16:20, Recommendation Page) |
| U007 | Food > Snacks > Chocolate | Chocolate, Snacks, Candy | Chocolate | 170 | Chocolate ad (13:15, Homepage) |
| U008 | Home > Furniture > Dining Tables | Dining Table, Kitchen Furniture | Dining Table | 210 | Dining Table ad (14:50, Category Page) |
| U009 | Appliances > Air Conditioners > Coolers | Air Conditioners, Coolers | Air Conditioner | 200 | Air Conditioner ad (09:30, Homepage) |
| U010 | Beauty > Lipstick > Skincare | Lipstick, Skincare | Lipstick, Face Masks | 160 | Lipstick ad (17:05, Recommendation Page) |
Table 2.
CTR evaluation.
| Ad Type | Morning Clicks | Morning Impressions | Noon Clicks | Noon Impressions | Afternoon Clicks | Afternoon Impressions | Evening Clicks | Evening Impressions | Average CTR (%) |
| Banner Ad | 120 | 3000 | 180 | 3500 | 160 | 3200 | 190 | 3300 | 4.98 |
| Video Ad | 210 | 3800 | 240 | 4000 | 210 | 3900 | 250 | 4200 | 5.71 |
| Popup Ad | 80 | 2700 | 100 | 3000 | 90 | 2900 | 110 | 3100 | 3.24 |
| Interstitial Ad | 200 | 2700 | 260 | 2900 | 230 | 2800 | 270 | 3000 | 8.4 |
Disclaimer/Publisher’s Note: The statements, opinions and data contained in all publications are solely those of the individual author(s) and contributor(s) and not of MDPI and/or the editor(s). MDPI and/or the editor(s) disclaim responsibility for any injury to people or property resulting from any ideas, methods, instructions or products referred to in the content. |
© 2025 by the authors. Licensee MDPI, Basel, Switzerland. This article is an open access article distributed under the terms and conditions of the Creative Commons Attribution (CC BY) license (http://creativecommons.org/licenses/by/4.0/).
Copyright: This open access article is published under a Creative Commons CC BY 4.0 license, which permit the free download, distribution, and reuse, provided that the author and preprint are cited in any reuse.


