
Submitted:
25 February 2025
Posted:
26 February 2025
You are already at the latest version
Abstract
Açaí (Euterpe oleracea) is one of the most important palms of the genus Euterpe and is found distributed on a large scale in the Amazon. In the process of extracting its pulp, waste is generated, called the pit - which corresponds to the endocarp and kernel of the fruit. The research was conducted with the help of the R-Studio tool and took into account the quantity of waste produced, specifically, in the years 2023 and 2024, in the city of Belém do Pará, during the harvest and off-season. Through the statistical Cluster methodology, the grouping of average data was carried out for final definition in the generation of dendrograms. In this way, the present work aimed to employ statistical methods for the collection of quantitative data on the production of açaí waste generated during the high and low production periods of açaí, in addition to proposing locations for grouping for disposal points of açaí seeds based on the route, logistics, and accessibility of the Urban Solid Waste Collection company in the city of Belém. The results obtained, demonstrate that the Jurunas neighborhood had the highest açaí production and consequently, a higher production of wastes. While the Val-de-Cans neighborhood showed the lower percentage regarding the same theme.
Keywords:
Statistical Analysis
; Açaí Commercialization
; Açaí Seeds
; Quantification of Waste
; City of Belém
1. Introduction
Açaí (Euterpe oleracea) is one of the most important palms of the genus Euterpe. found and distributed mainly in the Amazon. From the fruit of this species, the seed is the largest part, which is typically consumed in the North of Brazil. However, due to the predominantly antioxidant chemical properties, there is a demand for commercialization for the rest of the country and the world (Domingues at al, 2017; Buratto et al., 2021).
In Pará, the açaí fruit is one of the most consumed products in the northern region of the country, the which has as waste the seed or pit, which constitutes an environmental liability environmental, especially in the city of Belém. It is emphasized that the State of Pará, in addition to great consumer of açaí, is also the largest producer of this fruit in Brazil. According to data from the Municipal Agricultural Survey (PAM), from the IBGE (Brazilian Institute of Geography and Statistics Statistics), the State of Pará produced in the year 2022, about 94% of all the açaí in the country, with 1,485,113 tons (SEDEME, 2023).
The açaí seed, which corresponds to the endocarp and kernel of the fruit, is a byproduct from the açaí production chain (Cedrim et al., 2018). It is a rich organic material that has aroused the interest of many scientists and national and international institutions from various fields due to its peculiarities, with an emphasis on its utilization and energy recovery from waste (Erlacher et al., 2016).
It happens that, during the process of extracting the açaí pulp, the remaining residue is generally treated as urban sediment by processing industries and by the authorities public, a factor that hinders the proper collection of such waste (Almeida et al., 2017). Not rarely are açaí pits dumped on public roads near açaí sales points - the blenders, used as landfill material in construction sites or simply discarded in landfills (Padilha et al., 2006; Barbosa Neto et al., 2015; Barreto and Borges, 2018).
The proper disposal of solid waste is a major challenge faced by society. Brazilian society today. In this sense, we can highlight the National Solid Waste Policy (PNRS) as a legal framework. National Solid Waste Policy (PNRS), established by Law No. 12.305/2010, regulated by Decree No. 10,936, in which a set of principles, objectives, guidelines, instruments, goals, and actions for integrated management and environmentally sound management correct management of solid waste (RS).
According to studies by the Rural University of the Amazon (UFRA), during the harvest of fruit, approximately 24 thousand sacks of waste from açaí production are generated and 17 thousand sacks during the off-season. And despite the beaters being responsible for the disposal of this waste, the material is usually collected together with household waste (UFRA, 2022).
Moreover, there is still scientific and academic evidence regarding the quantity of açaí seeds of açaí generated in the city of Belém, especially, based on the economic/social income of each neighborhood. This research contextualized a relatively common issue in the municipalities in Pará, with a focus on the state capital, Belém, which still does not have sufficient tools to regulate the segment of açaí beaters, regarding the enormous generation of useless and abandoned pits, on the many corners of metropolis of the Amazon.
Thus, the general objectives of the research consist of analyze the quantity of waste resulting from açaí processing (seeds) during the harvest and off-season periods, through multivariate analysis, in the municipality of Belém-PA. And the specific objectives are, identify the main points of açaí commercialization in Belém, starting from the period of the harvest and off-season; Analyze through descriptive statistics the data on processing, seed generation, place of acquisition of fresh fruits during the harvest and off-season; Summarize a series of median values of açaí seeds, and generate tabulated and graphs of the variances that occurred and propose clustering locations for acai seed disposal points based on route, logistics, and accessibility of each açaí processing point.
2. Materials and Methods
In this section, the methodology for achieving the proposed objectives in the present research, detailing the study area, the methodological design, the specific data collection procedures, results, and statistical techniques used to achieve the expected objectives.
The research used statistics to carry out the data collection on the quantity of açaí waste resulting from the removal of the pulp, in the neighborhoods of the city of Belém/PA. Study Area Georeferencing of collected points Survey Bibliographic Data Collection Results Statistical Application Ward’s Test Clustering Test. The statistical methodology, called Cluster, uses average data grouping for the final definition of dendrograms. The research conducted, with the help of the RStudio tool, the quantification of waste produced in the years 2023 and 2024, during the harvest and off-season for açaí.
2.1. Field of Study
The study area corresponds to the municipality of Belém, which according to IBGE data (2010), has a population of 1,393,399 inhabitants, with 1,381,475 residing in the urban area urban and 11,924 in the rural area. The municipality occupies a territorial area of 1,059.458 km²,presenting a population density of 1,315.26 inhabitants per km² in 2010.
Within this territory, the quantification of açaí seeds generated was carried out. during the harvest and off-season periods in açaí commercial establishments. The city of Belém is composed of 39 neighborhoods: Águas Lindas, Barreiro, Batista Campos, Bengui, Cabanagem, Campina, Canudos, Castanheira, Cidade Velha, Condor, Coqueiro, Cremação, Curió Utinga, Fátima, Guamá, Jurunas, Mangueirão, Maracangalha, Marambaia, Marco, Montese – Terra Firme, Nazaré, Parque Verde, Pedreira, Pratinha, Reduto, Sacramenta, São Braz, São Clemente, Souza, Tapanã, Telégrafo, Umarizal, Universitário, Val-de-Cans, Una, Guanabara, Aurá, and Miramar, according to Figure 1 below.
Among the 39 neighborhoods of the municipality of Belém, semi-structured interviews were conducted semi-structured interviews with merchants and owners in 37 neighborhoods, which presented mixers, using a questionnaire with open and closed questions (Figure 2). These interviews aimed to explore how much açaí is processed during the harvest and off-season periods and how the açaí waste is disposed of in the city of Belém. The neighborhoods of Aurá and Miramar does not present collection data from the interview, as there was no permission. of the local residents to conduct the survey.
In the data collection process, a total of 1,783 questionnaires were administered in 37 neighborhoods of the city, namely: Águas Lindas, Barreiro, Batista Campos, Bengui, Cabanagem, Campina, Canudos, Castanheira, Cidade Velha, Condor, Coqueiro, Cremação, Curió Utinga, Fátima, Guamá, Jurunas, Mangueirão, Maracangalha, Marambaia, Marco, Montese – Terra Firme, Nazaré, Parque Verde, Pedreira, Pratinha, Reduto, Sacramenta, São Braz, São Clemente, Souza, Tapanã, Telégrafo, Umarizal, Universitário, Val-de-Cans, Una, Guanabara.
One (1) questionnaire was employed per açaí blender location, totaling the number of 1,783 points, in 37 neighborhoods of the city of Belém. The door-to-door survey began in February 2023 by the establishments located near the Federal University of Pará – UFPA, such as the neighborhoods of Guamá, Condor, Jurunas, Montese – Terra Firme and Universitário; followed by the other sectors located in center of Belém, namely, Umarizal, São Braz, Marco, Reduto, Nazaré, Campina, Cidade Velha and Batista Campos; until reaching the farthest neighborhoods from UFPA, such as Coqueiro, Tapanã and Cabanagem. The field research was completed in June 2024.
The açaí pulp processing points that were studied show an accumulation of waste in front of their establishments or on the streets of the city of Belém, being the main issue due to the impact that this activity can generate on the environment.
2.2. Database Description
With the application of the questionnaire in the field, some variables were imposed, among them the date, identification of the points, quantity of cans sold (classified into harvest and off-season), purchase locations that are subdivided into: açaí fair (Campina neighborhood), açaí port (Jurunas neighborhood), Icoaraci (district of Belém), and others (insular region of the city of Belém); according to the panorama raised, the options for urban collection (carried out by the municipal government), cart drivers, cooperatives, and others (private company) for the collection and final disposal of açaí waste.
The geographic coordinates (latitude and longitude) were also recorded. The variables of harvest and off-season, points of sale, and sub-variables of purchase and disposal locations are categorized as numerical and discrete.
To obtain the collection of primary data, the questionnaire technique was used, conducted “door-to-door” for each owner of the açaí points, located in the 37 neighborhoods.
Next, the quantification of the mass of waste produced was carried out, through the number of cans used during the processing of fresh açaí at the collection points in each neighborhood. Table 1 shows the collection date and quantity by points in the target area of the research during the harvest and off-season.
3. Results
3.1. Data Collection
The field data were grouped and presented in Table 03, which shows the 37 (thirty-seven) neighborhoods with açaí sales points, the amount of production during the harvest and off-season periods, between the cycle of February 2023 to June 2024, as well as the arithmetic mean; it also shows the percentage calculation subdivided between urban collection, cooperative, closed points (places that were not operational at the time of the field interview), and others (private companies that collect waste), which are locations for collecting and storing açaí seeds. After analyzing the data in the table, a distinction was observed among the neighborhoods studied regarding points of sale, productivity, and the amount of waste generated by each açaí production point in these neighborhoods. Among the neighborhoods studied in Belém, Jurunas is the one with the highest quantity of açaí sales, with 238 units; while the neighborhoods of Val-de-Cans and Guanabara have 2 sales units of the same production. Table 2 also shows the quantity processed during the harvest period, the off-season, and the average between these two terms. It also presents the percentage division between the disposal and collection of the waste that is produced.
3.2. Analysis by Descriptive Statistics of Açaí Residues
Through univariate descriptive statistics, a statistical survey was conducted on the 1,783 açaí sales points located in the 37 neighborhoods of the metropolitan region of Belém, as shown in Table 3 and Table 4 below. It presents elements such as the mean, median (Med), variance (Var), standard deviation (SD), minimum (Min), maximum (max), interquartile range (IQR), coefficient of variation (CV), skewness, and kurtosis on the data collected during the harvest and off-season periods.
Conducting the descriptive statistical survey of açaí production in the neighborhoods, the target area of the study, it is noted that the values of mean, median, variance, standard deviation, and minimum value are higher during the harvest period (Table 3) than the same terms during the off-season (Table 4). This occurs due to the high production of açaí pulp and the mass resulting from the quantity of cans (mass) generated in each harvest season.
Regarding the terms of IQR, maximum value, skewness, and kurtosis, these were greater in quantity during the off-season compared to the harvest season, due to the variation of the mean and median presenting a skewed distribution, varying according to the amount produced in the off-season months.
Thus, the histogram of the continuous variables harvests and off-season showed a high dispersion, with the most frequent values shifted to the left, indicating that these variables do not follow a normal distribution, as shown in Figure 3.
Based on the spatial distribution of the data, Figure 3 illustrates the quantity of cans of açaí sold in the neighborhoods of Belém during the harvest and off-season periods. It is observed that the southern region of the municipality, including the neighborhoods of Jurunas, Guamá, Terra Firme, and Condor, along with the neighborhood of Tapanã to the north, accounts for 44% of the total açaí sold in Belém-PA during the harvest period and 44.5% during the off- season. The number of açaí sales points identified and organized by neighborhoods is presented in Figure 4.
The analysis of the model’s residuals and the qqplot graph show that their distribution does not follow a normal distribution (p < 0.05), due to extreme values originating from the neighborhoods of Condor, Jurunas, and Tapanã. Among the açaí sales points, the açaí market (Ver-o-Peso) and Porto do Açaí were identified as the main suppliers for the neighborhoods of Belém, accounting for 92.8% of all açaí sold in the region, Figure 5.
The research found that 253 points of sale (14.2%) were closed or did not provide information. Regarding the disposal of açaí seeds, the study revealed that 76.6% of the waste is collected through selective collection, followed by collection carried out by cooperatives (companies). Only 5.2% of açaí sales points dispose of their waste improperly, according to Figure 6.
3.3. Multivariate Analysis
The cluster analysis using the Ward method and Euclidean distance identified four distinct groups as shown in Figure 7. One group includes the neighborhoods Barreiro, Condor, Marambaia, and Tapanã (orange color). The neighborhood Coqueiro was isolated (green), while Terra Firme, Guamá, and Jurunas formed another group (blue). The remaining neighborhoods formed the larger group (red).
For a better understanding of group formation, the PCA analysis emphasizes the variables responsible for the formation of these groups. From the groups formed by HCA, the neighborhood clusters were labeled as clusters to corroborate the information between the multivariate analysis techniques.
The results presented in Table 5 demonstrate that the variables harvest, off-season, point, Ver-o-Peso, and selective collection are more adequately represented by the first principal component (PC1), while Porto do açaí, Porto Icoarací, Other points, and cooperatives exhibit more expressive correlations in the second principal component (PC2).
Thus, based on the table above, the variables cart driver and other waste are better represented by PC3. The first principal component, PC1, represents 60.3% of the total variance. The first three principal components explain 84% of the variation in the data.
4. Conclusions
During the analysis of the topic, especially since it deals with a current problematic situation in the municipality of Belém, the study was able to rely on statistical data on açaí waste production in 37 neighborhoods of the city of Belém, generated during the harvest and off-season periods of the product.
According to the results, it is understood from the statistical survey which neighborhood produces the most and which one has the lowest waste generation rate. The neighborhood of Jurunas was the one that showed the highest production of açaí, both during the harvest and off-season periods, and consequently, the highest production of waste. On the other hand, the neighborhoods of Val-de-Cans and Guanabara show the lowest percentage regarding the same theme. This is due to the number of açaí production points in each neighborhood, as well as the population size that consumes the product.
It was also observed that the highest rate of disposal of this waste is collected and discarded through the urban collection of the Municipality of Belém and sent to the regional landfill. Some areas of the municipality of Belém do not have daily urban collection, and the research identified other disposal methodologies for this waste, with it being collected by private companies and applied in research projects or other purposes. The açaí pits are also being implemented for other purposes, such as bioasphalt and the production of sustainable shoes, which are made from açaí waste along with rubber waste.
In this way, the research was able to prove that the percentage of waste generated occurs due to the amount of pulp produced annually in the region, and that the disposal of this input is still a socio-environmental issue; however, the statistics indicated that the largest percentage of this waste is directed to proper final disposal, which consists of the local landfill, and that the other collection and disposal methodologies carried out by private companies and cooperatives already present studies and other forms of reuse and implementation of these pits, introducing sustainable methods and reducing irregular disposal.
References
- ALMEIDA, A. V. C.; MELO, I. M.; PINHEIRO, I. S.; FREITA S, J. F.; MELO, A. C. S.; revalorização do caroço de açaí em uma beneficiadora de polpas do município de Ananindeua/PA: proposta de estruturação de um canal reverso orientado pela PNrS e logística reversa. GEPROS. Gestão da Produção, Operações e Sistemas, Bauru, Ano 12, nº 3, jul-set/2017, p. 59-83. [CrossRef]
- BARBOSA NETO, A.; LIMA, J.; MARQUES, L.; PRADO, M. Secagem Infravermelho de caroços de Açaí para a obtenção de biomassa. Blucher Chemical Engineering Proceedings, v.1, n. 2, p. 5451-5458, 2015. [CrossRef]
- BARRETO, D. A. A.; BORGES, F. G. P. The presence of the middlemen in the açaí productive chain in the State of Amapá: traditional capitalist carriers or logistic operators? A perspective from Fleury’s point of view. Brazilian Journal of Development, v. 4, n. 6, p. 2923-2938, 2018.
- BURATTO, R. T.; COCERO, M. J.; MARTÍN, A. Characterization of industrial açaí pulp residues and valorization by microwave-assisted extraction. Chemical Engineering and Processin-Process Intensifica-tion, 2021. Disponível em: <https://www.sciencedi-rect.com/science/article/pii/S0255270120307315?via%3Dihub >. Acesso em: 16 out. 2024. [CrossRef]
- CEDRIM, P. C. A. S.; BARROS, E. M. A.; NASCIMENTO, T. G. D. Antioxidant properties of açaí (Euterpe oleracea) in the metabolic syndrome. Brazilian Journal of Food Technology, n. 2, 2018. [CrossRef]
- DOMINGUES, A. F. N.; MATTIETTO, R. A.; OLIVEIRA, M. S. P. Teor de lipídeos em caroços de Euterpe oleracea Mart. Embrapa Amazônia Oriental. Boletim de Pesquisa e Desenvolvimento, 2017. Disponível em: <https://www.infoteca.cnptia.embrapa.br/infoteca/bitstream/doc/1062268/1/BOLETIMPD115Ainfo.pdf > Acesso em: 14 ago. 2024.
- ERLACHER, W. A.; OLIVEIRA, F. L. de; SILVA, D. M. N. da; QUARESMA, M. A. L; CHRIS TO, B. F. Formas de utilização do caroço de Juçara como substrato orgânico na produção de mudas de hortaliças. Revista Brasileira de Agroecologia, v. 1, n. 4, p. 328-335, 2016.
- INSTITUTO BRASILEIRO DE GEOGRAFIA E ESTATÍSTICA – IBGE, Censo 2010, Sinope. Dispo-nível em: https://cidades.ibge.gov.br/brasil/pa/belem/pesquisa/23/221078. Acesso em 15 jun. 2024.
- PADILHA, J. L.; CANTO, S. A. E.; RENDEIRO, G. Avaliação do Potencial dos Caroços de Açaí para Geração de Energia. Biomassa & Energia, v. 2, p. 231-239, 2006.
- SECRETARIA DE ESTADO DE DESENVOLVIMENTO ECONÔMICO, MINERAÇÃO E ENERGIA – SEDEME (2023). Disponível em: https://sedeme.pa.gov.br/noticias/com-incentivo-do-governo-do-par%C3%A1-produto-%C3%A0-base-de-a%C3%A7a%C3%AD-vence-competi%C3%A7%C3%A3o-internacional. Acesso em 22 out. 2024.
- UNIVERSIDADE FEDERAL RURAL DA AMAZONIA – UFRA; Caroço do açaí: pesquisa tem o ob-jetivo de transformar resíduo em biomateriais e bioenergia, 2022. Disponível em: https://novo.ufra.edu.br/index.php?option=com_content&view=article&id=3219:caroco-de-acai-pes-quisa-tem-o-objetivo-de-transformar-residuos-do-acai-em-biomateriais-e-bioenergia&catid=17&Ite-mid=121. Acesso em 24 out. 2024.
Figure 1.
Location of neighborhoods in Belém/PA.
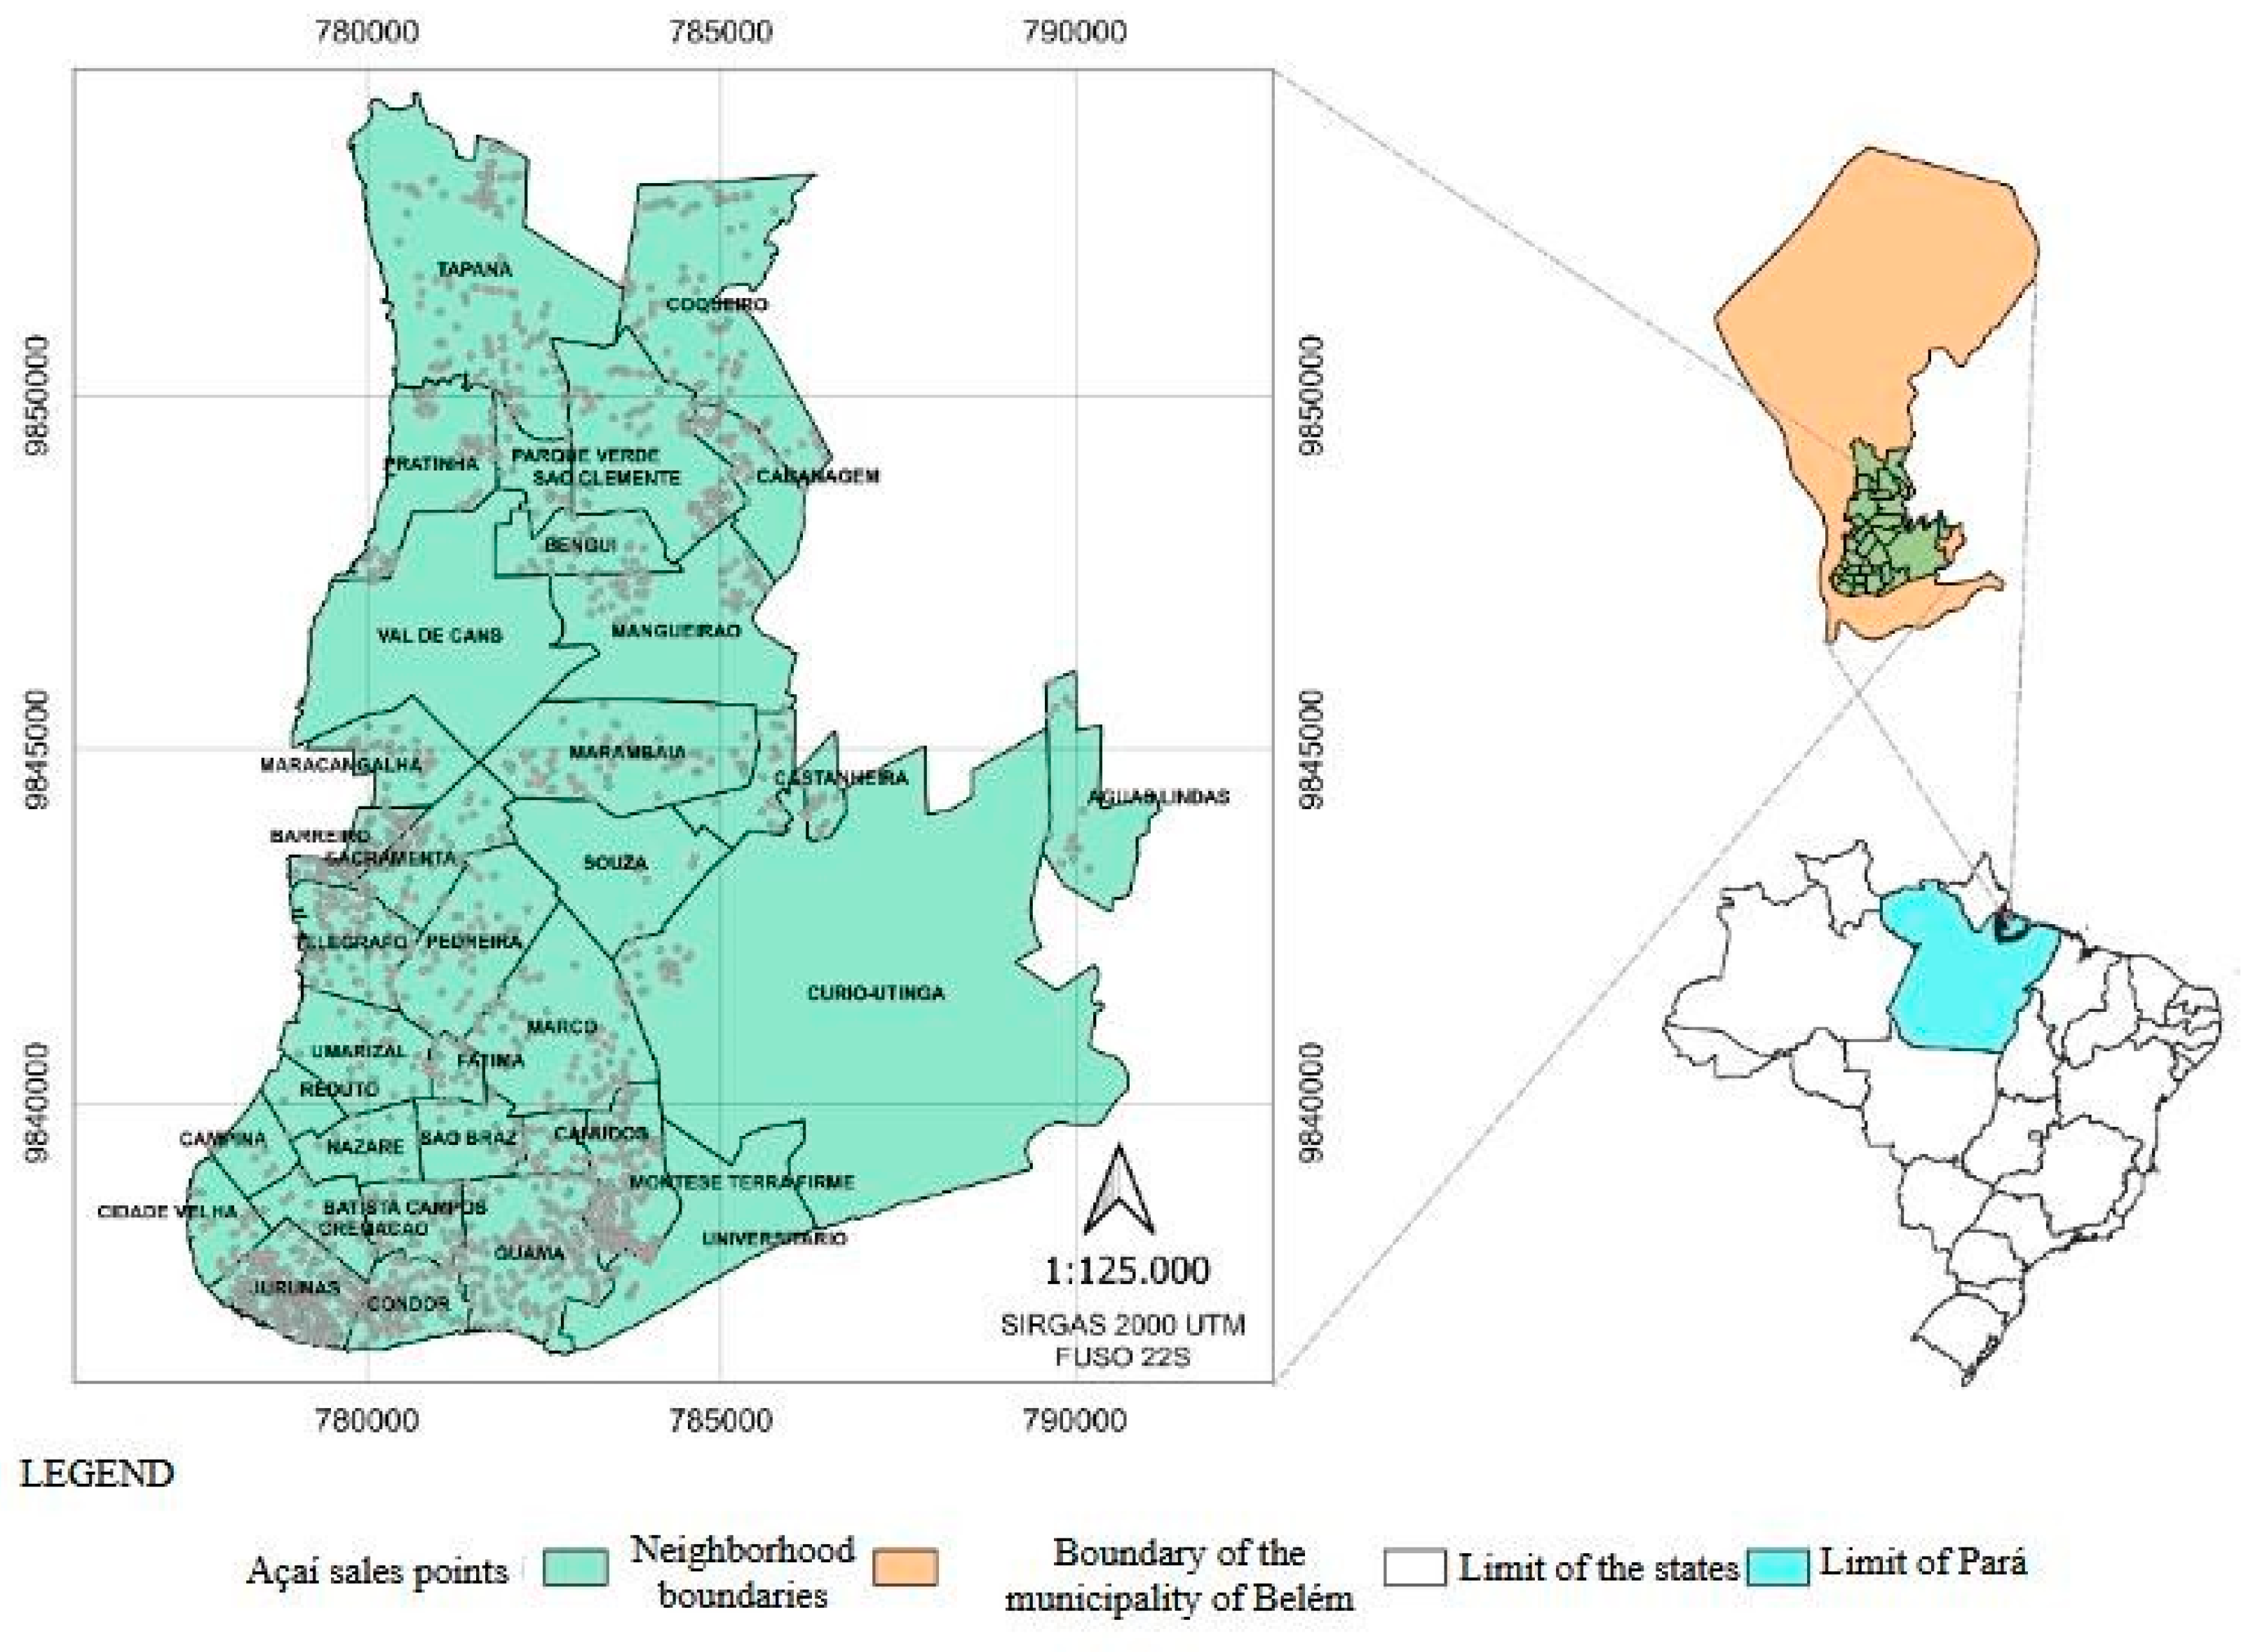
Figure 2.
Field-applied questionnaire model.
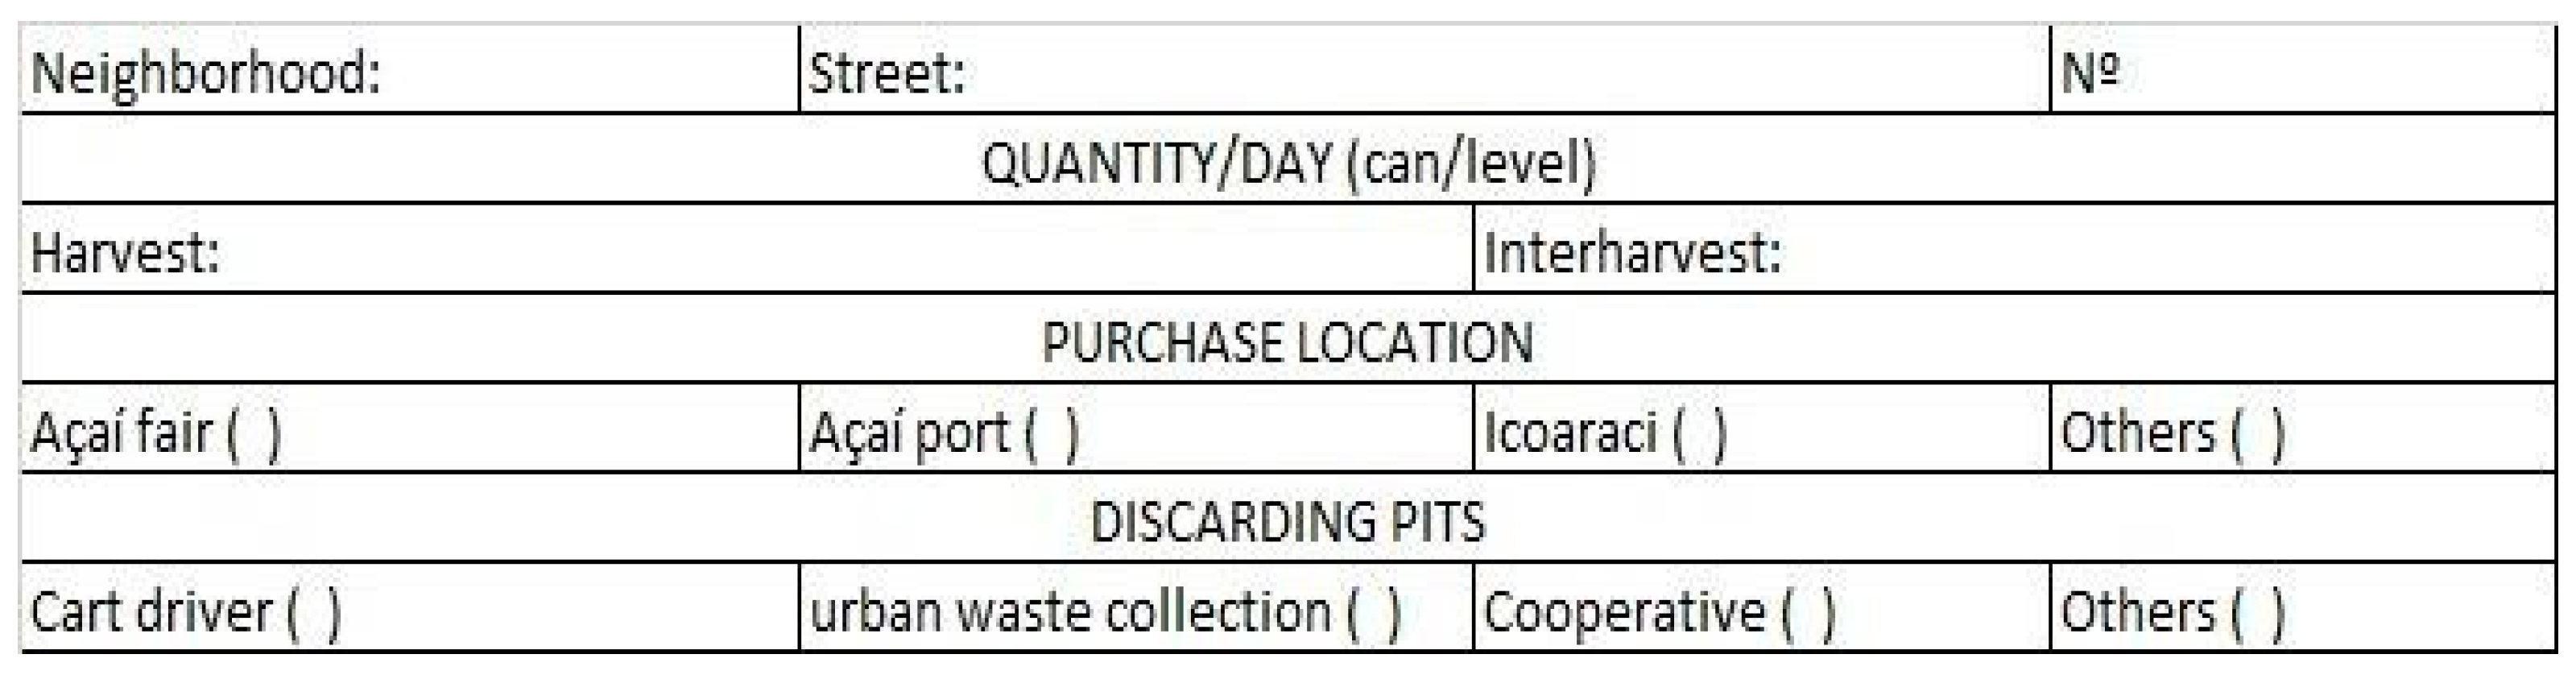
Figure 3.
Distribution of the number of açaí cans in relation to the harvest period (a) and off-season (b).
Figure 3.
Distribution of the number of açaí cans in relation to the harvest period (a) and off-season (b).
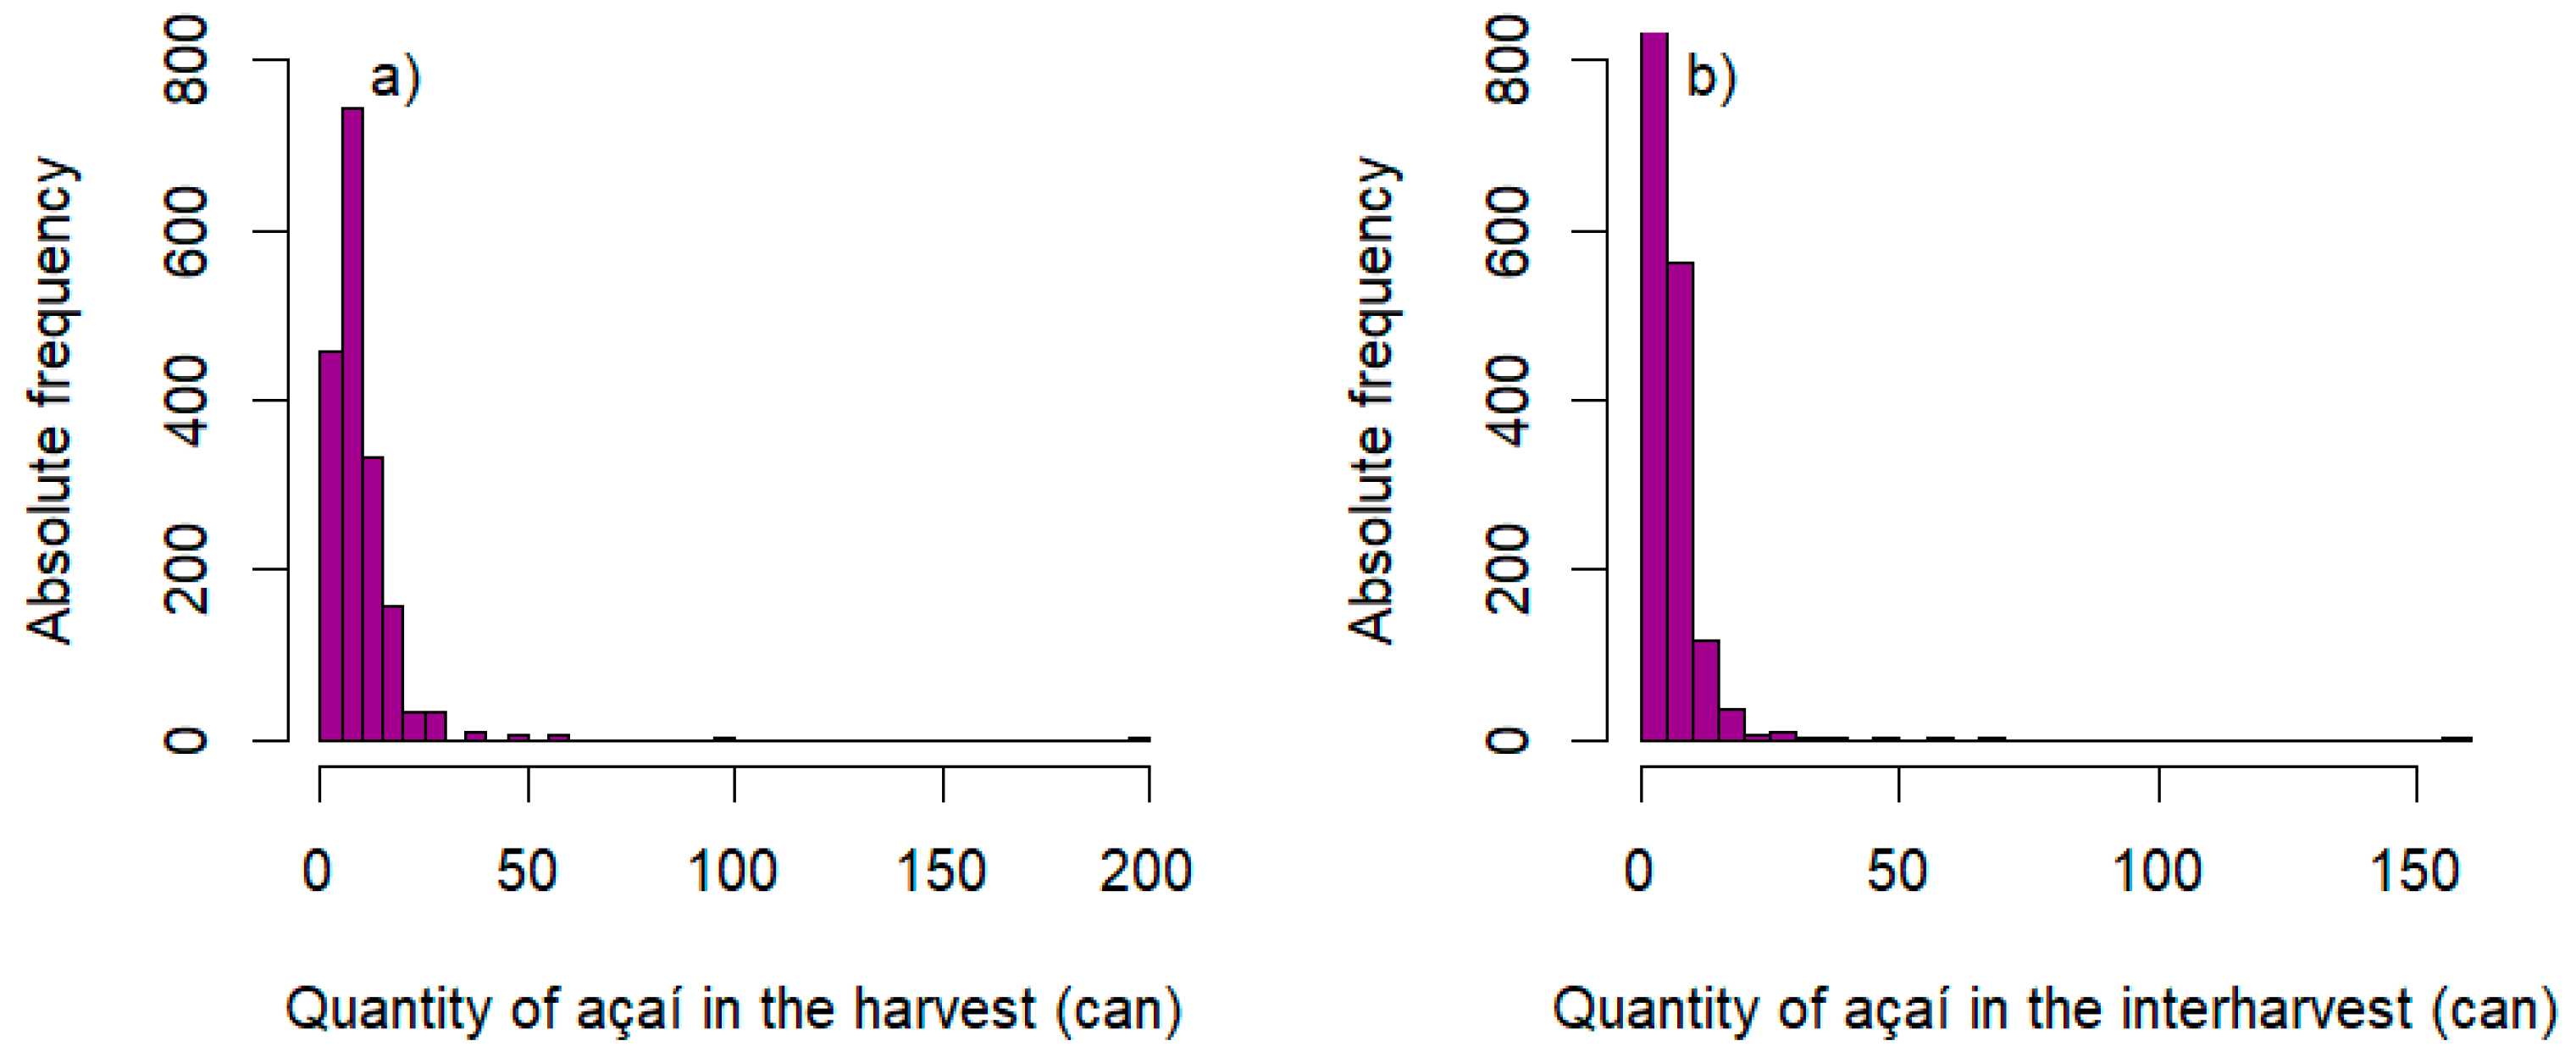
Figure 4.
Number of açaí spots in the Belém-PA region.
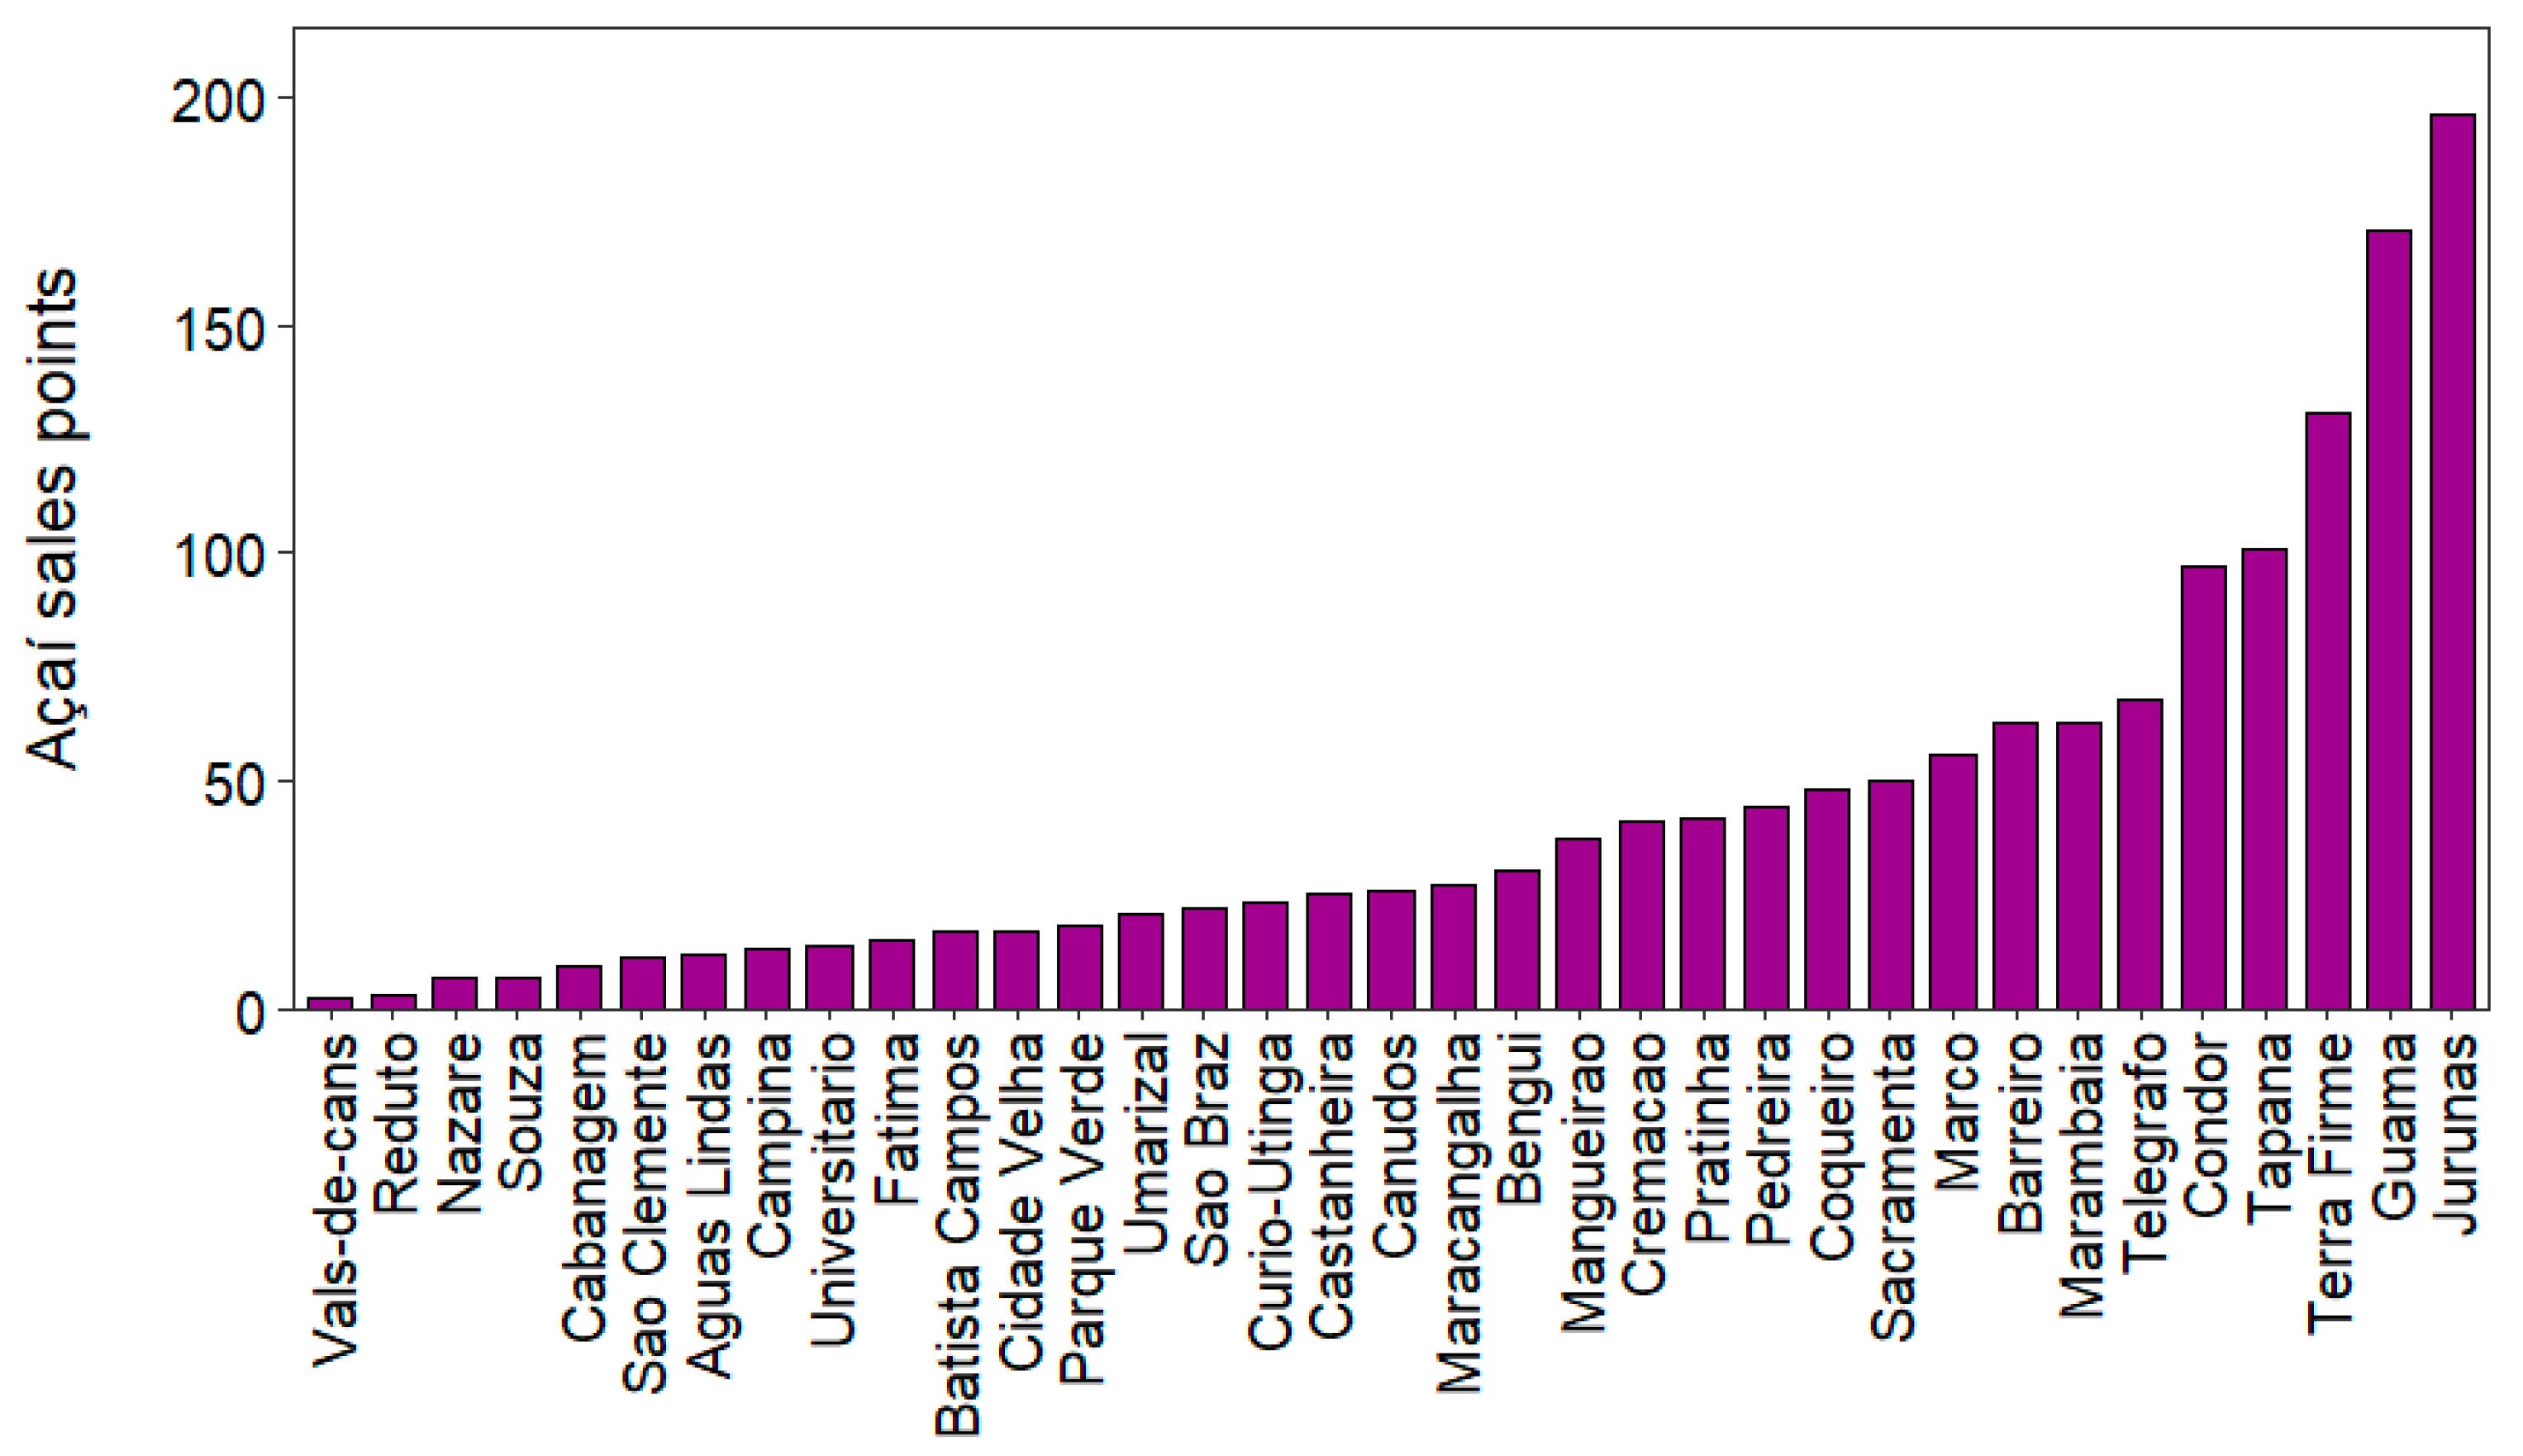
Figure 5.
Places to buy açaí in the Municipality of Belém.
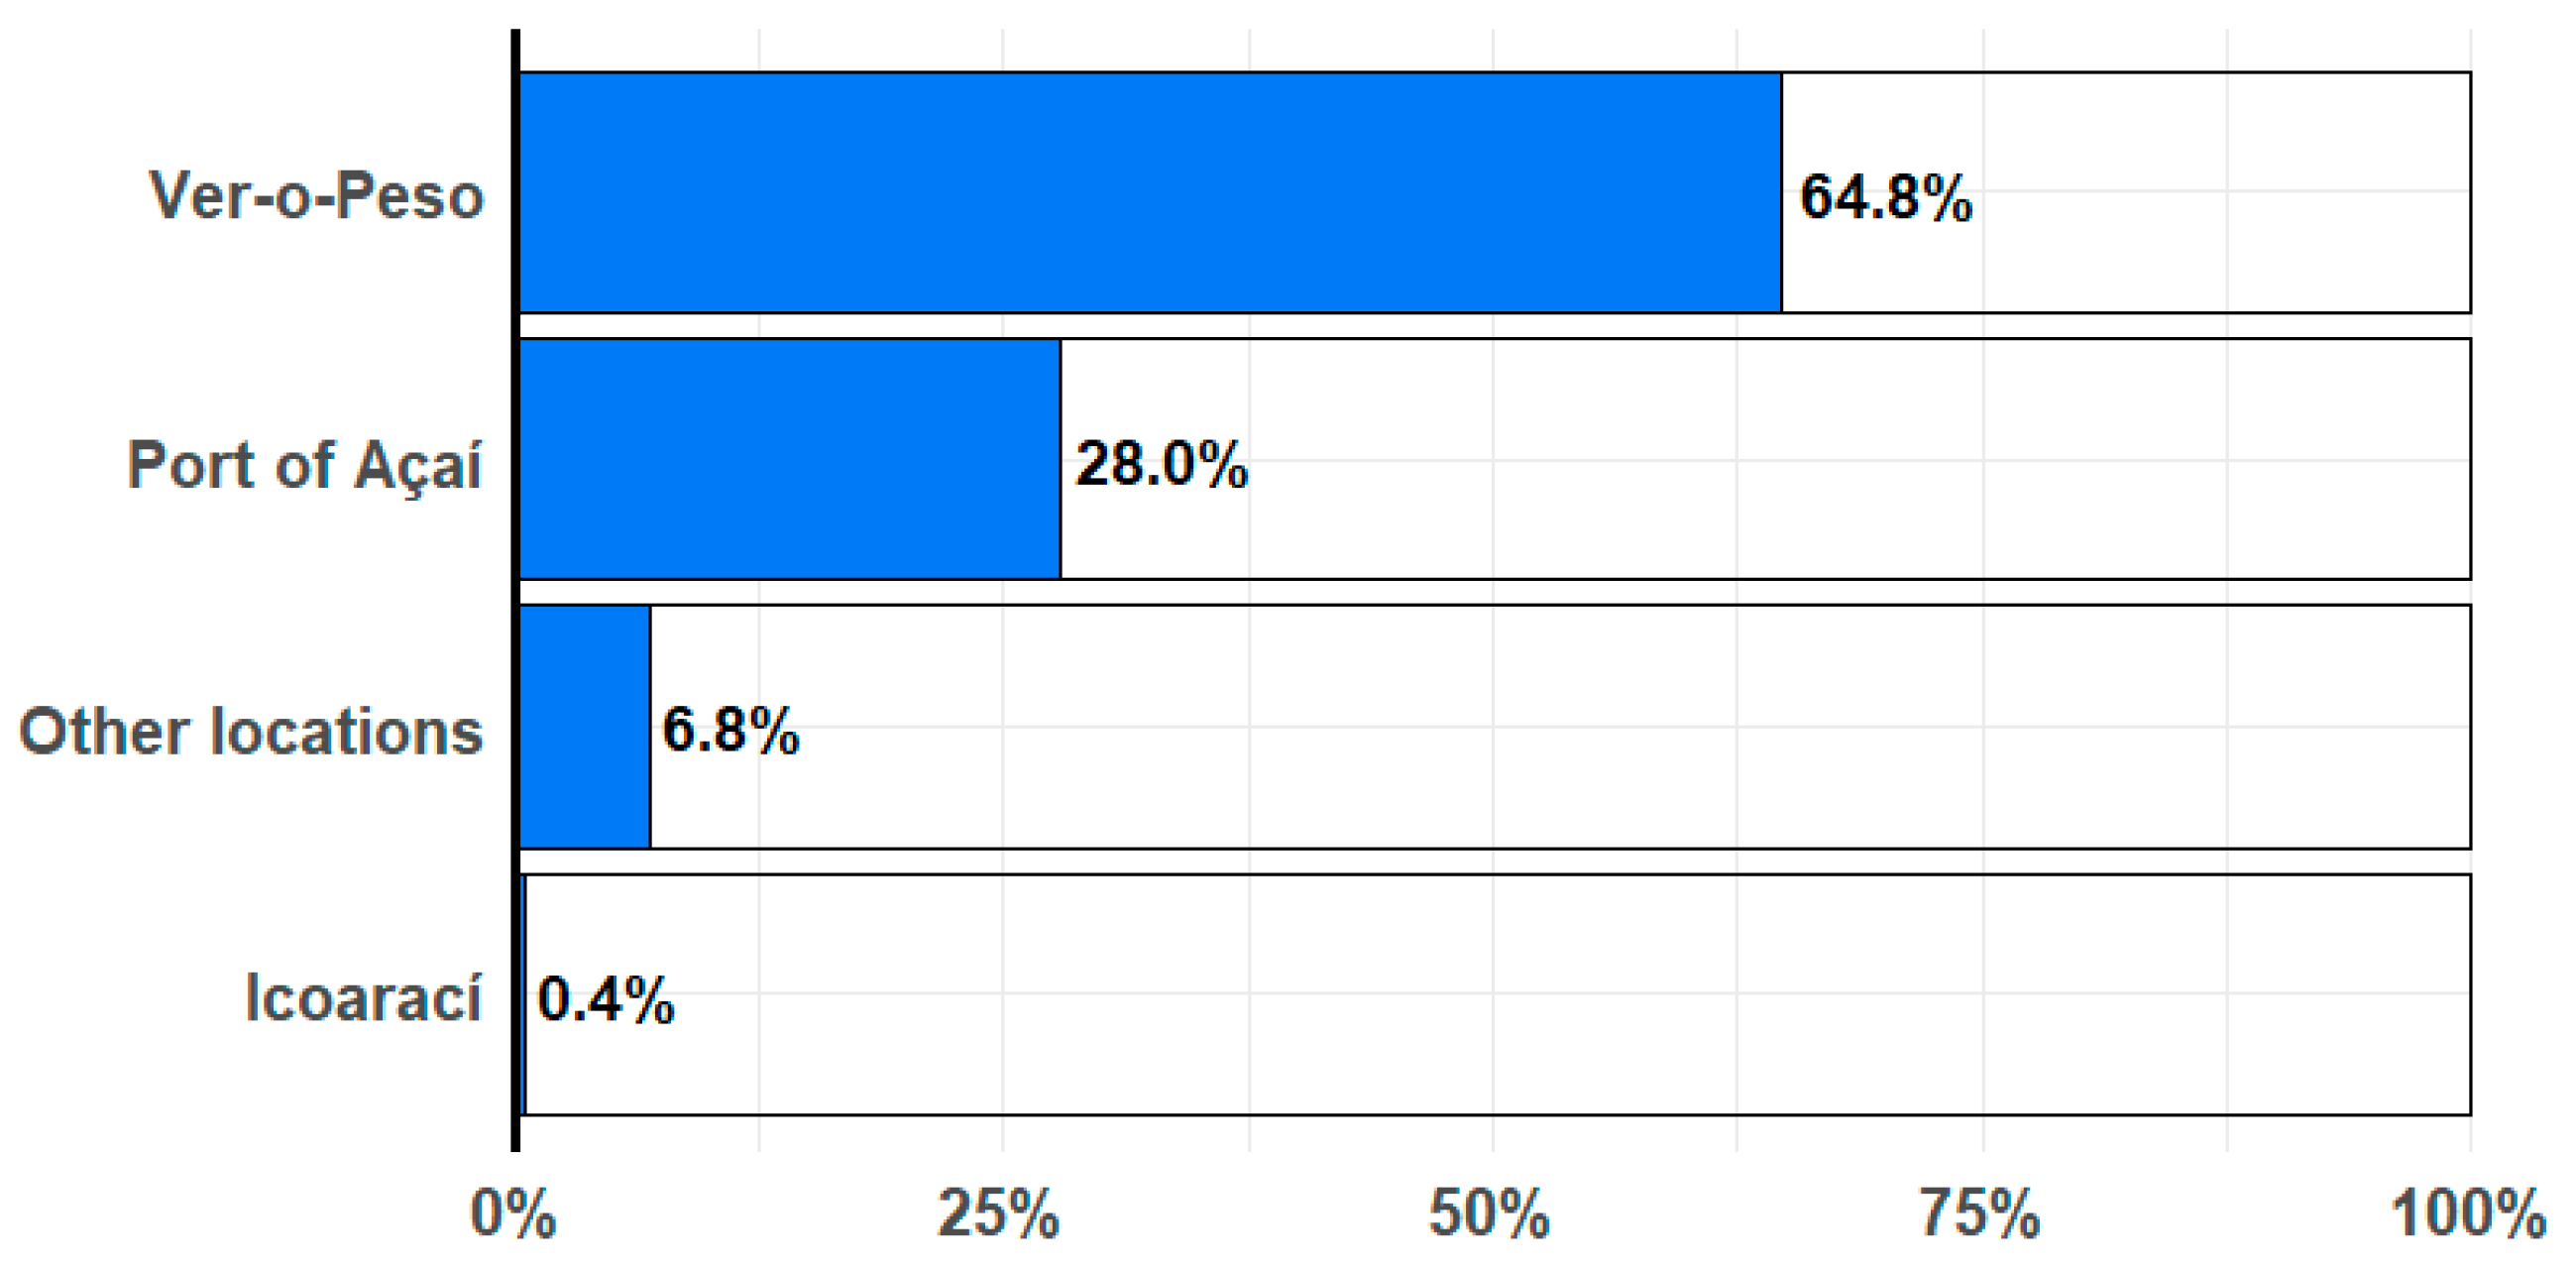
Figure 6.
Destination of açaí seeds.
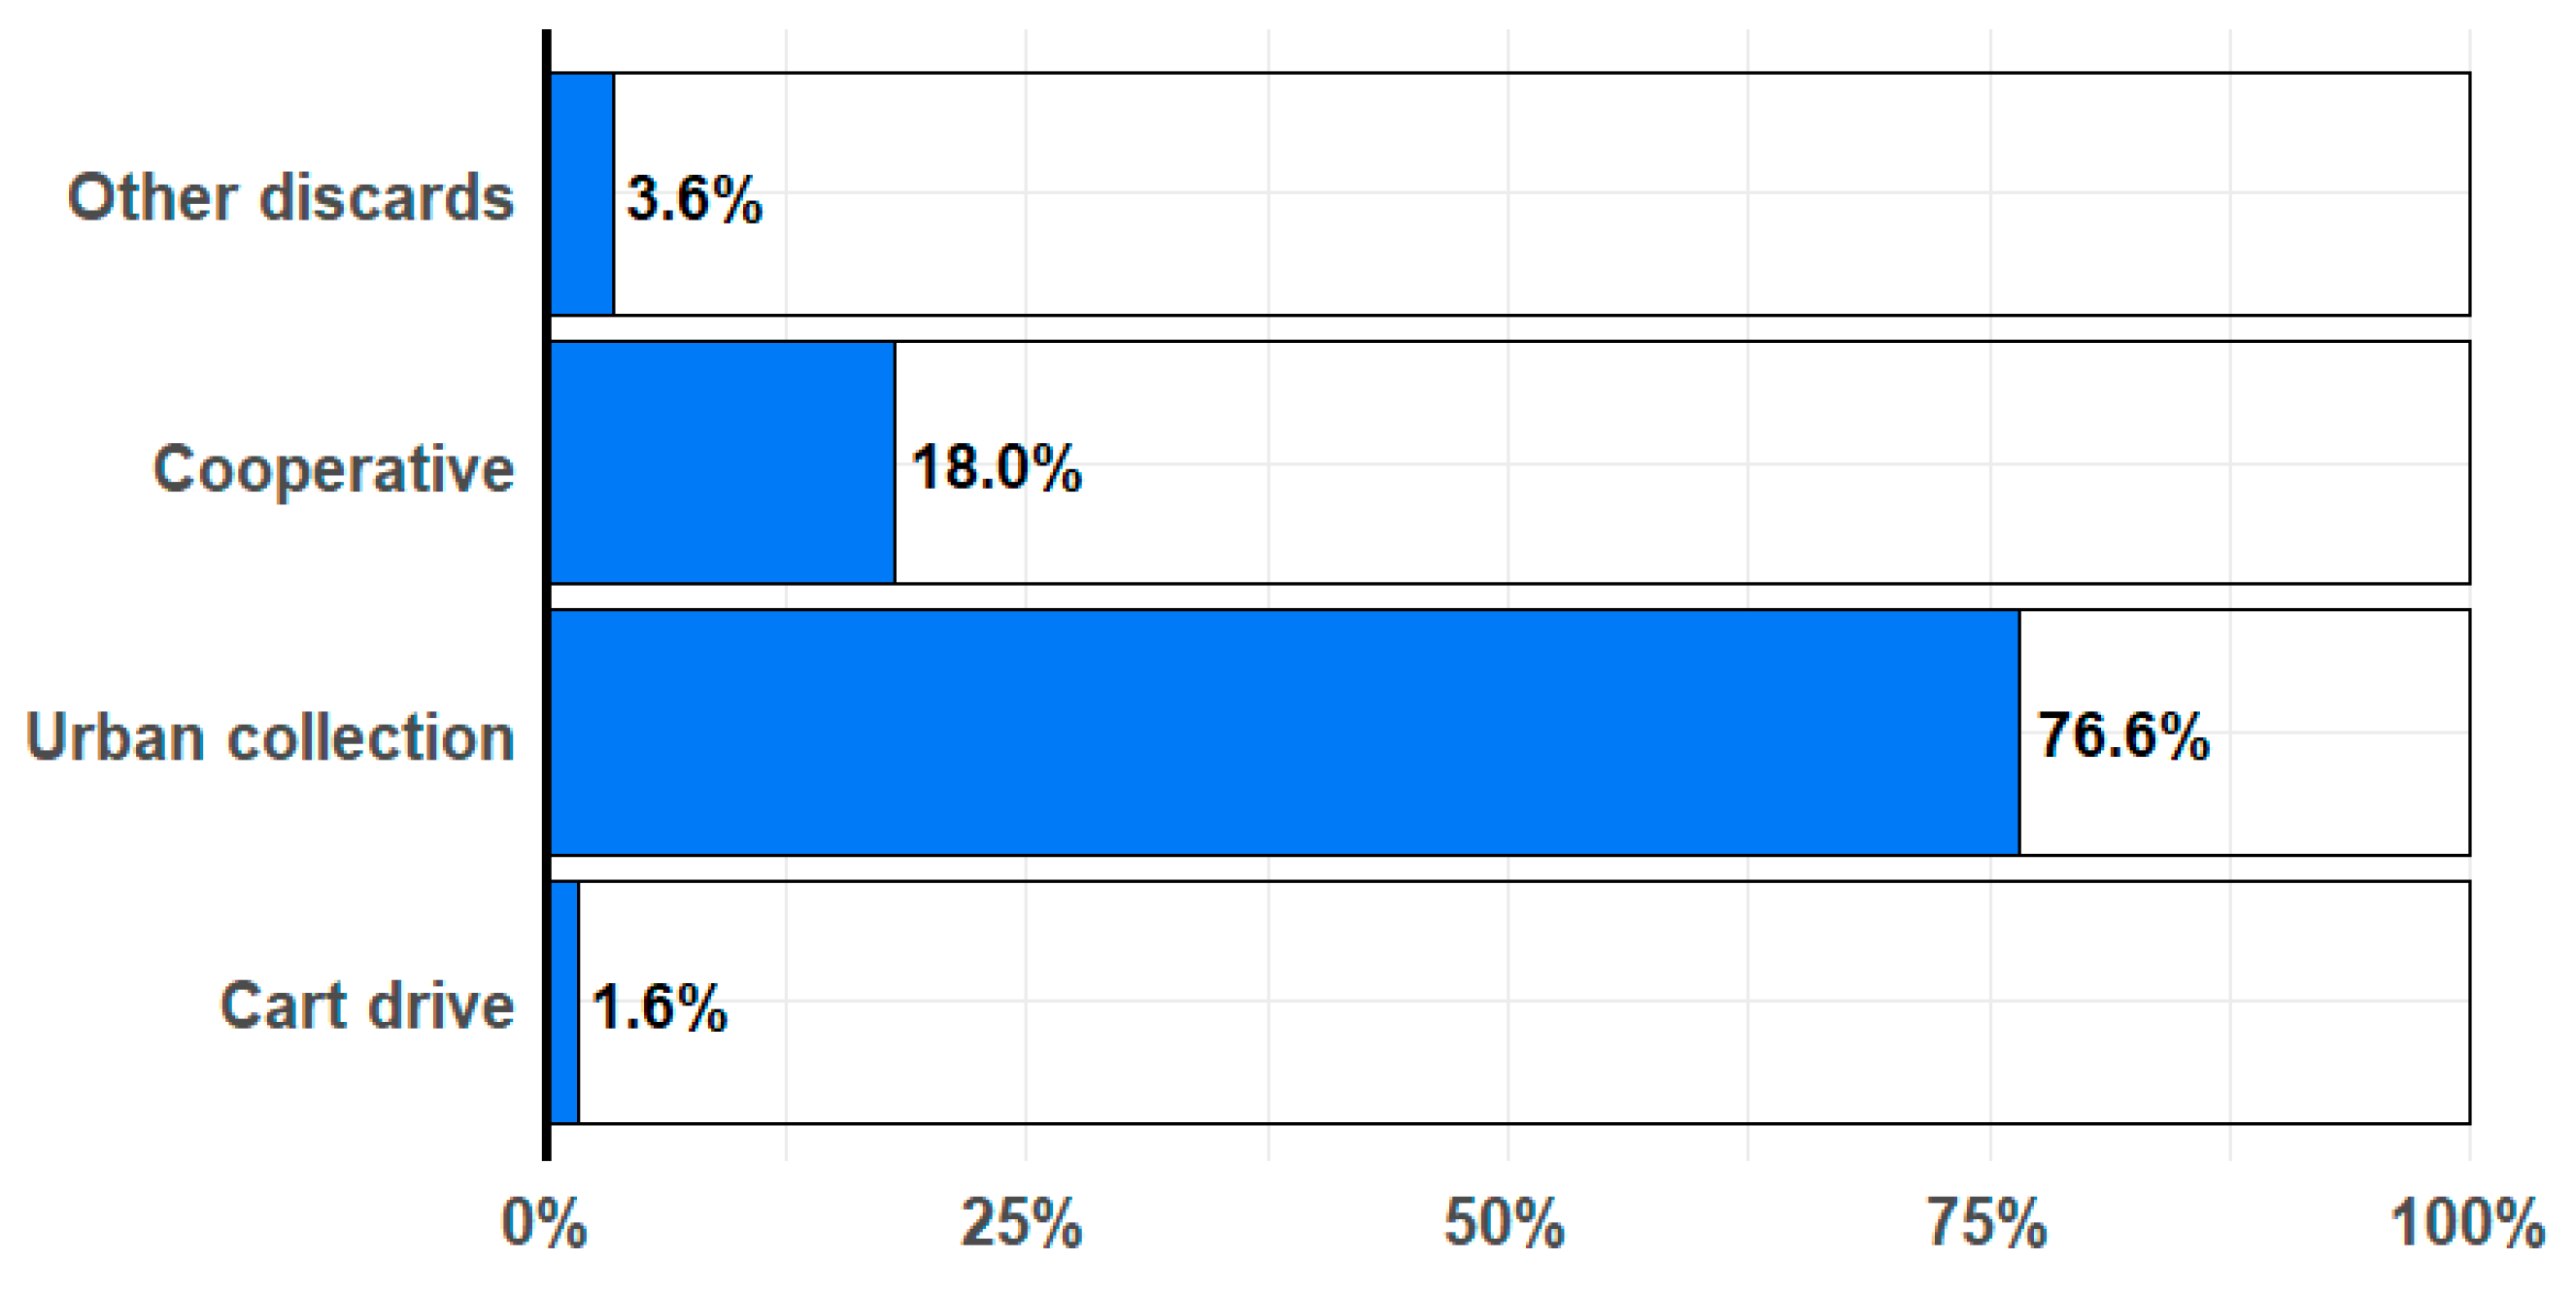
Figure 7.
Cluster Analysis by Neighborhoods of Belém-PA.
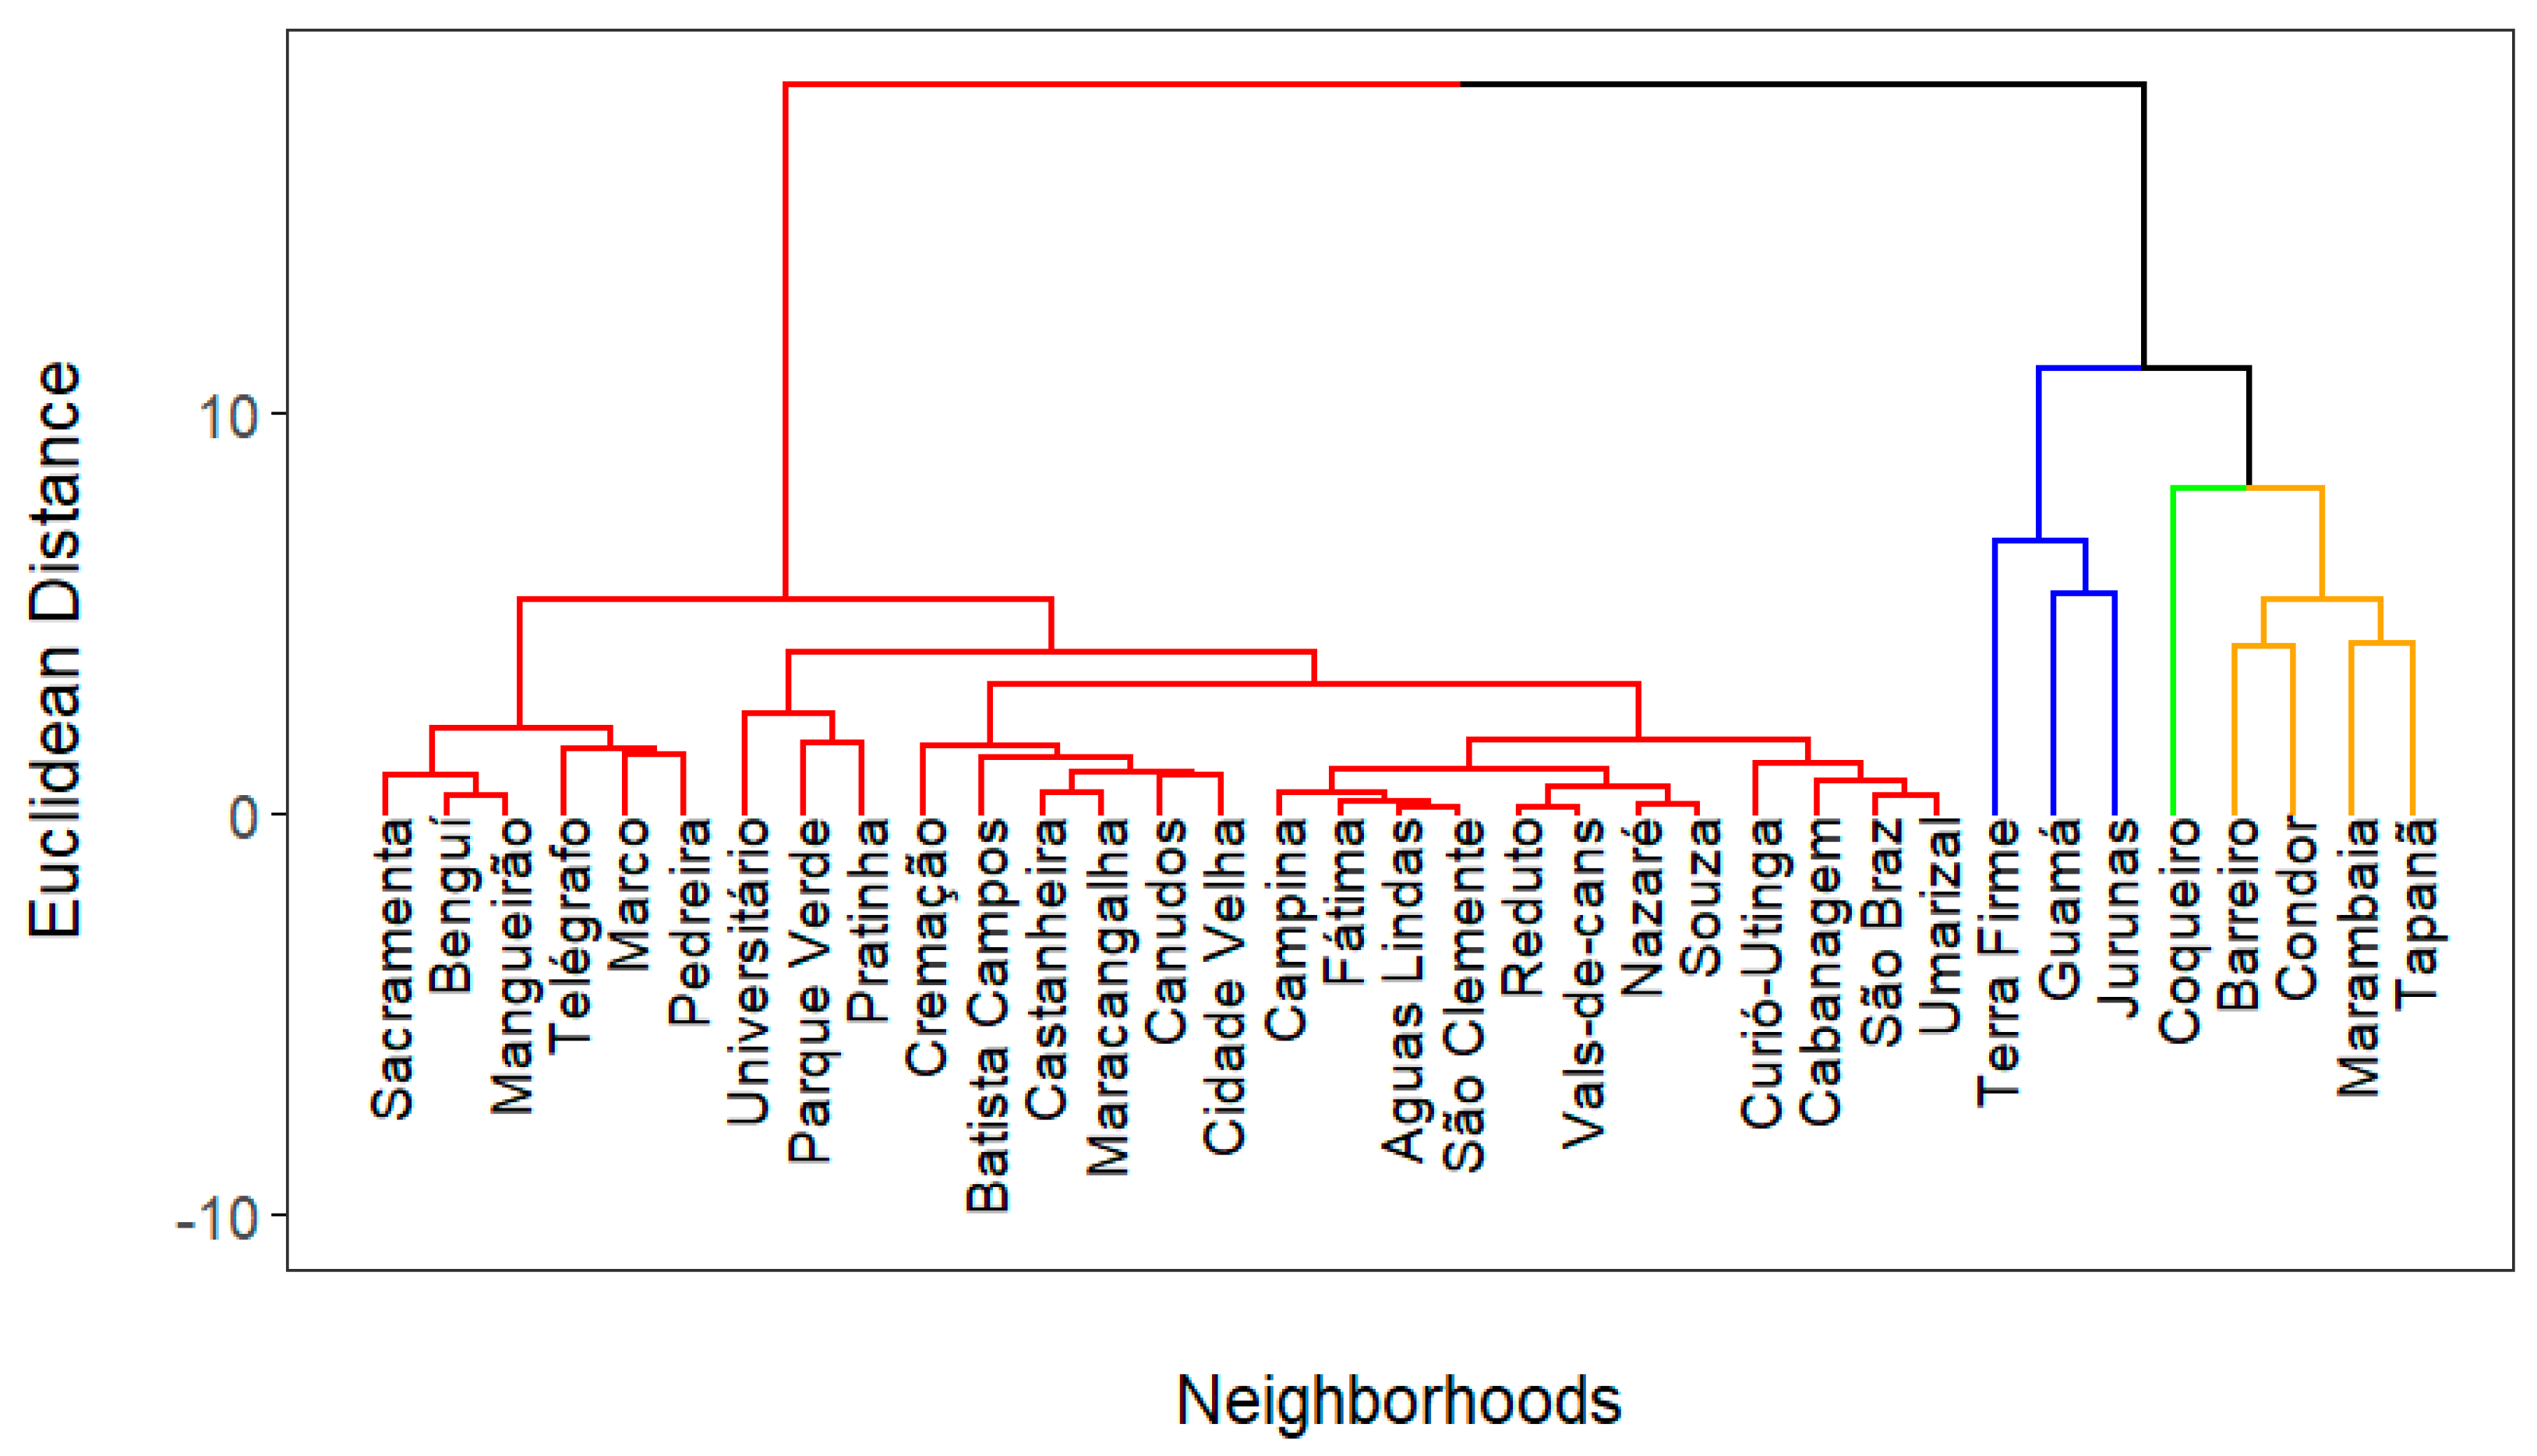

Table 1.
Demonstration of questionnaire collection by neighborhoods.
| Neighborhoods | Period | Quantity of points |
| Águas Lindas | 24/11 e 25/11/2023 | 14 |
| Barreiro | 11/07 à 01/08/2023 | 65 |
| Batista Campos | 13/06 à 16/06/2023 | 18 |
| Benguí | 20/03 à 03/05/2024 | 34 |
| Cabanagem | 31/01 à 29/02/2024 | 35 |
| Campina | 01/05 à 28/05/2023 | 13 |
| Canudos | 07/03 à 14/09/2023 | 13 |
| Coqueiro | 18/01 à 09/02/2024 | 96 |
| Castanheira | 09/08 à 01/09/2023 | 27 |
| Cidade Velha | 12/04 à 15/05/2023 | 22 |
| Condor | 01/03 à 27/03/2023 | 98 |
| Cremação | 29/03 à 31/03/2023 | 42 |
| Curió-Utinga | 18/04 à 20/09/2023 | 28 |
| Fátima | 19/04 à 20/04/2023 | 15 |
| Guamá | 16/02 à 23/08/2023 | 176 |
| Guanabara | 02/07 à 11/07/2024 | 2 |
| Jurunas | 17/02 à 11/04/2023 | 238 |
| Mangueirão | 19/02 à 29/02/2024 | 45 |
| Maracangalha | 03/07 à 30/08/2023 | 28 |
| Marambaia | 21/05 à 21/06/2023 | 70 |
| Marco | 20/03 à 12/04/2023 | 62 |
| Montese_ Terra-Firme | 24/02 à 24/09/2023 | 135 |
| Nazaré | 16/05 à 18/05/2023 | 7 |
| Parque Verde | 14/02 à 20/03/2024 | 70 |
| Pratinha | 06/03 à 05/04/2024 | 50 |
| Pedreira | 25/04 à 12/05/2023 | 46 |
| Reduto | 05/06 à 06/05/2023 | 3 |
| Sacramenta | 04/07 à 27/06/2023 | 50 |
| São Brás | 04/04 à 26/04/2023 | 23 |
| São Clemente | 07/04 à 20/03/2024 | 15 |
| Souza | 19/05 à 20/06/2023 | 9 |
| Tapanã | 05/04 à 18/07/2024 | 112 |
| Telegráfo | 05/07 à 19/09/2024 | 69 |
| Umarizal | 13/06 à 08/08/2023 | 23 |
| Una | 14/05 à 31/05/2024 | 13 |
| Universitário | 27/02 à 28/02/2023 | 15 |
| Val-de-Cans | 07/02 à 08/02/2023 | 2 |
Table 2.
Neighborhoods targeted in the study.
| NUMBER OF CANS | WASTE DISPOSAL | |||||||
| Neighborhoods | Point of Sale | Harvest | Underharvest | Average of the harvests | Urban collection | Cooperative | Closed points | Others |
| Águas Lindas | 14 | 159 | 79 | 119 | 71,43% | 14,29% | 14,29% | 0% |
| Barreiro | 65 | 531 | 320 | 425,5 | 60% | 15,38% | 1,54% | 18,46% |
| Batista Campos | 18 | 254 | 167 | 210,5 | 72,22% | 0% | 5,56% | 22,22% |
| Benguí | 34 | 449 | 260 | 354,5 | 70,59% | 17,65% | 11,76% | 0% |
| Cabanagem | 35 | 168 | 84 | 126 | 11,43% | 20% | 68,57% | 0% |
| Campinas | 13 | 262 | 166 | 214 | 100% | 0% | 0% | 0% |
| Canudos | 13 | 359 | 247 | 303 | 69,23% | 19,23% | 15,38% | 11,54% |
| Coqueiro | 96 | 788 | 481 | 634,5 | 8,33% | 40,63% | 47,92% | 2,08% |
| Castanheira | 27 | 175 | 106 | 140,5 | 77.78% | 11,11% | 7,41% | 3,70% |
| Cidade Velha | 22 | 294 | 192 | 243 | 59,09% | 13,64% | 22,73% | 4,55% |
| Condor | 98 | 1086 | 594 | 840 | 83,67% | 9,18% | 0% | 6,12% |
| Cremação | 42 | 468 | 265 | 366,5 | 78,57% | 14,29% | 2,38% | 4,76% |
| Curió Utinga | 28 | 189 | 125 | 157 | 78,57% | 7,14% | 10,71% | 0% |
| Fátima | 15 | 193 | 91 | 142 | 86,67% | 13,33% | 0% | 0% |
| Guamá | 176 | 1866 | 1155 | 1510,5 | 76,70% | 11,36% | 2,84% | 6,82% |
| Guanabara | 2 | 20 | 13 | 16,5 | 0% | 100% | 0% | 0% |
| Jurunas | 238 | 2277 | 1446 | 1861,5 | 74,37% | 7,56% | 17,27% | 0% |
| Mangueirão | 45 | 453 | 280 | 366,5 | 68,89% | 15,56% | 15,56% | 0% |
| Maracangalha | 28 | 300 | 166 | 233 | 82,14% | 7,40% | 3,57% | 7,14% |
| Marambaia | 72 | 742 | 438 | 590 | 27,14% | 57,14% | 4,29% | 7,14% |
| Marco | 62 | 701 | 436 | 568,5 | 77,42% | 14,52% | 8,06% | 0% |
| Terra Firme | 135 | 1375 | 982 | 1178,5 | 86,67% | 6,67% | 2,96% | 0% |
| Nazaré | 7 | 89 | 56 | 72,5 | 71,43% | 28,57% | 0% | 0% |
| Parque Verde | 70 | 269 | 121 | 195 | 14,29% | 7,14% | 75,71% | 1,43% |
| Pratinha | 50 | 328 | 178 | 253 | 76% | 4% | 16% | 0% |
| Pedreira | 46 | 473 | 310 | 391,5 | 58,70% | 34,78% | 4,35% | 2,17% |
| Reduto | 3 | 26 | 6 | 16 | 66,67% | 33,33% | 0% | 0% |
| Sacramenta | 50 | 555 | 298 | 426,5 | 88% | 12% | 0% | 0% |
| São Brás | 23 | 289 | 155 | 222 | 60,87% | 30,44% | 4,35% | 4,35% |
| São Clemente | 15 | 146 | 80 | 113 | 66,67% | 6,67% | 26,67% | 0% |
| Tapanã | 112 | 1097 | 546 | 821,5 | 68,75% | 22,32% | 8,93% | 0% |
| Souza | 9 | 102 | 72 | 87 | 77,78% | 0% | 22,22% | 0% |
| Telégrafo | 69 | 534 | 323 | 428,5 | 81,16% | 15,94% | 1,45% | 1,45% |
| Universitário | 15 | 128 | 114 | 121 | 53,33% | 13,33% | 6,67% | 26,67% |
| Umarizal | 23 | 272 | 174 | 223 | 56,53% | 34,78% | 4,35% | 0% |
| Una | 13 | 151 | 65 | 108 | 53,85% | 38,46% | 7,69% | 0% |
| Val de Cans | 2 | 12 | 6 | 9 | 100% | 0% | 0% | 0% |
Table 3.
Descriptive statistics of mass açaí consumption by neighborhood during harvest periods.
| Curtose | Asymmetry | CV | Máx | IQR | p75 | p25 | Mín | DP | Var | Med | Media | n | Neighborhoods |
| 1.83 | 0.03 | 36 | 20 | 6.3 | 15.8 | 9.5 | 6 | 4.7 | 22.2 | 13.5 | 13.3 | 12 | Aguas Lindas |
| 5.23 | 1.31 | 38 | 20 | 4.0 | 10.0 | 6.0 | 4 | 3.1 | 9.8 | 8.0 | 8.2 | 63 | Barreiro |
| 3.6 | 1.20 | 43 | 30 | 5.0 | 15.0 | 10.0 | 8 | 6.4 | 40.4 | 14.0 | 14.9 | 17 | Batista Campos |
| 7.43 | 2.24 | 86 | 60 | 7.0 | 15.0 | 8.0 | 6 | 12.9 | 167.2 | 10.0 | 15.0 | 30 | Benguí |
| 2.13 | 0.58 | 75 | 40 | 17.0 | 25.0 | 8.0 | 2 | 12.7 | 161.9 | 12.0 | 16.9 | 9 | Cabanagem |
| 5.14 | 1.01 | 38 | 40 | 4.0 | 22.0 | 18.0 | 8 | 7.6 | 57.5 | 20.0 | 20.2 | 13 | Campina |
| 17.96 | 3.86 | 137 | 100 | 5.5 | 11.5 | 6.0 | 4 | 18.9 | 358.2 | 8.5 | 13.8 | 26 | Canudos |
| 2.56 | 0.41 | 31 | 12 | 3.0 | 8.0 | 5.0 | 3 | 2.2 | 4.8 | 7.0 | 7.0 | 25 | Castanheira |
| 13.88 | 3.50 | 162 | 200 | 15.0 | 25.0 | 10.0 | 3 | 45.3 | 2050.7 | 17.0 | 27.9 | 17 | Cidade Velha |
| 4.14 | 1.21 | 41 | 25 | 7.0 | 15.0 | 8.0 | 5 | 4.5 | 20.2 | 10.0 | 11.1 | 97 | Condor |
| 5.84 | 1.67 | 81 | 60 | 13.3 | 20.0 | 6.8 | 2 | 13.4 | 178.2 | 14.0 | 16.4 | 48 | Coqueiro |
| 2.56 | 0.60 | 37 | 20 | 7.0 | 15.0 | 8.0 | 5 | 4.2 | 17.6 | 10.0 | 11.4 | 41 | Cremação |
| 2.06 | 0.48 | 37 | 14 | 4.5 | 10.5 | 6.0 | 4 | 2.9 | 8.6 | 8.0 | 8.0 | 23 | Curió-Utinga |
| 1.45 | -0.38 | 18 | 15 | 4.5 | 15.0 | 10.5 | 9 | 2.4 | 5.6 | 14.0 | 12.9 | 15 | Fátima |
| 4.79 | 1.33 | 55 | 30 | 7.5 | 14.0 | 6.5 | 0 | 6.0 | 36.6 | 10.0 | 10.9 | 171 | Guamá |
| 17.36 | 2.89 | 67 | 60 | 9.0 | 15.0 | 6.0 | 1 | 7.7 | 59.3 | 10.0 | 11.5 | 196 | Jurunas |
| 4.86 | 0.87 | 45 | 30 | 7.0 | 15.0 | 8.0 | 0 | 5.4 | 29.4 | 12.0 | 12.1 | 37 | Mangueirão |
| 1.86 | 0.12 | 25 | 16 | 4.0 | 13.5 | 9.5 | 7 | 2.8 | 7.6 | 10.0 | 11.1 | 27 | Maracangalha |
| 4.91 | 1.30 | 51 | 30 | 7.0 | 14.5 | 7.5 | 3 | 5.5 | 29.7 | 10.0 | 10.7 | 63 | Marambaia |
| 8.24 | 2.08 | 69 | 50 | 7.0 | 15.0 | 8.0 | 4 | 8.8 | 78.3 | 10.0 | 12.8 | 56 | Marco |
| 4.84 | 1.89 | 61 | 30 | 2.5 | 11.5 | 9.0 | 8 | 7.8 | 60.2 | 10.0 | 12.7 | 7 | Nazaré |
| 12.02 | 3.04 | 81 | 60 | 6.5 | 15.0 | 8.5 | 5 | 12.1 | 146.5 | 12.0 | 14.9 | 18 | Parque Verde |
| 2.24 | 0.37 | 39 | 20 | 7.3 | 15.0 | 7.8 | 4 | 4.2 | 17.8 | 10.0 | 10.8 | 44 | Pedreira |
| 3.54 | 1.06 | 34 | 15 | 4.0 | 10.0 | 6.0 | 5 | 2.7 | 7.0 | 7.5 | 7.8 | 42 | Pratinha |
| 1.5 | 0.71 | 13 | 10 | 1.0 | 9.0 | 8.0 | 8 | 1.2 | 1.3 | 8.0 | 8.7 | 3 | Reduto |
| 2.58 | 0.68 | 37 | 20 | 6.8 | 14.8 | 8.0 | 5 | 4.1 | 17.2 | 10.0 | 11.1 | 50 | Sacramenta |
| 2.35 | -0.63 | 37 | 20 | 7.0 | 19.0 | 12.0 | 5 | 5.4 | 29.3 | 15.0 | 14.6 | 7 | Souza |
| 3.76 | -0.17 | 30 | 20 | 4.8 | 15.0 | 10.3 | 3 | 3.9 | 15.4 | 13.0 | 13.1 | 22 | São Braz |
| 2.52 | 0.80 | 61 | 30 | 12.0 | 20.0 | 8.0 | 5 | 8.1 | 64.8 | 10.0 | 13.3 | 11 | São Clemente |
| 13.66 | 2.60 | 62 | 50 | 6.0 | 12.0 | 6.0 | 2 | 6.7 | 45.2 | 8.0 | 10.8 | 101 | Tapanã |
| 2.68 | 0.43 | 38 | 15 | 5.0 | 10.0 | 5.0 | 2 | 3.0 | 8.8 | 8.0 | 7.9 | 68 | Telégrafo |
| 10.87 | 2.44 | 81 | 60 | 10.0 | 15.0 | 5.0 | 0.6 | 9.2 | 84.3 | 8.0 | 11.3 | 131 | Terra Firme |
| 2.41 | 0.57 | 44 | 25 | 7.0 | 15.0 | 8.0 | 5 | 5.5 | 30.1 | 10.0 | 12.5 | 21 | Umarizal |
| 6.13 | 1.94 | 96 | 40 | 6.0 | 10.0 | 4.0 | 3 | 10.1 | 102.6 | 7.0 | 10.6 | 14 | Universitário |
| * | * | 0 | 6 | 0 | 6 | 6 | 6 | 0 | 0 | 6 | 6 | 2 | Vals-de-Cans |
Table 4.
Descriptive statistics of mass açaí consumption by neighborhood during the off-season periods.
Table 4.
Descriptive statistics of mass açaí consumption by neighborhood during the off-season periods.
| Curtose | Asymmetry | CV | Máx | IQR | p75 | p25 | Mín | DP | Var | Med | Media | n | Neighborhoods |
| 2.4 | 0.5 | 41.2 | 12 | 4 | 8 | 4 | 3 | 2.7 | 7.4 | 6 | 6.6 | 12 | Aguas Lindas |
| 5.9 | 1.5 | 46.4 | 14 | 3 | 6 | 3 | 2 | 2.3 | 5.2 | 4 | 4.9 | 63 | Barreiro |
| 3.7 | 1.3 | 65.6 | 26 | 6 | 11 | 5 | 3 | 6.4 | 41.5 | 8 | 9.8 | 17 | Batista Campos |
| 8.4 | 2.4 | 98.5 | 40 | 4 | 8 | 4 | 2 | 8.5 | 72.9 | 6 | 8.7 | 30 | Benguí |
| 2.3 | 0.6 | 72.6 | 20 | 8 | 12 | 4 | 1 | 6.2 | 38.5 | 6 | 8.6 | 9 | Cabanagem |
| 3.9 | -1.1 | 24.6 | 17 | 3 | 15 | 12 | 5 | 3.1 | 9.9 | 14 | 12.8 | 13 | Campina |
| 17.8 | 3.8 | 140.1 | 70 | 6 | 10 | 4 | 2 | 13.3 | 177.1 | 5.5 | 9.5 | 26 | Canudos |
| 3.6 | 0.3 | 44.3 | 9 | 2 | 5 | 3 | 0 | 1.9 | 3.5 | 4 | 4.2 | 25 | Castanheira |
| 12.9 | 3.3 | 190.3 | 160 | 9 | 14 | 5 | 1 | 37.6 | 1414.3 | 10 | 19.8 | 17 | Cidade Velha |
| 5.5 | 1.4 | 43.9 | 16 | 3 | 7 | 4 | 2 | 2.7 | 7.1 | 5 | 6.1 | 97 | Condor |
| 6 | 1.7 | 81.8 | 40 | 9 | 14 | 5 | 1 | 8.2 | 67.2 | 8 | 10 | 48 | Coqueiro |
| 2.4 | 0.6 | 42.7 | 13 | 3 | 8 | 5 | 2 | 2.8 | 7.6 | 6 | 6.5 | 41 | Cremação |
| 4 | 1.1 | 43.8 | 12 | 3 | 7 | 4 | 2 | 2.3 | 5.4 | 5 | 5.3 | 23 | Curió-Utinga |
| 2.2 | 0.6 | 30.8 | 10 | 3 | 8 | 5 | 4 | 1.9 | 3.5 | 5 | 6.1 | 15 | Fátima |
| 7.8 | 1.9 | 69.9 | 30 | 6 | 10 | 4 | 0 | 4.8 | 22.7 | 5 | 6.8 | 171 | Guamá |
| 8.5 | 2 | 68 | 35 | 6 | 10 | 4 | 1 | 5 | 25 | 6 | 7.4 | 196 | Jurunas |
| 2.9 | 0.9 | 45.8 | 15 | 5 | 10 | 5 | 3 | 3.4 | 11.8 | 6 | 7.5 | 37 | Mangueirão |
| 3.5 | -0.3 | 36.8 | 10 | 3 | 8 | 5 | 0 | 2.3 | 5.1 | 6 | 6.1 | 27 | Maracangalha |
| 5.6 | 1.6 | 61.1 | 20 | 4 | 8 | 4 | 2 | 4 | 15.8 | 5 | 6.5 | 63 | Marambaia |
| 29.8 | 4.7 | 86.6 | 50 | 6 | 10 | 4 | 3 | 6.7 | 44.7 | 6 | 7.7 | 56 | Marco |
| 4.7 | 1.9 | 67.7 | 20 | 3 | 8 | 5 | 5 | 5.4 | 29.3 | 6 | 8 | 7 | Nazaré |
| 12.1 | 3.1 | 92.8 | 30 | 2 | 6 | 4 | 3 | 6.2 | 38.9 | 5 | 6.7 | 18 | Parque Verde |
| 2.7 | 0.6 | 42.1 | 15 | 4 | 9 | 5 | 3 | 3 | 8.8 | 7 | 7 | 44 | Pedreira |
| 4.5 | 1.3 | 46.3 | 10 | 3 | 6 | 3 | 2 | 2 | 3.8 | 4 | 4.2 | 42 | Pratinha |
| 1.5 | -0.7 | 86.6 | 3 | 2 | 3 | 2 | 0 | 1.7 | 3 | 3 | 2 | 3 | Reduto |
| 3.5 | 0.7 | 54.3 | 15 | 4 | 8 | 4 | 0 | 3.2 | 10.5 | 5 | 6 | 50 | Sacramenta |
| 1.8 | -0.3 | 40.8 | 15 | 6 | 14 | 8 | 4 | 4.2 | 17.6 | 10 | 10.3 | 7 | Souza |
| 1.8 | 0.3 | 36.2 | 12 | 5 | 10 | 5 | 3 | 2.6 | 6.5 | 6.5 | 7 | 22 | São Braz |
| 1.9 | 0.7 | 57.7 | 15 | 7 | 11 | 5 | 3 | 4.2 | 17.6 | 5 | 7.3 | 11 | São Clemente |
| 3.3 | 0.9 | 54.2 | 15 | 4 | 7 | 3 | 2 | 2.9 | 8.4 | 5 | 5.3 | 101 | Tapanã |
| 3 | 0.7 | 40.9 | 10 | 3 | 6 | 3 | 2 | 1.9 | 3.8 | 5 | 4.8 | 68 | Telégrafo |
| 23.3 | 3.8 | 96.3 | 60 | 4 | 8 | 4 | 1 | 7.3 | 53.8 | 5 | 7.6 | 131 | Terra Firme |
| 2.2 | 0.6 | 49.1 | 15 | 5 | 10 | 5 | 3 | 3.9 | 15.2 | 6 | 8 | 21 | Umarizal |
| 1.9 | 0.7 | 79.2 | 20 | 10 | 14 | 4 | 2 | 7 | 49.2 | 6.5 | 8.9 | 14 | Universitário |
| * | * | 0 | 3 | 0 | 3 | 3 | 3 | 0 | 0 | 3 | 3 | 2 | Vals-de-Cans |
Table 5.
Correlation matrix of the principal components.
| PC3 | PC2 | PC1 | Dice |
| 0.148 | 0.085 | 0.38 | Harvest |
| 0.122 | 0.083 | 0.379 | Underharvest |
| 0.175 | 0.051 | 0.375 | Point |
| 0.113 | 0.036 | 0.337 | Ver-o-peso |
| 0.054 | 0.319 | 0.304 | Port of açaí |
| 0.209 | -0.697 | 0.087 | Port of Icoaraci |
| -0.278 | -0.288 | 0.264 | Other ports |
| -0.532 | -0.122 | 0.261 | Cartwrights |
| 0.112 | 0.272 | 0.358 | Urban collection |
| 0.22 | -0.472 | 0.244 | Cooperatives |
| -0.672 | -0.031 | 0.182 | Other discards |
Disclaimer/Publisher’s Note: The statements, opinions and data contained in all publications are solely those of the individual author(s) and contributor(s) and not of MDPI and/or the editor(s). MDPI and/or the editor(s) disclaim responsibility for any injury to people or property resulting from any ideas, methods, instructions or products referred to in the content. |
© 2025 by the authors. Licensee MDPI, Basel, Switzerland. This article is an open access article distributed under the terms and conditions of the Creative Commons Attribution (CC BY) license (http://creativecommons.org/licenses/by/4.0/).
Copyright: This open access article is published under a Creative Commons CC BY 4.0 license, which permit the free download, distribution, and reuse, provided that the author and preprint are cited in any reuse.


