
Submitted:
25 February 2025
Posted:
26 February 2025
You are already at the latest version
Abstract
Background/Objectives: Approximately 90% of newly developed active pharmaceutical ingre-dients (APIs) exhibit low solubility in aqueous environments. The formation of cyclodextrin (CD)-guest inclusion complexes (ICs) is one method of increasing the solubility of poorly soluble drugs. In contrast to its crystalline state, a compound is more soluble in its amorphous solid state. Methods: The purpose of this work was to investigate how the solid-state characteristics of ti-cagrelor (TICA) are affected by complexation with specific cyclodextrins. TICA inclusion com-plexes containing three different types of CDs were prepared by freeze-drying, co-precipitation, and kneading methods. Solid-state characterization of pure ingredients, physical mixtures (PMs) and TICA-CD ICs was performed using: scanning electron microscopy (SEM), powder X-ray diffraction analysis (PXRD), thermogravimetric analysis (TGA), differential scanning calorimetry (DSC) and temperature-modulated differential scanning calorimetry (TMDSC). Results: The freeze-drying method was the most effective in terms of obtaining TICA in the amorphous state. Using the kneading technique, the complexes with lower crystallinity were obtained compared to pure ticagrelor. Since almost pure crystalline ticagrelor was found in the mixes produced by co-precipitation, it may be said that the procedure was unsuccessful. Conclusions: Therefore, our findings suggest that kneading and, particularly, freeze-drying techniques are useful approaches for preparing TICA–CD amorphous ICs.
Keywords:
ticagrelor
; cyclodextrin
; freeze-drying
; kneading
; DSC
1. Introduction
Solubility, and consequently the dissolution rate of an active pharmaceutical ingredient (API) play critical roles in determining the bioavailability of oral solid dosage forms [1]. Given that almost 90% of recently developed APIs show poor solubility in aqueous conditions, this is especially important [2]. To improve the dissolution rate and bioavailability of novel drugs, strategies often focus on enhancing their solubility or surface area. The process of converting a drug's crystalline form to an amorphous state is referred to as amorphization. The amorphous solid state of a compound is particularly advantageous, as it is more soluble than the crystalline state, which requires significant energy to disrupt the crystal lattice structure. This allows drug molecules to more easily form intermolecular interactions with solvent molecules, and become soluble [3,4,5,6].
Like most new synthetized APIs, ticagrelor (TICA) exhibits low solubility and low intrinsic permeability, being classified as a class IV compound according to the Biopharmaceutics Classification System (BCS) [7,8]. TICA is a platelet aggregation inhibitor, the first oral, direct-acting and reversible inhibitor of the ADP P2Y12 receptor [9]. Various studies have been performed in order to increase the solubility, dissolution rate and subsequently bioavailability of TICA [8,10,11,12,13,14,15]. For instance, Ren et al. [10] studied the impact of crystal habit modification on solubility of TICA. As a result, changes in crystal surface morphology led to increased solubility. Jung et al. [13] formulated a high-loaded nanostructured lipid carrier (HL-NLC), which can be developed as sustained-release tablets. The method of increasing TICA solubility by forming inclusion complexes (ICs) with cyclodextrins (CDs) was described by Ahmed Alsaad [16]. They concluded that the solvent evaporation method was more effective than physical trituration and kneading. The solvent evaporation technique was also studied by Kim et al. [8], their study being the first to report the improvement of TICA bioavailability by the solid dispersion technique.
Cyclodextrins are homologous cyclic and non-reducing oligosaccharides formed by α–1,4–linked D-glucopyranoside units with a hydrophilic external surface and a lipophilic central cavity. They are considered "host molecules", capable of forming ICs with drugs, which are considered "guest molecules". Due to their ability to create "host-guest" systems, they can change the physiochemical properties of the included drug. Thereby, cyclodextrins, such as beta-cyclodextrin (B–CD) and its derivatives, can be used to increase properties such as dissolution rate and apparent solubility of poorly soluble drugs [17,18,19,20].
Although numerous studies have focused on the inclusion complexes of drugs with CDs [11,21,22,23,24,25,26,27,28,29,30,31], little attention has been dedicated to the inclusion complexes with TICA.
The objectives of this current study were:
- ICs preparation with 1:1 molar ratio of TICA and B–CD, hydroxypropyl-beta-cyclodextrin (HP–B–CD) and methyl-beta-cyclodextrin (ME–B–CD), respectively. Different preparation methods were considered for preparing inclusion complexes, such as kneading (KN), co-precipitation (COP), and freeze-drying (FD, also known as lyophilization);
- solid state characterization of pure ingredients, physical mixtures (PMs) and products of technological processes, using several analytical techniques such as: scanning electron microscopy (SEM), powder X-ray diffraction analysis (PXRD), thermogravimetric analysis (TGA), differential scanning calorimetry (DSC) and temperature-modulated differential scanning calorimetry (TMDSC);
2. Materials and Methods
2.1. Materials
Ticagrelor (Figure 1) was kindly donated by Zentiva, Bucharest, Romania.
B–CD (Figure 2) and its derivates (HP–B–CD and ME–B–CD) were provided by the Hong Kong Guokang Bio-Technology Co., Limited, Baoji City, Shaan’xi province, China.
All other chemicals and solvents used in the study were of analytical grade.
2.2. Methods
2.2.1. Preparation of the Powders to Be Analyzed
Based on previous studies demonstrating that cyclodextrins increase bioavailability of APIs, the majority of dosages were less than 100 mg [32]. Consequently, in order to have 45 mg of TICA and 100 mg of CD, inclusion complexes of TICA with CDs were prepared in a 1:1 molar ratio, most commonly, one drug molecule forming a complex with one CD molecule [11]. The inclusion complexes (TICA+B–CD, TICA+HP–B–CD and TICA+ME–B–CD) were prepared using co-precipitation, kneading, and freeze-drying techniques. A Mettler Toledo AT261 (Columbus, OH, USA) balance (with 0.01 mg sensitivity) was used for weighing all materials. The raw materials, their PMs, and obtained ICs were characterized by TGA, DSC, PXRD and SEM in order to characterize the solid state of all compounds.
2.2.1.1. Preparation of the PMs of TICA with CDs
In order to prepare the three different PMs, accurately weighed amounts of TICA and each CDs, in 1:1 molar ratio, were mixed in a mortar for 5 min at room temperature.
2.2.1.2. Preparation of the Inclusion Complexes2.2.1.2.1. Co-Precipitation Technique
The TICA and each CD were weighed based on a calculated 1:1 molar ratio. CDs and TICA solutions were obtained at room temperature by dissolving in water or ethanol, respectively. TICA solution was added slowly into each CD solution, and the mixtures were continuously stirred for 4 h at 1000 rpm at room temperature using a Heidolph MR 3001K (Schwabach, Germany) magnetic stirrer. The obtained suspensions were filtered, and the solids were dried at 25 °C in an exicator for 24 h.
2.2.1.2.2. Kneading Technique
The required quantities of TICA and each CD were transferred to a ceramic mortar and manually kneaded for 1 h at room temperature. During this process, the samples were wetted with 10 mL of ethyl alcohol:water (50:50 v/v) mixture. The resulting paste was dried at room temperature for 24 h. The dried product was then powdered and passed through an 800 micrometers sieve.
2.2.1.2.3. Freeze-Drying Technique
TICA and each CD solution were prepared analogously to the co-precipitation method. Calculated amounts of TICA and each CD were weighed, according to 1:1 molar ratio. CDs solutions and TICA solutions were obtained at room temperature by dissolving in water or ethanol, respectively. TICA solution was added slowly into each CD solution and the mixtures were continuously stirred for 4 hours at 1000 rpm at room temperature using a Heidolph MR 3001K (Schwabach, Germany) magnetic stirrer. After 1 hour, the stirred suspensions were frozen and then lyophilized at −60 °C for 12 h using the Christ ALPHA 1–2, B (Braun Biotech International, Melsungen, Germany) lyophilizer.
2.2.2. Binary Powder Systems Characterization
2.2.2.1. Scanning Electron Microscopy
Morphological studies were carried out using a Hitachi TM4000 (Tokyo, Japan) tabletop scanning electron microscope. Secondary electron images were recorded in high vacuum mode at an accelerating voltage between 5 and 20 kV. Double-sided conductive adhesive tape was placed on a 1 cm diameter aluminum stub, and particles of each dry powder sample were scattered on the tape and dispersed homogeneously with the use of a spatula by tapping lightly. The samples were randomly scanned without coating.
2.2.2.2. Powder X-Ray Diffraction
All measurements were conducted on a Bruker D2 Phaser (Karlsruhe, Germany) X-ray diffractometer using CuKα radiation (wavelength 1.5406 Å) in parallel beam geometry. The PXRD patterns were recorded in the 2Θ = 10 – 70° range, with a scan speed of 2° / min-1 and a 0.02° step size.
2.2.2.3. Differential Scanning Calorimetry and Temperature-Modulated Differential Scanning Calorimetry
All DSC and TMDSC measurements of the samples were performed using the NETZSCH DSC 214 Polyma (Selb, Germany). Aluminum crucibles (type Concavus) with pierced lids were used. Nitrogen at a flow rate of 40 mL min-1 was used as the purge gas. Approximately 10 mg of each sample were heated at a rate of 10 °C min-1 in a 0 – 200 °C temperature range. The temperature and heat flow rate calibration were performed using high-purity indium as a standard (Tfus = 156.65 °C and ΔHfus = 28.45 J g−1). Thermograms were normalized to the sample weight. Data were analyzed using NETZSCH Proteus® software (Selb, Germany).
2.2.2.4. Thermogravimetric Analysis
TGA measurements were carried out with an TG 209 Tarsus Netzsch (Selb, Germany) thermogravimetric analyzer using open ceramic crucibles. Nitrogen was used as a purge gas at a flow rate of 40 mL min−1. The samples (about 10 mg) were heated at 10 °C min-1 from 20 to 400 °C.
3. Results and Discussions
3.1. Characterization of Pure Components, PMs and Products of Technological Processes
3.1.1. TGA Analysis
Thermogravimetric analysis was performed in order to evaluate the thermal stability of all samples and to establish the host-guest interactions between the compounds in the solid state [33].
Various IC production methods of the ICs fabrication processes produced varied solid-state structures, as shown in Figure 3, Figure 4 and Figure 5 . Regarding the diagrams of the co-precipitation products, they were comparable to those of the pure materials, with no traces of CDs to be observed. Thus, it was believed that there was no interaction between TICA and CDs, the last mentioned being lost during the filtration process. The kneading and freeze-drying synthesis procedures resulted in TGA thermograms with thermal decomposition patterns that differed from those of the individual compounds.
TGA curve of B–CD (Figure 3) could be separated into two sections. The first stage, at around 100 °C, results in a 9.33% mass loss due to solvent evaporation. The second stage, which ranges from 260 to 350 °C, is related to the thermal decomposition of the CD. The initial decomposition temperature of pure B–CD was approximately 290 °C, which is consistent with the literature [28]. TGA results of B–CD+TICA IC are somewhat unusual. The major weight loss for the IC starts around 280 °C. Therefore, the possible formation of the IC decreased the CD thermal stability by few degrees. This may have resulted from the molecular structure of B–CD. When the active ingredient is included into the CD cavity, the distance between the compounds caused by the intermolecular attractive forces, such as van der Waals interaction and hydro-phobic interaction, may be longer compared to the other CDs. Thus, steric congestion can make the inclusion complex unstable [34,35,36].
Due to thermal breakdown events, HP-B-CD (Figure 4) and ME-B-CD (Figure 5) achieved thermal weightlessness in a single phase. HP–B–CD+TICA and ME–B–CD+TICA inclusion complexes presented increased thermal stability compared to TICA, which indicates the better stability provided by the complexation process. This suggests the insertion of TICA in the CD cavity and the formation of inclusion complexes [34].
3.1.1. DSC Analysis
Heat flow versus temperature curve of TICA was determined using standard DSC. Figure 6 and Figure 7 show the heat-flow rate of TICA at a temperature range from 20 °C to 175 °C, with a 10 °C min-1 and 2.5 min–1 heating rate, respectively, showing both cooling and second heating runs.
During the first heating, the DSC curve displayed one sharp endothermic peak (Figure 6, curve A) with an onset at 137.4 °C and a heat of fusion Δhm = 81.4 J g–1 due to the melting process. The fusion parameters values are similar to those reported by Yayé et al. [37] (onset at 136.2 °C and an enthalpy of fusion Δh = 81 J g–1 due to melting) and Inam et al. [38] (exhibiting a sharp endothermal effect at 137.5 °C). The onset temperature is few degrees lower than that reported by Lobo et al. [39] (onset at 138.92 °C). The PXRD data confirm the crystalline nature of the sample.
During the cooling run (Figure 6, curve B) from the molten state, a glass transition event is observed with Tgon cooling at 45.1 °C and a change of heat capacity (Δcp) at Tg of 0.28 J g–1 °C–1. A glass transition is observed on the second heating run (Figure 3a, curve C) at 50.7 °C with a Δcp = 0.40 J g–1 °C–1 overlapped with a low-intensity enthalpy recovery peak. Due to the physical aging process of TICA during cooling and heating below the glass transition, the value of Tg and estimated Δcp during the heating run is different than during cooling run [40].
By changing the heating rate from 10 °C min-1 to 2.5 °C min-1 different thermal behavior is observed. On the first heating (Figure 7, curve A), besides the first sharp endothermic peak with an onset at Tm1 = 137.2 °C and a heat of fusion Δhm1 = 82.28 J g–1 caused by the melting process, there is a second lower intensity endothermic peak with an onset at Tm2 = 150.8 °C and a heat of fusion Δhm2 = 4.35 J g–1 it may suggest some other polymorphic form creation.
Figure 8, Figure 9 and Figure 10 show the heat-flow rates of starting materials (as reference) and their ICs at a temperature range from 20 °C to 180 °C, with a 10 °C min-1 heating rate. DSC curves of CDs displayed broad endotherms around 100 °C due to water loss, as also reported by Novac et al. [41].
B–CD results show a broad endothermic peak, associated with water loss, with an onset at T = 85.4 °C and a heat of fusion Δh = 422.6 J g–1. The results are similar to the general observations by Pralhad and Rajendrakumar [42].
A broad endothermic peak, corresponding to the release of water, with an onset at T = 66.2 °C and a change of enthalpy Δh = 170.9 J g–1 was obtained for HP–B–CD. The DSC thermogram of HP–B–CD was similar to previously published studies [43,44,45].
Also, on the thermogram of the third CD, ME–B–CD, a broad endothermic effect with an onset at T = 52.5 °C and a heat of fusion Δh = 42.91 J g–1 was observed, similar to the data obtained by Ribeiro et al. and Zoppi et al. [46,47].
Based on the DSC results, no TICA endothermal peak at 137.4 °C can be noticed for the powder obtained by the freeze-drying method, proving the amorphous character of the sample. This could be explained by an entrapment in the inner cavity of the CD which leads to a reduction in drug crystallinity, or a possibly dispersion on a molecular level in the solid product, as suggested by Novac et al. [48].
The findings suggest that kneading and, in particular, freeze-drying methods are effective strategies for the formulation of TICA ICs with HP–B–CD and ME–B–CD, in 1:1 molar ratio. Concerning the DSC results in Figure 8, Figure 9 and Figure 10, the melting peak of TICA and the dehydration peaks of the CDs were displayed in the co-precipitation method endotherms, which indicated an absence of interactions between TICA and CDs in such systems. Therefore, the co-precipitation method produced no complexation between Ticagrelor and CDs in the 1:1 molar ratio in these systems. These observations are supported by those obtained from PXRD, TGA and SEM analyses.
3.1.3. TMDSC Analysis
For more accurate measurements TMDSC analysis was performed, in order to analyze the polymorphic forms of TICA. Figure 11 and Figure 12 show the total, reversing and non-reversing heat flows, as a function of temperature for pure TICA.
Figure 11 shows the melting process in all three curves. The total heat-flow curve of TICA revealed a melting endotherm with two sharp melting peaks that corresponded to the melting points of the two distinct polyforms. The analogous melting behavior was also noticed in the corresponding reversing and non-reversing curves, respectively. The TMDSC non-reversing curve also indicated that TICA exhibited a clear cold-crystallization exotherm at 138.14 °C.
On the second run, represented by Figure 12, the total heat flow curve shows the glass transition followed by the cold crystallization peak. This is followed by the continuous melting and recrystallization process of these newly formed crystals. The endothermic signals contribute to both reversible and non-reversible scans, while the crystallization exotherms can only be detected in the non-reversible signal.
In conclusion, the occurrence of double melting peaks in the DSC thermograms was confirmed by the TMDSC analysis. As a result, all of the findings presented above corroborated TICA's double-melting behavior.
3.1.4. SEM Analysis
The morphologies of pure materials and prepared ICs were examined using scanning electron microscopy SEM. By comparing the microscopic aspects of the powders, SEM can be used as a supporting analysis method to determine whether the ICs were created. Different forming procedures have resulted in powders with different morphologies.
SEM photographs of pure compounds (TICA and CDs), PMs, freeze-drying, kneading and co-precipitate products are displayed in Figure 13, Figure 14, Figure 15, Figure 16, Figure 17, Figure 18 and Figure 19, at various magnifications. TICA crystals were discovered to be irregular in shape, with dimensions ranging from 1 to 20 micrometers, as seen in both images from Figure 13.
The surface morphology of B–CD, shown in Figure 14, appears as crystalline particles with a parallelogram form and a rough surface, as previously described by Ficarra et al. [49]. HP–B–CD and ME–B–CD were found to be porous spherical structures, as demonstrated in research conducted by Novac et al. [41] and Figueiras et al. [50].
The three PMs (Figure 15) are distinguished by the evident presence of particles from both components (CDs embedded with TICA) which have a morphology similar to that of the individual pure compounds, with no significant changes in shape or size. As a result, in the solid form, there are no obvious interactions between the two species.
In contrast, drastic changes in particles morphology and shape were observed in products prepared by freeze-drying method (Figure 16). SEM images of the proposed ICs revealed compact and uniform structures, indicating a strong interaction between TICA and all CDs in the solid state.
Increased magnification (Figure 10) revealed that freeze-dried products had a less crystalline structure with a soft and fluffy appearance, with no distinctions between crystals of single components.
In the case of kneading products (Figure 18) it was seen that CD shells are filled with TICA particles. Apart from this encapsulation, it was possible to identify TICA particles and CD fragments that were still present in the systems.
The morphology of the mixtures formed by co-precipitation approach (Figure 19) was discovered to be like homogeneous blocks compared to the microphotographs of the compounds obtained by the freeze-drying process.
Among the techniques of production, kneading appears to have resulted in the development of new aggregates between TICA and CDs, whereas freeze-drying may have provided a true complexation process. SEM analysis is insufficient to confirm the development of an inclusion complex, but it is a useful tool for demonstrating the affinity between two components and the possibility of forming homogeneous samples. These modifications are supported by TGA, DSC, and PXRD studies.
3.1.5. PXRD Analysis
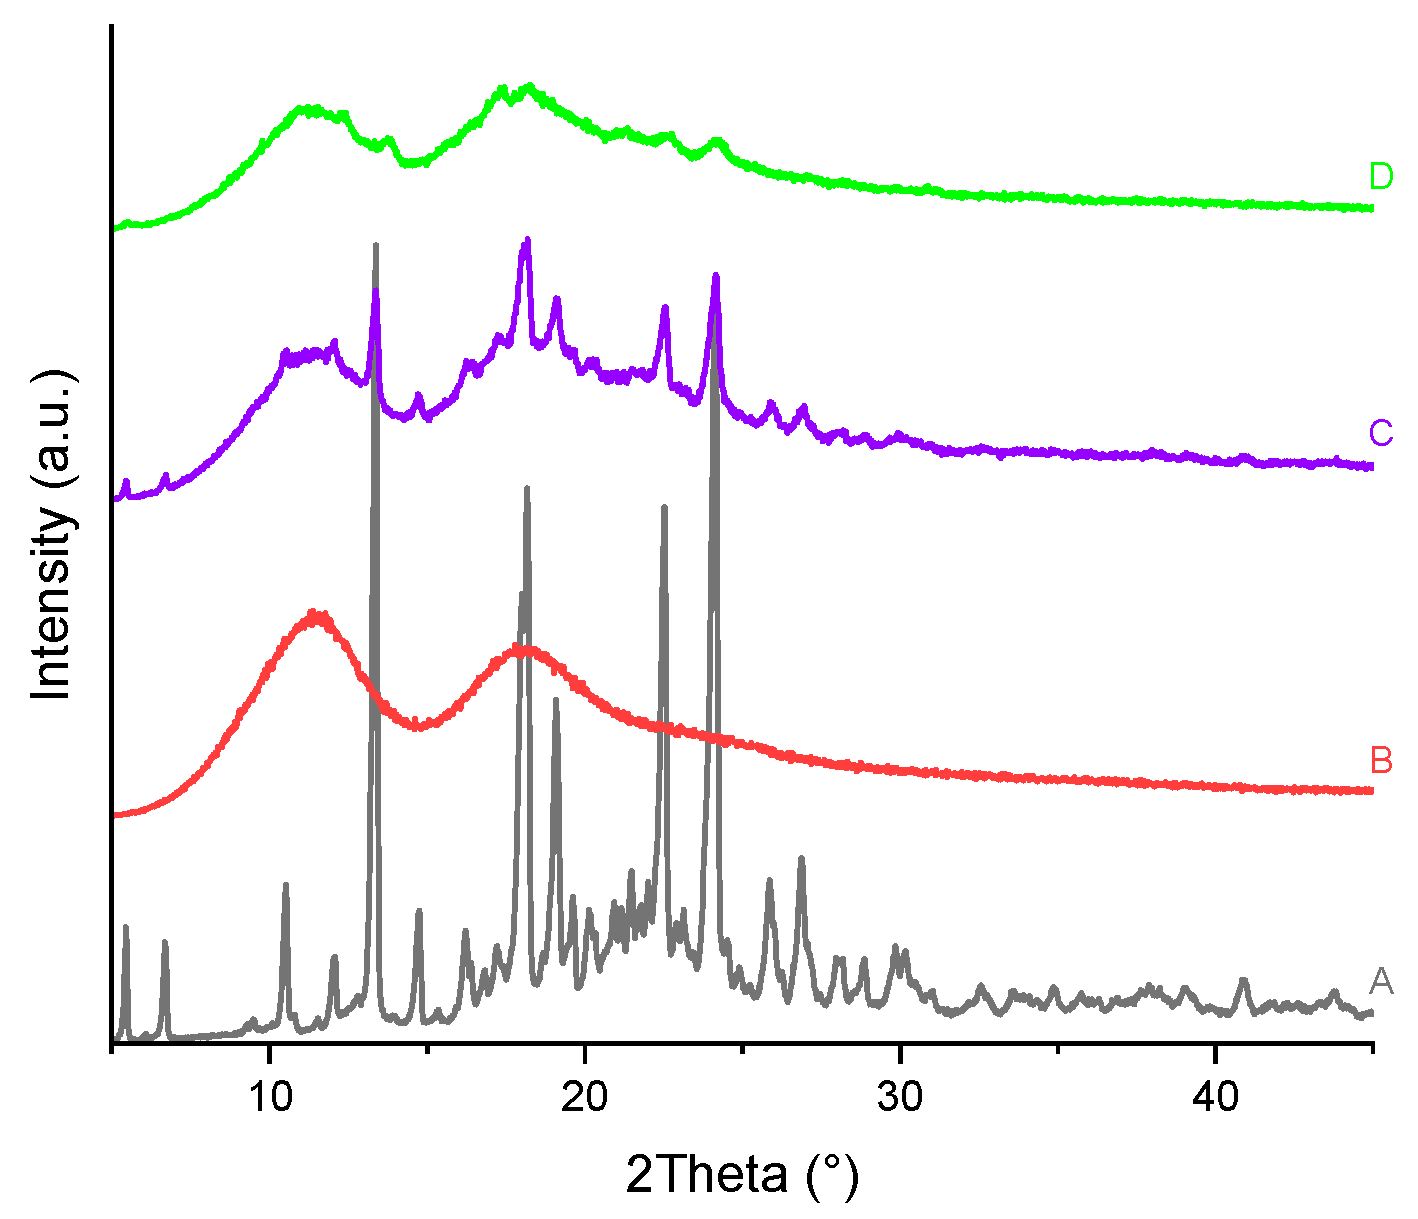
PXRD patterns of TICA, CDs, as well as TICA–CDs complexes produced by freeze-drying and kneading methods are presented in Figure 20, Figure 21 and Figure 22 , X-ray diffraction technique being an essential approach for confirming TICA amorphization [51]. Considering the unsatisfactory TGA, DSC and SEM results obtained for the compounds produced via the co-precipitation procedure, their PXRD analysis was no longer performed.
The diffractogram of the pure drug revealed a series of sharp peaks, indicating its crystalline form, described also by Ren et al. [10]. The B–CD diffractogram exhibited several intense diffraction peaks, also indicating its crystalline nature, proved also by Novac et al. [48].
The PXRD diffractograms of HP-B-CD and ME-B-CD showed that the CDs are amorphous, as evidenced by the "halo" pattern.
All freeze-drying and kneading formulations resulted in broader peaks, indicating reciprocal solid-state interaction and the possibility of IC formation between TICA and CDs. The kneading procedure lowered TICA and CDs peaks while superimposing portions of their characteristic peaks on the complex's amorphous pattern, which can be explained by partial inclusion.
PXRD patterns of TICA+HP–B–CD and TICA+ME–B–CD complexes obtained using the freeze-drying approach may explain incorporation in the amorphous lattice of the CDs, which acts as a "host," because the drug's distinctive peaks can no longer be distinguished. In the TICA+B–CD IC obtained by this procedure, some characteristic peaks of the individual compounds were still detectable, showing that no true IC was formed [48]. The inclusion complexes' diffractograms also reveal new peaks. This finding can be explained by the formation of new molecules.
4. Conclusion
Formulations of TICA and three types of CDs (B–CD, HP–B–CD and ME–B–CD) in a molar ratio of 1:1 were accomplished by three methods: freeze-drying, co-precipitation and kneading. The individual chemicals, physical mixtures, and inclusion complexes all underwent the same physical-chemical investigations.
TGA, DSC, SEM, and PXRD investigations were conducted to validate the possibility of inclusion complex development. Powder X-ray diffraction patterns revealed that the CD fingerprint is still present in co-precipitation systems, however it is significantly reduced in kneading combinations. In contrast, the PXRD patterns of the freeze-drying formulations showed an amorphous character, with fewer B-CD characteristics. The thermograms recorded in the temperature range of 20 °C to 400 °C revealed the nearly complete disappearance of TICA and CDs melting peaks. As a result, all analytical tests confirmed that TICA-CD inclusion complexes with CDs in a 1:1 molar ratio could be generated by kneading and, in particular, freeze-drying methods.
It is likely that ticagrelor amorphization that incorporate inclusion complexes will enhance the API's rate of dissolution, resulting in increased bioavailability. Future research will examine this issue further by creating tablets with TICA-CD inclusion complexes and assessing how they dissolve at different pH levels. Based on this conclusion, we can expect a reduction in drug dosage administration and, as a result, a lower incidence of negative side effects. Building on this finding, it is suggested that lowering the therapeutic dose and increasing bioavailability are significant factors in lowering therapeutic expenses. Because less pharmaceutical waste is produced as a result of reduced dosage consumption, this approach not only improves the sustainability of the pharmaceutical industry but also aids in waste reduction.
Author Contributions
Conceptualization, M.L.M.; methodology, E.A.O and M.S.; software, M.L.M and M.S.; validation, E.A.O., M.S., J.L., and D.D.; formal analysis, M.L.M, M.S. and J.L.; investigation, M.L.M.; resources, E.A.O., I.S., M.S., J.L., and D.D.; data curation, M.L.M.; writing— M.L.M.; writing— review and editing, E.A.O., V.A., I.S., M.S., J.L., and D.D.; visualization, M.L.M., M.S and J.L.; supervision, D.D.; All authors have read and agreed to the published version of the manuscript.
Acknowledgments
Publication of this paper was supported by the University of Medicine and Pharmacy Carol Davila, through the institutional program Publish not Perish. This research was supported by “Carol Davila” University of Medicine and Pharmacy Bucharest, Romania through Project Contract no. 33PFE/2021 funded by the Ministry of Research and Innovation within PNCDI III, Program 1—Development of the National RD system, Subprogram 1.2—Institutional Performance—RDI excellence funding projects and the by the Central European Exchange Program for University Studies mobility grants, through Contract no. M-1113-2122-153335 funded by the Central European Knowledge Alliance for Teaching, Learning & Research in Pharmaceutical Technology (CEKA PharmTech), Program RS-1113-05-2122.
Conflicts of Interest
The authors declare no conflicts of interest.
References
- Shekunov, B.; Montgomery, E.R. Theoretical Analysis of Drug Dissolution: I. Solubility and Intrinsic Dissolution Rate. J Pharm Sci 2016, 105, 2685–2697. [Google Scholar] [CrossRef] [PubMed]
- Yun, T.-H.; Lee, J.-G.; Bang, K.-H.; Cho, J.-H.; Kim, K.-S. A Quaternary Solid Dispersion System for Improving the Solubility of Olaparib. Solids 2025, 6, 1. [Google Scholar] [CrossRef]
- Paudel, A.; Van Den Mooter, G. Influence of Solvent Composition on the Miscibility and Physical Stability of Naproxen/PVP K 25 Solid Dispersions Prepared by Cosolvent Spray-Drying. Pharm Res 2012, 29, 251–270. [Google Scholar] [CrossRef] [PubMed]
- Patel, B.B.; Patel, J.K.; Chakraborty, S.; Shukla, D. Revealing Facts behind Spray Dried Solid Dispersion Technology Used for Solubility Enhancement. Saudi Pharmaceutical Journal 2015, 23, 352–365. [Google Scholar] [CrossRef] [PubMed]
- Napierała, O.; Marin, L.; Pieczuro, J.; Lulek, J.; Skotnicki, M. Thermal Analysis of a Co-Amorphous Olanzapine-Tryptophan System Obtained by a Spray Drying Process. Macedonian Pharmaceutical Bulletin 2023, 69, 31–32. [Google Scholar] [CrossRef]
- Singh, A.; Van den Mooter, G. Spray Drying Formulation of Amorphous Solid Dispersions. Adv Drug Deliv Rev 2016, 100, 27–50. [Google Scholar] [CrossRef]
- Marin, L.M.; Sîrbu, I.; Ozon, E.A.; Skotnicki, M.; Lulek, J.; Chivu, R.D.; Drăgănescu, D. TICAGRELOR – MECHANISM OF ACTION AND ITS IMPACT ON DRUG EFFICACY. Farmacia 2024, 72, 273–279. [Google Scholar] [CrossRef]
- Kim, S.J.; Lee, H.K.; Na, Y.G.; Bang, K.H.; Lee, H.J.; Wang, M.; Huh, H.W.; Cho, C.W. A Novel Composition of Ticagrelor by Solid Dispersion Technique for Increasing Solubility and Intestinal Permeability. Int J Pharm 2019, 555, 11–18. [Google Scholar] [CrossRef]
- Rysz, J. Ticagrelor-A New Platelet Aggregation Inhibitor in Patients with Acute Coronary Syndromes. An Improvement of Other Inhibitors? Med Sci Monit 2009, MS24–30. [Google Scholar]
- Ren, Y.; Shen, J.; Yu, K.X.; Phan, C.U.; Chen, G.X.; Liu, J.Y.; Hu, X.; Feng, J.Y. Impact of Crystal Habit on Solubility of Ticagrelor. Crystals (Basel) 2019, 9. [Google Scholar] [CrossRef]
- Saokham, P.; Muankaew, C.; Jansook, P.; Loftsson, T. Solubility of Cyclodextrins and Drug/Cyclodextrin Complexes. Molecules 2018, 23. [Google Scholar] [CrossRef] [PubMed]
- Yang, S.; Wu, Y.; Zhang, H.; Sun, J.; Liu, Y. Solubility Measurement of Crystal Form II and Form v Ticagrelor in Several Pure Organic Solvents. J Chem Eng Data 2021, 66, 2022–2033. [Google Scholar] [CrossRef]
- Jung, M.; Jin, M.; Jeon, W.J.; Lee, H.S.; Kim, H.; Won, J.H.; Yoo, H.; Bai, H.W.; Han, S.C.; Suh, H.; et al. Development of a Long-Acting Tablet with Ticagrelor High-Loaded Nanostructured Lipid Carriers. Drug Deliv Transl Res 2023, 13, 1212–1227. [Google Scholar] [CrossRef] [PubMed]
- Srivastava, A.; Khan, M.A.; Bedi, S.; Bhandari, U. DESIGN, OPTIMIZATION, AND CHARACTERIZATION OF A NOVEL AMORPHOUS SOLID DISPERSION FORMULATION FOR ENHANCEMENT OF SOLUBILITY AND DISSOLUTION OF TICAGRELOR. International Journal of Applied Pharmaceutics 2023, 15, 296–305. [Google Scholar] [CrossRef]
- Sohn, J.S.; Choi, J.S. A Study on the Improved Dissolution and Permeability of Ticagrelor with Sodium Oleate in a Ternary System. J Mol Liq 2022, 361. [Google Scholar] [CrossRef]
- Alsaad, A.A.A. Solubility Enhancement of Ticagrelor by Different Complexation Methods. Journal for ReAttach Therapy and Developmental Diversities 2022, 5, 494–505. [Google Scholar]
- V. B. Chaudhary; J. K. Patel CYCLODEXTRIN INCLUSION COMPLEX TO ENHANCE SOLUBILITY OF POORLY WATER SOLUBLE DRUGS: A REVIEW. 2013, 4, 68–76. [CrossRef]
- Kim, D.H.; Jang, J.G.; Le, H.T.; Kim, J.Y.; Lim, C.W.; Kim, T.W. 6-Hydroxymethyltriazolyl-6-Deoxy-β-Cyclodextrin: A Highly Water Soluble and Structurally Well-Defined β-Cyclodextrin Click Cluster. Tetrahedron Lett 2012, 53, 5791–5795. [Google Scholar] [CrossRef]
- Mahmood, A.; Sharif, A.; Muhammad, F.; Sarfraz, R.M.; Abrar, M.A.; Qaisar, M.N.; Anwer, N.; Amjad, M.W.; Zaman, M. Development and in Vitro Evaluation of (β-Cyclodextrin-g-Methacrylic Acid)/Na+-Montmorillonite Nanocomposite Hydrogels for Controlled Delivery of Lovastatin. Int J Nanomedicine 2019, 14, 5397–5413. [Google Scholar] [CrossRef]
- Kurkov, S. V.; Loftsson, T. Cyclodextrins. Int J Pharm 2013, 453, 167–180. [Google Scholar] [CrossRef]
- Sharapova, A. V.; Ol’khovich, M. V.; Blokhina, S. V. Integrative Approach for Improved Dofetilide Solubility Using β-Cyclodextrin and Two Its Substituted Derivatives: Solutions and Solid Dispersions. Colloids Surf A Physicochem Eng Asp 2024, 698. [Google Scholar] [CrossRef]
- Commey, K.L.; Enaka, A.; Nakamura, R.; Yamamoto, A.; Tsukigawa, K.; Nishi, K.; Iohara, D.; Hirayama, F.; Otagiri, M.; Yamasaki, K. Development of α-Cyclodextrin-Based Orally Disintegrating Tablets for 4-Phenylbutyrate. Pharmaceutics 2024, 16. [Google Scholar] [CrossRef] [PubMed]
- Carneiro, S.B.; Duarte, F.Í.C.; Heimfarth, L.; Quintans, J.D.S.S.; Quintans-Júnior, L.J.; Júnior, V.F.D.V.; De Lima, Á.A.N. Cyclodextrin-Drug Inclusion Complexes: In Vivo and in Vitro Approaches. Int J Mol Sci 2019, 20. [Google Scholar] [CrossRef]
- Sarabia-Vallejo, Á.; Caja, M. del M.; Olives, A.I.; Martín, M.A.; Menéndez, J.C. Cyclodextrin Inclusion Complexes for Improved Drug Bioavailability and Activity: Synthetic and Analytical Aspects. Pharmaceutics 2023, 15. [Google Scholar] [CrossRef]
- Kali, G.; Haddadzadegan, S.; Bernkop-Schnürch, A. Cyclodextrins and Derivatives in Drug Delivery: New Developments, Relevant Clinical Trials, and Advanced Products. Carbohydr Polym 2024, 324. [Google Scholar] [CrossRef]
- Singh, P.; Mahar, R. Cyclodextrin in Drug Delivery: Exploring Scaffolds, Properties, and Cutting-Edge Applications. Int J Pharm 2024, 662. [Google Scholar] [CrossRef]
- Hădărugă, N.G.; Bandur, G.N.; David, I.; Hădărugă, D.I. A Review on Thermal Analyses of Cyclodextrins and Cyclodextrin Complexes. Environ Chem Lett 2019, 17, 349–373. [Google Scholar] [CrossRef]
- Abarca, R.L.; Rodríguez, F.J.; Guarda, A.; Galotto, M.J.; Bruna, J.E. Characterization of Beta-Cyclodextrin Inclusion Complexes Containing an Essential Oil Component. Food Chem 2016, 196, 968–975. [Google Scholar] [CrossRef]
- Conceição, J.; Adeoye, O.; Cabral-Marques, H.M.; Lobo, J.M.S. Cyclodextrins as Excipients in Tablet Formulations. Drug Discov Today 2018, 23, 1274–1284. [Google Scholar] [CrossRef]
- Jambhekar, S.S.; Breen, P. Cyclodextrins in Pharmaceutical Formulations II: Solubilization, Binding Constant, and Complexation Efficiency. Drug Discov Today 2016, 21, 363–368. [Google Scholar] [CrossRef]
- Jambhekar, S.S.; Breen, P. Cyclodextrins in Pharmaceutical Formulations I: Structure and Physicochemical Properties, Formation of Complexes, and Types of Complex. Drug Discov Today 2016, 21, 356–362. [Google Scholar] [CrossRef]
- Carrier, R.L.; Miller, L.A.; Ahmed, I. The Utility of Cyclodextrins for Enhancing Oral Bioavailability. Journal of Controlled Release 2007, 123, 78–99. [Google Scholar] [CrossRef] [PubMed]
- Varganici, C.D.; Marangoci, N.; Rosu, L.; Barbu-Mic, C.; Rosu, D.; Pinteala, M.; Simionescu, B.C. TGA/DTA-FTIR-MS Coupling as Analytical Tool for Confirming Inclusion Complexes Occurrence in Supramolecular Host-Guest Architectures. J Anal Appl Pyrolysis 2015, 115, 132–142. [Google Scholar] [CrossRef]
- Gao, Y.A.; Li, Z.H.; Du, J.M.; Han, B.X.; Li, G.Z.; Hou, W.G.; Shen, D.; Zheng, L.Q.; Zhang, G.Y. Preparation and Characterization of Inclusion Complexes of β-Cyclodextrin with Ionic Liquid. Chemistry - A European Journal 2005, 11, 5875–5880. [Google Scholar] [CrossRef]
- Sandilya, A.A.; Natarajan, U.; Priya, M.H. Molecular View into the Cyclodextrin Cavity: Structure and Hydration. ACS Omega 2020, 5, 25655–25667. [Google Scholar] [CrossRef] [PubMed]
- Sambasevam, K.P.; Mohamad, S.; Sarih, N.M.; Ismail, N.A. Synthesis and Characterization of the Inclusion Complex of β-Cyclodextrin and Azomethine. Int J Mol Sci 2013, 14, 3671–3682. [Google Scholar] [CrossRef]
- Sadou Yayé, H.; Rietveld, I.B.; Barrio, M.; Secrétan, P.H.; Faucheron, A.; Karoui, M.; Tilleul, P.; Yagoubi, N.; Do, B. Investigating Therapeutic Usage of Combined Ticagrelor and Aspirin through Solid-State and Analytical Studies. European Journal of Pharmaceutical Sciences 2017, 107, 62–70. [Google Scholar] [CrossRef] [PubMed]
- Inam, M.; Wu, J.; Shen, J.; Phan, C.U.; Tang, G.; Hu, X. Preparation and Characterization of Novel Pharmaceutical Co-Crystals: Ticagrelor with Nicotinamide. Crystals (Basel) 2018, 8. [Google Scholar] [CrossRef]
- Shane, N.L.J.; Chamle, A.H.; Vasantharaju, *!!! REPLACE !!!*; Pai, A.; Pai, G.; Sathyanarayana, M.B. Fabrication and Solid State Characterization of Ticagrelor Co-Crystals with Improved Solubility and Dissolution. International Journal of Pharmaceutical Quality Assurance 2017, 8, 1–8. [Google Scholar] [CrossRef]
- Skotnicki, M.; Czerniecka-Kubicka, A.; Neilsen, G.; Woodfield, B.F.; Pyda, M. Application of Advanced Thermal Analysis for Characterization of Crystalline and Amorphous Phases of Carvedilol. J Pharm Biomed Anal 2022, 217. [Google Scholar] [CrossRef]
- Novac, M.; Musuc, A.M.; Ozon, E.A.; Sarbu, I.; Mitu, M.A.; Rusu, A.; Petrescu, S.; Atkinson, I.; Gheorghe, D.; Lupuliasa, D. Design and Evaluation of Orally Dispersible Tablets Containing Amlodipine Inclusion Complexes in Hydroxypropyl-β-Cyclodextrin and Methyl-β-Cyclodextrin. Materials 2022, 15. [Google Scholar] [CrossRef] [PubMed]
- Pralhad, T.; Rajendrakumar, K. Study of Freeze-Dried Quercetin-Cyclodextrin Binary Systems by DSC, FT-IR, X-Ray Diffraction and SEM Analysis. J Pharm Biomed Anal 2004, 34, 333–339. [Google Scholar] [CrossRef]
- Williams Iii, R.O.; Mahaguna, V.; Sriwongjanya, M. Characterization of an Inclusion Complex of Cholesterol and Hydroxypropyl-b-Cyclodextrin. 1998. [CrossRef]
- Rodríguez-Tenreiro, C.; Alvarez-Lorenzo, C.; Concheiro, A.; Torres-Labandeira, J.J. CHARACTERIZATION OF CYCLODEXTRIN-CARBOPOL INTERACTIONS BY DSC AND FTIR. J Therm Anal Calorim 2004, 77, 403–411. [Google Scholar] [CrossRef]
- Liu, J.; Qiu, L.; Gao, J.; Jin, Y. Preparation, Characterization and in Vivo Evaluation of Formulation of Baicalein with Hydroxypropyl-β-Cyclodextrin. Int J Pharm 2006, 312, 137–143. [Google Scholar] [CrossRef]
- Ribeiro, A.; Figueiras, A.; Santos, D.; Veiga, F. Preparation and Solid-State Characterization of Inclusion Complexes Formed between Miconazole and Methyl-β-Cyclodextrin. AAPS PharmSciTech 2008, 9, 1102–1109. [Google Scholar] [CrossRef]
- Zoppi, A.; Delrivo, A.; Aiassa, V.; Longhi, M.R. Binding of Sulfamethazine to β-Cyclodextrin and Methyl-β- Cyclodextrin. AAPS PharmSciTech 2013, 14, 727–735. [Google Scholar] [CrossRef]
- Novac, M.; Musuc, A.M.; Ozon, E.A.; Sarbu, I.; Mitu, M.A.; Rusu, A.; Gheorghe, D.; Petrescu, S.; Atkinson, I.; Lupuliasa, D. Manufacturing and Assessing the New Orally Disintegrating Tablets, Containing Nimodipine-Hydroxypropyl-β-Cyclodextrin and Nimodipine-Methyl-β-Cyclodextrin Inclusion Complexes. Molecules 2022, 27. [Google Scholar] [CrossRef]
- Ficarra, R.; Ficarra, P.; Di Bella, M.R.; Raneri, D.; Tommasini, S.; Calabrò, M.L.; Gamberini, M.C.; Rustichelli, C. Study of B-Blockers/b-Cyclodextrins Inclusion Complex by NMR, DSC, X-Ray and SEM Investigation. J Pharm Biomed Anal 2000, 23. [Google Scholar] [CrossRef] [PubMed]
- Figueiras, A.; Ribeiro, L.; Vieira, M.T.; Veiga, F. Preparation and Physicochemical Characterization of Omeprazole:Methyl-Beta- Cyclodextrin Inclusion Complex in Solid State. J Incl Phenom Macrocycl Chem 2007, 57, 173–177. [Google Scholar] [CrossRef]
- Willart, J.F.; Descamps, M. Solid State Amorphization of Pharmaceuticals. Mol Pharm 2008, 5, 905–920. [Google Scholar] [CrossRef]
Figure 1.
Chemical structure of: a) ticagrelor (TICA) – (1S,2S,3R,5S)-3-[7-{[(1R,2S)-2-(3,4-Difluorophenyl)cyclopropyl]amino}-5-(propylsulfanyl)-3H-[1,2,3]triazolo[4,5-d]pyrimidin-3-yl]-5-(2-hydroxyethoxy)-1,2-cyclopentanediol.
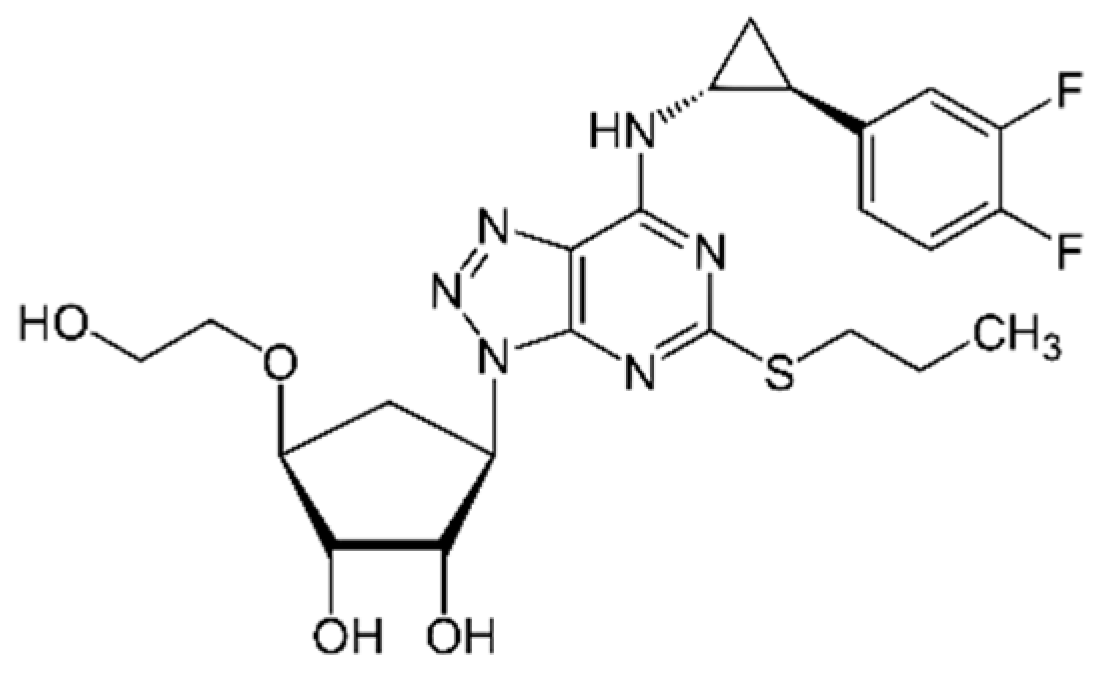
Figure 2.
Chemical structure of beta–cyclodextrin (B-CD).
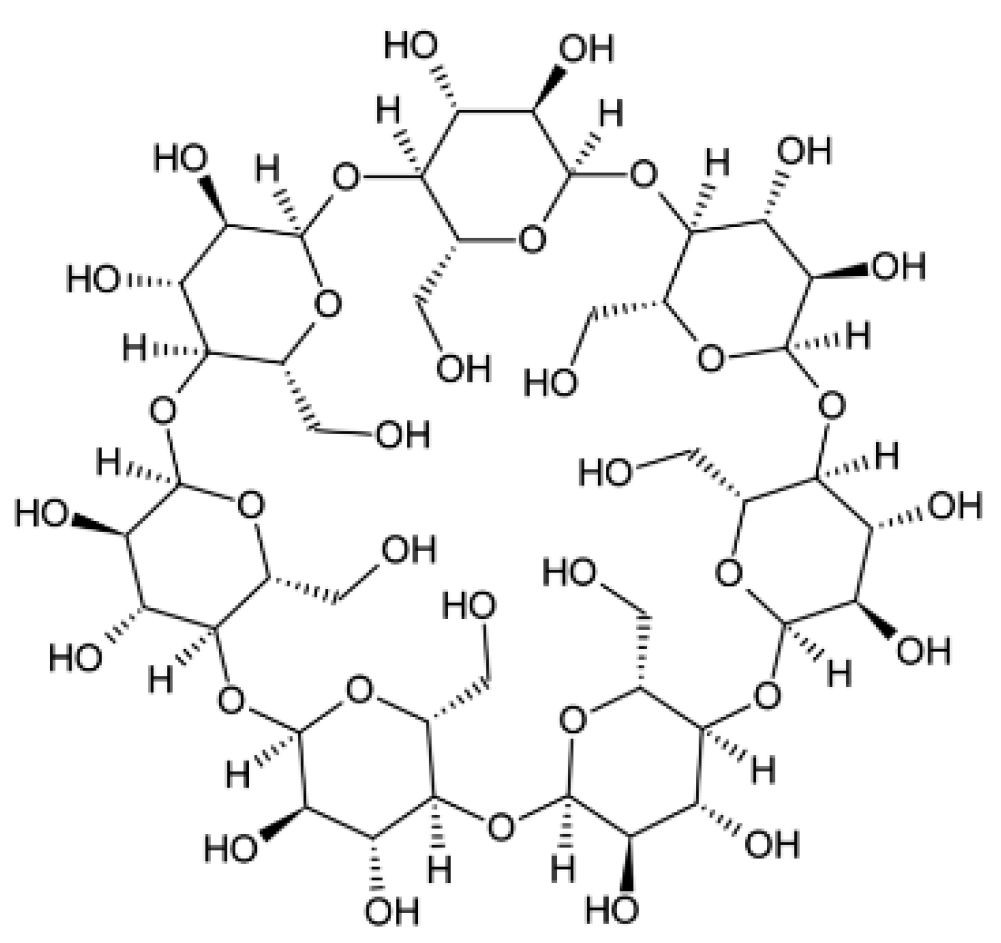
Figure 3.
TGA curves of TICA, B–CD and TICA+B–CD IC.
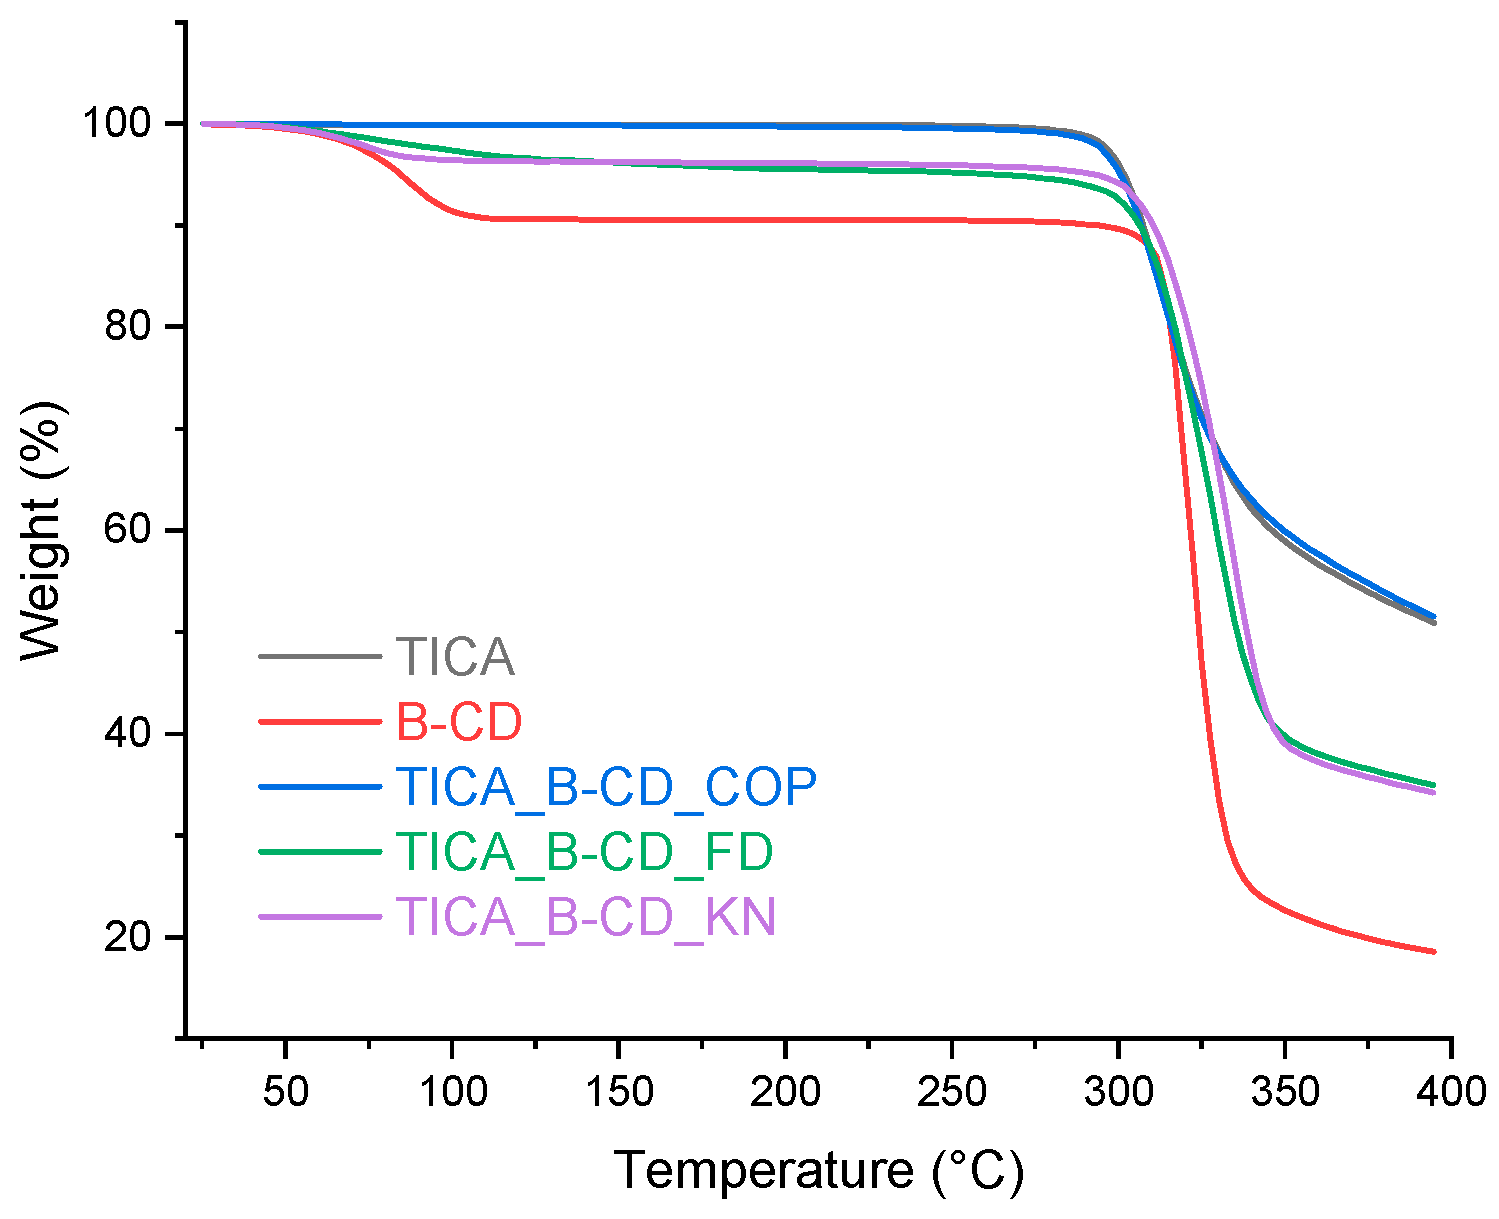
Figure 4.
TGA curves of TICA, HP–B–CD and TICA+HP–B–CD IC.
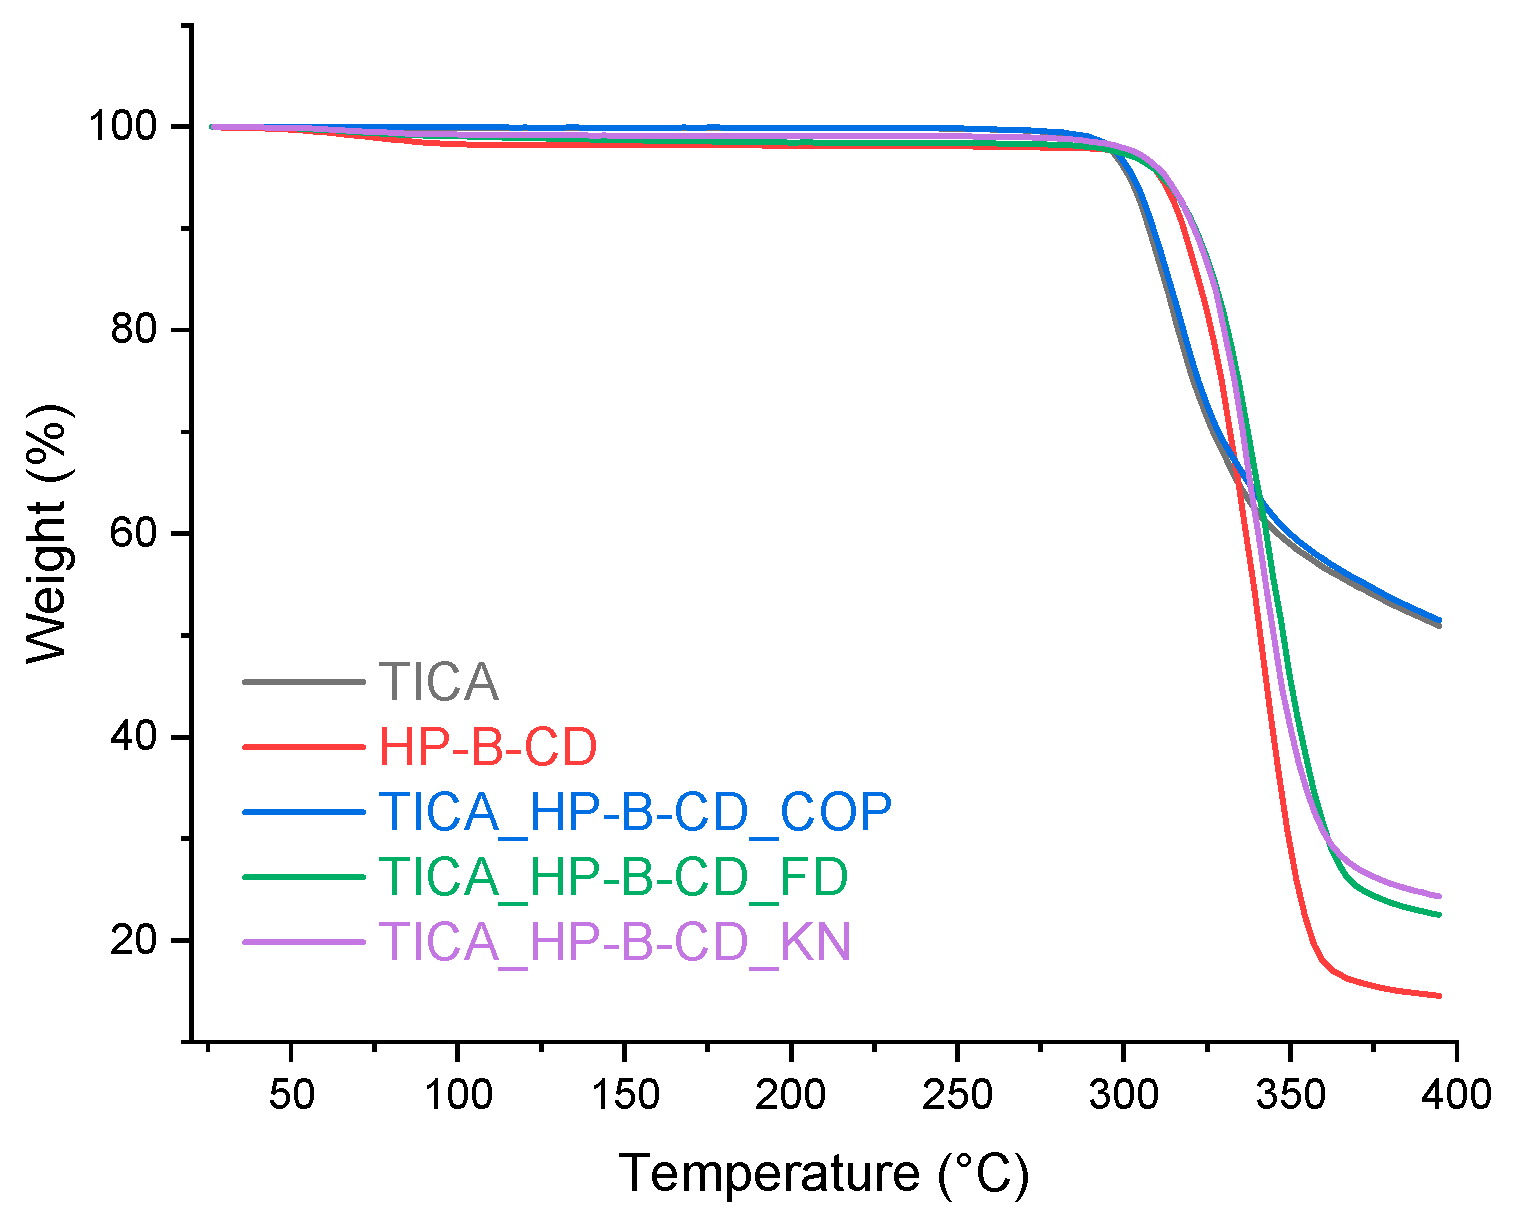
Figure 5.
TGA curves of TICA, ME–B–CD and TICA+ME–B–CD IC.
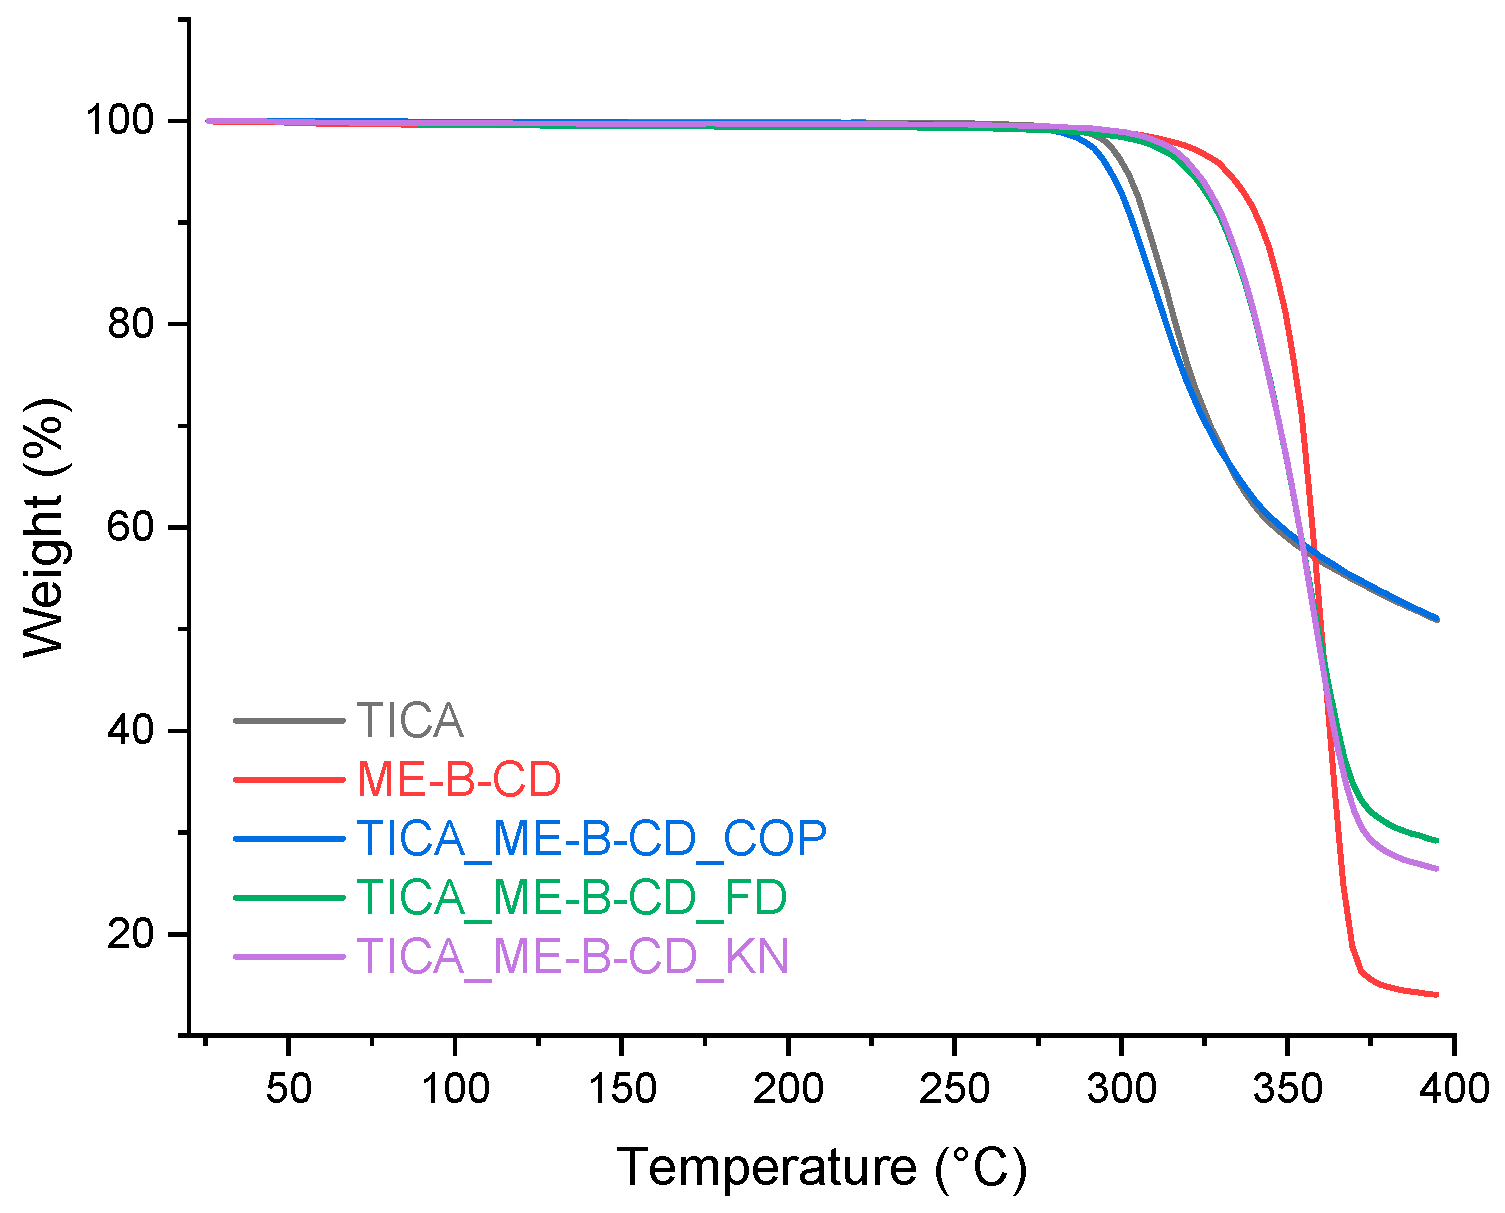
Figure 6.
Heat-flow curves of TICA showing (A) 1st heating (melting of crystalline material), (B) cooling (glass transition of amorphized material) and (C) 2nd heating run (glass transition with enthalpy relaxation of amorphous material). The runs were obtained at 10 °C min-1 heating rate.
Figure 6.
Heat-flow curves of TICA showing (A) 1st heating (melting of crystalline material), (B) cooling (glass transition of amorphized material) and (C) 2nd heating run (glass transition with enthalpy relaxation of amorphous material). The runs were obtained at 10 °C min-1 heating rate.
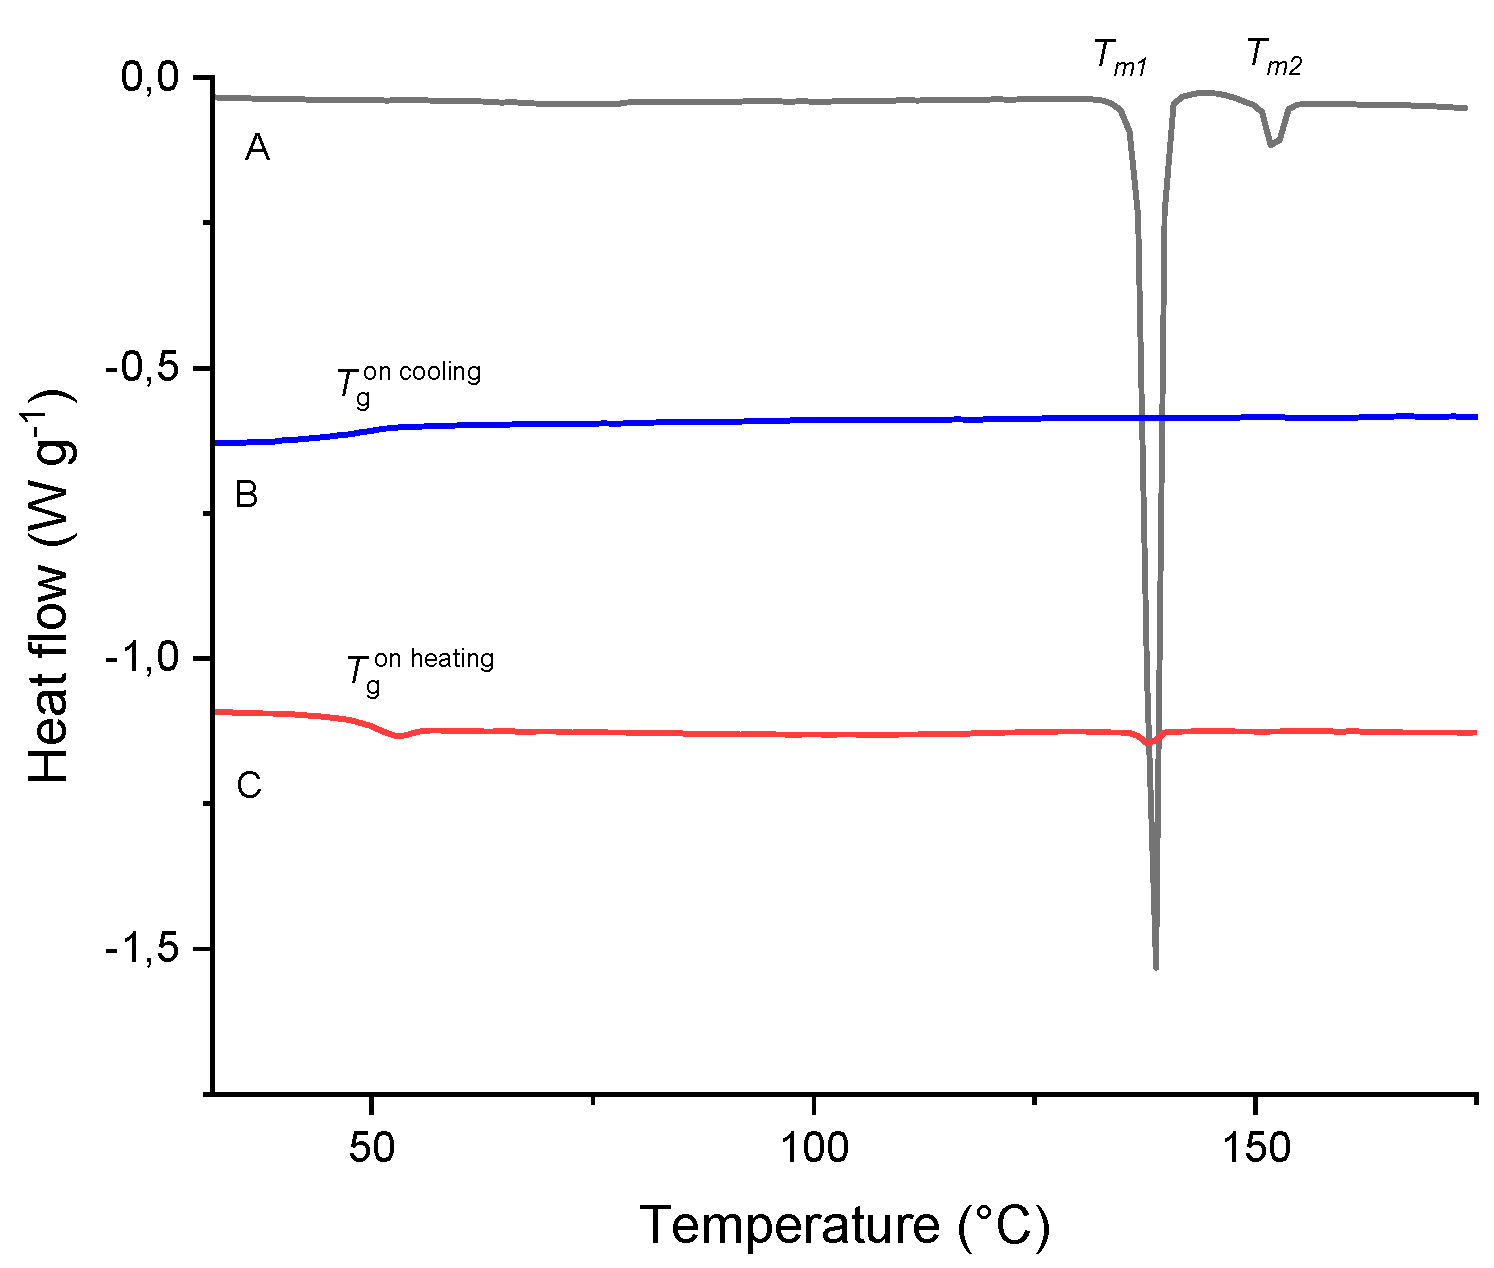
Figure 7.
Heat-flow curves of TICA showing (A) 1st heating (melting of crystalline material), (B) cooling (glass transition of amorphized material) and (C) 2nd heating run (glass transition with enthalpy relaxation of amorphous material). The runs were obtained at 2.5 °C min-1 heating rate.
Figure 7.
Heat-flow curves of TICA showing (A) 1st heating (melting of crystalline material), (B) cooling (glass transition of amorphized material) and (C) 2nd heating run (glass transition with enthalpy relaxation of amorphous material). The runs were obtained at 2.5 °C min-1 heating rate.
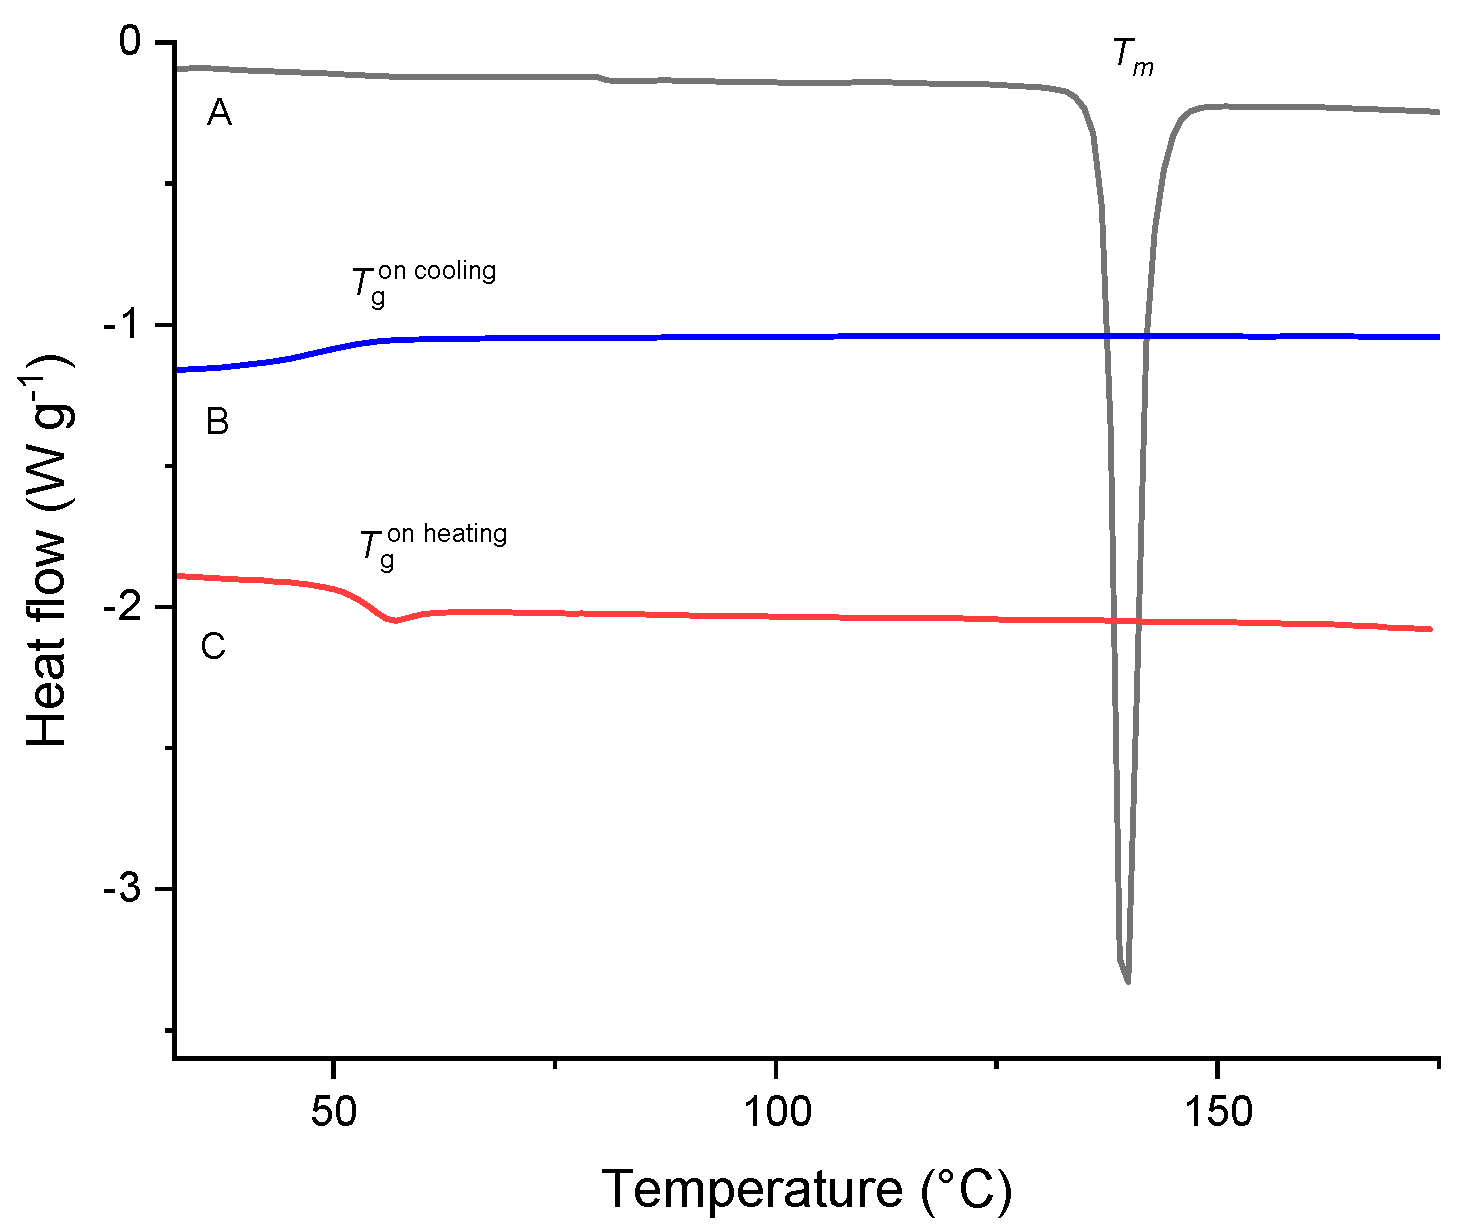
Figure 8.
DSC curves of TICA (curve A), B–CDs (curve E) and their prepared IC by: (B) co-precipitation, (C) kneading and (D) freeze-drying.
Figure 8.
DSC curves of TICA (curve A), B–CDs (curve E) and their prepared IC by: (B) co-precipitation, (C) kneading and (D) freeze-drying.
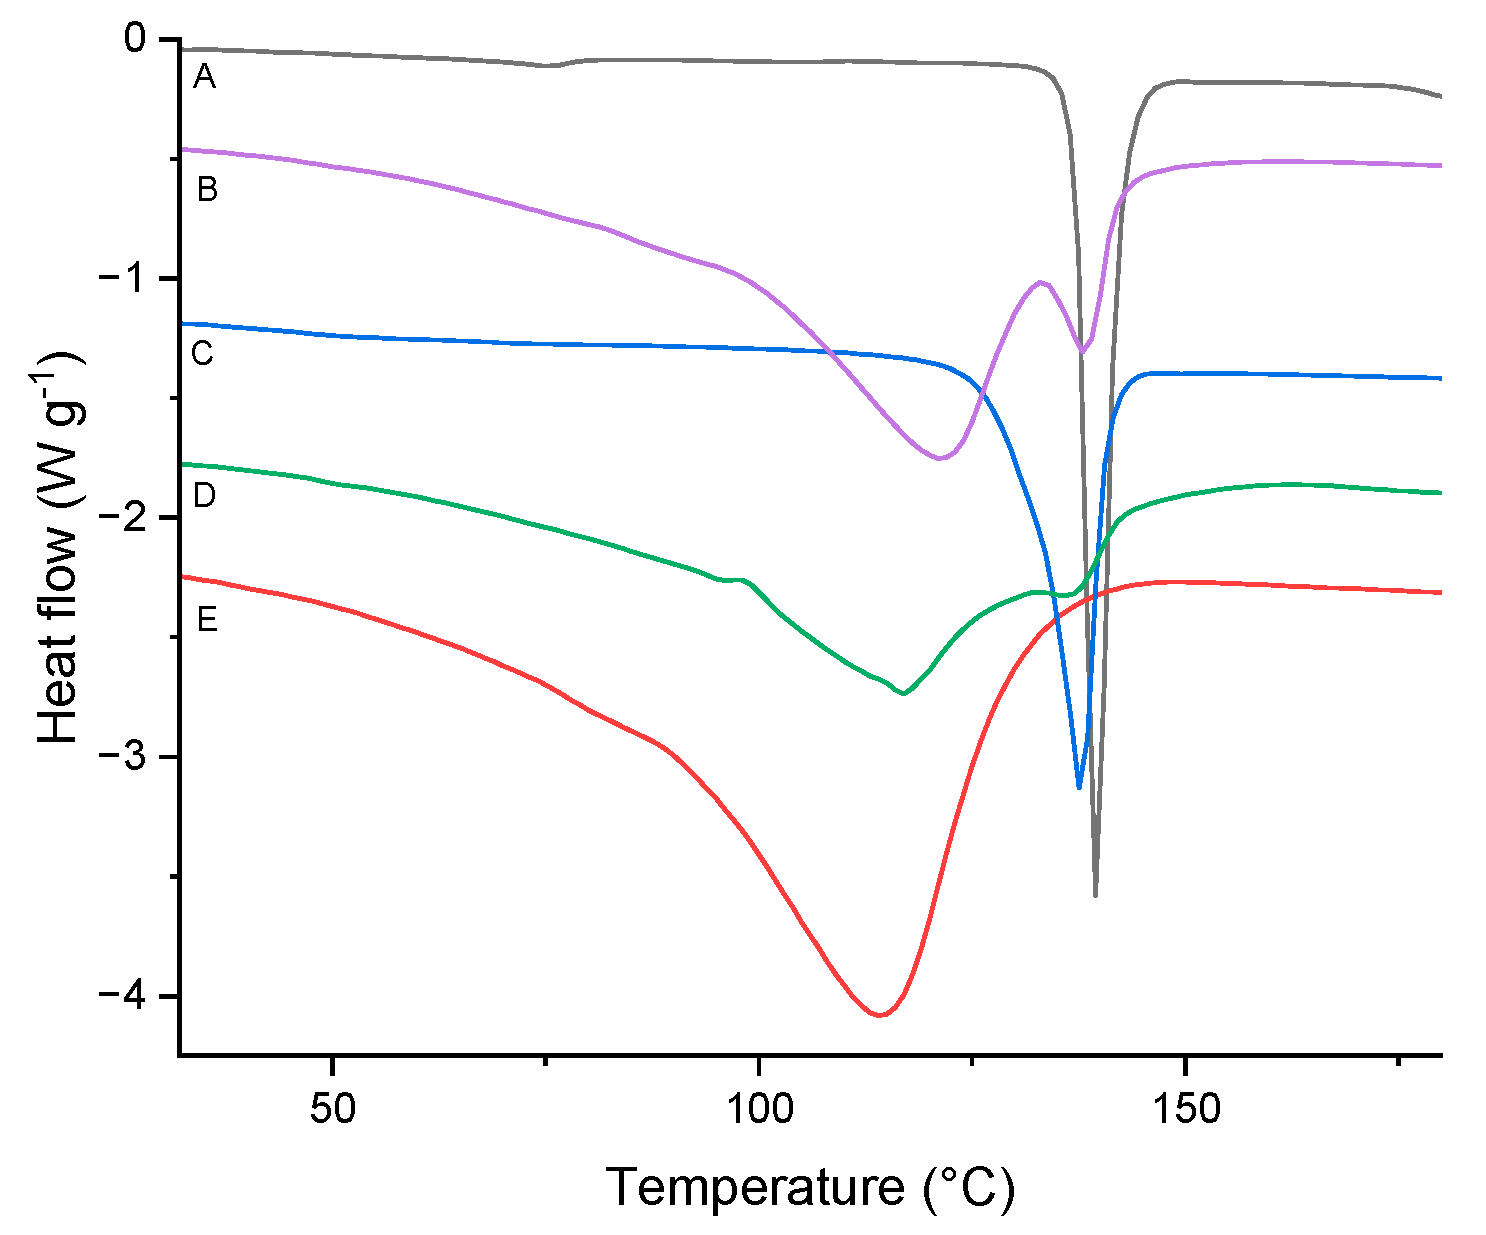
Figure 9.
DSC curves of TICA (curve A), HP–B–CDs (curve E) and their prepared IC by: (B) co-precipitation, (C) kneading and (D) freeze-drying.
Figure 9.
DSC curves of TICA (curve A), HP–B–CDs (curve E) and their prepared IC by: (B) co-precipitation, (C) kneading and (D) freeze-drying.
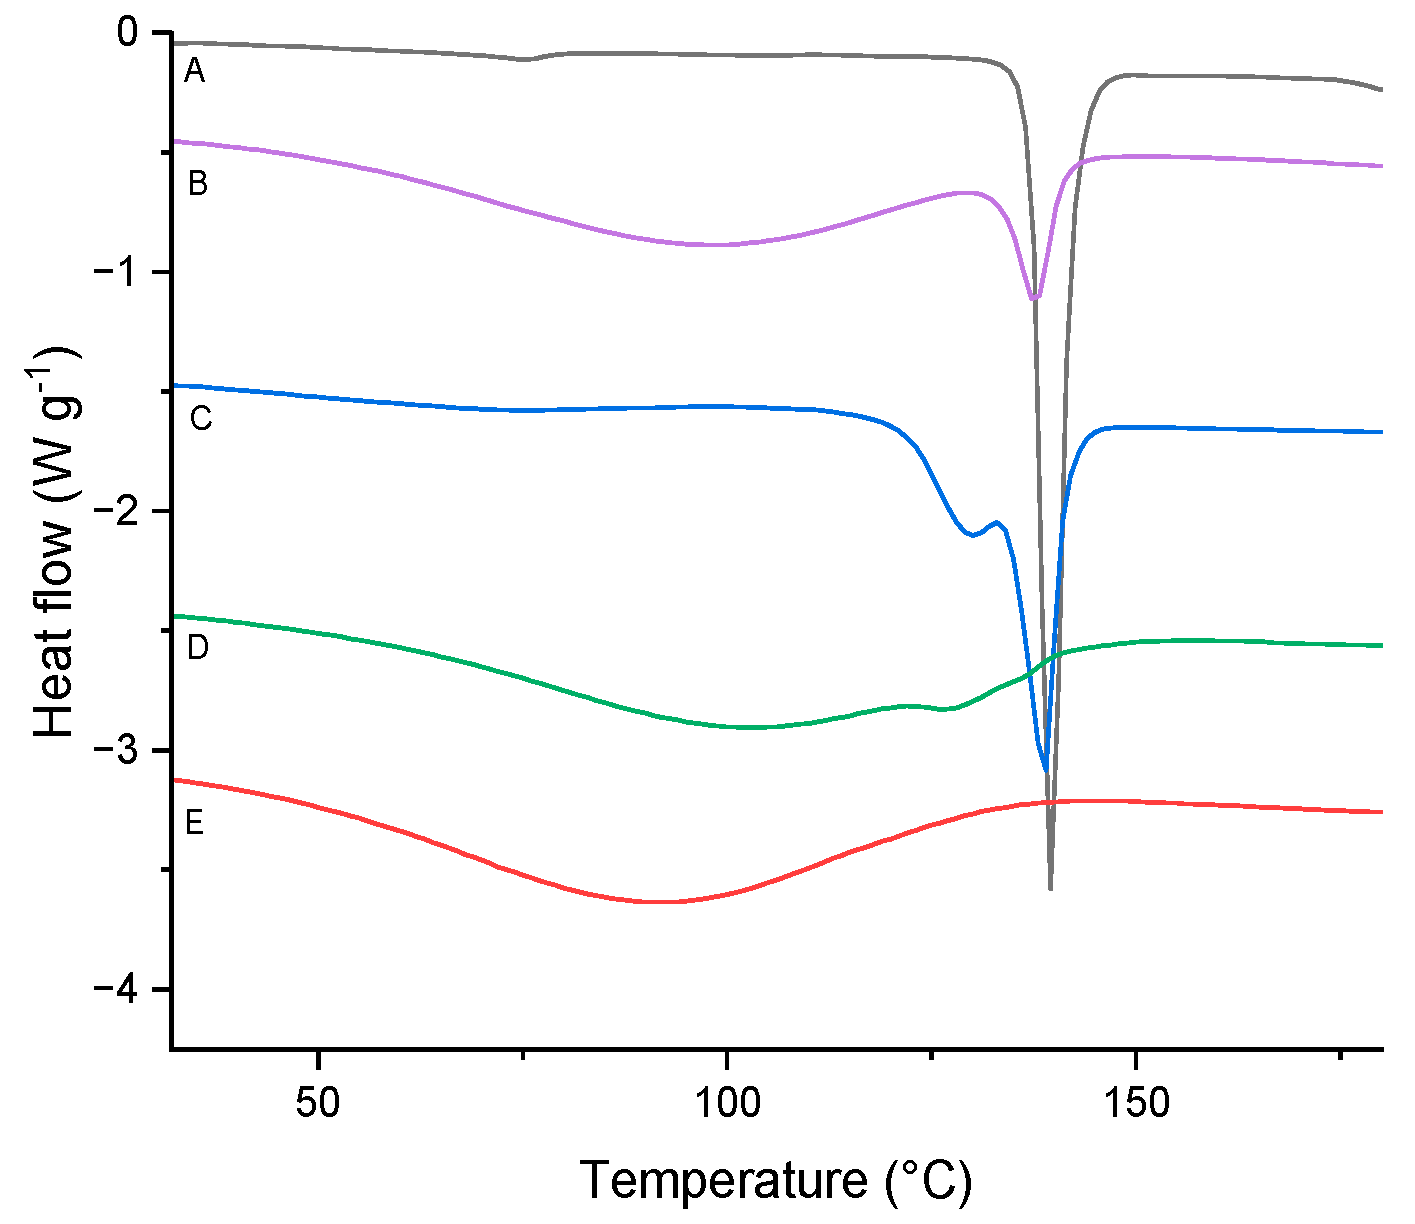
Figure 10.
DSC curves of TICA (curve A), ME–B–CDs (curve E) and their prepared IC by: (B) co-precipitation, (C) kneading and (D) freeze-drying.
Figure 10.
DSC curves of TICA (curve A), ME–B–CDs (curve E) and their prepared IC by: (B) co-precipitation, (C) kneading and (D) freeze-drying.
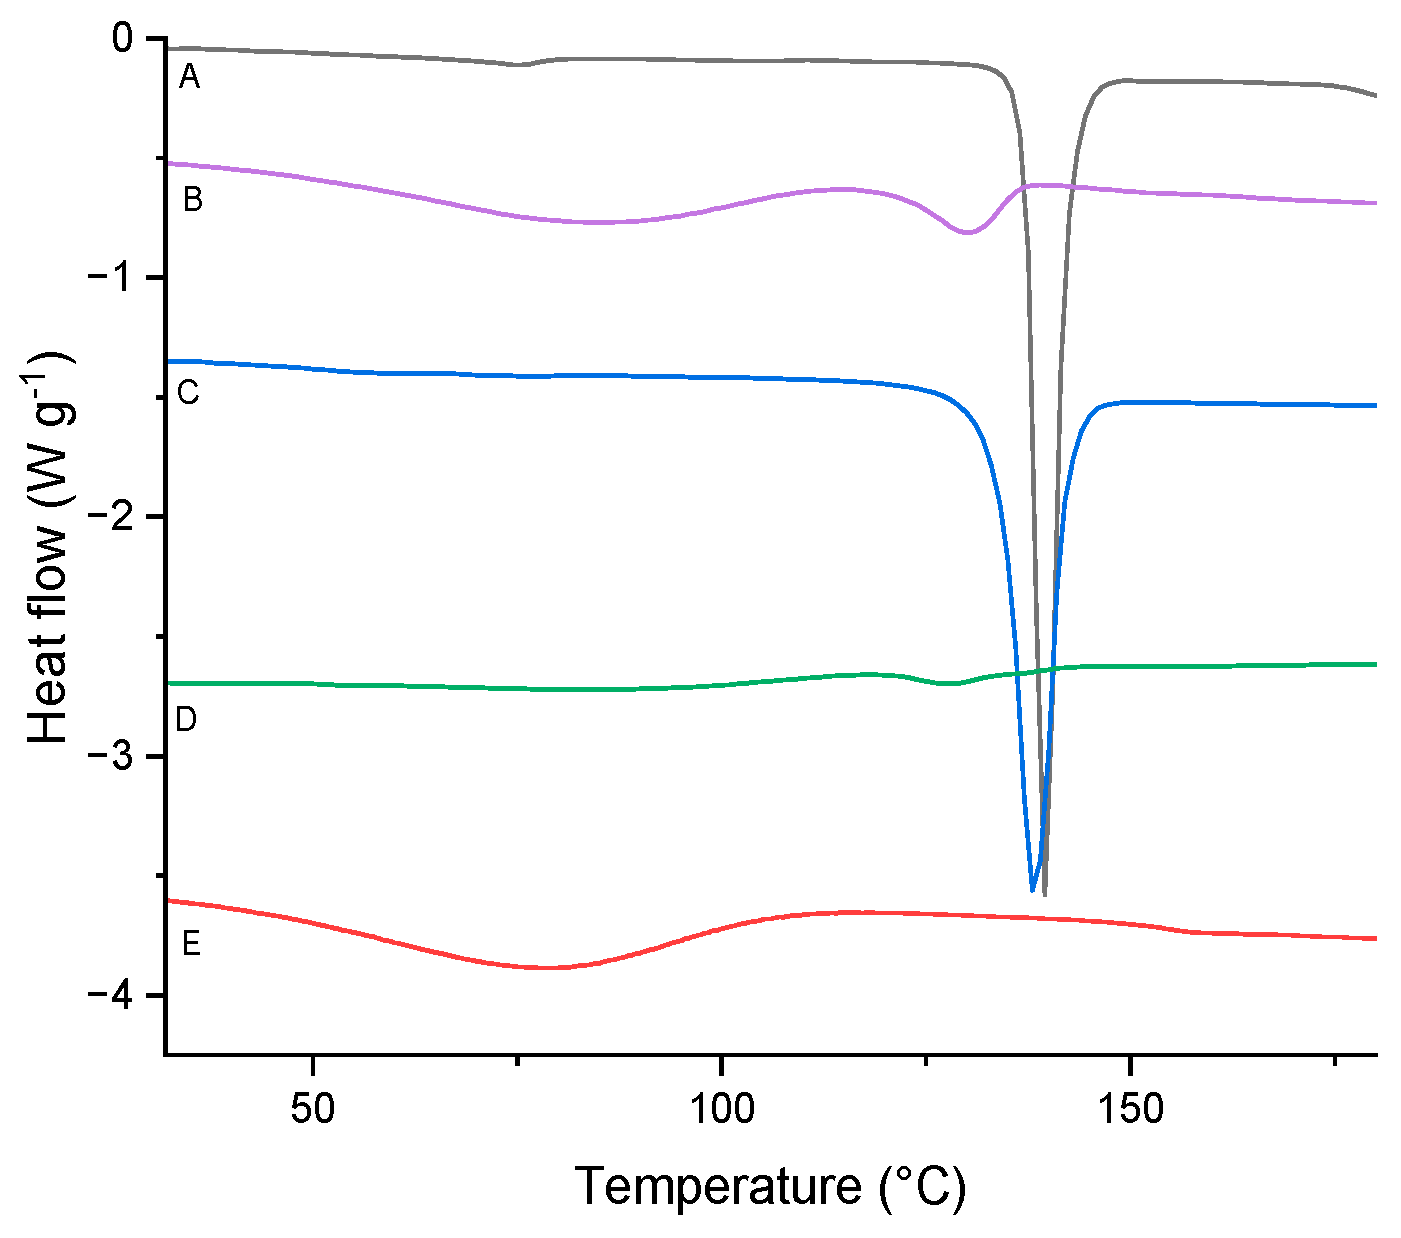
Figure 11.
TMDSC analysis of TICA (first run).
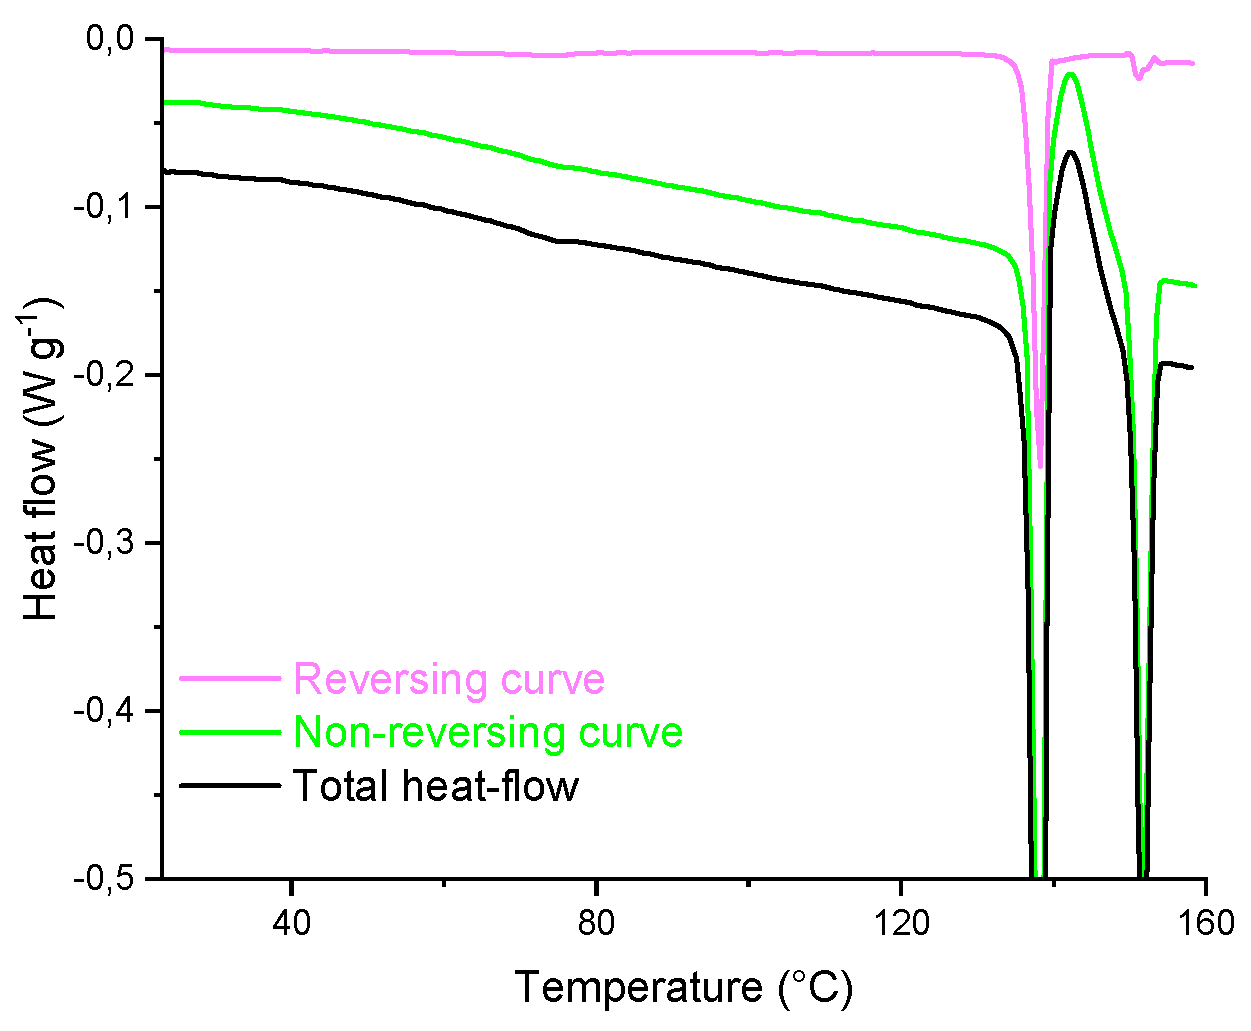
Figure 12.
TMDSC analysis of TICA (second run).
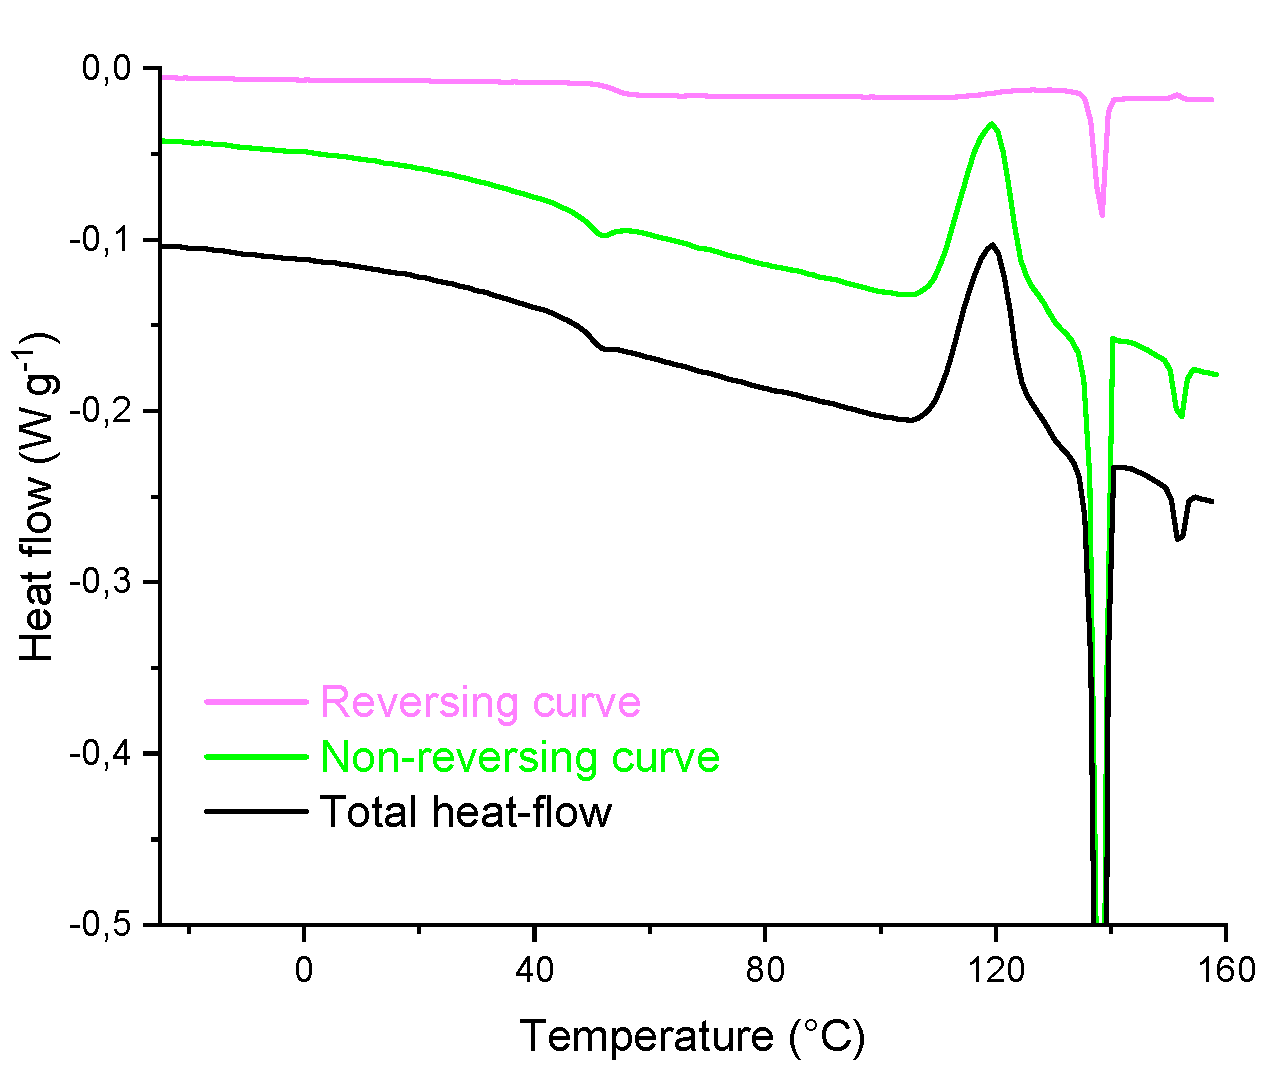
Figure 13.
a) and b): SEM micrographs of pure TICA.
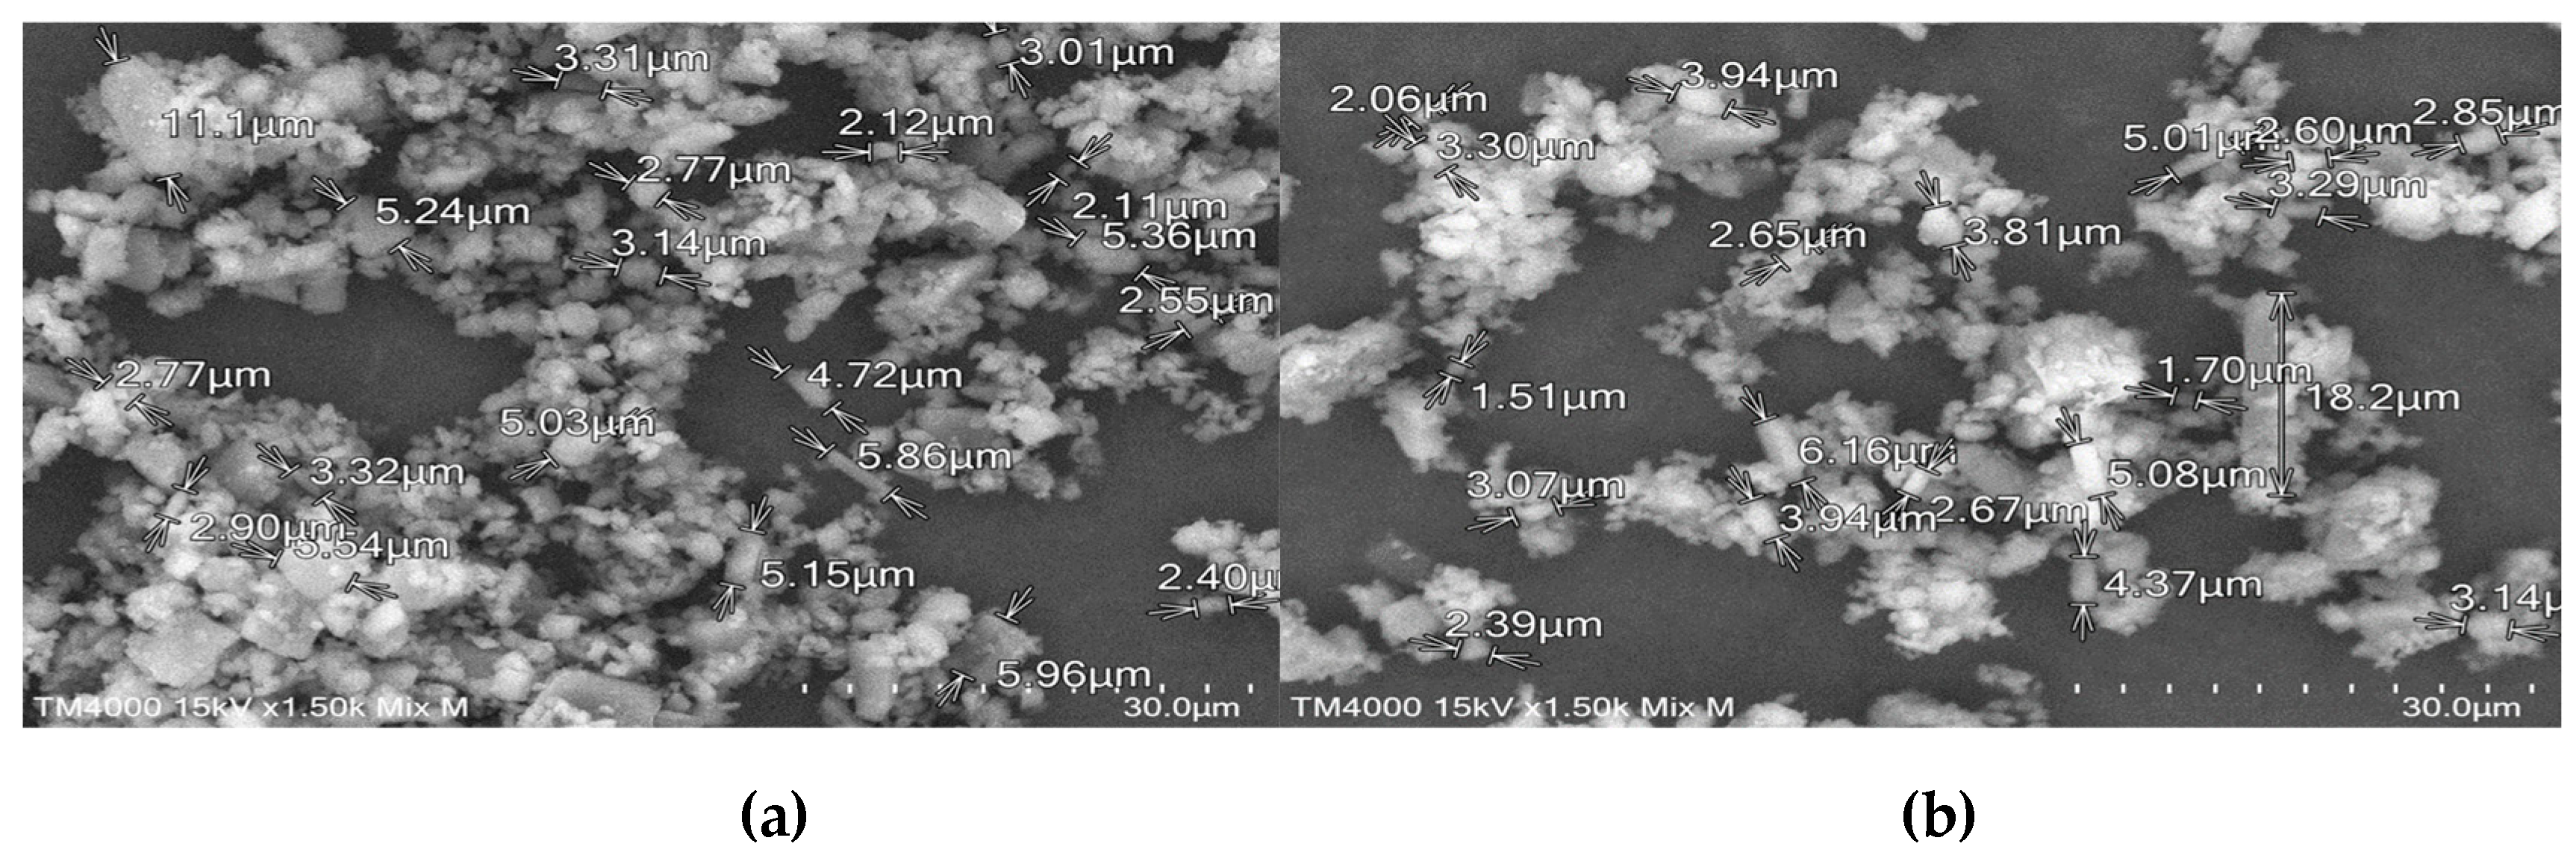
Figure 14.
SEM micrographs of pure CDs: a) B–CD; b) HP–B–CD; c) ME–B–CD.
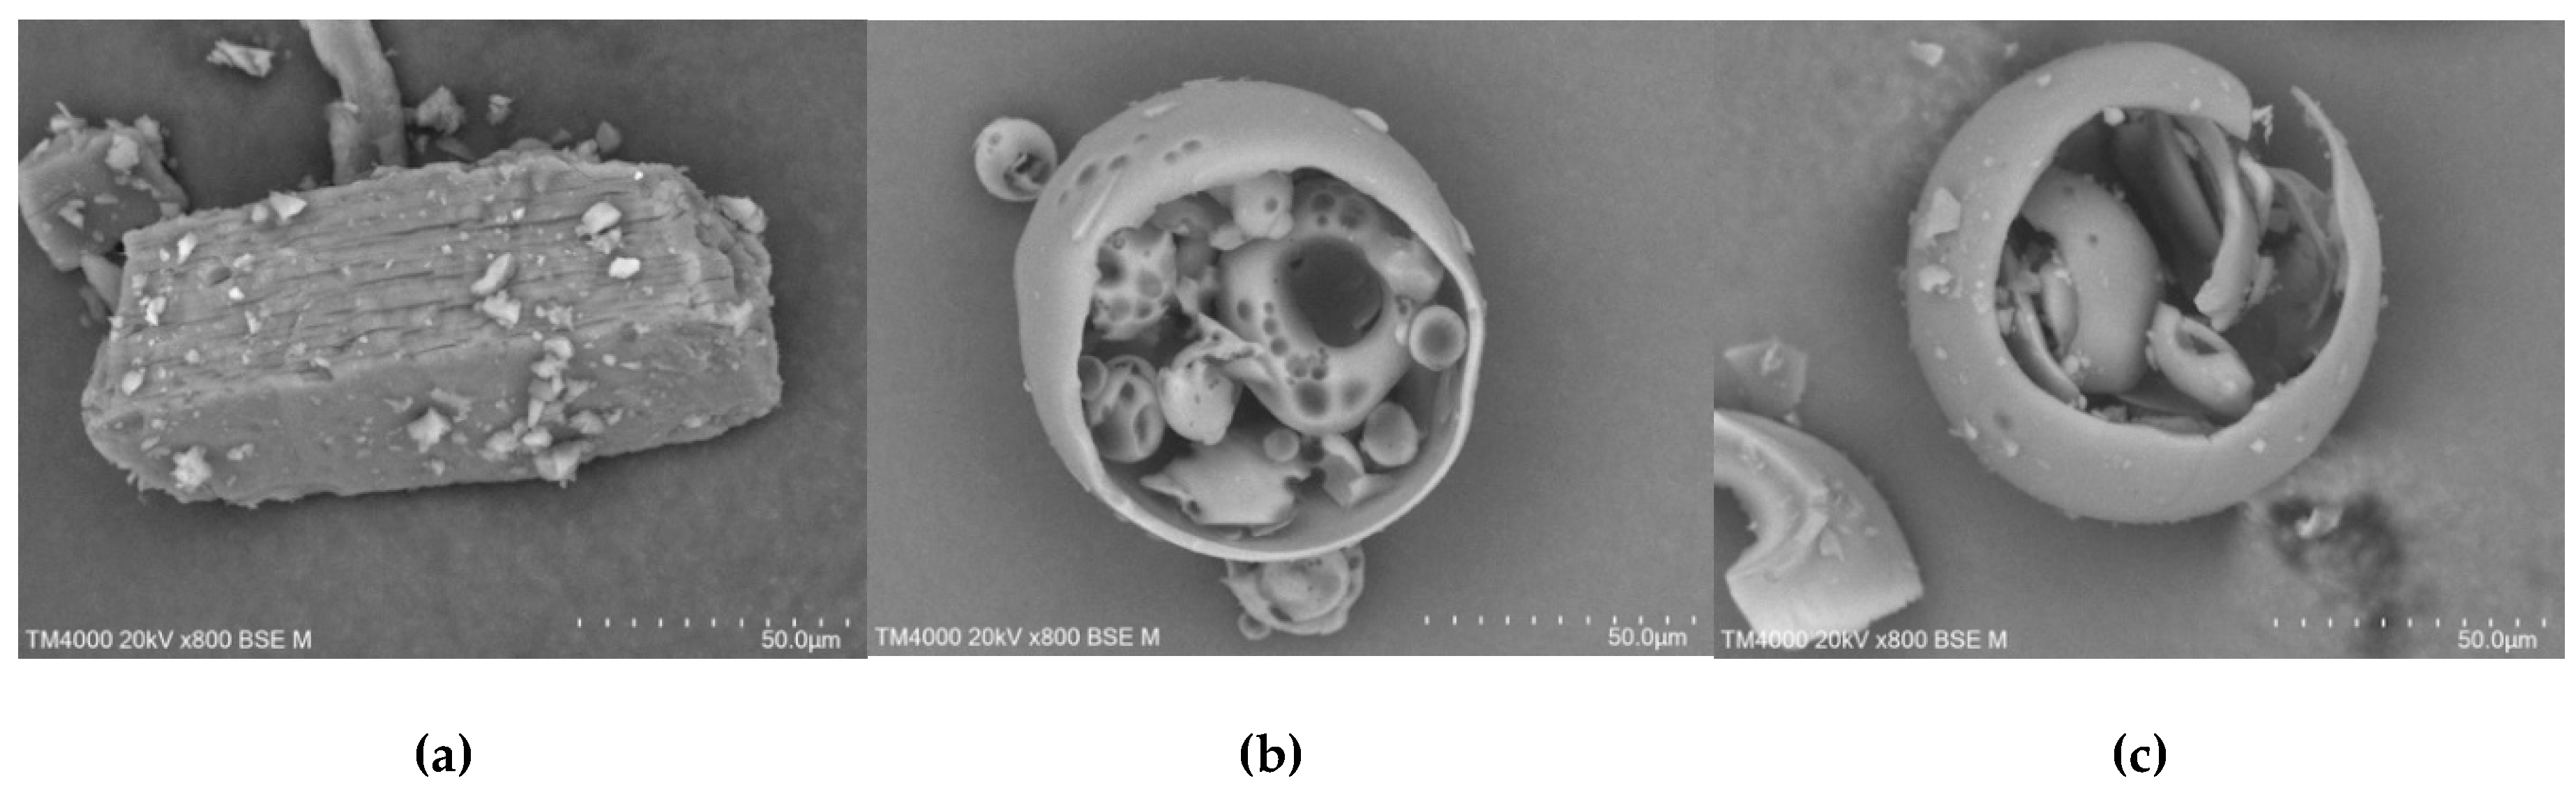
Figure 15.
SEM micrographs of TICA and CDs PMs: a) TICA+B–CD PM; b) TICA+HP–B–CD PM; c) TI-CA+ME–B–CD PM.
Figure 15.
SEM micrographs of TICA and CDs PMs: a) TICA+B–CD PM; b) TICA+HP–B–CD PM; c) TI-CA+ME–B–CD PM.
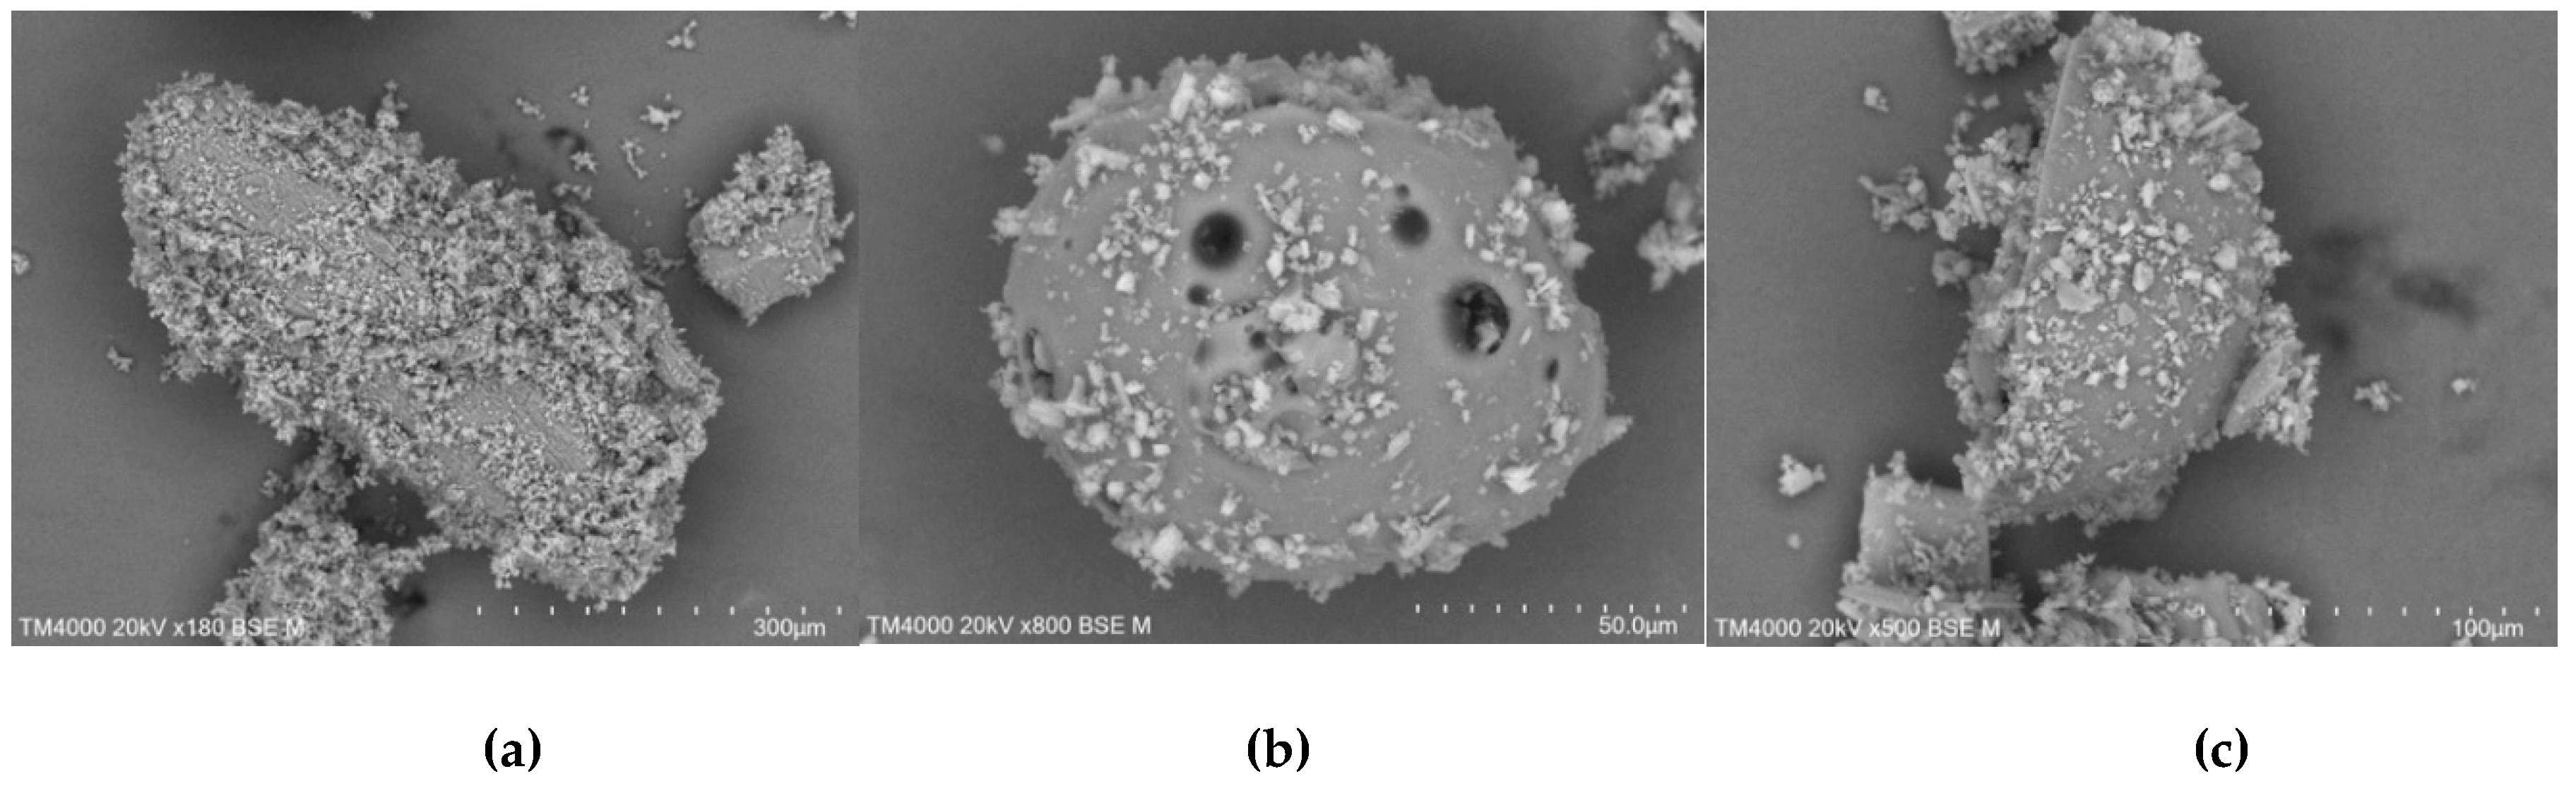
Figure 16.
SEM micrographs of TICA, CDs and ICs prepared by freeze-drying method, 0.5–1 mm; a) TICA+B–CD IC; b) TICA+HP–B–CD IC; c) TICA+ME–B–CD IC.
Figure 16.
SEM micrographs of TICA, CDs and ICs prepared by freeze-drying method, 0.5–1 mm; a) TICA+B–CD IC; b) TICA+HP–B–CD IC; c) TICA+ME–B–CD IC.
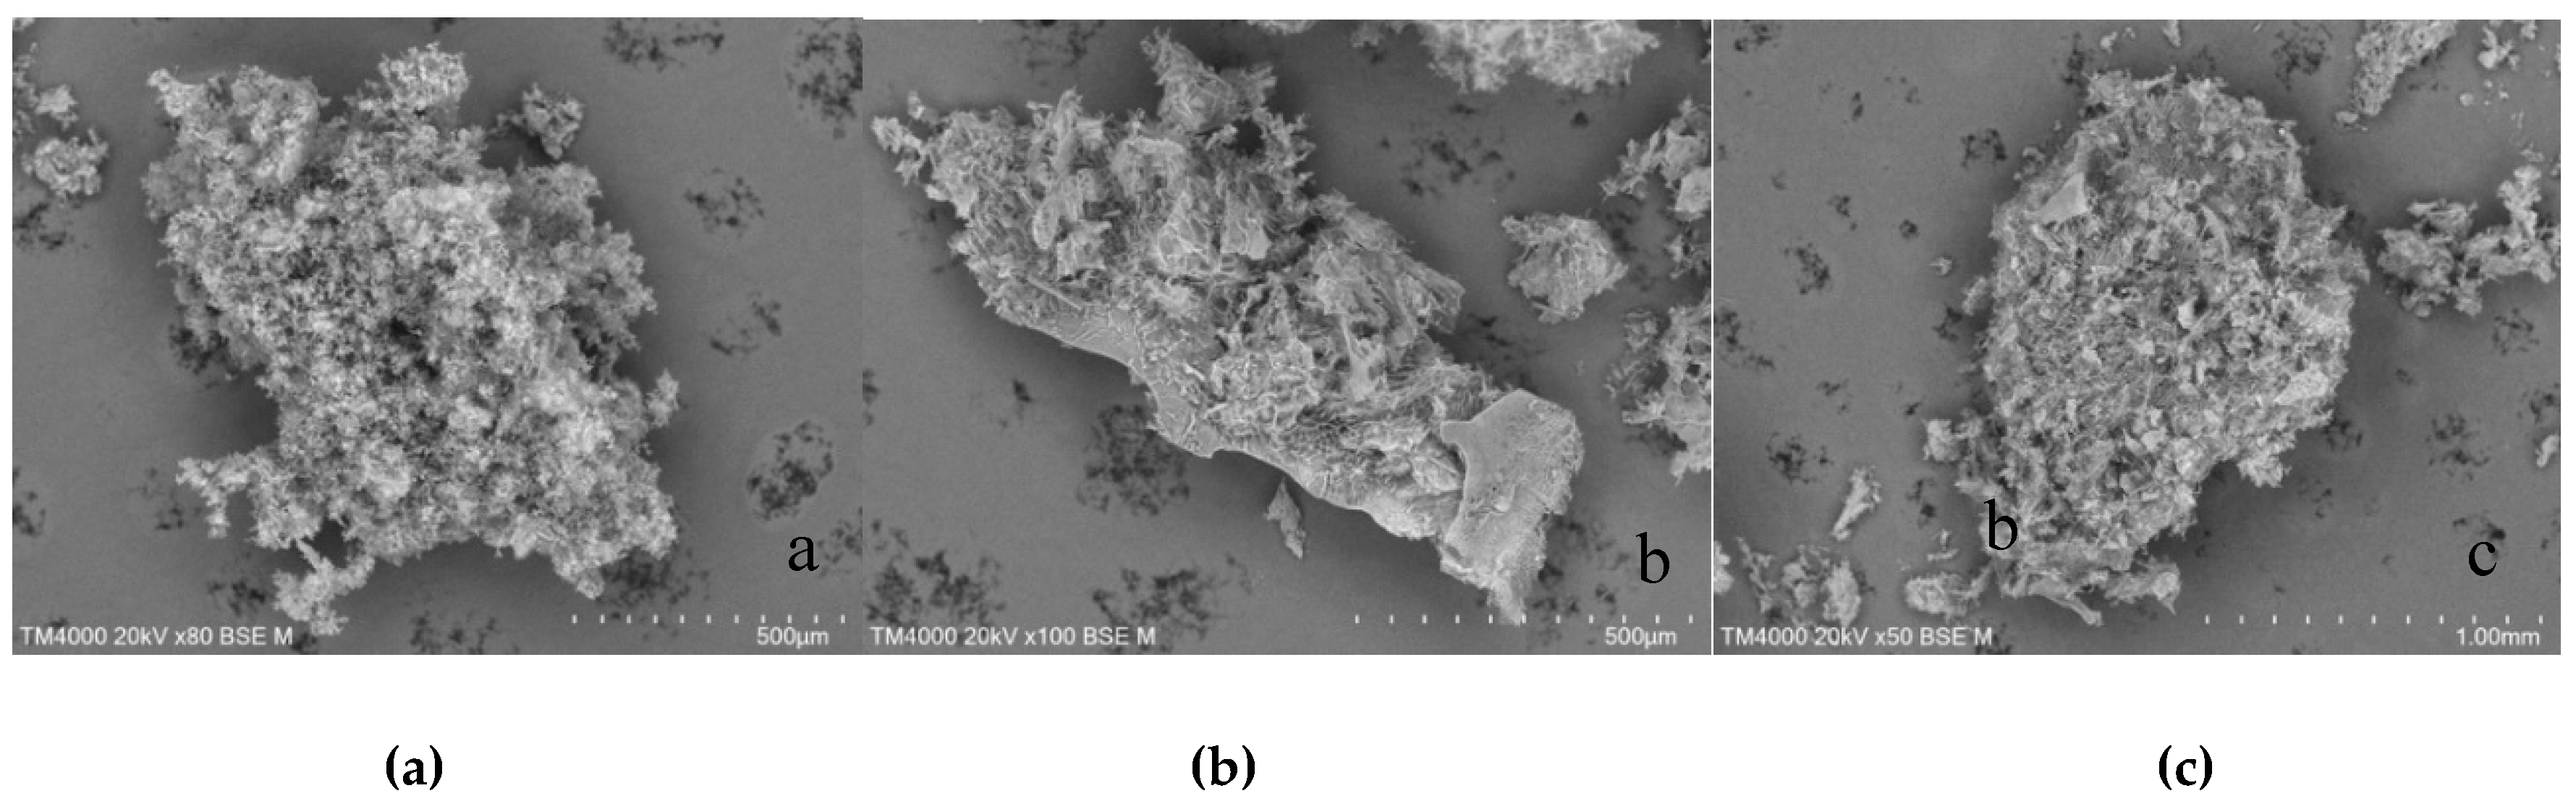
Figure 17.
SEM micrographs of TICA and CDs mixtures prepared by freeze-drying method, 0.03–0.1 mm; a) TICA+B–CD IC; b) TICA+HP–B–CD IC; c) TICA+ME–B–CD IC.
Figure 17.
SEM micrographs of TICA and CDs mixtures prepared by freeze-drying method, 0.03–0.1 mm; a) TICA+B–CD IC; b) TICA+HP–B–CD IC; c) TICA+ME–B–CD IC.
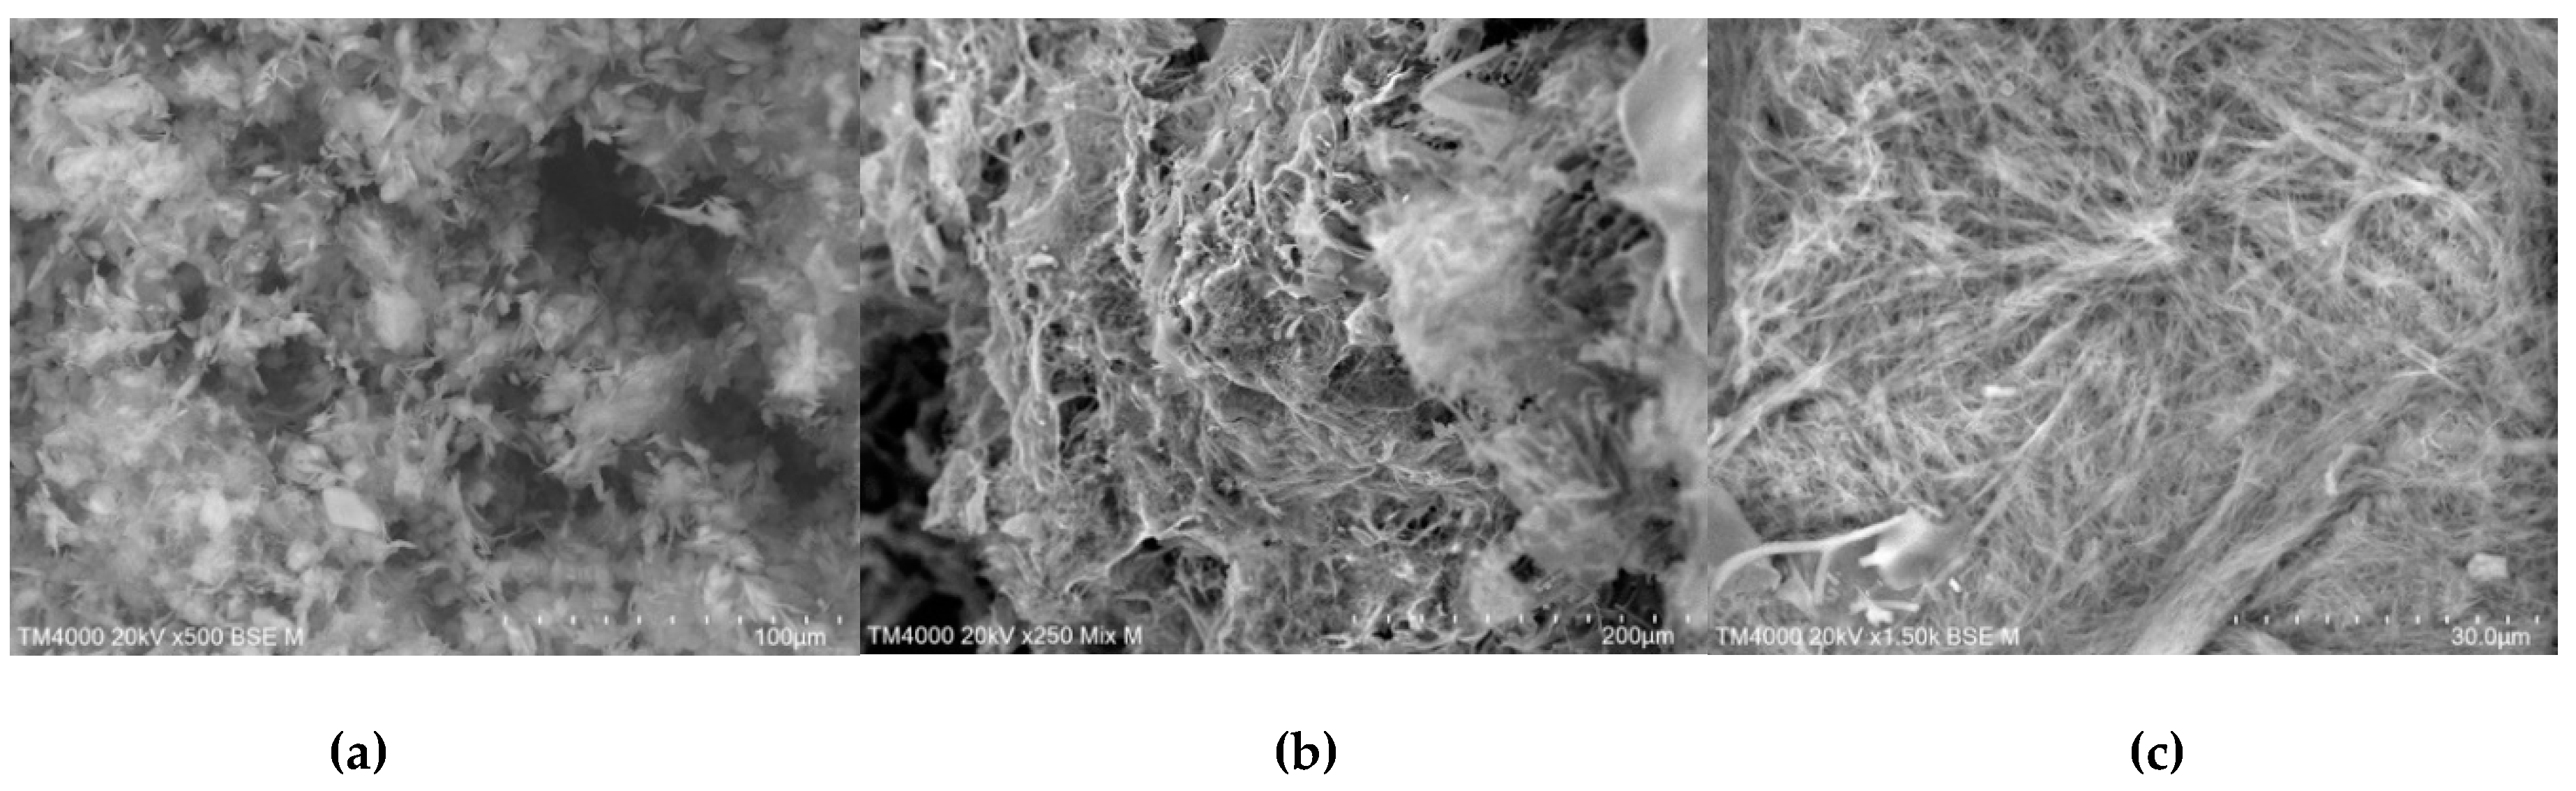
Figure 18.
SEM micrographs of TICA and CDs mixtures prepared by kneading method; a) TICA+B–CD IC; b) TICA+HP–B–CD IC; c) TICA+ME–B–CD IC.
Figure 18.
SEM micrographs of TICA and CDs mixtures prepared by kneading method; a) TICA+B–CD IC; b) TICA+HP–B–CD IC; c) TICA+ME–B–CD IC.
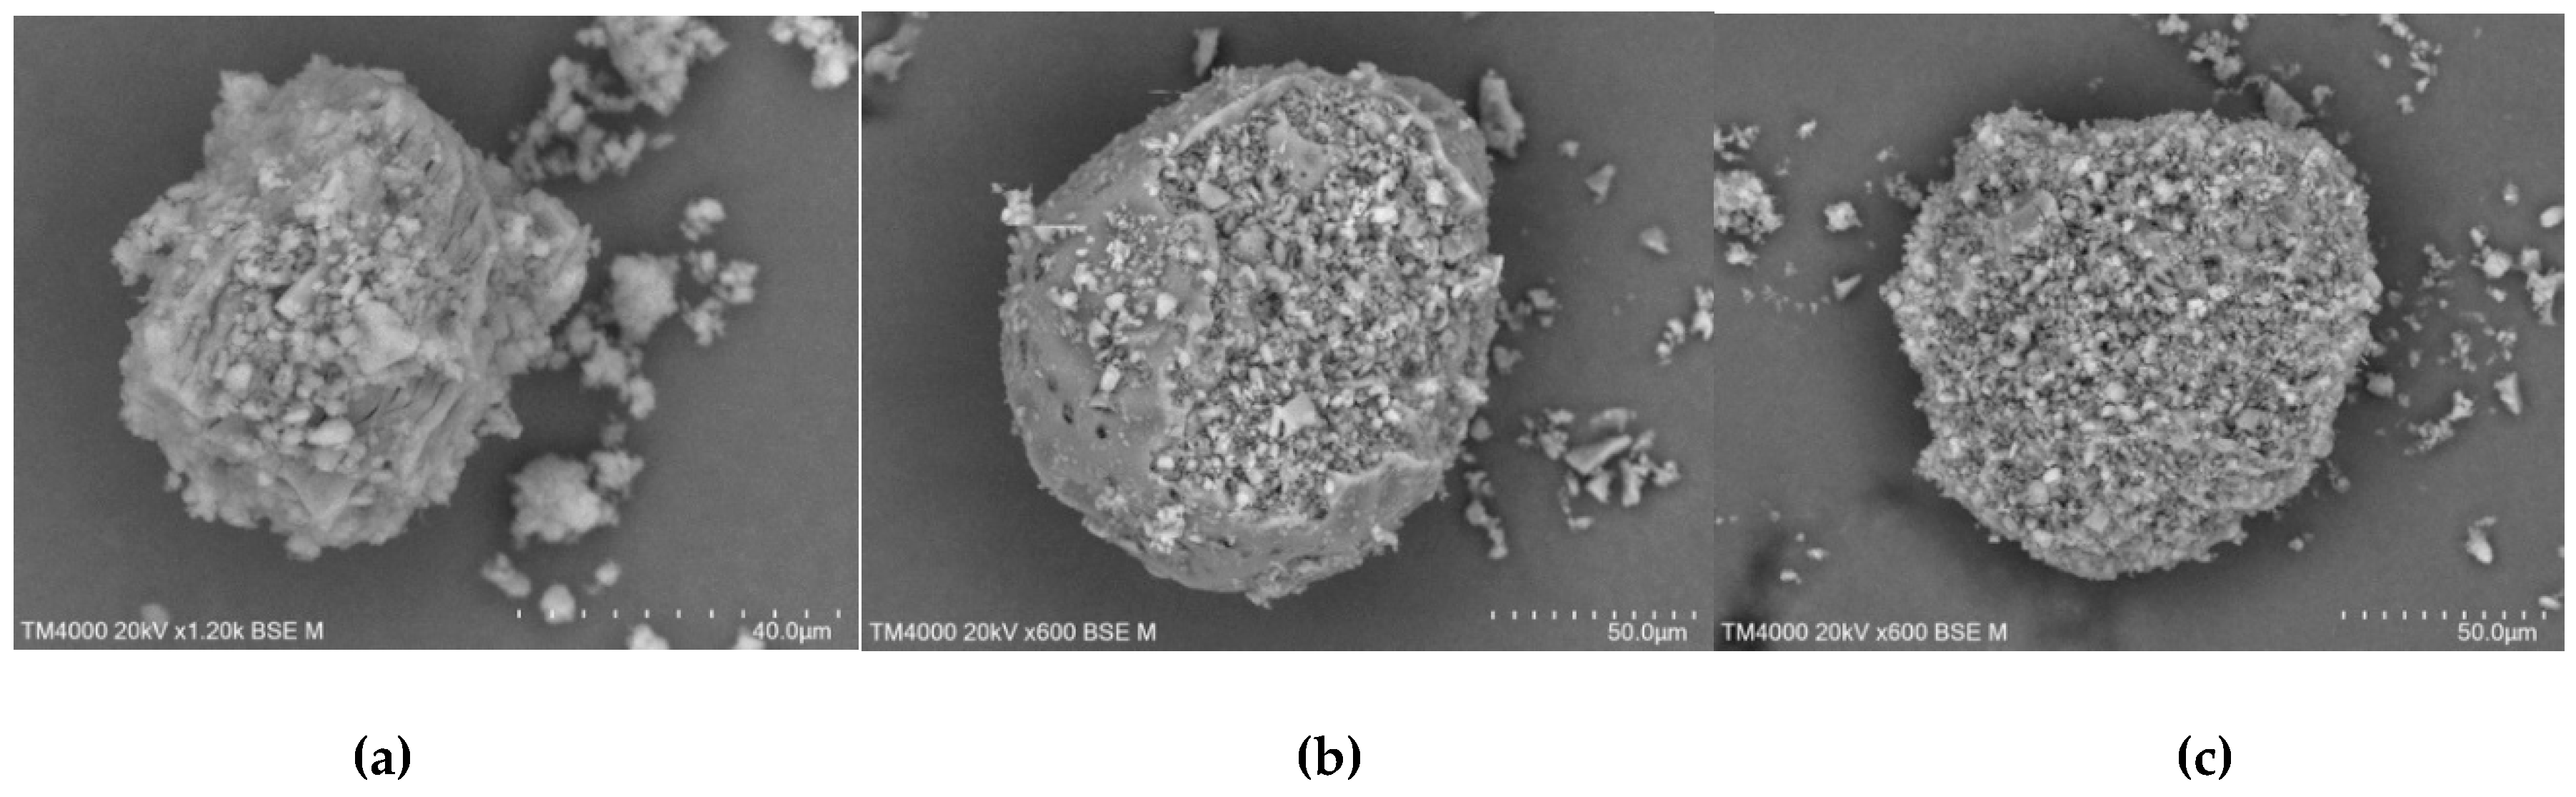
Figure 19.
SEM micrographs of TICA and CDs mixtures prepared by co-precipitation method; a) TICA+B–CD IC; b) TICA+HP–B–CD IC; c) TICA+ME–B–CD IC.
Figure 19.
SEM micrographs of TICA and CDs mixtures prepared by co-precipitation method; a) TICA+B–CD IC; b) TICA+HP–B–CD IC; c) TICA+ME–B–CD IC.
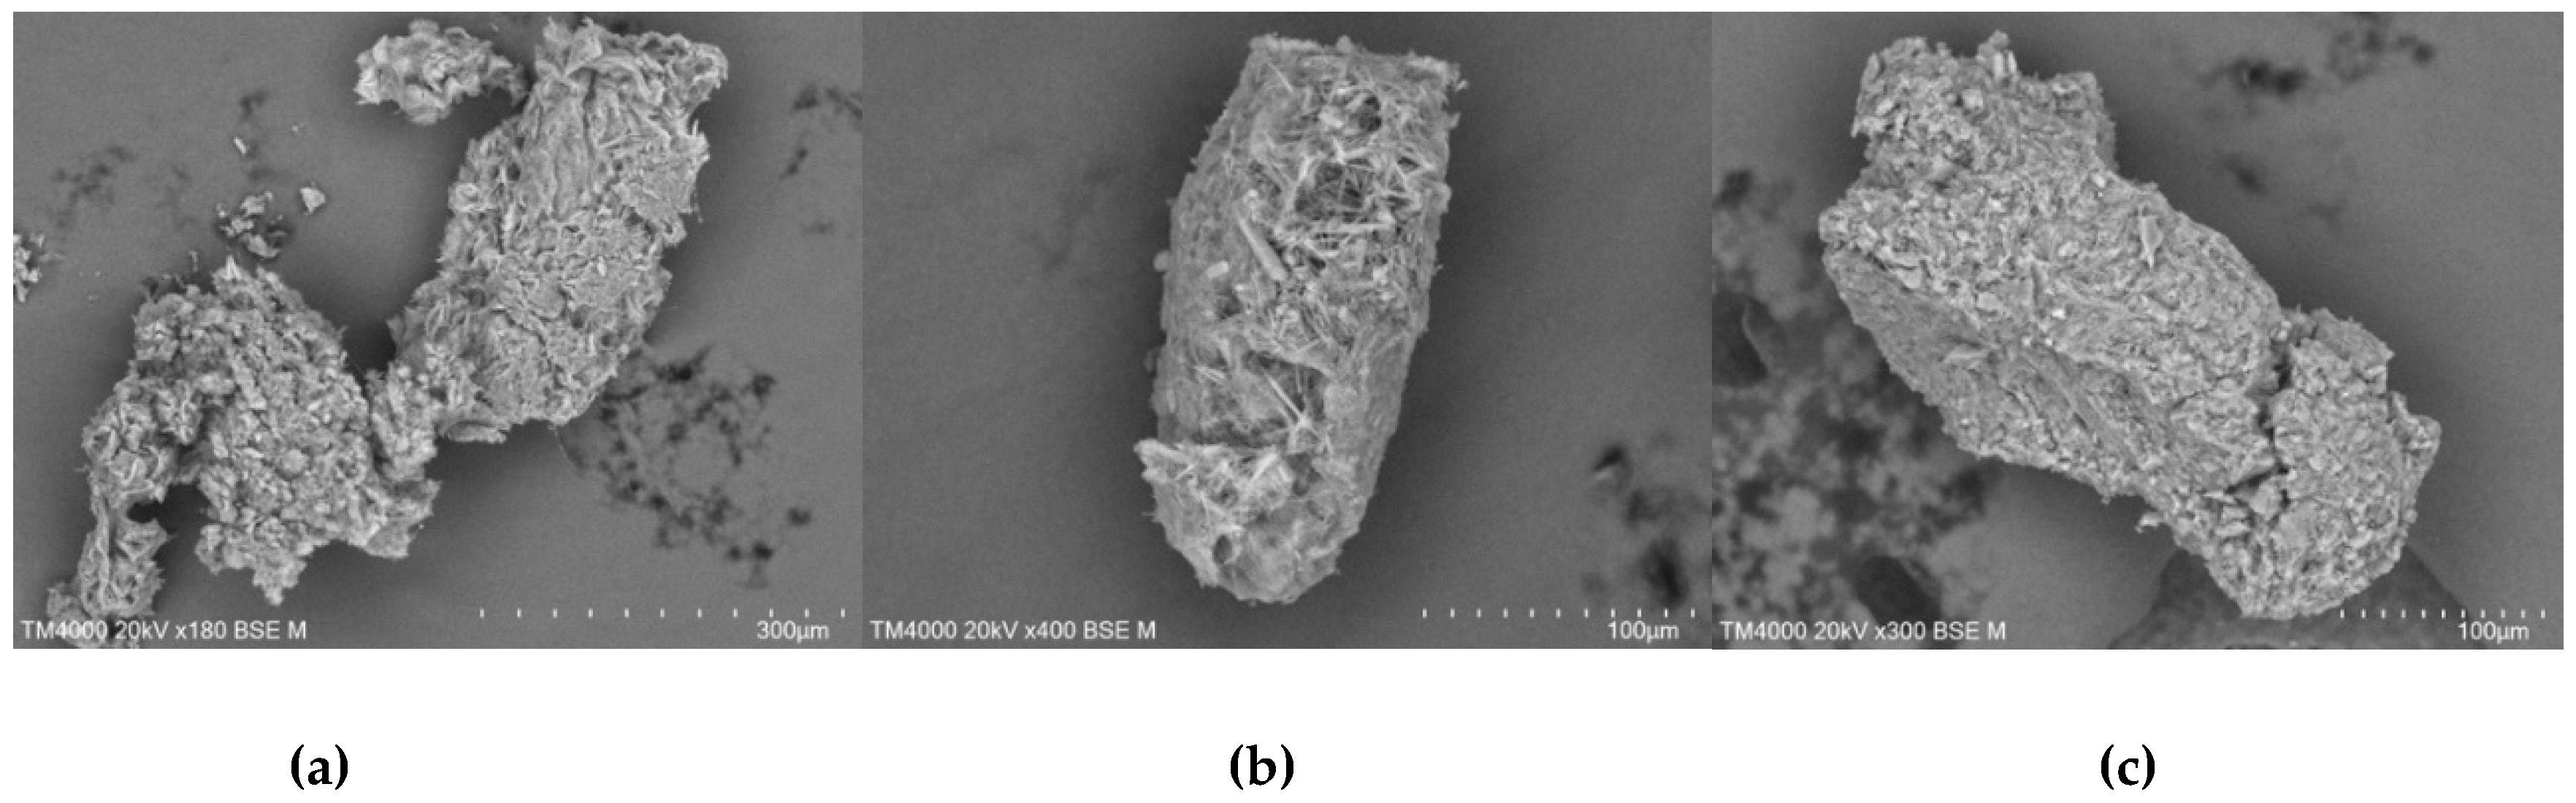
Figure 20.
PXRD patterns of the (A) TICA, (B) B–CDs and their prepared ICs by: (C) kneading and (D) freeze-drying.
Figure 20.
PXRD patterns of the (A) TICA, (B) B–CDs and their prepared ICs by: (C) kneading and (D) freeze-drying.
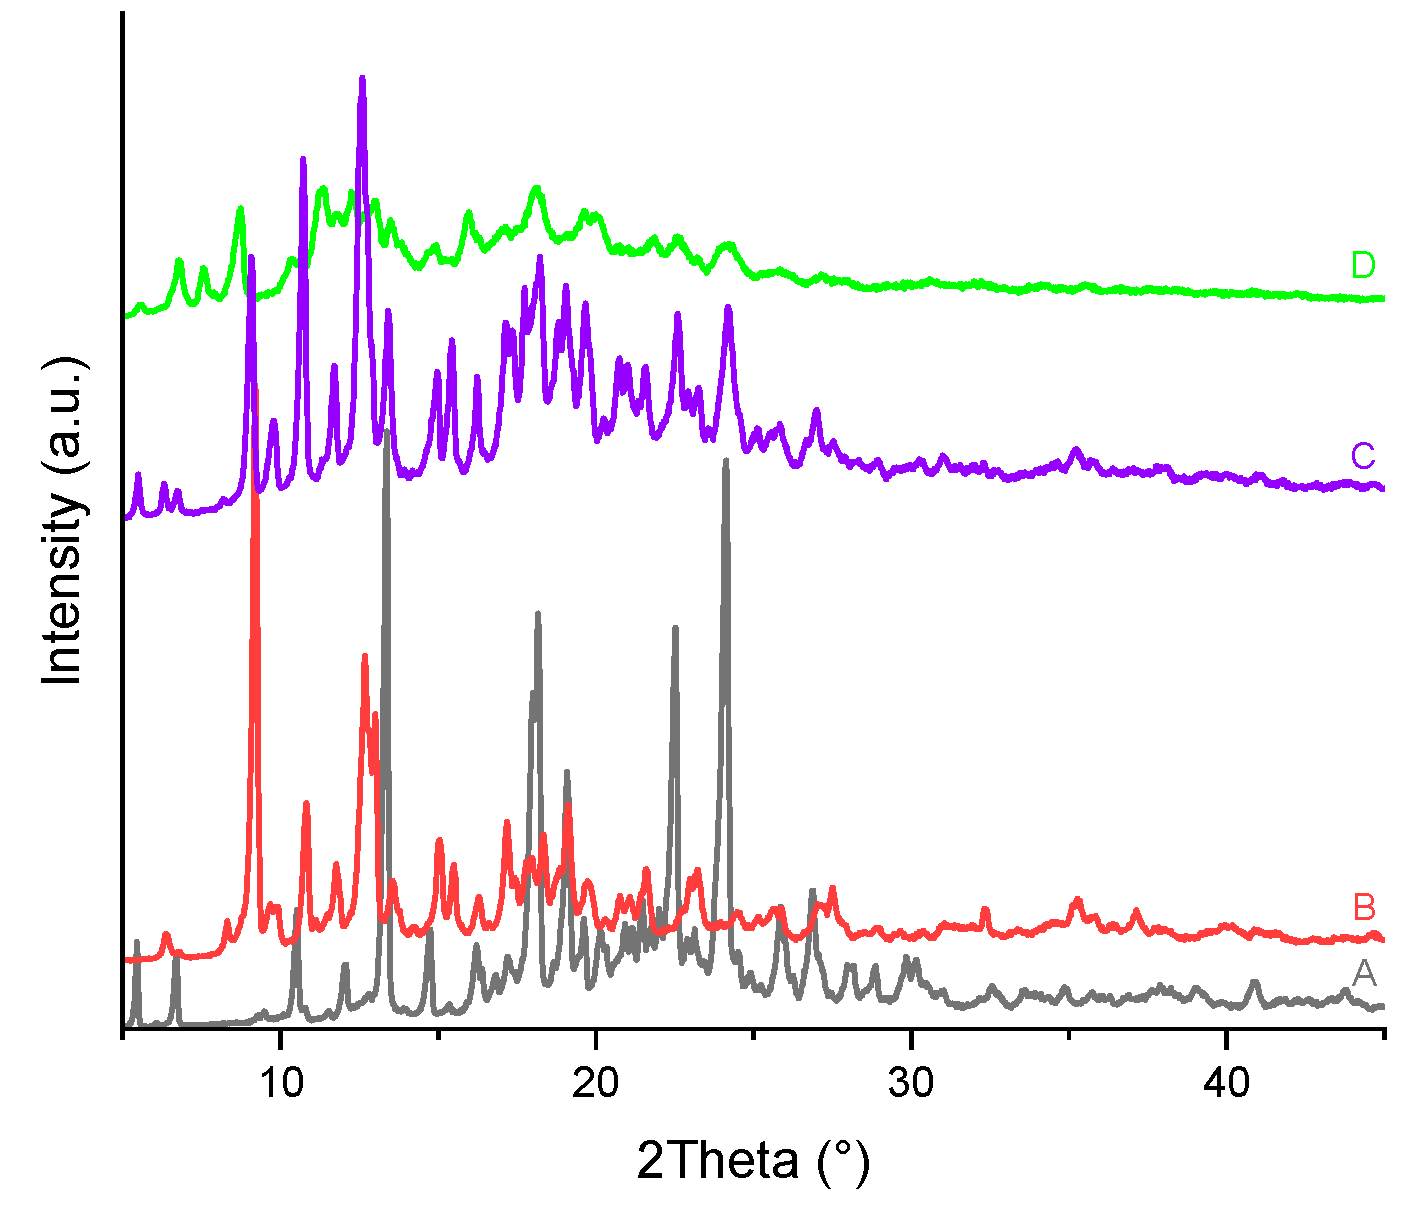
Figure 21.
PXRD patterns of the (A) TICA, (B) HP–B–CDs and their prepared ICs by: (C) kneading and (D) freeze-drying.
Figure 21.
PXRD patterns of the (A) TICA, (B) HP–B–CDs and their prepared ICs by: (C) kneading and (D) freeze-drying.
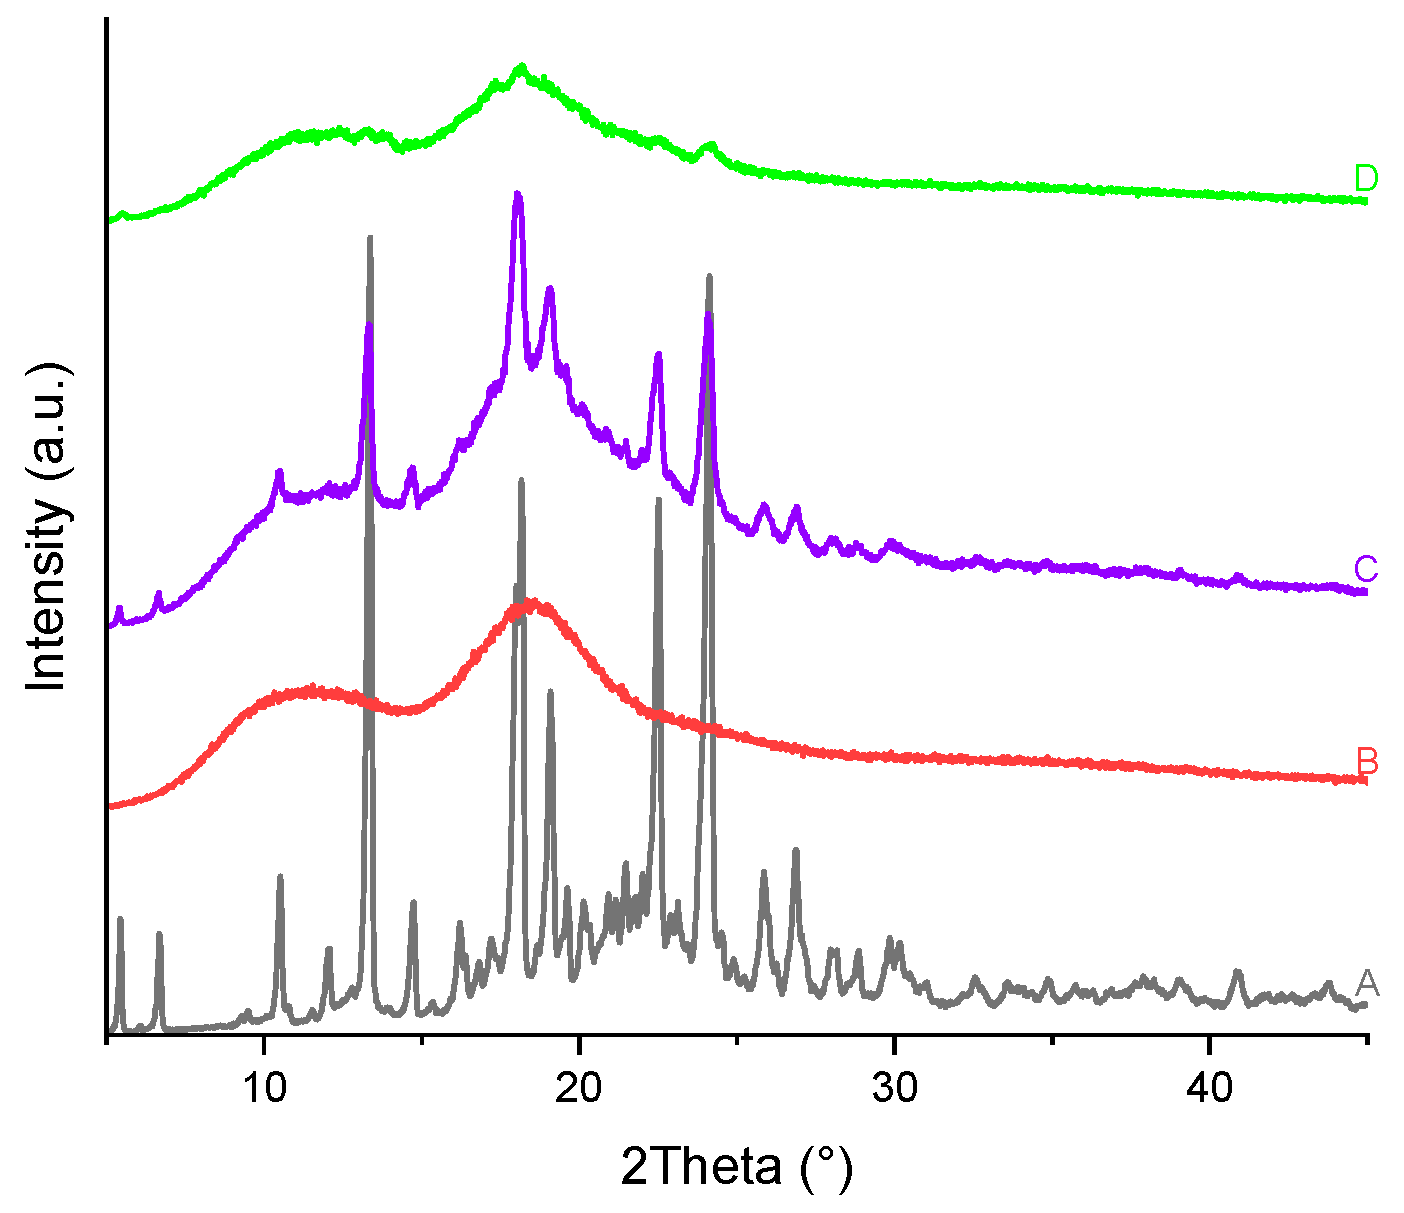
Figure 22.
PXRD patterns of the (A) TICA, (B) CDs and their prepared ICs by: (C) kneading and (D) freeze-drying with: a) B–CD; b) HP–B–CD; c) ME–B–CD.
Figure 22.
PXRD patterns of the (A) TICA, (B) CDs and their prepared ICs by: (C) kneading and (D) freeze-drying with: a) B–CD; b) HP–B–CD; c) ME–B–CD.
Disclaimer/Publisher’s Note: The statements, opinions and data contained in all publications are solely those of the individual author(s) and contributor(s) and not of MDPI and/or the editor(s). MDPI and/or the editor(s) disclaim responsibility for any injury to people or property resulting from any ideas, methods, instructions or products referred to in the content. |
© 2025 by the authors. Licensee MDPI, Basel, Switzerland. This article is an open access article distributed under the terms and conditions of the Creative Commons Attribution (CC BY) license (http://creativecommons.org/licenses/by/4.0/).
Copyright: This open access article is published under a Creative Commons CC BY 4.0 license, which permit the free download, distribution, and reuse, provided that the author and preprint are cited in any reuse.


