
Submitted:
24 February 2025
Posted:
26 February 2025
You are already at the latest version
Abstract
Financial health deterioration may imply financial distress and fraud. Nevertheless, it is computationally intensive to signal financial health deterioration earlier since new financial data are periodically available, and these data may outdate an old detection of financial health deterioration. This study integrates a Naive Bayes classifier with the Bayesian measure of surprise to detect financial health deterioration. This Bayesian measure of surprise denotes the anomaly measure, whereas the Naive Bayes classifier classifies past financial ratio data to create a classification model. Defining the Bayesian measure of surprise employs the relative posterior predictive surprise. For seamless integration with the Naive Bayes classifier’s workflows and pipelines, computing the Bayesian measure of surprise is a post-processing step in implementing the Naive Bayes classifier. Our detection targets are those cases subjected to relative posterior predictive surprises below 0.01. Experiments on actual financial data show that the Bayesian measure of surprise complements a Naive Bayes classifier in detecting assumed anomalies without labeling past normal or anomalous data and calibrating many parameters. However, the Bayesian measure of surprise helps signal assumed anomalies earlier than the p-value does. In conclusion, a Naive Bayes classifier and the Bayesian measure of surprise can be better tools for anomaly detection.
Keywords:
1. Introduction
- Labeled normal or anomalous data may be unavailable. Many machine learning algorithms (e.g., [2]) need to label past normal or anomalous data for detecting future anomalies.
- Reconstructing the past data distributions to detect future anomalies is inconvenient. Models like autoencoders (e.g., [5]) or principal component analyses (e.g., [6]) reconstruct the distribution of past data in detecting unseen anomalies. Implementing this reconstruction is inconvenient when detecting anomalies from periodically updated data.
- Balance some advantages of applying unsupervised, semi-supervised, and supervised learning approaches [9] to anomaly detection. We adapt future anomalies without labeling past financial data. Adapting new anomalies and eliminating the need for labeling data are two of the advantages of unsupervised anomaly detection. Meanwhile, this study defines a Bayesian measure of surprise to signal anomalies. This Bayesian measure of surprise is explainable and interpretable. Explainability and interpretability are two of the advantages of creating a supervised anomaly detection. Besides, we detect financial health deterioration without calibrating many nuisance parameters. Eliminating the need for this calibration is one of the advantages of generating semi-supervised anomaly detection.
- This study does not preprocess past high-dimensional financial data before detecting new anomalies based on these data. We further implement the computation of a Bayesian measure of surprise using classification results of a Naive Bayes classifier. Except for high-dimensional financial data, the current works may be suitable for detecting anomalies from other high-dimensional data.
- This study seamlessly integrates a classification algorithm with an anomaly measure. Computing the Bayesian measure of surprise is a post-processing step of implementing a Naive Bayes classifier. It is unnecessary to create new codes to implement a Naive Bayes classifier and the Bayesian measure of surprise.
2. Literature Review
- Advantages and disadvantages of those supervised, semi-supervised, and unsupervised learning approaches;
- Strengths and weakness of a machine learning algorithm in anomaly detection;
- Drawbacks of a likelihood-based anomaly measure.
2.1. Advantages and Disadvantages of Supervised, Semi-Supervised, and Unsupervised Learning Approaches
2.2. Strengths and Weakness of a Machine Learning Algorithm in Anomaly Detection
2.3. Drawbacks of a Likelihood-Based Anomaly Measure
- Published studies (e.g., [19]) assume that normal data follows a particular probability distribution. Therefore, we can detect anomalies by checking whether suspicious data conform unacceptably to that particular probability distribution. Unfortunately, this assumption does not hold in practice, especially with complex real-world data.
- Some machine learning models (e.g., [16]) (e.g., a deep learning model) are complex. Obtaining their best performance requires tuning many parameters. We need ablation studies to determine the best values of these parameters.
- A likelihood-based anomaly measure may miss anomalies that only deviate from expected behavior within a certain context or subspace (e.g., [20]).
- Likelihood-based anomaly measures may be sensitive to noisy data. Noisy data may be misclassified as anomalies (e.g., [21]).
- Calculating likelihood-based measures for relatively high-dimensional data may be challenging and computationally expensive (e.g., [19]).
3. Methods
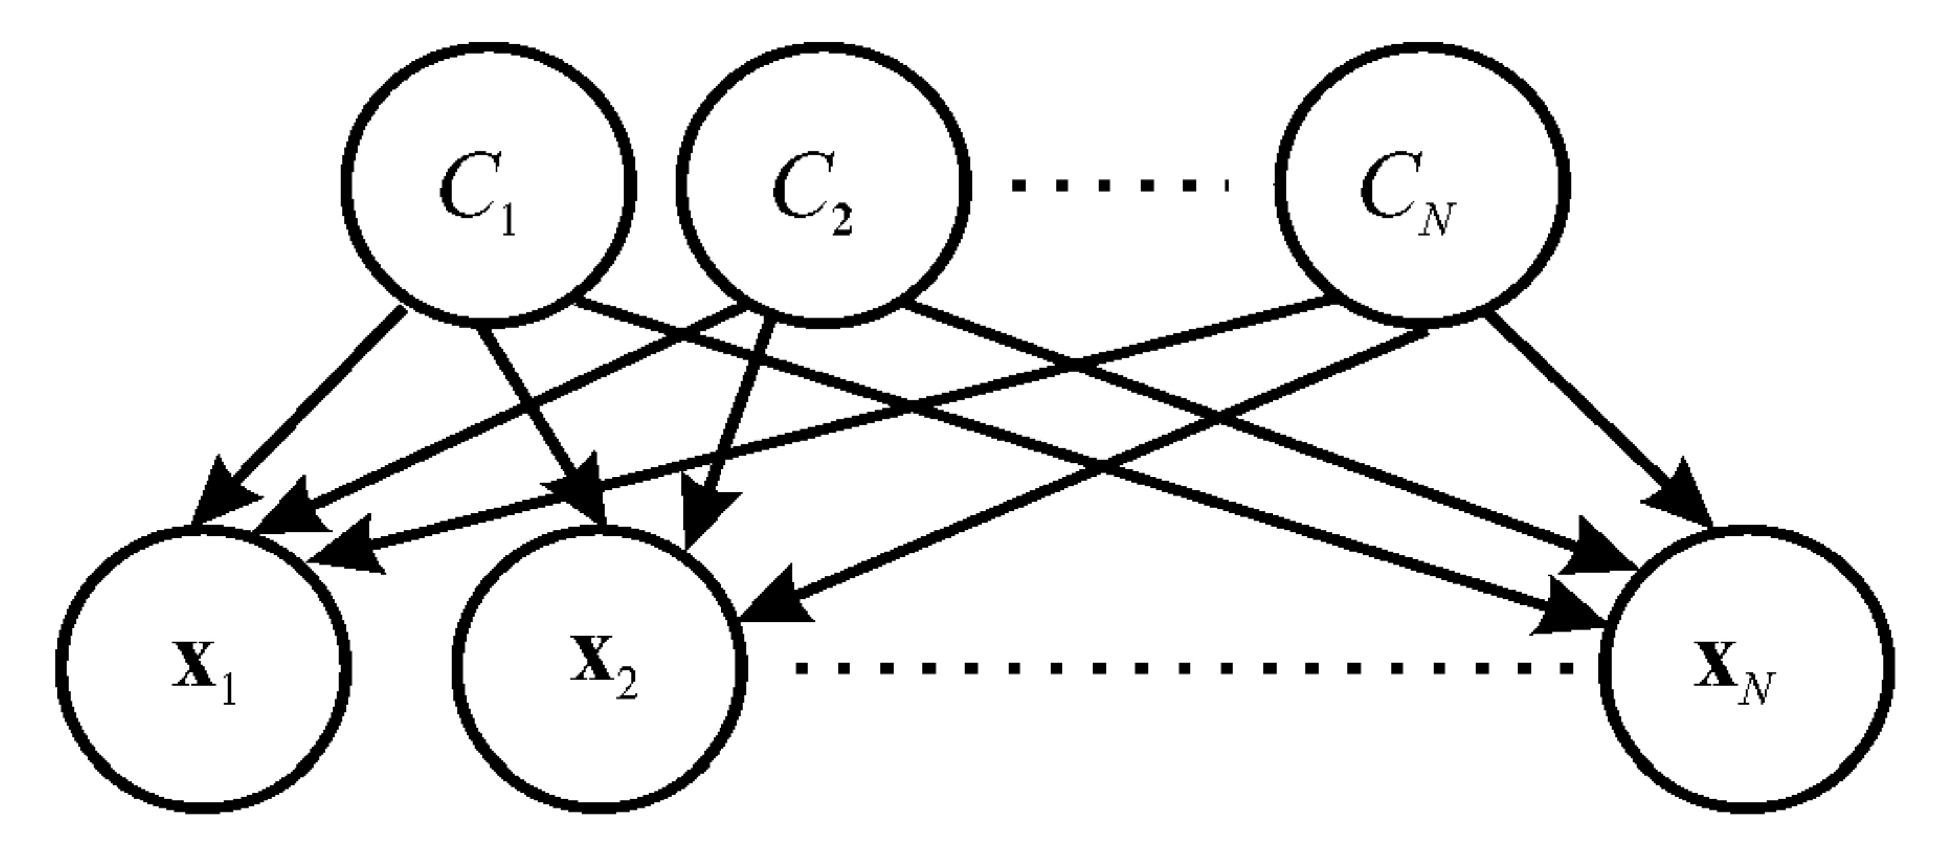
3.1. Naive Bayes Classifier
3.2. Bayesian Measure of Surprise
4. Results
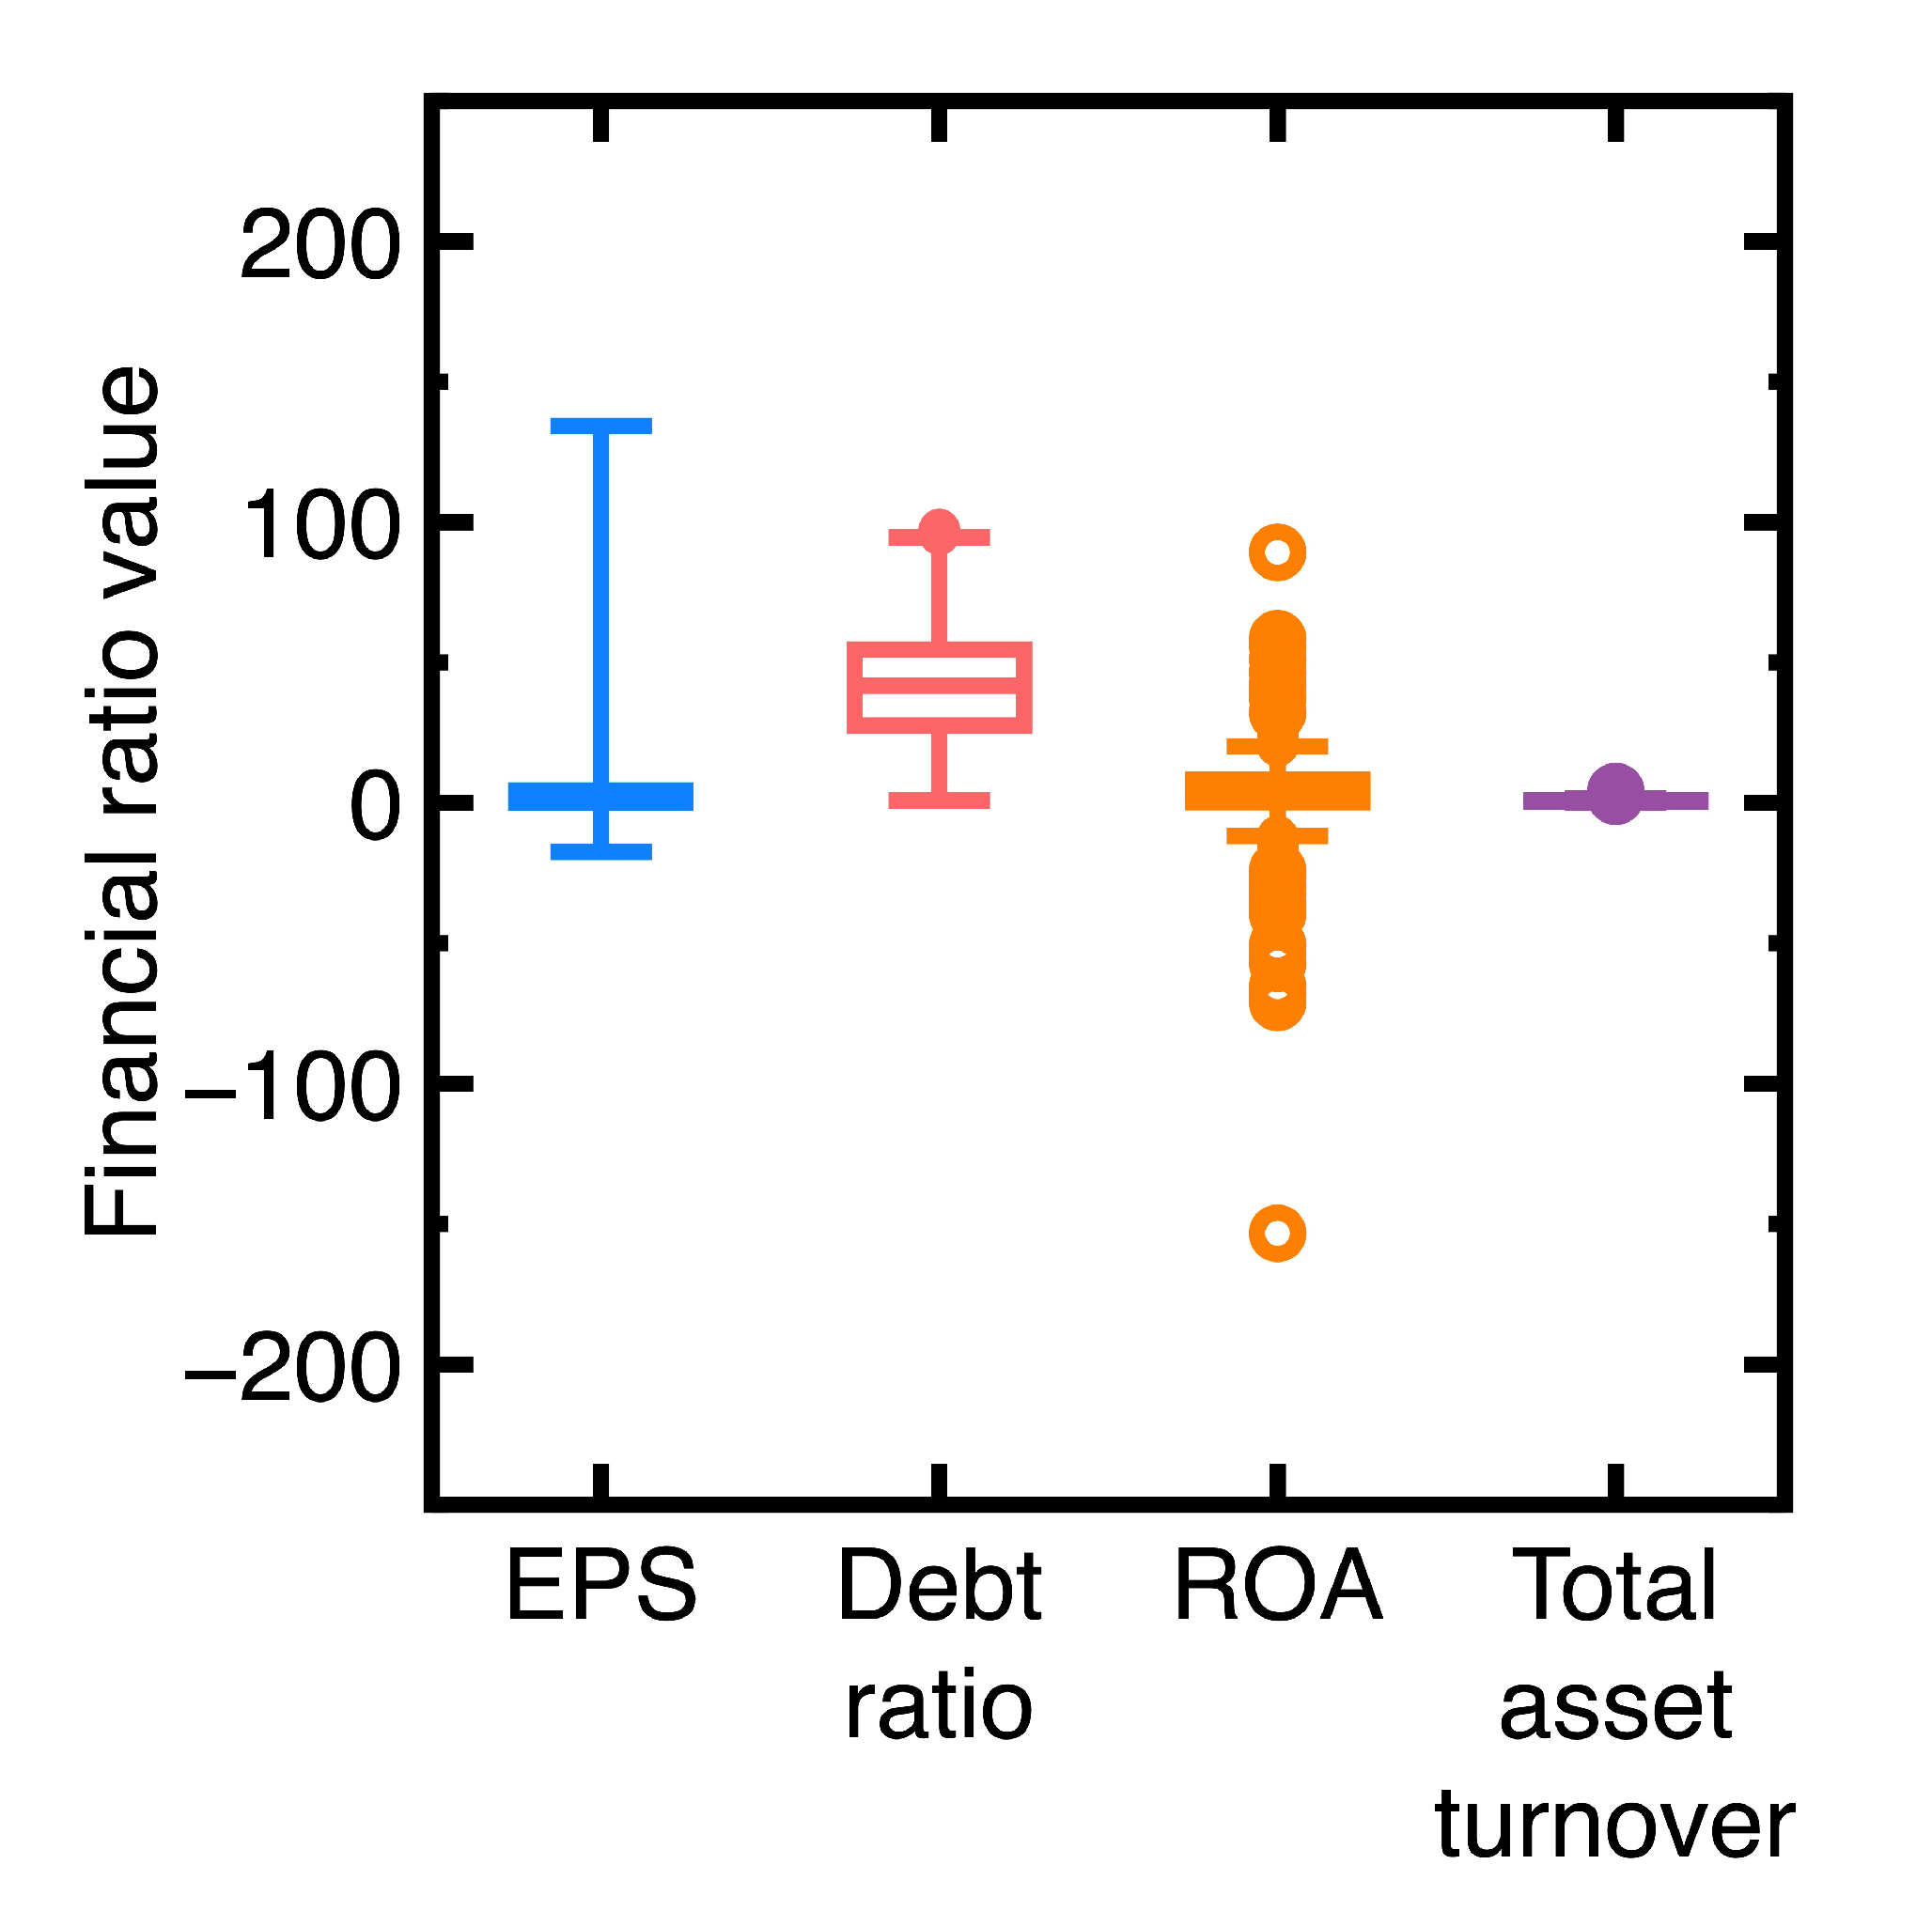
4.1. Experiment 1
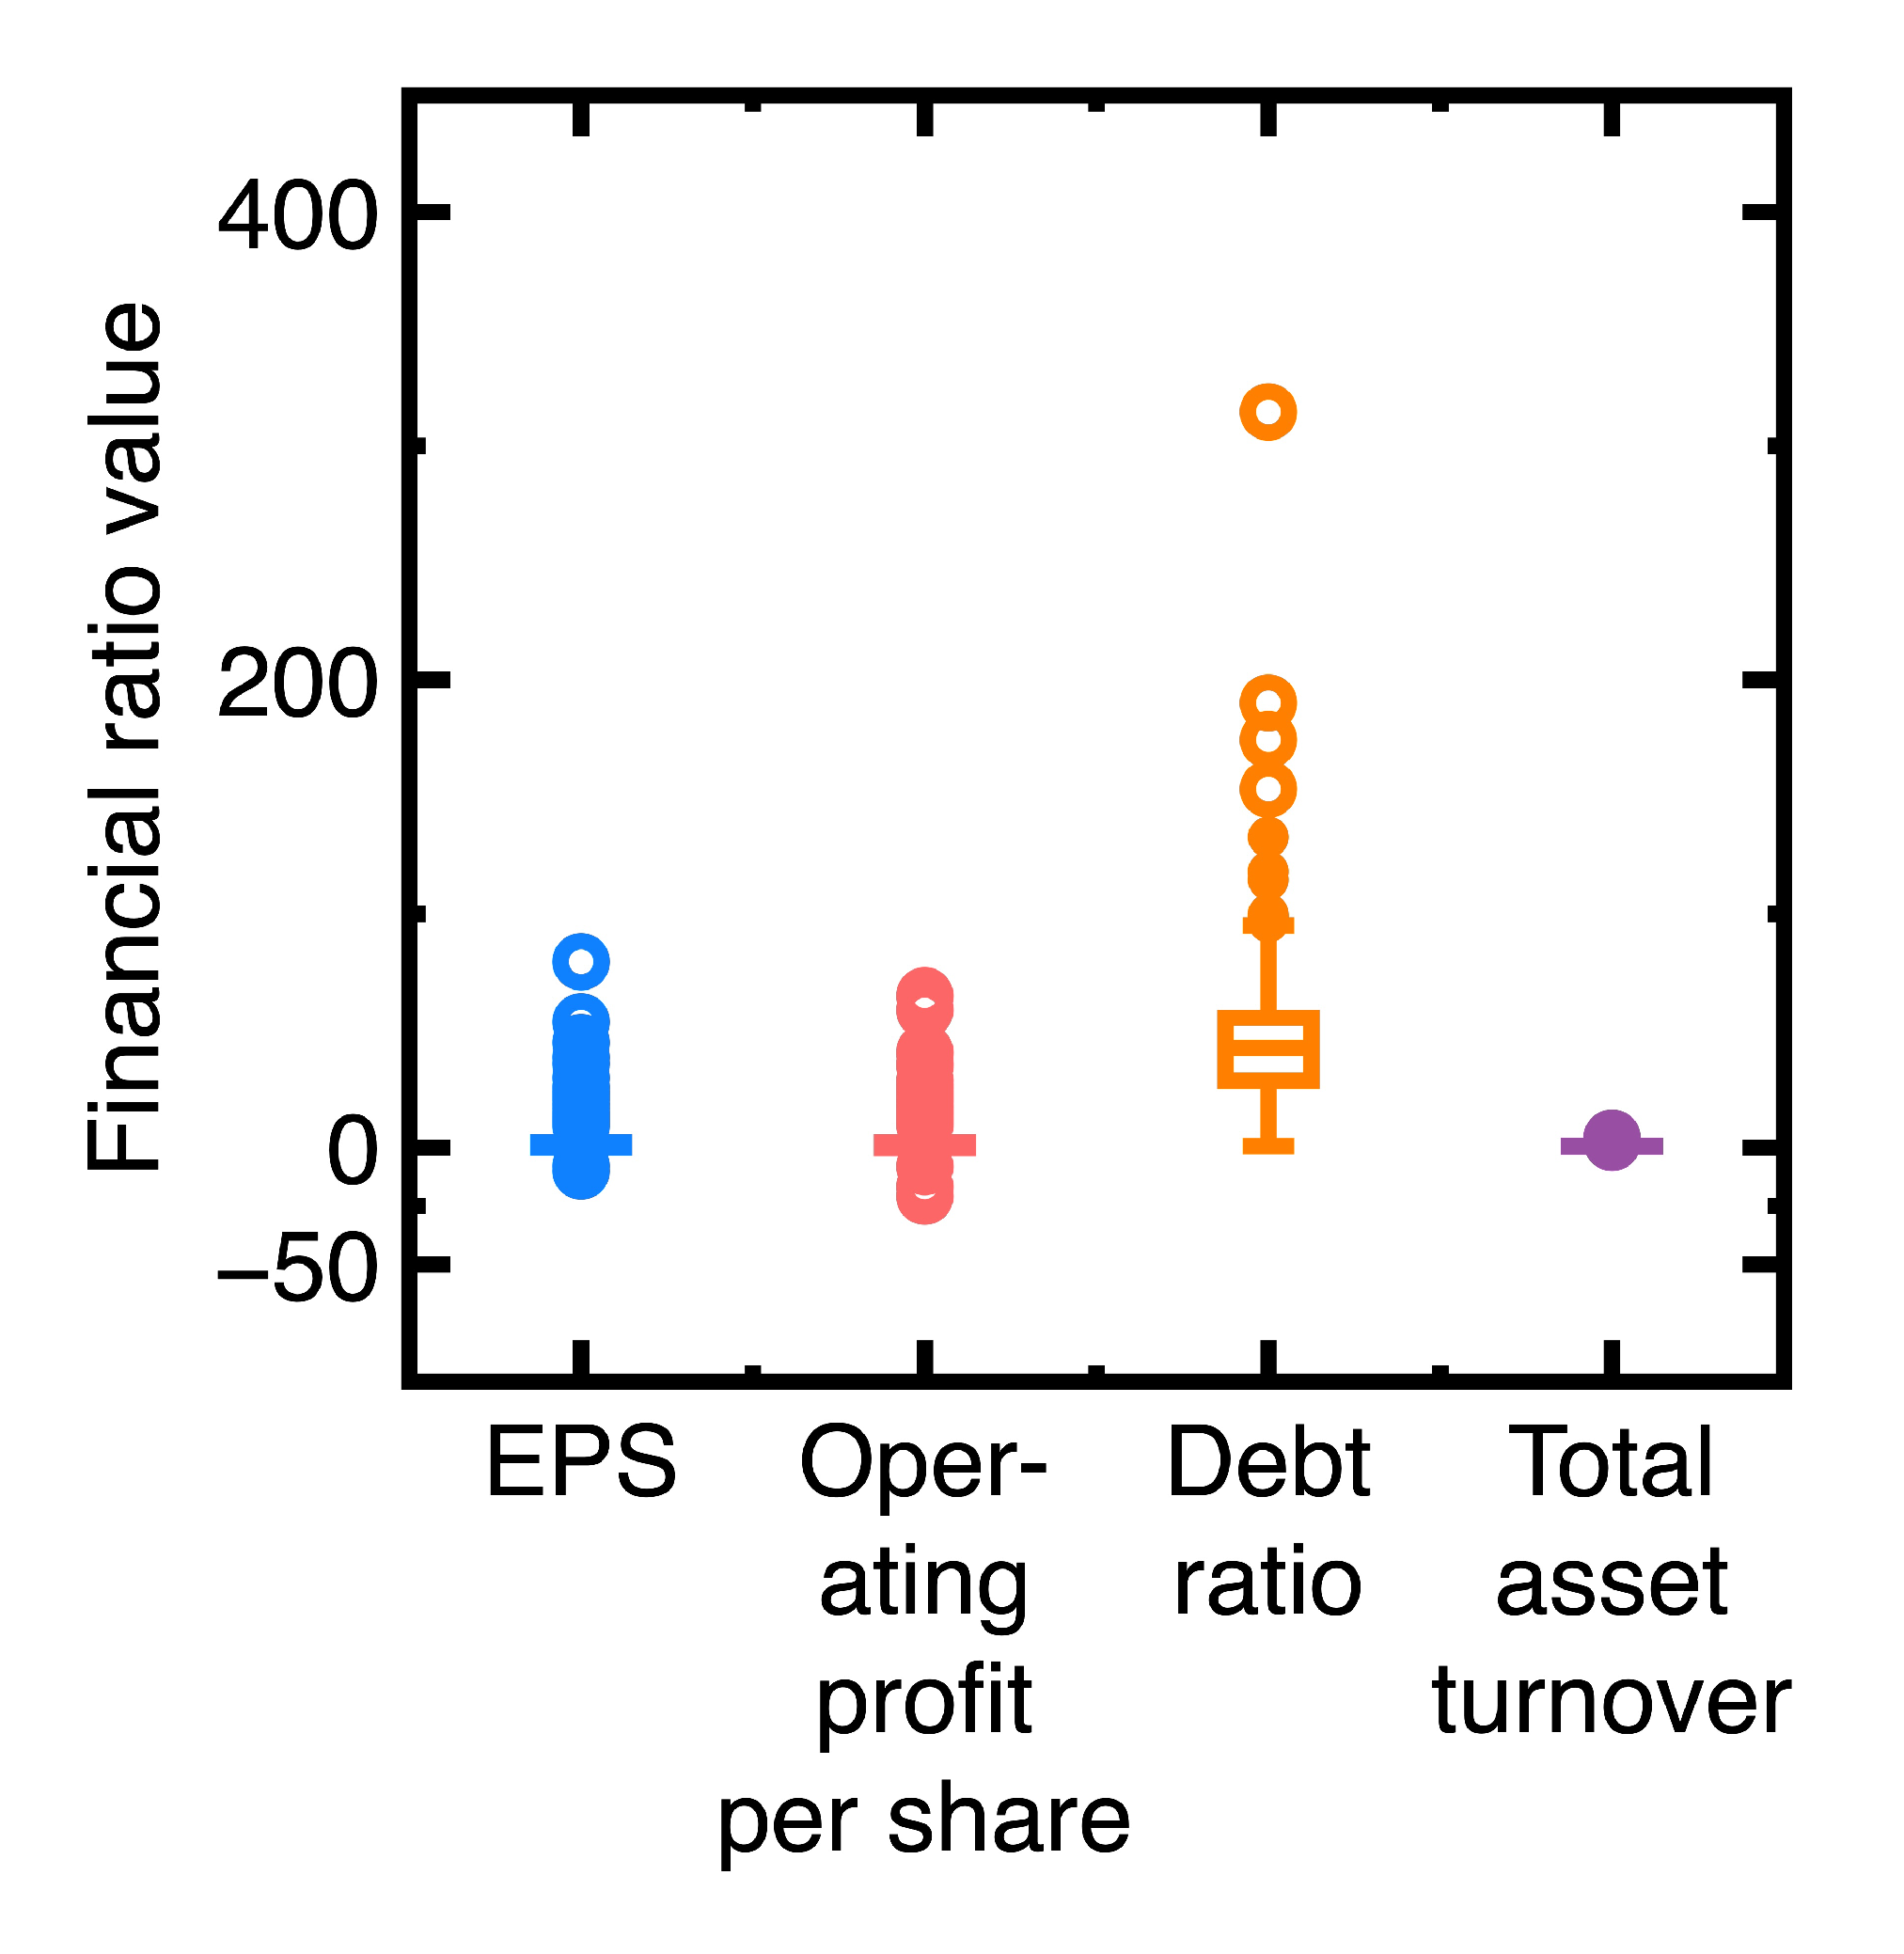
- A company’s financial health remained sufficiently strong between the fourth quarter of 2023 and the first quarter of 2024. An example is the EST Global Apparel Co. Ltd. (Stock No = 4413). Its financial ratios are EPS = 62.52, debt ratio = 13.97, ROA = 58.42, and total and asset turnover = 1.27 in the fourth quarter of 2023. In contrast, these financial ratios changed to EPS = 24.48, debt ratio = 9.72, ROA = 17.76, and total asset turnover = 1.11 in the first quarter of 2024. This company’s financial health kept sufficiently strong.
- The financial health of the company deviated slightly between the fourth quarter of 2023 and the first quarter of 2024. Our classification results indicate that this company’s past and new financial ratio data are in the same class. An example is TBI Motion Technology Co. Ltd. (Stock No = 4540). Its financial ratios in the fourth quarter of 2023 are EPS = -1.09, debt ratio = 58, ROA = -1.34, and total asset turnover = 0.33, whereas these financial ratios changed to EPS = -1.71, debt ratio = 58.73, ROA = -2.15, and total asset turnover = 0.31 in the first quarter of 2024.
4.2. Experiment 2
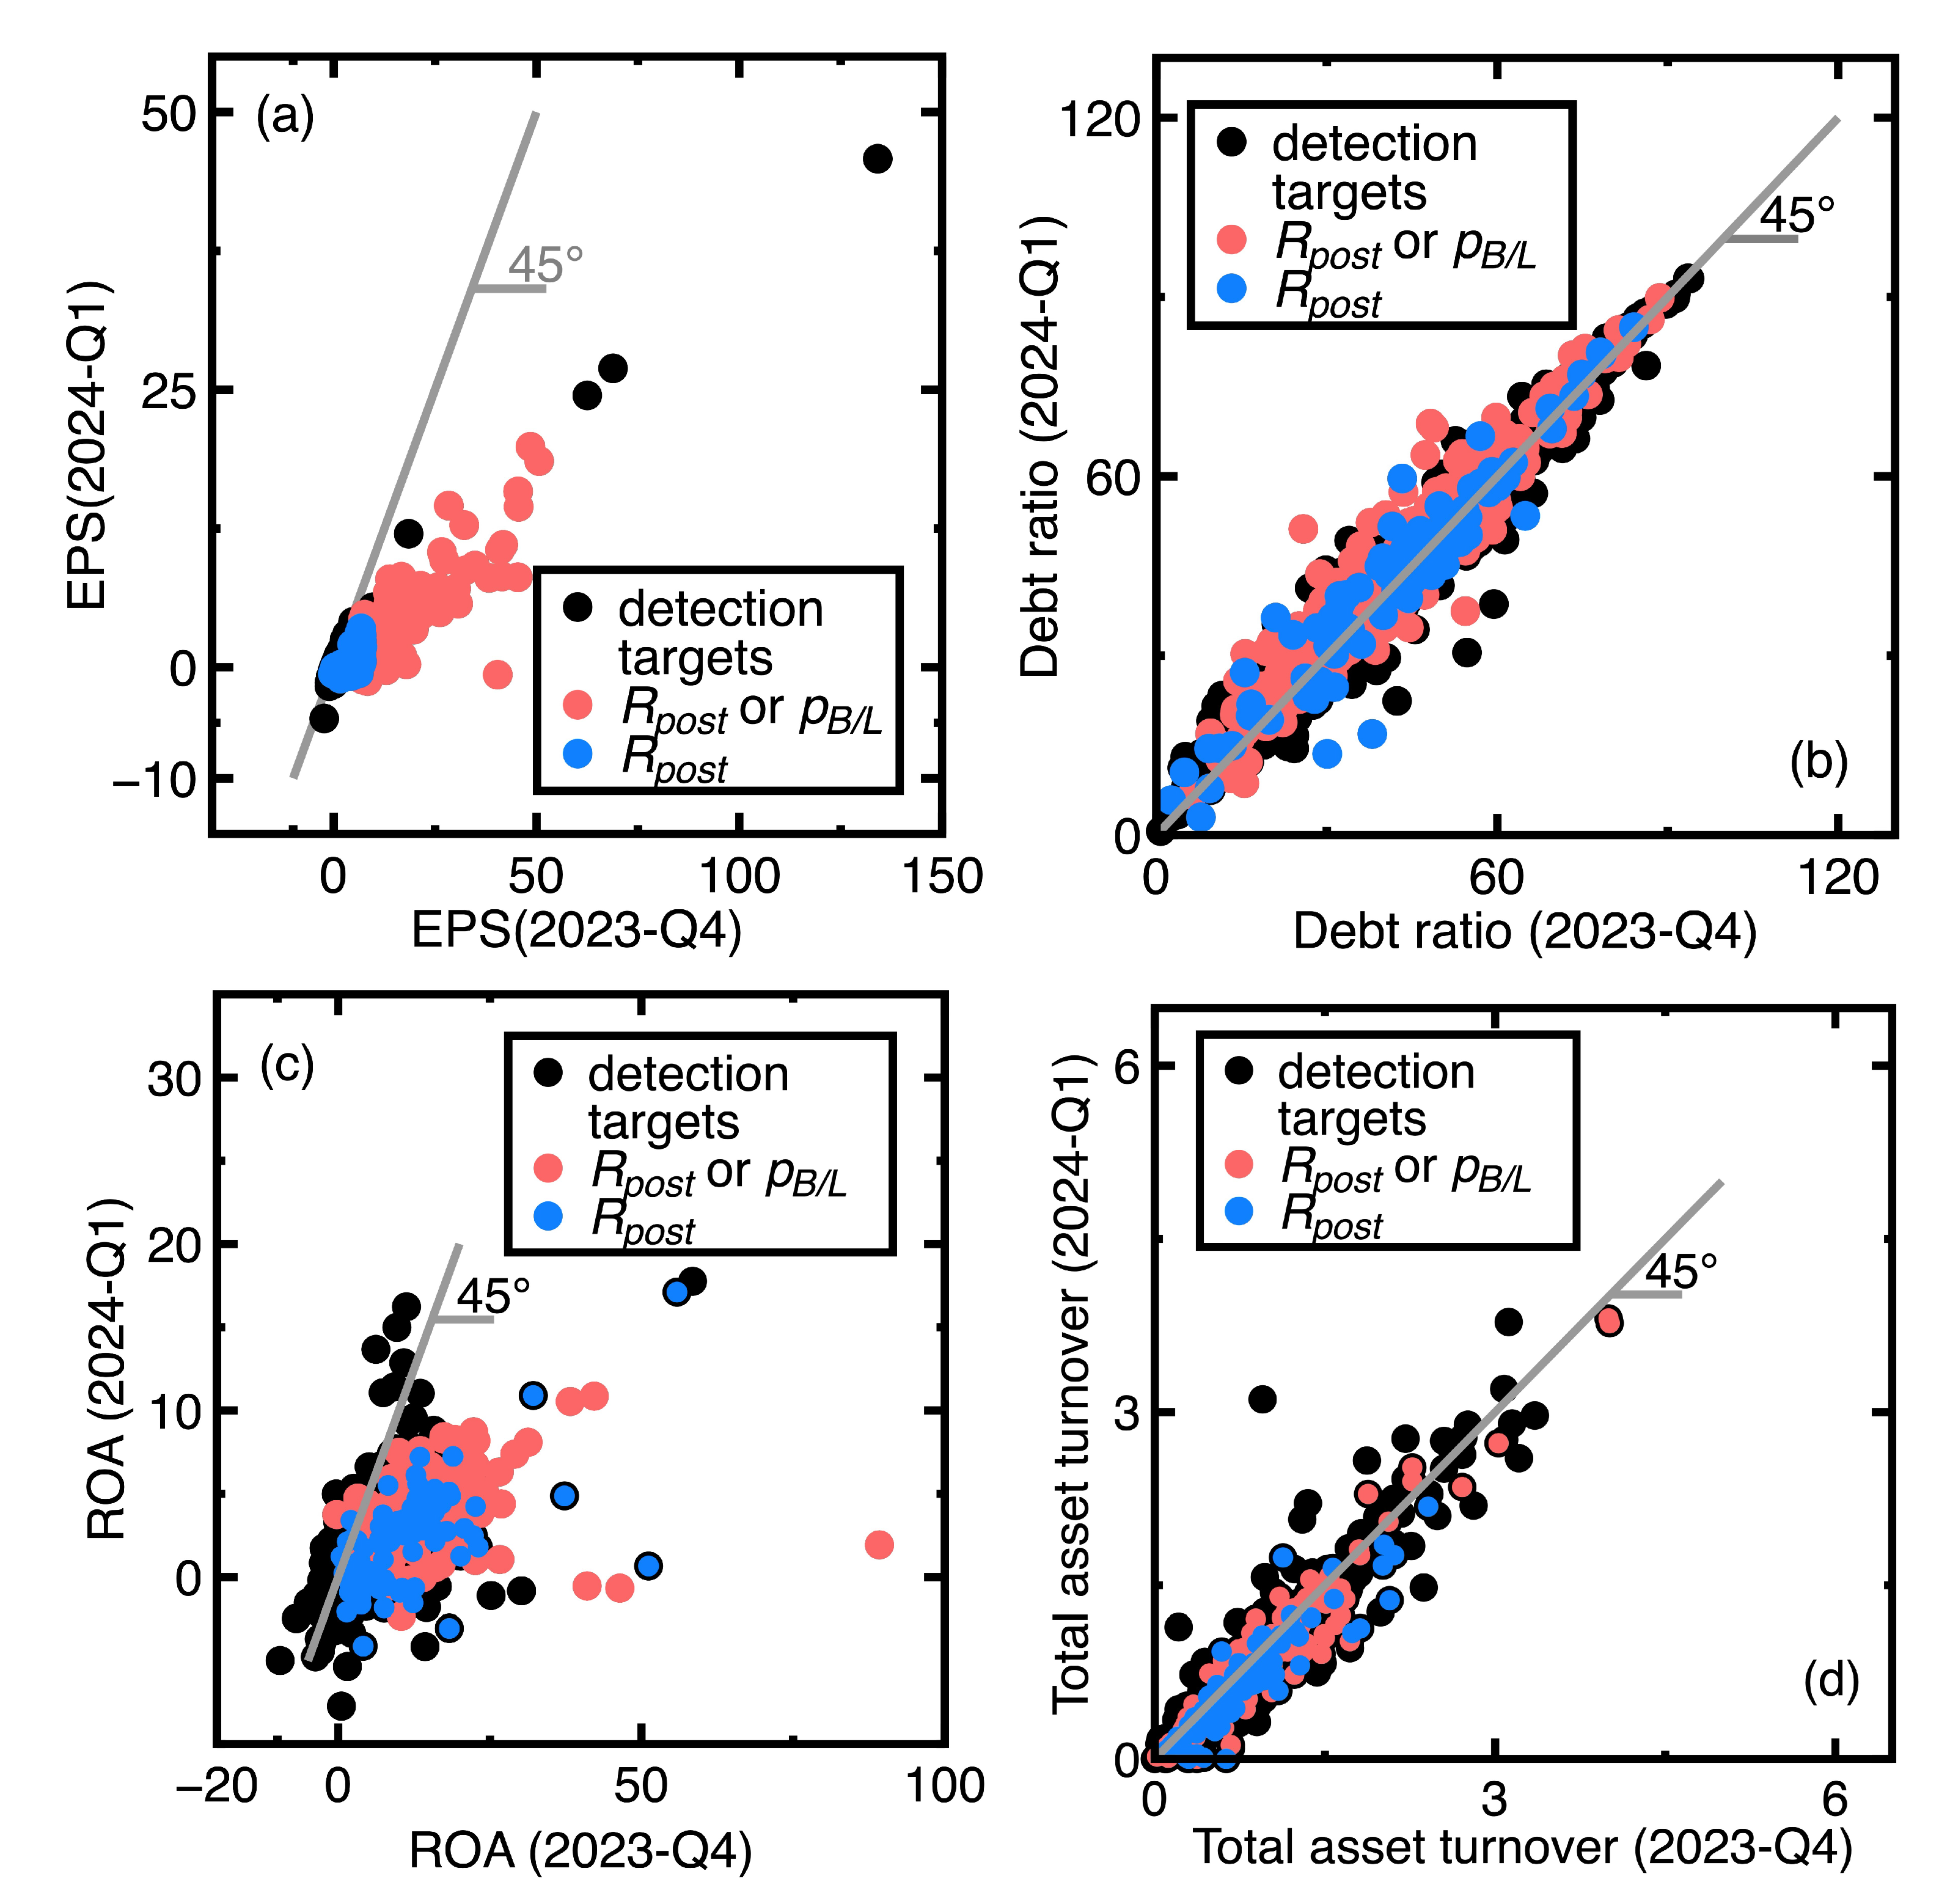
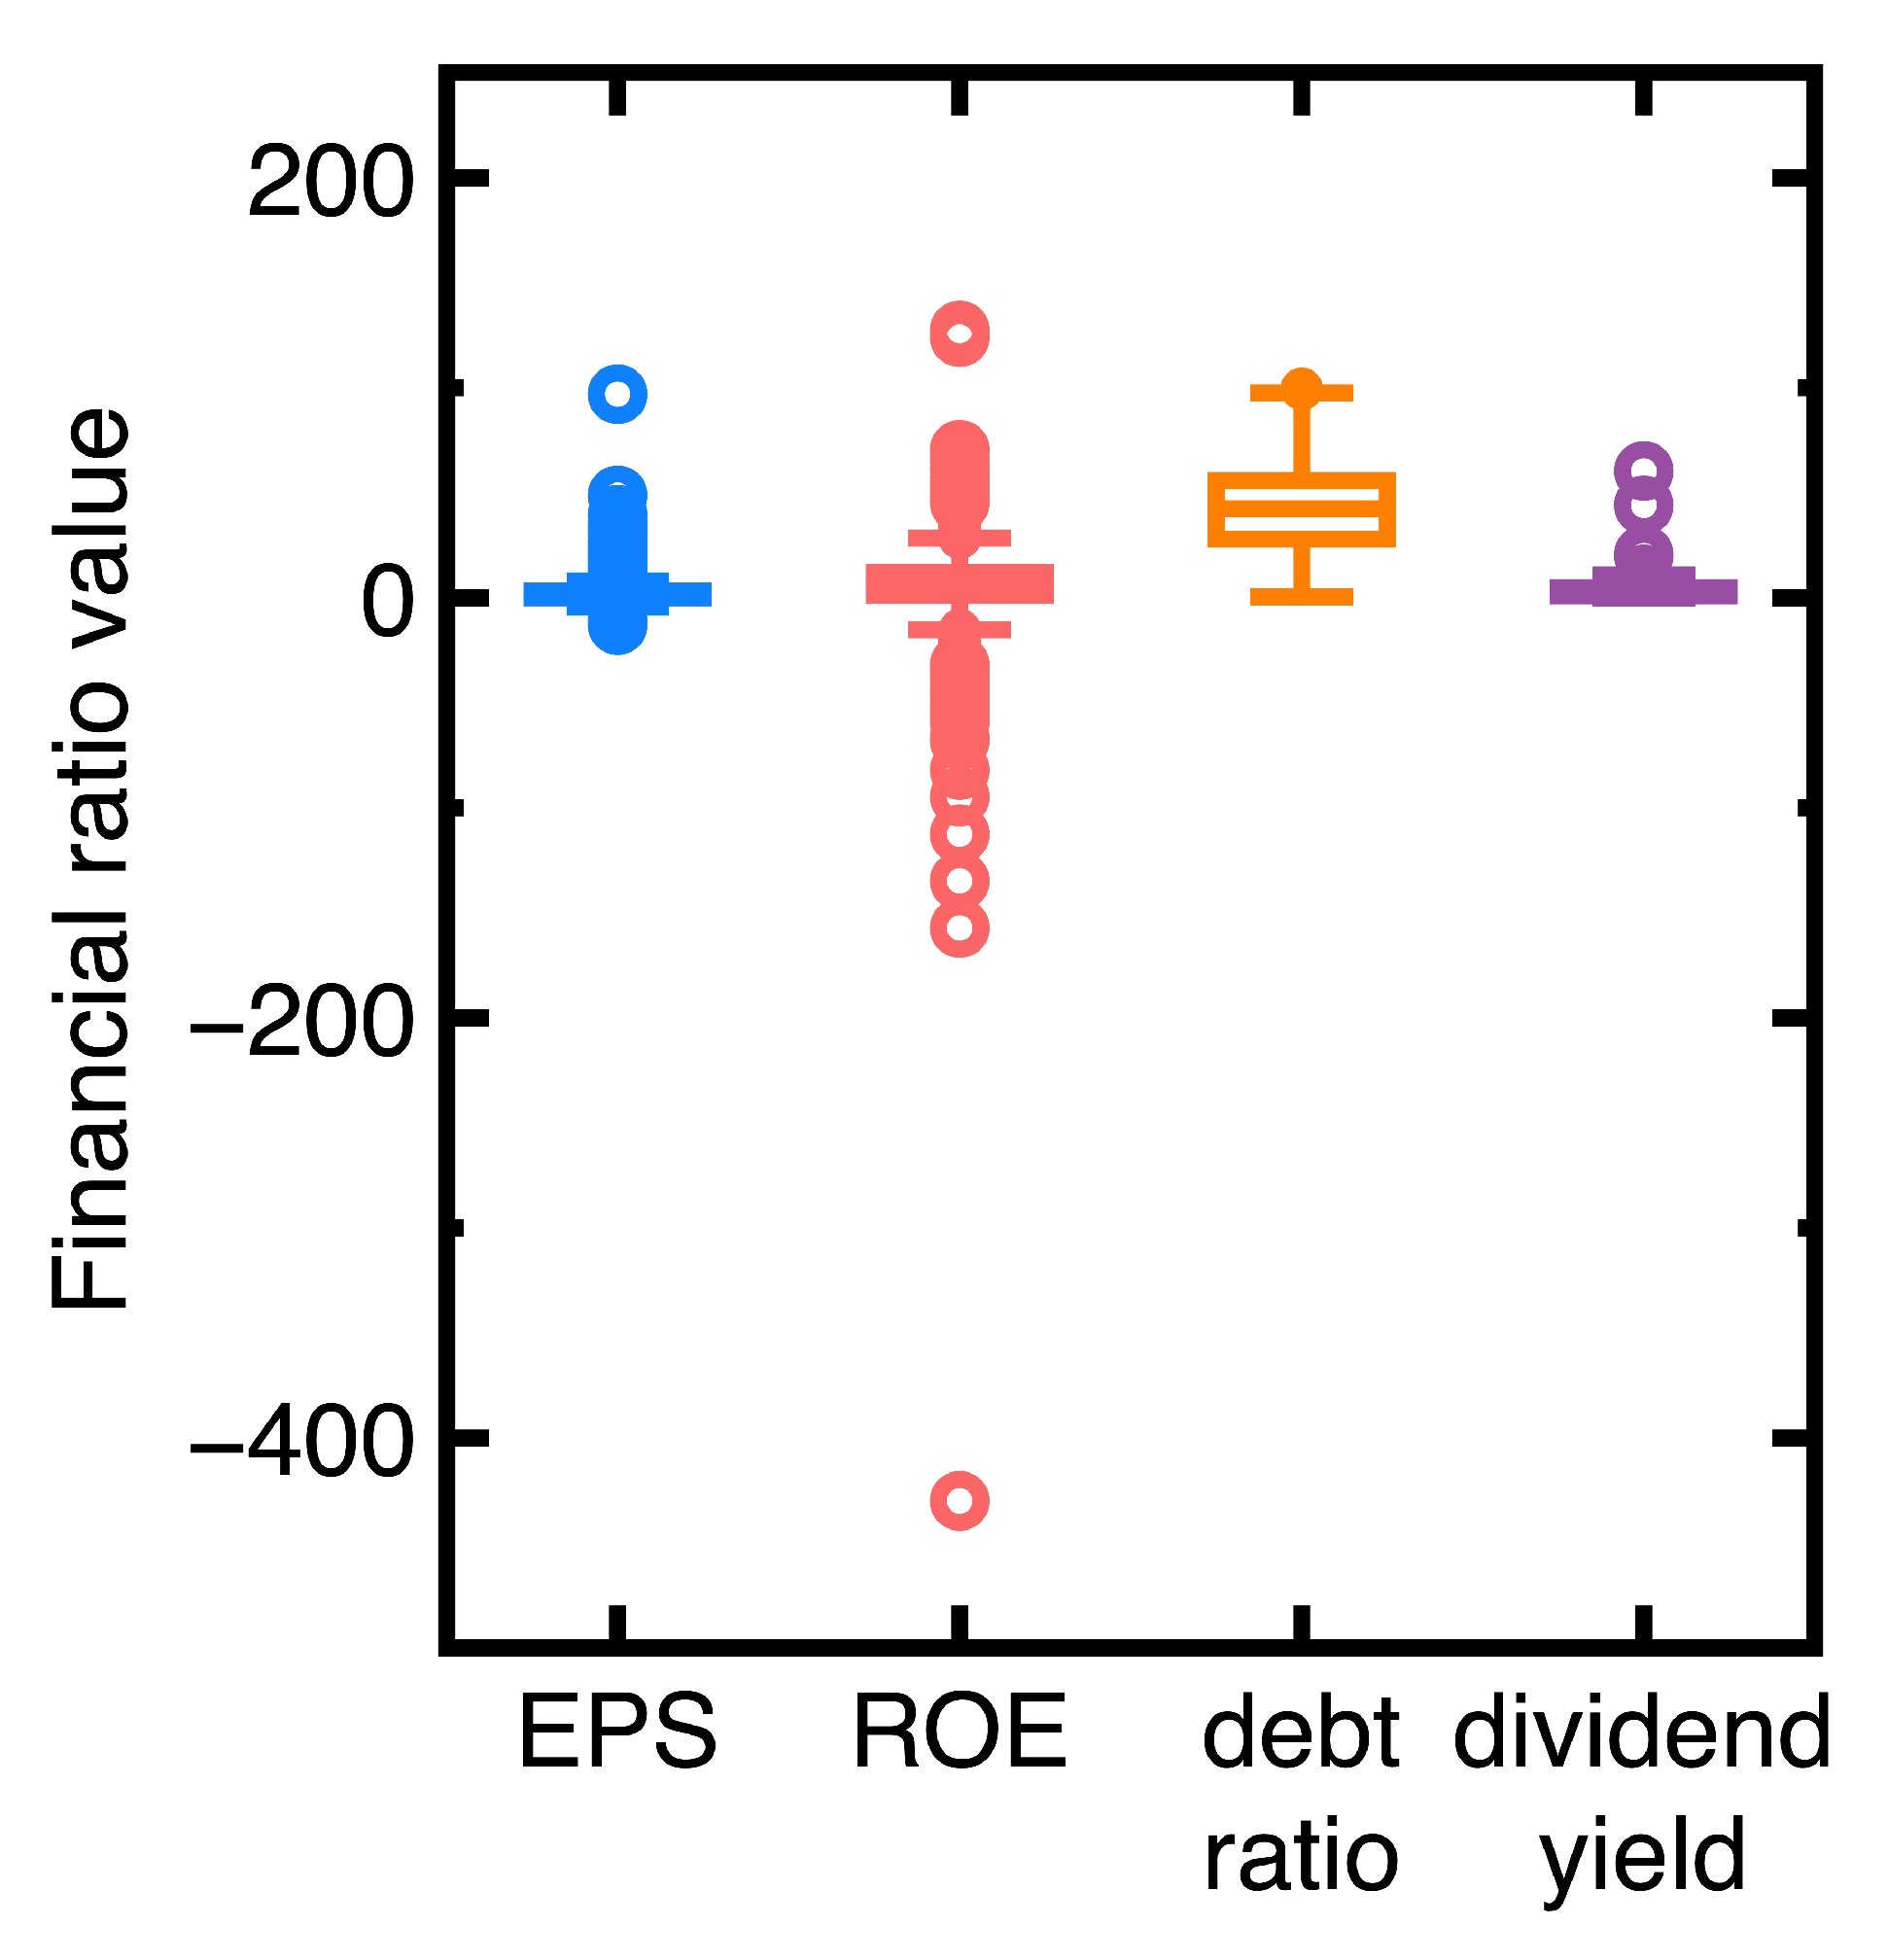
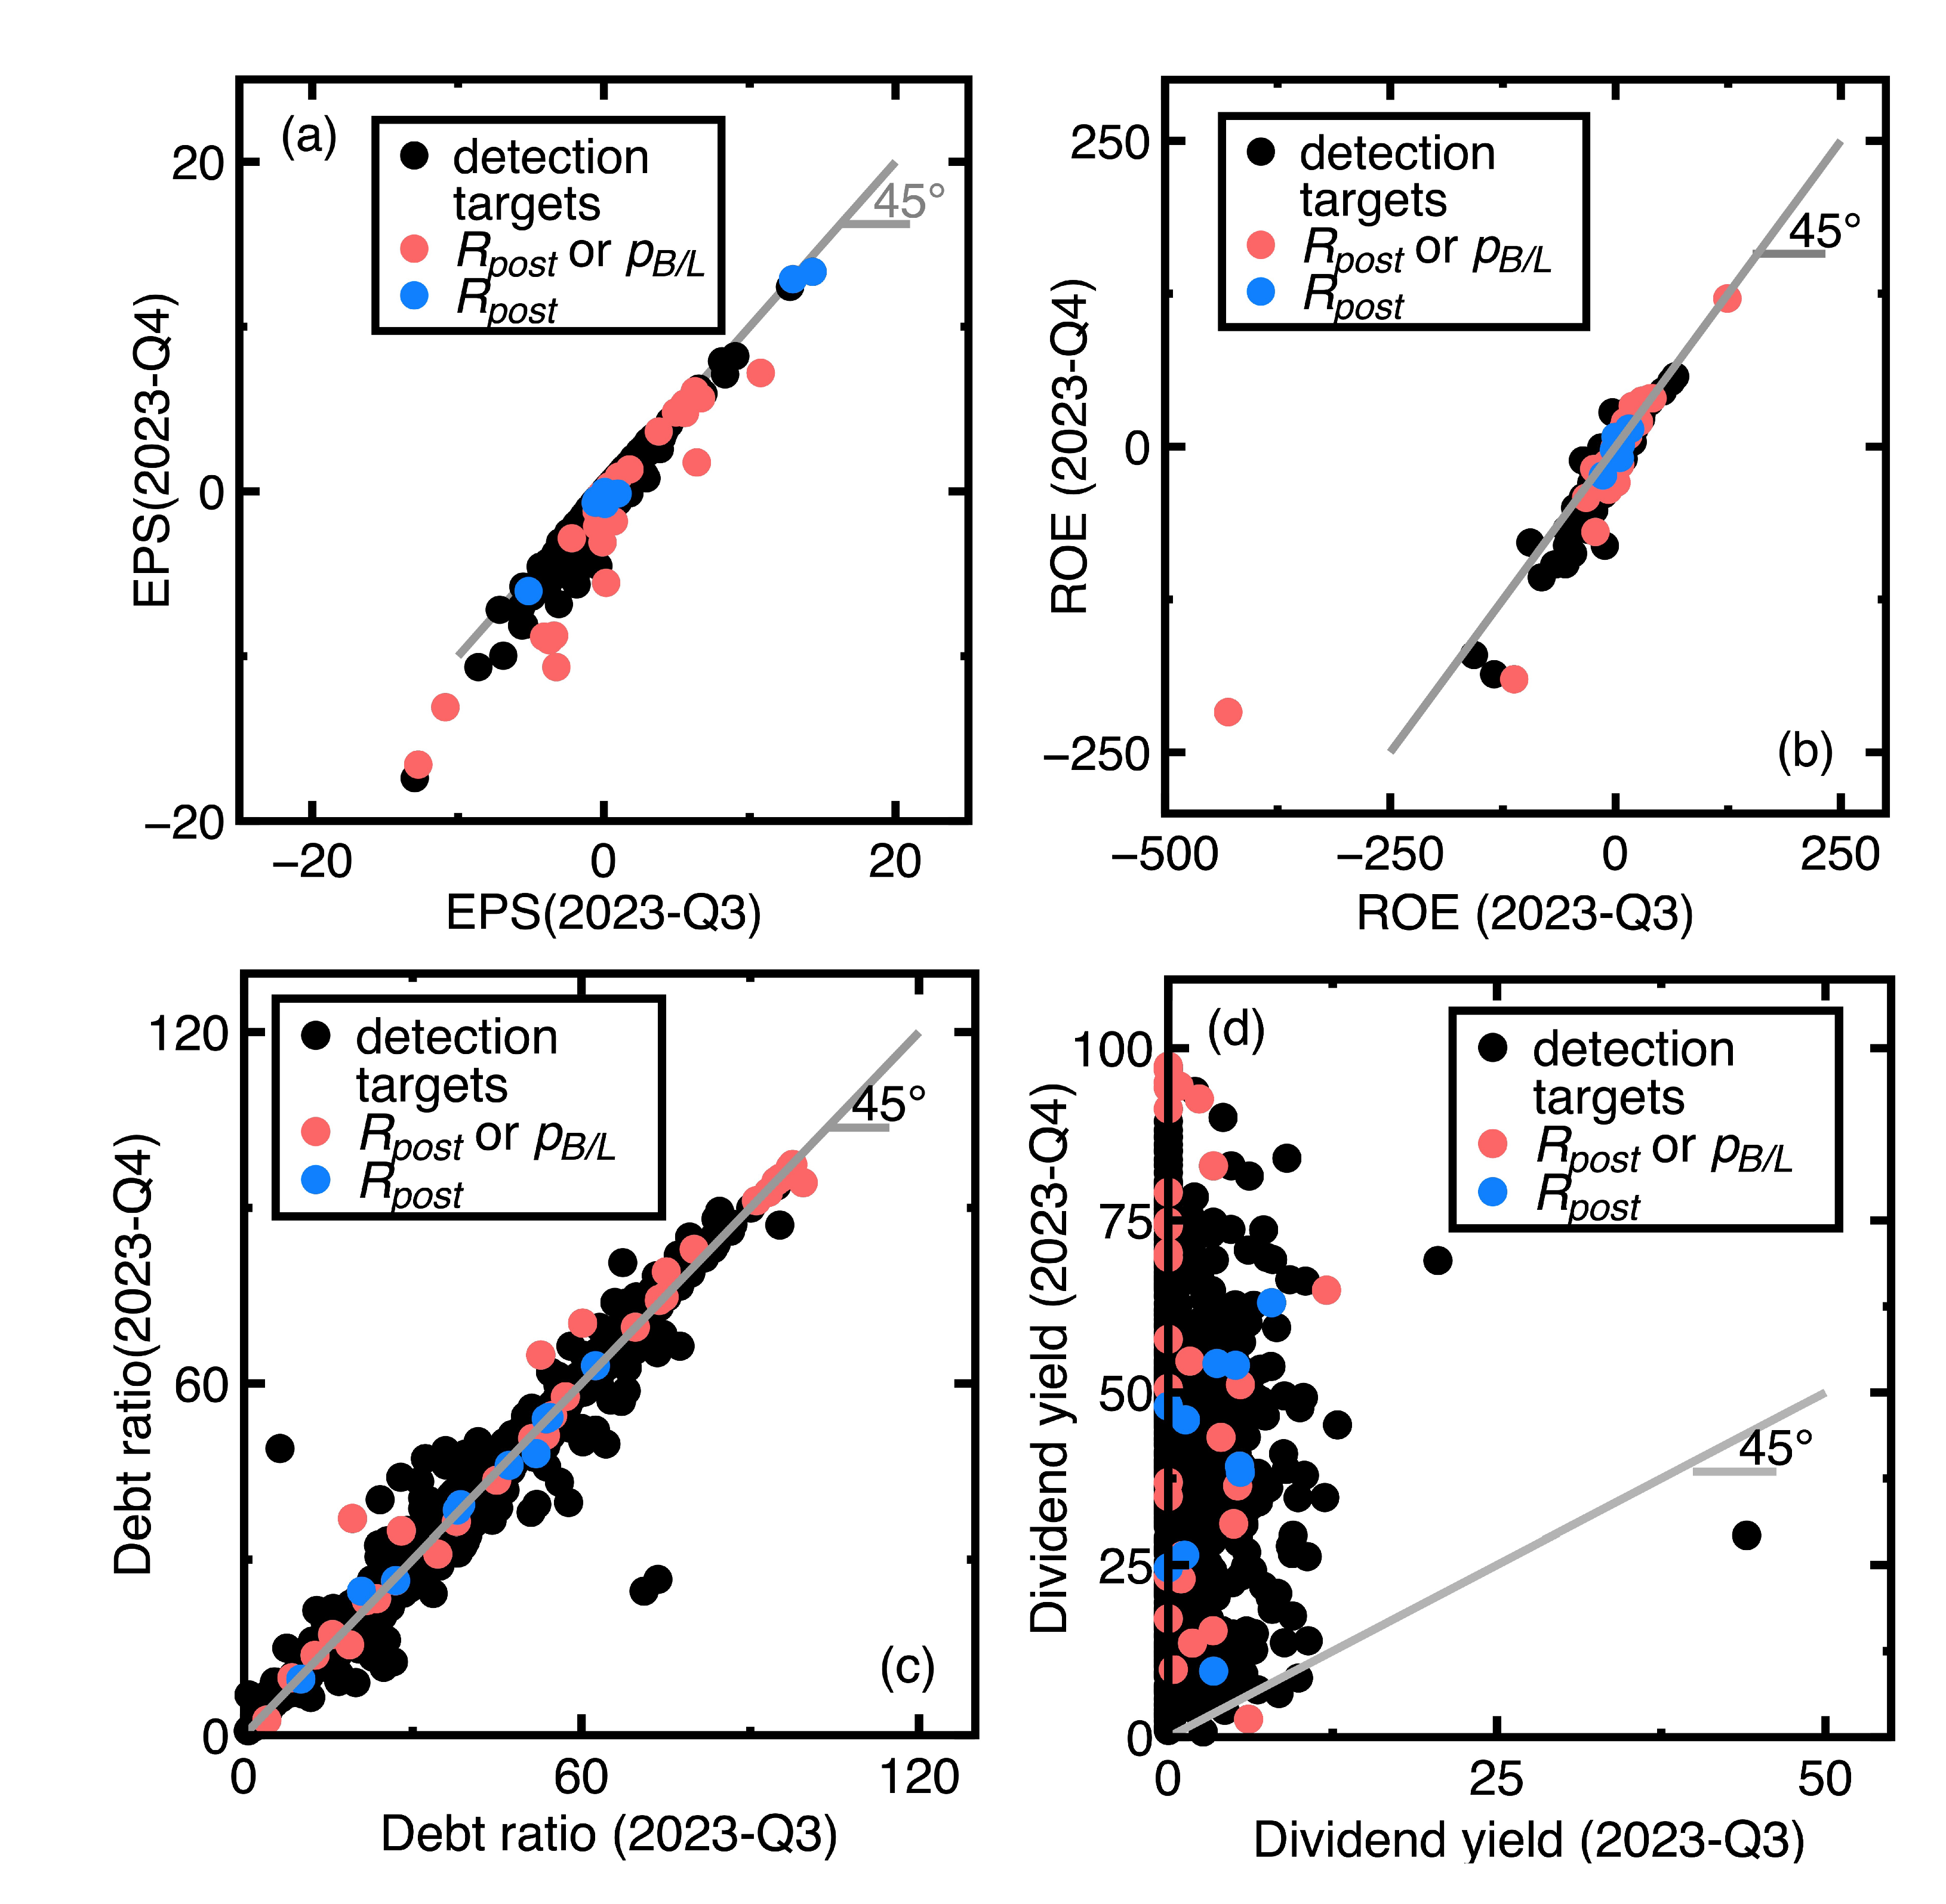
- Similar to Section 4.1, the current section fails to detect targets whose financial health remained sufficiently strong or poor between third and fourth quarters of 2023. An example is the Launch Technologies Co. Ltd. (Stock No = 8420). It generated EPS = -12.97, ROE = -53.87, debt ratio = 58.1, and dividend yield = 9.24 in the third quarter of 2023. These financial ratios changed to EPS = -17.4, ROE = -80.86, debt ratio = 66.37, and dividend yield = 0.0 in the fourth quarter of 2023. These financial ratios show that the company’s financial health kept poor.
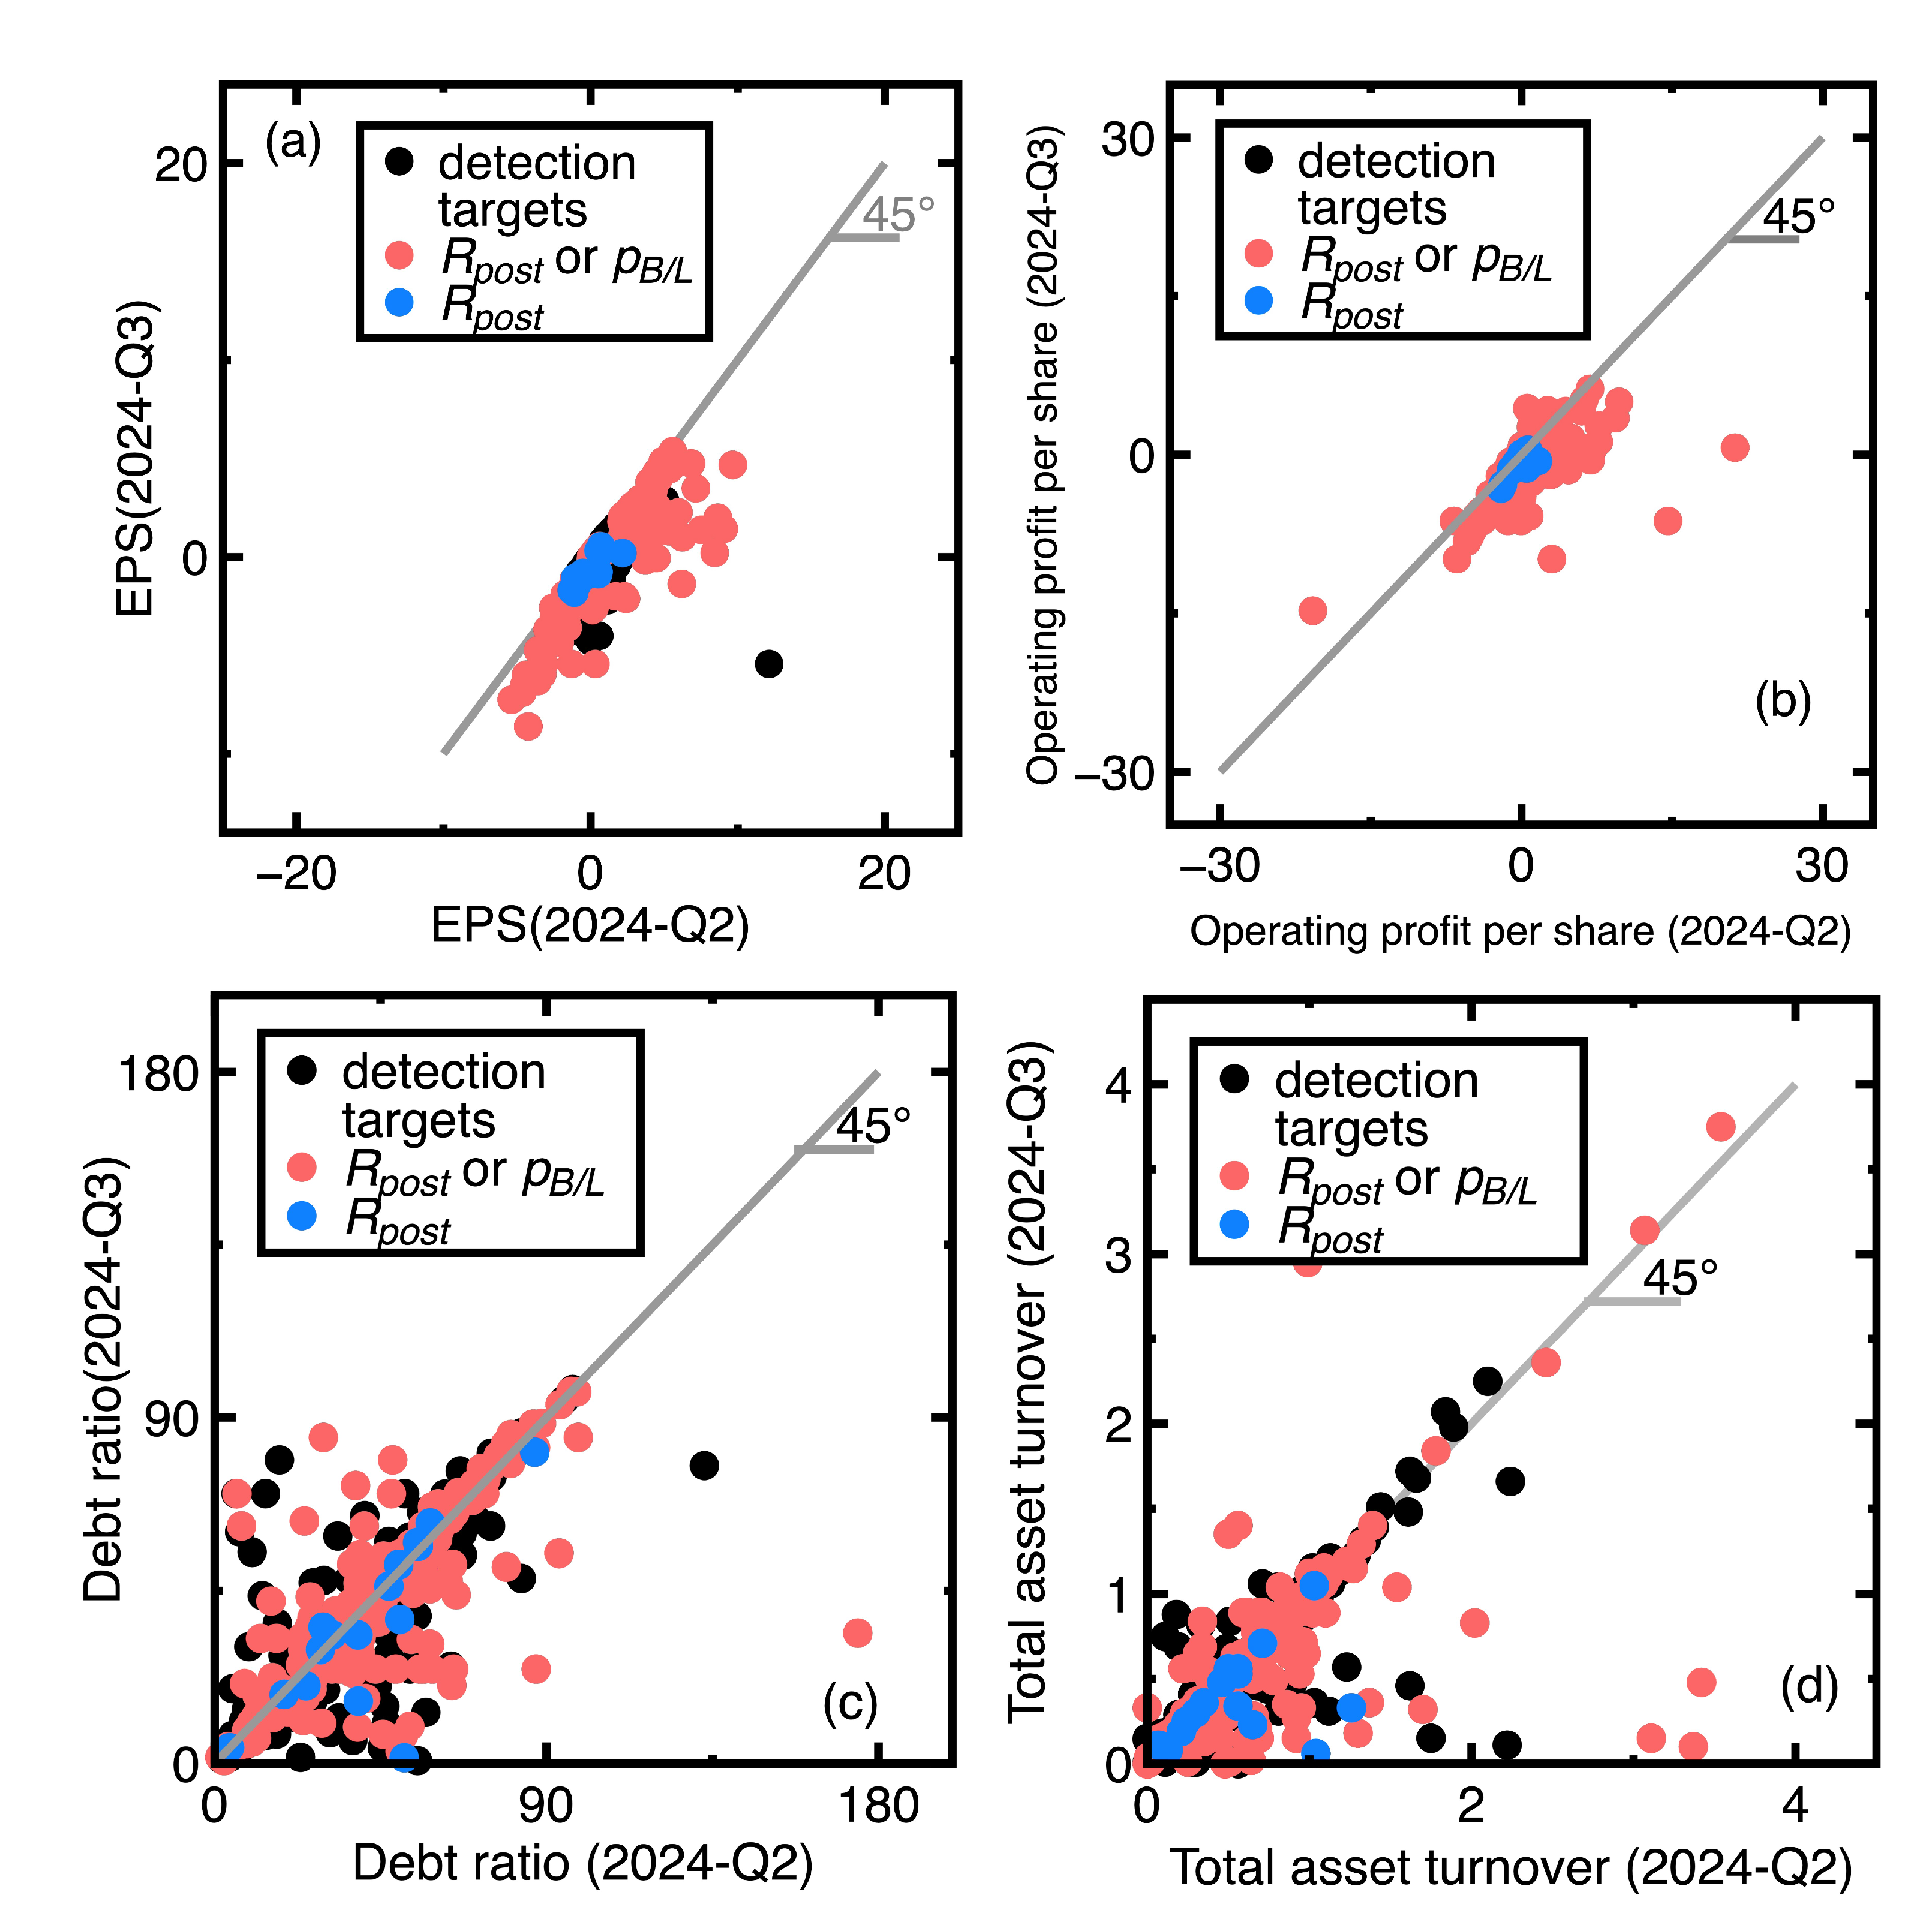
- Figure 7(a), Figure 7(c), and Figure 7(d) show that many unsuccessful detections of companies subjected to declining EPS values but increasing debt ratios and dividend yields between third and fourth quarters of 2024. Conclusively, the financial health of these companies may not be deteriorating. We need more financial ratios to conclude the financial health deterioration. An example is the GeneReach Biotechnology Co. (Stock No = 4171). It provided EPS = -1.88, ROE = -10.84, debt ratio = 23.54, and dividend yield = 9.43 in the third quarter of 2023, whereas these financial ratios changed to EPS = -2.89, ROE = -17.43, debt ratio = 26.67, and dividend yield = 26.67 in the fourth quarter of 2023.
4.3. Experiment 3
5. Discussion
- In detecting chosen targets, this study does not label normal or anomalous data in Section 4. Labeling normal and abnormal data is an essential step of supervised anomaly detection. We replace such a step with classifying data in implementing Section 4.1-Section 4.3.
- We calculate Equation (10) with respect to each member of a . Therefore, it does not miss anomalies that only deviate from expected behavior within a specific context or subspace.
- It is easy to explain or interpret that data satisfying Equation (10) are rare. In Section 4.1-Section 4.3, calculating the signals the subtle changes of financial ratios. Compared to the p-value, the can be a better metric for an early alert of a company’s financial health deterioration.
- Since the computation of Equation (10) does not change the original workflow and pipeline of a Naive Bayes classifier, we seamlessly combine Equations (3), (4), and (10). One can modify old codes to implement a Naive Bayes classifier for anomaly detection.
- If we desire signal anomalies as early as possible, Section 4.3 suggests finely discretizing financial ratios’ distributions to generate a classification model. In this section, generating a fine discretization helps signal subtly declining EPS values earlier.
- The expression of Equation (10) does not contain the reconstruction of input data distributions and calibration of many nuisance parameters. Employing the Bayesian measure of surprise to anomaly detection is more convenient than using other anomalous measures for the same goal (for example, a distance-based one (e.g., [3])).
- Implementing Section 4.1-Section 4.3 uses financial data containing four financial ratios. Computing Equation (10) using these high-dimensional data is not challenging or computationally intensive. It is challenging to define distance-based (e.g., [3]) or density-based (e.g., [3]) anomaly measures using such high-dimensional data.
- Tuning the significance level can improve those unsuccessful detections in Section 4.1-Section 4.3. Nevertheless, too high values may destroy the rarity of detected anomalies.
6. Conclusions
- A Naive Bayes classifier and the Bayesian measure of surprise can be seamlessly combined as a good anomaly detection tool. The resulting tool helps a human expert signal suspicious anomalies earlier.
-
Compared to other anomaly measures, the Bayesian measure of surprise has the following advantages:
- Reconstructing the input data distributions is unnecessary.
- Labeling normal and anomalous data is not required.
- Capture those anomalies that only deviate from the expected behavior within a specific context or subspace.
- Requiring tuning as few parameters as possible.
Author Contributions
Funding
Data Availability Statement
Conflicts of Interest
References
- Bayarri, M.J.; Morales, J. Bayesian measures of surprise for outlier detection. J. Stat. Plan. Inference 2003, 111(1-2), 3–22.
- Razzak, I.; Zafar, K.; Imran, M.; Xu, G. Randomized nonlinear one-class support vector machines with bounded loss function to detect of outliers for large scale IoT data. Future Gener. Comp. Sy., 2020, 112, 715–723. [Google Scholar] [CrossRef]
- Hassan, S.; Abbas, K. A novel anomaly detection method based on adaptive Mahalanobis-squared distance and one-class kNN rule for structural health monitoring under environmental effects. Mech. Syst. Signal. Pr., 2020, 140, 106495. [Google Scholar]
- Benjamin, N.; David, S. Anomaly detection with density estimation. Phys. Rev. D. 2020, 101(7), 075042. [Google Scholar]
- Timo, N.; Stefan, L.; Alexander, S.; Max, M. Analyzing business process anomalies using autoencoders. Mach. Learn. 2018, 107(11), 1875–1893. [Google Scholar]
- Harrou, F.; Kadri, F.; Chaabane, S.; Tahon, C.; Sun, Y. Improved principal component analysis for anomaly detection: Application to an emergency department. Comput. Ind. Eng. 2015, 88, 63–77. [Google Scholar] [CrossRef]
- Sheu, G.Y.; Liu, N.R. Symmetrical and asymmetrical sampling audit evidence using a Naive Bayes classifier. Symmetry, 2024, 16(4), 500.
- Bayarri, M.J.; Morales, J. Bayesian measures of surprise for outlier detection, J. Stat. Plan. Inference, 2003, 111(1-2), 3–22.
- Nassif, A.B.; Talib, M.A.; Nasir, Q.; Dakalbab, F. M. Machine learning for anomaly detection: A systematic review. IEEE Access 2021, 9, 78658–78700. [Google Scholar] [CrossRef]
- Nico, G.; Marius, K.; Konrad, R.; Ulf, B. Toward supervised anomaly detection. J. Artif. Intell. Res. 2014, 46, 235–262. [Google Scholar]
- Bozorgtabar, B.; Mahapatra, D.; Vray, G.; Thiran, J.P. SALAD: Self-supervised Aggregation Learning for Anomaly Detection on X-Rays. In Medical Image Computing and Computer Assisted Intervention - MICCAI 2020. MICCAI 2020. Lecture Notes in Computer Science, Lima, Peru, October 4, 2020; 468–478.
- Zhang, Y.; Wang, J.; Chen, Y.; Yu, H.; Qin, T. Adaptive memory networks with self-supervised learning for unsupervised anomaly detection. IEEE Trans. Knowledge Data Eng. 2023, 35(12), 12068–12080. [Google Scholar] [CrossRef]
- Jungsuk, S.; Hiroki, T.; Yasuo, O.; Koji, N. Toward a more practical unsupervised anomaly detection system. Inf. Sci. 2013, 231, 4–14. [Google Scholar]
- Rac̆ki, D.; Tomaz̆evic̆, D.; Skoc̆aj, D. Combining unsupervised and supervised deep learning approaches for surface anomaly detection. In Proceedings of Sixteenth International Conference on Quality Control by Artificial Vision. Albi, France, June 6-8, 2023; 33–40.
- Lee, K.; Lee, C.H.; Lee, J. Semi-supervised anomaly detection algorithm using probabilistic labeling (SAD-PL). IEEE Access 2021, 9, 142972–142981. [Google Scholar] [CrossRef]
- Gao, F.; Li, J.; Cheng, R.; Zhou, Y.; Ye, Y. ConNet: Deep semi-supervised anomaly detection based on sparse positive samples. IEEE Access 2021, 9, 67249–67259. [Google Scholar] [CrossRef]
- Zhang, J.; Wang, Z.; Meng, J.; Tan, Y.-P.; Yuan, J. Boosting positive and unlabeled learning for anomaly detection with multi-features. IEEE Trans. Multimedia 2019, 21(5), 1332–1344. [Google Scholar] [CrossRef]
- Khloud, A.J.; Mohamad, A.; Said, M.D. Anomaly detection optimization using big data and deep learning to reduce false-positive. J. Big Data. 2020, 7(1), 68. [Google Scholar]
- Razzak, I.; Moustafa, N.; Mumtaz, S.; Xu, G. One-class tensor machine with randomized projection for large-scale anomaly detection in high-dimensional and noisy data. Int. J. Intell. Syst. 2022, 37(8), 4515–4536. [Google Scholar] [CrossRef]
- Hayes, M.A.; Capretz, M.A.M. Contextual anomaly detection framework for big sensor data. J. Big Data. 2015, 2(1), 2. [Google Scholar] [CrossRef]
- Raginsky, M.; Willett, R.M.; Horn, C.; Silva, J.; Marcia, R.F. Sequential anomaly detection in the presence of noise and limited feedback. IEEE Trans. Inf. Theory 2012, 58(8), 5544–5562. [Google Scholar] [CrossRef]
- Deng, H.; Sun, Y.; Chang, Y.; Han, J. Probabilistic Models for Classification, In Data Classification: Algorithms and Applications; Aggarwal, C.C., Ed.; Chapman and Hall/CRC: New York, USA, 2014; pp. 65–86. [Google Scholar]
- Rubin, D.B. Bayesianly justifiable and relevant frequency calculations for the applied statistician. Ann. Stat. 1984, 12(4), 1151–1172. [Google Scholar] [CrossRef]
- Bayarri, M. J.; Morales, J. Bayesian measures of surprise for outlier detection. J. Stat. Plan. Inference 2003, 111(1-2), 3-22.
- Good, I.J. The surprise index for the multivariate normal distribution. Ann. Math. Stat. 1956, 27(4), 1130–1135. [Google Scholar] [CrossRef]
- Berger, J.Q. Statistical Decision Theory and Bayesian Analysis, 2nd ed.; Spring-Verlag: New York, NY, USA, 1985. [Google Scholar]
- Kliestik, T.; Valaskova, I.; Lăzărohu, G.; Kovác̆ová, M; Vrbka, J. Remaining financially healthy and competitive: The role of financial predictions J. Compet. 2020, 12(1), 74-92.
- Benjamin, S.; Paul, J. H.; Smith, D. B.; Salvaggio, A. N. Which comes first: employee attributes or organizational financial and market performance? J. Appl. Psychol. 2003, 88(5), 836–851. [Google Scholar]

| Metric | Weighted averaged Value |
|---|---|
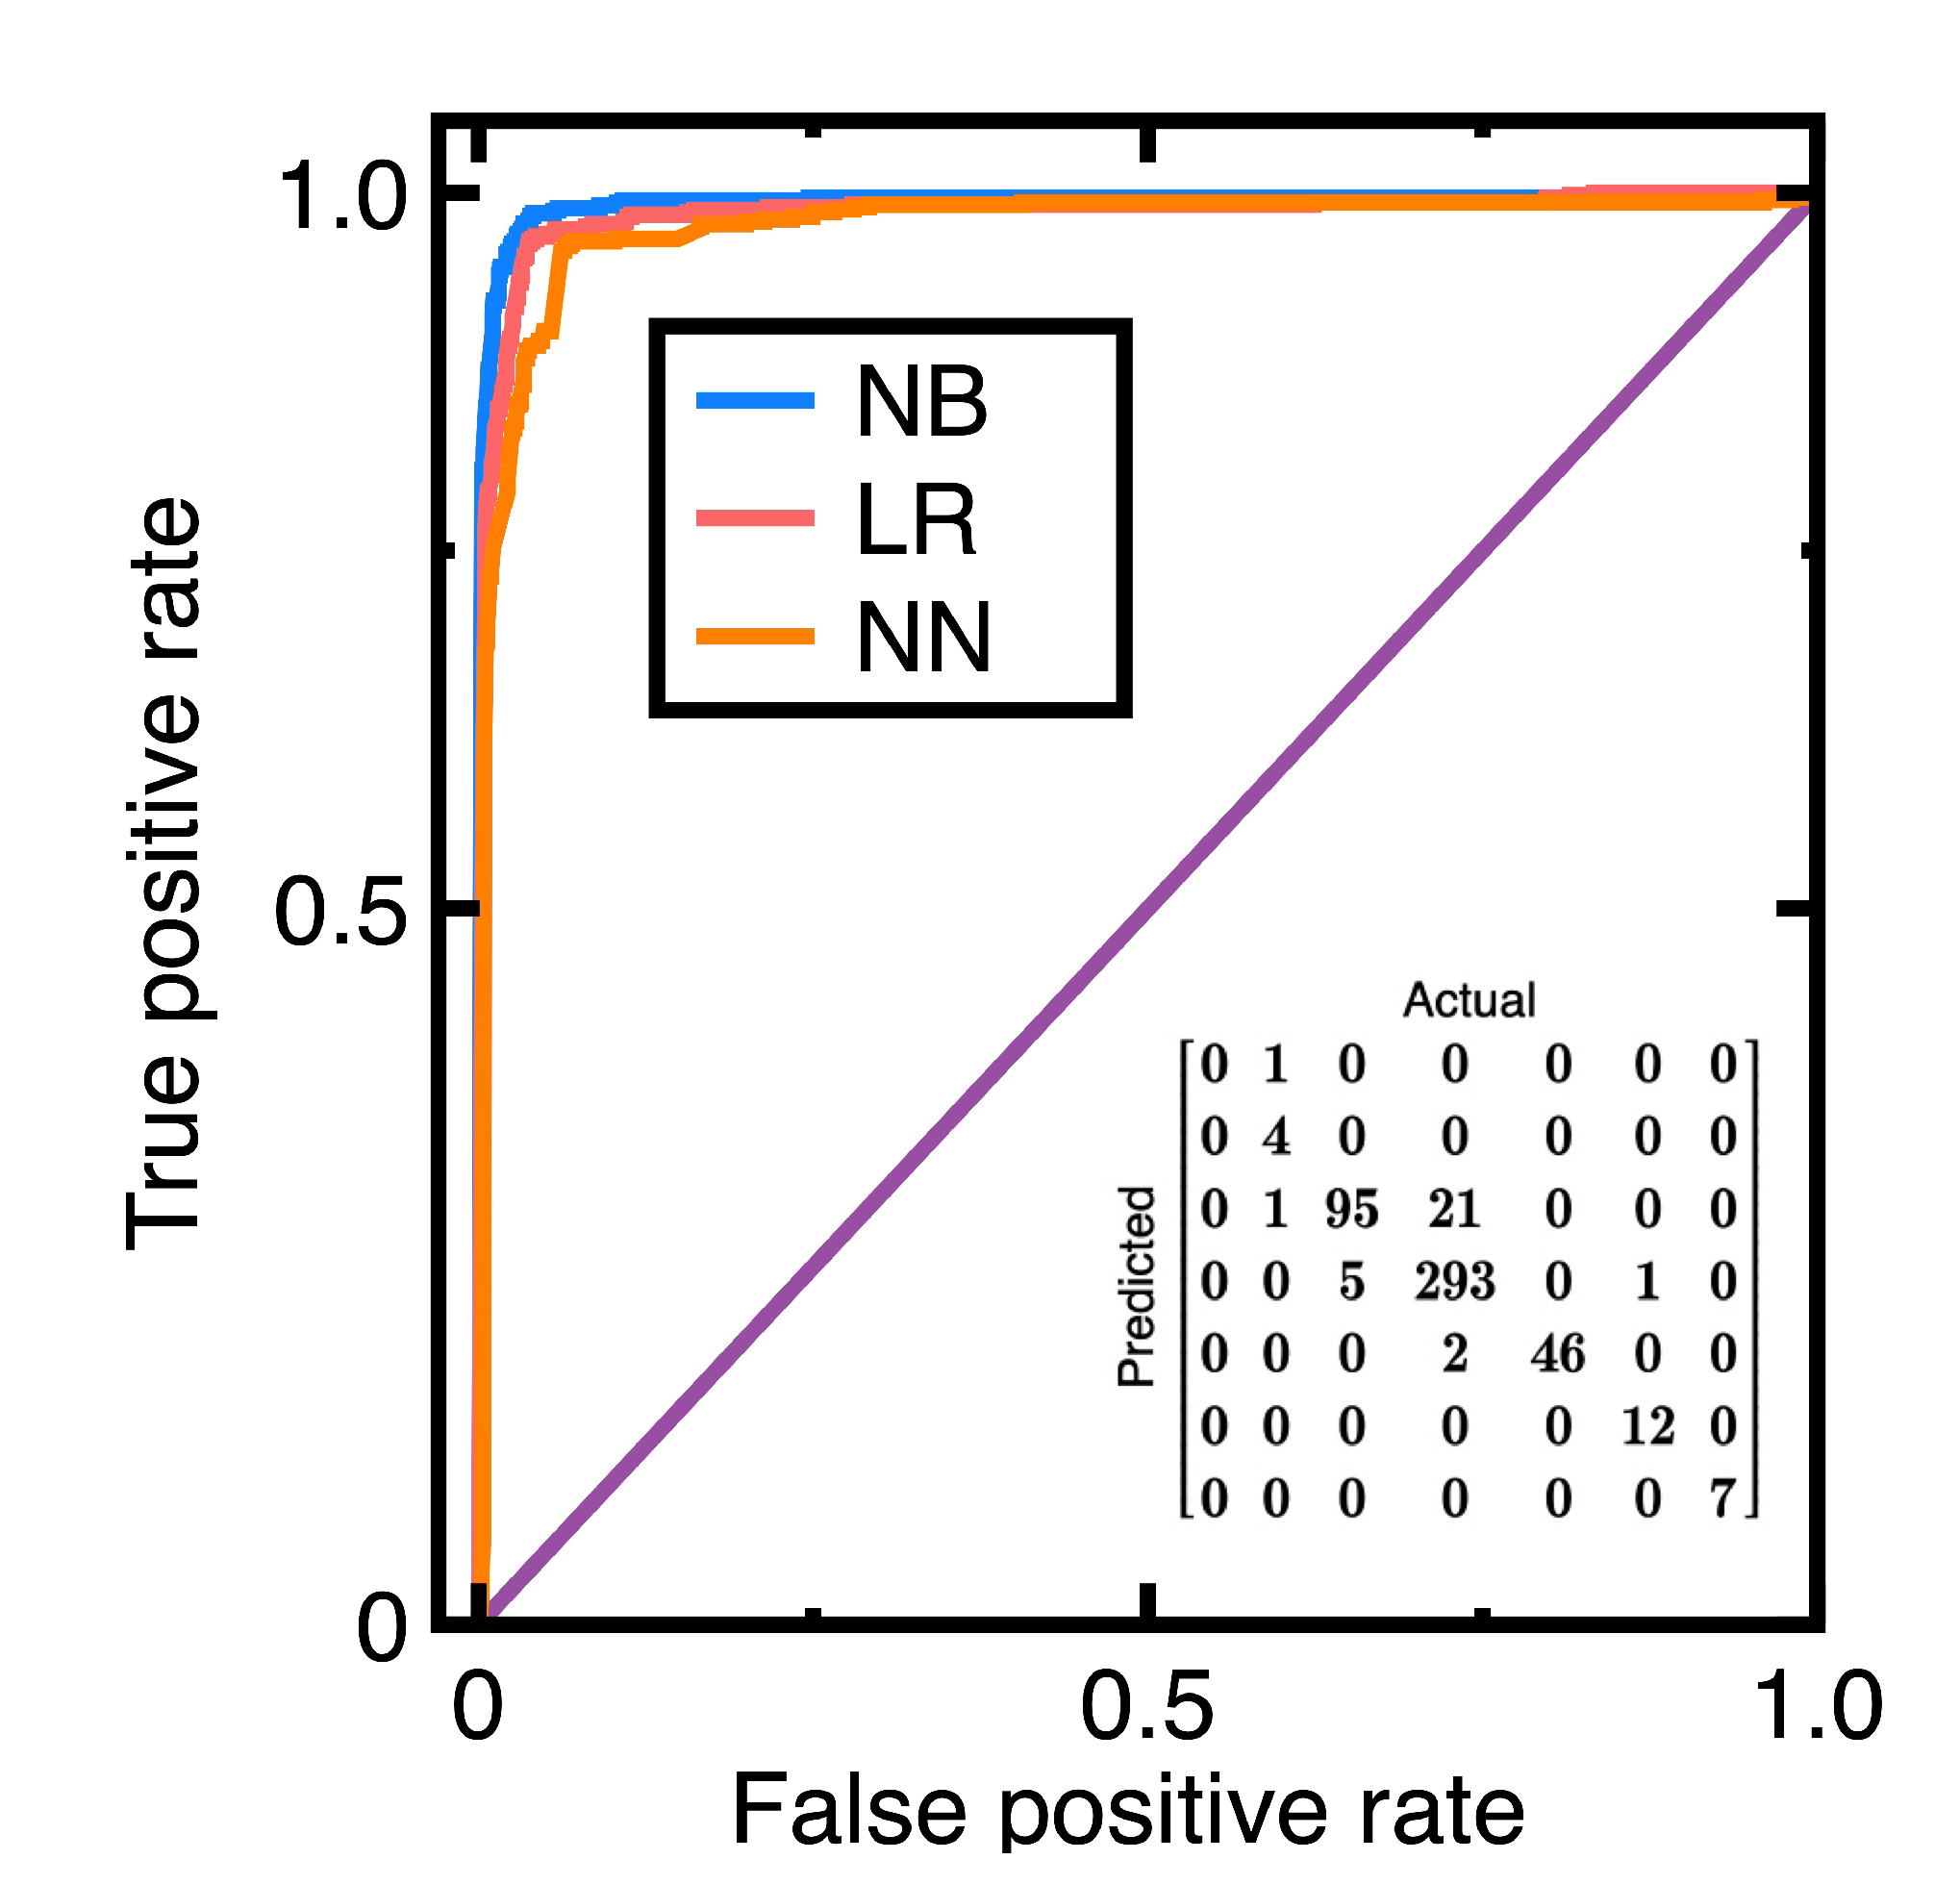
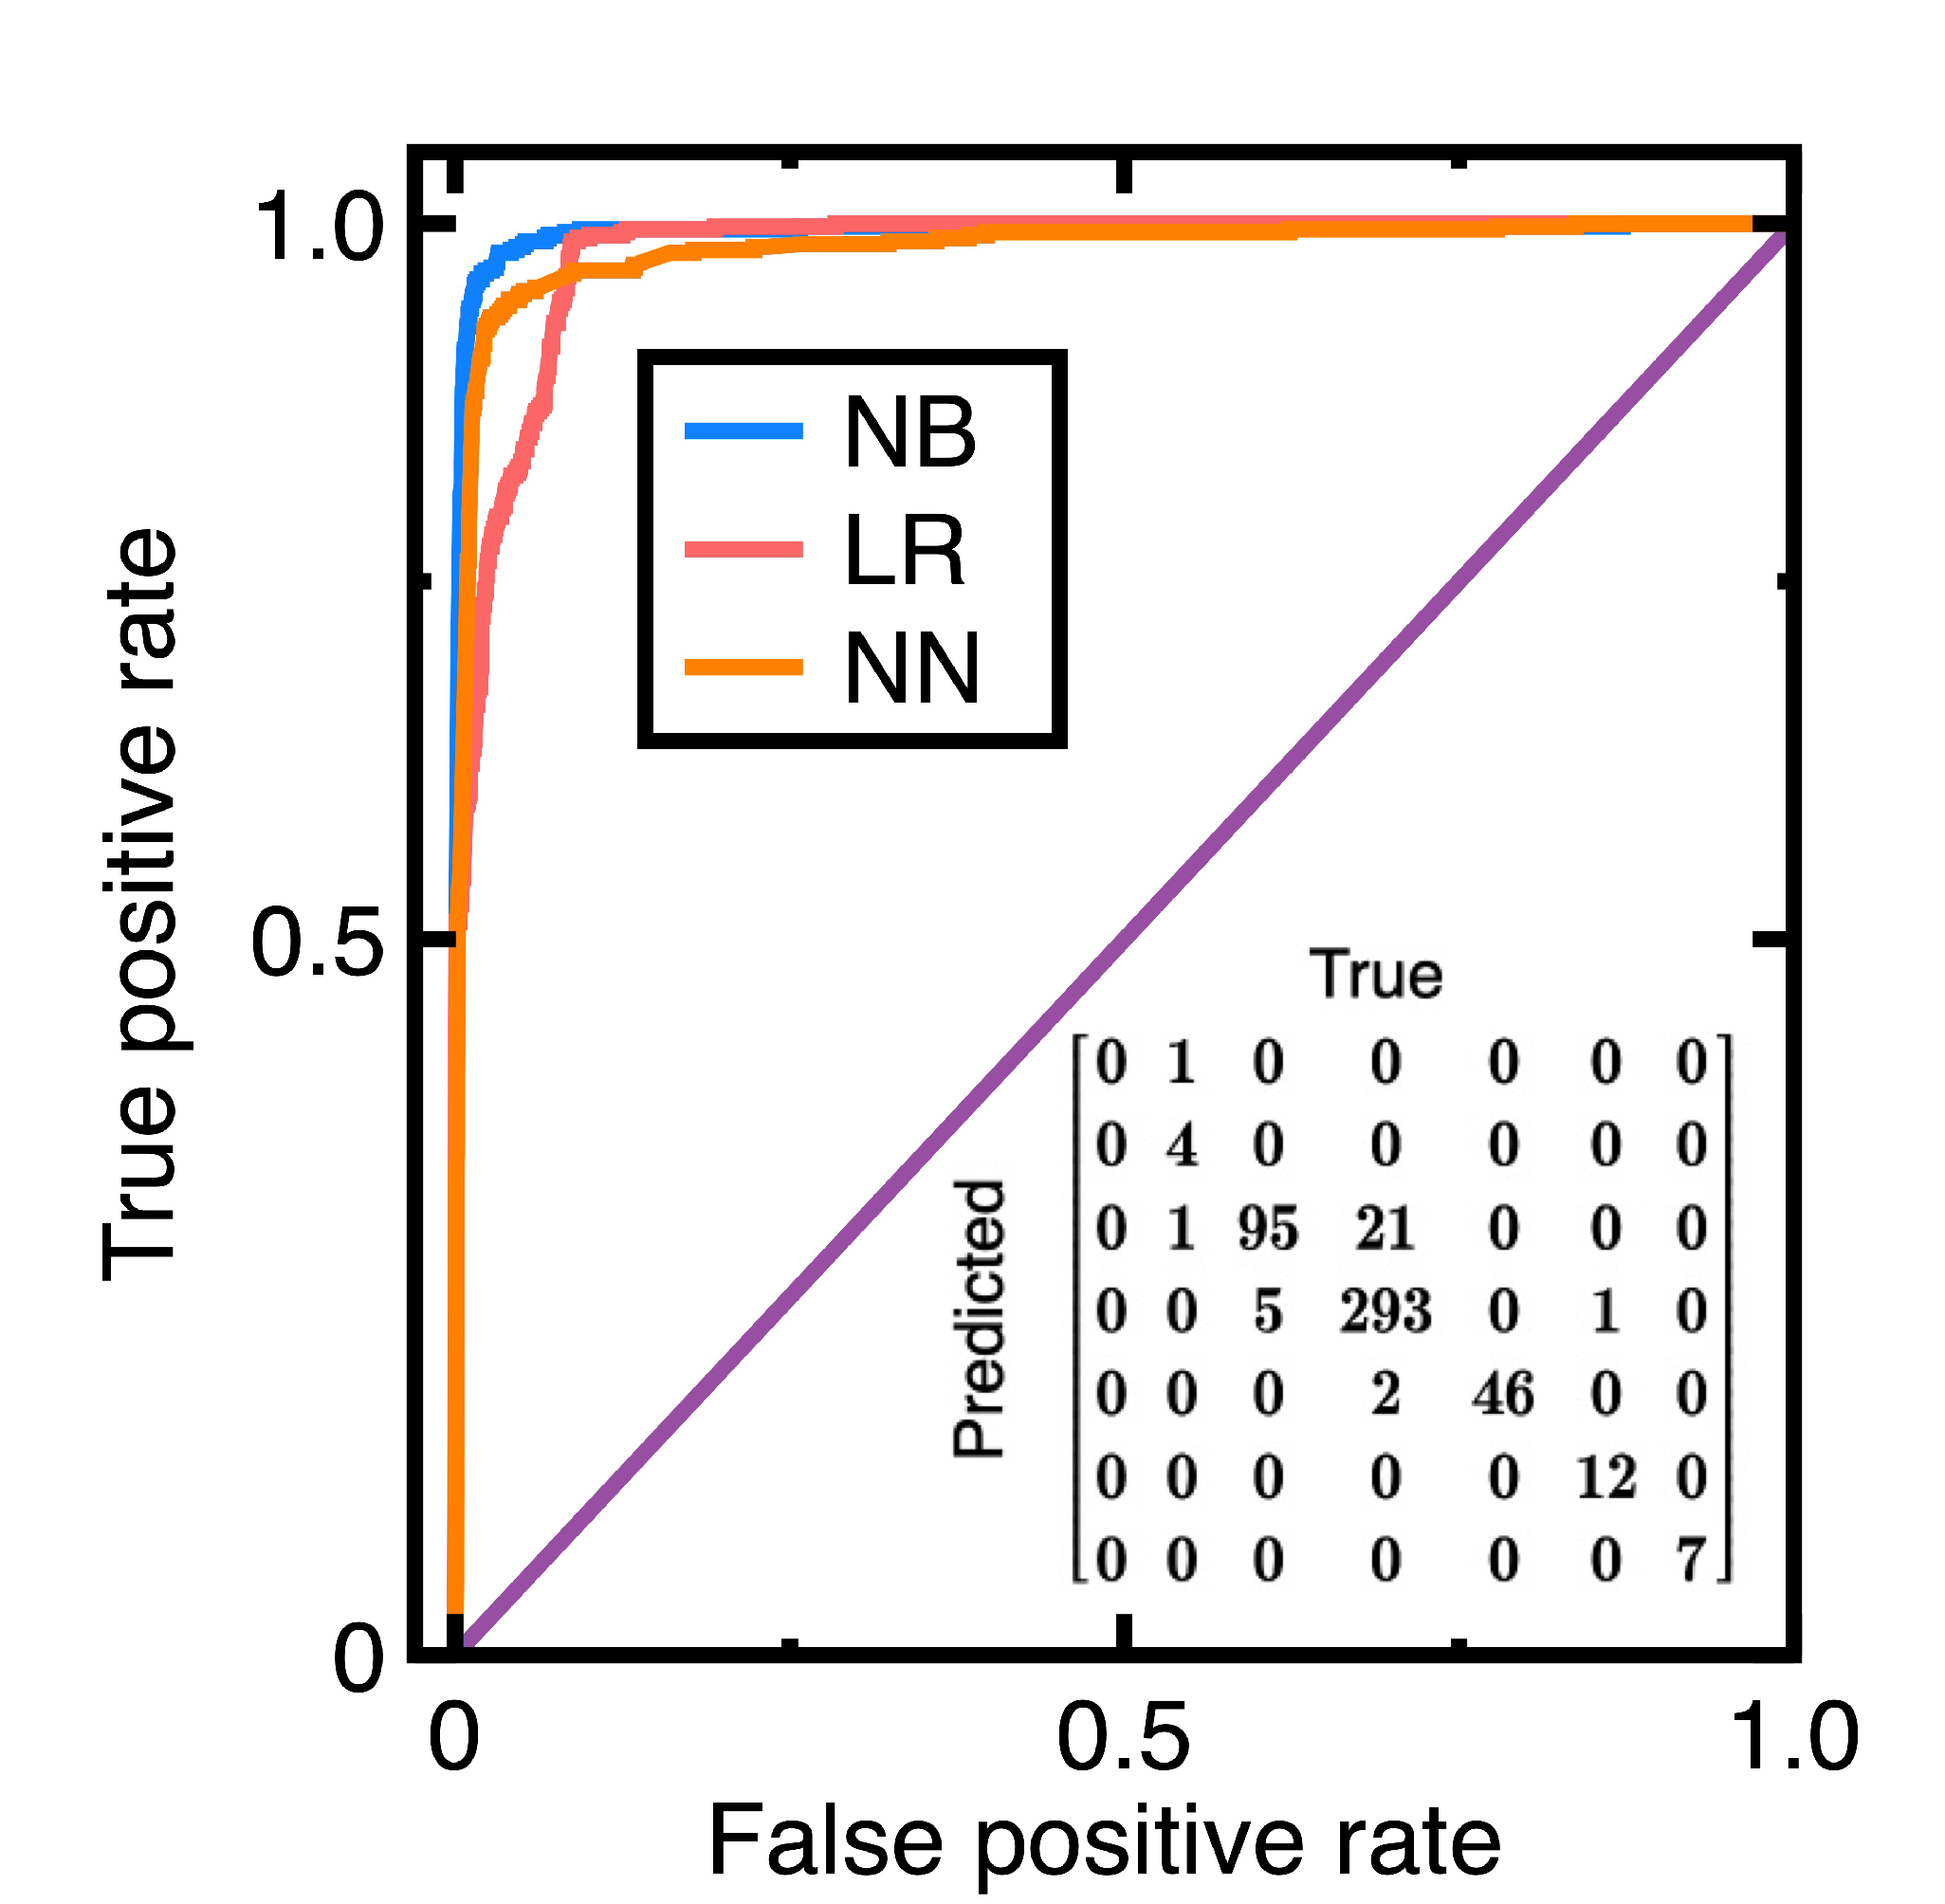
| Accuracy | 0.949 |
| Precision | 0.921 |
| Recall | 0.954 |
| Specificity | 0.985 |
| F1 score | 0.936 |
| Metric | Weighted averaged Value |
|---|---|
| Accuracy | 0.936 |
| Precision | 0.937 |
| Recall | 0.936 |
| Specificity | 0.922 |
| F1 score | 0.935 |
| Metric | Weighted averaged Value |
|---|---|
| Accuracy | 0.92 |
| Precision | 0.926 |
| Recall | 0.92 |
| Specificity | 0.967 |
| F1 score | 0.922 |
Disclaimer/Publisher’s Note: The statements, opinions and data contained in all publications are solely those of the individual author(s) and contributor(s) and not of MDPI and/or the editor(s). MDPI and/or the editor(s) disclaim responsibility for any injury to people or property resulting from any ideas, methods, instructions or products referred to in the content. |
© 2025 by the authors. Licensee MDPI, Basel, Switzerland. This article is an open access article distributed under the terms and conditions of the Creative Commons Attribution (CC BY) license (http://creativecommons.org/licenses/by/4.0/).


