
Submitted:
21 February 2025
Posted:
24 February 2025
You are already at the latest version
Preprints on COVID-19 and SARS-CoV-2
Abstract
Depression is a common mental illness magnified by the COVID-19 pandemic. In this path, its early detection is pivotal for the public health systems. Various works have addressed depression detection in social network data. Nevertheless, they used data before the pandemic and did not exploit transformers’ architecture capabilities for realizing binary classification on extensive dimensional data. This paper introduces DEENT, an approach with a depression-oriented dataset built with BERT and K-means from a previous Twitter dataset labeled for sentiment analysis, and two models called DEENT-Generic and DEENT-Bert for classifying depressive and non-depressive tweets effectively. DEENT was evaluated extensively and compared to Random Forest, Support Vector Machine, XGBoost, and Recurrent and Convolutional Neural Networks. Results revealed that DEENT outperforms baseline models regarding accuracy, balanced accuracy, precision, recall, and F1-Score. We argue that these results are due to the DEENT leveraging the encoder-only transformer architecture and fine-tuning to detect depression in large Twitter data effectively. Therefore, we concluded that DEENT is a promising solution for detecting depressive and non-depressive tweets.
Keywords:
depression classification
; social network
; COVID-19
; machine learning
; natural language processing
; transformers
1. Introduction
In 2019, according to the World Health Organization (WHO), one in eight individuals in the world had depression or anxiety. The COVID-19 pandemic affected many people around the globe, perturbing their mental health due to isolation, quarantine, and deaths, raising depression worldwide. In this regard, WHO reported that in 2020, during the COVID-19 pandemic, the number of individuals experiencing depressive disorder increased by 28% [1]. This raising shows that early depression detection is essential because this illness is associated with suicidal behavior [2] that can result in a high economic cost to health systems [3].
Processing social network data from Twitter, Reddit, and Weibo with Machine Learning (ML), Deep Learning (DL), and Natural Language Processing (NLP) techniques has helped detect depression early; it is noted that users usually express their sentiments through publications with words related to depression in social networks. The works [4,5] analyzed sentiment in social network data to raise statistics about depression-related messages; they do not focus on classifying tweets as depressive or non-depressive. The investigations [6,7,8,9,10] used Random Forest (RF) [11], Support Vector Machines (SVM) [12], Extreme Gradient Boosting Machines (XGBoost) [13], Recurrent Neural Networks (RNN) [14], Convolutional Neural Networks (CNN) [15], and Hierarchical Attention Networks (HAN) [16] to detect depression and other mental diseases; notably, these works employ few depression-related data. The work [17] classified depression, anxiety, suicide, and bipolar behavior in a large dataset collected before the COVID-19 pandemic in the Reddit social network, using the Bidirectional Encoder Representations from Transformers (BERT) [18]; this BERT-based solution did not focus on depression classification and, consequently, involved few depression data.
This paper introduces Depression dEtection Based on Encoder-oNly Transformer (DEENT), an approach for depression detection from Twitter data collected during the COVID-19 pandemic. DEENT includes a tweets dataset labeled as non-depressive and depressive with BERT and K-means, and two flavors: DEENT-Generic and DEENT-Bert. The flavors leverage the encoder-only architecture of transformers to detect depressive tweets on high-dimensional data by processing depression-related words effectively through attention mechanisms. DEENT-Bert is based on a pre-trained model built for classifying tweets, while DEENT-Generic uses the encoder-only architecture without previous training. An extensive evaluation using labeled depressive tweets reveals that DEENT outperforms RF, XGBoost, SVM, RNN, and CNN models in detecting depression disease. In particular, DEENT-Generic got higher accuracy, balanced accuracy, precision, recall, and f1-score than baseline models. In turn, DEENT-Bert outperforms DEENT-Generic regarding all evaluation metrics. The results reveal that DEENT is a promising solution for depression detection expressed in tweets.
To sum up, the main contributions of this paper are:
- Two encoder-only-based models (DEENT-Generic and DEENT-Bert) able to estimate effectively, regarding accuracy, balanced accuracy, precision, and f1-score, the depression during the COVID-19 pandemic from a Twitter dataset.
- A labeled dataset, built using BERT and K-means clustering, containing non-depressive and depressive tweets.
The rest of this paper is organized as follows. Section 2 describes the background. Section 3 presents the related work. Section 4 introduces DEENT-Generic and DEENT-Bert as well as the labeled tweets dataset. Section 5 presents and discusses the evaluation results. Section 6 concludes the paper and presents implications for future work.
2. Background
In 2019, 280 million individuals were affected by depression mental illness, including 23 million children and adolescents [19]. Depression refers to a condition that manifests differently from the typical fluctuations in mood and sentiments associated with the changes in daily life [20]. This disease can impact all facets of an individual’s life, including familiar, social, and communal relationships; those who have experienced abuse, severe loss, or stressful events are susceptible to suffering depression. During a depressive episode, the individual may experience a depressed mood, characterized by feelings of sadness, irritability, or emptiness, or a loss of pleasure or interest in activities [21,22]. Additionally, several other symptoms may manifest, including difficulty concentrating, a sense of overwhelming guilt or low self-esteem, a lack of hope regarding the future, recurrent thoughts of death or suicide, sleep disturbances, changes in appetite or weight, and feelings of profound fatigue or lack of energy. It is important to note that individuals with depression are at an increased risk of suicide [19].
Detecting depression in social network data is a binary classification problem; this paper explores using the encoder-only Transformer’s architecture for this purpose since tweets expressing depression messages rose exponentially during the COVID-19 pandemic, and such an architecture has resulted particularly effective for tasks requiring text comprehension [23,24] instead of text generation. In particular, the encoder-only transformer architecture comprises five elements [18,25,26]: Input Embedding, Positional Encoding, Multi-head Attention, Feed Forward, and Add & Norm. Input embedding represents in a vectorial way the input text in which a token represents a word; it helps a model to process and understand patterns from the text input data. The Positional Encoding occurs after input word embedding and before the encoder. This encoding is necessary since, without positional information, an encoder-only model might believe that two sentences have the same semantics.
Multi-head Attention involves implementing attention mechanisms in parallel; an attention mechanism improves model performance by focusing on relevant information, meaning the Transformer selectively attends to different parts of the input text data by assigning weights according to the relevance of features for the model’s output. Each head attention processes the input independently, allowing it to capture the different aspects of the relationships between words. The Feed Forward consists of two linear neural networks separated by a nonlinear activation function helpful to learn more complex patterns. Add & Norm combines a residual connection (Add) and a normalization layer (Norm). Add facilitates the training of deep networks by mitigating the problem of vanishing gradient, providing an alternative path for data to ensure that gradients during backpropagation do not become too small, seeking to improve training performance. Norm is crucial to keeping the model’s stability and avoiding problems, such as exploding gradient, and helps to make the model less sensitive to the input scale values for faster and more robust training.
3. Related Work
In [4], the authors explored the effects of COVID-19 on people’s mental health using Weibo data (a Chinese social network). They used Online Ecological Recognition [27] that uses Naive Bayes (NB) [28] and Linear Regression [29] to detect psychological problems. The work [5] used Latent Dirichlet Allocation [30] to group behavior profiling from emotions (i.e., anger, fear, sadness, disgust, joy, anticipation, trust, and surprise) expressed in Twitter during the COVID-19 pandemic. The authors used Markov chains [31] to represent the transition between emotions. These works focused on analyzing positive and negative sentiments or emotions without employing ML models to classify depression.
The work [6] identified depression and anxiety in the Brazilian population using RF and XGBoost models trained with data collected via a web survey requesting information about lifestyle behavior during the COVID-19 pandemic. Notably, these algorithms had been pre-trained with data collected in Spain. [7] detected the effects of depression suffered by the USA population during the COVID-19 pandemic using SVM and RF models trained with data collected via a web survey looking for indicators suggesting a predisposition to suffer mental disorders. [8] classified depression using SVM, RF, and NB algorithms trained with a few data (1,000 samples) collected from Reddit’s social network during the COVID-19 pandemic. [9] proposed a model based on SVM and k-Nearest Neighbor (KNN) to classify depression and compared it to SVM, RF, XGBoost, and CNN. The algorithms were trained using a few data (4,996 samples) from Reddit’s social network. The SVM+KNN model Outperformed SVM, RF, XGBoost, and CNN.
The work [10] used a Multi-Aspect Depression Detection with Hierarchical Attention Network (MDHAN) to estimate depression using tweets and user behavior data collected before the COVID-19 pandemic. MDHAN got better accuracy than SVM, BiGRU, MBiGRU, CNN, MCNN, and HAN. In [17], the author performed a benchmark between XGBoost, RF, CNN, Long Short-Term Memory (LSTM), BERT [18], and MentalBERT [32] when used to predict anxiety, bipolar, depression, and suicide watch from a small dataset composed by Reddit messages (16.205 samples related to depression) gathered before the COVID-19 pandemic; solutions based on BERT got better accuracy than other algorithms. Also, it is noteworthy that [17] did not show the process to label the mental illnesses dataset.
The works aforecited (see Table 1) share two pivotal shortcomings. First, they trained the ML models with a few depression-related data mainly collected before the COVID-19 pandemic, limiting their learning. Second, they did not use a specific metric to measure the model performance in unbalanced datasets. Third, they did not present the process to label the depression-oriented dataset. Conversely, DEENT shows how to build a depression-oriented dataset with 123,984 tweets collected during the COVID-19 pandemic, during which the depression disease grew exponentially; the labeling is performed using a BERT-based model and K-means clustering. Also, DEENT introduces two models based on encoder-only Transformer architecture to improve depression detection; the balanced accuracy and f1-score metrics measure their effectiveness in the unbalanced dataset built.
4. DEENT
This section presents DEENT, an approach based on the encoder-only Transformer architecture to detect depression from Twitter data collected during the COVID-19 pandemic. DEENT comprises DEENT-Generic, DEENT-Bert, and a tweets dataset built for evaluation purposes and labeled (non-depressive and depressive) with BERT and K-means.
4.1. Pipeline
We build up DEENT following the first four phases of CRISP-ML(Q) methodology [33]: (i) Business and data understanding to define the DEENT’s scope and goal. (ii) Data engineering to produce a tweets dataset with depressive and non-depressive labels. (iii) Machine Learning model engineering to build DEENT flavors and the baseline ML models. (iv) Quality assurance for Machine Learning applications to evaluate and compare the performance of all built models. The results of enforcing the above-mentioned phases are discussed hereinafter.
4.2. Business and Data Understanding
DEENT aims to detect depression using social network data during the COVID-19 pandemic. As there is no open dataset labeled for depression detection, we built it. We constructed our dataset from a dataset labeled from a sentiment analysis perspective, containing 134,348 tweets collected during the pandemic and publically available on IEEEDataPort [34]. Such a public dataset included three columns: index, text (i.e., tweet), and sentiment (i.e., the score calculated using TextBlob: cero for positive tweets and one for negative ones), Table 2 exemplifies five instances. The following items describe the data engineering and labeling process.
4.3. Data Engineering
In data engineering, we carried out three steps to process the sentiment-oriented dataset (see Figure 1): convert tweets to lowercase, clean tweets (i.e., delete empty, duplicates, and stop words), and re-index the whole dataset. (i) All tweets were converted into lowercase to reduce the data dimensionality; uppercase letters can cause words with the same meaning to be taken by the model as different, increasing the dimensionality. (ii) The first instance was deleted because it contained no tweet but a dataset description. Eighteen empty instances (NaN) and 10,314 duplicates were removed. Also, we deleted the stop words (special characters) and URLs to avoid learning problems. After such removal, we obtained 31 empty instances that were also removed. (iii) The dataset was re-indexed because the indexes were not continuous due to previous steps. After cleaning, the final dataset included 123,984 tweets, which is greater than related work on depression detection. We developed data engineering with the NLTK 3.8.1 library version.
4.4. Depression Twitter Dataset
We obtained the depression-oriented Twitter dataset as follows, see Figure 2.
- A pre-trained model, called covid-twitter-bert-v2-mnli [35] (available on HugginFace [36]) and based on BERT, was used to find the probability score of each tweet (just the text column of the sentiment-oriented dataset was used) of belong to two candidate labels (depressive and non-depressive); this model was used since it was already fine-tuned for classification problems related to COVID pandemic, note that had not been used for mental illness classification as we do in this paper. In this process, the Transformer library version 4.40.2 of HuggingFace was used to download the covid-twitter-bert-v2-mnli that computes the probability scores related to depression.
- The K-means clustering algorithm was enforced on the dataset containing the probability scores obtained in the previous step. In particular, we varied the number of clusters k from 2 to 9 and evaluated the K-Means outcome with the Silhouette coefficient (near values to 1 are desirable) to determine the clustering process quality. Results revealed that the coefficient (0.613) was highest when K-means operated with k=2. Remarkably, K-means grouped the tweets as depressive (label = 1) and non-depressive (label=0) and, consequently, got a dataset for binary depression classification. The resultant dataset (see Table 3) was imbalanced, including 70,509 (56.87%) non-depressive tweets and 53,475 (43.13%) depressive. In this process, the Scikit-learn 1.4.1 was used to build the K-means clustering model and Matplotlib 3.7.1 to plot the figures and analyze the results.
4.5. DEENT-Generic
The DEENT-Generic model classifies tweets into depressive and non-depressive. This model was trained and tested using the depression-oriented Twitter dataset. For building DEENT-Generic, the dataset was tokenized, the dataset was balanced, and the model structure was set up. Tokenizing tweets. We tokenized the depression-oriented Twitter dataset since a transformers-based solution, such as DEENT-Generic, needs an understandable numerical sequential representation. Here, the Keras tokenizer was used to obtain a numerical value interpretable by the generic encoder-only architecture input.
Balancing Depression Twitter dataset. As the depression-oriented Twitter dataset is imbalanced, we balanced the training part (training dataset with total samples 99,187 with 56,407 non-depressive and 42,780 depressive) with SMOTE. Recall that SMOTE [37] is a common technique used to balance data on binary text classification tasks compatible with the baseline models (i.e., RF, XGBoost, SVM, RNN, and CNN) and DEENT-Generic. In particular, we set up SMOTE to increase the minority class to the majority one, resulting in 56,407 samples for each class.
Model Structure. DEENT-Generic was structured with Input Embedding, Positional Encoding, Multi-head Attention, Feed Forward, and Add & Norm layers (see Figure 3). (i) Input Embedding, the tweet sequences were converted into vectorial representations to be processed by the following layers. (ii) Positional Encoding, the embedding returns each word in a tweet with its position, which helps the models understand the relative position of each word in the sequence. (iii) Multi-head Attention, the model learns complex relationships between words from the tweet sequence. (iv) Feed Forward allows the model to learn more complex relationships after the attention block. (v) Add & Norm, helps to mitigate the problems related to gradients in the backpropagation. A dropout layer was also included with a value of 0.1 after the generic encoder-only structure to regularize the model and prevent overfitting. After dropout, a fully connected layer was constructed to convert the DEENT-Generic output into probabilities for the depression binary classification. The first dense layer contains 32 neurons, the second 8 with a Tanh activation function to avoid linearity. In the last layer, we use a single neuron and the Sigmoid activation function, which is the most used for binary classification tasks.
4.6. DEENT-Bert
The DEENT-Bert model classifies tweets into depressive and non-depressive using a pre-trained model called tiya1012/swmh4_bert [38] and its inner tokenization. DEEN-Bert was trained and tested using the depression-oriented Twitter dataset. The dataset was balanced, and the model structure was set up to build DEENT-Bert. Balancing Depression Twitter dataset. As the depression-oriented Twitter dataset is imbalanced, we balanced the training part with the weighted loss function; this function helps the model pay more attention to the minority class, thus improving performance on imbalanced datasets. Remarkably, we did not use SMOTE since it is incompatible with tiya1012/swmh4_bert.
Model structure. For building up DEEN-Bert, we fine-tuned tiya1012/swmh4_bert [17], a pre-trained model previously used to classify depression using data collected from the Reddit social network before the COVID-19 pandemic. By such a tuning, DEENT-Bert was expected to understand better the words related to depression. As tiya1012/swmh4_bert is an encoder-only model, it had already included the corresponding architectural elements (see Figure 4). We did the fine-tuning with the Torch library.
5. Evaluation
Using the built depression-oriented dataset, we evaluated DEENT-Generic and DEENT-Bert performance regarding accuracy, balanced accuracy (over epochs), precision, recall, f1-score, and loss (over epochs). Furthermore, we compared DEENT flavors with ML baseline models, namely, RF, SVM, XGBoost, CNN, and RNN.
5.1. Performance Metrics
We compared DEENT to baseline models regarding accuracy, balanced accuracy, precision, recall, and f1-score. Accuracy [39] is the fraction of predictions that the model got right (see Equation 1). Accuracy involves True Positives (TP) and True Negatives (TN) when the model correctly predicts the non-depressive and depressive tweets, respectively, and False Positives (FP) and False Negatives (FN) when the model incorrectly predicts the non-depressive tweets and depressive tweets, respectively.
Balanced accuracy [40] assesses the performance of classification models on imbalanced datasets, ensuring that both minority and majority classes are important during evaluation. Balanced accuracy is computed by Equation 2) where specificity represents the proportion of actual depressive tweets correctly identified, and recall [39] indicates the correct identification of the proportion of actual non-depressive tweets (see Equation 3). Notably, in the evaluation, we considered recall as a separate metric to analyze each class behavior (see Equation 3).
F1-score [39] is commonly used in binary classification problems to analyze and understand better the model performance in front of unbalanced data; this metric is given by Equation 4 that computes the harmonic mean of recall and precision (see Equation 5). Precision [41] points out the correct prediction of non-depressive tweets.
5.2. DEENT Training
DEENT-Generic and DEENT-Bert were trained with the Adam optimizer [42] and BinaryCrossEntropyLoss [43] because they have shown excellent results in binary classification. Both models were trained for up to 50 epochs, with early stopping to save the best models’ results, meaning the models stopped the training when the validation accuracy did not improve for ten consecutive epochs. Early stopping helps prevent overfitting and reduces unnecessary computations. The learning rate was defined via experimentation by ranging its values from 1e-1, 1e-2, 1e-3, and 1e-4. The accuracy of DEENT-generic for these values was 0.568, 0.568, 0.807, and 0.813. In turn, the accuracy obtained by DEENT-Bert for these values was 0.568, 0.568, 0.568, and 0.855. We developed DEENT-generic using Python 3.10, Tensorflow 2.15.0, and Keras 2.15.0. DEENT-Bert was developed with Torch version 2.4.1+cu121 and the Transformer library version 4.40.2.
5.3. Baseline
We considered SVM, RF, XGBoost, RNN, and CNN as baseline models since they have been used in several works [6,7,8,9,10,17] for depression classification. SVM [12] analyzes the training data and identifies the separation between the support vectors and the optimal hyperplane (i.e., two classes for binary classification). SVM was configured using a linear kernel.
RF [11] is an ensemble ML algorithm that combines many decision tree predictors and aggregates their outputs to achieve more accurate and robust predictions. This algorithm was configured with 100 estimators, a maximum tree depth of 150, and a random state equal to 42 to ensure reproducibility. XGBoost [13] is an optimized distributed gradient boosting algorithm designed for efficient and scalable ML model training, combining predictions from multiple weak models to produce a more robust prediction. This algorithm was trained with a learning rate equal to 0.1, a maximum tree depth of 15, and 150 estimators.
RNNs [14] are feedback-connected neural networks, which allows them to have internal states. These internal states give a memory that can hold information about previous inputs. We set up an LSTM with embedding and dense layers, an Adam optimizer with a learning rate equal to 0.001, and a BinaryCrossEntropyLoss function. The LSTM included 64 neurons, dropout equal to 0.5, a first dense layer with 32 neurons, a second with 8, a third with 2 (all using Tanh activation function), and the last layer with a single neuron with a Sigmoid activation function. CNN [15] has convolutional and pooling layers. Each convolutional layer computes dot products between the weights of output neurons called filters and a local region in the input volume of the layer to which they are connected. A pooling layer is placed between the convolutional layers to reduce the number of parameters and computations. We trained a CNN with an embedding, Conv1D, dense layer, Adam optimizer with a learning rate equal to 0.001, and BinaryCrossEntropyLoss function. The Conv1D layer included 64 neurons activated with the Tanh function. Before the dense layer, a dropout equal to 0.5 was set up to prevent overfitting during training. The first dense layer included 32 neurons, the second 8, and the third 2 with Tanh activation function. The last layer used a single neuron with a Sigmoid activation function.
We used the Scikit-learn 1.4.1 version to construct RF and SVM models and the Xgboost 2.0.3 version library to build the XGBoost model. The RNN and CNN models were developed using the Tensorflow 2.15.0 and Keras 2.15.0 versions. Remarkably, all models, including DEENT, were compiled using the T4 Google Colab machine. This GPU machine has 16GB of GDDR6 memory and 2,560 CUDA cores.
5.4. Results and Analysis
Figure 5 shows the accuracy and balanced accuracy obtained by DEENT and the baseline models in the test imbalanced depression-oriented dataset (i.e., 14,102 non-depressive tweets and 10,695 depressive tweets). Results reveal DEENT had better accuracy and balanced accuracy than RF (80.17% and 79.68%), SVM (80.63% and 80.33%), XGBoost (80.31% and 79.28%), RNN (80.91% and 80.90%), and CNN (80.72% and 80.39%); DEENT-Bert achieved (84.54%, 84.06%) and DEENT-Generic (81.23%, 81.17%). These results revealed, first, that the attention mechanism used by DEENT helped it to learn more complex relationships between words associated with depression disease than non-transformers-based models. Second, thanks to the fine-tuning, DEENT-Bert outperformed DEENT-Generic. Third, DEENT-Generic and DEENT-Bert are robust models when processing unbalanced data since the difference between accuracy and balanced accuracy is negligible; DEENT-Generic obtained a variation around 0.06%, and DEENT-BERT obtained a variation near 0.48%. On the other hand, the model proposed by [17] that detected depression in Reddit messages before the COVID-19 pandemic achieved an accuracy near 76.62%, and DEENT got more promising results in a larger dataset built from tweets. It is also to remark that the work [17] did not measure the robustness of its model in front of unbalanced data.
Figure 6 shows the precision, recall, and f1-score obtained by DEENT and baseline models in the test imbalanced depression-oriented dataset. DEENT-Generic (80.72%) and DEENT-Bert (80.54%) achieved a higher recall than RF (75.82%), SVM (78.16%), XGBoost (71.81%), RNN (80.38%), and CNN (77.92%), meaning DEENT detected better depressive tweets than the other models. DEENT-Bert (83.10%) outperformed RF (77.68%), SVM (77.20%), XGBoost (80.44%), RNN (76.61%), CNN (77.53%), and DEENT-Generic (76.90%) regarding precision; highlighting DEENT-Bert ability to classify non-depressive tweets. DEENT-Bert (81.80%) and DEENT-Generic (78.47%) accomplished better results regarding the f1-score than the baseline models (RF - 76.74%, SVM - 77.68%, XGBoost - 75.88%, RNN - 78.10%, CNN - 77.38%), remarking DEENT as the most robust model solution to detect depressive and non-depressive tweets. Similarly to the accuracy and balanced accuracy results, the ones regarding precision, recall, and f1-score corroborated, first, that the attention mechanism used by DEENT allowed DEENT-Generic and DEENT-Bert to learn better the complex words related to depressive tweets and non-depressive tweets, respectively. Second, thanks to the fine-tuning, DEENT-Bert outperformed DEENT-Generic regarding the f1-score since the former has already learned complex linguistic representations.
Figure 7a,b show the accuracy and loss obtained by DEENT, RNN, and CNN over epochs; note that RF, SVM, and XGBoost were omitted because they did not operate with epochs. DEENT-Bert (a: 84.54%, l: 0.3563) and DEENT-Generic (a: 81.23%, l: 0.4820) achieved the highest accuracy and the lowest loss in the second epoch. These accuracies were better than those of CNN (a: 80.72%, l: 0.5456) and RNN (a: 80.91%, l: 0.5456). The results in accuracy and loss over epochs corroborated the DEENT’s robustness since it stabilizes faster than the other models.
From the above results regarding accuracy, balanced accuracy, precision, and f1-score, we concluded that DEENT-Generic and DEENT-Bert are promising solutions to identifying depressive and non-depressive. In particular, DEEN-Generic learns better to identify depressive tweets, while DEEN-Bert is more appropriate to classify non-depressive tweets. Furthermore, remarkably, they stabilize faster than the baseline models.
6. Conclusions and Future Work
This paper presented DEENT, an approach based on encoder-only transformer architecture to detect depressive and non-depressive tweets. The proposed approach introduced a depression-oriented dataset built with BERT and K-means from a previous one that included tweets labeled for sentiment analysis and DEENT-Generic and DEENT-Bert. The DEENT flavors achieved prominent accuracy, balanced accuracy, precision, recall, and F1-Score, showing their ability to classify tweets into depressive and non-depressive. Regarding the above-mentioned evaluation metrics, DEENT outperformed the baseline ML models (i.e., RF, SVM, XGBoost, RNN, and CNN). These results are due to DEENT is based on the encoder-only architecture, attention mechanism, and fine-tuning. Furthermore, thanks to the balanced accuracy metric, it was corroborated that DEENT is a robust model using imbalanced data since the difference between accuracy and balanced accuracy was negligible. Overall, we concluded that DEENT is a promising solution to address depression detection using social network data.
In future work, we plan to explain and improve DEENT using explainable artificial intelligence techniques, such as Local Interpretable Model-Agnostic Explanations and Shapley Additive ExPlanations. We also intend to strengthen DEENT’s performance via hyperparameter tunning and text preprocessing optimization.
Author Contributions
Conceptualization, R.N.B., O.M.C. and C.A.A.; methodology, R.N.B., O.M.C. and C.A.A.; software, R.N.B. and O.M.C.; validation, R.N.B., O.M.C. and C.A.A.; formal analysis, R.N.B., O.M.C. and C.A.A.; investigation, R.N.B., O.M.C. and C.A.A.; resources, R.N.B. and O.M.C; data curation, R.N.B.; writing-original draft preparation, R.N.B.; writing-review and editing, R.N.B., O.M.C. and C.A.A.; visualization, R.N.B.; supervision, O.M.C.; project administration, O.M.C.; funding acquisition, O.M.C. All authors have read and agreed to the published version of the manuscript.
Funding
This research received no external funding.
Data Availability Statement
The data is available on IEEEDataPort
Acknowledgments
The authors thank the Universidad del Cauca and the Foundation for the Future of Colombia - Colfuturo - for funding this research work through the Master’s scholarship of the student Robinson Narváez Burbano.
Conflicts of Interest
The authors declare no conflict of interest. The financiers had no role in the design of the study; in the collection, analyses, or interpretation of data; in the writing of the manuscript, or in the decision to publish the results.
Abbreviations
| AI | Artificial Intelligence |
| AUROC | Area Under the Receiver Operating Characteristics |
| BERT | Bidirectional Encoder Representations from Transformers |
| BiGRU | bidirectional Gated Recurrent Unit |
| CNN | Convolutional Neural Network |
| DL | Deep Learning |
| FN | False Negatives |
| FP | False Positives |
| GAI | Generative Artificial Intelligence |
| HAN | Hierarchical Attention Network |
| LSTM | Long short-term memory |
| MDHAN | Multi-Aspect Depression Detection with Hierarchical Attention Network |
| ML | Machine Learning |
| NB | Naive Bayes |
| NLP | Natural Language Processing |
| RF | Random Forest |
| KNN | k-Nearest Neighbors |
| RNN | Recurrent Neural Network |
| SVM | Support Vector Machine |
| TN | True Negatives |
| TP | True Positives |
| XGBoost | Extreme Gradient Boosting Machine |
| WHO | World Health Organization |
References
- Mental disorders. Available online: https://www.who.int/news-room/fact-sheets/detail/mental-disorders (accessed on 10 December 2024).
- Sher, L. Post-COVID syndrome and suicide risk. QJM. 2021, 114, 95 – 98. [CrossRef]
- Latoo, J.; Haddad, P.M.; Mistry, M.; Wadoo, O.; Islam, S.M.S.; Jan, F.; Iqbal, Y.; Howseman, T.; Riley, D.; Alabdulla, M. The COVID-19 pandemic: An opportunity to make mental health a higher public health priority. BJPsych Open. 2021, 7. [CrossRef]
- Li, S.; Wang, Y.; Xue, J.; Zhao, N.; Zhu, T. The impact of covid-19 epidemic declaration on psychological consequences: A study on active weibo users. Int. J. Environ. Res. Public Health. 2020, 17. [CrossRef]
- Adikari, A.; Nawaratne, R.; de Silva, D.; Ranasinghe, S.; Alahakoon, O.; Alahakoon, D. Emotions of COVID-19: Content analysis of self-reported information using artificial intelligence. J. Med. Internet Res. 2021, 23. [CrossRef]
- Simjanoski, M.; Ballester, P.L.; da Mota, J.C.; De Boni, R.B.; Balanzá-Martínez, V.; Atienza-Carbonell, B.; Bastos, F.I.; Frey, B.N.; Minuzzi, L.; Cardoso, T.d.A.; et al. Lifestyle predictors of depression and anxiety during COVID-19: a machine learning approach. Trends Psychiatry Psychother. 2022, 44. [CrossRef]
- Jha, I.P.; Awasthi, R.; Kumar, A.; Kumar, V.; Sethi, T. Learning the mental health impact of COVID-19 in the United States with explainable artificial intelligence: Observational study. JMIR Mental Health. 2021, 8. [CrossRef]
- Huma.; Sohail, M.K.; Akhtar, N.; Muhammad, D.; Afzal, H.; Mufti, M.R.; Hussain, S.; Ahmed, M. Analyzing COVID-2019 Impact on Mental Health through Social Media Forum. Comput. Mater. Continua. 2021, 67, 3737 – 3748. [CrossRef]
- Adarsh, V.; Arun Kumar, P.; Lavanya, V.; Gangadharan, G. Fair and Explainable Depression Detection in Social Media. Inf. Process. Manag. 2023, 60. [CrossRef]
- Zogan, H.; Razzak, I.; Wang, X.; Jameel, S.; Xu, G. Explainable depression detection with multi-aspect features using a hybrid deep learning model on social media. World Wide Web. 2022, 25, 281 – 304. [CrossRef]
- Breiman, L. Random Forests. Mach. Learn. 2001, 45, 5–32. [CrossRef]
- Cortes, C.; Vapnik, V. Support-vector networks. Mach. Learn. 1995, 20, 273–297. [CrossRef]
- Chen, T.; Guestrin, C. XGBoost: A scalable tree boosting system. In Proceedings of the Proceedings of the ACM SIGKDD International Conference on Knowledge Discovery and Data Mining, New York, USA, 13-17 August 2016; p. 785 – 794. [CrossRef]
- Hochreiter, S.; Schmidhuber, J. Long Short-Term Memory. Neural Comput. 1997, 9, 1735 – 1780. [CrossRef]
- LeCun, Y.; Bottou, L.; Bengio, Y.; Haffner, P. Gradient-based learning applied to document recognition. Proc. IEEE. 1998, 86, 2278 – 2323. [CrossRef]
- Yang, Z.; Yang, D.; Dyer, C.; He, X.; Smola, A.; Hovy, E. Hierarchical Attention Networks for Document Classification. In Proceedings of the Proceedings of the 2016 Conference of the North American Chapter of the Association for Computational Linguistics: Human Language Technologies, San Diego, California, June 2016; pp. 1480–1489. [CrossRef]
- Thushari, P.D.; Aggarwal, N.; Vajrobol, V.; Saxena, G.J.; Singh, S.; Pundir, A. Identifying discernible indications of psychological well-being using ML: explainable AI in reddit social media interactions. Soc. Netw. Anal. Min. 2023, 13. [CrossRef]
- Devlin, J.; Chang, M.W.; Lee, K.; Toutanova, K. BERT: Pre-training of Deep Bidirectional Transformers for Language Understanding. In Proceedings of the Proceedings of the 2019 Conference of the North American Chapter of the Association for Computational Linguistics: Human Language Technologies, Minneapolis, Minnesota, June 2019; pp. 4171–4186. [CrossRef]
- Depression. Available online: https://www.who.int/es/news-room/fact-sheets/detail/depression (accessed on 10 December 2024).
- Depression. Available online: https://www.nimh.nih.gov/health/topics/depression (accessed on 10 December 2024).
- Deshpande, M.; Rao, V. Depression detection using emotion artificial intelligence. In Proceedings of the Proceedings of the International Conference on Intelligent Sustainable Systems, ICISS 2017, Palladam, India, 7-8 December 2017; pp. 858–862. [CrossRef]
- Cacheda, F.; Fernandez, D.; Novoa, F.J.; Carneiro, V. Early detection of depression: Social network analysis and random forest techniques. J. Mach. Learn. Res. 2019, 21. [CrossRef]
- Bombieri, M.; Rospocher, M.; Dall’Alba, D.; Fiorini, P. Automatic detection of procedural knowledge in robotic-assisted surgical texts. Int. J. Comput. Assist. Radiol. Surg. 2021, 16, 1287 – 1295. [CrossRef]
- Mehta, D.; Dwivedi, A.; Patra, A.; Anand Kumar, M. A transformer-based architecture for fake news classification. Soc. Netw. Anal. Min. 2021, 11. [CrossRef]
- Vaswani, A.; Shazeer, N.; Parmar, N.; Uszkoreit, J.; Jones, L.; Gomez, A.N.; Kaiser, L.; Polosukhin, I. Attention is all you need. In Proceedings of the Proceedings of the 31st International Conference on Neural Information Processing Systems, Long Beach, California, USA, 4-9 December 2017; pp. 6000–6010. [CrossRef]
- Lan, Z.; Chen, M.; Goodman, S.; Gimpel, K.; Sharma, P.; Soricut, R. ALBERT: A Lite BERT for Self-supervised Learning of Language Representations. In Proceedings of the International Conference on Learning Representations, April 2020. [CrossRef]
- Liu, M.; Xue, J.; Zhao, N.; Wang, X.; Jiao, D.; Zhu, T. Using Social Media to Explore the Consequences of Domestic Violence on Mental Health. J. Interpers. Violence. 2021, 36, NP1965 – 1985NP. [CrossRef]
- Kalt, T. A New Probabilistic Model of Text Classification and Retrieval. Technical report, University of Massachusetts, USA, 1998.
- Krasker, W.S. Estimation in linear regression models with disparate data points. Econometrica 1980, 48, 1333. [CrossRef]
- Blei, D.M.; Ng, A.Y.; Jordan, M.I. Latent Dirichlet allocation. J. Mach. Learn. Res. 2003, 3, 993 – 1022.
- Meng, Q.M.; Wu, W.G. Artificial emotional model based on finite state machine. J. Cent. South Univ. Technol. 2008, 15, 694 – 699. [CrossRef]
- Ji, S.; Zhang, T.; Ansari, L.; Fu, J.; Tiwari, P.; Cambria, E. MentalBERT: Publicly Available Pretrained Language Models for Mental Healthcare. In Proceedings of the Proceedings of the Thirteenth Language Resources and Evaluation Conference, Marseille, France, June 2022; pp. 7184–7190. [CrossRef]
- Studer, S.; Bui, T.B.; Drescher, C.; Hanuschkin, A.; Winkler, L.; Peters, S.; Müller, K.R. Towards CRISP-ML(Q): A Machine Learning Process Model with Quality Assurance Methodology. Mach. Learn. Knowl. Extr. 2021, 3, 392 – 413. [CrossRef]
- University of Melbourne, M. Depressive/non-Depressive Tweets between Dec’19 to Dec’20. Available online: https://ieee-dataport.org/open-access/depressivenon-depressive-tweets-between-dec19-dec20 (accessed on 10 December 2024).
- Müller, M.; Salathé, M.; Kummervold, P.E. COVID-Twitter-BERT: A Natural Language Processing Model to Analyse COVID-19 Content on Twitter. CoRR 2020.
- Huggingface. Available online: https://huggingface.co/digitalepidemiologylab/covid-twitter-bert-v2-mnli (accessed on 10 December 2024).
- Chawla, N.V.; Bowyer, K.W.; Hall, L.O.; Kegelmeyer, W.P. SMOTE: synthetic minority over-sampling technique. J. Artif. Int. Res. 2002, 16, 321–357. [CrossRef]
- Huggingface BERT Model. Available online: https://huggingface.co/tiya1012/swmh4_bert (accessed on 10 December 2024).
- Sokolova, M.; Japkowicz, N.; Szpakowicz, S. Beyond Accuracy, F-Score and ROC: A Family of Discriminant Measures for Performance Evaluation. In Proceedings of the AI 2006: Advances in Artificial Intelligence, Hobart, Australia, 4-8 December 2006; pp. 1015–1021. [CrossRef]
- García, V.; Mollineda, R.; Sánchez, J. Index of balanced accuracy: A performance measure for skewed class distributions. Pattern Recognit. Image Anal. 2009, 5524 LNCS, 441 – 448. [CrossRef]
- Boutaba, R.; Salahuddin, M.A.; Limam, N.; Ayoubi, S.; Shahriar, N.; Solano, F.E.; Rendón, O.M.C. A comprehensive survey on machine learning for networking: evolution, applications and research opportunities. J. Internet Serv. Appl. 2018, 9, 16:1–16:99. [CrossRef]
- Kingma, D.P.; Ba, J. Adam: A Method for Stochastic Optimization 2017. [arXiv:cs.LG/1412.6980].
- Ruby, U.; Yendapalli, V. Binary cross entropy with deep learning technique for Image classification. Int. J. Adv. Trends Comput. Sci. Eng. 2020, 9. [CrossRef]
Figure 1.
Cleaning Twitter Dataset Steps.
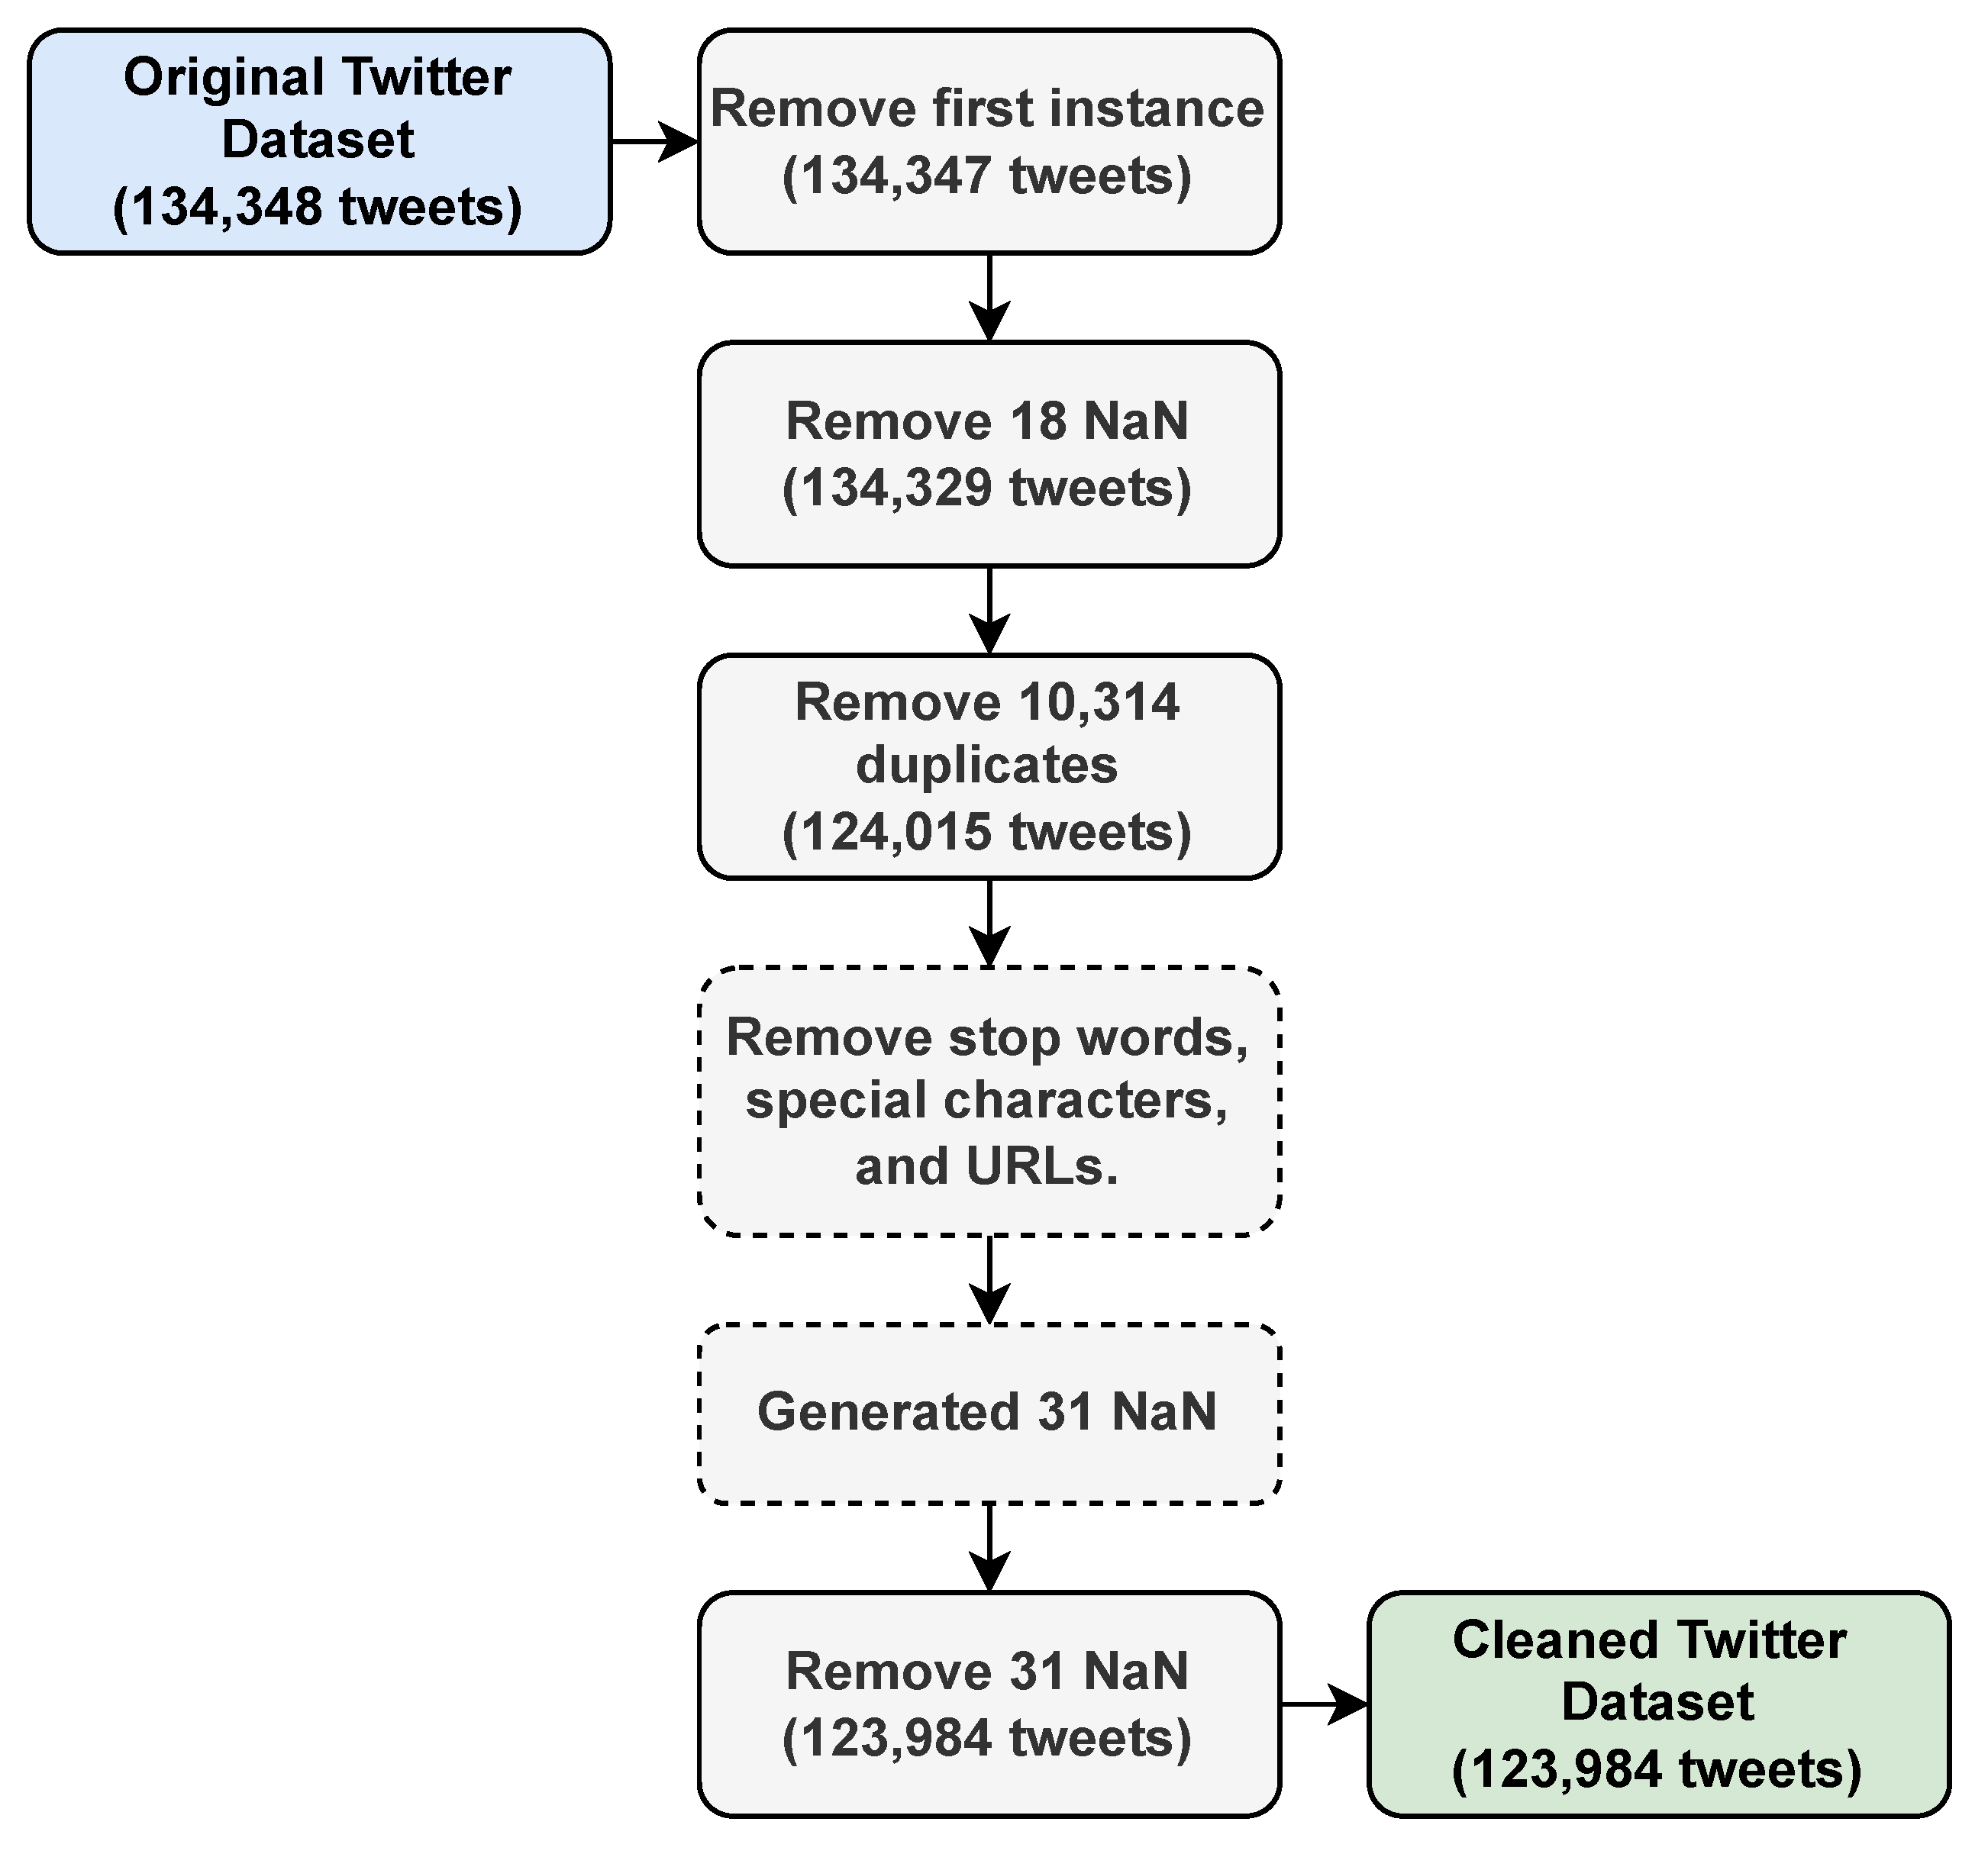
Figure 2.
Labeling Twitter Dataset steps.
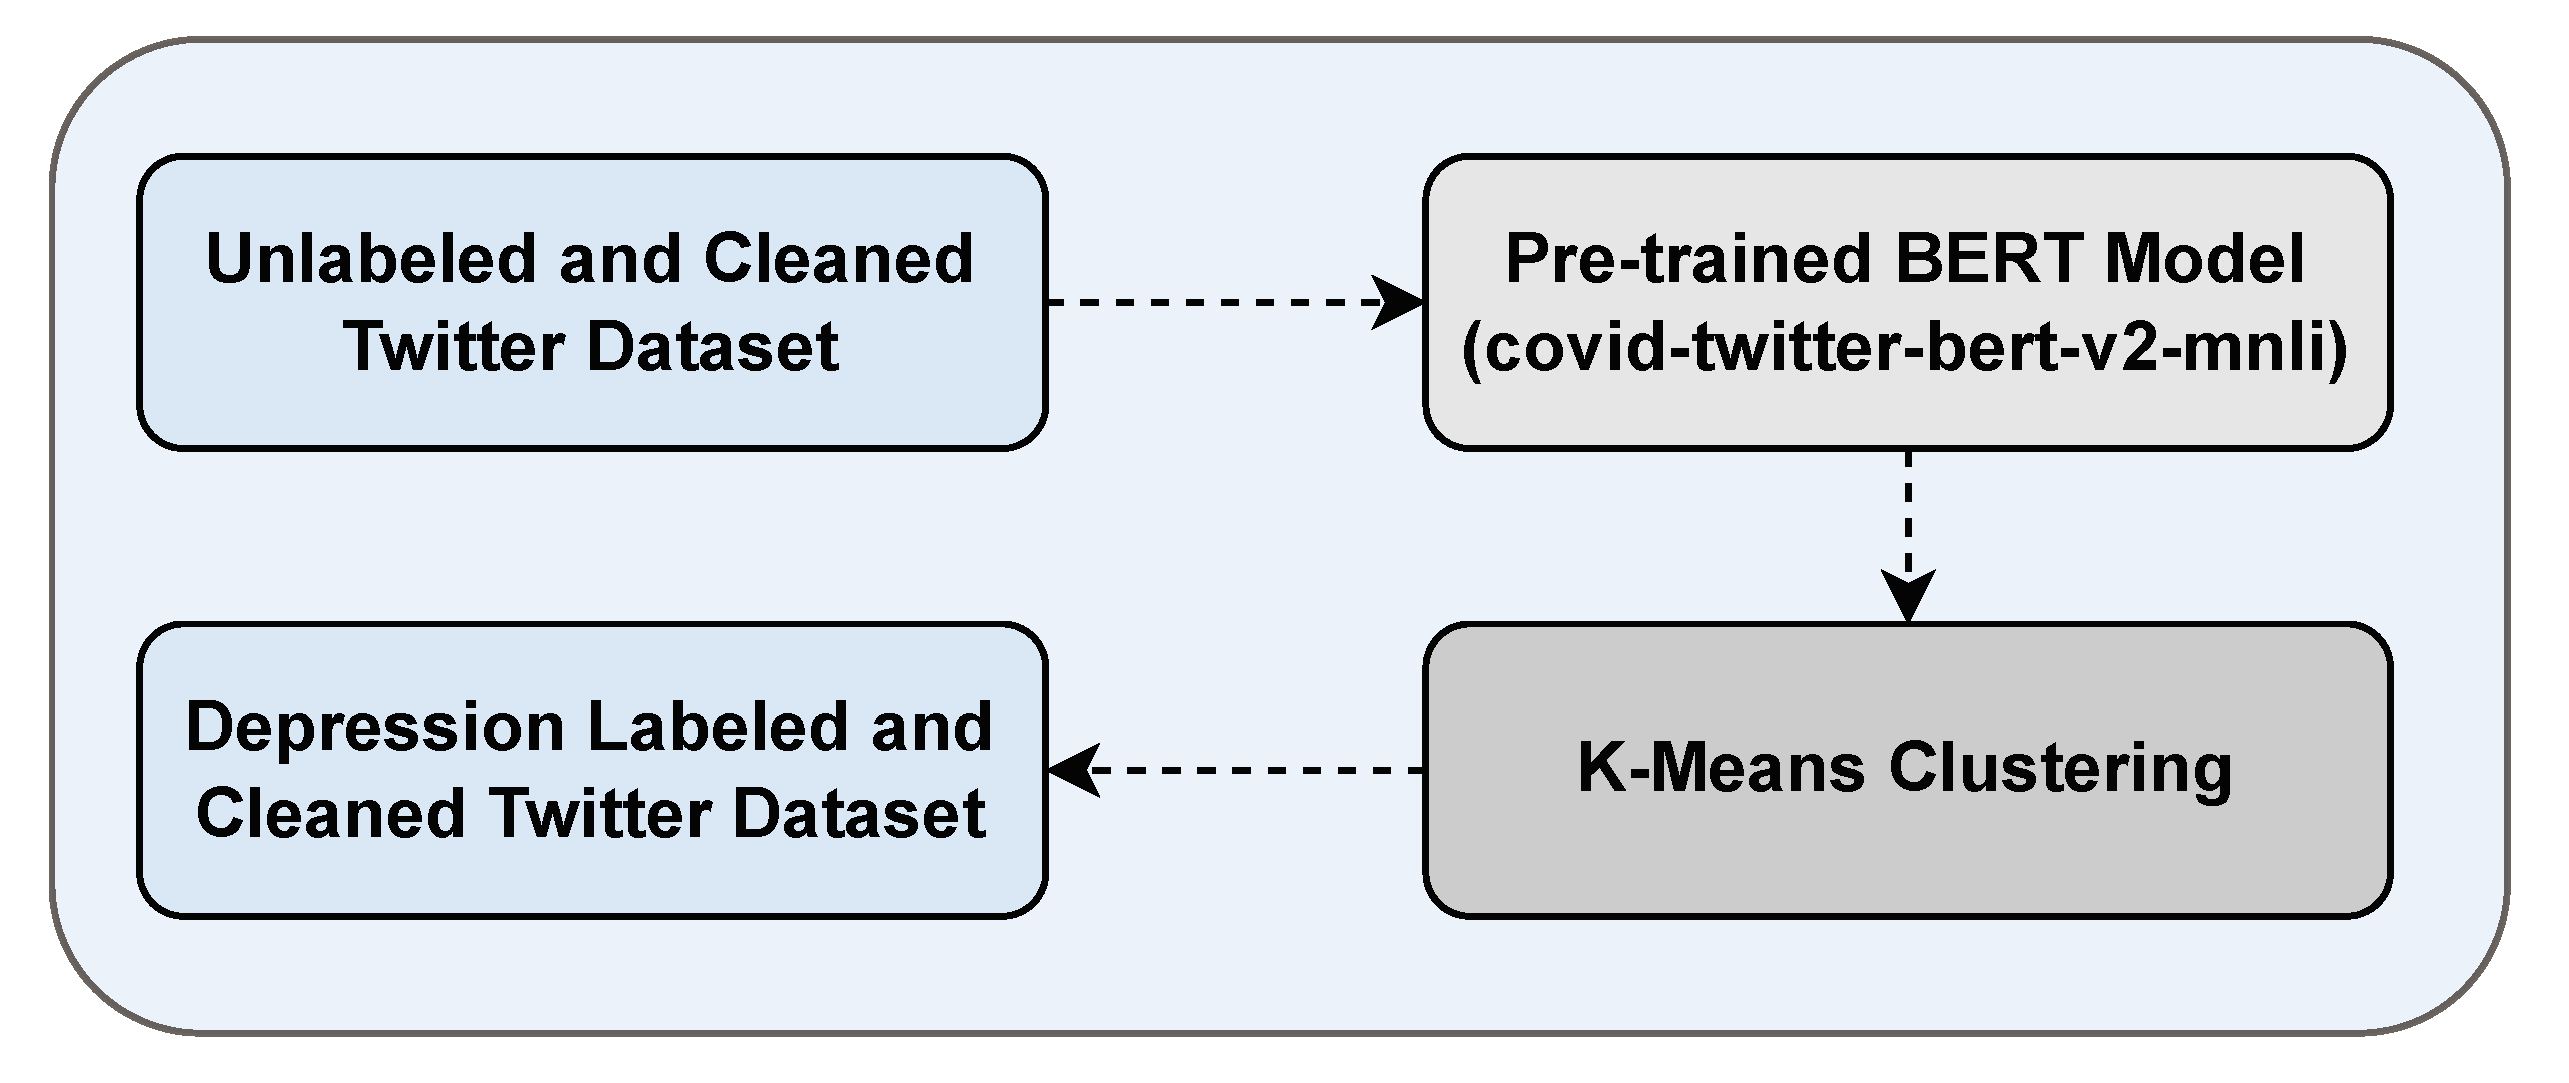
Figure 3.
DEENT-Generic Structure.

Figure 4.
DEENT-Bert Structure.
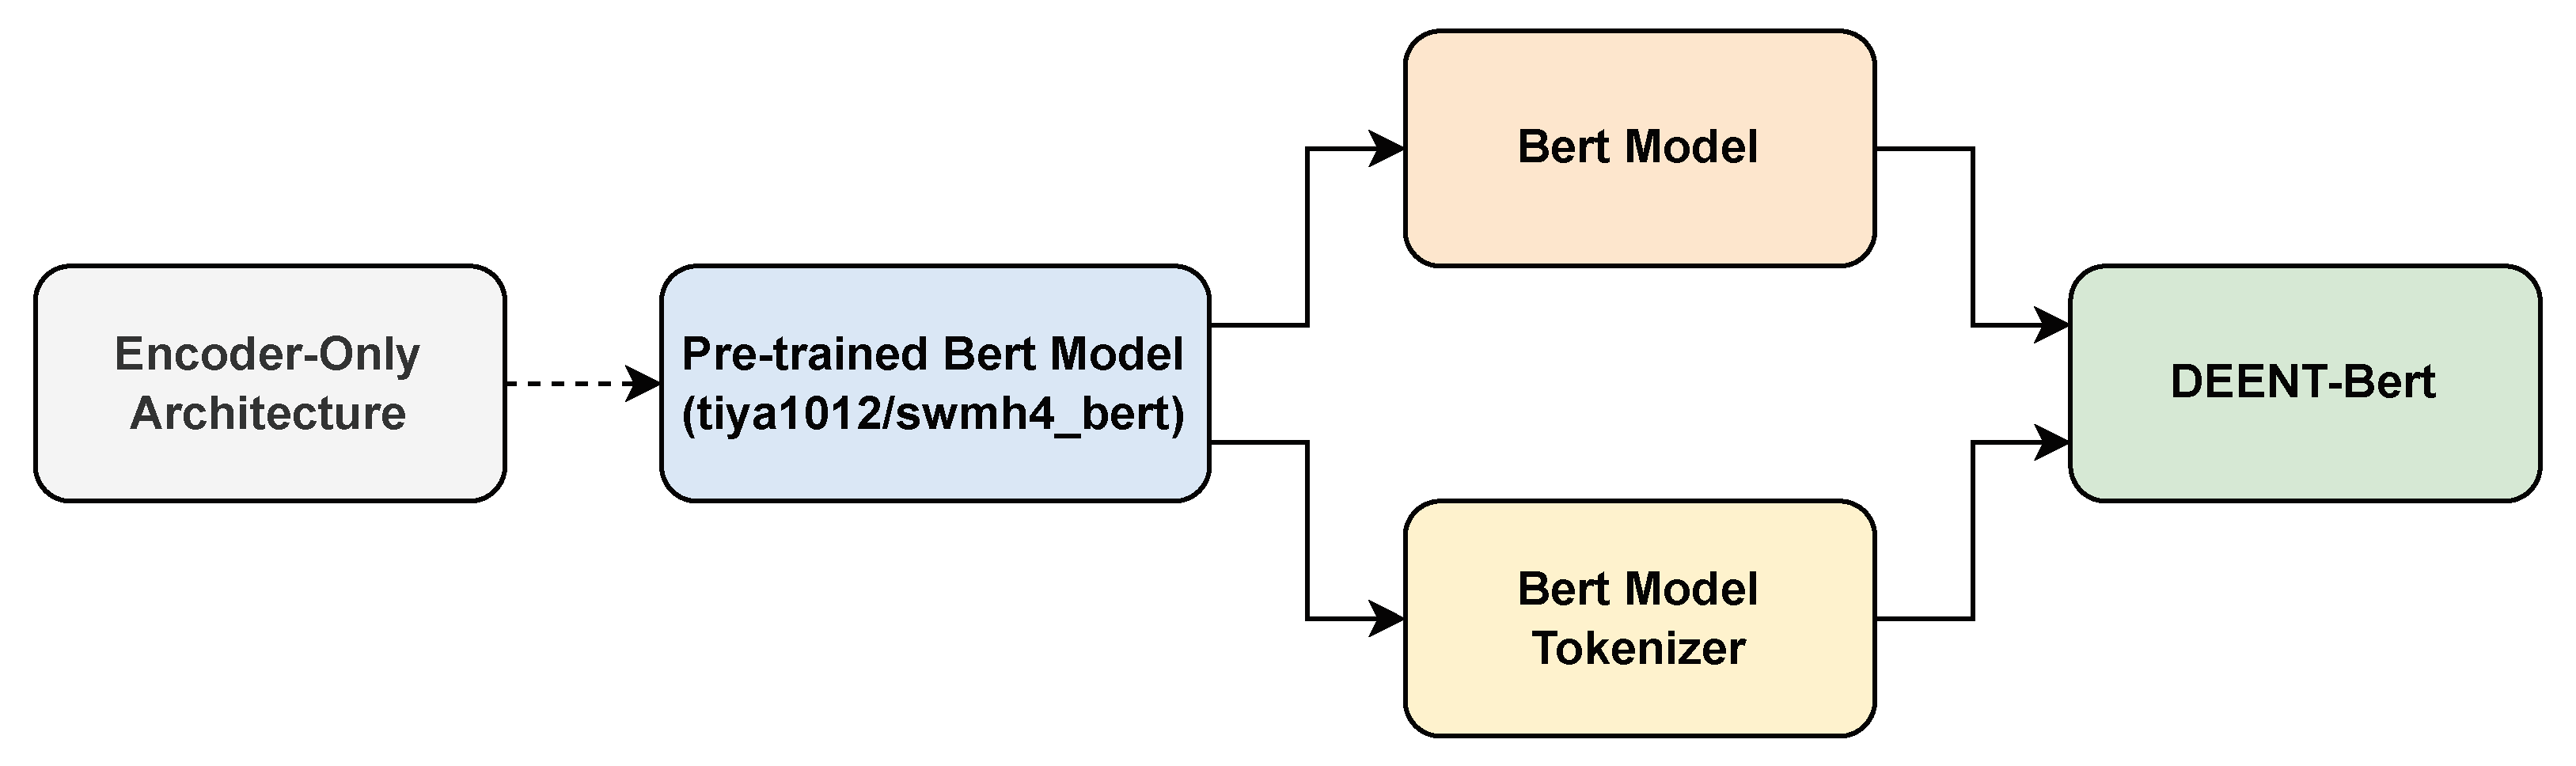
Figure 5.
DEENT vs Baseline models - Accuracy and Balanced Accuracy.
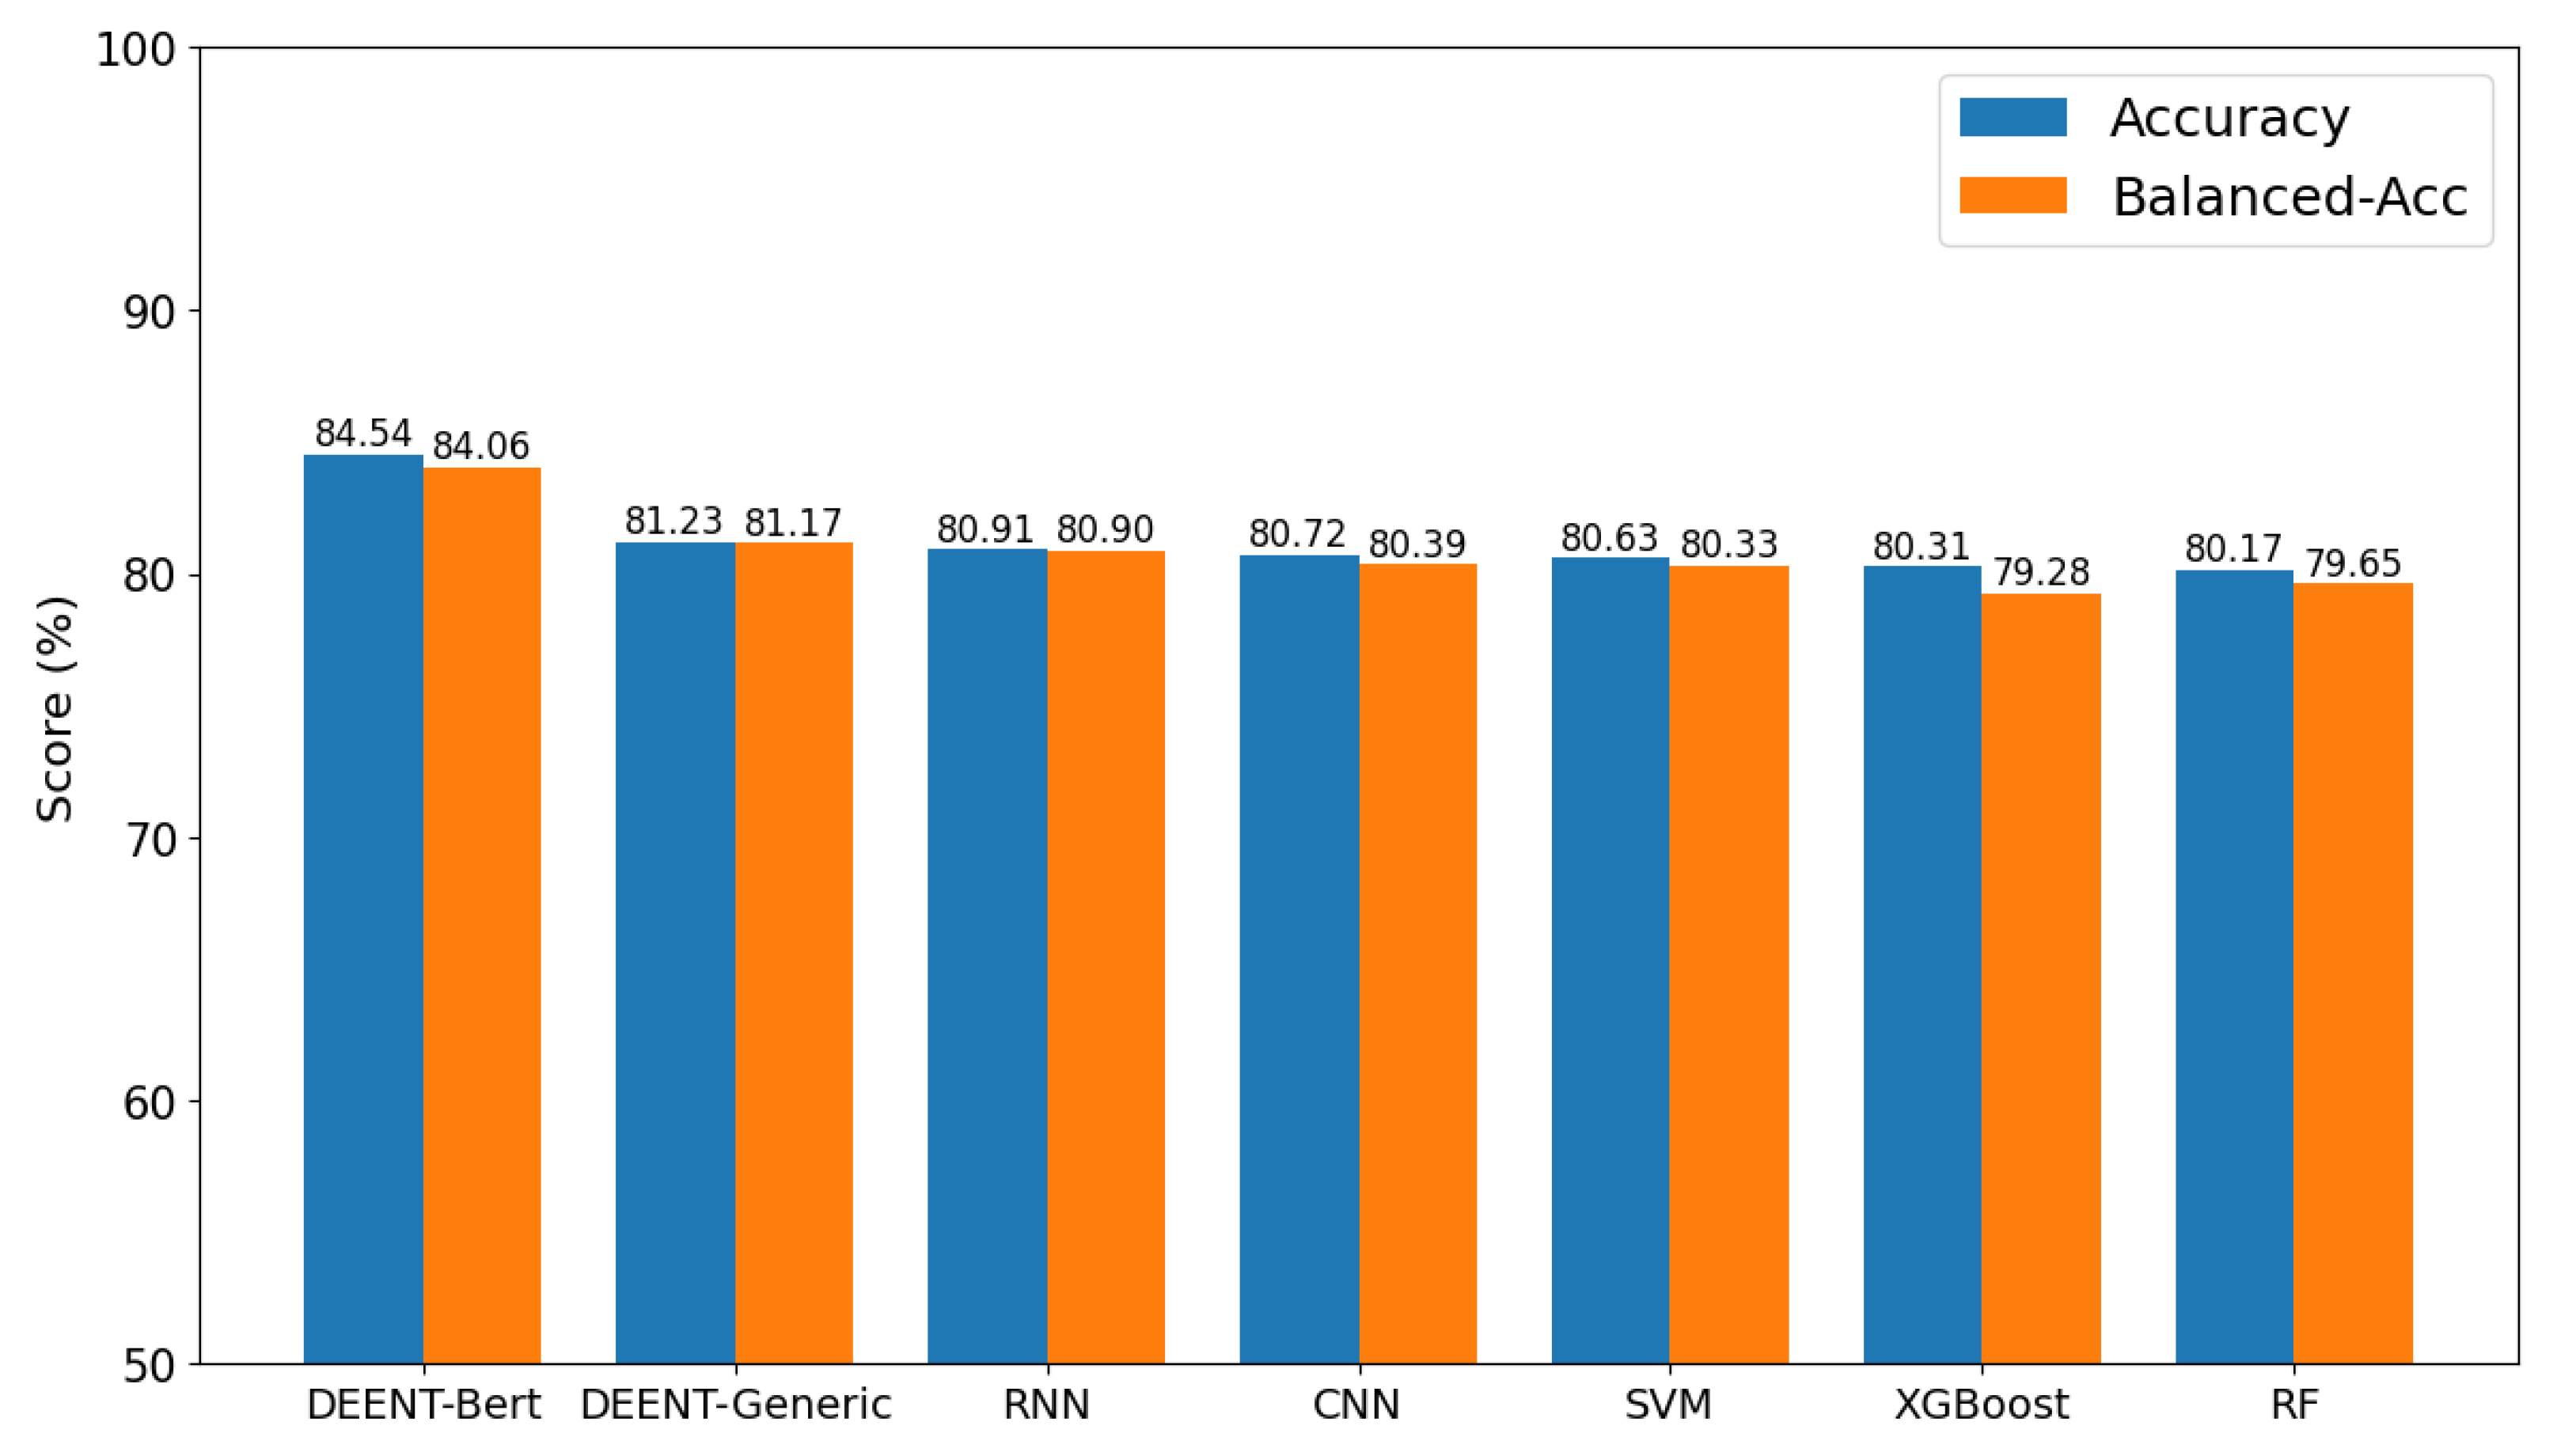
Figure 6.
DEENT vs Baseline models - Precision, Recall, and F1-Score.
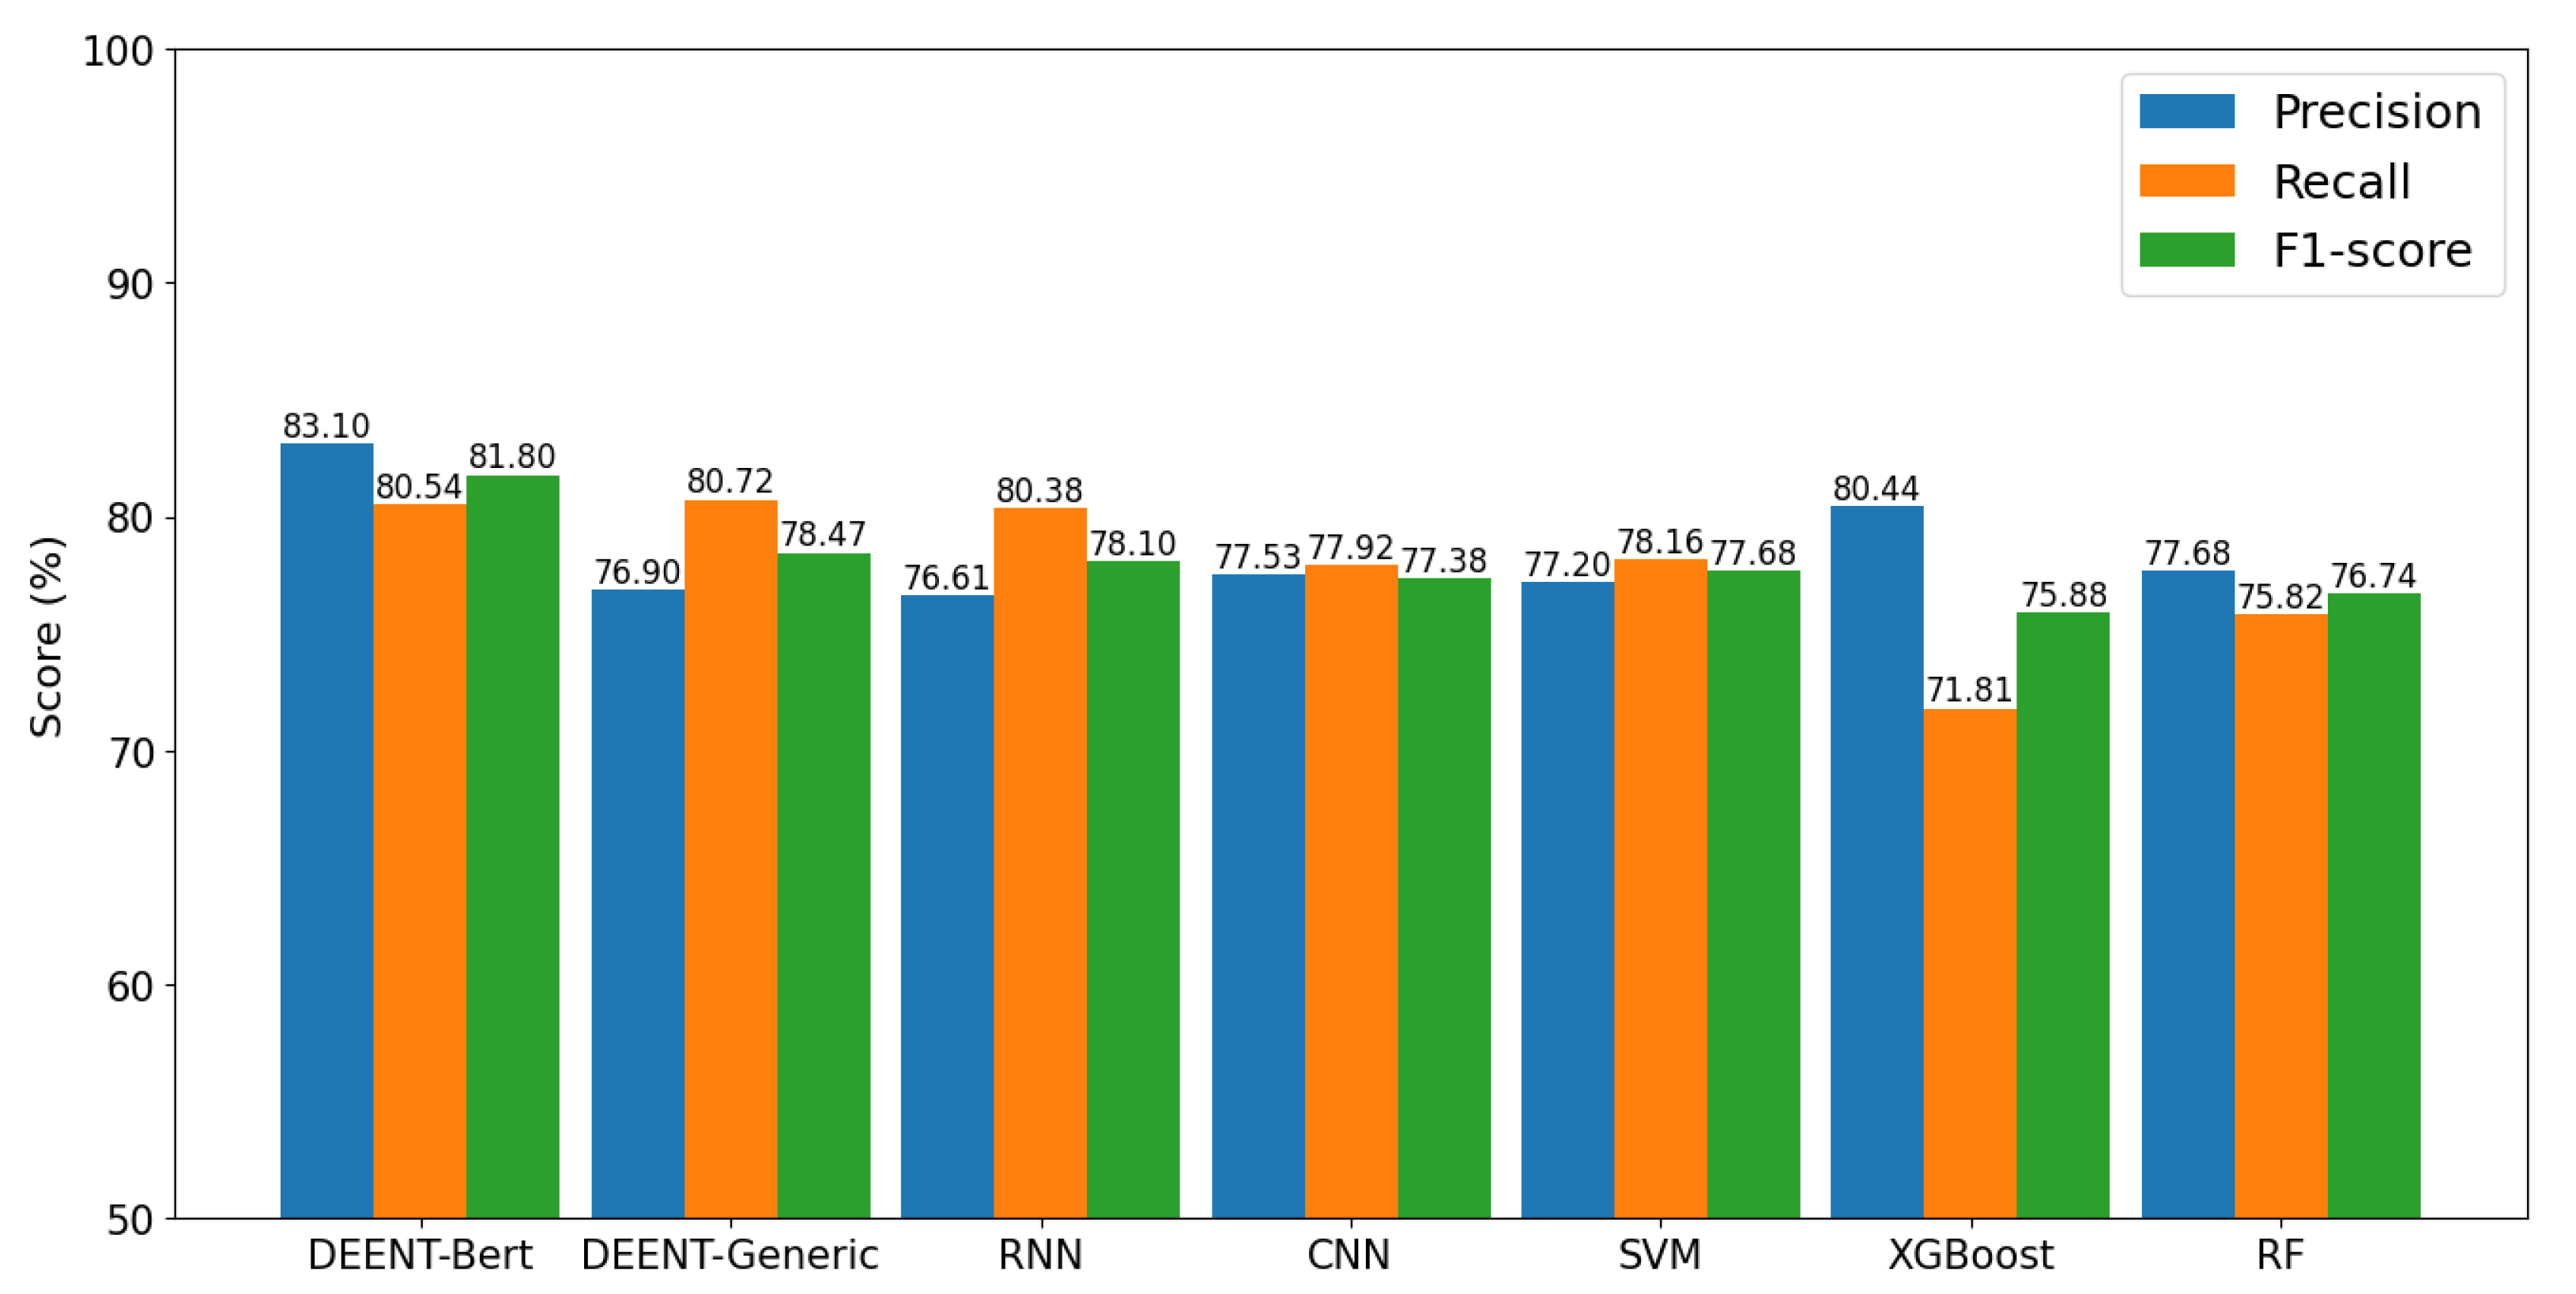
Figure 7.
DEENT vs DL Baseline models - Accuracy and Loss.
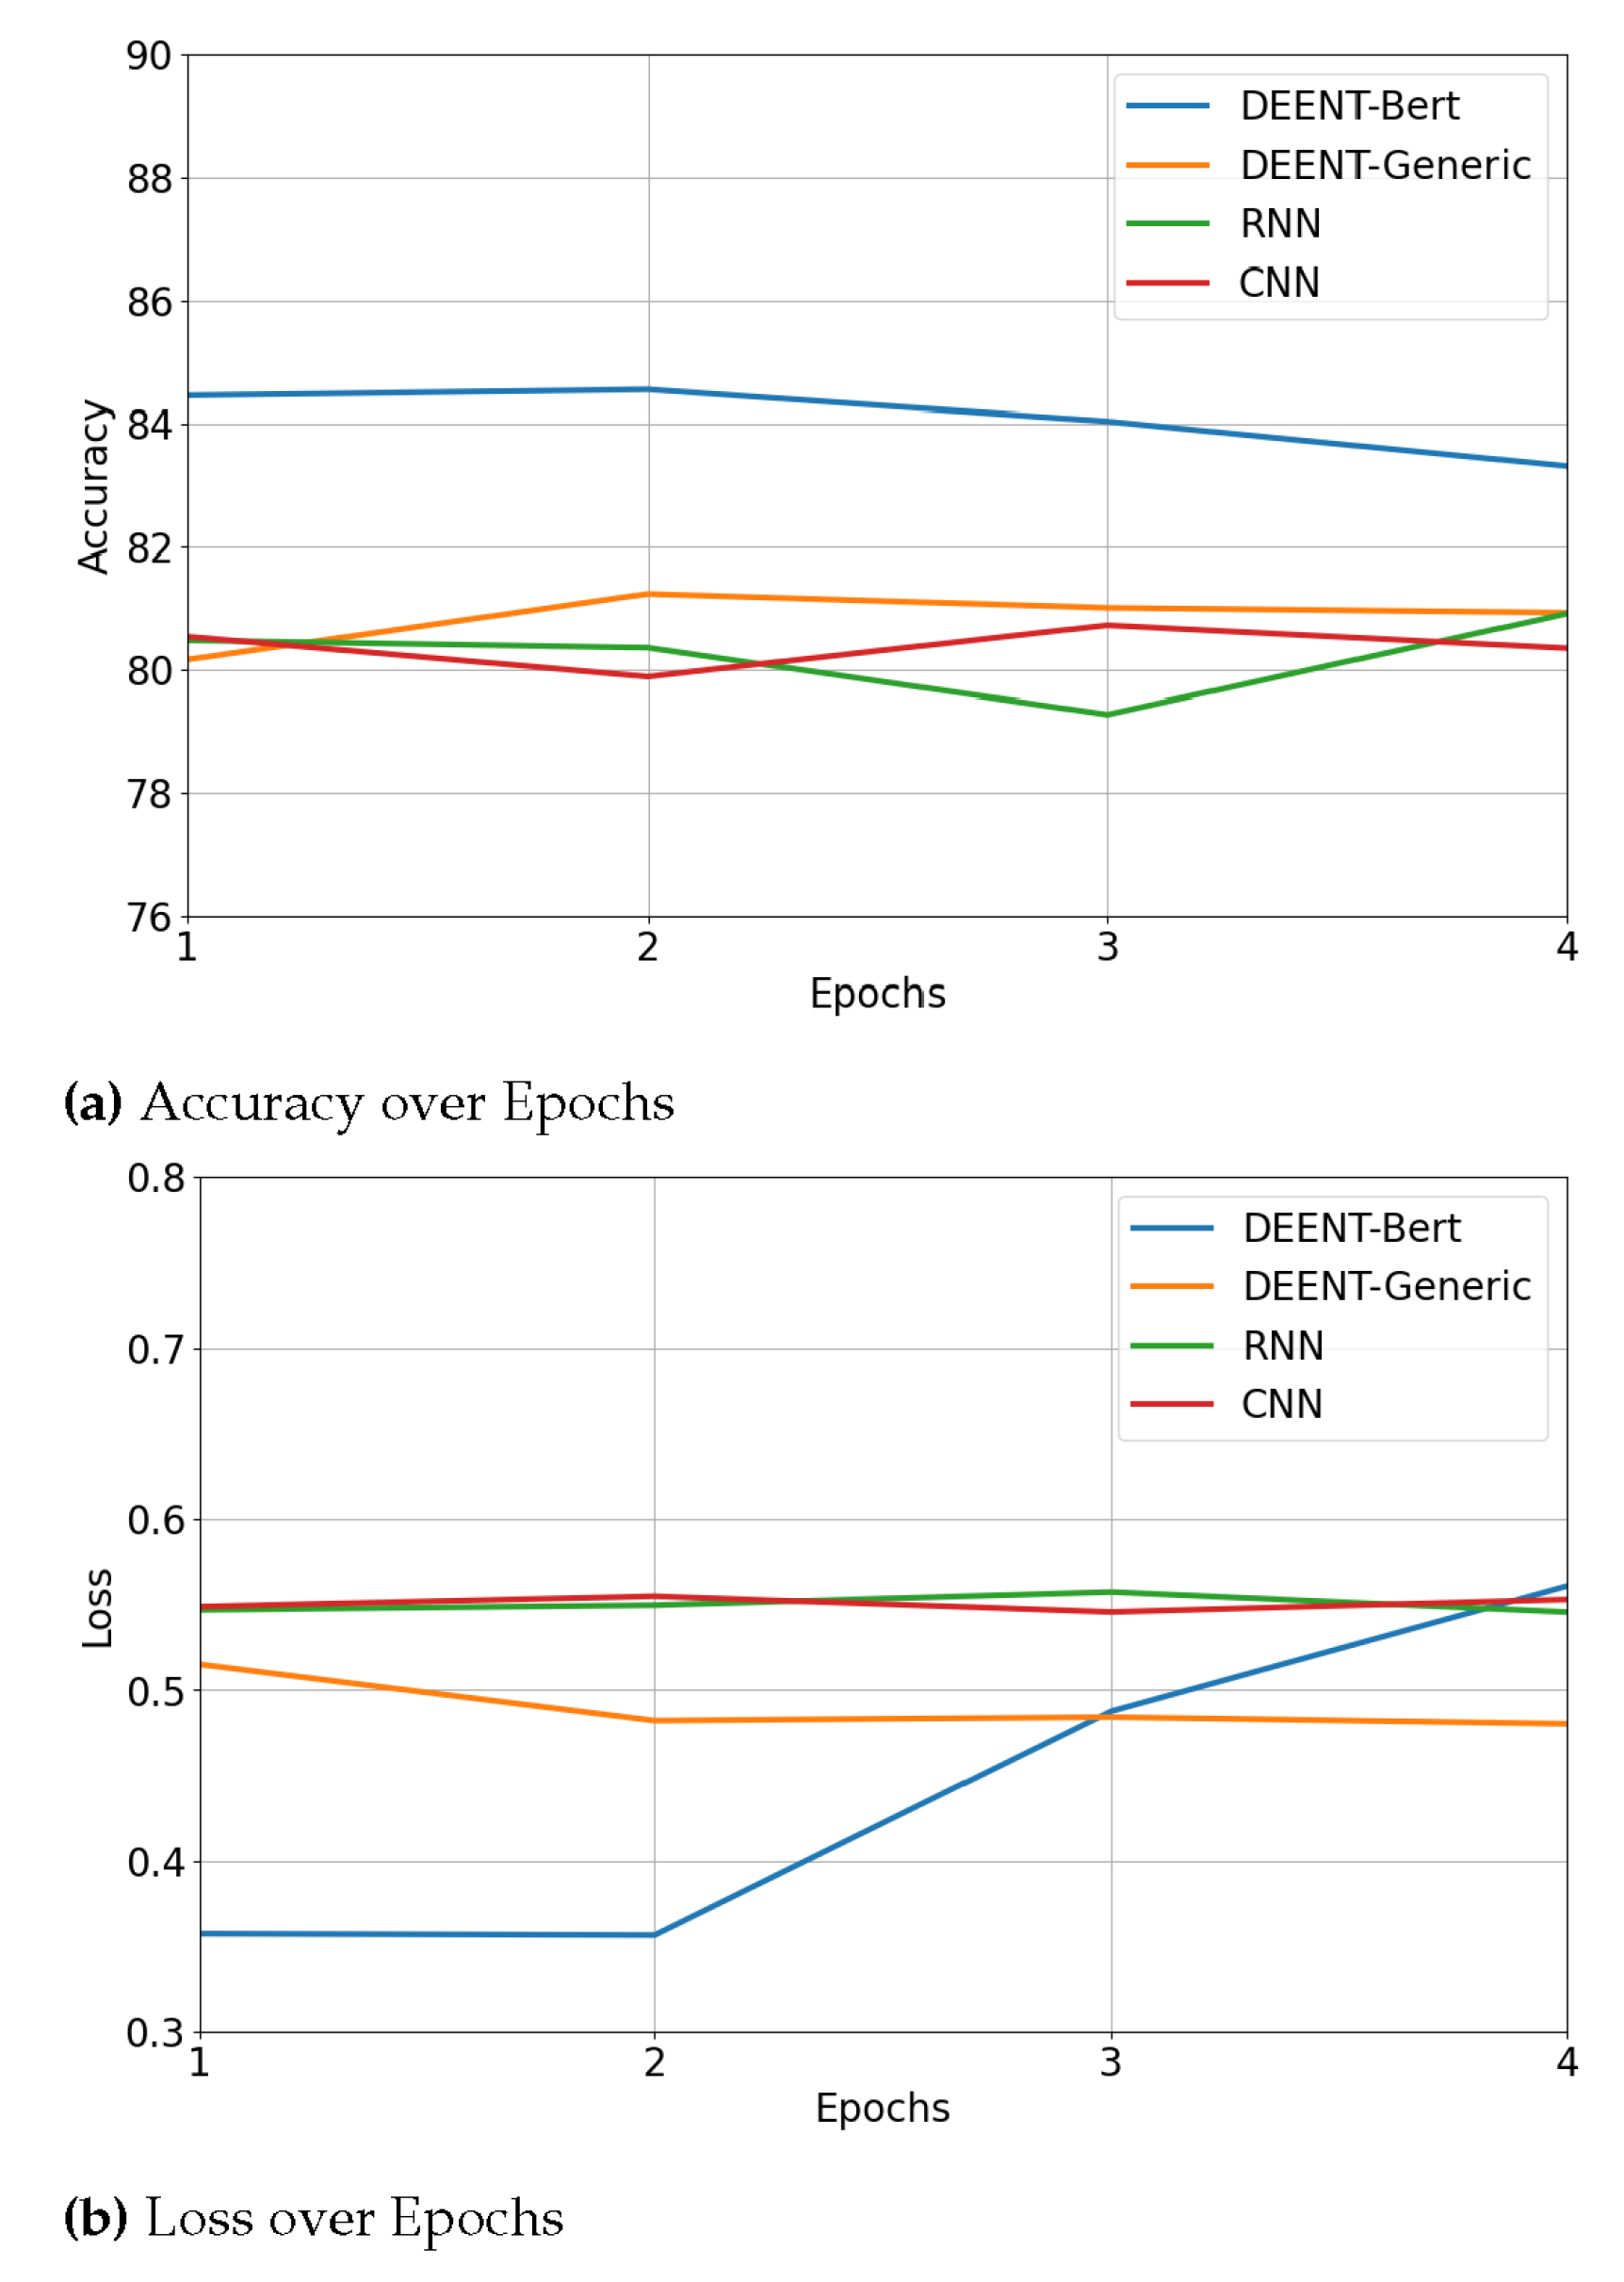

Table 1.
Related work - Comparison.
| Reference | Data Source | Samples | Collection Time | Domain | Algorithm | Metric | Transformer Architecture |
|---|---|---|---|---|---|---|---|
| [4] | 17,864 | During COVID-19 | Sentiment Analysis | Naive Bayes, Linear Regression | |||
| [5] | 73,000 | During COVID-19 | Sentiment Analysis | Latent Dirichlet Allocation | |||
| [6] | Google Form Survey | 22,562 | During COVID-19 | Depression and Anxiety Classification | RF, XGBoost | Balanced Accuracy, Sensitivity, Specificity | |
| [7] | Google Form Survey | 17,764 | During COVID-19 | Mental Illnesses Classification | RF, SVM | Accuracy, Sensitivity, Specificity, AUROC | |
| [8] | 5,877 msgs; 1,000 related to depression | During COVID-19 | Mental Illnesses Classification | SVM, RF, NB | Precision, Recall, F1-Score | ||
| [9] | 12,911 msgs; 4,996 related to depression | During COVID-19 | Depression and Suicide Classification | SVM, RF, XGBoost, CNN, SVM+KNN | Accuracy, Precision, Recall, F1-Score, AUROC | ||
| [10] | 447,856 | Before COVID-19 (2009 to 2016) | Depression Classification | MDHAN, SVM, BiGRU, MBiGRU, CNN, MCNN, HAN | Accuracy, Precision, Recall, F1-Score | ||
| [17] | 46,103 msgs; 16,205 were related to depression | Before COVID-19 | Mental Illnesses Classification | XGBoost, RF, CNN, LSTM, BERT, and MentalBERT | Accuracy, Precision, Recall, F1-Score | Encoder-only | |
| DEENT | 123,984 tweets; 53,475 related to depression | During COVID-19 (Dec 2019 to Dec 2020) | Depression Classification | DEENT-Generic and DEENT-Bert | Accuracy, Balanced Accuracy, Precision, Recall, F1-Score | Encoder-only |
Table 2.
Twitter dataset, sentiments-oriented.
| index | text | sentiment* |
|---|---|---|
| 0 | rising cases of covid does not alarm me rising death rate does more testing capacity means more cases are detected earlier and asymtomatics and mild cases are identified india is in scary place go check out their graphs | 1 |
| 1 | please vote for chicagoindiaresolution marking india independence shared values of democracy human rights secularism | 0 |
| 2 | wishing all of you eidaladha hazrat ibrahim as ki sunnah aap sab ko mubarak in most parts of india | 1 |
| 3 | daily coronavirus cases in india top for first time covid | 1 |
| 4 | sitting here india style watching the raindrops hit this big ass pond listening to amy winehouse finallay understand what zahree was talking about | 0 |
| * 0: positive; 1: negative | ||
Table 3.
Twitter dataset, depression-oriented.
| index | text | target* |
|---|---|---|
| 0 | rising cases covid alarm rising death rate testing capacity means cases detected earlier asymtomatics mild cases identified india scary place go check graphs | 0 |
| 1 | please vote chicagoindiaresolution marking india independence shared values democracy human rights secularism | 1 |
| 2 | wishing eidaladha hazrat ibrahim ki sunnah aap sab ko mubarak parts india | 0 |
| 3 | daily coronavirus cases india top first time covid | 1 |
| 4 | sitting india style watching raindrops hit big ass pond listening amy winehouse finallay understand zahree talking | 0 |
| * 0: non-depressive; 1: depressive | ||
Disclaimer/Publisher’s Note: The statements, opinions and data contained in all publications are solely those of the individual author(s) and contributor(s) and not of MDPI and/or the editor(s). MDPI and/or the editor(s) disclaim responsibility for any injury to people or property resulting from any ideas, methods, instructions or products referred to in the content. |
© 2025 by the authors. Licensee MDPI, Basel, Switzerland. This article is an open access article distributed under the terms and conditions of the Creative Commons Attribution (CC BY) license (http://creativecommons.org/licenses/by/4.0/).
Copyright: This open access article is published under a Creative Commons CC BY 4.0 license, which permit the free download, distribution, and reuse, provided that the author and preprint are cited in any reuse.


