
Submitted:
22 February 2025
Posted:
24 February 2025
You are already at the latest version
Abstract
Background: Sodium regulation is critical in extremely low birth weight (ELBW, < 1000 grams) in-fants. In a recent systematic review, a sodium pattern over postnatal age and its variables (care factors, fluid regimens, maturational factors) has been summarized. However, this systematic re-view also illustrated the shortages and limitations of reported cohorts, and the need to report on additional datasets. This study therefore aims to describe the postnatal sodium patterns and its variables in a cohort of ELBW neonates in their first 10 days of life. Methods: Data on 1704 serum sodium observations in the first 10 days of life from 211 ELBW infants admitted to a single neonatal intensive care unit were available to explore associations between serum sodium and perinatal variables. Multivariate linear models with sodium as response variable and postnatal day as factor were hereby applied. Baseline and treatment characteristics were included as variables, applying an unstructured covariance matrix to account for the longitudinal data. Results: Gestational age, birth weight, and length, showed variable correlations with serum sodium concentrations over postnatal age. Interesting, the analysis on sodium patterns in this ELBW cohort also revealed significant as-sociations between prenatal betamethasone use, delivery mode, ibuprofen, or the use of inotropics and the postnatal serum sodium concentrations patterns. Multivariate analyses confirmed that gestational age and birth weight independently impacted sodium concentration patterns, and that ibuprofen use remained a significant variable after adjusting for these variables. Conclusions: Gestational age and birth weight complexities emphasize the need for nuanced understanding and standardized methodologies. Sodium patterns in the current ELBW cohort provide support for previously published sodium reference patterns in this population. New variables associated with sodium levels include ibuprofen administration, and the use of inotropic agents.
Keywords:
extremely low birth weight
; sodium
; dysnatriemia
; hyponatriemia
; hypernatriemia
1. Introduction
While significant improvements in survival and outcome occurred over the last decades, extremely low birth weight (ELBW, <1000g) infants still face short- and long-term outcome challenges [1,2]. Sodium dysregulation, particularly in the first 10 days of life, poses a significant concern as modifiable indicator of short- and long-term outcomes. Unfortunately, aspects on patterns, variables and reference values of sodium have not been widely studied in this specific population [3].
In a recent systematic review on this topic, patterns on sodium changes over postnatal age in ELBW cases were summarized [4]. Besides care related variables (incubator settings, fluid regimens, or occlusive skin care), these patterns mainly related to maturational factors of the ELBW infant (gestational age, postnatal age, small or appropriate for gestational age, SGA/AGA). However, we could only retain 8 studies (observational studies, n = 5; case control studies, n = 2, and one randomized controlled trial) [4]. Consequently, the extensive heterogeneity among the studies retained in this review called for cautious interpretation of the pooled data, while additional validation studies are needed to better document normative values and to improve fluid and sodium supplementation protocols and practices. Because of the way the data on sodium values were reported in the individual papers, we also failed to provide data on mean sodium values over postnatal age [4]. This makes clinical studies on e.g. associations between hypo- or hypernatriemia and short- or long-term outcomes even more difficult to pool and understand.
Since the recently published systematic review illustrated the shortage on reported cohorts, and the need to report additional datasets, this study therefore aims to describe the postnatal sodium patterns and its variables in a large cohort of ELBW neonates in their first 10 days of life.
2. Materials and Methods
2.1. Clinical Characterstics and Fluid Administration Strategy
This study utilized previously collected longitudinal serum sodium concentrations of neonates hospitalized in the neonatal intensive care unit (NICU) of the University Hospitals Leuven from July 2007-August 2011 and an additional dataset from June 2015-March 2017. All ELBW infants who had serum sodium concentrations available during the first 10 days of life were included [5]. We defined day 1 as the first 24h of life [6]. In addition, clinical data [birth weight, length, gestational age, SGA/AGA, sex, neonatal death, prenatal lung maturation, type of delivery (caesarean/vaginal), ibuprofen prescription, exposure to inotropics] were extracted from medical records as previously described [5]. Ethics approval (S63405, KU Leuven, Belgium) has been provided to extract these data and perform the analysis [5].
All ELBW neonates were cared for in closed incubators, with temperature setting to sustain normothermia and with humidity settings at 50-80 %. The fluid and sodium management in this cohort was standardized, with an increment in fluid volume over postnatal age [60 ml/kg, based on 40 ml/kg glucose 10% + 20 ml/kg plasma on day 1, day of birth – day of birth, 80 ml/kg on day 2, 100 ml/kg on day 3, 120 ml/kg on day 4, and 150-180 ml/kg for day 5 onwards). Sodium (2.5 mmol/kg/day) was commonly administrated as part of parenteral nutrition from day 4 onwards [7].
2.2. Statistical analysis
Statistical analysis explored the patterns and trends in sodium levels during the first 10 days of life in ELBW infants and its association with perinatal and neonatal variables. The variables included prenatal betamethasone lung maturation treatment, mode of delivery, SGA status, gestational age, sex, birth weight and length, ibuprofen treatment and inotropic agents. We applied multivariate linear models with sodium as response variable and postnatal day as factor. Baseline or treatment characteristics were included as variables, with an unstructured covariance matrix to account for longitudinal data.
We tested interactions between day and each characteristic, presenting mean differences with 95% confidence intervals (CIs) per day if significant, or overall effects if not. If applicable, non-linear effects of continuous variables were estimated using log-transformation. Results were presented as slopes with 95% CIs. Statistical analyses were performed using SAS software (version 9.4, SAS System for Windows) [8].
3. Results
3.1. Clinical Characteristics of the ELBW Cohort
Data were collected on 211 ELBW neonates, with population characteristics and the use of betamethasone for lung maturation, ibuprofen, and inotropic agents as summarized in Table 1.
The study measured 1704 serum sodium concentrations in ELBW infants during their first 10 days of life. Figure 2 illustrates the variation of serum sodium concentration over time. Serum sodium was significantly higher after day 1 with a peak serum sodium concentration on day 3 at 145.4 mmol/L, followed by a gradual decrease until day 9.
3.2. Perinatal Variables
We evaluated the associations between prenatal betamethasone lung maturation administration and serum sodium concentration in ELBW infants over the first 10 days of life but found no significant correlations. The mean serum sodium concentration did neither differ significantly between infants with and without lung maturation treatment (Figure 3a). Additionally, we studied the impact of delivery mode (caesarean vs. vaginal) on serum sodium concentrations (Table S1). While some differences were noted on specific days, overall, no consistent significant associations were found (Figure 3b).
3.3. Neonatal Variables
Associations between neonatal variables such as sex (Figure 3c), SGA status (Figure 3d), and serum sodium concentrations were evaluated. No significant associations were observed. The serum sodium concentrations between male and female ELBW infants, or between SGA and AGA infants, were neither significantly different.
We also assessed the impact of gestational age (Figure 4a, Table S2), birth weight (Figure 4b, Table S3), and birth length (Figure 5c) on serum sodium concentration. The associations for gestational age, birth weight, and birth length varied across the 10 days. Specifically, gestational age showed a positive correlation on day 1 and a negative correlation on the subsequent days (Figure 4a). Birth weight and birth length were negatively associated with serum sodium concentrations from day 3 onward (Figure 4b and Figure 4c, Tables S9–S10).
We compared serum sodium concentrations between infants who were exposed to ibuprofen and those who were not (Figure 5a, Table S4), as well as between those exposed to inotropic agents and those who were not exposed (Figure 5b, Table S5). Both ibuprofen and inotropic agent exposure showed significant day-to-group interactions, with differences in sodium concentrations observed from day 6 onwards (Table S4 and S5).
Multivariate analyses confirmed that gestational age and birth weight independently impacted sodium levels, and that ibuprofen use remained a significant variable after adjusting for these variables (Table S6).
4. Discussion
Sodium regulation in neonates is of utmost importance, most prominent in the most immature ELBW subpopulation. This study reports on an analysis of sodium patterns and the variables associated of these sodium values in a cohort of 211 ELBW’s from a single neonatal intensive care unit.
When considered the overall pattern during the first 10 days of postnatal life (Figure 2, Table 2), we noticed the expected increase in sodium values over the first days of life, followed by a subsequent blunted decrease to result in sodium values similar to those at birth from the end of the first week of life. This pattern largely confirms the pattern recently described in our systematic review [4], assuming that this initial increase in sodium levels is facilitated by a physiological fluid shift in the first 24-48 hours of life (more pronounced water losses), reaching a peak on day 3, followed by a gradual decrease [1,2,3,4]. In this way, the currently reported sodium reference values validate these previously described findings [4].
ELBW infants experience prolonged water loss, necessitating fluid and sodium supplementation after initial weight loss [1,9,10]. The challenge lies in balancing the need for fluids to prevent hypernatremia, dehydration and hyperbilirubinemia while avoiding potential complications of excessive fluid administration like patent ductus arteriosus, or bronchopulmonary dysplasia. Ideally, fluid supplementation allows contraction of the extracellular space and excessive fluid loss but helps avoiding early hypernatremia and providing enough sodium necessary for growth after the first few days [9,10]. Both Costarino et al. [11] (bronchopulmonary dysplasia) and Eibensteiner et al. [12] (high grade intraventricular hemorrhage, necrotizing enterocolitis, mortality) observed that sodium intake restriction resulted in better outcomes [11,12].
When reflecting on the variables associated with sodium patterns in the first 10 days of postnatal age, gestational age’s association on sodium values varied across the first 10 days in the current analysis. Higher gestational age was correlated with higher sodium values on day 1, while days 3-10 show a correlation with lower sodium values. It is important to note that infants who were born at 34 weeks of gestational age yet <1kg are severely growth restricted. Correspondingly, Boubred et al. showed that SGA had a non-significant trend to lower serum sodium values compared to AGA infants [13]. The decrease in sodium values with decreasing gestational age observed in the research of Strizke et al. aligns with the finding from our cohort on day 1 of life [14].
Also, the effect of birth weight on serum sodium values varied, with a higher birth weight resulting in lower sodium values on all days except day 1 and 2. Higher birth weight was associated with lower average sodium values. Monnikendam et al. reported on an association between moderate and severe hypernatremia and lower birth weight and gestational age [3].
Besides largely confirming the relevance of these maturational differences, additional and new variables were identified. Infants who received ibuprofen had higher sodium levels than those who were not exposed. This was somewhat unexpected as non-steroidal anti-inflammatory drugs (NSAIDs) inhibit the synthesis of renal prostaglandin, potentially causing a range of disturbances in electrolyte and acid-base balance and inducing fluid retention. These disturbances can include sodium retention and a decrease in renal function, which can further reduce renal free water clearance and lead to hyponatremia [15]. Additionally, ibuprofen can also impact renal function directly by causing tubular toxicity, leading to a decrease in the concentrating ability of the kidneys. A likely explanation for the hypernatremia observed in this cohort is that the infants who were administered ibuprofen also had fluid restriction as a part of their treatment [15].
Sodium values were significantly higher for infants who were exposed to ionotropic agents compared to their counterparts. Inotropes are commonly used in NICUs to treat hypotension and poor perfusion. However, their impact on serum sodium levels in neonates is not well-studied and the evidence is limited [16]. One possible explanation could be related to the physiological effects of inotropes. They can increase blood pressure and improve organ perfusion, which might influence renal function and subsequently affect electrolyte balance, including sodium levels [16]. Another variable could be the fluid management in neonates who are on inotropes. These neonates likely receive additional sodium containing fluid boluses compared to those not on inotropes, which could influence their serum sodium levels. However, it is important to note that this is a complex issue and other variables could also be involved. More research is needed to fully understand the relationship between inotrope use and serum sodium levels in neonates.
Interestingly, in the current cohort study, infants born by vaginal delivery exhibited higher sodium values on days 3, 4, and 10 compared to those born by caesarean section. To our knowledge, this association has not yet been observed, and we can only speculate on the underlying mechanisms, perhaps related to peripartal fluid shifts. Stritzke et al. looked at the impact of caesarean delivery on cord blood electrolytes, but no significant association was observed after correcting for gestational age [14]. Dimitrou et al. reported that insensible water loss was lower, and urine output higher in preterms that were exposed to prenatal lung maturation, while fewer developed hyponatraemia [17]. The absence of significant differences in the current cohort can be explained by their overall high exposure rate (87 %).
Obviously, our study has its limitations. The retrospective analysis of this cohort presents inherent limitations in establishing causation. Future research should aim to unveil normative values and optimize fluid and sodium supplementation protocols. Additionally, the association of different variables on sodium homeostasis in ELBW infants should be established in additional longitudinal assessments.
In conclusion, we confirmed sodium trends and reference values over postnatal age in ELBW cases, while new variables of this sodium pattern were suggested. While associations between serum sodium levels and gestational age, birth weight and birth length are in line with what has been previously described in the literature, we observed the association of exposure to inotropic agents or ibuprofen and serum sodium values in ELBW infants. This should be further prospectively validated and confirmed in larger cohorts. Such reference values are useful to provide clinicians guidance to interpret single sodium observations or postnatal trends in individual ELBW newborns.
Supplementary Materials
The following supporting information can be downloaded at the website of this paper posted on Preprints.org. Table S1. Effect of caesarean on serum sodium concentration of ELBW infants in the first 10 days of life; Table S2. Effect of gestational age on serum sodium concentrations of ELBW infants in the first 10 days of life; Table S3. Effect of birth weight on serum sodium concentrations of ELBW infants in the first 10 days of life; Table S4. A comparison of serum sodium levels during the first 10 days in ELBW infants who were exposed to ibuprofen (yes/no) versus those who were not, with a 95% confidence interval; Table S5. A comparison of serum sodium levels during the first 10 days in ELBW infants who were exposed to inotropic agents (yes/no) versus those who were not, with a 95% confidence interval; Table S6 The interaction between gestational age and birth weight with effect on serum sodium values in the first 10-days of life, with a 95% confidence interval.
Author Contributions
Conceptualization, S.v.S., M.P. and K.A.; methodology, S.v.S., M.P. and K.A.; writing—original draft preparation, M.P. and S.v.S.; writing—review and editing, T.S., A.L., formal analysis, A.L.; A.R. and K.A.; supervision, K.A.; funding acquisition, K.A. All authors have read and agreed to the published version of the manuscript.
Funding
This research received no external funding.
Institutional Review Board Statement
The study was conducted in accordance with the Declaration of Helsinki and approved by the Institutional Review Board of UZ Leuven (S63405).
Informed Consent Statement
Patient consent was waived by the IRB involved.
Data Availability Statement
The original contributions presented in this study are included in the article/supplementary material. Further inquiries can be directed to the corresponding author(s).
Conflicts of Interest
The authors declare no conflicts of interest.
References
- Wada, M.; Kusuda, S.; Takahashi, N.; Nishida, H. Fluid and electrolyte balance in extremely preterm infants < 24 weeks of gestation in the first week of life. Pediatr. Int. 2008, 50, 331–336. [Google Scholar] [CrossRef] [PubMed]
- Stritzke, A.; Thomas, S.; Amin, H.; Fusch, C.; Lodha, A. Renal consequences of preterm birth. Mol. Cell. Pediatr. 2017, 4, 2. [Google Scholar] [CrossRef] [PubMed]
- Monnikendam, C.S.; Mu, T.S.; Aden, J.K.; Lefkowitz, W.; Carr, N.R.; Aune, C.N.; Ahmad, K.A. Dysnatremia in extremely low birth weight infants is associated with multiple adverse outcomes. J. Perinatol. 2019, 39, 842–847. [Google Scholar] [CrossRef] [PubMed]
- Pace, M.; van Sas, S.; Salaets, T. , Laenen, A.; Raaijmakers, A.; Allegaert, K. Hypo- and hypernatriemia in extremely low birth weight infants in the first 10 days of life: a review. Children 2025, 12, 231. [Google Scholar] [CrossRef] [PubMed]
- van Donge, T.; Allegaert, K.; Gotta, V; Smits, A.; Levtchenko, E.; Mekahli, D.; van den Anker, J.; Pfister, M. Characterizing dynamics of serum creatinine and creatinine clearance in extremely low birth weight neonates during the first 6 weeks of life. Pediatric Nephrology. 2021, 36, 649–659. [Google Scholar] [CrossRef] [PubMed]
- Allegaert, K.; Hildebrand, H.; Singh, K.; Turner, M.A. The publication quality of laboratory values in clinical studies in neonates. Pediatr. Res. 2023, 94, 96–98. [Google Scholar] [CrossRef] [PubMed]
- Devlieger, H.; De Pourcq, L.; Casneuf, A.; Vanhole, C.; de Zegher, F.; Jaeken, J.; Eggermont, E. Standard two-compartment formulation for total parenteral nutrition in the neonatal intensive care unit: a fluid tolerance based system. Clin. Nutr. 1993, 12, 282–286. [Google Scholar] [CrossRef] [PubMed]
- SAS Institute Inc. SAS software 9.4; SAS Institute Inc.: Cary, NC, USA, 2014. [Google Scholar]
- Gawlowski, Z.; Aladangady, N.; Coen, P.G. Hypernatraemia in preterm infants born at less than 27 weeks gestation. J. Paediatr. Child. Health. 2006, 42, 771–774. [Google Scholar] [CrossRef] [PubMed]
- Segar, J.L. A physiological approach to fluid and electrolyte management of the preterm infant: Review. J Neonatal Perinatal Med. 2020, 13, 11–19. [Google Scholar] [CrossRef] [PubMed]
- Costarino, A.T.; Gruskay, J.A.; Corcoran, L.; Polin, R.A.; Baumgart, S. Sodium restriction versus daily maintenance replacement in very low birth weight premature neonates: A randomized, blind therapeutic trial. J Pediatr. 1992, 120, 99–106. [Google Scholar] [CrossRef] [PubMed]
- Eibensteiner, F.; Laml-Wallner, G.; Thanhaeuser, M.; Ristl, R.; Ely, S.; Jilma, B.; Berger, A.; Haiden, N. ELBW infants receive inadvertent sodium load above the recommended intake. Pediatr Res. 2020, 88, 412–420. [Google Scholar] [CrossRef] [PubMed]
- Boubred, F.; Herlenius, E.; Bartocci, M.; Jonsson, B.; Vanpée, M. Extremely preterm infants who are small for gestational age have a high risk of early hypophosphatemia and hypokalemia. Acta Paediatr. 2015, 104, 1077–1083. [Google Scholar] [CrossRef] [PubMed]
- Stritzke, A.; Ismail, R.; Rose, M.S.; Lyon, A.W.; Tenton, T.R. Cord-Blood Derived Chemistry Reference Values in Preterm Infants for Sodium, Chloride, Potassium, Glucose, and Creatinine. Am. J. Perinatol. 2024, 41, 722–729. [Google Scholar] [CrossRef] [PubMed]
- Ohkawa, N.; Shoji, H.; Ikeda, N.; Murano, Y.; Okuno, T.; Kantake, M.; Yokomizo, T.; Shimizu, T. The impact of cyclooxygenase inhibitor use on urinary prostaglandin metabolites in preterm infants. Pediatr. Neonatol. 2024, 65, 123–126. [Google Scholar] [CrossRef] [PubMed]
- Agakidou, E.; Chatziioannadis, I.; Kontou, A.; Stathopoulou, T.; Chotas, W.; Sarafidis, K. An update on pharmacologic management of neonatal hypotension: when, why, and which medication. Children (Basel) 2024, 11, 490. [Google Scholar] [CrossRef] [PubMed]
- Dimitriou, G.; Kavvadia, V.; Marcou, M.; Greenough, A. Antenatal steroids and fluid balance in very low birth weight infants. Arch. Dis. Child. Fetal Neonatal Ed. 2005, 90, F509–F513. [Google Scholar] [CrossRef] [PubMed]
Figure 2.
Mean daily serum sodium concentrations in Extremely Low Birth Weight (ELBW) infants during the first 10 days of life (95% confidence intervals).
Figure 2.
Mean daily serum sodium concentrations in Extremely Low Birth Weight (ELBW) infants during the first 10 days of life (95% confidence intervals).
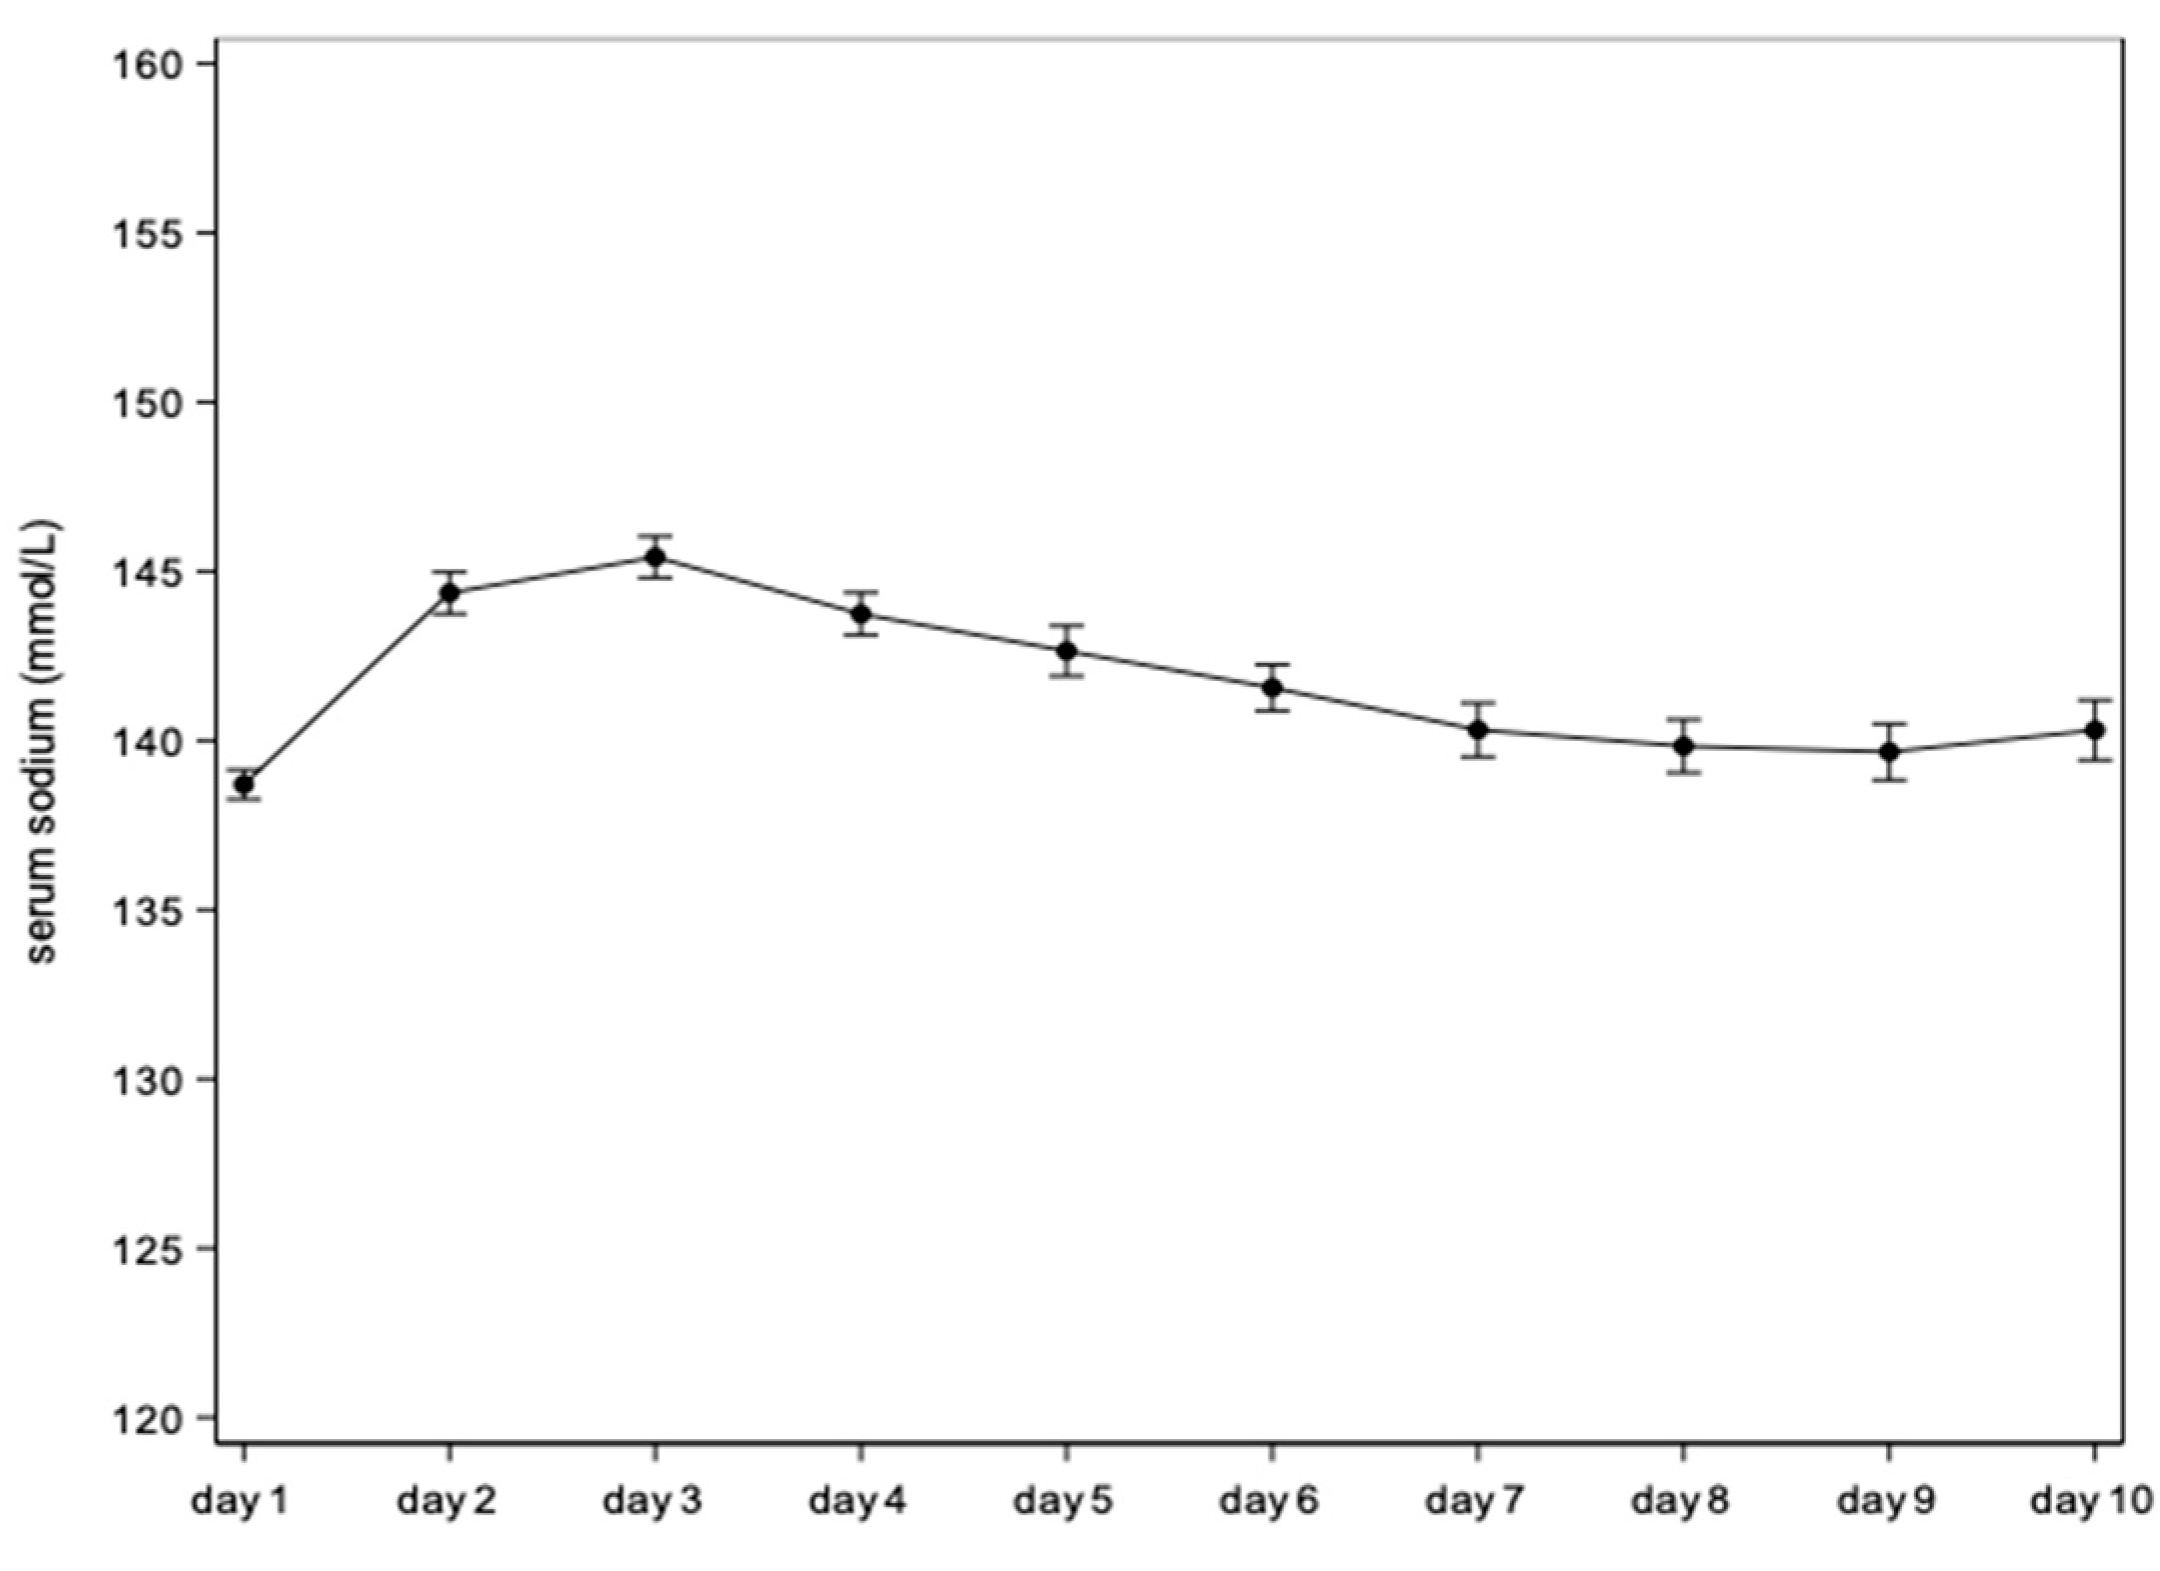
Figure 3.
a) Serum sodium concentrations of ELBW infants with and without prenatal betamethasone lung maturation treatment in the first 10 days. b) Serum sodium concentrations of ELBW infants born by caesarean section vs. vaginal delivery. c) Serum sodium concentrations female vs. male ELBW infants. d) Serum sodium concentrations of SGA and AGA ELBW. (Extremely Low Birth Weight, ELBW; Small for Gestational Age, SGA; Appropriate for Gestational Age, AGA)
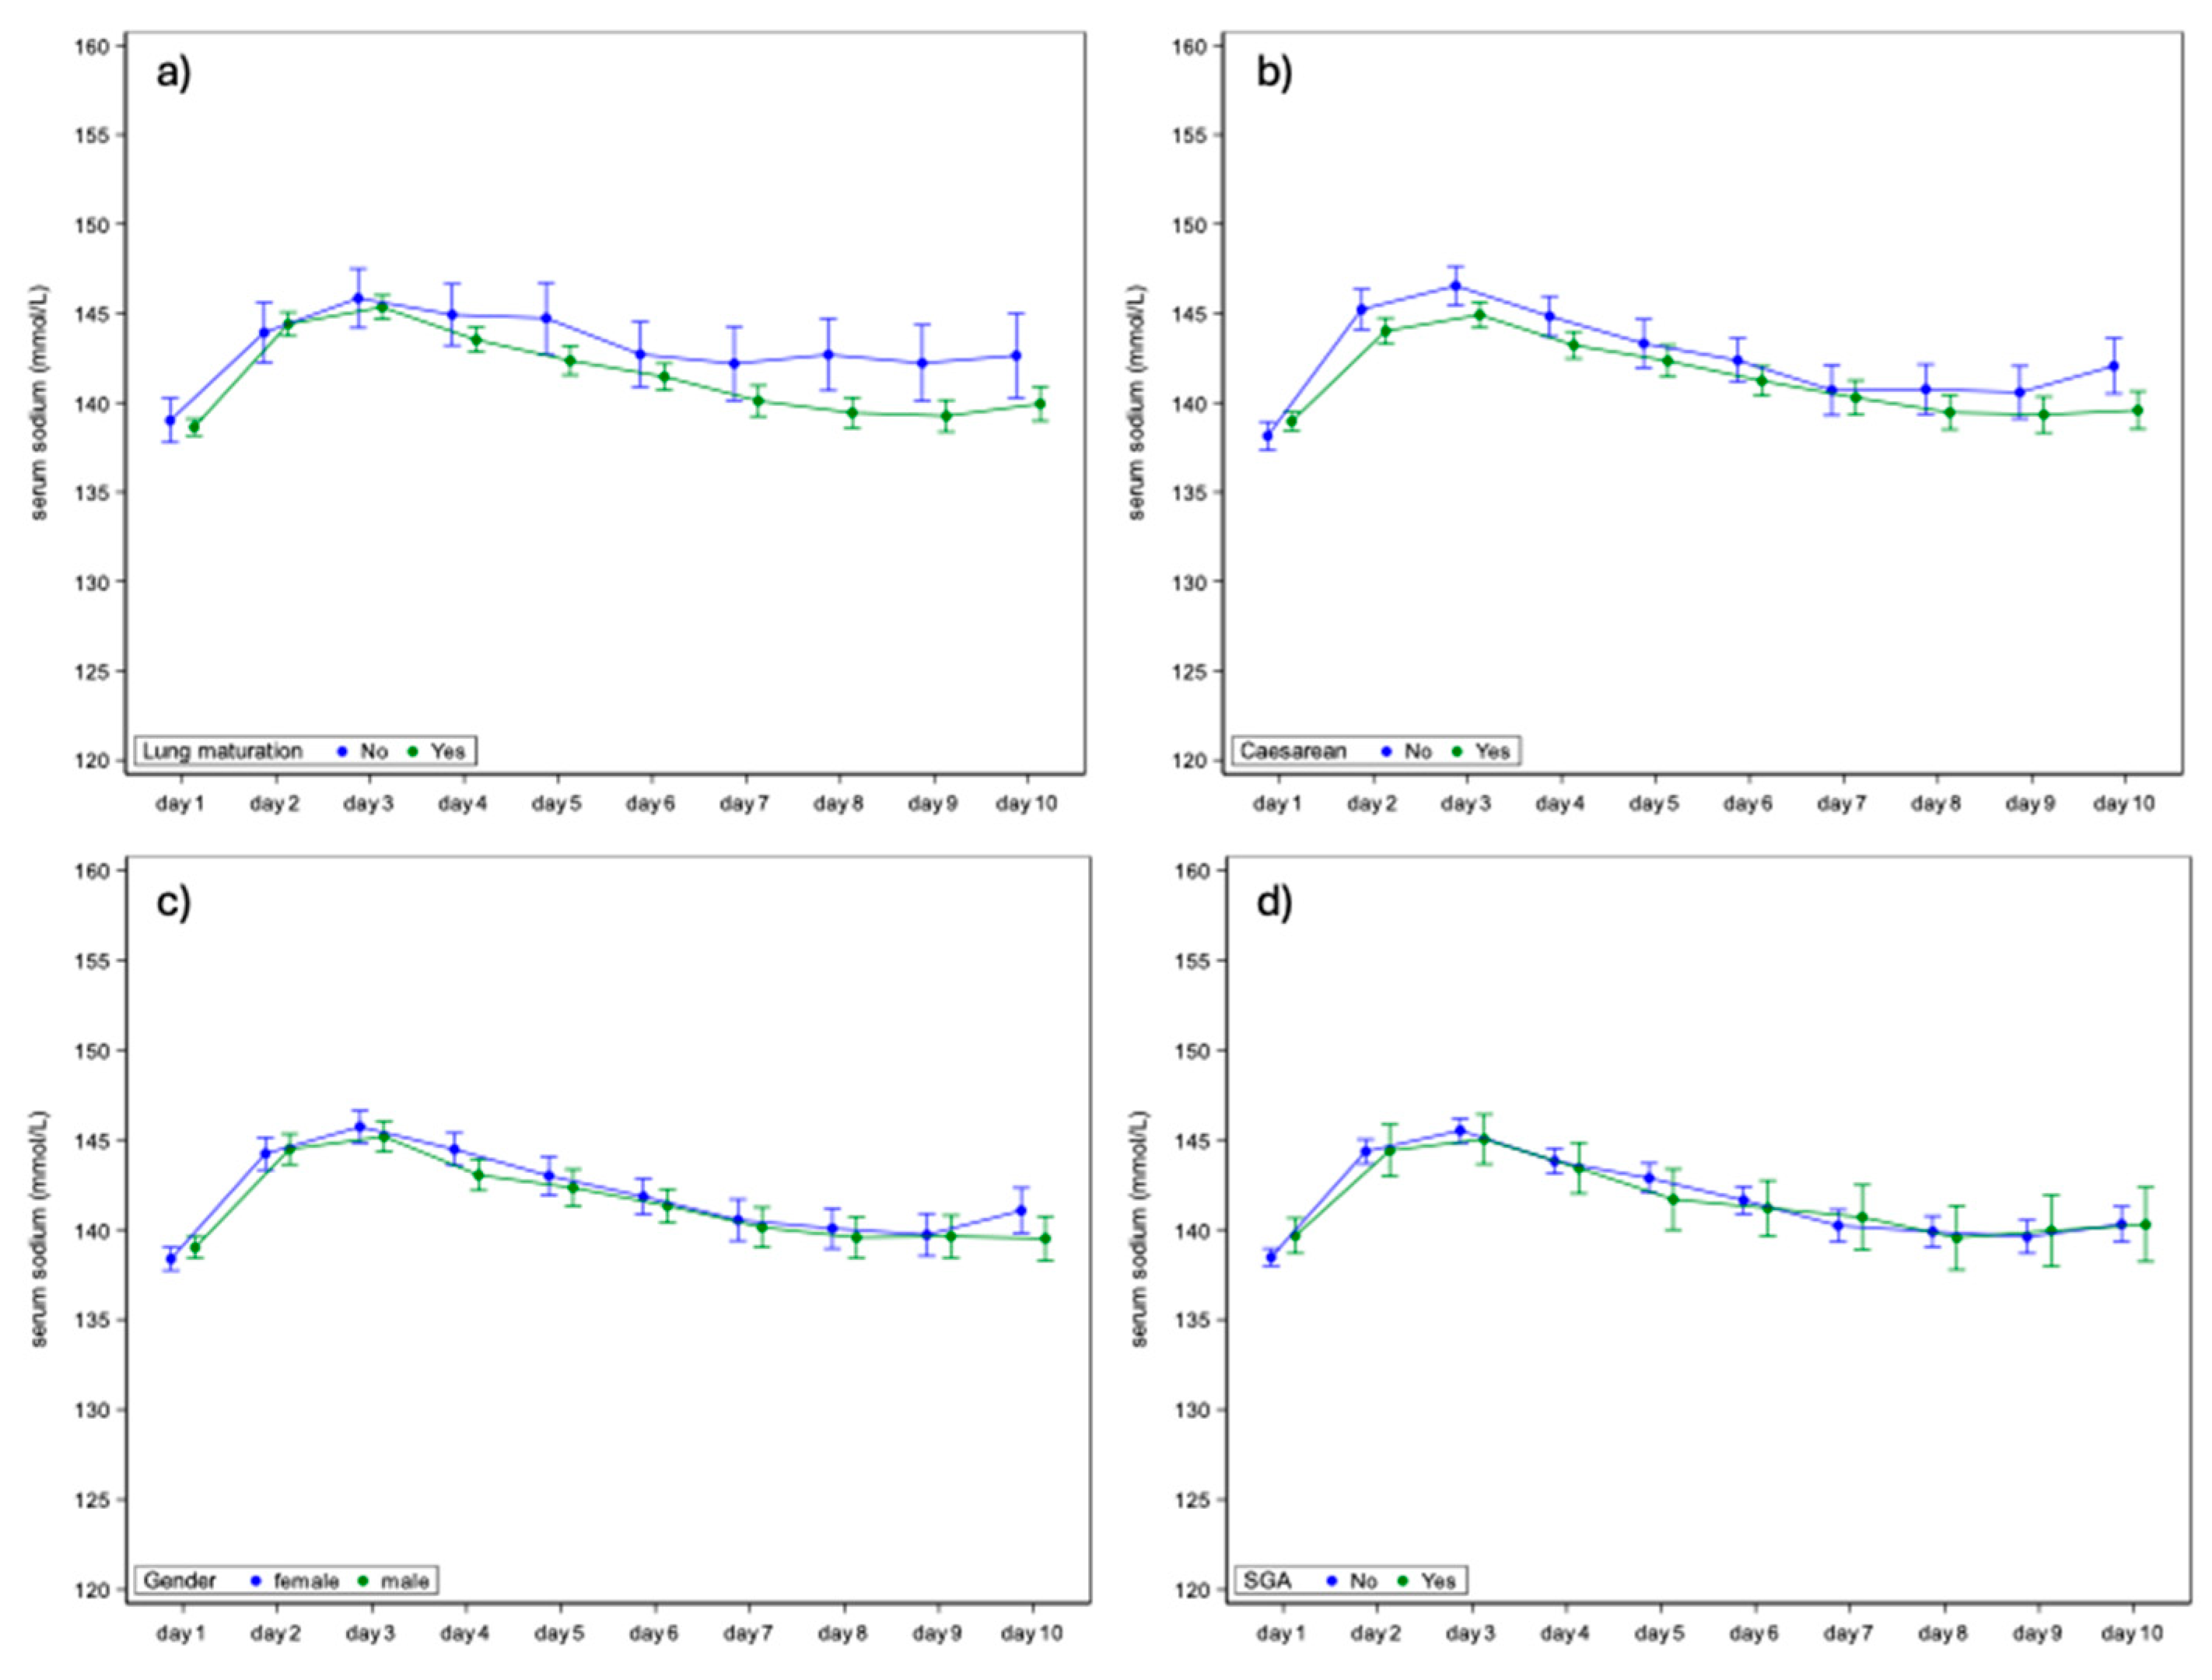
Figure 4.
The graphs each show the slope and 95% confidence interval (CI) of the associations between gestational age (a), birth weight (b), birth length (c) respectively and serum sodium concentrations for each day. The slope represents the change in serum sodium for a 1-week higher gestational age, for a 2-fold higher birth weight and for a 2-fold higher birth length respectively.
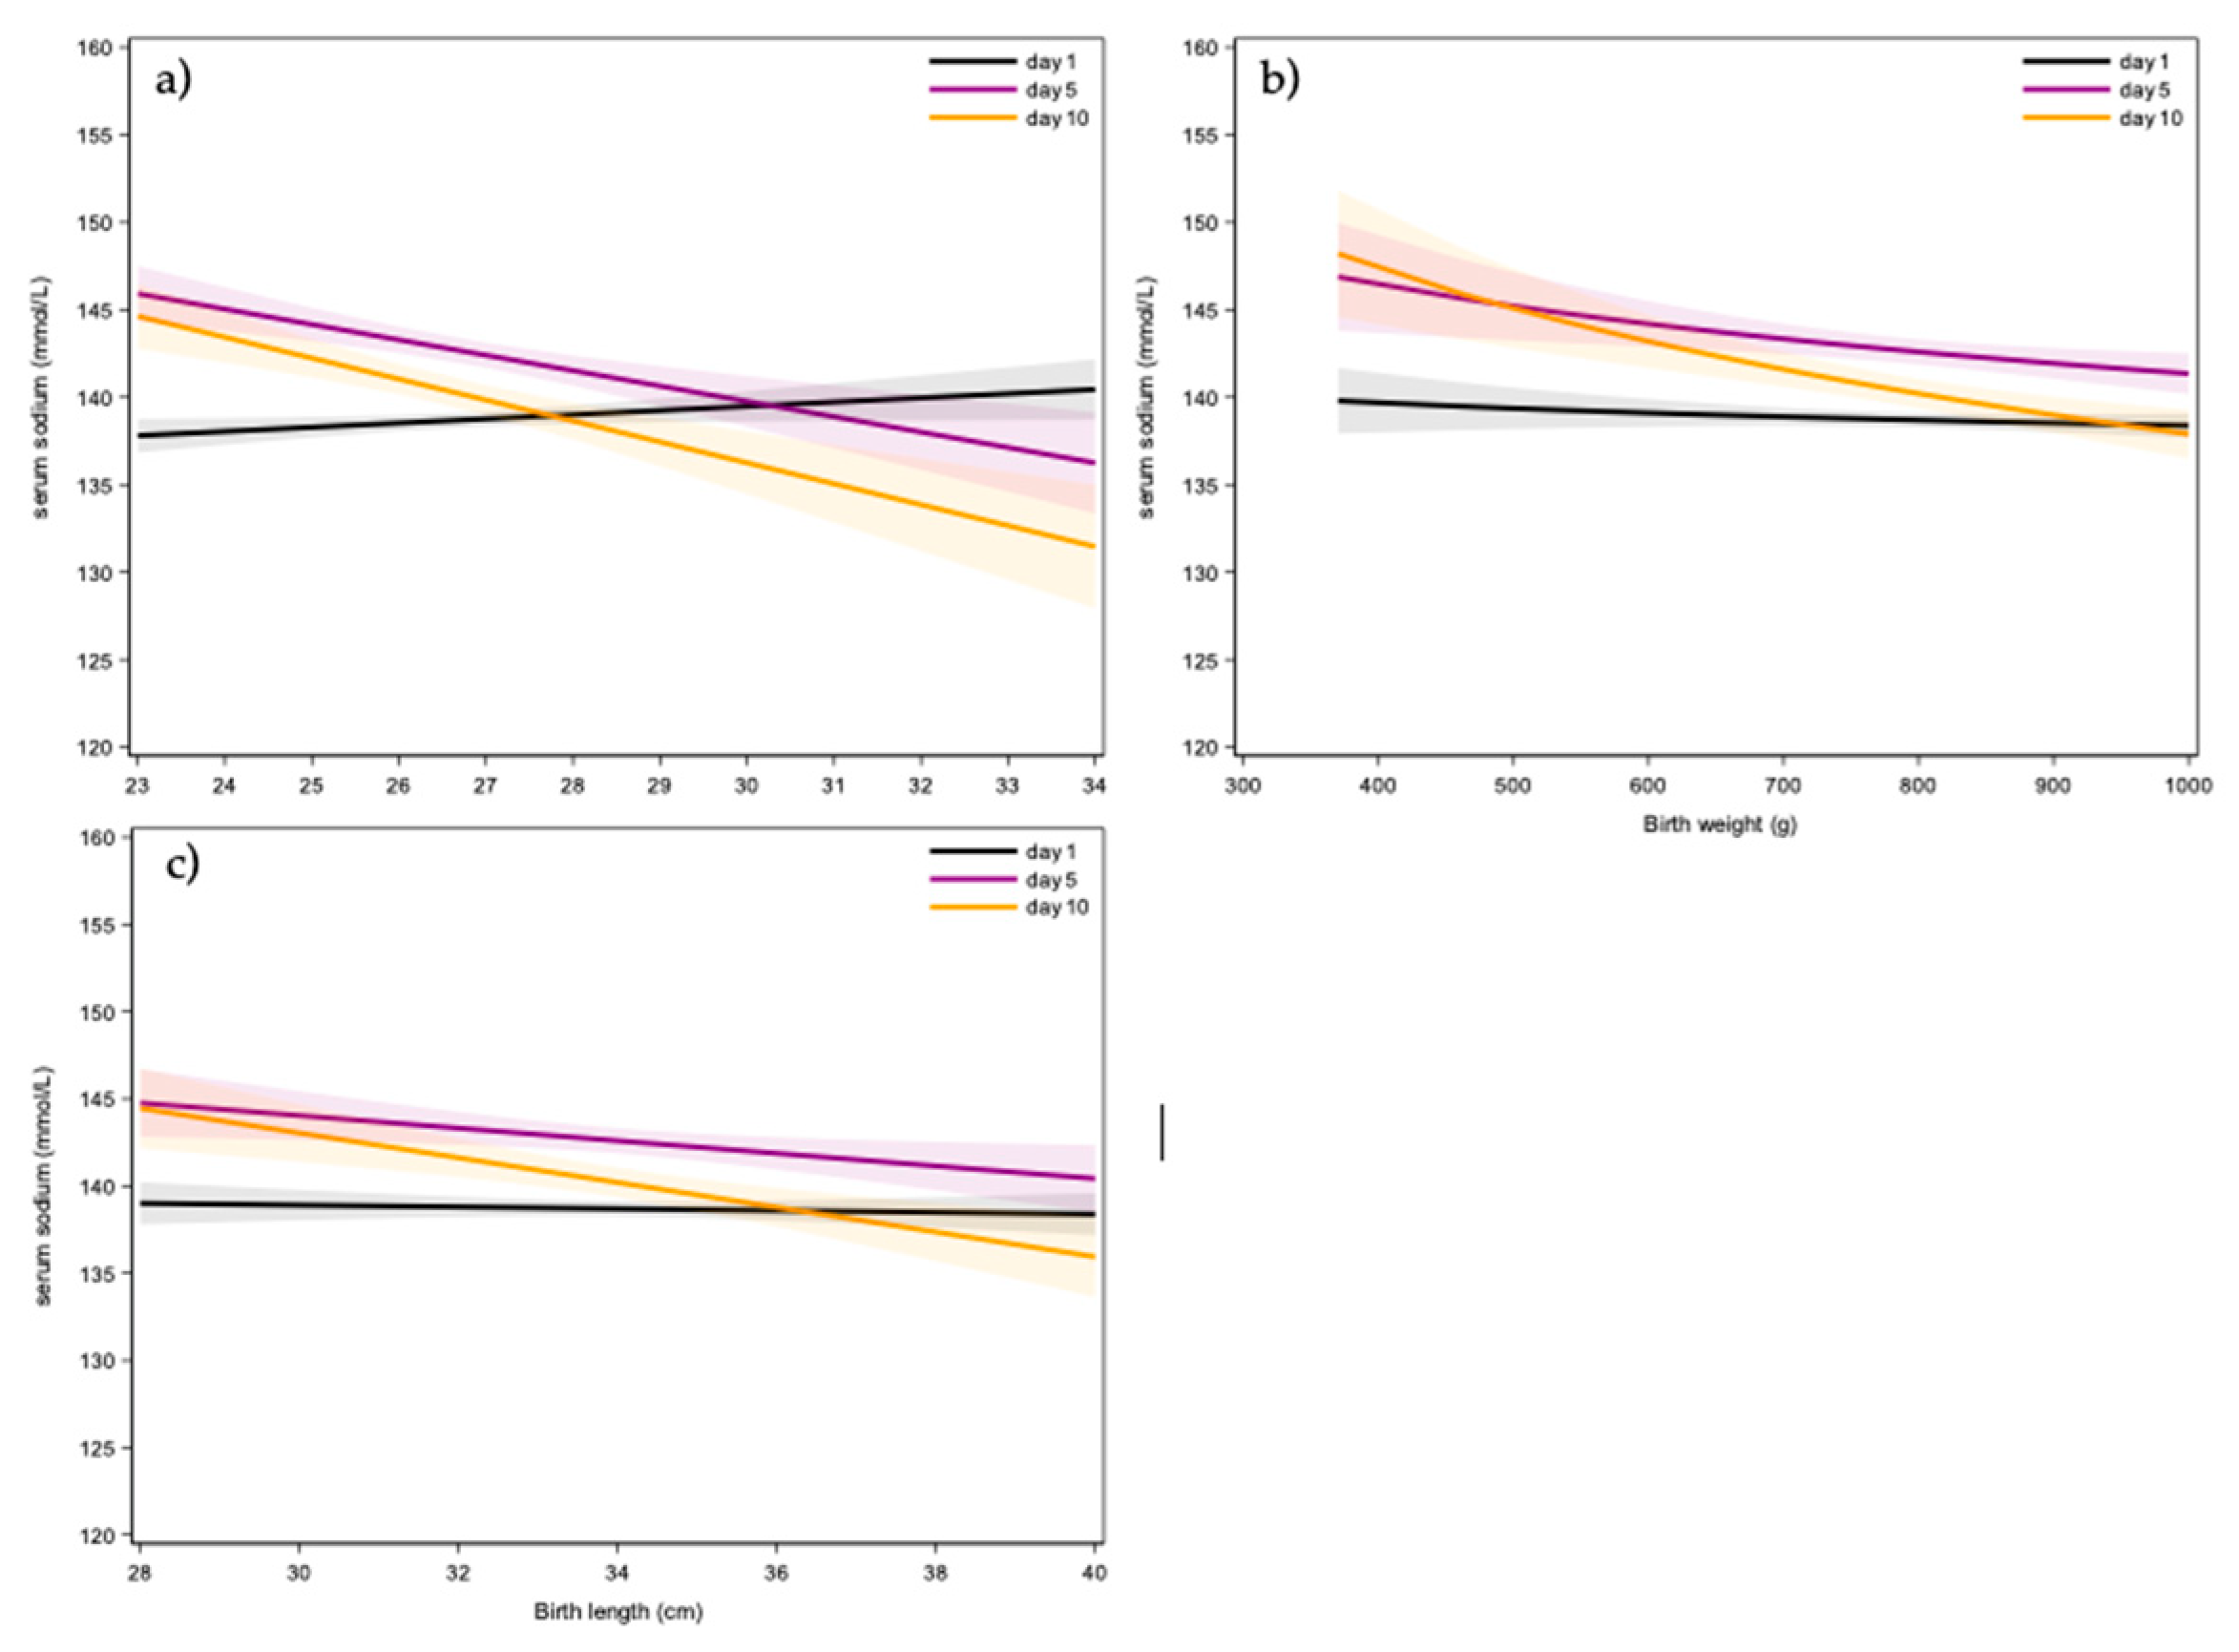
Figure 5.
(a) Comparing sodium values in cases either or not exposed to ibuprofen, corrected for gestational age. (b) Comparing sodium values in cases either or not exposed to ionotropic agents.
Figure 5.
(a) Comparing sodium values in cases either or not exposed to ibuprofen, corrected for gestational age. (b) Comparing sodium values in cases either or not exposed to ionotropic agents.
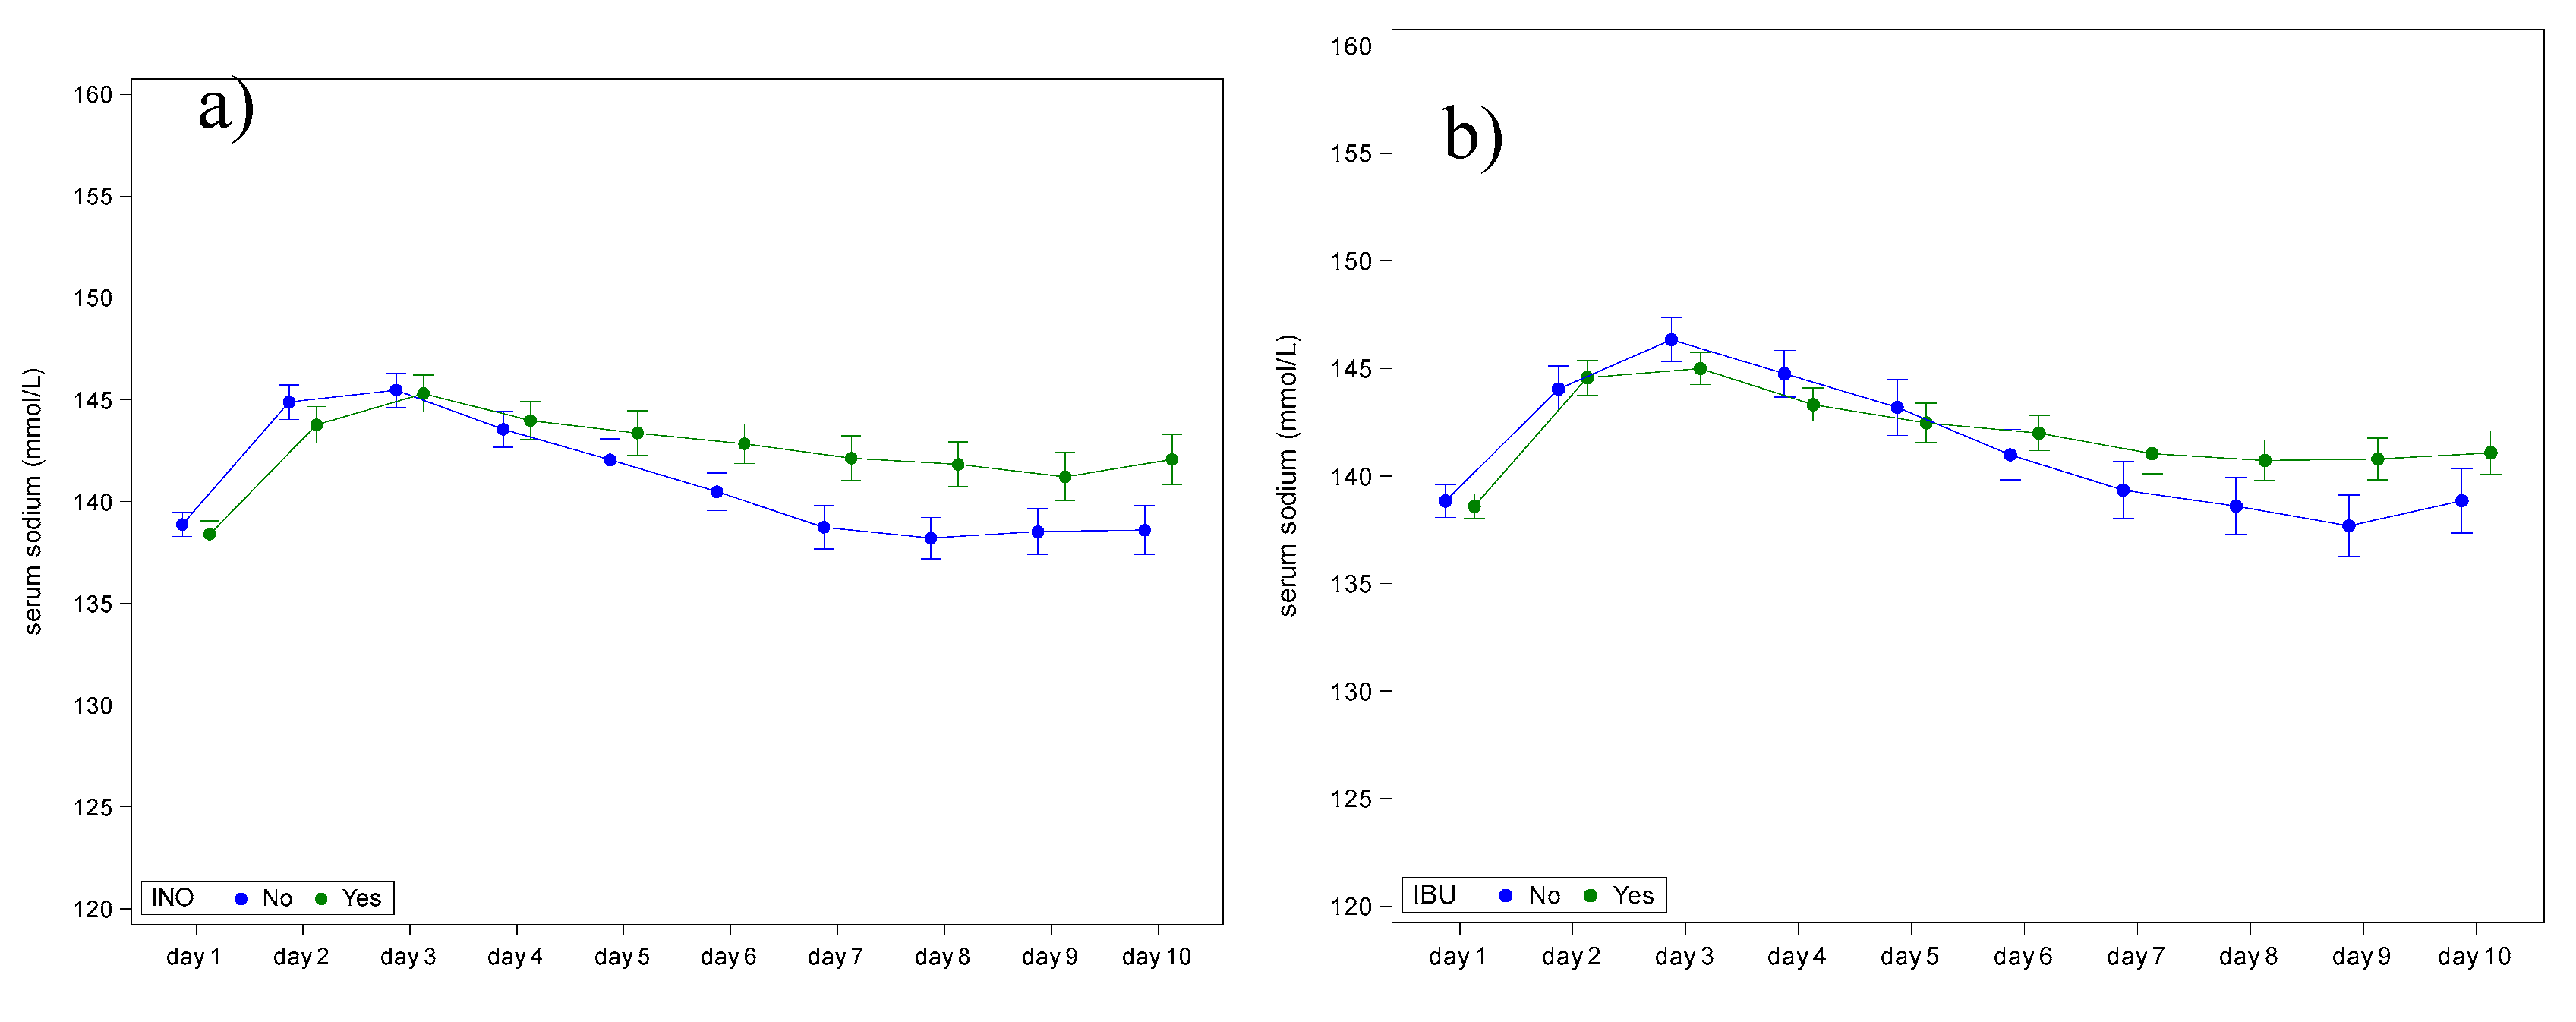

Table 1.
Demographic data of the Extremely Low Birth Weight (ELBW) cohort (AGA: appropriate for gestational age; SGA: small for gestational age).
Table 1.
Demographic data of the Extremely Low Birth Weight (ELBW) cohort (AGA: appropriate for gestational age; SGA: small for gestational age).
| Variable | Statistic | All | |
|---|---|---|---|
| Birth weight (g) | N Mean Std Median IQR Range |
211 807 135 830 (715; 910) (370;1000) |
|
| Length (cm) | N Mean Std Median IQR Range |
200 34 2.4 34 (32; 36) (28; 40) |
|
| Growth category | AGA SGA |
n/N (%) n/N (%) |
170/211 (80.6%) 41/211 (19.4%) |
| Gestational age (weeks) | N Mean Std Median IQR Range |
211 26.7 1.9 26 (25; 28) (23; 34) |
|
| Sex | Female Male Unknown |
n/N (%) n/N (%) n/N (%) |
99/211 (46.9%) 111/211 (52.6%) 1/211 (0.5%) |
| Neonatal death | No Yes |
n/N (%) n/N (%) |
183/211 (86.7%) 28/211 (13.3%) |
| Lung maturation | No Yes |
n/N (%) n/N (%) |
28/207 (13.5%) 179/207 (86.5%) |
| Caesarean | No Yes |
n/N (%) n/N (%) |
63/209 (30.1%) 146/209 (69.9%) |
| Ibuprofen | No Yes |
n/N (%) n/N (%) |
79/209 (37.8%) 130/209 (62.2%) |
| Inotropic agents | No Yes |
n/N (%) n/N (%) |
111/208 (53.4%) 97/208 (46.6%) |
Table 2.
Mean (95 % CI) daily and mean difference compared to day 1 (95% CI) in serum sodium concentrations in Extremely Low Birth Weight (ELBW) infants during the first 10 days, with 95% confidence intervals (CI) in the cohort.
Table 2.
Mean (95 % CI) daily and mean difference compared to day 1 (95% CI) in serum sodium concentrations in Extremely Low Birth Weight (ELBW) infants during the first 10 days, with 95% confidence intervals (CI) in the cohort.
| Day | Mean estimate (95% CI) | Mean difference vs Day 1 (95% CI) | P-value |
|---|---|---|---|
| Day 1 | 138.7 (138.3;139.1) | 0 | . |
| Day 2 | 144.4 (143.7;145.0) | 5.7 (5.0;6.3) | <.0001 |
| Day 3 | 145.4 (144.8;146.0) | 6.7 (6.0;7.5) | <.0001 |
| Day 4 | 143.7 (143.1;144.4) | 5.0 (4.3;5.8) | <.0001 |
| Day 5 | 142.6 (141.9;143.4) | 3.9 (3.1;4.8) | <.0001 |
| Day 6 | 141.6 (140.9;142.2) | 2.9 (2.0;3.7) | <.0001 |
| Day 7 | 140.3 (139.5;141.1) | 1.6 (0.7;2.5) | 0.0005 |
| Day 8 | 139.8 (139.0;140.6) | 1.1 (0.2;2.0) | 0.0141 |
| Day 9 | 139.7 (138.8;140.5) | 1.0 (0.0;1.9) | 0.0422 |
| Day 10 | 140.3 (139.4;141.2) | 1.6 (0.6;2.6) | 0.0015 |
Disclaimer/Publisher’s Note: The statements, opinions and data contained in all publications are solely those of the individual author(s) and contributor(s) and not of MDPI and/or the editor(s). MDPI and/or the editor(s) disclaim responsibility for any injury to people or property resulting from any ideas, methods, instructions or products referred to in the content. |
© 2025 by the authors. Licensee MDPI, Basel, Switzerland. This article is an open access article distributed under the terms and conditions of the Creative Commons Attribution (CC BY) license (http://creativecommons.org/licenses/by/4.0/).
Copyright: This open access article is published under a Creative Commons CC BY 4.0 license, which permit the free download, distribution, and reuse, provided that the author and preprint are cited in any reuse.


