Submitted:
17 February 2025
Posted:
18 February 2025
You are already at the latest version
Abstract
Background and objective. Low back pain (LBP) is considered the most common and challenging disorder in health care. Although its incidence increases with age, a student`s sedentary behavior could contribute to this risk. Through machine learning (ML), advanced algorithms can analyze complex patterns in health data, enabling accurate prediction and targeted prevention of medical conditions such as LBP. This study aims to detect the factors associated with LBP among health sciences students.
Methods. A self-administered modified version of the Standardized Nordic Questionnaire was completed in May to June 2022 by freshman class health sciences students. A supervised random forest algorithm was utilized to analyze data and prioritize the importance of variables related to LBP. The model's predictive capability was further visualized using a decision tree to identify high-risk patterns and associations. Results. A total of 197/222 (88.7%) students participated in this study, most of whom (75%) were female. Their mean age and body mass index were 23 ±3.8 and 23 ±3.5, respectively. Forty-six percent (n=90) of the students reported having experienced LBP in the last month, 15% (n=30) were smokers, and 60% (n=119) were involved in prolonged sitting (more than 3 hours per day). The decision tree of ML revealed that a history of pain (score=1), as well as disability (score= 0.34) and physical activity (score =0.21), were significantly associated with LBP.
Conclusions. About half (46%) of the health science students suffered from LBP. The machine-learning approach showed that a history of pain was the most independent factor related to LBP.
Keywords:
Health science students
; low back pain
; machine learning
; history of pain
; physical activity
Introduction
Low back pain (LBP) is commonly recognized as a health, social, and economic burden in Western countries. The condition covers different types of pain and involves a spectrum of structures (e.g., muscles and discs). It has been reported that mechanical LBP, which is considered the most common type, could lead to pain chronicity [1]. It is also accepted that LBP increases with age [1, 2], and its prevalence according to the National Center of Health Statistics at younger (18–44 years) and older ages (45–65 years) is 23% and 35%, respectively [2]. It is worth noting that LBP is a multifactorial component that includes biological, environmental, and psychological factors [3]. Growing evidence suggests that student lifestyles, particularly of those in health science programs, lead to a large prevalence of LBP compared to the stratified population [4,5]. For example, the 12-month prevalence of LBP among nursing students was found to be high (65%), whereas the reported rate among student athletes was 39% [6]. Furthermore, some studies reported [7,8] being a physiotherapy student was considered to be a risk factor for LBP. These findings could be associated with the fact that health science students possess highly demanding curricula (e.g., loss of sleep hours), poor working posture as well as manual handling activities during training, and stressful experiences [8-10]. However, data regarding the specific variables that greatly stimulate LBP among health science students are still unclear [10-13]. For example, two prospective cohort studies [10,11] among nursing students found diverse predictive variables for LBP.
Machine learning (ML) is continually gaining importance in medical predictive analytics and has numerous advantages compared to conventional analyses such as logistic regression [14]. ML algorithms can expose highly complex interactions among variables that allow for more accurate medical prognosis, and other novel applications [15,16]. ML can be divided mainly into supervised and unsupervised models. A common supervised model is that of decision tree (DT) learning, whose classification and regression implements a grouping or a regression task, which is more visible and easier to understand than other modalities [17]. Additionally, DT can learn highly irregular patterns, with low bias and high variance for the training set, boosting the model's performance [18]. Most studies on ML in spinal disorders are in the domain of diagnosis, followed by prognosis, prediction, and biomechanics for spinal applications [19]. A recent systematic review showed that ML has been used only for the recovery prediction and treatment of LBP [20]. The authors concluded that ML could also enhance the ability to detect patterns of clinical characteristics in LBP [20] even though little existing ML research predicts its onset. Understanding the risk factors of LBP among undergraduates of health science, who are more likely to engage in unhealthy behaviors that adversely affect their well-being, can help in implementing suitable preventive or treatment measures to attenuate LBP chronicity in future daily function and practice.
Thus, this study aims to investigate the factors contributing to LBP among health science students using an ML approach. By applying a random forest algorithm, the study seeks to uncover complex variable interactions, prioritize risk factors, and provide actionable insights for preventive strategies tailored to this population.
Materials and Methods
Study design. A cross-sectional study of 222 freshman undergraduates in health sciences (Nursing, Physical Therapy, Medical Laboratory Science, and Emergency Medical Services) from the Zefat Academic College in the north of Israel who were enrolled between May and June There were no exclusion criteria other than the inability to fill out the hardcopy self-reported questionnaire. We considered only freshman class, as we plan to follow the participants throughout their academic years. The participants were recruited in their classrooms by one of the study`s assessors at the end of that course in the presence of their instructor. A consent form, which included the purpose of the study and the right of the student to withdraw at any time, was received from each participant. The study was conducted in adherence to the Helsinki Declaration, and it was approved by the Departmental of Research Ethics Committee at Zefat Academic College (no. 19-2022).
2.Instruments and Measures
A structured and anonymous questionnaire according to the modified validated Standardised Nordic Questionnaire [21] that seeks information on sociodemographic characteristics and factors such as sedentary behavior and smoking habits was used [22] (Table 1). Physical activities were also recorded and were adapted from the American College of Sports Medicine guidelines [23]. These were graded from 0= no physical activity to 5= high frequency of physical activity. The students were asked if they had ever suffered LBP at some point in their life (lifetime prevalence) and if they had ever been hospitalized due to LBP. Those who had experienced LBP in the last year (based on the response "yes" to the question) were asked specific questions about pain frequency (graded from 1= daily to 4= rarely/never) and medication consumption, as well as whether they were seeking care and disability according to the Oswestry Disability Index (ODI) [24].
2.Statistical and Supervised Machine-Learning Analyses
In analyzing our data, we first used statistical methods with IBM SPSS version We checked whether the numerical data followed a normal distribution, and conducted descriptive analyses for both numerical and categorical variables.
Next, we applied machine learning (ML) to identify key factors that influence LBP. Specifically, we used the Random Forest (RF) algorithm, a powerful ML method for complex data analysis [26]. RF comprises many DTs, which are simple models that mimic human decision making [27]. Each DT asks a series of yes/no questions to classify data. For example, a tree might first ask a person if they sit for long hours and then ask their age before predicting their risk for LBP. RF combines multiple DTs to improve accuracy and find the most important factors related for LBP. These factors were age, activity level, and sedentary behavior. To ensure our results were reliable, we tested the model using 100-fold Monte Carlo cross-validation, a technique that helps check a model's stability by repeatedly training and testing it on different parts of the data [28].
We evaluated how well the model performed using several measures: sensitivity—how well it identified people with LBP, specificity—how well it identified those without LBP, precision—how accurate the positive predictions were, accuracy— the overall correctness of the predictions, and F-measure—the balance between precision and sensitivity. The area under the receiver operating characteristics curve (AUROC) was also considered for considering the test dataset to be a strong indicator of performance for classifiers in imbalanced datasets.
A total of 197 students participated in this study. For the DT learning process, we divided the participants into two groups: 90 with LBP and 107 without LBP. The optimal feature was selected recursively, and the training data were segmented according to this feature to ensure the best classification process. This process corresponds to the division of the feature space and the construction of the DT.
First, we constructed the root node, where all training data were placed. An optimal feature was chosen, and the training dataset was divided into subsets according to this feature, ensuring the best classification under the given conditions. If these subsets were correctly classified, they were assigned to leaf nodes. If any subset remained unclassified, a new optimal feature was selected, and the process continued until all data were classified or no more suitable features were available. Finally, each subset was assigned to the leaf nodes, completing the DT structure [29]. For implementation, we used the KNIME platform, a user-friendly ML tool, applying default parameters for analysis.
Results
3.Student Characteristics
One hundred ninety-seven students (88.7%) responded and completed the questionnaire (Figure 1). The demographic and sedentary features of the participants are presented in Table The mean age and body mass index (BMI) values for all the participants were 23 ±3.8 and 23 ±3.5, respectively. Seventy-five percent were females (n=148) and 45% (n=89) were from the nursing department. The majority (93%) of participants were single, and 15% were habitual smokers. Additionally, 73% defined themselves as secular and traditional, 60% were involved in prolonged daily sitting (more than 3 hours) and most of them (85%, n=167) reported that they experienced study-related stress.
In our series, 55% (n=108) of the students took part in sports activities with frequencies that were diverse: 7% (n=14) with low frequency (at least 20 minutes to 1 hour weekly), and 19% (n=37) with high practice frequency (more than 3 hours).
3.Low Back Pain
A high prevalence of students (74%, n=146) had experienced LBP at some point in their life, and 4% (n=8) had been hospitalized because of such pain. In addition, 46% (n=90) reported that they had suffered lower back pain in the last month (Table 2). The features of LBP during the last year were dispersed. For example, the frequency of LBP was as follows: 17% (n=34) suffered almost daily, 24% (n=47) once a week, 22% (n=43) once a month, and 37% (n=73) rarely or never. It was also found that 33% of the students (n=65) had reported disability, and about 20% (n=39) had been referred to a physician and/or used medication.
The DT represents the variables that are associated with LBP. As depicted in Figure 2a, the tree comprises internal nodes (conditions), branches (decisions), and leaves (outcomes). In general, variables that appear at the top of the tree (e.g., frequency of LBP) have a greater impact on LBP than those in the bottom nodes, such as department or BMI. To understand the DT output in Figure 2a, we illustrated its main findings in Figure 2b. We found that 90 out of the 197 students tested positive for LBP. We also noticed that the "frequency of LBP in the last year" was considered to be at the "peak" of the tree, having the greatest impact on LBP (score=1, Table 3). Additionally, among those who suffered with LBP more regularly (daily), 32 students out of 34 had LBP (94%), and when the frequency was reported as "rarely," this percentage decreased to 8% (6 out of 73). This result implies that once the person begins to experience LBP more often, the likelihood of its recurrence increases. We also observed that a history of "disability" and physical activity (PA) influenced the onset of LBP, with scores of 0.43 and 0.21, respectively (Table 3). For example, 11 students out of 12 reported LBP if they met the following conditions: (a) had pain frequency at least "once a month," (b) were traditionally religious, and (c) had experienced disability. In addition, 20 students out of 25 suffered from LBP if their pain frequency was "once a week," and they did not engage in PA. The scores of each variable associated with LBP in the DT are depicted in Table 3.
Discussion
This cross-sectional study aimed to verify the associated variables for LBP among freshman health sciences students using machine learning. Contrary to previous studies that applied logistic regression analysis with well-known limitations (e.g., unstable variable selection), here, we used a random forest of ML algorithms. To the best of our knowledge, few studies have addressed the risk factors for LBP using this approach [30-32].
Although the utilization of ML for detecting LBP is still in its infancy, it was recently reported that supervised ML compared with other analyses (e.g., regression) could predict LBP among college students from a questionnaire with high accuracy [31]. Shim and colleagues (2021) also noted that ML could effectively identify populations at high risk of chronic LBP [32].
This study showed lifetime and 1-month prevalences of LBP of 74% and 46%, respectively. This finding falls within the range (31% to 84%) previously reported among health sciences undergraduates worldwide [7,13,33-39]. The lifetime prevalence among these undergraduates, such as those studying nursing and physiotherapy, was about 50% [7,13]. It was reported that about 84% of a freshman class in health sciences (n=153) suffered from LBP [36]. Nyland and Grimmer also reported a 31% 1-month prevalence among first-class physiotherapy students [7].
Our results confirm that a history of pain (frequency) has the greatest relationship (score=1) with LBP. However, while this finding is in agreement with some studies [10,40,41], it contradicts others [11,13,34,35,42-44]. A systematic review study in the general population showed that a history of previous episodes of LBP was the only predicting factor for the recurrence of LBP [40]. A prospective cohort study (over 4 years) among nursing students also reported that a history of LBP was considered a prediction factor for new episodes [10]. In contrast, other studies revealed that smoking, advanced physical activity, higher stress levels, a sedentary lifestyle, and mal-posture were independent factors for LBP among nursing students [11,35,43]. Notably, factors associated with such back pain are inconsistent due to high-risk biases, such as heterogeneity of the methodology and sample features (e,g., students` department, general population) and/or a small study sample.
This study also found that disability in the last year and a lack of physical activity can predict LBP. This association between a disability history and LBP was previously confirmed [44,45]. For example, in a prospective cohort study in a working population with a 3-year follow-up period, it was fond that high disability due to LBP was a prognostic factor for its recurrence [44]. As mentioned, data regarding physical activity and LBP are still conflicting [12, 46-48]. For example, Felemban et al. [48] and Amelot et al.[12] found that exercise and walking at least 30 minutes a day significantly improved LPB among a group of dental and medical students. Conversely, an Australian cross-sectional study among nursing students revealed that vigorous physical activity contributed to LBP [46]. It is widely recognized that physical activity has numerous health benefits related to physiological and psychological health [49-51]. Moreover, it is well-accepted that physical activity can reduce the risk factors of various chronic diseases such as those that are cardiovascular and musculoskeletal, as well as diabetes [50,52]. Thus, the impact of physical activity on LBP may depend on the activity type and the degree of loading on the lumbar spine [53,54]. One related review [55] suggested that the type and intensity of physical activity should be considered when measuring the association with LBP. A recent systematic and meta-analysis review reported that a medium activity level was associated with a lower prevalence of LBP [56], and the authors recommended moderate doses of physical activity when managing and preventing LBP.
The fact that 55% of our participants were involved in physical activity is in line with a review from Keating and colleagues that 40–50% of college students are physically inactive [57]. In addition, sufficient evidence has been found to indicate that most university students have an unhealthy lifestyle, with poor levels of physical activity (PA) [58,59]. These findings are not surprising and highlight what has previously been reported regarding the need for PA intervention programs for these students [60,61]. We believe that findings underscore the potential of ML to predict and prioritize LBP risk factors, enabling targeted interventions. For instance, academic institutions could design preventive measures, such as tailored PA programs or ergonomic training, for high-risk students identified by the model. One can also assume that stakeholders should dedicate "physical activity time" to the student curricula to reduce the risk and chronicity of future LBP. We anticipate that further studies are needed using MLmethods to establish basic predictive factors for LBP for all ages.
Limitations of the study. This study was conducted at a single academic institution in the north of the State of Israel. Moreover, the self-reported questionnaire may have various biases such as recall, overestimation, and socioeconomic and cognitional factors. Lastly, spinal deformity, depression, and duration of pain were not addressed in this study.
Conclusions
The current study found that the 1-month prevalence of LBP among freshman health sciences undergraduates was 47%. The random forest algorithm indicates that a history of pain frequency has the greatest impact on LBP. In addition, physical activity and a history of disability were also associated with LBP.
Author Contributions
Conceptualization KJ and JA; methodology MY and KH; validation and data collection KJ; investigation MY and JA; original draft preparation JA; writing- review and editing JA, KH and MY; supervision JA; administration JA and KJ.
Funding
The authors declare that they have no sources of funding for research reported.
Institutional Review Board Statement
The ethical committee of Zefat Academic College (no. 19- 2022) has approved this research.
Informed Consent Statement
Informed and written consent was obtained from all subjects involved in the current study.
Data Availability Statement
Datasets are available to download on request. Requests should be directed to the corresponding author.
Conflicts of Interest
The authors declare that the research was conducted in the absence of any commercial or financial relationships that could be construed as a potential conflict of interest.
References
- Itz, C.J.; Geurts, J.W.; van Kleef, M.; Nelemans, P. Clinical course of non-specific low back pain: a systematic review of prospective cohort studies set in primary care. Eur J Pain. 2013, 17, 5–15. [Google Scholar] [CrossRef] [PubMed]
- Gaonkar, A.P.; Kulkarni, R.; Caytiles, R.D.; Iyengar, N. Classification of Lower Back Pain Disorder Using Multiple Machine Learning Techniques and Identifying Degree of Importance of Each Parameter. International Journal of Advanced Science and Technology 2017, 105, 11–24. [Google Scholar] [CrossRef]
- Lall, M.P.; Restrepo, E. The biopsychosocial model of low back pain and patient- centered outcomes following lumbar fusion. Orthop Nurs. 2017, 36, 213–21. [Google Scholar] [CrossRef] [PubMed]
- Crawford, R.J.; Volken, T.; René Schaffert, R.; Bucher, T. Higher low back and neck pain in final year Swiss health professions’ students: worrying susceptibilities identified in a multi-centre comparison to the national population. BMC Public Health. 2018, 8, 1188. [Google Scholar] [CrossRef]
- Cakmak, A.; Yücel, B.; Ozyalçn, SN. The frequency and associated factors of low back pain among a younger population in Turkey. Spine. 2004, 29, 1567–1572. [Google Scholar] [CrossRef]
- Wong, A.Y.L; Chan, L.L.Y; Lo, C.W.T; Chan, W.W.Y.; et al. Prevalence/Incidence of Low Back Pain and Associated Risk Factors Among Nursing and Medical Students: A Systematic Review and Meta-Analysis. First Published: 25 January 2021. 25 January.
- Nyland, L.J.; Grimmer, K.A. Is undergraduate physiotherapy student a risk factor for low back pain? A prevalence study of low back pain in physiotherapy students. BMC Musculoskelet Disord. 2003, 4, 1–8. [Google Scholar] [CrossRef]
- Falavigna, A.; Teles, A.R.; Mazzocchin, T.; et al. Increased prevalence of low back pain among physiotherapy students compared to medical students. Eur Spine J. 2011;20(3):500–505. Eur Spine J.
- Algarni, A.D.; Al-Saran, Y.; Al-Moawi, A.; Bin Dous, A.; Al-Ahaideb A, Kachanathu SJ. The prevalence of and factors associated with neck, shoulder, and low-back pains among medical students at university hospitals in Central Saudi Arabia. Pain Res Treat. 2017, 1, 1235706. [Google Scholar] [CrossRef]
- Feyer, A.M.; Herbison, P.; Williamson, A.M. The role of physical and psychological factors in occupational low back pain: A prospective cohort study. Occup Environ Med. 2000, 57, 116–120. [Google Scholar] [CrossRef]
- Mitchell, T.; O’Sullivan, P.B.; Burnett, A. Identification of modifiable personal factors that predict new-onset low back pain: a prospective study of female nursing students. Clin J Pain. 2010, 26, 275–283. [Google Scholar] [CrossRef]
- Amelot, A.; Mathon, B.; Haddad, .;, et al. Low Back Pain among Medical Students: A Burden and an Impact to Consider! Spine 2019: 1390-1395.
- AlShayhan, F.A.; Saadeddin, M. Prevalence of low back pain among health sciences students. Eur J Orthop Surg Traumatol. 2018, 28, 165–170. [Google Scholar] [CrossRef]
- Khan, O.; Badhiwala, J.H.; Wilson, J. RF.; Jiang, F.; Martin, A.R.; Fehlings, M.G. Predictive modeling of outcomes after traumatic and nontraumatic spinal cord injury using machine learning: review of current progress and future directions. Neurospine. 2019, 16, 678–685.
- Senders, J.T.; Staples, P.C.; Karhade, A.V.; et al. Machine learning and neurosurgical outcome prediction: a systematic review. World Neurosurg. 2018, 109, 476–486e1. [Google Scholar] [CrossRef]
- LeCun, Y.; Bengio, Y.; Hinton, G. Deep learning. Nature 2015, 521, 436–444. [Google Scholar] [CrossRef] [PubMed]
- Ren G, Yu K, Xie Z, Wang P, et al. Current Applications of Machine Learning in Spine: From Clinical View. Global Spine J. 2021, 28, 521, 436–44.
- Galbusera, F.; Casaroli, G.; Bassani, T. Artificial intelligence and machine learning in spine research. JOR Spine. 2019, 2, e1044. [Google Scholar] [CrossRef]
- Azimi, P.; Yazdanian, T.; Benzel, E.C.; Aghaei, H.N.; et al. A Review on the Use of Artificial Intelligence in Spinal Diseases (in eng). Asian Spine J. 2020, 14, 543–571. [Google Scholar] [CrossRef]
- Tagliaferri, S.D.; Angelova, M.; Zhao X, Owenet PJ et al. Artificial intelligence to improve back pain outcomes and lessons learnt from clinical classification approaches: three systematic reviews. NPJ Digit Med. 2020, 3, 93. [Google Scholar] [CrossRef]
- Kuorinka I, Jonsson B, Kilbom A. Standardised Nordic questionnaires for the analysis of musculoskeletal symptoms. Applied Ergonomics. 1987, 18, 233–237.
- Jessor, R.; Turbin, M.S.; Costa, M.F. Survey of Personal and Social Development at CU; Institute of Behavioral Sciences, University of Colorado: Boulder, Colorado, 2003; Volume 19, p. Available online: http://www.colorado.edu/ibs/jessor/ questionnaires/ questionnaire_spsd2.pdf (accessed on 15 December 2021).
- Thompson, W.R.; Gordon, N.F.; Pescatello, L.S. American College of Sport Medicine. ACSM’s Guidelines for Exercise Testing and Prescription. Nbsp, 9th ed.; Lippincott Williams and Wilkins: Philadelphia, PA, USA, 2014. [Google Scholar]
- Fairbank, J.C.; Pynsent, P.B. The Oswestry Disability Index. Spine. 2000, 25, 2940–2952 (discussion 2952). [Google Scholar] [CrossRef]
- Dionne, C.E.; Dunn, K.M.; Croft, P.R. A consensus approach toward the standardization of back pain definitions for use in prevalence studies. Spine. 2008, 33, 95–103. [Google Scholar] [CrossRef]
- Breiman, L. Random forests. Mach Learn. 2001, 45, 5–32. [Google Scholar] [CrossRef]
- Biau, G.; Scornet, E. "A random forest guided tour. " Test. 2016, 25, 197–227. [Google Scholar] [CrossRef]
- Picard, R.R.; Cook, R.D. Cross-validation of regression models. J Am Stat Assoc. 1984, 79, 575–583. [Google Scholar] [CrossRef]
- Feng, Y.; Wang, Z.; Cui, R.; et al. Clinical analysis and artificial intelligence survival prediction of serous ovarian cancer based on preoperative circulating leukocytes. Journal of Ovarian Research. 2022, 15, 64. [Google Scholar] [CrossRef] [PubMed]
- Muhaimil, A.; Pendem, S.; Sampathilla, N.; Priya, P.S.; et al. Role of Artificial intelligence model in prediction of low back pain using T2 weighted MRI of Lumbar spine. F1000Research. 2024, 10, 13,1035. [Google Scholar]
- Dasgupta, P.; Kuhn, L.M.; Sekeroglu, K.; Prasai, A. A mathematical modelling approach for analysing the risk of low back pain in college students using student desks. International Journal of Human Factors and Ergonomics. 2023, 10, 85–112. [Google Scholar] [CrossRef]
- Shim, J.G.; Ryu, K.H.; Cho, E.A.; Ahn, J.H.; Kim, H.K; et al. Machine learning approaches to predict chronic lower back pain in people aged over 50 years. Medicina. 2021, 57, 1230. [Google Scholar] [CrossRef]
- Mitchell,T. ; O’Sullivan, P.B.; Burnett, A.F. Low back pain characteristics from undergraduate student to working nurse in Australia: A cross-sectional survey. Int J Nurs Stud. 2008, 45, 1636–1644.
- Nordin, N.; Singh, D.; Kanglun, L. Low back pain and associated risk factors among health science undergraduates. Sains Malaysiana. 2014, 43, 423–428. [Google Scholar]
- Hafeez, K.; Memon, A.A; Jawaid, M. Back pain-are health care undergraduates at risk? Iran J Public Health 2013, 42, 819–825. [Google Scholar]
- Yucel, H.; Torun, P. Incidence and Risk Factors of Low Back Pain in Students Studying at a Health University. Bezmialem Sci. 2016, 4, 12–18. [Google Scholar] [CrossRef]
- Anggiat, L.; Hon, W.H.C.; Baait, W.S.N. The incidence of Low back pain among university students. Jurnal Pro-Life. 2018, 5, 677–87. [Google Scholar]
- Smedley, J.; Trevelyan, F.; Inskip, H. Impact of ergonomic intervention on back pain among nurses. Scand J Work Environ Health. 2003, 29, 117–123. [Google Scholar] [CrossRef] [PubMed]
- Maul, I.; Läubli, T.; Klipstein, A.; Krueger, H. Course of low back pain among nurses: a longitudinal study across eight years. Occup Environ Med. 2003, 60, 497–503. [Google Scholar] [CrossRef]
- Da-Silva, T.; Mills, K.; Brown, B.T. Risk of Recurrence of Low Back Pain: A Systematic Review. J Orthop Sports Phys Ther. 2017, 47, 305–313. [Google Scholar] [CrossRef]
- Machado, G.C.; Maher, C.G.; Ferreira, P.H.; et al. Can recurrence after an acute episode of low back pain be predicted? . Physical therapy. 2017, 97, 889–95. [Google Scholar] [CrossRef]
- Alshagga, M.A.; Nimer, A.R.; Yan, L.P.; et al. Prevalence and factors associated with neck, shoulder and low back pains among medical students in a Malaysian Medical College. BMC research notes. 2013, 6, 1–7. [Google Scholar] [CrossRef] [PubMed]
- Citko, A.; Górski, S.; Marcinowicz, L.; Górska, A. Sedentary Lifestyle and nonspecific low back pain in medical personnel in North-East Poland. BioMed research international. 2018(1), 1965807. [CrossRef]
- van den Heuvel, S.G.; Ariëns, G.A.; Boshuizen, H.C.; Hoogendoorn, W.E.; Bongers, P.M. Prognostic factors related to recurrent low-back pain and sickness absence. Scandinavian journal of work, environment & health. 2004, 1, 459–67. [Google Scholar]
- Estlander AM, Takala EP, Viikari-Juntura E. Do psychological factors predict changes in musculoskeletal pain? J Occup Environ Med 1998, 5, 445–53.
- Mitchell., T.; O’Sullivan, P.B.; Smith, A. Biopsychosocial factors are associated with low back pain in female nursing students: a cross-sectional study. Int J Nurs Stud. 2009, 46, 678–688. [Google Scholar] [CrossRef]
- Skoffer, B.; Foldspang, A. Physical activity and low-back pain in schoolchildren. Eur Spine J. 2008, 17, 373–379. [Google Scholar] [CrossRef] [PubMed]
- Felemban, R.A.; Sofi, R.A.; Alhebshi, S.A.; et al. Prevalence and predictors of musculoskeletal pain among undergraduate students at a dental school in Saudi Arabia. Clinical, cosmetic and investigational dentistry. 2021, 17, 39–46. [Google Scholar] [CrossRef] [PubMed]
- Warburton, D.E.; Nicol, C.W.; Bredin, S.S. Health benefits of physical activity: the evidence. CMAJ. 2006, 174, 801–809. [Google Scholar] [CrossRef]
- O’Donovan, G.; Lee, I.M.; Hamer, M.; Stamatakis, E. Association of “Weekend Warrior” and Other Leisure Time Physical Activity Patterns With Risks for All- Cause, Cardiovascular Disease, and Cancer Mortality. JAMA Intern Med. 2017, 177, 335–342. [Google Scholar] [CrossRef] [PubMed]
- Sadarangani, K.P.; Hamer, M.; Mindell, J.S.; Coombs, N.A.; Stamatakis, E. Physical activity and risk of all-cause and cardiovascular disease mortality in diabetic adults from Great Britain: pooled analysis of 10 population-based cohorts. Diabetes Care. 2014, 37, 1016–1023. [Google Scholar] [CrossRef]
- National Institute for Health and Clinical Excellence. Physical activity: exercise referral schemes, 2014.
- Iwamoto, J.; Abe, H.; Tsukimura, Y.; Wakano, K. Relationship between radiographic abnormalities of lumbar spine and incidence of low back pain in high school and college football players: a prospective study. Am J Sports Med. 2004, 32, 781–786. [Google Scholar] [CrossRef]
- Lundin, O.; Hellstrom, M.; Nilsson, I.; Sward, L. Back pain and radiological changes in the thoracolumbar spine of athletes: a long term follow-up. Scand J Med Sci Sports. 2001, 11, 103–109. [Google Scholar] [CrossRef]
- Heneweer, H.; Staes, F.; Aufdemkampe, G.; van Rijn, M.; Vanhees, L. Physical activity and low back pain: a systematic review of recent literature. European spine journal: official publication of the European Spine Society, the European Spinal Deformity Society, and the European Section of the Cervical Spine Research Society. 2001, 20, 826–845. [Google Scholar] [CrossRef]
- Alzahrani, H.; Martin Mackey, M.; Stamatakis, E.; et al. The association between Physical activity and low back pain: a systematic review and meta-analysis of observation studies. Sci Rep. 2019, 9(1), 8244. [Google Scholar] [CrossRef]
- Keating, X.D.; Guan, J.; Piñero, J.C.; Bridges, D.M. A meta-analysis of college students' physical activity behaviors. Journal of American college health. 2005, 54(2), 116–26. [Google Scholar] [CrossRef] [PubMed]
- akubiec, D.; Kornafel, D.; Cygan, A.; Gorska-Klek, L.; Chromik, K. Lifestyle of students from different universities in Wroclaw, Poland. Roczniki Państwowego Zakładu Higieny. 2015, 66(4), 337-344.
- Almutairi, K.M.; Alonazi, W.B.; Vinluan, J.M.; et al. Health promoting lifestyle of university students in Saudi Arabia: a cross-sectional assessment. BMC public health. 2018, 8, 1–10. [Google Scholar] [CrossRef] [PubMed]
- Sigmundová, D.; ChmelÍk, F.; Sigmund, E.; Feltlová, D.; Frömel, K. Physical activity in the lifestyle of Czech university students: Meeting health recommendations. European Journal of Sport Science. 2013, 13(6), 744–50. [Google Scholar] [CrossRef] [PubMed]
- Deliens, T.; Deforche, B.; De Bourdeaudhuij, I.; Clarys, P. Determinants of physical activity and sedentary behaviour in university students: a qualitative study using focus group discussions. BMC public health. 2015, 15, 1–9. [Google Scholar] [CrossRef]
Figure 1.
Figure 1. Flow chart for the study sample.
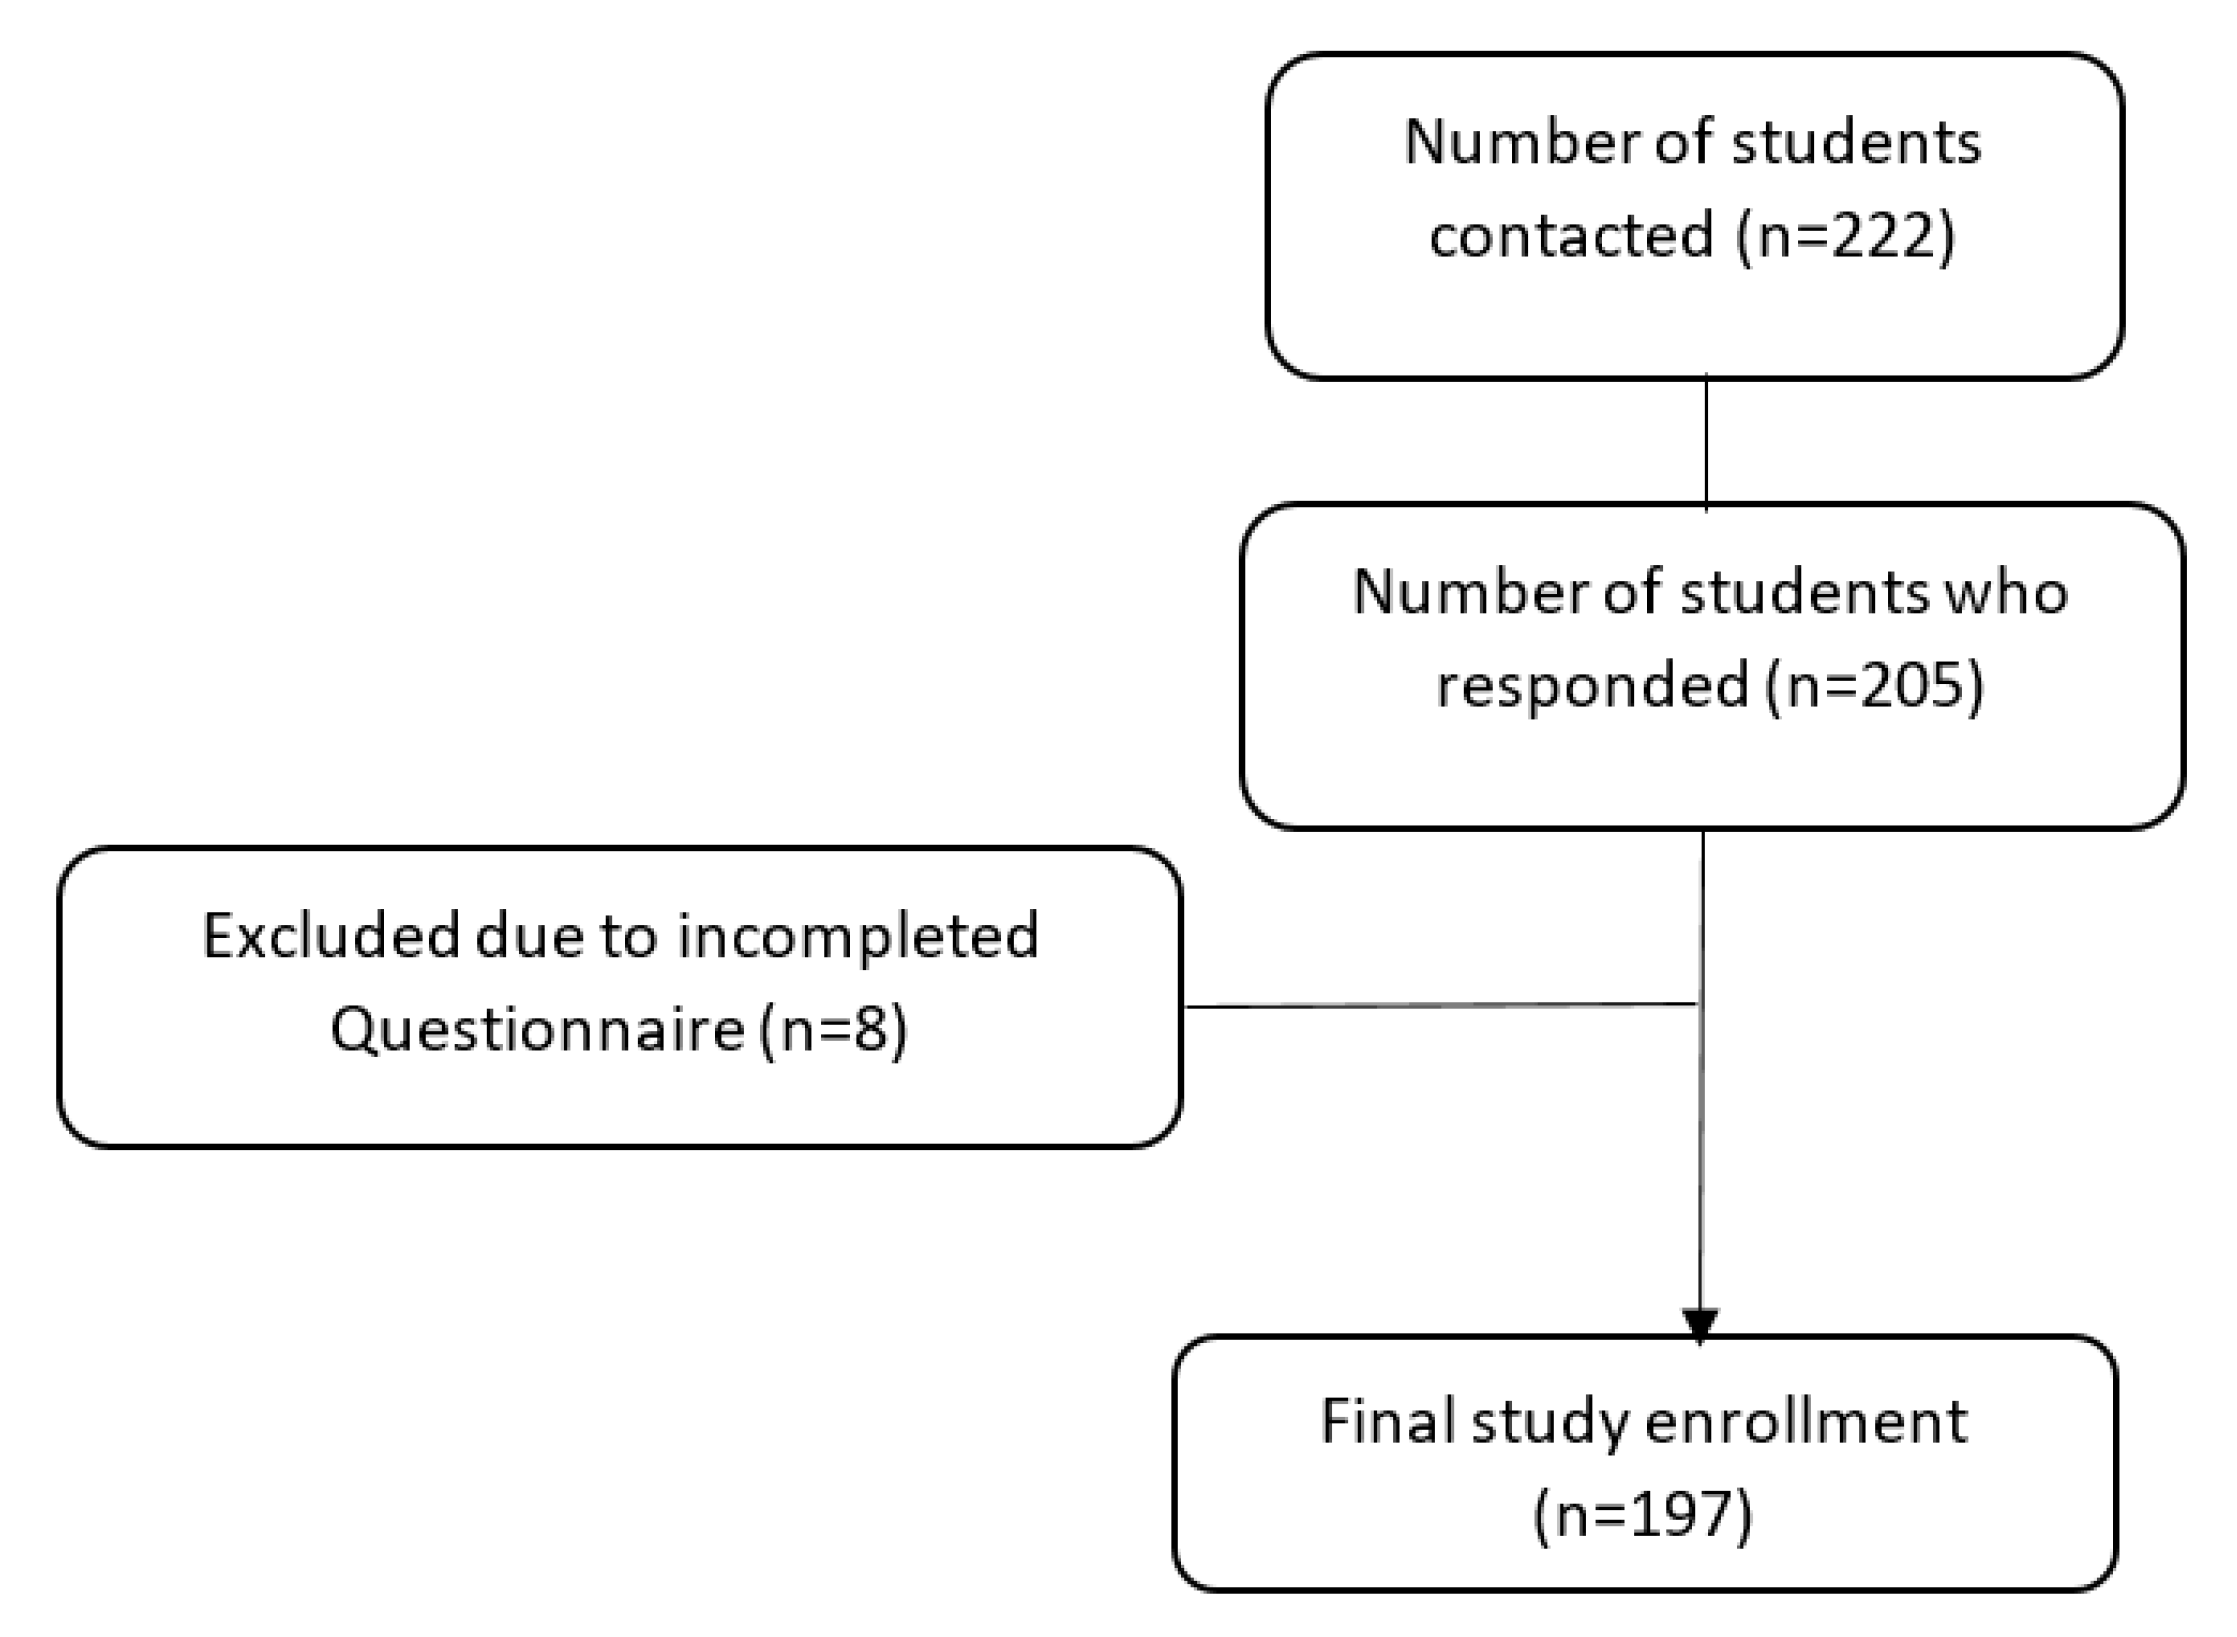
Figure 2.
Figure 2. Decision tree output of the random forest for predicting 1-month LBP obtained by the given variables. Neg=negative, pos=positive. PA- physical activity. b: The main variables significantly associated with LBP according to the decision tree outcome.
Figure 2.
Figure 2. Decision tree output of the random forest for predicting 1-month LBP obtained by the given variables. Neg=negative, pos=positive. PA- physical activity. b: The main variables significantly associated with LBP according to the decision tree outcome.
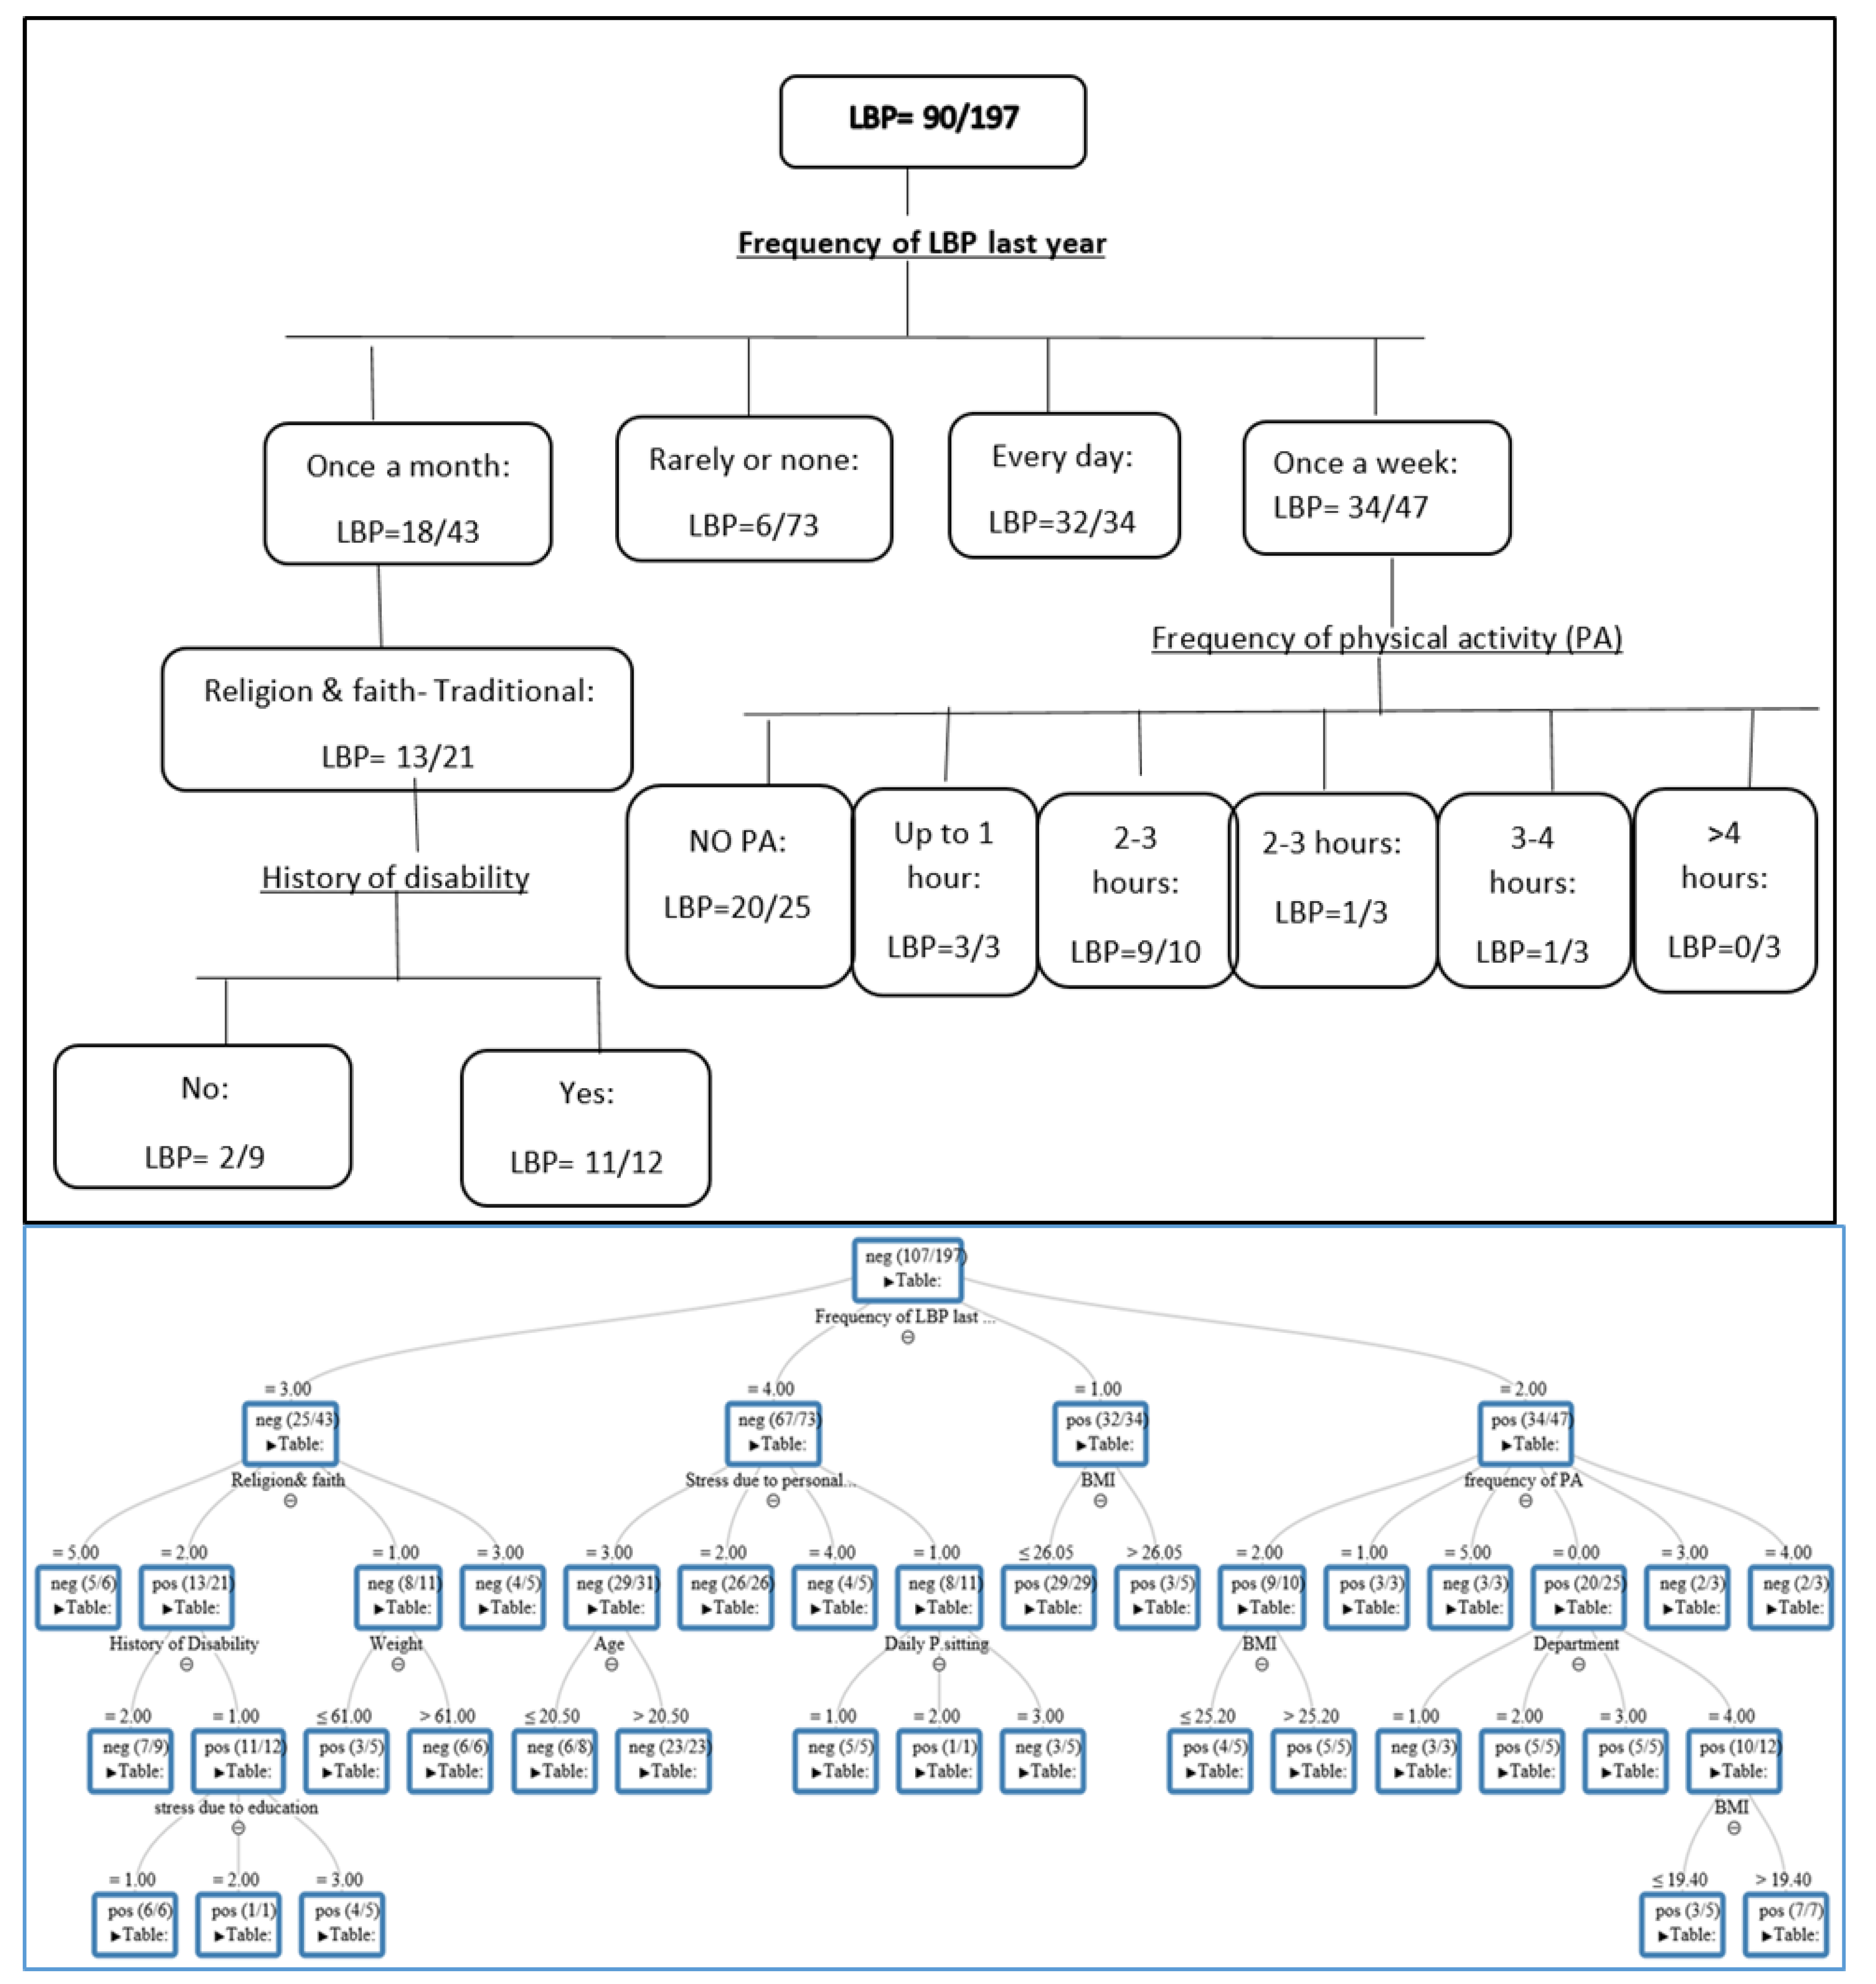

Table 1.
Sample size characteristics.
| % (n)/or mean ± SD | |
| 89 (197) | Response rate n (%) |
| 25 (49) 75 (148) |
Male Female |
|
45 (89) 21 (41) 19 (37) 15(30) |
Department: Nursing Physical Therapy Medical Lab Emergency Medical Services |
| 23 ± 3.8 | Mean age (year) |
| 23 ± 3.5 | Mean BMI (kg/m2) |
| 91 (179) | Dominant right hand (%) |
|
93 (184) 7 (13) |
Marital status: Single Other |
| 15 (30) | Smoking |
|
30 (60) 43 (84) 13 (26) 14 (27) |
Religion & faith: Secular Traditional Religious/orthodox Other |
| 55 (108) 7 (14) 19 (37) 10 (20) 9 (18) 10 (19) |
Those with physical activity (wk): 20 min to 1 hour 1–2 hours 2–3 hours 3–4 hours > 4 hours |
|
40 (78) 23 (45) 37 (74) |
Prolonged daily sitting: Up to 3 hours 3–5 hours 5 hours > |
|
32 (63) 30 (60) 38 (74) |
Total daily sitting: Up to 6 hours 6–8 hours >8 hours |
|
85 (167) 15 (30) |
*Study-related stress: Very high–quite high Little–none |
*We present only study-related stress as this variable was most common compared to other types of stress.
Table 2.
Low back pain (LBP) characteristics for the study group.
| N (%) | |
| 146 (74) | Those who experienced LBP at some point in their life |
| 8 (4) | Those who had been hospitalized due to LBP |
|
34 (17) 47 (24) 43 (22) 73 (37) 65 (33) 39 (20) 39 (20) |
LBP in the last year: Frequency of LBP: ● Every day ● Once a week ● Once a month ● Rarely/never Disability Seeking care Medication consumption |
| 90 (46) | 1-month LBP |
Table 3.
Scores of the significant variables associated with LBP by the decision tree.
| Variable | Score |
| Frequency of LBP History of disability Frequency of physical activity (PA) Weight Religion and faith Department |
1 0.34 0.21 0.18 0.13 0.12 |
Disclaimer/Publisher’s Note: The statements, opinions and data contained in all publications are solely those of the individual author(s) and contributor(s) and not of MDPI and/or the editor(s). MDPI and/or the editor(s) disclaim responsibility for any injury to people or property resulting from any ideas, methods, instructions or products referred to in the content. |
© 2025 by the authors. Licensee MDPI, Basel, Switzerland. This article is an open access article distributed under the terms and conditions of the Creative Commons Attribution (CC BY) license (http://creativecommons.org/licenses/by/4.0/).
Copyright: This open access article is published under a Creative Commons CC BY 4.0 license, which permit the free download, distribution, and reuse, provided that the author and preprint are cited in any reuse.


