
Submitted:
17 February 2025
Posted:
18 February 2025
You are already at the latest version
Abstract
Resumen: This study emphasizes the application of deep learning techniques for tumor detection in medical images using YOLOv11. By leveraging convolutional neural networks (CNNs) pre-trained on large-scale datasets, the model fine-tunes its parameters to address the specific challenge of tumor identification. Training and validation are analyzed through loss and metric graphs. The losses associated with bounding box adjustment, classification, and coordinates showed a progressive decrease, indicating continuous improvement in model accuracy during both training and validation. Key metrics such as precision, recall, and mAP were evaluated. The model achieved an accuracy exceeding 95%, while recall increased from 75% to 90%, demonstrating robust capability in identifying true positives. The confusion matrix analysis revealed 287 correctly classified tumors, with 24 false negatives and 36 false positives, suggesting areas for improvement. The results confirm the effectiveness of transfer learning in medical image analysis tasks. The developed model performs accurate detections, making it a computationally efficient and viable solution for applications in resource-constrained environments. This study lays a solid foundation for the development of computer vision-based diagnostic tools that could enhance early tumor detection and improve clinical outcomes in vulnerable populations.
Keywords:
Brain tumors
; prognosis
; convolutional neural networks
; Transfer Learning
; YOLO
; Computer Vision
1. Introduction
Computer vision utilizes advanced image processing techniques across various domains, including industrial settings, autonomous driving, education, and healthcare [1]. n medical applications, these techniques enable tumor localization and classification through segmentation and object detection, providing a valuable tool for radiologists and physicians in diagnostic decision-making [2]. A computer vision-based approach to assisted tumor diagnosis harnesses the power of artificial intelligence (AI) and deep learning (DL) to efficiently and accurately analyze medical images [3]. This technology focuses on the automatic interpretation of images such as X-rays, computed tomography (CT), and magnetic resonance imaging (MRI) to identify patterns that might go unnoticed by the human eye.
Early tumor diagnosis is crucial for improving survival rates and enhancing the quality of life for cancer patients [4], [5]. However, timely detection is often hindered in many regions due to the lack of specialized resources, the workload of medical professionals, and technological limitations [6]. Integrating AI-based tools presents a promising solution to these challenges by providing more efficient, accurate, and accessible diagnostic support systems [7].
Among AI technologies, object detection models like You Only Look Once (YOLO) have gained prominence for their ability to make fast and accurate predictions in various applications, including medical diagnosis [8]. hese models utilize CNNs to recognize complex patterns in visual data, making them ideal for detecting tumors in medical images. Additionally, their efficient design enables deployment on low-cost hardware, making them a viable option for both clinical and non-clinical settings, including rural or resource-limited communities [9],[10].
A representative example is the “Tumor” project developed by Selencakmak, available on Roboflow Universe through YOLOv8 (https://roboflow.com/, accessed December 14, 2023). This project uses advanced YOLO models, such as YOLOv8s, for tumor detection in medical images. The model has been trained on a specialized dataset and can be deployed both in web browsers and via a hosted inference API. Its CC BY 4.0 license allows free use and adaptation with proper attribution, fostering collaboration and technological advancements in the medical field. For instance, in a test case, this model correctly identified several suspicious lesions in mammograms, demonstrating its potential to reduce the workload of radiologists [11].
A particularly relevant approach in this context is Transfer Learning, a technique that enables pre-trained models to adapt knowledge from a general dataset to a specific domain [12]. This method is especially beneficial in medical imaging, where labeled datasets are limited and computational resources may be constrained. Using pre-trained models like YOLOv8, optimized with large-scale datasets such as COCO, significantly reduces training time and improves generalization when adapting the model to tumor-specific datasets.
In this context, the present study focuses on the application of deep learning techniques using YOLO models, particularly YOLOv11, for assisted brain tumor diagnosis. The model’s performance is evaluated in automated tumor detection from MRI datasets. The research explores model customization and training stages, along with validation using clinically relevant metrics. By optimizing the model with a specialized dataset, the study aims to enhance detection accuracy and performance in clinical scenarios, contributing to the development of affordable and accessible diagnostic tools. Furthermore, this approach highlights how knowledge transfer techniques can be effectively applied in environments with limited data and resources, marking a step toward more inclusive and effective computer vision-based diagnostic systems.
From this point forward, the article is structured as follows: Section 2 provides a concise review of the relevant literature, focusing on deep learning techniques applied through YOLO. Section 3 details the employed methodology, describing the algorithms and experimental design. Section 4 presents the results obtained from the conducted experiments, while Section 5 discusses the findings in relation to previous studies. Finally, Section 6 reports the conclusions derived from this research, emphasizing its implications and recommendations for future studies.
2. Trabajos Relacionados
The application of AI models for tumor detection and diagnosis has seen significant advancements in recent years, with various approaches utilizing computer vision, CNNs, deep learning techniques, and object detection models like YOLO. However, previous studies present different methodological strategies with limitations in accuracy, interpretability, and generalization capability. Below, the most relevant works are analyzed, organized thematically, and discussed in terms of their findings and challenges.
ince its first version, the YOLO architecture has evolved with improvements in accuracy and computational efficiency. The work of [13] provides a comprehensive review of YOLO’s evolution from v1 to v8, highlighting its applicability across various sectors, including industrial defect detection. However, despite its efficiency, adaptation to medical imaging remains a challenge. In this context, studies such as [14] and [15] have explored the implementation of YOLO in polyp detection in endoscopic images and leukemia diagnosis, respectively, achieving improvements in metrics such as accuracy and mAP. Similarly, the use of YOLO in security applications has been studied in [16], where neural networks were implemented for detecting criminal behavior from surveillance videos, demonstrating its versatility in different fields.
Several studies have investigated the application of YOLO in brain tumor diagnosis. The study by [17] compares class-based detection models with segmentation-based approaches using prompts, concluding that the former are more suitable for high-precision diagnostic applications. Similarly, [18] proposes a YOLO-NeuroBoost model that integrates attention mechanisms and loss function improvements, achieving an mAP of 99.48 on the Br35H dataset. Meanwhile, [19] evaluates YOLO’s ability to detect and localize brain tumors in MRI images, obtaining an mAP_0.5 of 0.941, highlighting its potential in clinical settings. Additionally, [20] emphasizes the need for automated models for tumor detection, underscoring the challenges in segmenting and classifying tumors in complex medical images.
Despite the progress made, existing studies present several limitations. For instance, [21] highlights the challenges in detecting diabetic retinopathy lesions due to variability in image size and contrast. Additionally, the study by [22] emphasizes the difficulty in accurately segmenting brain tumors using YOLOv8, requiring architectural adjustments to enhance performance in medical images. Furthermore, [23] warns about YOLO model vulnerabilities to adversarial perturbations, which could compromise the reliability of systems in critical applications such as disease diagnosis. Moreover, the implementation of noise reduction techniques in medical images, as proposed in [24], could complement tumor detection by improving input quality for AI models.
The use of YOLO has not been limited to medicine but has also been explored in various fields. For example, [25] and [26] examine its application in detecting visual pollution and malaria diagnosis, respectively, demonstrating its adaptability to different data types and environments. Additionally, [27] investigates its integration into robotic systems for object manipulation in assisted environments, highlighting the potential of this technology across disciplines. In bone fracture detection, [28] implements YOLOv11 to improve fracture classification and localization in X-ray images, achieving superior accuracy compared to traditional methods such as Faster R-CNN and SSD.
This study addresses several of these gaps by implementing YOLOv11 for brain cancer detection. Unlike previous approaches using YOLOv8 [29], the proposed model introduces improvements in segmentation and accuracy through advanced transfer learning techniques and hyperparameter optimization. Additionally, it focuses on reducing false negatives identified in [19], enhancing the model’s sensitivity in detecting early-stage tumors. Finally, its robustness against adversarial perturbations [23], s evaluated, ensuring its applicability in real clinical settings. Moreover, this study incorporates computational optimization elements similar to those applied in [25] and [30], improving model inference efficiency. Consequently, this research contributes to the development of more precise and accessible diagnostic tools in the medical field, aligning with recent trends in AI-based automated disease detection [31].
3. Materials and Methods
To implement the computer vision-based assisted tumor diagnosis system, the YOLOv11 object detection model was utilized to accurately and efficiently detect tumors in medical images. The methodology is outlined in Figure 1. This section describes the process implemented to train and validate a tumor detection model using the YOLOv11 convolutional neural network, employing advanced computer vision and transfer learning techniques.
This approach focuses on deep learning models’ ability to identify and classify tumors in medical images, optimizing their application for early-assisted diagnosis.
3.1. Environment Setup and Initial Configuration
To begin the process, the development environment was configured using the NVIDIA platform and the necessary libraries. The system’s compatibility with the available GPU was validated using the nvidia-smi command, ensuring the proper utilization of graphical resources during model training. Subsequently, the working directory was set using the os.getcwd() command, ensuring that all required files and data were in the correct location.
3.2. Package and Library Installation
The implementation process utilized the Ultralytics library, which provides an optimized interface for working with detection models like YOLO. The installation of this library was managed via pip install ultralytics, and its proper configuration was verified using the ultralytics.checks() function. Additionally, to facilitate dataset downloading and management, the Roboflow tool was installed, allowing access to well-organized, labeled datasets. This facilitated the retrieval of a tumor-specific dataset used to train and evaluate the detection model.
3.3. Dataset Acquisition and Preprocessing
The Roboflow platform was used to access a specific tumor detection project, utilizing the provided API key for authentication. Once authenticated, the project was accessed, and the corresponding dataset version was downloaded. The dataset consists of 3,580 images at 640x640 resolution, divided into 3,130 training images, 299 validation images, and 150 test images, as illustrated in Figure 2. This dataset is labeled according to the tumor classes present in medical images and is formatted for compatibility with YOLOv11.
During downloading, modifications were made to the data.yaml configuration file to ensure that the paths for training, validation, and test images were correctly specified. This preprocessing step included removing unnecessary lines and adding correct paths to image directories, ensuring the model correctly accessed the data during training and evaluation.
3.4. YOLOv11 Model Training
With the dataset prepared, the training phase is initiated using the YOLOv11 model. This model, pre-trained on a base version, is fine-tuned for assisted tumor diagnosis by being specifically trained with the previously configured dataset. Training is conducted using the command: !yolo task=detect mode=train,
Key parameters specified include:
- Number of epochs: 10
- Input image size: 640x640 pixels
- Activation of evaluation graphs during the process
The model is trained using the yolo11n.pt version, a pre-trained neural network adapted to the dataset characteristics. Additionally, data augmentation techniques are employed, which allow the expansion of the existing dataset without the need to collect new samples. This process involves applying controlled random modifications to already available images, generating new versions with variations.
In artificial neural network training, this technique is widely used as it enhances the model’s ability to generalize and optimizes learning by increasing the diversity of training data. The specific parameters for the applied data augmentation techniques include:
- 90° rotation: Clockwise and counterclockwise
- Rotation range: Between -15° and +15°
In this study, data augmentation strategies were implemented to modify MRI brain scan images, applying transformations such as rotations, flips, cropping, and controlled adjustments. The primary goal of this approach is to optimize the model’s capability to detect tumors effectively, regardless of their orientation or position within the image. Furthermore, the generation of augmented data helps mitigate overfitting, which occurs when a model becomes excessively adapted to the training data, reducing its generalization ability due to an excessive number of parameters compared to the available observations.
3.5. Model Evaluation
After training, the model was evaluated to determine its tumor detection performance. The evaluation results were accessed through graphs, including confusion matrices and validation batch images. These visualizations assessed model performance in terms of precision, recall, and other key metrics. Results obtained at this stage were used to adjust additional parameters if necessary.
3.6. Validation and Final Prediction
With the model trained and evaluated, it is validated on a different data set than the training one. Using the !yolo task=detect mode=val command, the model’s ability to generalize to new data is validated. Subsequently, the final prediction is performed on a set of test images using the !yolo task=detect mode=predict command, with a confidence threshold of 0.25. The output images were stored and visualized, allowing for a final performance review and ensuring the model’s effectiveness in tumor detection, as illustrated in Figure 3.
4. Results
The training and validation loss graphs provide insights into the model’s progress in terms of fitting and generalization, as illustrated in Figure 4. In the case of the loss associated with bounding box prediction during training (train/box_loss), the blue curve (“results”) exhibits a consistent decline, indicating that the model progressively improves in predicting bounding boxes. The orange curve (“smooth”), a smoothed version, reinforces this trend. Similarly, classification loss (train/cls_loss) experiences a rapid decrease in the early epochs, demonstrating that the model quickly learns to classify objects, although this progress slows down as it approaches convergence. On the other hand, distribution focal loss (train/dfl_loss), which is related to the accuracy of bounding box coordinate predictions, also decreases consistently, indicating continuous adjustment.
Regarding validation metrics, bounding box losses (val/box_loss) exhibit higher variability across epochs, but maintain a downward trend, reflecting improvements in the model’s ability to generalize to unseen data. Similarly, classification losses (val/cls_loss) and coordinate losses (val/dfl_loss) in validation show similar behavior to their training counterparts, though with typical fluctuations observed in validation datasets.
The metric graphs evaluate model performance in terms of precision, recall, and mean average precision (mAP). The precision metric (metrics/precision(B)) shows that the model starts with a high initial precision (>0.88) and experiences slight improvements until surpassing 0.95, indicating that most predictions are relevant. Meanwhile, the recall metric (metrics/recall(B)), which measures the proportion of detected true positives, starts at approximately 0.75 and consistently improves to 0.9, reflecting the model’s increasing capability to identify true positives.
Regarding mAP with an IoU threshold of 0.5 (metrics/mAP50(B)), the model exhibits significant progress, increasing from 0.75 to nearly 0.95, demonstrating accurate detections in most cases. Finally, the mean mAP across IoU thresholds from 0.5 to 0.95 (metrics/mAP50-95(B)) starts at 0.35 and rises to approximately 0.6. Although this improvement is more gradual due to the stricter threshold, it still reflects continuous and robust learning. Together, these metrics confirm the model’s strong and consistently improving performance in terms of both accuracy and generalization, particularly when compared to [19].
Subsequently, Table 1 presents a summary of the model, which was trained for 10 epochs, completed in 0.190 hours.
Figure 2 displays a confusion matrix, used to evaluate the performance of the classification model on a dataset distinguishing between two classes: “tumor” and “background”. The values within the matrix cells represent the number of correct and incorrect predictions made by the model. The main diagonal (287 in the top-left cell) represents correct classifications: the model accurately classified 287 cases as “tumor”. However, errors are also observed outside the diagonal:
- 36 cases were incorrectly classified as “tumor” when they were actually “background” (false positives).
- 24 cases were incorrectly classified as “background” when they were actually “tumor” (false negatives).
This suggests that, although the model performs well overall in identifying “tumor” cases, there is still room for improvement.
The blue shading in the matrix helps visualize the distribution of values, where darker tones, such as the 287 cell, indicate a higher number of correct classifications, while lighter tones represent lower frequencies. This visual differentiation allows for a quick identification of the model’s strengths and weaknesses. For instance, the cell corresponding to true negatives (correct “background” predictions) is completely empty, possibly indicating a dataset imbalance or a model bias toward the “tumor” class. This imbalance may have affected the model’s ability to properly identify the “background” class.
In terms of evaluation, the model exhibits a high level of precision for the “tumor” class, as the majority of predictions for this class are correct. However, the presence of false negatives reduces recall, meaning the model may fail to detect some actual “tumor” cases. On the other hand, the absence of true negatives suggests that the model fails to correctly identify “background” cases, which might require further analysis, such as class balancing within the dataset or hyperparameter optimization
As illustrated in Figure 6, after processing through the proposed model, it automatically identifies regions associated with cancer by incorporating blue bounding boxes. Additionally, each detection is accompanied by a confidence percentage, indicating the certainty level of the model’s predictions.
To evaluate the model’s ability to generalize brain tumor detection beyond a specific cancer type, tumors of various sizes were considered. The results indicate that the model correctly identifies affected areas regardless of variations in size or tumor coloration. In some cases, tumor regions appear white, in others gray, and some even combine both shades. This behavior suggests that the model possesses a high generalization capacity, accurately detecting cancerous regions regardless of their size, color, or location within the image. This effectively demonstrates the “Theoretical Foundations and Applications of Deep Learning Techniques” through computer vision.
4. Discussion
The results obtained in this study reflect the effectiveness of the pre-trained model in tumor detection using transfer learning, based on computer vision architectures. The training and validation loss graphs exhibit a consistent convergence, indicating that the model achieves effective learning in both object classification and bounding box localization. The progressive decrease in train/box_loss, train/cls_loss, and train/dfl_loss confirms a proper parameter adjustment, while validation metrics maintain a downward trend with minor variations, typical of evaluation on unseen data.
In terms of performance, evaluation metrics such as precision, recall, and mAP demonstrate outstanding model behavior on the validation dataset.
- Precision, exceeding 95%, highlights the model’s ability to minimize false positives.
- The steady increase in recall indicates that a growing number of true positives are being detected.
- mAP curves, both at the 0.5 IoU threshold and across the 0.5-0.95 range, emphasize the model’s capability to make precise predictions under varying overlap criteria, compared to [19].
The confusion matrix analysis complements the quantitative evaluation, revealing that the model effectively classifies most images. However, the presence of false positives and false negatives, although reduced, suggests the potential for further optimization through strategies such as hyperparameter fine-tuning or dataset expansion.
These findings underscore the viability of transfer learning-based approaches for assisted diagnostic tasks, particularly in resource-constrained computational environments. However, they also highlight key areas for future research and improvements.
5. Conclusions
The model trained using transfer learning proved to be an effective solution for tumor detection, achieving high accuracy and recall in predictions, particularly in the application of deep learning techniques. This confirms that pre-trained architectures can be successfully adapted to specific medical diagnostic tasks even with limited datasets, optimizing the training process and reducing computational resource requirements.
The evaluation metrics obtained, including an accuracy exceeding 95%, recall close to 90%, and a growing mAP across strict IoU ranges (0.5-0.95), demonstrate the robust performance of the model in both training and validation data. The downward trend in loss values and the insights drawn from the confusion matrix reinforce the model’s ability to generalize effectively to unseen data. However, the presence of false positives and false negatives suggests room for further improvement.
This study demonstrates the feasibility of implementing computer vision-based models to assist in medical diagnosis, particularly in rural areas or resource-limited environments. However, future research could focus on further model optimization through advanced strategies, such as hyperparameter tuning, data augmentation techniques, and the incorporation of more diverse medical images to ensure greater robustness and applicability in real clinical settings.
References
- E. F. Rivera and V. H. Andaluz, “Autonomous Control of an Electric Vehicle by Computer Vision Applied to the Teaching–Learning Process,” in Smart Innovation, Systems and Technologies, 2022. [CrossRef]
- A. S. Shinde, B. M. Mahendra, S. Nejakar, S. M. Herur, and N. Bhat, “Performance analysis of machine learning algorithm of detection and classification of brain tumor using computer vision,” Adv. Eng. Softw., vol. 173, 2022. [CrossRef]
- 3. S. Ankireddy, “Assistive Diagnostic Tool for Brain Tumor Detection using Computer Vision,” in 2020 IEEE MIT Undergraduate Research Technology Conference, URTC 2020, 2020. [CrossRef]
- E. Guerra, P. V. Sharma, and B. S. Castillo, “Multi-Cancer Early Detection: The New Frontier in Cancer Early Detection,” Annual Review of Medicine, vol. 75. 2024. [CrossRef]
- R. Rivera, F., Hurtado, “Hidden Layer Visualization for Convolutional Neural Networks: A Brief Review,” in Proceedings of Ninth International Congress on Information and Communication Technology. ICICT, 2024. [CrossRef]
- A. Haleem, M. Javaid, R. Pratap Singh, and R. Suman, “Medical 4.0 technologies for healthcare: Features, capabilities, and applications,” Internet of Things and Cyber-Physical Systems, vol. 2. 2022. [CrossRef]
- 7. P. Istasy et al., “The Impact of Artificial Intelligence on Health Equity in Oncology: Scoping Review,” Journal of Medical Internet Research, vol. 24, no. 11. 2022. [CrossRef]
- 8. M. G. Ragab et al., “A Comprehensive Systematic Review of YOLO for Medical Object Detection (2018 to 2023),” IEEE Access, vol. 12, 2024. [CrossRef]
- E. D. Mañay, D. Martínez, M. D. Chiliquinga, V. D. Criollo, E. F. Rivera, and R. M. Toasa, “Low-cost deep learning-based architecture for detecting cardiac arrhythmias in ECG signals,” in Iberian Conference on Information Systems and Technologies, CISTI, 2022. [CrossRef]
- 10. L. Ma and F. Zhang, “End-to-end predictive intelligence diagnosis in brain tumor using lightweight neural network,” Appl. Soft Comput., vol. 111, 2021. [CrossRef]
- Selencakmak, “Tumor Dataset,” Roboflow, 2023. https://universe.roboflow.com/selencakmak/tumor-dj2a1 (accessed Dec. 14, 2023).
- H. E. Kim, A. Cosa-Linan, N. Santhanam, M. Jannesari, M. E. Maros, and T. Ganslandt, “Transfer learning for medical image classification: a literature review,” BMC Medical Imaging, vol. 22, no. 1. 2022. [CrossRef]
- 13. M. Hussain, “YOLO-v1 to YOLO-v8, the Rise of YOLO and Its Complementary Nature toward Digital Manufacturing and Industrial Defect Detection,” Machines, vol. 11, no. 7. 2023. [CrossRef]
- Z. F. K. M. R. M. R. M. A. K. A. A. M. Marzougui, “Real-Time Polyp Detection From Endoscopic Images Using YOLOv8 With YOLO-Score Metrics for Enhanced Suitability Assessment:,” IEEE Access, vol. 12, pp. 176346–176362, 2024. [CrossRef]
- K. D. P. J. K. K. Kim, “Lightweight and Efficient YOLOv8 With Residual Attention Mechanism for Precise Leukemia Detection and Classification,” IEEE Access, vol. 12, pp. 159395–159413, 2024. [CrossRef]
- Y. Gao, J.; Shi, J.; Balla, P.; Sheshgiri, A.; Zhang, B.; Yu, H.; Yang, “Camera-Based Crime Behavior Detection and Classification,” Smart Cities, vol. 7, no. 3, 2024. [CrossRef]
- E. H. T. M. C. M. W. B. C. J. E. C. C. S. M. R. C. T. C. Pimenta, “Brain Tumor Images Class-Based and Prompt-Based Detectors and Segmenter: Performance Evaluation of YOLO, SAM and Grounding DINO,” in 2024 International Conference on Artificial Intelligence, Blockchain, Cloud Computing, and Data Analytics (ICoABCD), 2024, pp. 202–207. [CrossRef]
- G. B. and Y. I. C. kmalbek Abdusalomov, Mekhriddin Rakhimov, Jakhongir Karimberdiyev, “Enhancing Automated Brain Tumor Detection Accuracy Using Artificial Intelligence Approaches for Healthcare Environments,” Bioeng. 2024, vol. 11, no. 6, 2024. [CrossRef]
- F. Mercaldo, L. Brunese, F. Martinelli, A. Santone, and M. Cesarelli, “Object Detection for Brain Cancer Detection and Localization,” Appl. Sci., vol. 13, no. 16, 2023. [CrossRef]
- S. T. Manoj Kumar, Urmila Pilania and T. Bhayana, “YOLOv5x-based Brain Tumor Detection for Healthcare Applications,” Procedia Comput. Sci., vol. 233, pp. 950–959, 2024. [CrossRef]
- Santos, M. Aguiar, D. Welfer, and B. Belloni, “A New Approach for Detecting Fundus Lesions Using Image Processing and Deep Neural Network Architecture Based on YOLO Model,” Sensors, vol. 22, no. 17, 2022. [CrossRef]
- R. S. D. Y, “Image Segmentation for MRI Brain Tumor Detection Using Advance AI algorithm,” in 2024 2nd International Conference on Networking, Embedded and Wireless Systems (ICNEWS), 2024, pp. 1–6. [CrossRef]
- G. Sharma and U. Garg, “Unveiling vulnerabilities: evading YOLOv5 object detection through adversarial perturbations and steganography,” Multimed. Tools Appl., vol. 83, no. 30, 2024. [CrossRef]
- S.-W. Naqvi, R.A.; Haider, A.; Kim, H.S.; Jeong, D.; Lee, “Transformative Noise Reduction: Leveraging a Transformer-Based Deep Network for Medical Image Denoising,” Mathematics, vol. 12, no. 15, p. 2313, 2024. [CrossRef]
- M. AlElaiwi, M. A. Al-antari, H. F. Ahmad, A. Azhar, B. Almarri, and J. Hussain, “VPP: Visual Pollution Prediction Framework Based on a Deep Active Learning Approach Using Public Road Images,” Mathematics, vol. 11, no. 1, 2023. [CrossRef]
- W. Hoyos, K.; Hoyos, “Supporting Malaria Diagnosis Using Deep Learning and Data Augmentation,” Diagnostics, vol. 14, no. 7, p. 690, 2024. [CrossRef]
- G. Mezzina and D. De Venuto, “An Embedded Framework for Fully Autonomous Object Manipulation in Robotic-Empowered Assisted Living,” Sensors, vol. 23, no. 1, 2023. [CrossRef]
- H. Wanmian Wei, Yan Huang, Junchi Zheng, Yuanyong Rao, Yongping Wei, Xingyue Tan OuYang, “YOLOv11-based multi-task learning for enhanced bone fracture detection and classification in X-ray images,” J. Radiat. Res. Appl. Sci., vol. 18, no. 1, p. 101309, 2024. [CrossRef]
- S. Mahajan, A. K. Sahoo, P. K. Sarangi, L. Rani, and D. Singh, “MRI Image Segmentation: Brain Tumor Detection and Classification Using Machine Learning,” in Lecture Notes in Networks and Systems, 2024. [CrossRef]
- M. Kawulok, M.; Maćkowski, “YOLO-Type Neural Networks in the Process of Adapting Mathematical Graphs to the Needs of the Blind,” Appl. Sci, vol. 14, no. 24, 2024. [CrossRef]
- S. Basavaraju, A.; Davidson, E.; Diracca, G.; Chen, C.; Santra, “Pesticide Residue Coverage Estimation on Citrus Leaf Using Image Analysis Assisted by Machine Learning,” Appl. Sci., vol. 14, no. 22, 2024. [CrossRef]
Figure 1.
Methodology.
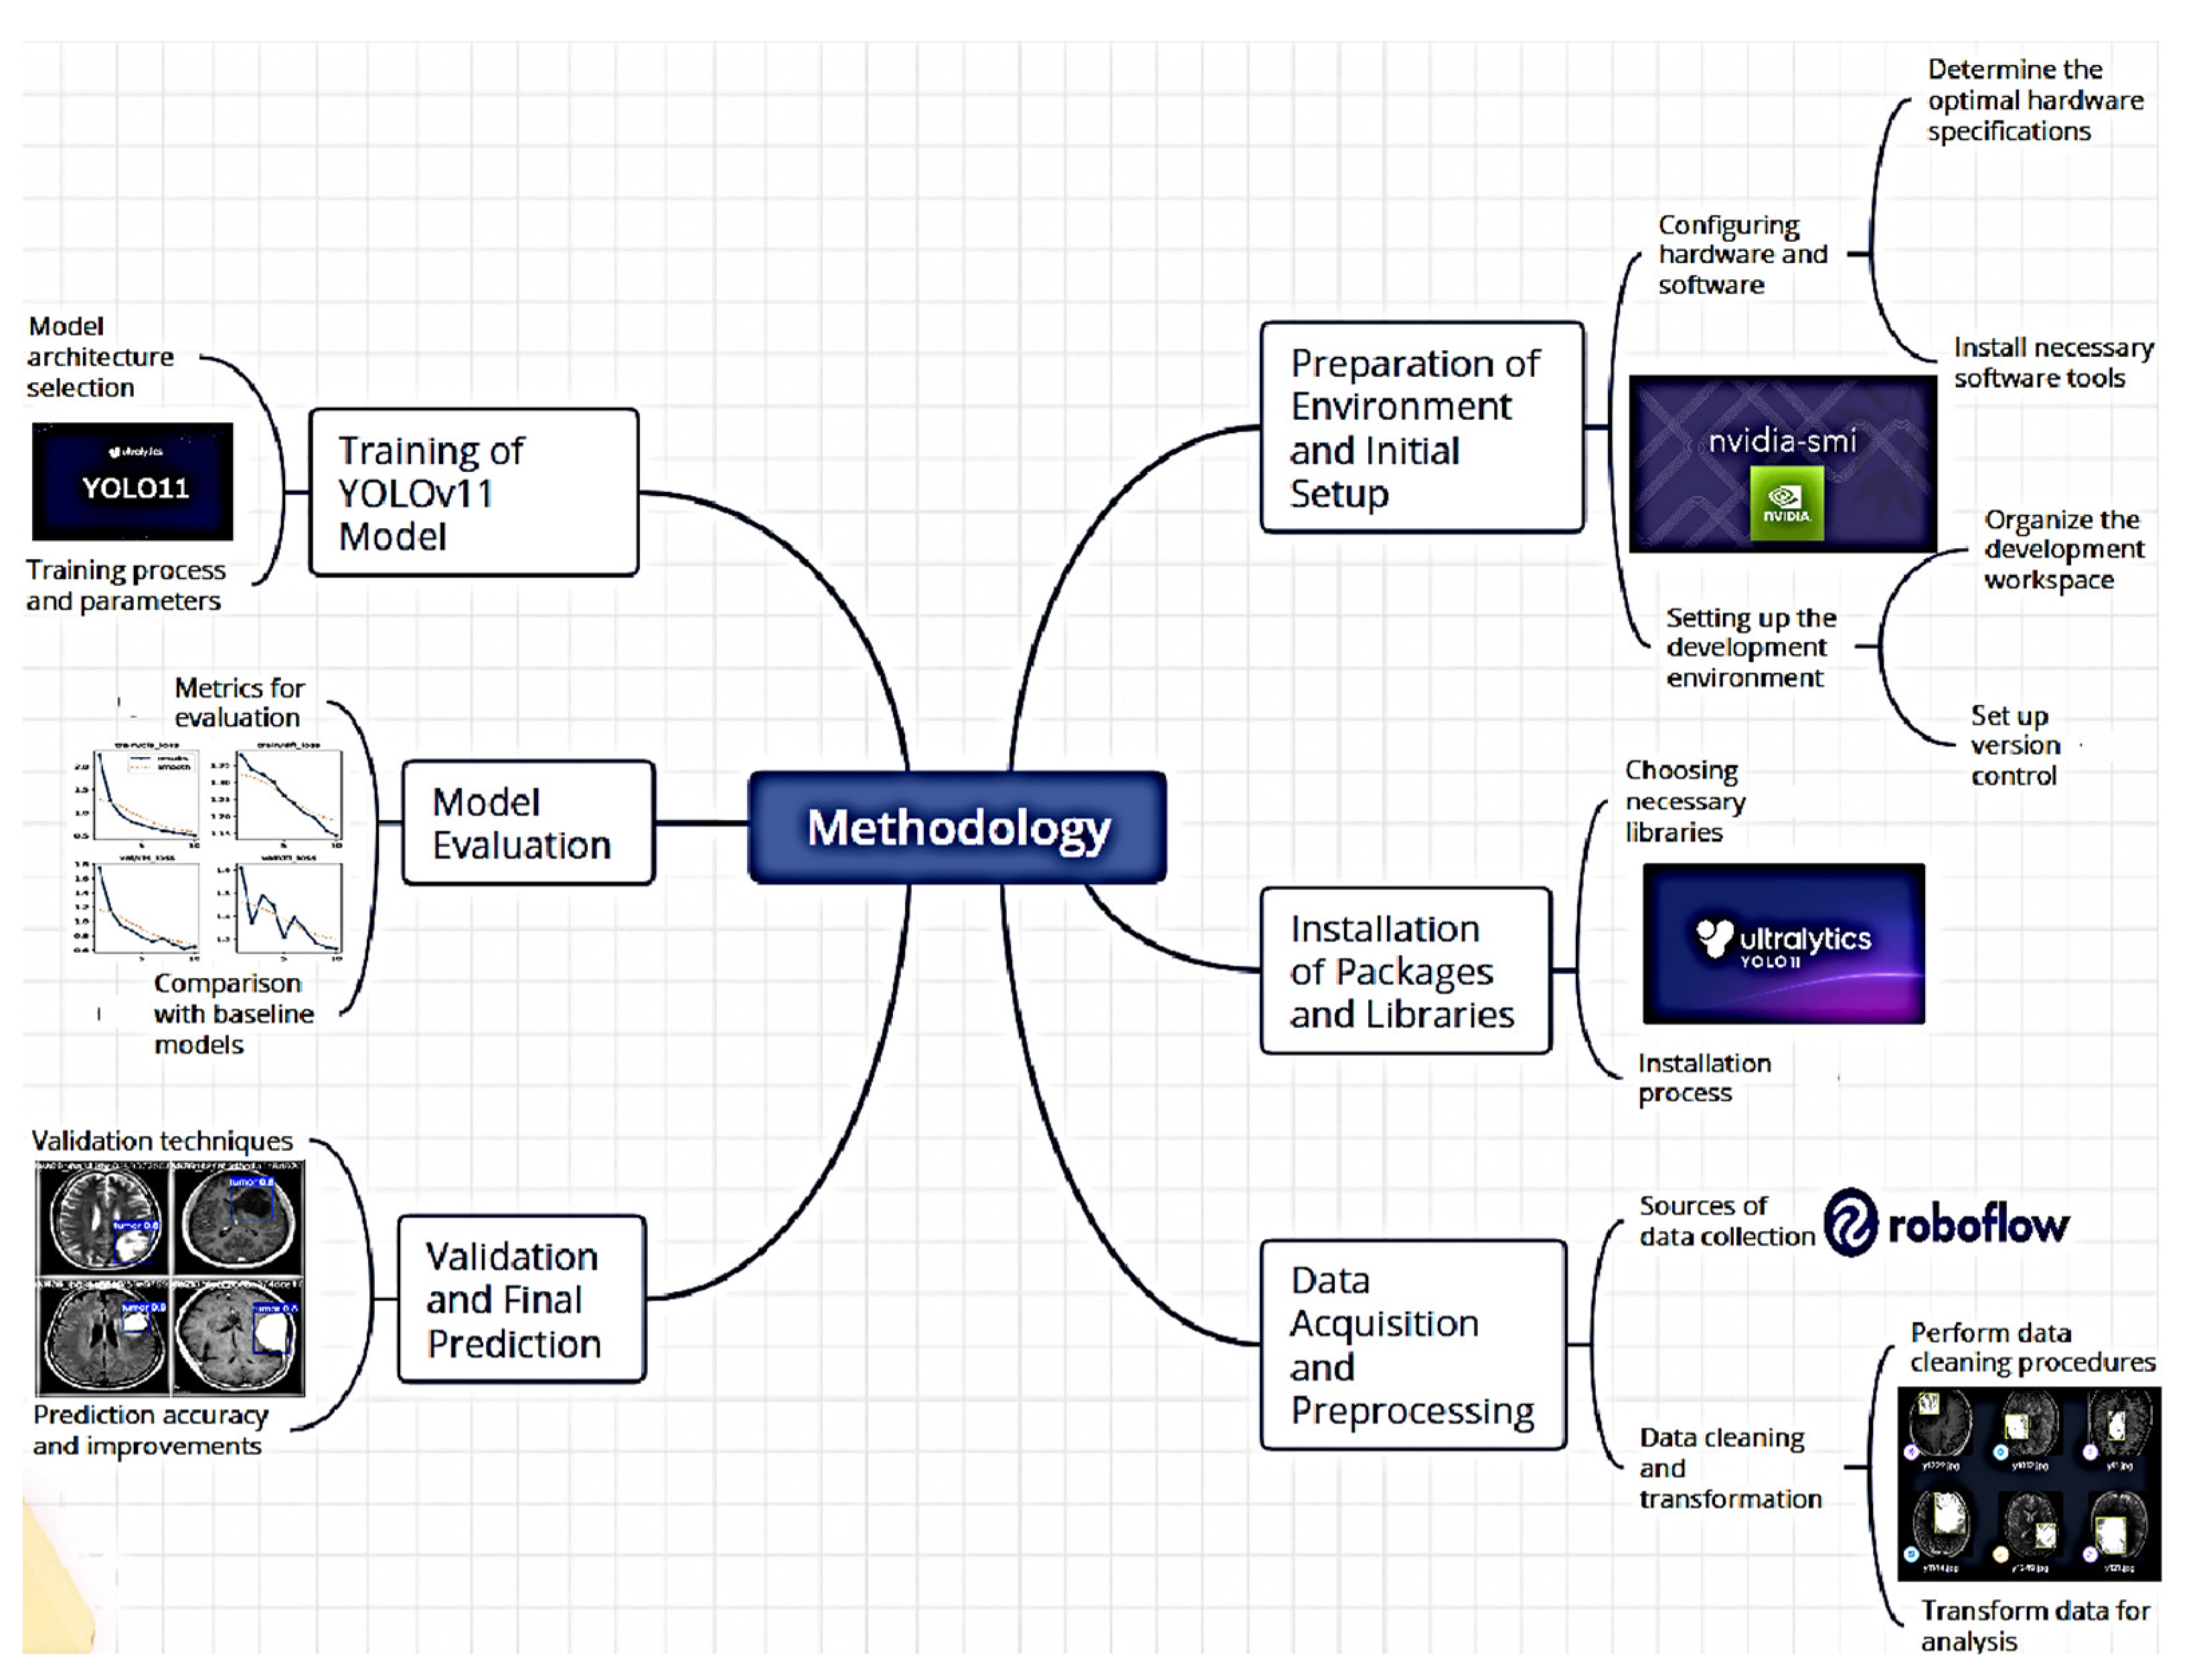
Figure 2.
Set de imágenes para el entrenamiento.
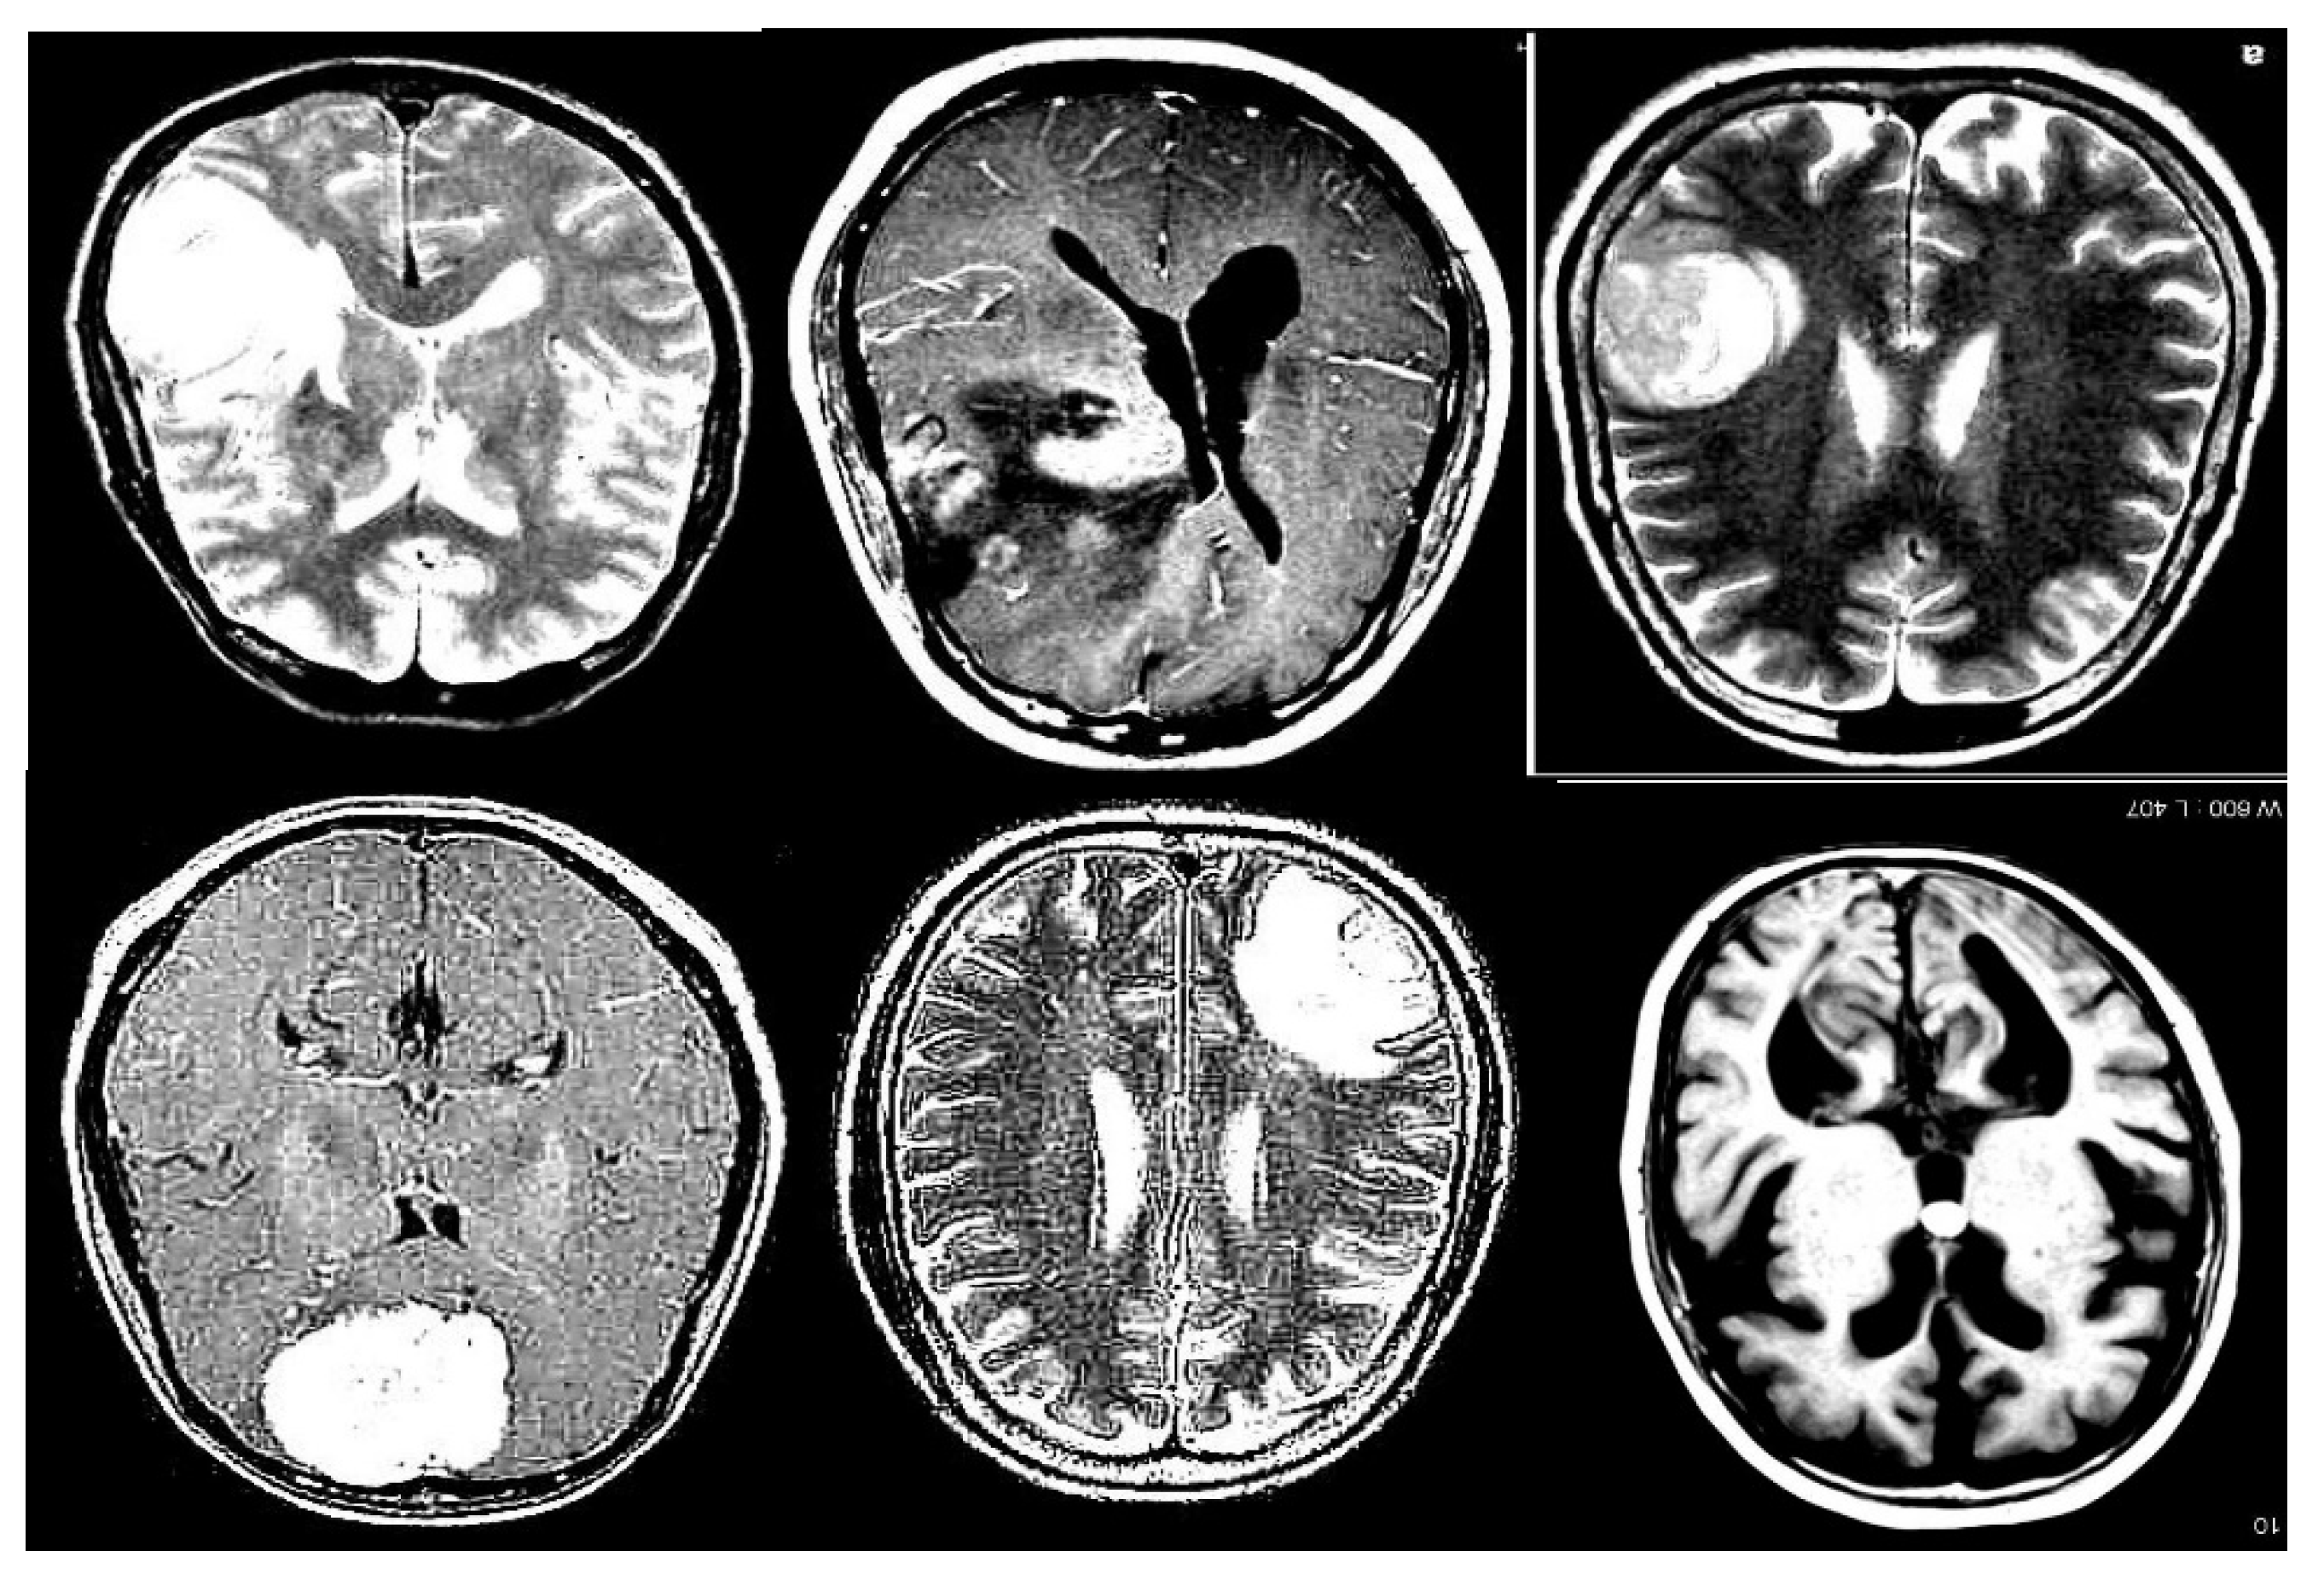
Figure 3.
Tumor prediction.
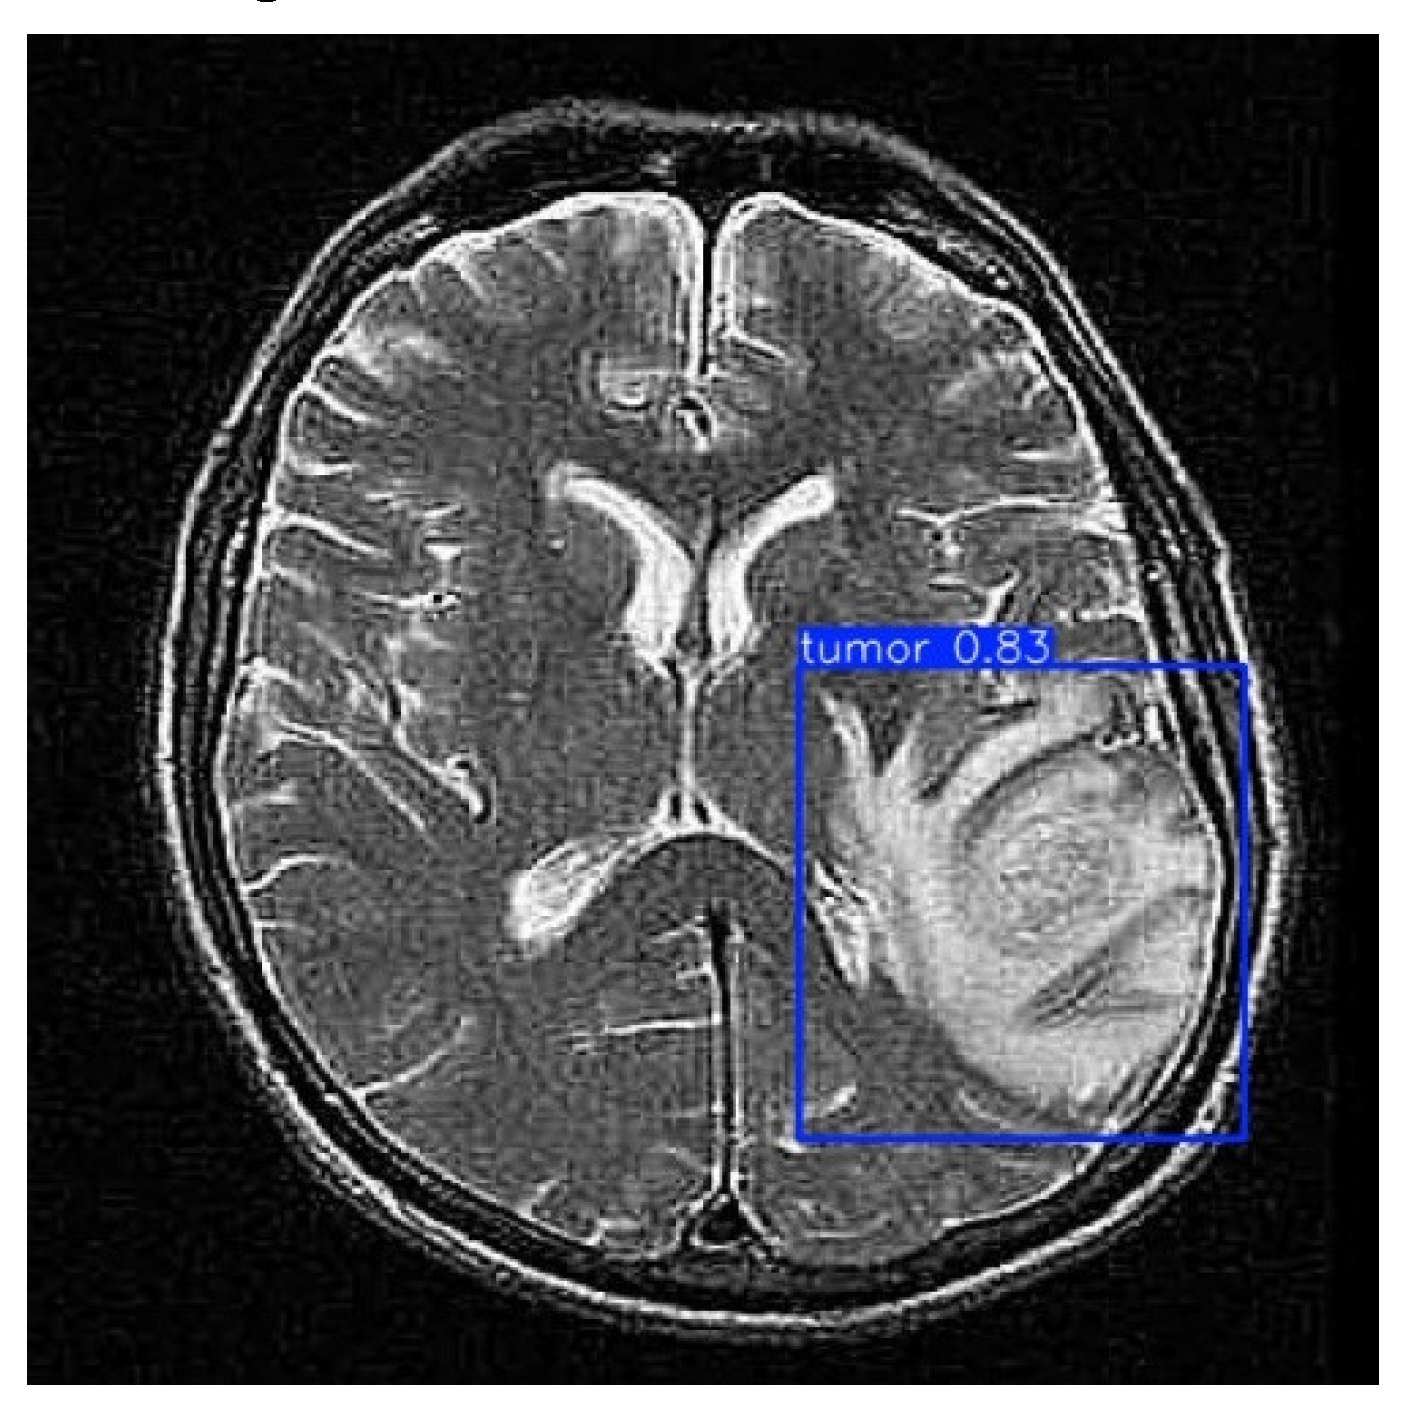
Figure 4.
Model Metrics.
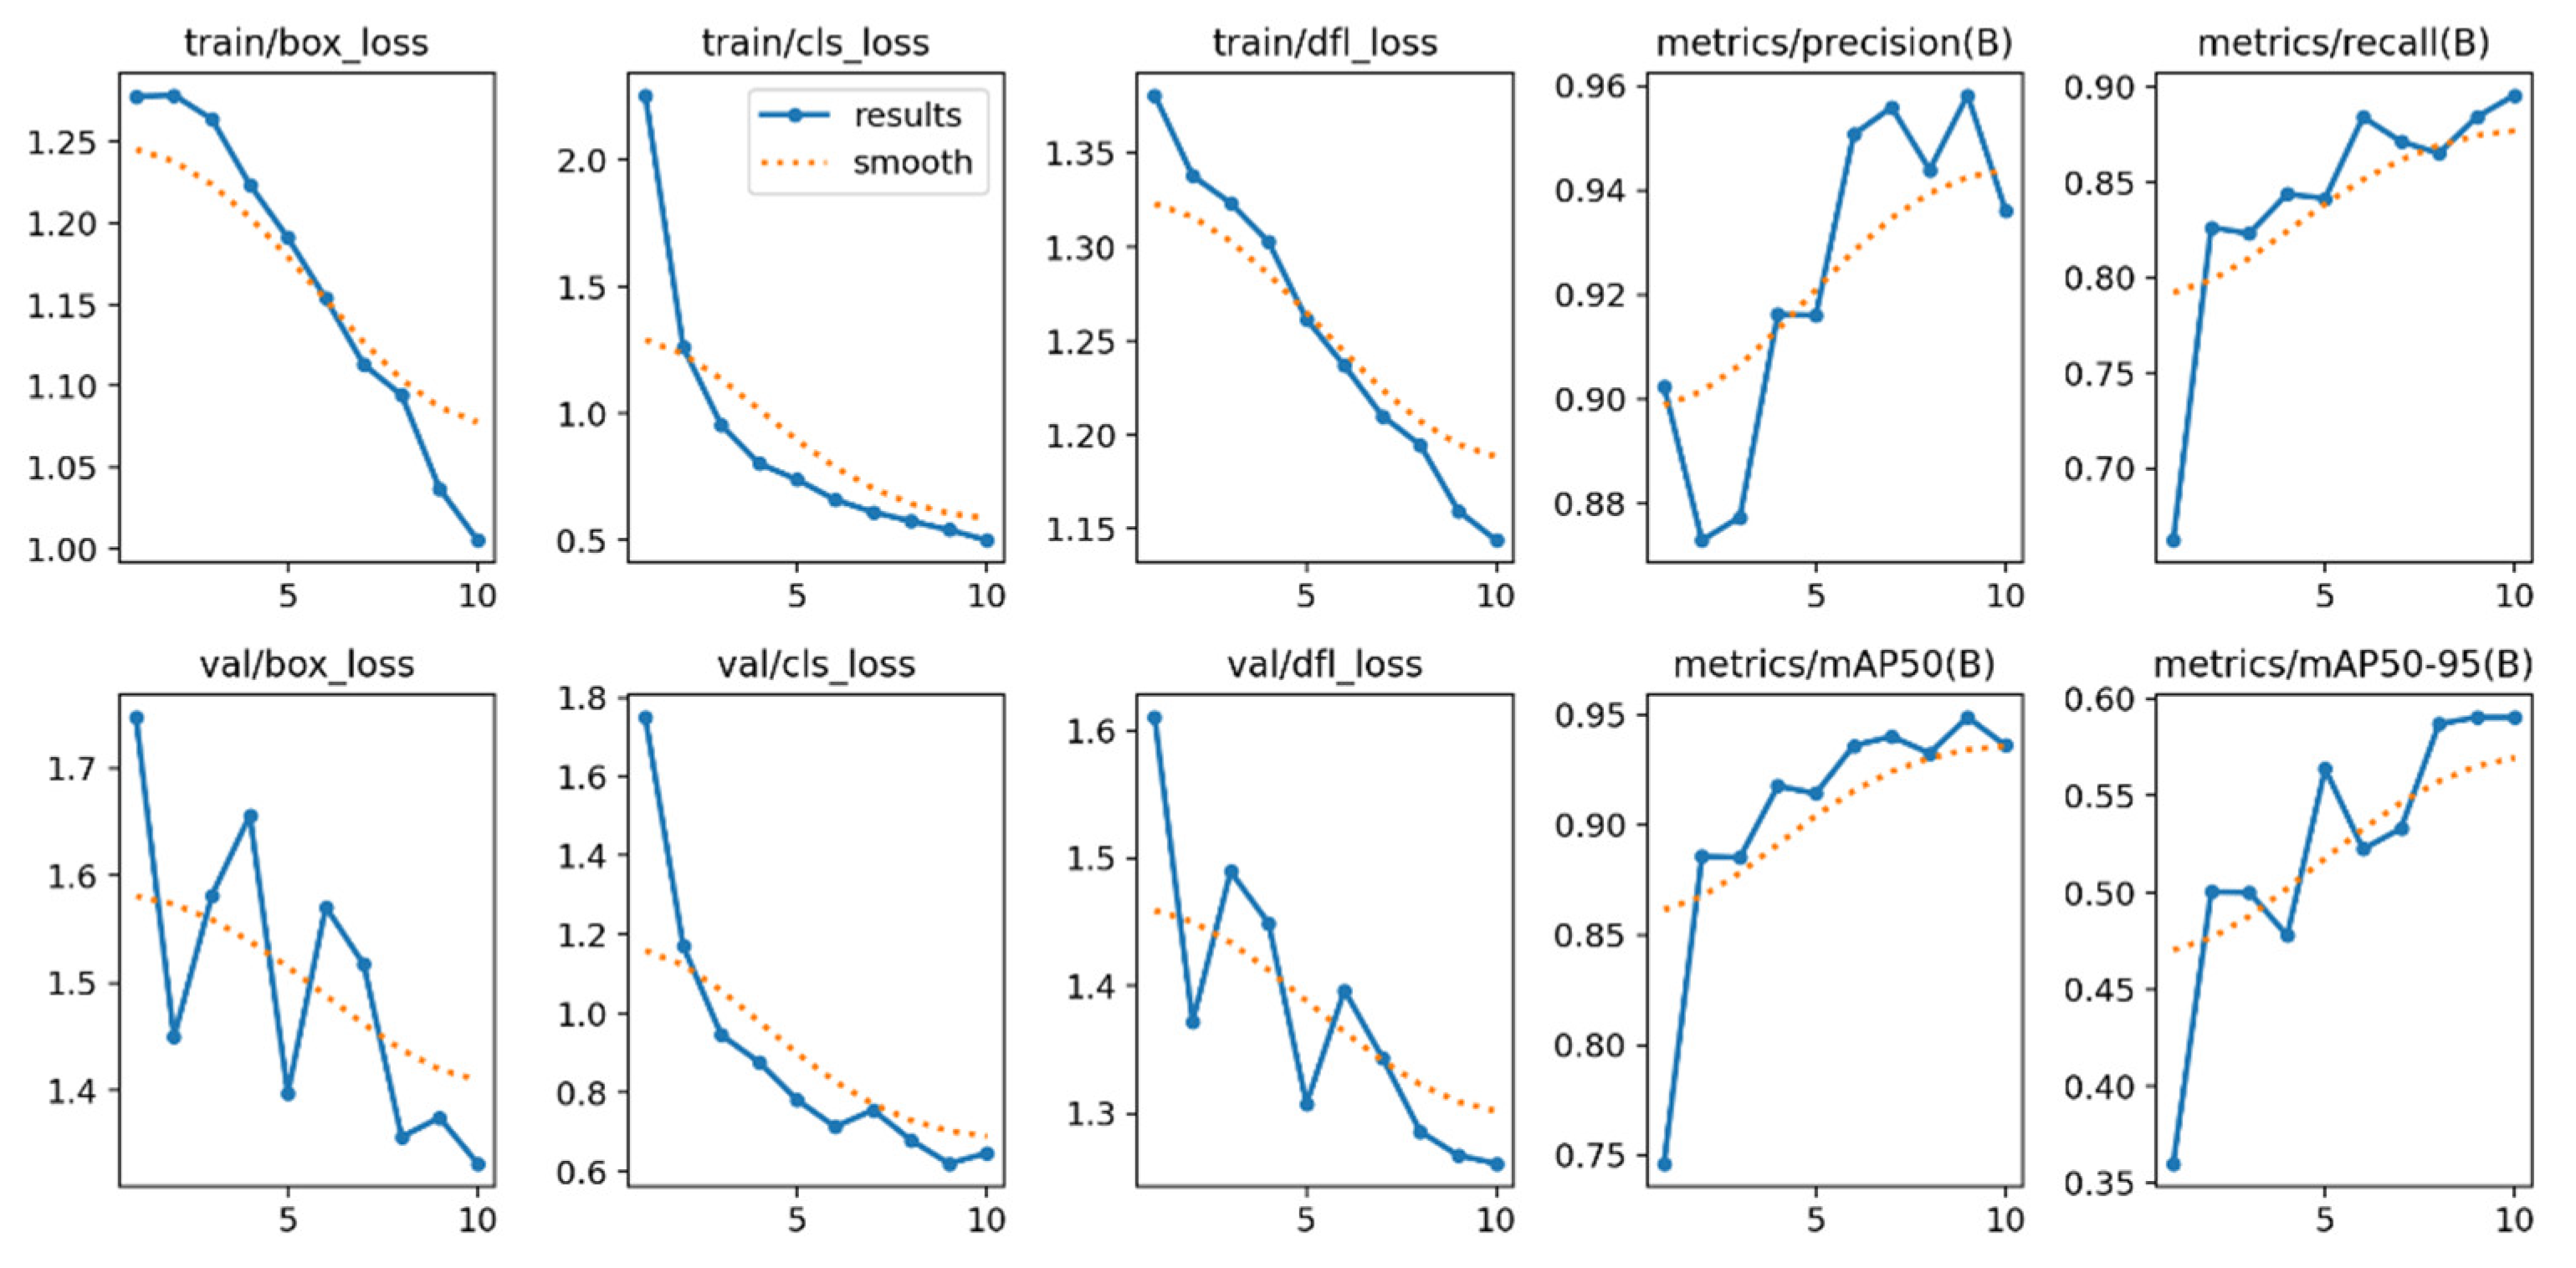
Figure 5.
Confusion matrix.
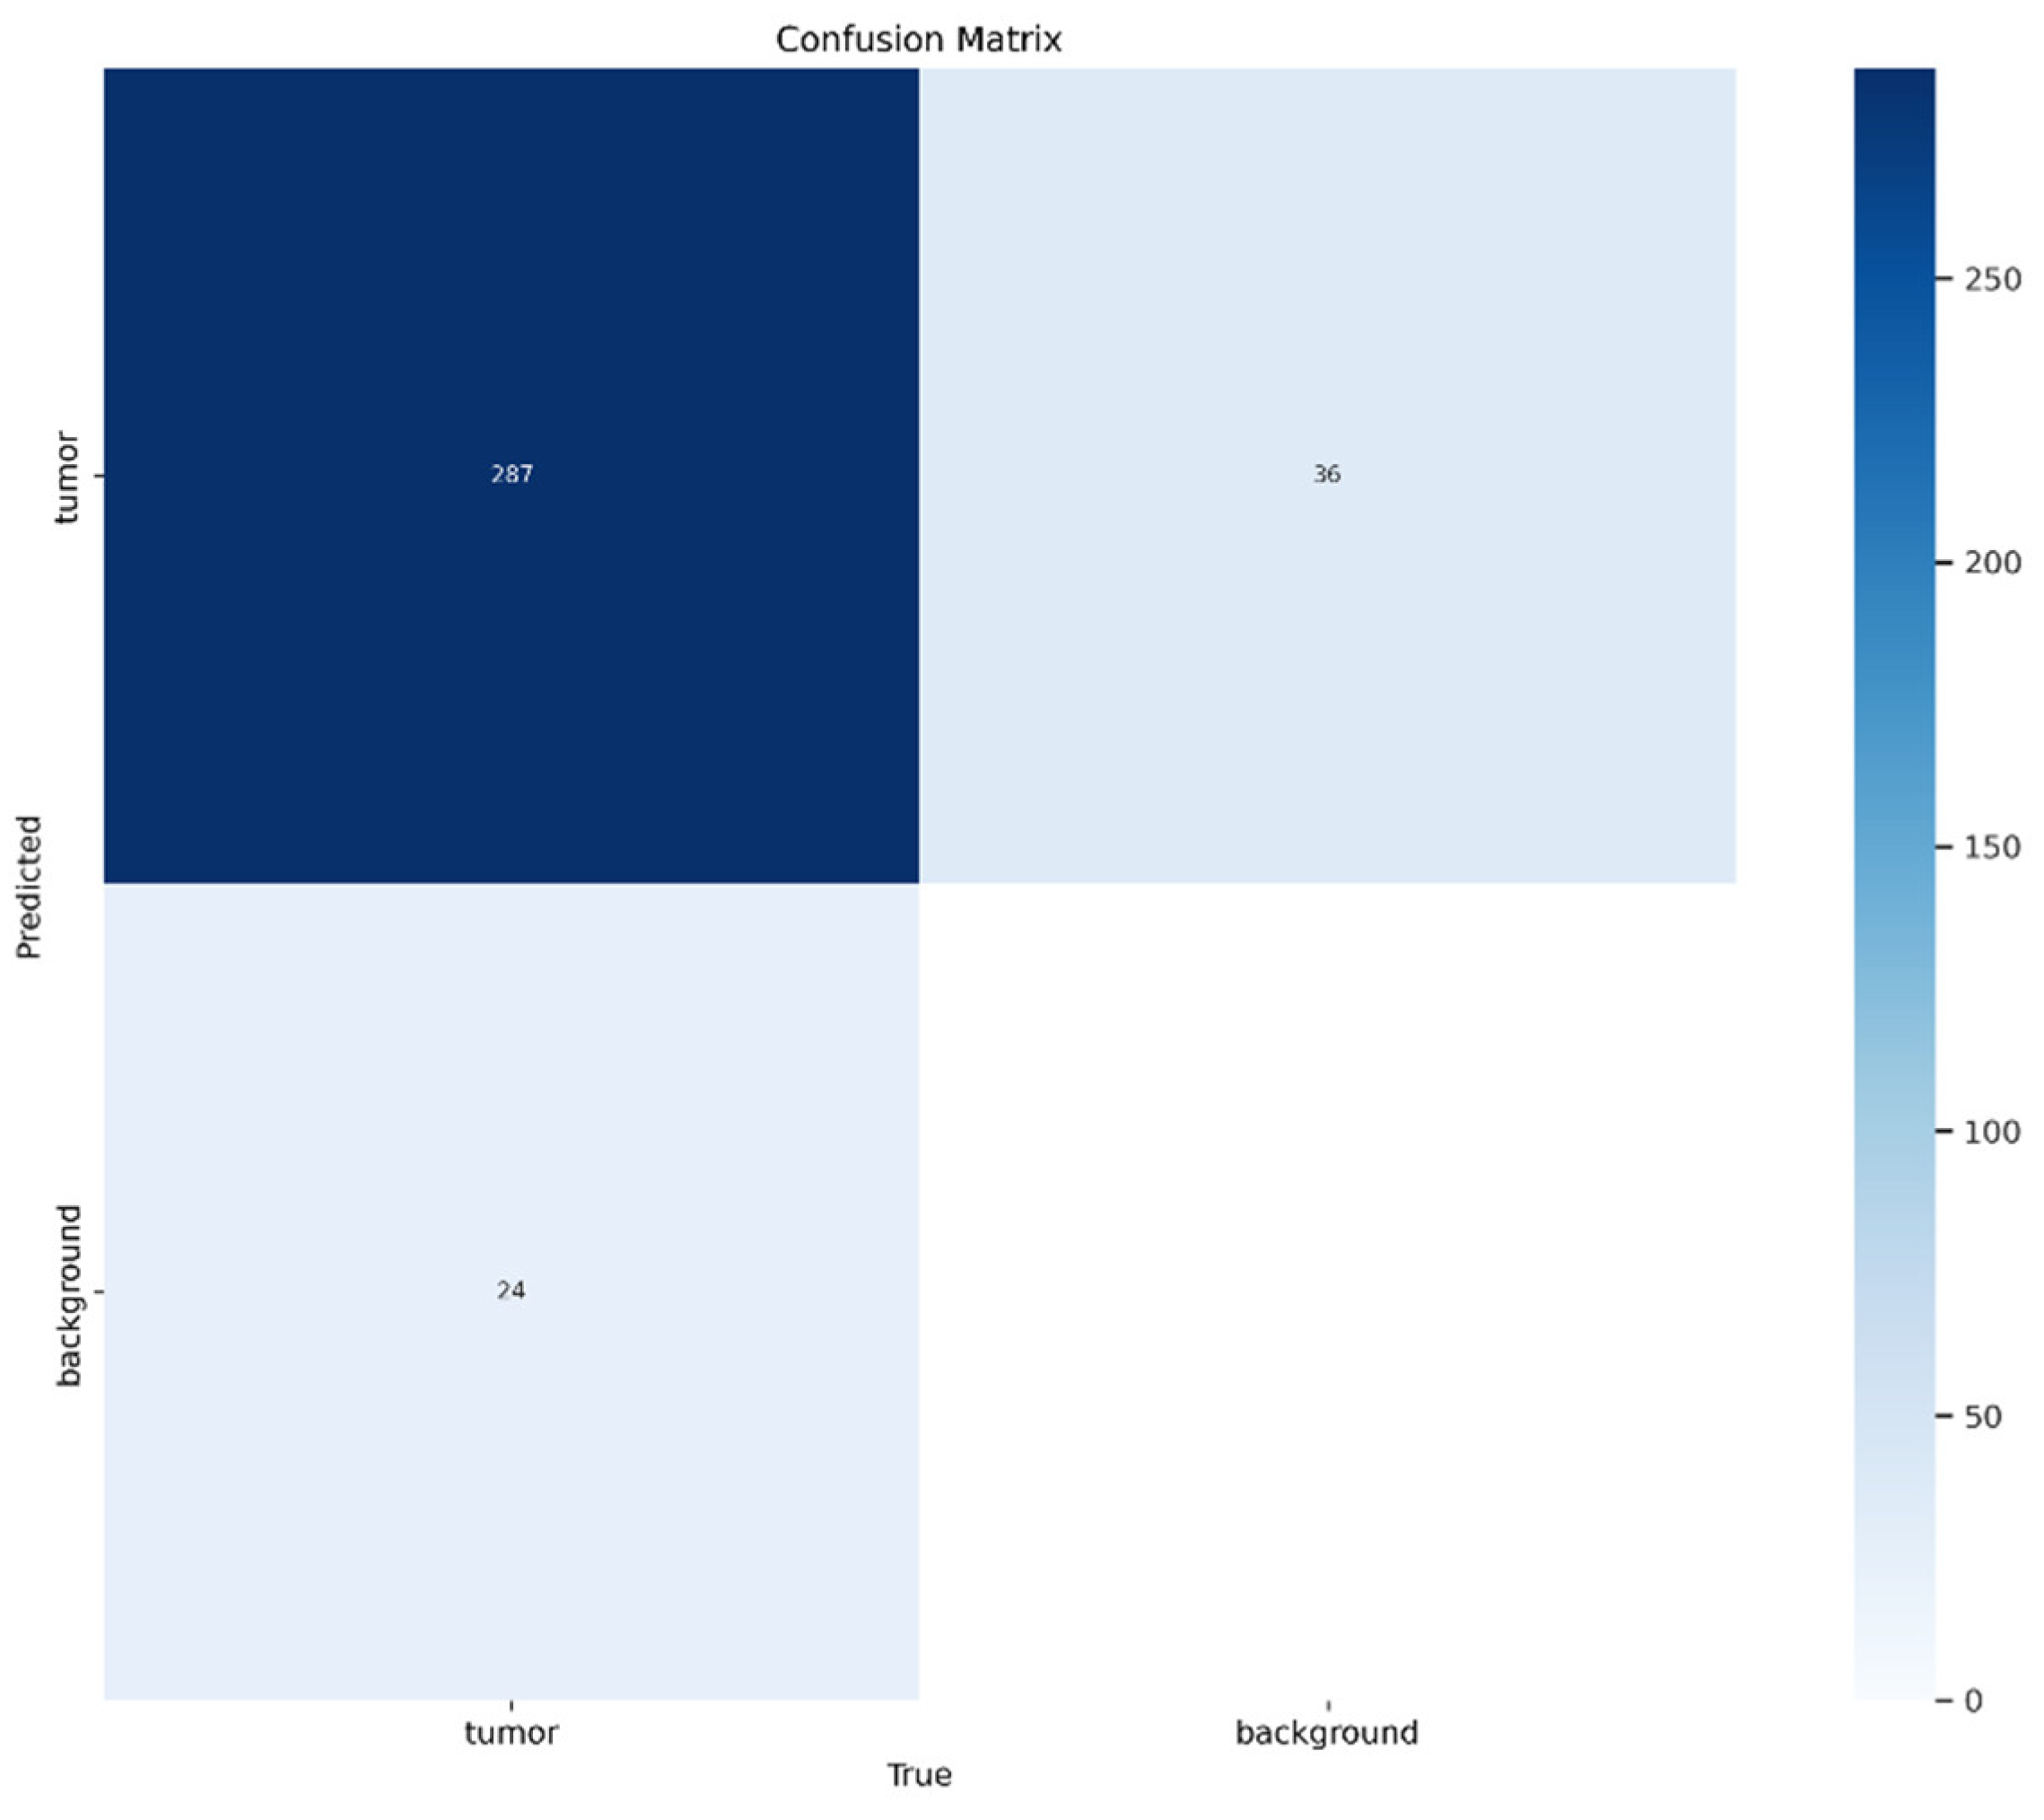
Figure 6.
Predictions examples.
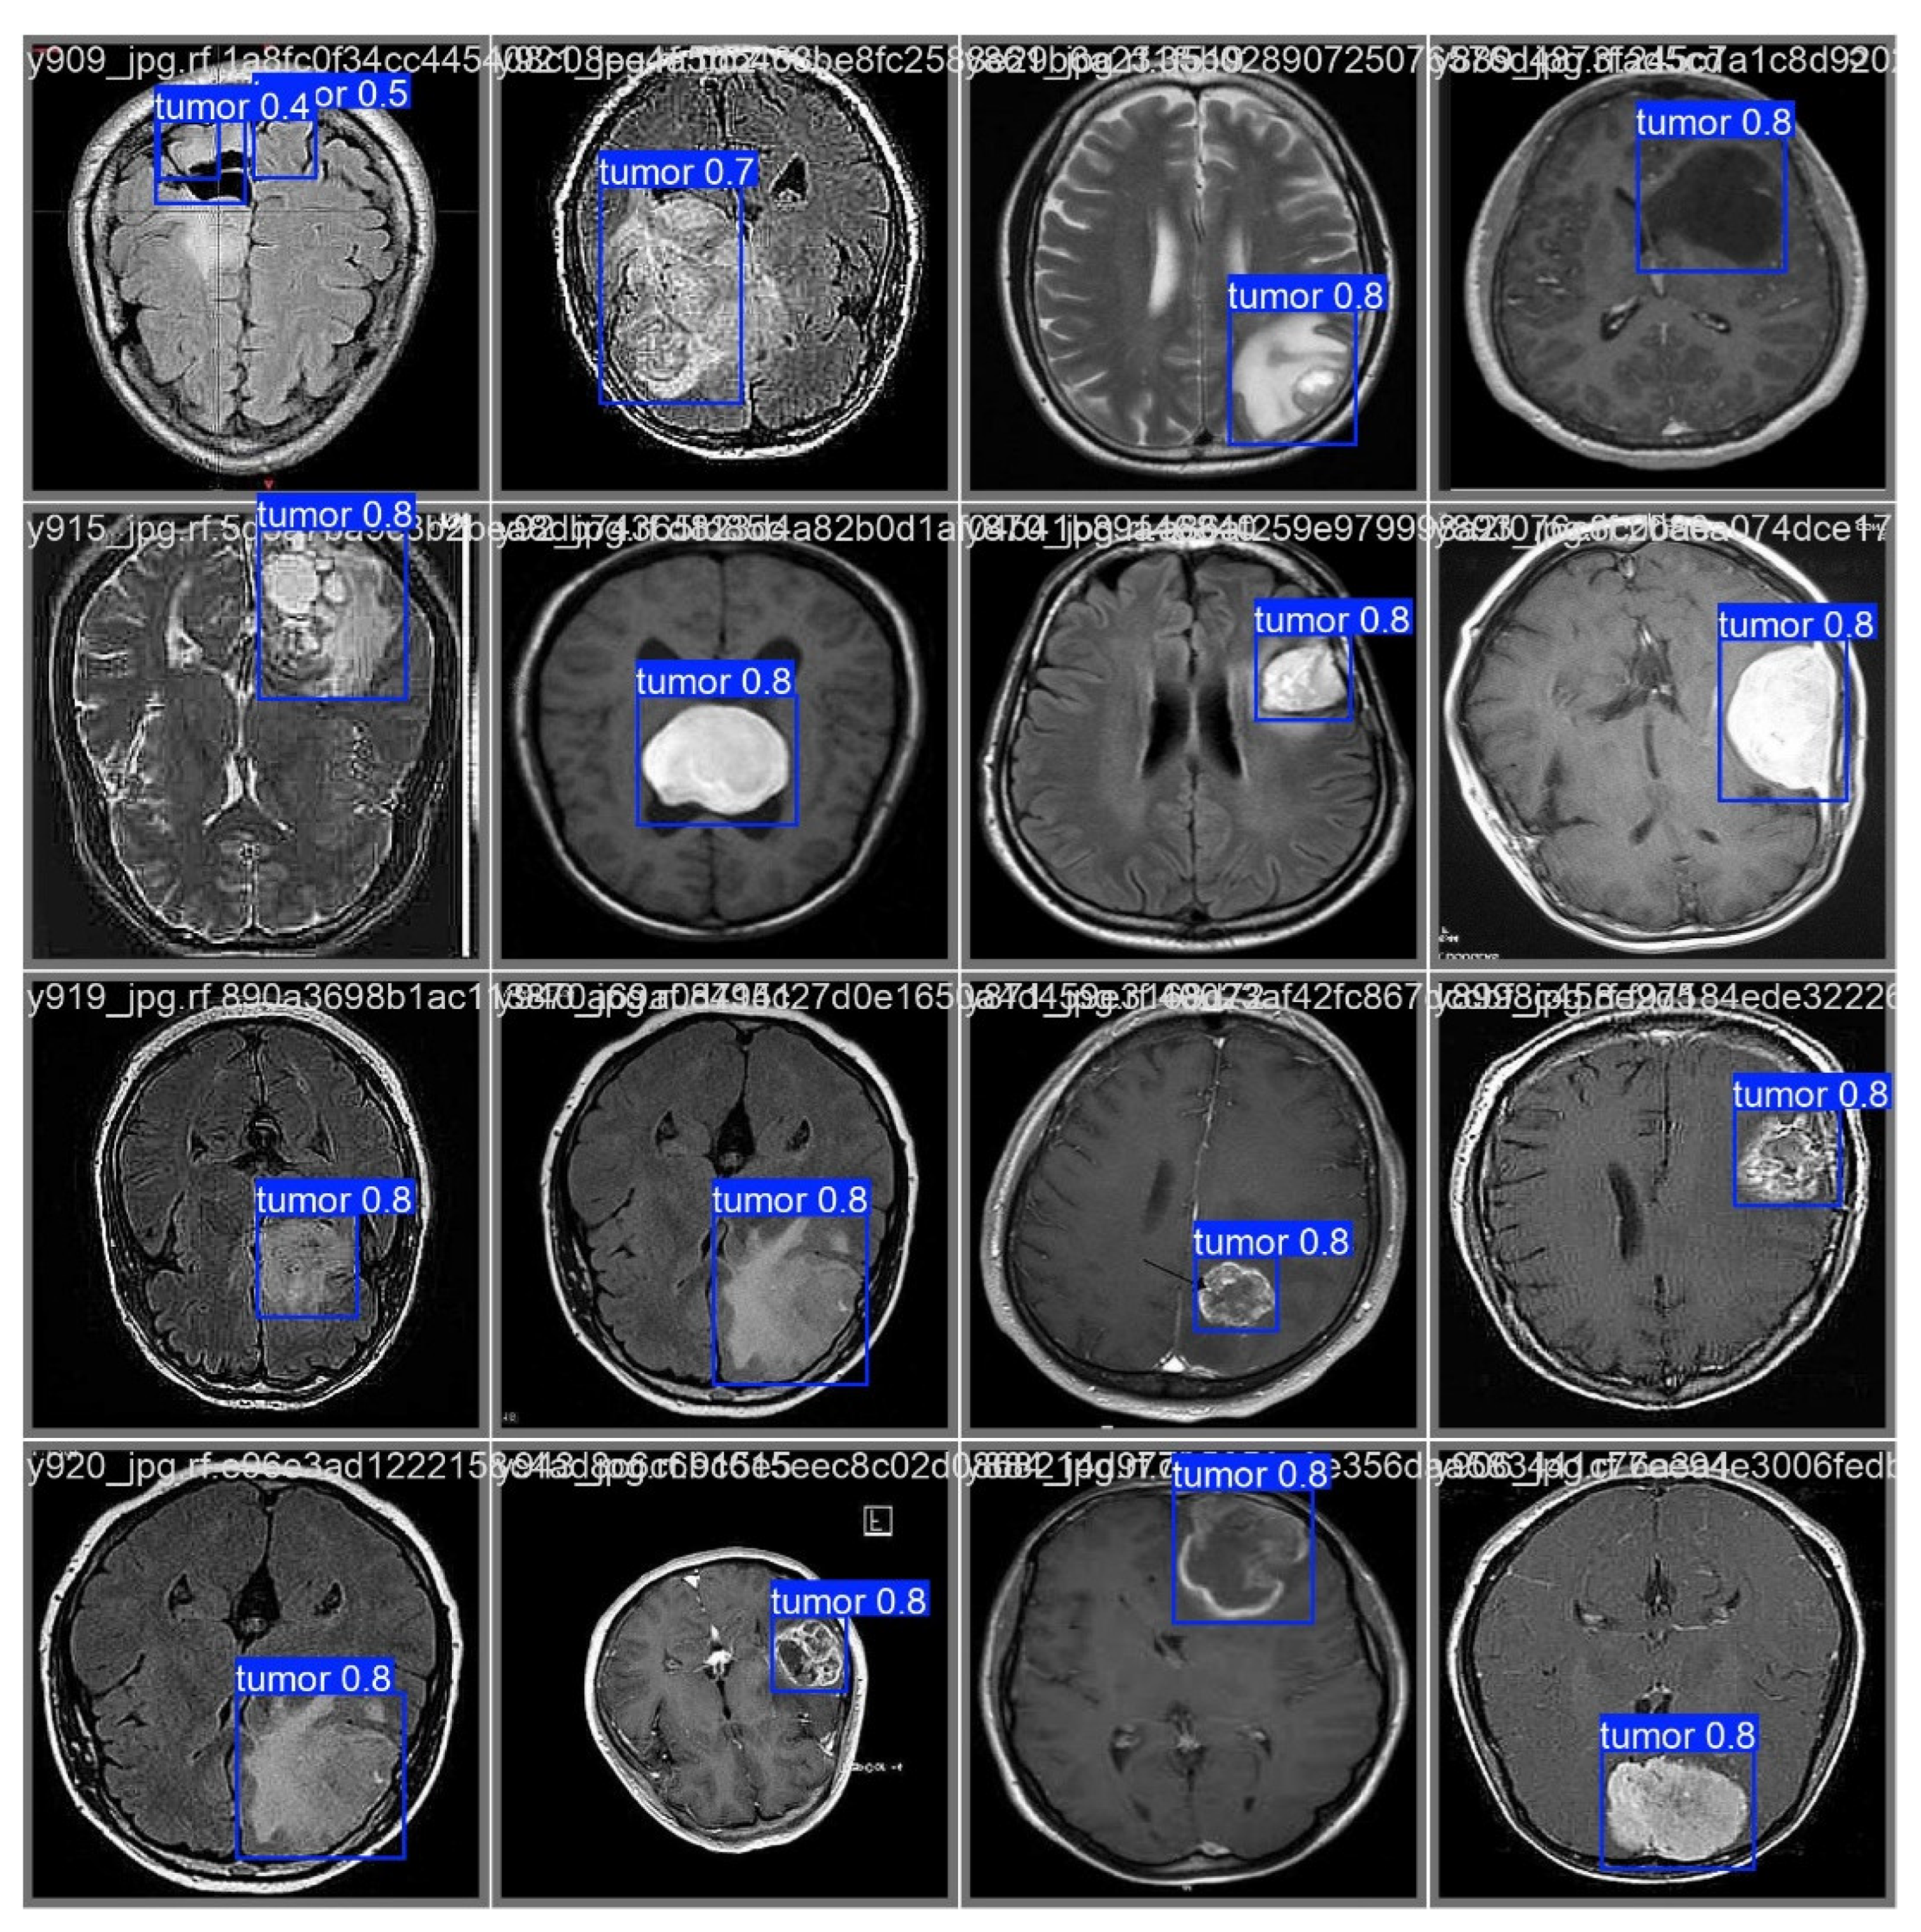

Table 1.
Summary of model execution.
| Clases | Images | Instances | Precisión | Recall | mAP50 | mAP50-95 |
|---|---|---|---|---|---|---|
| Todas | 299 | 311 | 0.958 | 0.884 | 0.949 | 0.59 |
Disclaimer/Publisher’s Note: The statements, opinions and data contained in all publications are solely those of the individual author(s) and contributor(s) and not of MDPI and/or the editor(s). MDPI and/or the editor(s) disclaim responsibility for any injury to people or property resulting from any ideas, methods, instructions or products referred to in the content. |
© 2025 by the authors. Licensee MDPI, Basel, Switzerland. This article is an open access article distributed under the terms and conditions of the Creative Commons Attribution (CC BY) license (http://creativecommons.org/licenses/by/4.0/).
Copyright: This open access article is published under a Creative Commons CC BY 4.0 license, which permit the free download, distribution, and reuse, provided that the author and preprint are cited in any reuse.


