
Submitted:
14 February 2025
Posted:
18 February 2025
You are already at the latest version
Abstract
Durum and bread wheat are widely planted cereal crops that contribute immensely to global food security. To maintain and improve on crop yields, fertilizers are applied including nitrogenous fertilizers. However, there is limited research focusing on the effect of nitrogen application rate on observed and estimated durum and bread wheat yields in dryland environments. This study investigated the application of unmanned aerial vehicle (UAV) multispectral bands and vegetation indices using artificial neural networks (ANN) and multiple linear regression (MLR) models to estimate yields of durum and bread under different nitrogen fertilizer application rates. The ratio vegetation index (r = 0.29; P < 0.05) and normalized difference vegetation index (r = 0.26; P < 0.05) showed a low, but significant correlation with bread yield under 48 kg/ha nitrogen application. The ANN model outperformed MLR for yield prediction under all nitrogen rates and produced highest accuracy of R² = 0.7753, RMSE = 0.0825 t/ha under 24 kg/ha nitrogen application for durum. The key findings from this study highlight that UAV datasets and ANN models can be used to predict durum and bread yields in real-time which is beneficial for crop nutrient management. The methods from this study should be explored with more robust machine learning and larger datasets for optimal crop yield estimation.
Keywords:
wheat yield
; unmanned aerial vehicle
; vegetation indices
; artificial neural networks
; multiple linear regression
1. Introduction
Crop yield is the measure of the average net output of agricultural product on a given area of land and it is a critical metric for assessing agricultural performance (Fischer, 2015). Crop yields are influenced by biotic factors including genetic parameters of seeds, and abiotic factors including rainfall and temperature, socioeconomic conditions, and agronomic practices (Tandzi and Mutengwa, 2020). Wheat, one of the most cultivated crops in the world, continues to experience production and yield fluctuations caused by several interacting factors (Saeed et al. 2015). Yield reductions are affected by abiotic factors such as high temperatures (Shew et al. 2020) and yield potential is compromised by certain traits that have been bred out of hybrids. Hybrids are more susceptible to new strains of disease-causing organisms, exaggerated by the changing environment (Rauf et al. 2015). Due to breeding, yield stability is reduced (Calderini and Slafer, 1999), however attempts are being made to reintroduce the genetic variability from landraces (Adhikari et al. 2022).
In the face of the global increase in food demand, due to rapid human population growth, crop yields need to be significantly improved. Hence, crop yield estimation remains a research hot topic (De Beer 2022; Fischer 2015; Tandzi and Mutengwa, 2020). Accurate estimation of crop yields can help identify areas that need improvement, such as seed breeding, agronomic practices and climate adaptation, amongst other yield-determinants (Reynolds et al., 2015).
Different yield estimation methods have been investigated and operationalized. These methods include field surveys, crop physical models, empirical models, and remote sensing (Paudel et al., 2021). Field surveys are physical estimates of the yield of a field or farm that is conducted by a farmer to estimate the potential yield for insurance and food security purposes. The method followed is to harvest the ears for a predetermined row length and estimate the yield by considering the intra row spacing. The limitation is grain moisture content, as it determines the seed density, which in turn will affect the estimated yield (Benson & Fermont 2011; Tandzi and Mutengwa, 2020). Crop physical models describe the process of crop growth and development as a function of weather, soil conditions and crop management. The limitations include the models’ parameters, accuracy to predict weather conditions and the plants physical growth. Empirical models (models of land use and land-use change) are critical for testing theories of land use and informing policies aimed at managing land-use change. Empirical models have been used to identify the causes of a particular distribution of land use and the factors that drive land-use change. For example, these models can be used to test the extent to which net returns to alternative uses and physical characteristics of land (i.e., land quality) influence land-use decisions (Plantinga & Irwin, 2006).
Crop yield estimation based on ground field surveys are generally destructive to crops, costly, inconvenient and inefficient to operate on large-scale farms (Reynolds, et al., 2000; Zeng et al., 2021; Bian et al., 2022). Moreover, meteorological and growth-based models need a lot of historical data to support yield predictions which is not always available for small scale farms (Yu et al., 2024). In general, crop growth yield models have been limited by spatial information about field conditions in real-time (Kasampalis et al., 2018). However, remote sensing-based models have been successfully used to calculate crop yield effectively and accurately in real-time. Furthermore, remote sensing methods are non-destructive and applicable to large-scale crop yield predictions (Ren et al., 2008).
The remote sensing platforms are based on ground, low and high-altitude mounted sensors. Analytical spectral devices (ASD), LabSpec spectrometer and FieldSpec spectroradiometers are ground remote sensing sensors that have high spectral resolution and multiple bands to characterize high-throughput phenotyping in crops and predict yield (Mishra, 2021; Feng et al., 2022; Silva et al., 2023). High altitude remote sensing is based on satellites and aerospace. This includes Advanced Very High-Resolution Radiometer (AVHRR), Moderate Resolution Imaging Spectroradiometer (MODIS), Landsat, and Sentinel satellites that have low-medium resolutions. Furthermore, these satellites are suitable for monitoring crop biophysical parameters at large-scale. However, their application is limited by bad weather conditions, longer revisit times and are unreliable for small-scale farms. Low altitude remote sensing is based on Unmanned Aircraft Systems (UASs) such as Unmanned Aerial Vehicles (UAVs) or drones. The adoption of remote sensing application of low altitude UAVs in agriculture has been increasing to monitor field crop biophysical and biochemical parameters (Lu et al., 2018; Pazhanivelan et al., 2023; Chiu et al., 2024). UAVs are flexible to operate and offer higher spectral resolutions with customized revisit time. These attributes have made low altitude remote sensing overcome limitations associated with high altitude remote sensing and ground based remote sensing, thereby making it a promising option for precision agriculture technology (Li et al., 2012; Zhang et al., 2021).
Several vegetation indices, machine learning and statistical regressions have been investigated for crop yield prediction using UAV datasets and have achieved satisfactory accuracy. For instance, normalized difference red edge (NDRE) dynamic model produced more than 90% accuracy for rice grain yield estimation using active portable sensor RapidScan CS-45 Spectral reflectance data (Zhang et al., 2019). The wide dynamic range vegetation index (WDRVI) has produced 92–96% estimation accuracy for corn grain yield using multispectral and red–green–blue (RGB) UAV datasets (Maresma et al., 2016; García-Martínez et al., 2020; Ramos et al., 2020). Random forest (RF) has attained 78% accuracy for wheat yield estimation using combined UAV multispectral datasets for jointing, heading, flowering, and filling growth stage (Fu et al., 2020). The ensemble learning framework of support vector machine (SVM), Gaussian process (GP), ridge regression (RR) and RF have attained 63% of wheat grain yield prediction accuracy based on UAV multispectral datasets at mid-grain filling stages (Fei et al., 2021). Green–red vegetation index (GRVI) has produced 93% of wheat yield prediction using UAV RGB imagery at the flowering stage under different levels of nitrogen fertiliser application (Zeng et al., 2021). Gaussian process regression (GPR) has achieved 88% of field-scale wheat yield prediction using UAV multispectral derived vegetation indices that has extremely strong correlations with yield from flowering and filling growth stages (Bian et al., 2022). The multiple linear regression (MLR) model has achieved 84% accuracy of winter wheat yield estimation using UAV-based hyperspectral data from all growth stages (Liu et al., 2023). Also, the Random Forest (RF) has demonstrated 88% accuracy for durum wheat yield on UAV multispectral vegetation indices under the mediterranean basin in Italy (Badagliacca et al., 2023). These findings have shown comprehensive feasibility of UAVs to monitor crop yield and other crop parameters in agricultural remote sensing. Crop type and growth conditions are complex, which necessitates monitoring of crop yields for different cultivars and conditions.
Bread is the most cultivated wheat across the world and susceptible to hot dry conditions. Durum wheat is more drought tolerant and resilient to the hot dry conditions (Hassan et al., 2018). Nitrogen is a dynamic element, but still vital to healthy plant growth. Nitrogen is an important plant nutrient, applied as a fertilizer, but with crops having a low nitrogen use efficiency of about 33%, resulting in leaching, run-off and volatilization, with associated negative effects on the environment (Dimkpa et al. 2020). A trial was conducted with two low nitrogen application rates to determine the wheat varieties that have a high nitrogen use efficiency. Using UAV data with different indices provide useful reflectance information about crop biophysical parameters to estimate yield (Gitelson et al. 2003, and Gitelson et al. 2005).
The impact of low nitrogen application rate on bread and durum wheat yields is not well documented and understood within dryland environments. This information is critical for breeding programs aiming to maximize wheat yields while reducing nitrogen input. Therefore, it is important to investigate both bread and durum wheat yield estimation from dryland production regions. Furthermore, assessment of the impact of nitrogen fertiliser application on wheat yield and its estimation is essential. In this study, the field-scale bread and durum wheat yield were predicted under different nitrogen fertiliser application rates (N = 28 kg/ha and 48 kg/ha) from UAV multispectral datasets using artificial neural networks (ANN) and MLR. The vegetation indices and raw bands were extracted from processed UAV imagery and correlated with yield data. The ANN and MLR models were trained using multiple vegetation indices and raw band datasets. Other studies have shown the efficiency of MLR and ANN to handle both linear and nonlinear datasets for estimating crop yield (García-Martínez et al., 2020; Liu et al., 2023). The originality of the study focuses on examining and comparing the impact of low nitrogen application rates on field-scale bread and durum wheat yield estimates under dryland environments.
2. Materials and Methods
2.1. Study Area
The study was conducted on the ARC – Brits research farm (-25.3748 E, 27.5897 S) situated in the Northwest province of South Africa (Figure 1A & B). Brits research farm receives, on average, 360 mm rainfall annually. The minimum and maximum temperatures in the summer season are 17 and 31 °C, respectively. During winter, temperatures range between 3 and 21 °C (ARC-ISCW, 2004). Durum and bread wheat were planted on Brits research farm. The trial layout was designed in a randomized block design (RBD) (Liu et al., 2023). The experimental RBD was planted with 10 bread and 10 durum wheat varieties (Table C1), with a split-plot following a treatment design (Figure 1C). The trial was divided by a high and low nitrogen treatment and sub-plots bread or durum. Each wheat type had different European wheat varieties planted randomly in the sub-plots. The wheat varieties were planted in 5.6 m by 1.4 m plots with a 0.5 m space between plots and 1.2 m between blocks. After planting, white 20% shade net was placed over the plots to prevent birds from eating the wheat seeds. The shade netting was removed post germination. The bread and durum seeds were planted in triplicate with high (48 kg N ha-1) and low (24 kg N ha-1) nitrogen application at tillering and flowering stages. Table 1 shows the planted bread and durum wheat varieties.
Figure 2 shows the average rainfall and temperatures received by Brits research farm monthly in 2023. This meteorological data was provided by the Agricultural Research Council (ARC) from the Amalgamated Beverages Industry (ABI) weather station located at Beestekraal near Brits. The research farm experienced high temperatures during summer months and relatively high rainfall particularly in February and December 2023. However, average temperatures dropped below 20 °C in winter with low levels of rainfall. The month of August had zero rainfall which corresponded with the planned UAV flights.
2.2. UAV Field Data Collection and Data Processing
The UAV data was collected in August 2023 during the flowering/heading growth stage. The flight was planned at 60 m altitude, and both frontal and lateral overlaps at 75%. The UAV was operated under moderate wind speed and clear sky conditions, acquiring fine spatial resolution images of 8 cm. The collected UAV imagery data was processed following standard procedures in Pix4Dmapper software 4.8.0 version (Pix4D SA, Lausanne, Switzerland).
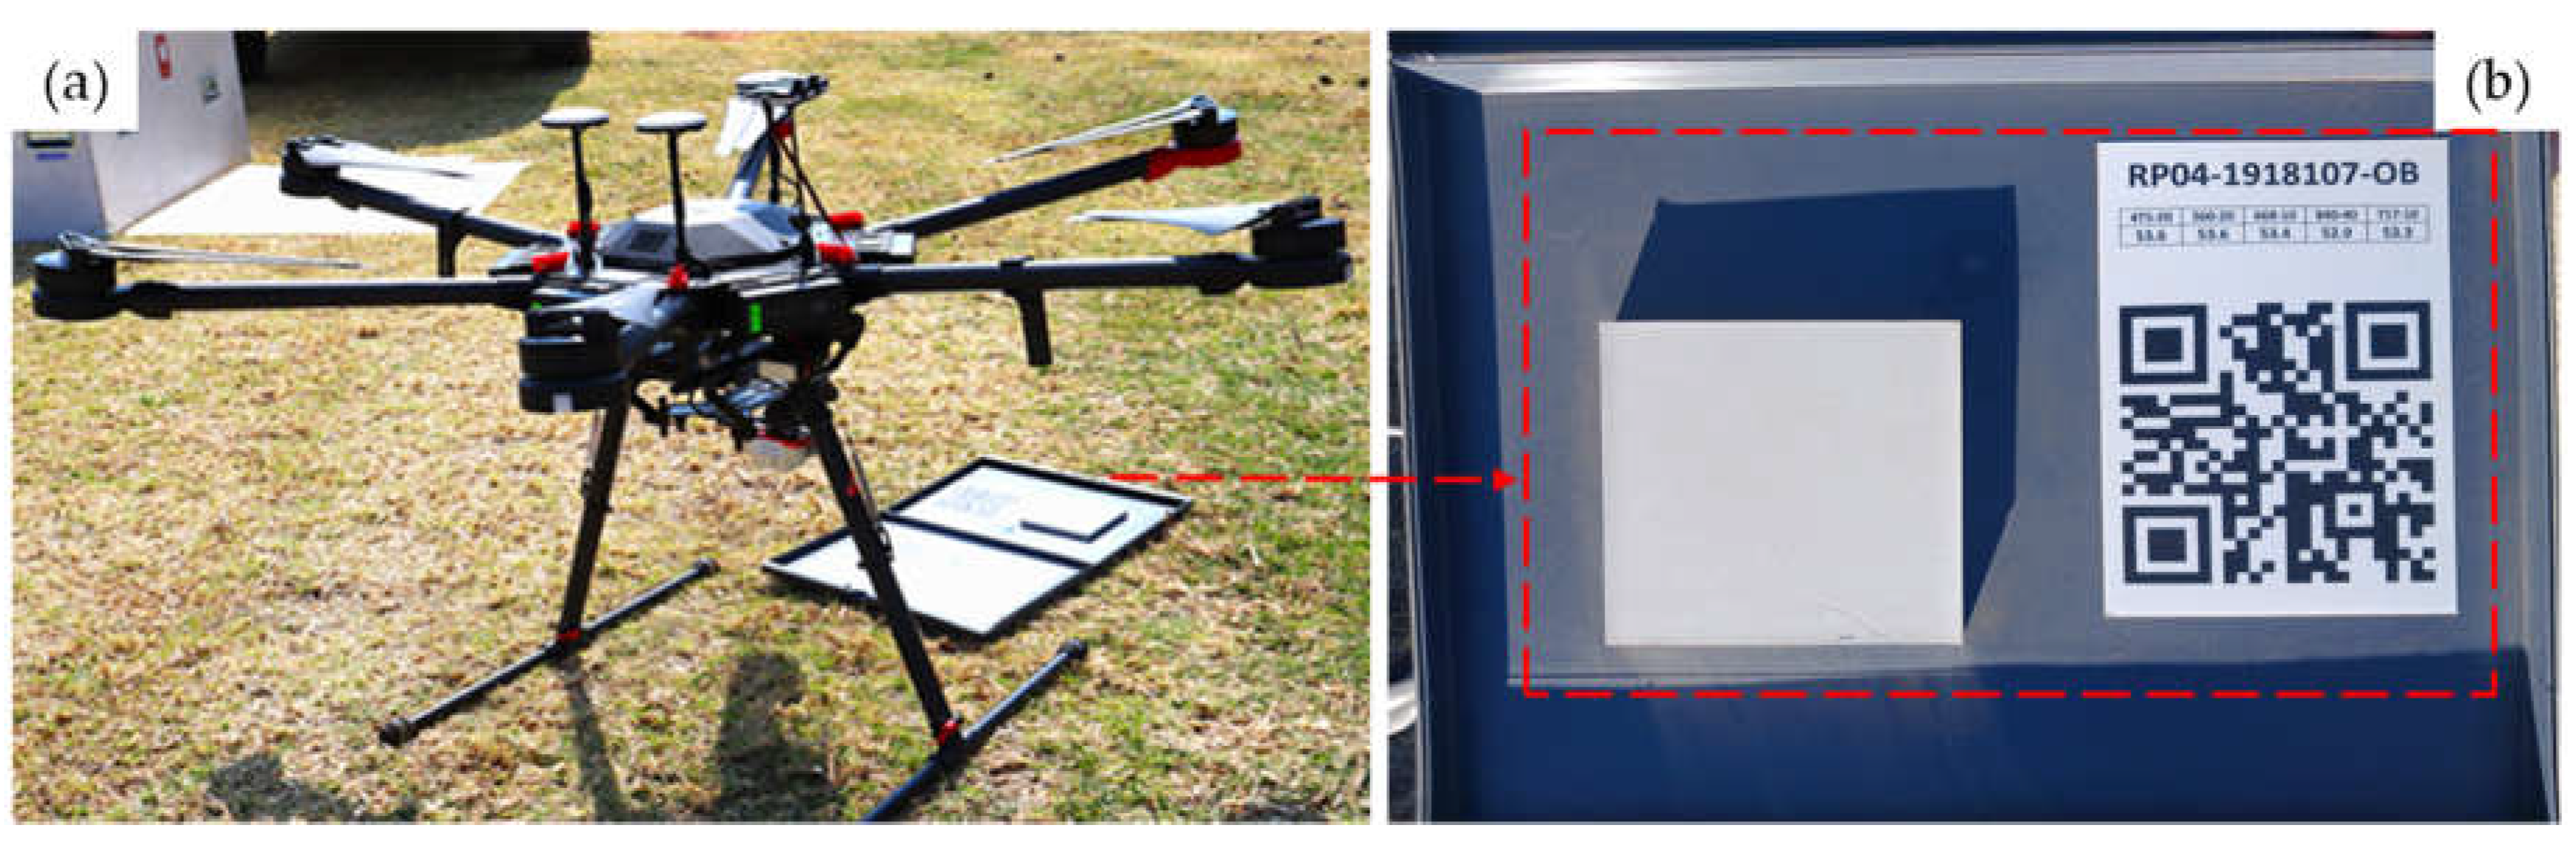
The multi-rotor system of UAV DJI-Matrice 600 Pro with a MicaSense RedEdge-MX multispectral sensor and calibration reflectance panel (CRP) with serial number: RP04-1918107-OB are shown in Figure 2 a and b, respectively. Additionally, Table 2 describes the wavelength (475–840 nm) and bandwidth (20–40 nm) of UAV MicaSense RedEdge-MX sensor.
Figure 2.
Multi-rotor DJI-Matrice 600 Pro UAV (a) and Calibration Reflectance Panel (b).
2.3. Summary of Wheat Yield Data
A total of 120 crop yield samples were collected from subplots under the two nitrogen application rates during the harvest period. Table 2 summarises the durum and bread wheat yield under the two nitrogen fertilizer application rates. Each subplot had three replicate subsamples, which were averaged to get a representative subplot yield. Durum yield increased from 0.67 to 0.73 ton per hectare (t/ha) under 24 kg/ha and 48 kg/ha nitrogen application, respectively. Additionally, bread yield increased from 0.74 to 0.85 t/ha as well under the same nitrogen application rate.
2.4. Selected Spectral Vegetation Indices
Spectral vegetation indices have been widely used to predict wheat yields (Zeng et al., 2021; Bian et al., 2022; Badagliacca et al., 2023; Yu et al., 2024). Table 4 provides the list of selected spectral bands and indices considered for wheat yield estimation in this study.

Table 3.
Summary of selected spectral vegetation indices.
| Vegetation indices | Equation | Reference |
| Normalized Difference Vegetation Index (NDVI) | Rouse et al., 1974 | |
| Normalized Difference RedEdge Index (NDRE) | Barnes et al., 2000 | |
| Green normalized difference vegetation index (GNDVI) | Gitelson et al., 2003 | |
| Green – Blue vegetation index (GBVI) | Hunt et al., 2005 | |
| Difference Vegetation Index (DVI) | G – B | Kawashima et al., 1998 |
| Red-edge difference vegetation index (REDVI) | NIR –RE | |
| Modified Triangular Vegetation Index (MTVI) | 1.2 * [1.2 (NIR – G) – 2.5 (R – G)] | Haboudane et al., 2004 |
| Ratio Vegetation Index (RVI) | Jordan et al., 1969 | |
| Red-edge ratio vegetation index (RERVI) | Vogelmann et al., 1993 | |
| Green Ratio Vegetation Index (GRVI) | Sripada et al., 2006;Zenget al., 2021 | |
| Chlorophyll Vegetation Index (CVI) | Vincini et al., 2011 | |
| Wide dynamic range vegetation index (WDRVI) * | Gitelson et al., 2004 | |
| Enhanced vegetation index 2 (EVI 2) | Jiang et al., 2008 | |
| Red Blue ratio index (RBRI) | Sellaro et al., 2010 | |
| Modified chlorophyll absorption in reflectance index (MCARI) | Daughtry et al., 2000 | |
| Optimized Soil adjusted vegetation index (OSAVI) | Steven et al., 1998; Yue et al., 2019 | |
| Modified Chlorophyll Absorption Ratio Index (MCARI 2) | Haboudane et al., 2004 | |
| Green Normalized Difference RedEdge Index (GNDRE) | Cao et al., 2021 | |
| Red Edge Triangulated Vegetation Index (RTVI) | 100 (NIR – RE) –10 (NIR – G) | Chen et al., 2010 |
| Soil adjusted vegetation index (SAVI) | Rondeaux et al., 1996 | |
| Soil adjusted vegetation index (RESAVI) | Sripada et al., 2006 | |
| Excess green index (EXG) | 2 x G – R – B | Woebbecke et al., 1995 |
| Renormalized Difference Vegetation Index (RDVI) | Roujean et al., 1995 | |
| Green chlorophyll index (GCI) | Gitelson et al., 2005 | |
| Chlorophyll Index Red Edge (CIRE) | Gitelson et al., 2005 |
*, B = Blue, G= Green, R= Red, NIR= Near Infrared, RE = Red Edge
2.5. Pearson Correlation Calculation
R-software (version 4.3.3) was used to calculate Pearson’s correlation coefficients (R) between crop yield, spectral bands and indices. The R coefficient is useful in determining the relationship between response and predictor variables. Pearson’s correlation coefficient is calculated according to equation 1.
The r denotes the correlation coefficient, n is the number of samples, and signify the sample values, and are the average values of the sample datasets. The higher the value of r means high correlation between x and y.
2.6. Nonlinear and Linear Regression Models
2.6.1. Multivariable Linear Regression
Multivariable Linear Regression (MLR) is a regression technique that explains the goodness of fit between one dependent variable and two or more independent variables. This study relates wheat yield with multiple vegetation indices. MLR usually performs better than linear regression. MLR in this study was used to construct wheat yield prediction models of vegetation indices and validate the prediction accuracy. The MRL was calculated using equation 2 (Fu et al., 2020).
Where Y = yield, is assigned to vegetation indices and is the coefficient of the corresponding independent variable.
2.6.2. Artificial Neural Networks
Artificial Neural Networks (ANN) is made up of the interconnected mathematical functions which imitate biological neural networks to understand nonlinear relationships (Mas et al., 2008; Jensen et al., 2009; Rossel et al., 2010). ANN can process large and complex datasets for statistical modelling due to its robust learning capacity. ANN has three layers with logistic regression to process information from input, hidden and output layer. In the ANN, this study used a sigmoid activation function hyper-parameter (Fu et al., 2020). Figure 3 shows the basic ANN self-organizing structure.
Figure 4 demonstrates the flowchart methods executed in this study. The UAV multispectral bands and computed vegetation indices were used for supervised learning of MLR and ANN regression modelling to estimate durum and bread wheat yield within MATLAB R2024a environment (The Mathworks ® nc., Natick, MA, USA). The modelling datasets were separated into 70% training, 15% validation and 15% testing.
2.8. Model Evaluation
The two-layered feedforward neural network with sigmoid hidden neurons, linear output and using error back propagation-Levenberg-Marquardt (BP-LM) algorithm was applied for ANN regression modelling wheat yield estimation. The ANN modelling performance was evaluated using mean square errors (MSE), Root mean square error (RMSE) and coefficient of determination (R²) equations as summarized below from 3 to 5:
where y and represent the measured and estimated values, respectively and n is the number of datasets of samples.
3. Results
3.1. Wheat Yields Descriptive Statistics
Descriptive statistics analysis of the dry weight measurements of wheat yields is summarised in Table 4 for both durum and bread varieties. Durum yield ranged from 0.04 to 1.58 gram per 1 m2 and bread yield ranged from 0.26 to 1.34 gram per 1 m2. Both durum and bread had higher mean yield values under 48 kg/ha nitrogen, which suggests the influence of nitrogen application on yield. Other features such as standard deviation (SD) and coefficient of variation (CV) varied in both wheat varieties.
Table 4.
Wheat yields (gram per 1 m2) descriptive statistics under two nitrogen fertilizer application rates (multiply by 10-2 for ton per ha).
Table 4.
Wheat yields (gram per 1 m2) descriptive statistics under two nitrogen fertilizer application rates (multiply by 10-2 for ton per ha).
| Nitrogen application rate (kg/ha) | Wheat variety | Number of samples | Min-imum | Max-imum | Mean | Standard Deviation (SD) | CV (%) |
| 48 | Durum | 30 | 0.04 | 1.58 | 0.73 | 0.32 | 43.84 |
| 24 | Durum | 30 | 0.34 | 1.07 | 0.67 | 0.16 | 23.88 |
| 48 | Bread | 30 | 0.34 | 1.34 | 0.85 | 0.23 | 27.06 |
| 24 | Bread | 30 | 0.26 | 1.32 | 0.74 | 0.24 | 32.43 |
3.2. Wheat Yield and UAV Datasets Correlation Matrix Analysis
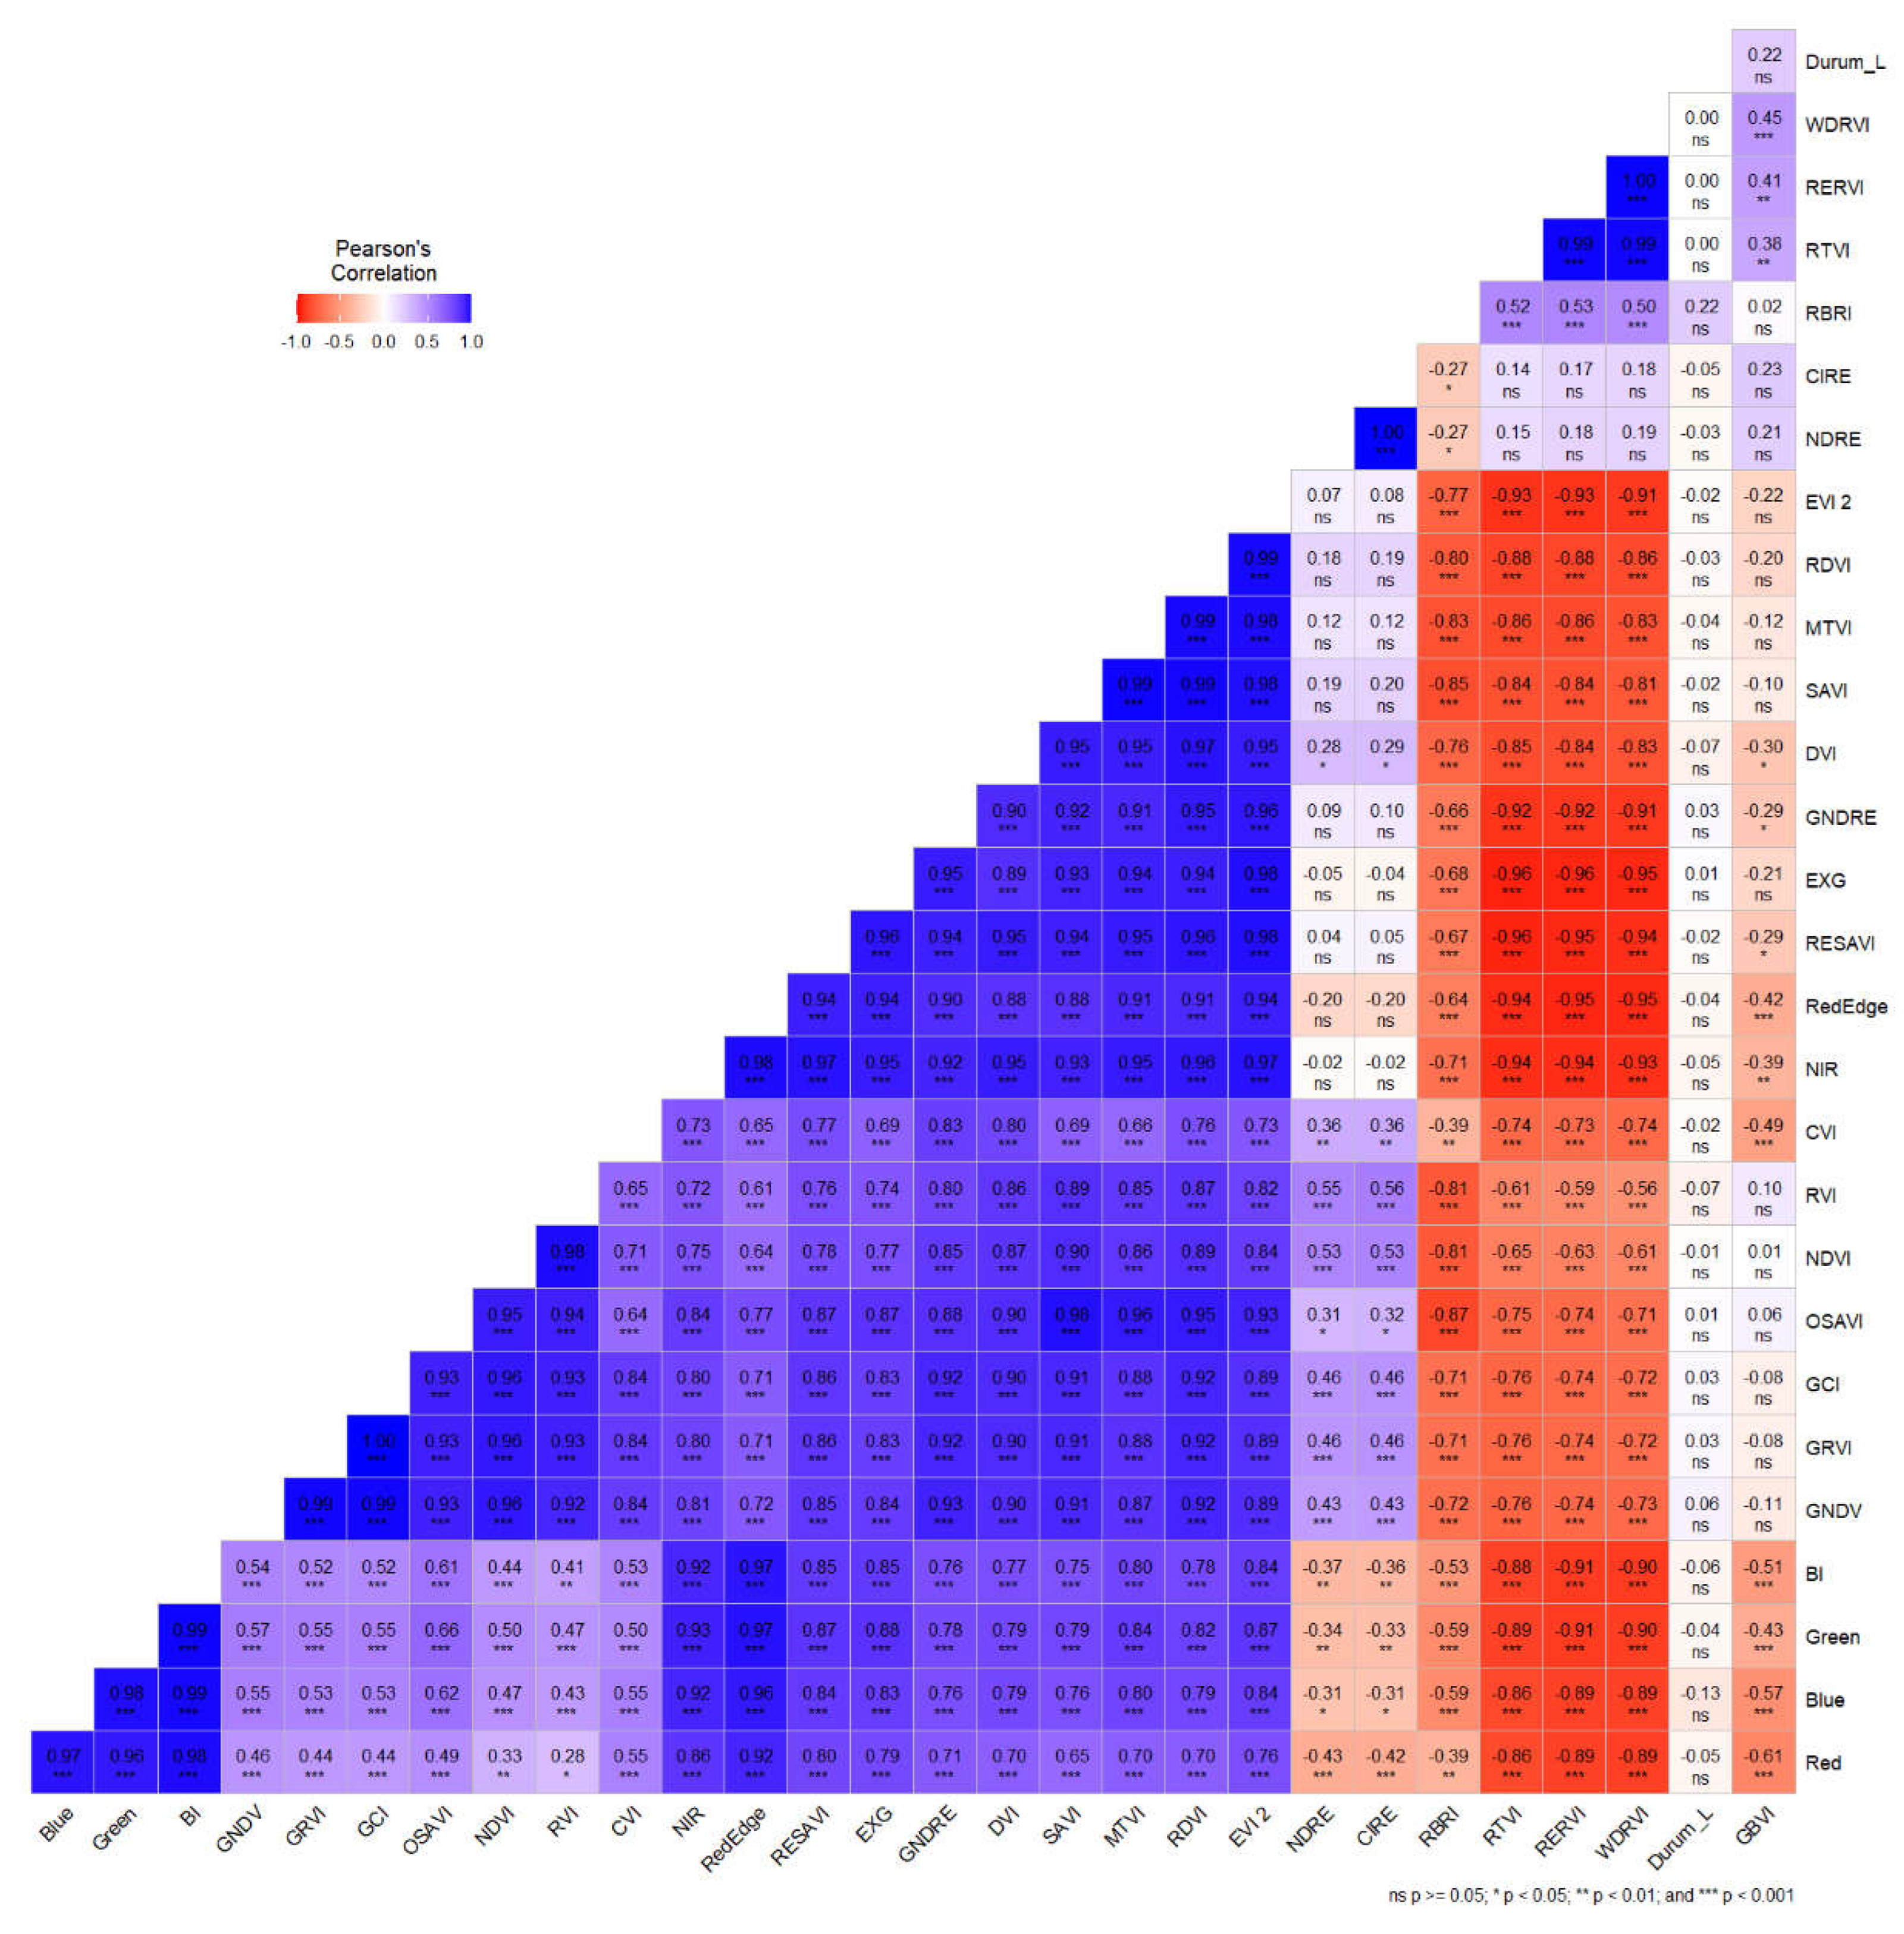
The study shows Pearson correlation matrix of durum and bread yield with multiple vegetation indices. The correlation matrix shows that only RVI (r = 0.29; P < 0.05) and NDVI (r = 0.26; P < 0.05) had a low but significant correlation with bread yield under 48 kg/ha nitrogen application at a 95% level (Figure A1). Additionally, the bread yield correlated positively with the following vegetation indices GNDRE, EXG, RESAVI, EVI 2, CVI, GNDVI, GRVI, GCI, DVI, OSAVI, RDVI, SAVI, MTVI, NDRE, CIRE, RTVI, WDRVI RBRI, NIR and RedEdge. These vegetation indices had insignificant correlation values ranging between r = 0.01– 0.22, P > 0.05. However, Figure A2 shows that durum yield had positive correlation with RBRI and GBVI (r = 0.22; P > 0.05) under 24 kg/ha nitrogen application. GNDRE (r = 0.03–0.19), GNDVI (r = 0.06–0.21) and RBRI (r = 0.12–0.22) had common weak positive correlation with both durum and bread yields, respectively.
3.3. Wheat Yield Estimation Model Performance
The ANN and MLR regression model performance statistics for wheat yield were calculated using multispectral UAV bands and vegetation indices. Table 5 and Table B1 provide a summary of ANN and MLR models under different nitrogen application rates. ANN produced higher accuracies (R² = 0.7753, RMSE = 0.0825) under 24 kg/ha nitrogen application in comparison to MLR (R² = 0.6441, RMSE = 0.1133) for durum yield prediction with training set of multispectral UAV datasets. Furthermore, ANN achieved higher accuracies (R² = 0.6303, RMSE = 0.1721) under 48 kg/ha nitrogen application in comparison to MLR (R² = 0.4609, RMSE = 0.1965) for bread yield estimation with training set of UAV datasets. The nitrogen application had minimal impact on durum yield ANN and MLR model estimation. While, increasing nitrogen application had positive impact on ANN and MLR estimation for bread yield.
Scatterplots were produced based on high training accuracy of ANN model for both durum and bread yield. The scatterplots show the multicollinearity between predicted and observed wheat durum and bread yield under 24 and 48 kg/ha nitrogen application rates, respectively (Figure 5). The data points grouped alongside regression line indicate a good agreement between predicted and observed yield values for ANN regression model using multispectral UAV datasets. ANN (R² = 0.7753, RMSE = 0.0825) training accuracy performed better than ANN (R² = 0.6303, RMSE = 0.1721) for durum and bread yield at a 95% confidence interval, respectively.
4. Discussion
The UAV multispectral bands and vegetation indices have been commonly used to estimate crop yield applying machine learning methods (Ramos et al., 2020; Paudel et al., 2021; Chiu et al., 2024). In this study, multiple vegetation indices calculated using UAV multispectral bands were examined using ANN and MLR models for field-scale durum and bread wheat yield prediction under different nitrogen fertilization rates. The study correlated vegetation indices, multispectral bands with both bread and durum wheat yields. The findings showed that UAV spectral band and vegetation indices datasets correlate with wheat yield which is consistent with previous studies. For instance, this study has demonstrated that RVI (r = 0.29; P < 0.05) and NDVI (r = 0.26; P < 0.05) had a weak positive and significant correlation with bread yield. Additionally, GNDRE (r = 0.03–0.19), GNDVI (r = 0.06–0.21) and RBRI (r = 0.12–0.22) had weak positive correlation with both durum and bread yields, respectively. The GCI had insignificant correlation (r = 0.22) with bread yield. Similar study findings have highlighted weak to strong positive correlation of GNDRE (r = 0.03–0.99), GNDVI (r = 0.04–0.99), RVI (r = 0.17–0.99), and RERVI (r = 0.01–0.99) with durum yield (Badagliacca et al., 2023). In contrast to our study, GNDVI, GCI and RVI (r = 0.86) were strongly and positively correlated with bread wheat (Hassan et al., 2018). Also, NDVI (r = 0.75; p < 0.0001) had strong positive and significant correlation with wheat grain yield from UAV multispectral data (Roy Choudhury et al., 2021).
Furthermore, RBRI (r = 0.8), RVI (r = 0.82), NDVI (r = 0.82) were found positive and strongly correlated with wheat yield (Bian et al., 2022). Traditionally, NDVI is the widely used index for crop yield estimation (Mashaba et al., 2017; Mirasi et al., 2021; Darra et al., 2023). Therefore, when more indices correlate with wheat yield, avenues are unlocked to use multiple indices for wheat yield estimation.
Several machine learning, deep learning and statistical models have been investigated simultaneously and independently to estimate crop yield with remote sensing data (Darra et al., 2023). The ANN (Fieuzal et al., 2017; Feng et al., 2022) and MLR (Zhou et al., 2017; Liu et a., 2023) have demonstrated their capacity to predict crop yield in previous studies. This study focused on investigating both ANN machine learning and MLR statistical model approach for wheat grain yield estimation under different nitrogen fertiliser rates. The findings showed that ANN outperformed the MLR models in all experiments for durum yield estimation under 24 kg/ha and 48 kg/ha nitrogen application. ANN model attained highest accuracy of R2 = 0.7753, RMSE = 0.0825 t/ha and MLR achieved R2 = 0.6441, RMSE = 0.1133 t/ha for durum yield estimation under 24 kg/ha nitrogen application. Furthermore, ANN obtained R2 = 0.6303, RMSE = 0.1721 t/ha and MLR achieved R2 = 0.4609, RMSE = 0.1965 t/ha accuracy for bread yield under 48 kg/ha nitrogen fertiliser rate. The poor performance of MLR modelling accuracy could be linked to multicollinearity. The nonlinear ANN is not affected by multicollinearity which may suggest the higher prediction accuracy (Chan et al., 2022). Furthermore, the results of this study showed that ANN and MLR model precision decreased for durum yield estimation when nitrogen fertiliser rate increased. This may suggest that higher nitrogen application of 48 kg/ha reduced durum yield. In contrast, the higher nitrogen application of 48 kg/ha improved the ANN and MLR model estimation accuracy for bread yield. For the APSIM model showed yield was more sensitive to variables that control water availability or variables that control nitrogen availability, depending on which was more limiting (Hao et al. 2021).
Similar trends were observed in this study as with previous studies for crop yield estimations. For instance, ANN outperformed MLR model for wheat and barley yield prediction using different datasets from arable farms of New Zealand and Iran, respectively (Safa et al., 2015; Mokarram et al., 2016). ANN has obtained slightly better wheat yield estimation accuracy of R2 = 0.77 in comparison to R2 = 0.75 of MLR model at the flowering stage in China (Fu et al., 2020). A similar study revealed that ANN model has achieved R2 = 0.62 for winter wheat yield estimation using UAV multispectral imagery in Japan (Zhou et al., 2021). The research conducted in sodic soil of northeastern Australia revealed that ANN have attained R2 = 0.74 –0.88 for wheat grain yield estimation from UAV multispectral and hyperspectral spectroradiometer datasets (Roy Choudhury et al., 2021). Other researchers have reported that ANN model has achieved R2 = 0.79 for winter wheat yield estimation at the filling growth stage in China. In contrast, MLR has attained R2 = 0.76 and R2 = 0.73 accuracy at the booting and heading stages for rice yield using multispectral and digital UAV imagery in China (Zhou et al., 2017). Furthermore, MLR has achieved r = 0.74 and r = 0.75 wheat yield estimation accuracy during the late flowering and ripening stage in southeastern Australia (Feng et al., 2020). Recently, MLR model has achieved r = 0.75, and r = 0.84, for winter wheat yield estimation using UAV multispectral and hyperspectral imagery, respectively (Liu et al., 2023). Other studies have demonstrated that ANN has better accuracy in comparison to MLR model for potato crop yield estimation in Tunisia and Poland (Abrougui et al., 2019; Piekutowska et al., 2021). The performance of ANN and MLR crop yield estimation accuracy varies in all regions. Therefore, it is important to estimate crop yield using more field measurements to validate these models and others.
Our study has demonstrated similar result trends as with other previous studies. However, it was limited to the local experimental farm results of Northwest province in South Africa which may suggest the lack of holistic findings. This warrants more crop yield research of similar and different environments for validation. In this study, MLR and ANN models were produced with a small number of yield samples which may have affected the estimation accuracies. Future research may consider more in-situ yield measurements and grey level co-occurrence matrix to increase dataset for robust modelling estimation. Data fusion of high-resolution sensors and ensemble learning approaches of multiple machine learning regressions should be explored which may enhance modelling prediction capacity. Further validation on different crops is required to strengthen remote sensing models on research on crop yield and guide policy decisions for crop breeding.
5. Conclusions
This study investigated UAV multispectral dataset using ANN and MLR models for bread and durum wheat yield estimation under two nitrogen fertiliser application rates. The results showed that UAV derived vegetation indices had weak positive correlation with both bread and durum wheat yield. The findings revealed that ANN outperformed MLR under all nitrogen application rates for bread and durum wheat. Additionally, findings revealed that the nonlinear model improved the accuracy of wheat yield estimation. Further, findings revealed that increasing nitrogen fertilization rate reduced durum yield prediction, while it improved the bread yield estimation. Moreover, findings revealed that UAV datasets and nonlinear models may predict crop yield in real-time and improve decision making in planting more tolerant wheat with minimal nitrogen application. The methods investigated in this study should be integrated with satellite datasets for medium to larger scale cropping area application in precision agriculture.
Appendix A
Figure A1.
Bread yield correlation with vegetation indices and raw bands under 48 kg/ha nitrogen application.
Figure A1.
Bread yield correlation with vegetation indices and raw bands under 48 kg/ha nitrogen application.
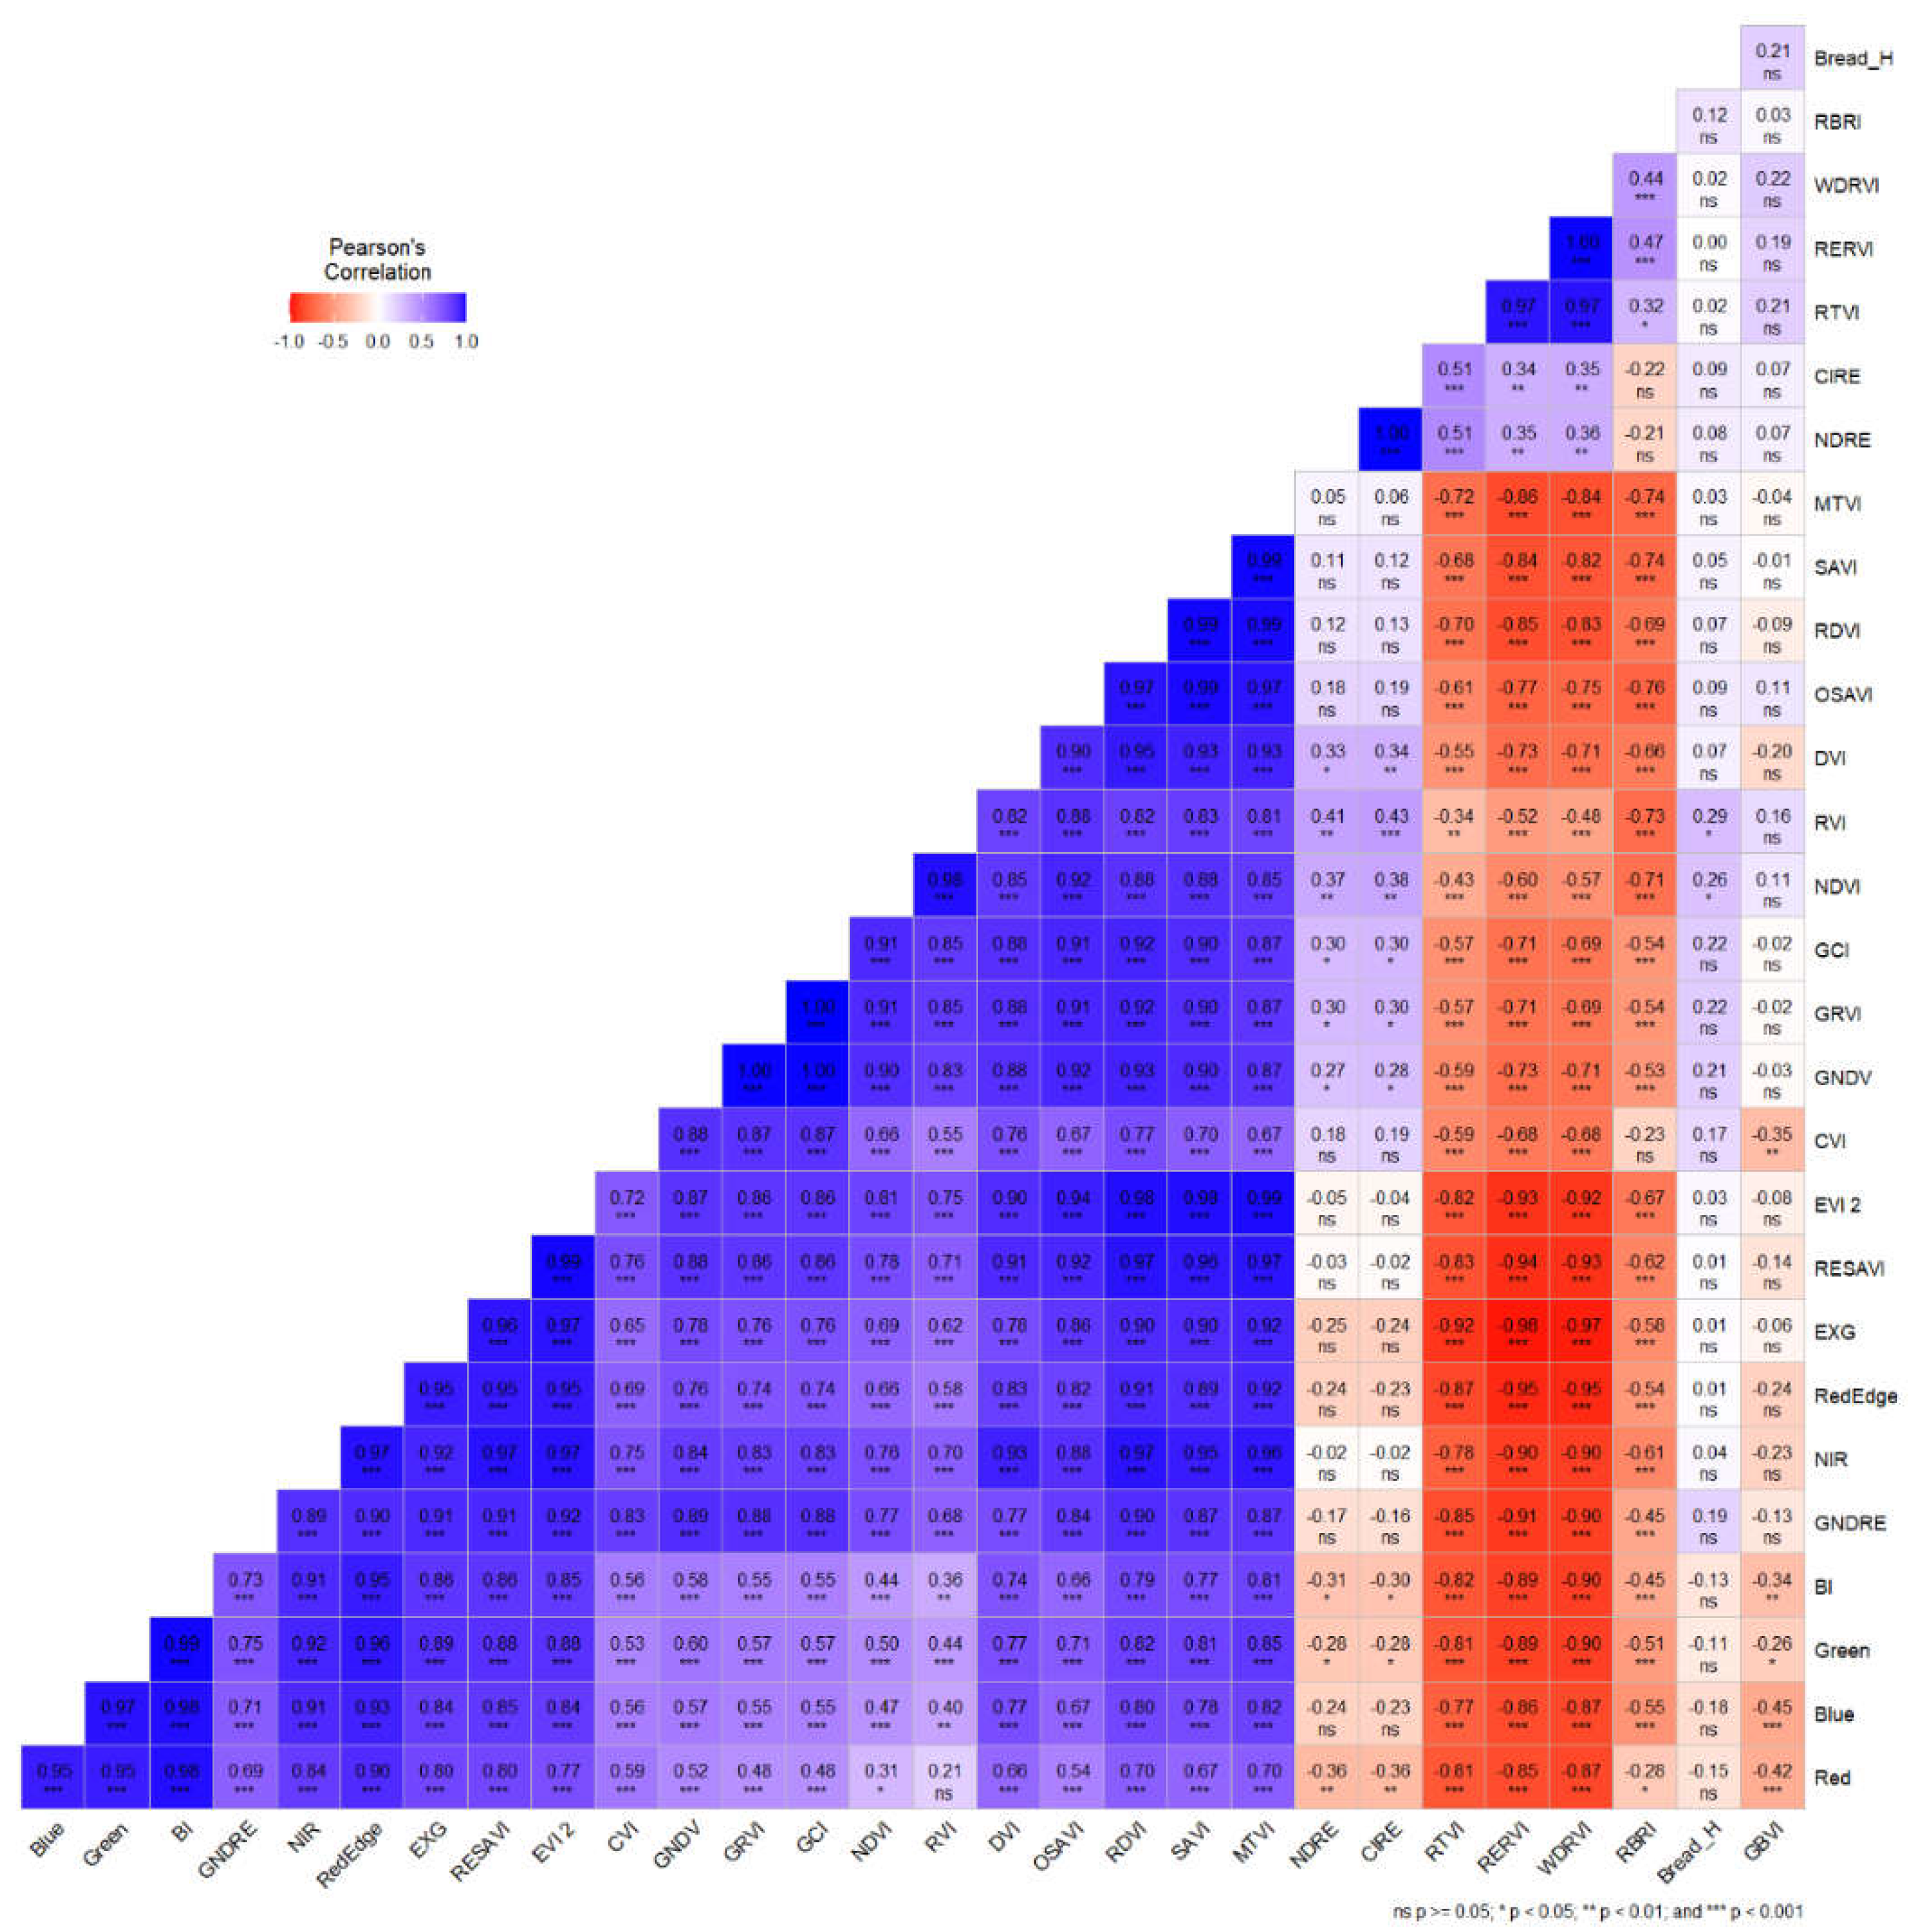
Figure A2.
Durum yield correlation with vegetation indices and raw bands under 24 kg/ha nitrogen application.
Figure A2.
Durum yield correlation with vegetation indices and raw bands under 24 kg/ha nitrogen application.
Appendix B
Table B1.
Wheat Yield Prediction Accuracy using MLR model.
| Nitrogen application rate (kg/ha) | Wheat Type | Model | R² | MSE | RMSE |
| 48 | Durum | MLR | 0.4167 | 0.0812 | 0.2849 |
| 24 | Durum | MLR | 0.6441 | 0.0128 | 0.1133 |
| 48 | Bread | MLR | 0.4609 | 0.0386 | 0.1965 |
| 24 | Bread | MLR | 0.1990 | 0.0628 | 0.2507 |
Appendix C
Table C1.
The wheat varieties planted for the trial.
| Type | Wheat variety | Label | Type | Wheat variety | Label |
| DURUM | Russello_SG7 | D1 | BREAD | WAT238 | B1 |
| Kyperounda_L28 | D2 | WAT496 | B2 | ||
| Tettra-IPK251 | D3 | WAT579 | B3 | ||
| Senatore_Cappelli | D4 | WAT580 | B4 | ||
| Haurani | D5 | WAT784 | B5 | ||
| Menceki_L36 | D6 | WAT387 | B6 | ||
| Dicoccum_Molise_Colli | D7 | WAT560 | B7 | ||
| Svevo | D8 | WAT746 | B8 | ||
| Altar_C84 | D9 | Paragon | B9 | ||
| Monastir | D10 | Steenbok | B10 |
References
- Abrougui, K., Gabsi, K., Mercatoris, B., Khemis, C., Amami, R., & Chehaibi, S. (2019). Prediction of organic potato yield using tillage systems and soil properties by artificial neural network (ANN) and multiple linear regressions (MLR). Soil and Tillage Research, 190, 202–208. [CrossRef]
- Adhikari, S.; Kumari, J.; Jacob, S.J.; Prasad, P.; Gangwar, O.P.; Lata, C.; Thakur, R.; Singh, A.K.; Bansal, R.; Kumar, S.; Bhardwaj, S.C.; & Kumar, S. (2022). Landraces-potential treasure for sustainable wheat improvement. Genet Resour Crop Evol 69, 499–523. [CrossRef]
- ARC – ISCW, 2004. Overview of the status of the agricultural natural resources of South Africa. ARC-ISCW Report No. GW/A/2004/13, ARC – Institute for Soil, Climate and Water, Pretoria, South Africa.
- Badagliacca, G., Messina, G., Praticò, S., Lo Presti, E., Preiti, G., Monti, M., & Modica, G. (2023). Multispectral vegetation indices and machine learning approaches for durum wheat (Triticum durum Desf.) Yield Prediction across Different Varieties. AgriEngineering, 5(4), 2032–2048.
- Barnes, E.M.; Clarke, T.R.; Richards, S.E.; Colaizzi, P.D.; Haberland, J.; Kostrzewski, M.; Waller, P.; Choi, C.R.E.; Thompson, T.; Lascano, R.J.; et al. Coincident detection of crop water stress, nitrogen status and canopy density using ground based multispectral data. In Proceedings of the Fifth International Conference on Precision Agriculture, Bloomington, MN, USA, 16–19 July 2000; Volume 1619, p. 6.
- Benson, T.; Fermont, A. 2011. Estimating yield of food crops grown by smallholder farmers: A review in the Uganda context. In International Food Policy Research Institute; IFPRI Discussion Paper 01097; Development Strategy and Governance Division: Washington, DC, USA, 2011; p. 69.
- Bian, C., Shi, H., Wu, S., Zhang, K., Wei, M., Zhao, Y., & Chen, S. (2022). Prediction of field-scale wheat yield using machine learning method and multi-spectral UAV data. Remote Sensing, 14(6), 1474. [CrossRef]
- Calderini, D. F., & Slafer, G. A. (1999). Has yield stability changed with genetic improvement of wheat yield? Euphytica, 107, 51–59.
- Cao, X.; Liu, Y.; Yu, R.; Han, D.; Su, B. A Comparison of UAV RGB and Multispectral Imaging in Phenotyping for Stay Green of Wheat Population. Remote Sens., 2021, 13, 5173. [CrossRef]
- Chan, J. Y. L., Leow, S. M. H., Bea, K. T., Cheng, W. K., Phoong, S. W., Hong, Z. W., & Chen, Y. L. (2022). Mitigating the multicollinearity problem and its machine learning approach: a review. Mathematics, 10(8), 1283. [CrossRef]
- Chen, P.-F.; Nicolas, T.; Wang, J.-H.; Philippe, V.; Huang, W.-J.; Li, B.-G. New index for crop canopy fresh biomass estimation. Spectrosc. Spectr. Anal. 2010, 30, 512–517.
- Chiu, M. S., & Wang, J. (2024). Evaluation of Machine Learning Regression Techniques for Estimating Winter Wheat Biomass Using Biophysical, Biochemical, and UAV Multispectral Data. Drones, 8(7), 287. [CrossRef]
- Darra, N., Anastasiou, E., Kriezi, O., Lazarou, E., Kalivas, D., & Fountas, S. (2023). Can yield prediction be fully digitalized? A systematic review. Agronomy, 13(9), 2441.
- Daughtry, C.S.T.; Walthall, C.L.; Kim, M.S.; de Colstoun, E.B.; McMurtrey, J.E., III. 2000, Estimating corn leaf chlorophyll concentration from leaf and canopy reflectance. Remote Sens. Environ. 74: 229–239.
- De Beer K. 2022. How to do your own crop estimate. Grain SA, Pula (March 2022), Pretoria, SA.
- Dimkpa CO, Fugice J, Singh U and Lewis TD. 2020. Development of fertilizers for enhanced nitrogen use efficiency – Trends and perspectives. Science of the Total Environment, 731, 139113. [CrossRef]
- El Sabagh, A., Islam, M. S., Skalicky, M., Ali Raza, M., Singh, K., Anwar Hossain, M.,& Arshad, A. (2021). Salinity stress in wheat (Triticum aestivum L.) in the changing climate: Adaptation and management strategies. Frontiers in Agronomy, 3, 661932. [CrossRef]
- FAO (2009). High Level Expert Forum-How to Feed the World in 2050. Economic and Social Development. Rome: Food and Agricultural Organization of the United Nations.
- FAO, F. (2009). High level expert forum-how to feed the world in 2050. Economic and Social Development, Food and Agricultural Organization of the United Nations, Rome, Italy. Plant Cell, Tissue and Organ Culture.
- Fei, S., Hassan, M. A., He, Z., Chen, Z., Shu, M., Wang, J., & Xiao, Y. (2021). Assessment of ensemble learning to predict wheat grain yield based on UAV-multispectral reflectance. Remote Sensing, 13(12), 2338. [CrossRef]
- Feng, H., Tao, H., Fan, Y., Liu, Y., Li, Z., Yang, G., & Zhao, C. (2022). Comparison of winter wheat yield estimation based on near-surface hyperspectral and UAV hyperspectral remote sensing data. Remote Sensing, 14(17), 4158. [CrossRef]
- Feng, P., Wang, B., Li Liu, D., Waters, C., Xiao, D., Shi, L., & Yu, Q. (2020). Dynamic wheat yield forecasts are improved by a hybrid approach using a biophysical model and machine learning technique. Agricultural and Forest Meteorology, 285, 107922. [CrossRef]
- Figueroa, M., Hammond-Kosack, K. E., & Solomon, P. S. (2018). A review of wheat diseases—a field perspective. Molecular plant pathology, 19(6), 1523–1536.
- Fieuzal, R., Sicre, C. M., & Baup, F. (2017). Estimation of corn yield using multi-temporal optical and radar satellite data and artificial neural networks. International journal of applied earth observation and geoinformation, 57, 14–23. [CrossRef]
- Fischer R.A. 2015. Definitions and determination of crop yield, yield gaps, and of rates of change. Field Crops Research Vol 182, 9–18. [CrossRef]
- Fu, Z., Jiang, J., Gao, Y., Krienke, B., Wang, M., Zhong, K., & Liu, X. (2020). Wheat growth monitoring and yield estimation based on multi-rotor unmanned aerial vehicle. Remote Sensing, 12(3), 508. [CrossRef]
- García-Martínez, H., Flores-Magdaleno, H., Ascencio-Hernández, R., Khalil-Gardezi, A., Tijerina-Chávez, L., Mancilla-Villa, O. R., & Vázquez-Peña, M. A. (2020). Corn grain yield estimation from vegetation indices, canopy cover, plant density, and a neural network using multispectral and RGB images acquired with unmanned aerial vehicles. Agriculture, 10(7), 277. [CrossRef]
- Gitelson, A.A.; Gritz, Y.; Merzlyak, M.N. Relationships between leaf chlorophyll content and spectral reflectance and algorithms for non-destructive chlorophyll assessment in higher plant leaves. J. Plant Physiol. 2003, 160, 271–282. [CrossRef]
- Gitelson, A.A.; Viña, A.; Ciganda, V.; Rundquist, D.C.; Arkebauer, T.J. Remote estimation of canopy chlorophyll content in crops. Geophys. Res. Lett. 2005, 32. [CrossRef]
- Gitelson, A. A Wide Dynamic Range Vegetation Index for Remote Quantification of Biophysical Characteristics of Vegetation. J. Plant Physiol. 2004, 161, 165–173. [CrossRef]
- Hao S, Ryu D., Western A., Perry E., Bogena H. and Franssen H.J.H. 2021. Performance of a wheat yield prediction model and factors influencing the performance: A review and meta-analysis. Agricultural Systems 194, 103278. [CrossRef]
- Haboudane, D.; Miller, J.R.; Pattey, E.; Zarco-Tejada, P.J.; Strachan, I.B. Hyperspectral vegetation indices and novel algorithms for predicting green LAI of crop canopies: Modeling and validation in the context of precision agriculture. Remote Sens. Environ. 2004, 90, 337–352.
- Haboudane, D.; Miller, J.R.; Tremblay, N.; Zarco-Tejada, P.J.; Dextraze, L. Integrated narrow-band vegetation indices for prediction of crop chlorophyll content for application to precision agriculture. Remote Sens. Environ. 2002, 81, 416–426. [CrossRef]
- Hassan, M. A., Yang, M., Rasheed, A., Jin, X., Xia, X., Xiao, Y., & He, Z. (2018). Time-series multispectral indices from unmanned aerial vehicle imagery reveal senescence rate in bread wheat. Remote Sensing, 10(6), 809. [CrossRef]
- Hossain, A., Skalicky, M., Brestic, M., Maitra, S., Ashraful Alam, M., Syed, M. A., & Islam, T. (2021). Consequences and mitigation strategies of abiotic stresses in wheat (Triticum aestivum L.) under the changing climate. Agronomy, 11(2), 241.
- Hunt, E.R.; Cavigelli, M.; Daughtry, C.S.T.; Mcmurtrey, J.E.; Walthall, C.L. Evaluation of digital photography from model aircraft for remote sensing of crop biomass and nitrogen status. Precis. Agric. 2005, 6, 359–378.
- IDRC (2010). Facts and Figures on Food and Biodiversity. Canada: IDRC Communications, International Development Research Centre. Availble online at: https://www.idrc.ca/en/research-in-action/facts-figures-food-and-biodiversity.
- Jensen, R.R.; Hardin, P.J.; Yu, G. 2009. Artificial Neural Networks and Remote Sensing. Geogr. Compass 3, 630–646. [CrossRef]
- Jiang, Z.; Huete, A.R.; Didan, K.; Miura, T. Development of a two-band enhanced vegetation index without a blue band. Remote Sens. Environ. 2008, 112, 3833–3845. [CrossRef]
- Jordan, C.F. Derivation of Leaf-Area Index from Quality of Light on the Forest Floor. Ecology 1969, 50, 663–666.
- Kasampalis, D. A., Alexandridis, T. K., Deva, C., Challinor, A., Moshou, D., & Zalidis, G. (2018). Contribution of remote sensing on crop models: a review. Journal of Imaging, 4(4), 52. [CrossRef]
- Kawashima, S.; Nakatani, M. An algorithm for estimating chlorophyll content in leaves using a video camera. Ann. Bot. 1998,81, 49–54.
- Lesk, C.; Rowhani, P.; Ramankutty, N. Influence of extreme weather disasters on global crop production. Nature 2016, 529, 84–87. [CrossRef]
- Li, B., Liu, R., Liu, S., Liu, Q., Liu, F., & Zhou, G. (2012). Monitoring vegetation coverage variation of winter wheat by low-altitude UAV remote sensing system. Transactions of the Chinese Society of Agricultural Engineering, 28(13), 160–165.
- Liu, Y., Sun, L., Liu, B., Wu, Y., Ma, J., Zhang, W., & Chen, Z. (2023). Estimation of Winter Wheat Yield using multiple temporal vegetation indices derived from UAV-Based multispectral and hyperspectral imagery. Remote Sensing, 15(19), 4800. [CrossRef]
- Lu, B., He, Y., & Liu, H. H. (2018). Mapping vegetation biophysical and biochemical properties using unmanned aerial vehicles-acquired imagery. International Journal of Remote Sensing, 39(15–16), 5265–5287. [CrossRef]
- Maresma, Á., Ariza, M., Martínez, E., Lloveras, J., & Martínez-Casasnovas, J. A. (2016). Analysis of vegetation indices to determine nitrogen application and yield prediction in maize (Zea mays L.) from a standard UAV service. Remote Sensing, 8(12), 973.
- Mas, J.F.; Flores, J.J. 2008. The Application of Artificial Neural Networks to the Analysis of Remotely Sensed Data. Int. J. Remote Sens. 29, 617–663. [CrossRef]
- Mashaba, Z., Chirima, G., Botai, J. O., Combrinck, L., Munghemezulu, C., & Dube, E. (2017). Forecasting winter wheat yields using MODIS NDVI data for the Central Free State region. South African journal of science, 113(11–12), 1–6. [CrossRef]
- Mirasi, A., Mahmoudi, A., Navid, H., Valizadeh Kamran, K., & Asoodar, M. A. (2021). Evaluation of sum-NDVI values to estimate wheat grain yields using multi-temporal Landsat OLI data. Geocarto International, 36(12), 1309–1324. [CrossRef]
- Mishra, P. (2021). Chemometric approaches for calibrating high-throughput spectral imaging setups to support digital plant phenotyping by calibrating and transferring spectral models from a point spectrometer. Analytica Chimica Acta, 1187, 339154. [CrossRef]
- Mokarram, M., & Bijanzadeh, E. (2016). Prediction of biological and grain yield of barley using multiple regression and artificial neural network models. Aus J of Crop Science, 10 (6), 895–903. [CrossRef]
- Paudel, D., Boogaard, H., de Wit, A., Janssen, S., Osinga, S., Pylianidis, C., & Athanasiadis, I. N. (2021). Machine learning for large-scale crop yield forecasting. Agricultural Systems, 187, 103016. [CrossRef]
- Pazhanivelan, S., Kumaraperumal, R., Shanmugapriya, P., Sudarmanian, N. S., Sivamurugan, A. P., & Satheesh, S. (2023). Quantification of biophysical parameters and economic yield in cotton and rice using drone technology. Agriculture, 13(9), 1668. [CrossRef]
- Piekutowska, M.; Niedbała, G.; Piskier, T.; Lenartowicz, T.; Pilarski, K.; Wojciechowski, T.; Pilarska, A.A.; Czechowska-Kosacka, A. 2021. The Application of Multiple Linear Regression and Artificial Neural Network Models for Yield Prediction of Very Early Potato Cultivars before Harvest. Agronomy 11, 885. [CrossRef]
- Plantinga AJ and Irwin EG 2006. Overview of empirical models (Ch 7). Economics of Rural Land-Use Change Bell KP, Boyle KJ & Rubin J., Taylor and Francis, NY.
- Ramos, A. P. M., Osco, L. P., Furuya, D. E. G., Gonçalves, W. N., Santana, D. C., Teodoro, L. P. R., & Pistori, H. (2020). A random forest ranking approach to predict yield in maize with UAV-based vegetation spectral indices. Computers and Electronics in Agriculture, 178, 105791. [CrossRef]
- Saeed Rauf S, Zaharieva M, Warburton ML, Ping-zhi Z, AL-Sadi AL, Khalil F, Kozak M and Tariq SA. 2015. Breaking wheat yield barriers requires integrated efforts in developing countries. J. Integrative Agric. 14(8): 1447–1474. [CrossRef]
- Ren, J., Chen, Z., Zhou, Q., & Tang, H. (2008). Regional yield estimation for winter wheat with MODIS-NDVI data in Shandong, China. International Journal of Applied Earth Observation and Geoinformation, 10(4), 403–413. [CrossRef]
- Reynolds, C. A., Yitayew, M., Slack, D. C., Hutchinson, C. F., Huete, A., & Petersen, M. S. (2000). Estimating crop yields and production by integrating the FAO Crop Specific Water Balance model with real-time satellite data and ground-based ancillary data. International Journal of Remote Sensing, 21(18), 3487–3508. [CrossRef]
- Reynolds, M.; Tattaris, M.; Cossani, C.M.; Ellis, M.; Yamaguchi-Shinozaki, K.; Pierre, C.S. Exploring genetic resources to increase adaptation of wheat to climate change. In Advances in Wheat Genetics: From Genome to Field: 12th International Wheat Genetics Symposium; Ogihara, Y., Takumi, S., Handa, H., Eds.; Springer: Tokyo, Japan, 2015; pp. 355–368.
- Rondeaux, G.; Steven, M.; Baret, F. Optimization of soil-adjusted vegetation indices. Remote Sens. Environ. 1996, 55, 95–107.
- Rossel, R.; Behrens, T. Using data mining to model and interpret soil di_use reflectance spectra. Geoderma. 2010, 158, 46–54. / Rossel, R. V., & Behrens, T. (2010). Using data mining to model and interpret soil diffuse reflectance spectra. Geoderma, 158(1–2), 46–54.
- Roujean, J.-L.; Breon, F.-M. Estimating PAR absorbed by vegetation from bidirectional reflectance measurements. Remote Sens. Environ. 1995, 51, 375–384. [CrossRef]
- Rouse, J.W.; Haas, R.H.; Schell, J.A.; Deering, D.W. Monitoring vegetation systems in the Great Plains with ERTS. NASA Spec.
- Roy Choudhury, M., Das, S., Christopher, J., Apan, A., Chapman, S., Menzies, N. W., & Dang, Y. P. (2021). Improving biomass and grain yield prediction of wheat genotypes on sodic soil using integrated high-resolution multispectral, hyperspectral, 3D point cloud, and machine learning techniques. Remote Sensing, 13(17), 3482. [CrossRef]
- Safa, M., Samarasinghe, S., & Nejat, M. (2015). Prediction of wheat production using artificial neural networks and investigating indirect factors affecting it: case study in Canterbury province, New Zealand. Journal of Agricultural Science and Technology, 17(4), 791–803.
- Sellaro, R.; Crepy, M.; Ariel Trupkin, S.; Karayekov, E.; Sabrina Buchovsky, A.; Rossi, C.; Jose Casal, J. Cryptochrome as a sensor of the blue/green ratio of natural radiation in arabidopsis. Plant Physiol. 2010, 154, 401–409. [CrossRef]
- Shewry, P. R., & Hey, S. J. (2015). The contribution of wheat to human diet and health. Food and Energy Security 2015 4 (3): 178–202. [CrossRef]
- Shew AM, Tack JB, Nalley LL & Chaminuka P. 2020. Yield reduction under climate warming varies among wheat cultivars in South Africa. Nature communications, 11: 4408. [CrossRef]
- Silva, F. H. C. A., Wijewardane, N. K., Bheemanahalli, R., Reddy, K. R., Zhang, X., & Vennam, R. R. (2023). Comparison of UV, visible and near-infrared, and mid-infrared spectrometers to estimate maize and sorghum leaf nutrients using dry-intact and ground leaves. Computers and Electronics in Agriculture, 211, 108001. [CrossRef]
- Sripada, R.; Heiniger, R.; White, J.; Meijer, A. Aerial Color Infrared Photography for Determining Early In-Season Nitrogen Requirements in Corn. Agron. J. 2006, 98, 968. [CrossRef]
- Sripada, R.P.; Heiniger, R.W.; White, J.G.; Meijer, A.D. Aerial color infrared photography for determining early in-season nitrogen requirements in corn. Agron. J. 2006, 98, 968–977. [CrossRef]
- Steven, M. The Sensitivity of the OSAVI Vegetation Index to Observational Parameters. Remote Sens. Environ. 1998, 63, 49–60. [CrossRef]
- Tandzi LN, & Mutengwa, CS. 2020. Estimation of Maize (Zea mays L.) Yield Per Harvest Area: Appropriate Methods. Agronomy, 10, 29. [CrossRef]
- Vincini, M.; Frazzi, E. Comparing narrow and broad-band vegetation indices to estimate leaf chlorophyll content in planophile crop canopies. Precis. Agric. 2011, 12, 334–344. [CrossRef]
- Vogelmann, J.E.; Rock, B.N.; Moss, D.M. Red edge spectral measurements from sugar maple leaves. Int. J. Remote Sens. 1993, 14,1563–1575.
- Woebbecke, D.M.; Meyer, G.E.; Von Bargen, K.; Mortensen, D.A. Color indices for weed identification under various soil, residue, and lighting conditions. Trans. ASAE 1995, 38, 259–269.
- Yu, F., Wang, M., Xiao, J., Zhang, Q., Zhang, J., Liu, X., & Luan, R. (2024). Advancements in Utilizing Image-Analysis Technology for Crop-Yield Estimation. Remote Sensing, 16(6), 1003. [CrossRef]
- Yue, J.; Yang, G.; Tian, Q.; Feng, H.; Xu, K.; Zhou, C. Estimate of winter-wheat above-ground biomass based on UAV ultrahighground- resolution image textures and vegetation indices. ISPRS J. Photogramm. Remote Sens. 2019, 150, 226–244.
- Zeng, L., Peng, G., Meng, R., Man, J., Li, W., Xu, B., & Sun, R. (2021). Wheat yield prediction based on unmanned aerial vehicles-collected red–green–blue imagery. Remote Sensing, 13(15), 2937. [CrossRef]
- Zhang, H., Wang, L., Tian, T., & Yin, J. (2021). A review of unmanned aerial vehicle low-altitude remote sensing (UAV-LARS) use in agricultural monitoring in China. Remote Sensing, 13(6), 1221. [CrossRef]
- Zhang, K., Ge, X., Shen, P., Li, W., Liu, X., Cao, Q., & Tian, Y. (2019). Predicting rice grain yield based on dynamic changes in vegetation indexes during early to mid-growth stages. Remote sensing, 11(4), 387. [CrossRef]
- Zhou, X., Kono, Y., Win, A., Matsui, T., & Tanaka, T. S. (2021). Predicting within-field variability in grain yield and protein content of winter wheat using UAV-based multispectral imagery and machine learning approaches. Plant Production Science, 24(2), 137–151. [CrossRef]
- Zhou, X., Zheng, H. B., Xu, X. Q., He, J. Y., Ge, X. K., Yao, X., & Tian, Y. C. (2017). Predicting grain yield in rice using multi-temporal vegetation indices from UAV-based multispectral and digital imagery. ISPRS Journal of Photogrammetry and Remote Sensing, 130, 246–255. [CrossRef]
Figure 1.
Map of South Africa (A), Northwest Province (B), and ARC – Brits research farm with the trial layout (C).
Figure 1.
Map of South Africa (A), Northwest Province (B), and ARC – Brits research farm with the trial layout (C).
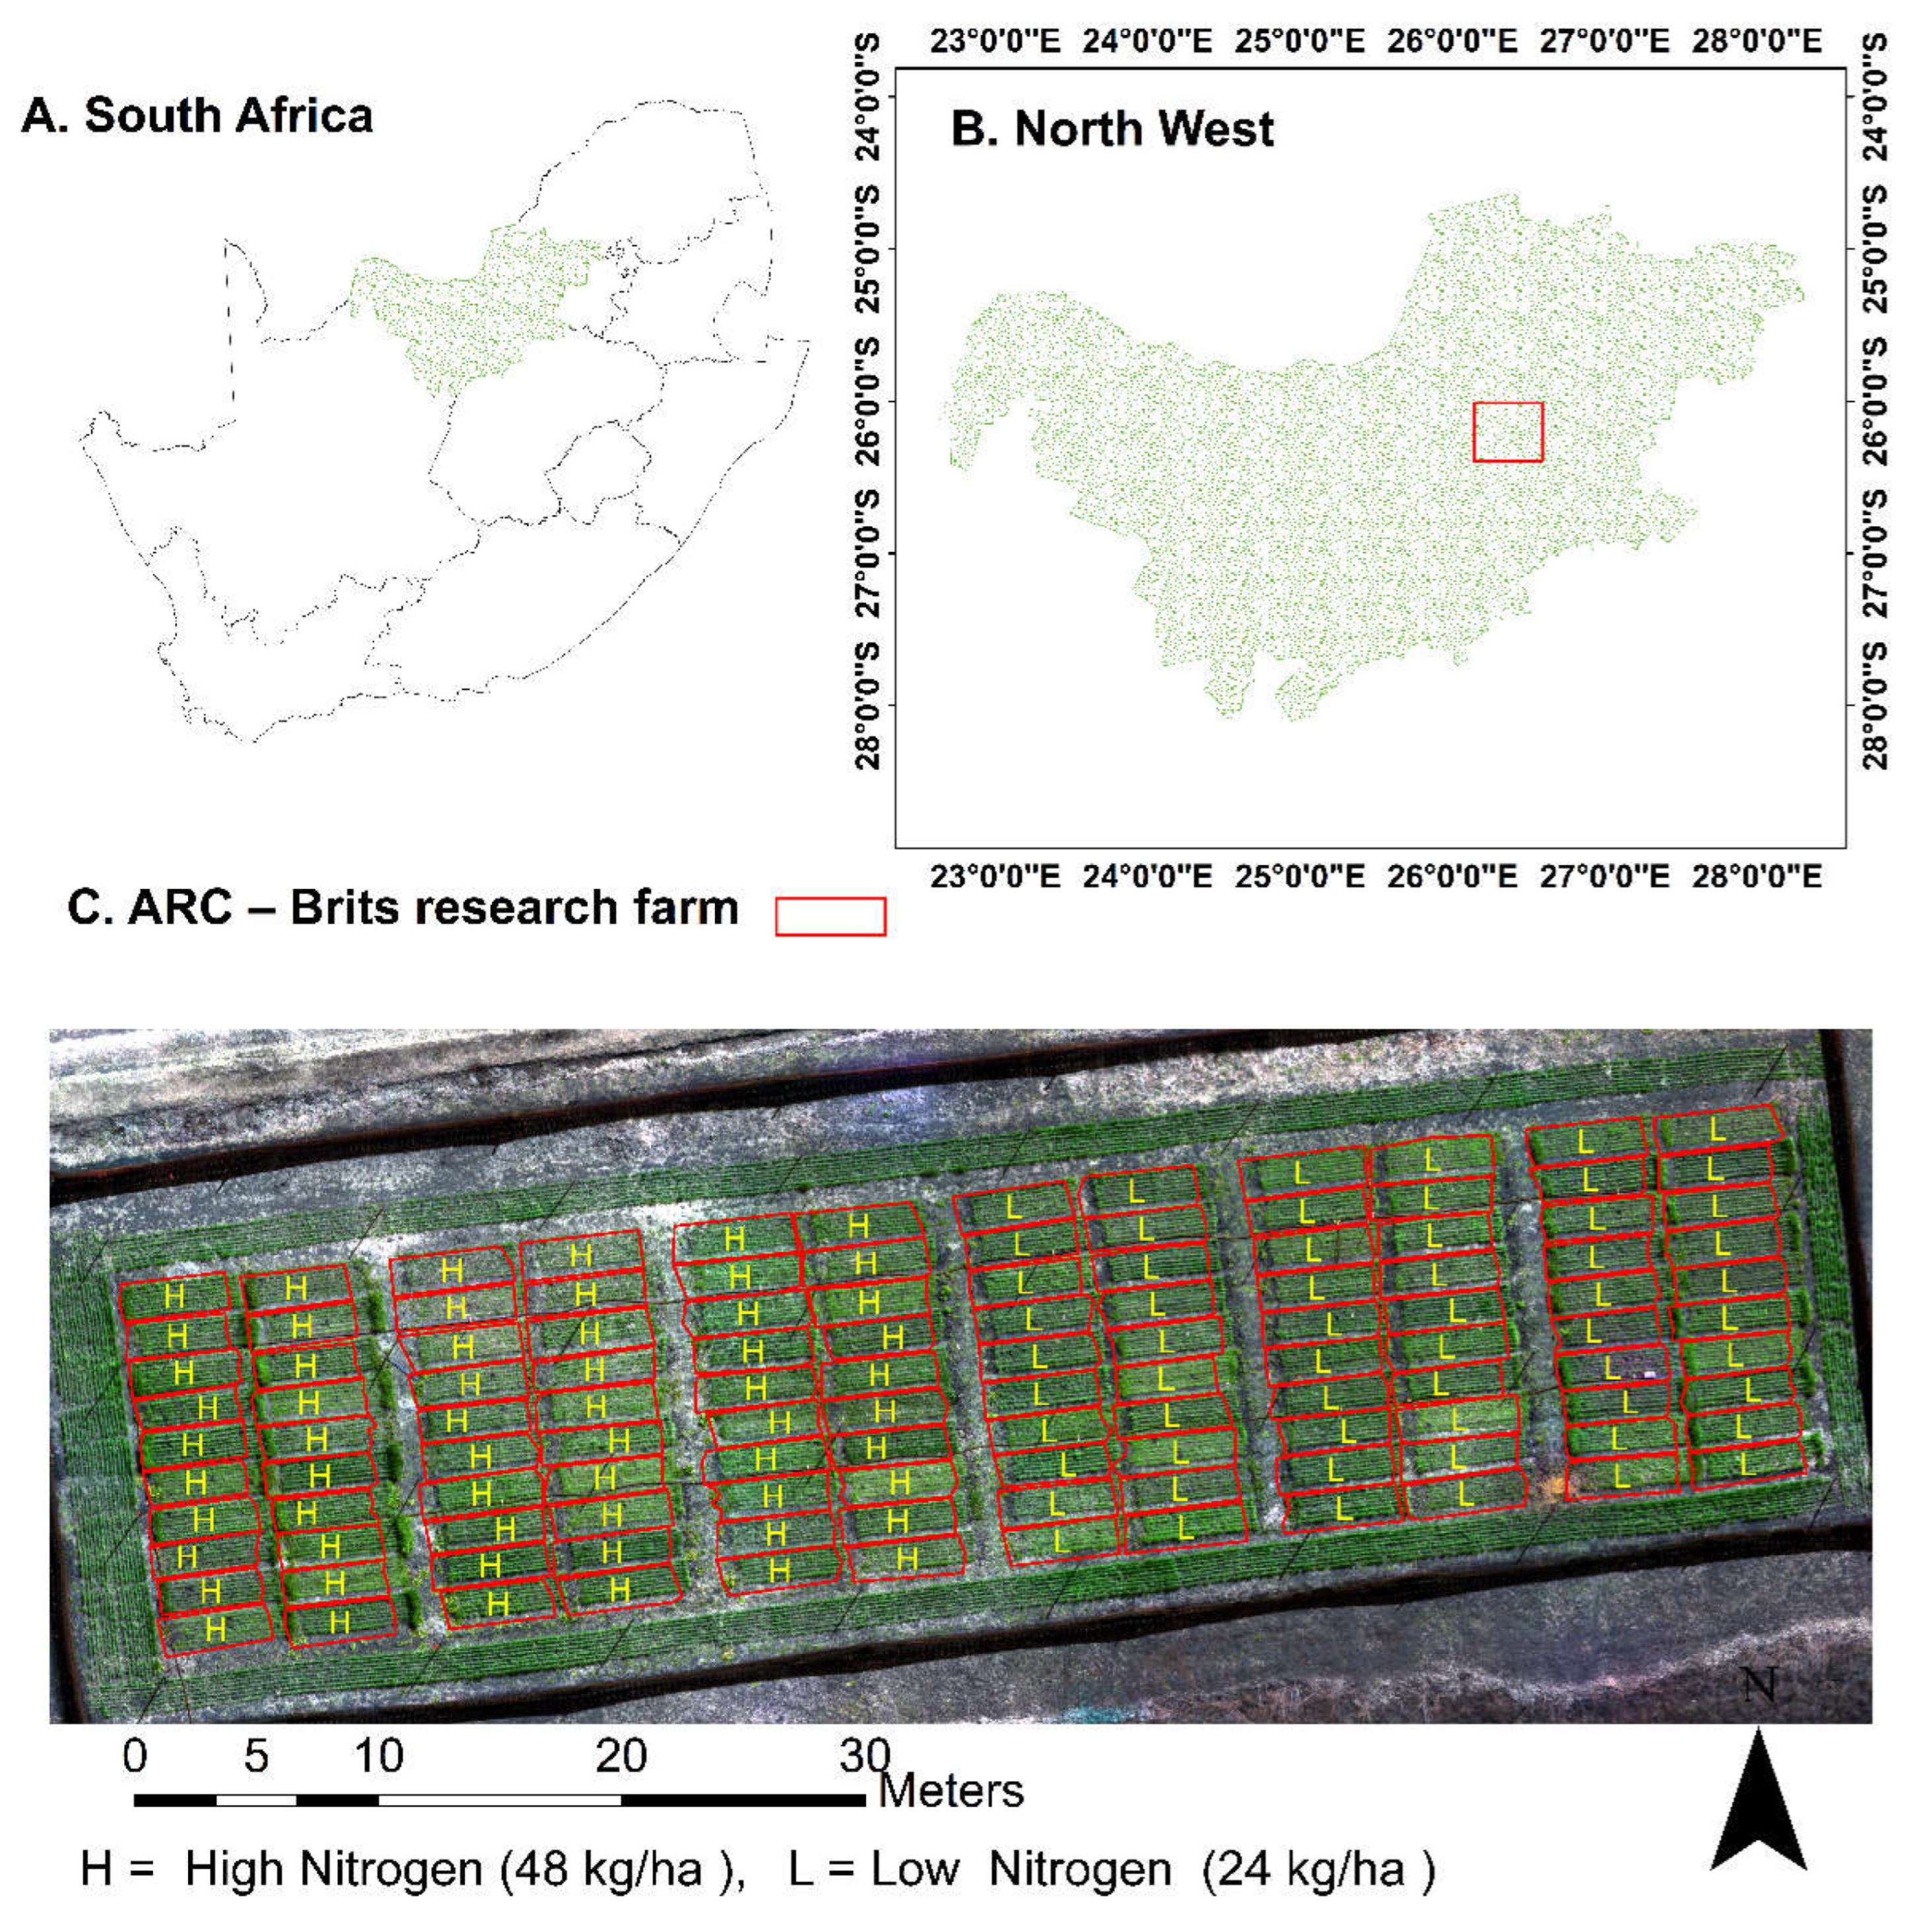
Figure 2.
ARC-ABI - Beestekraal - WS1 weather station data showing monthly average rainfall and temperatures from February 2023 to December 2023.
Figure 2.
ARC-ABI - Beestekraal - WS1 weather station data showing monthly average rainfall and temperatures from February 2023 to December 2023.
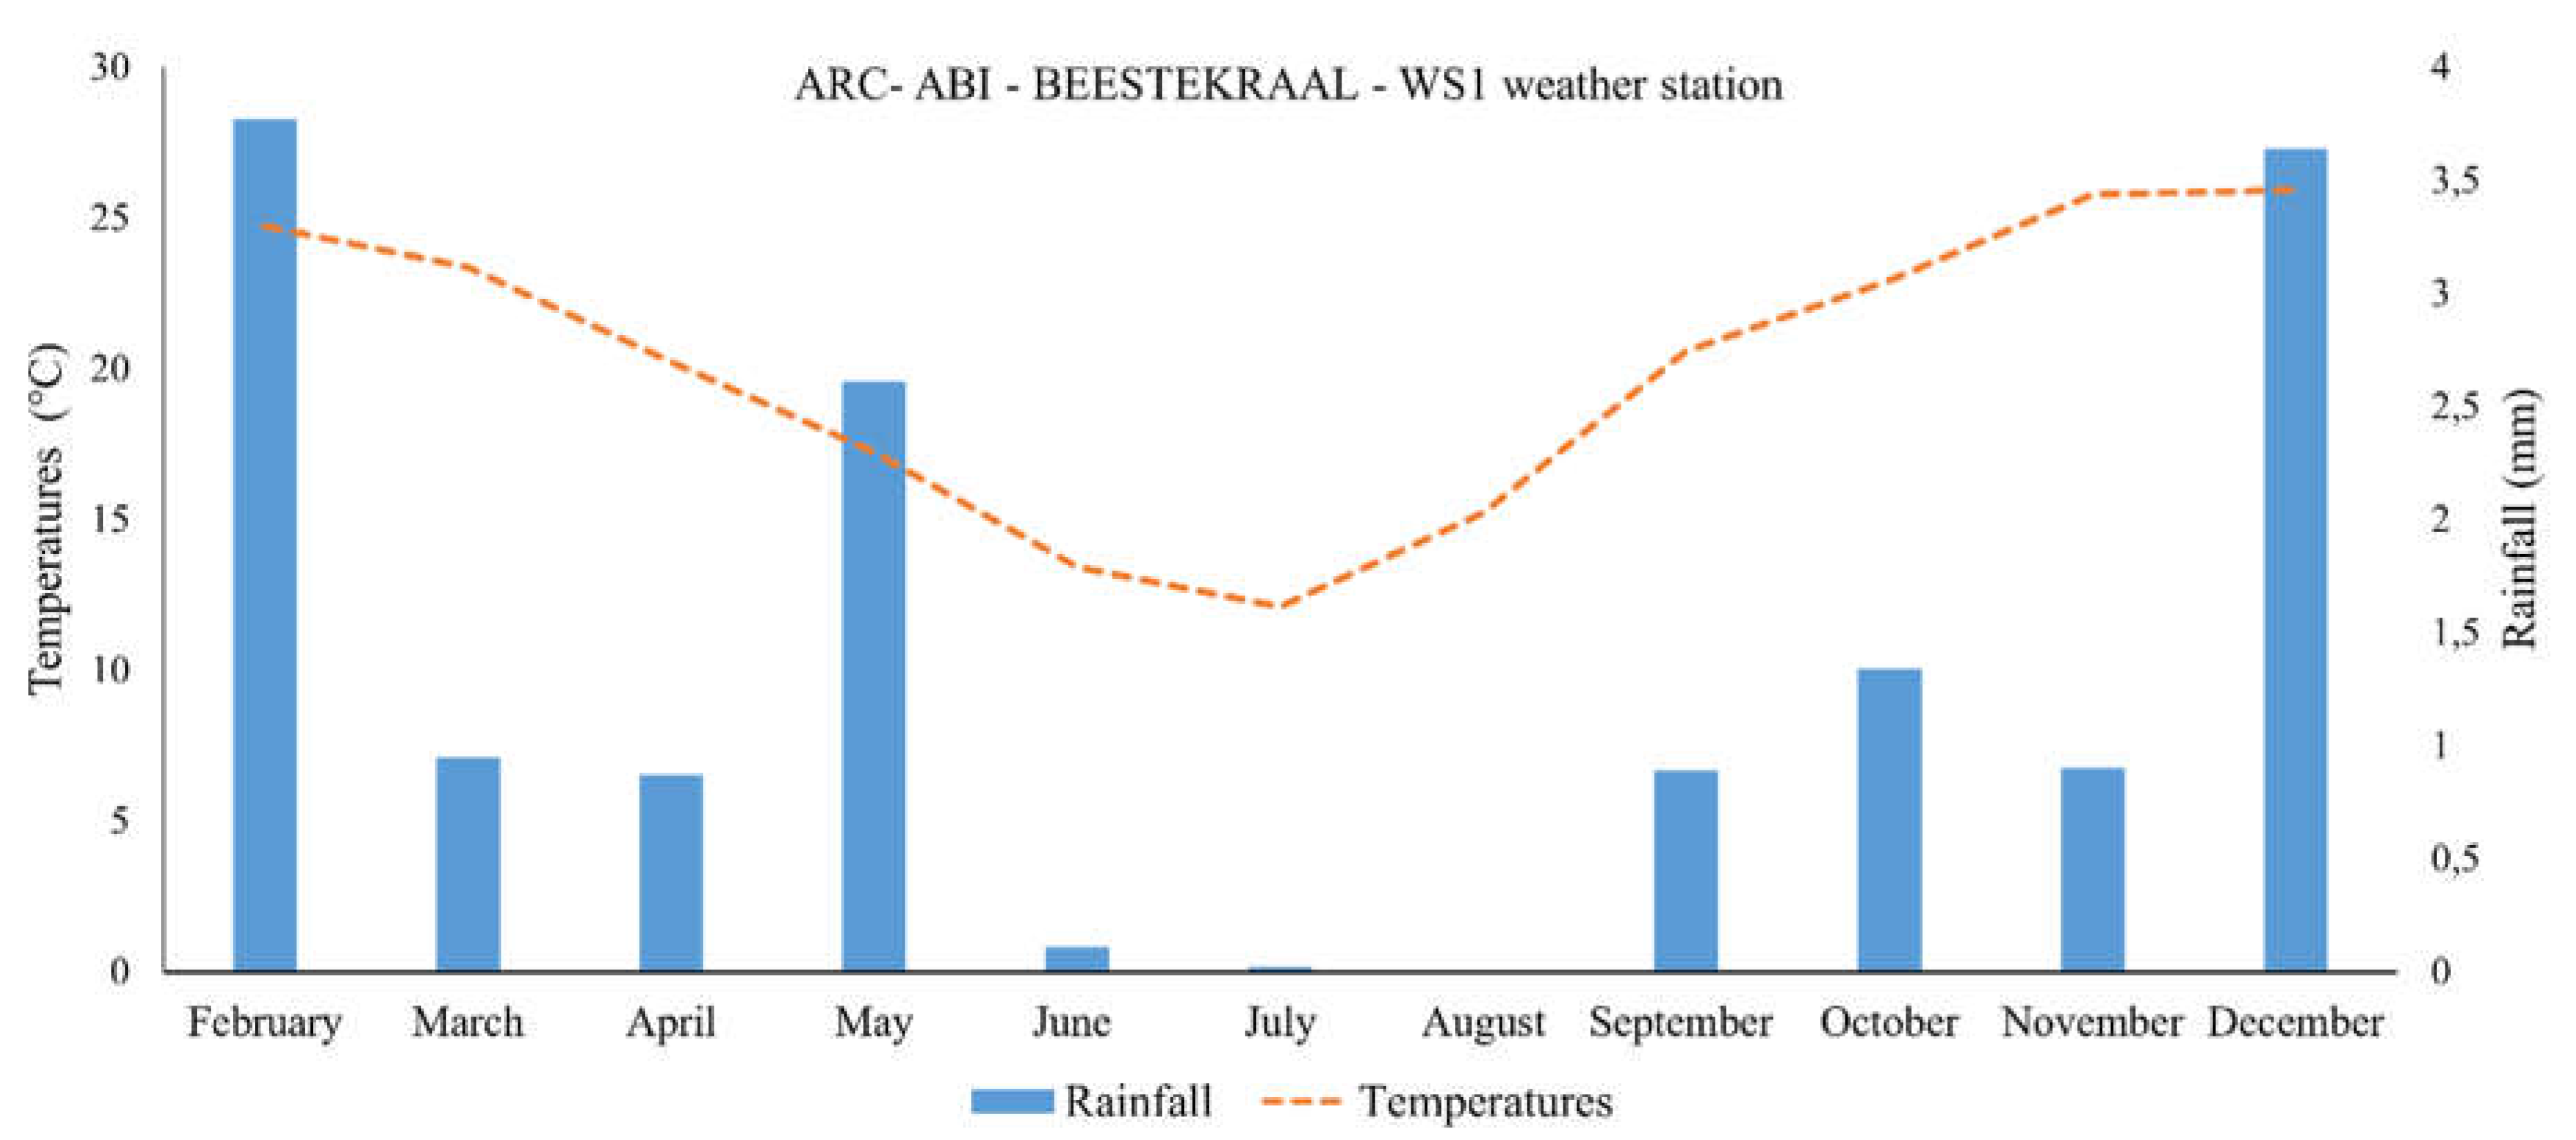
Figure 3.
ANN self-organizing structure in MATLAB R2024a environment used in this study.
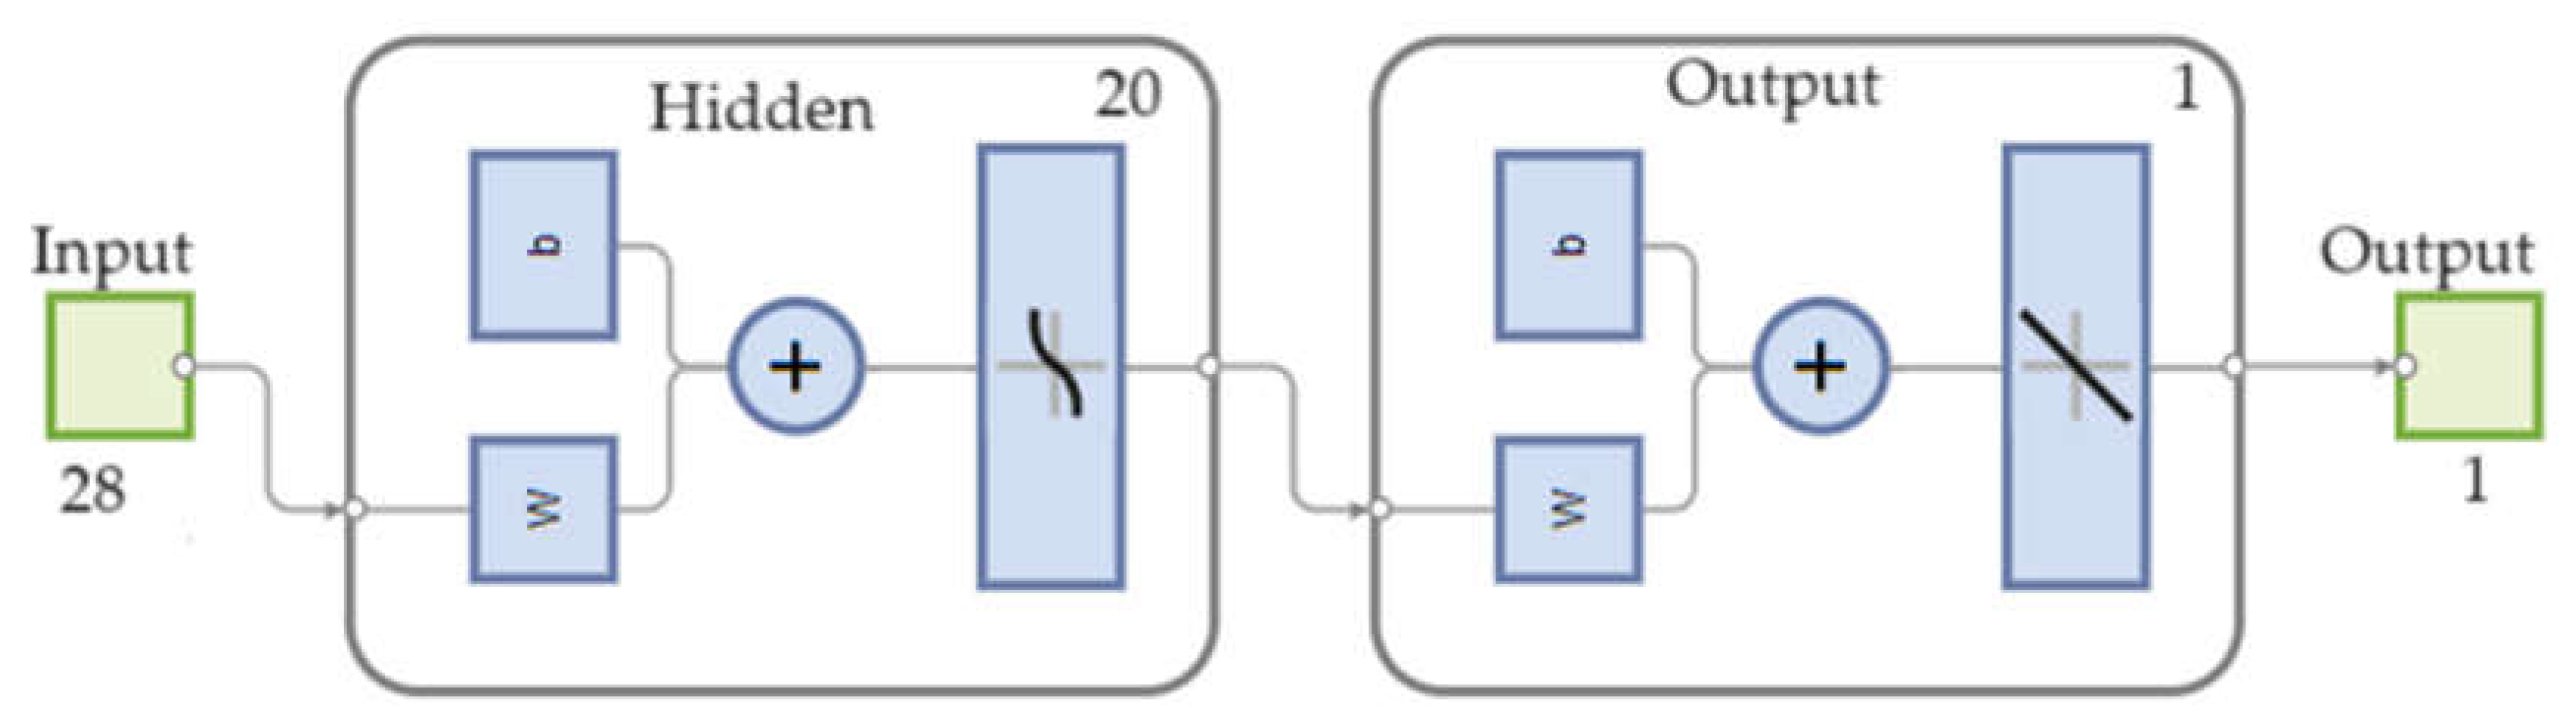
Figure 4.
Summarised flowchart for methodology used in this study to estimate yields.
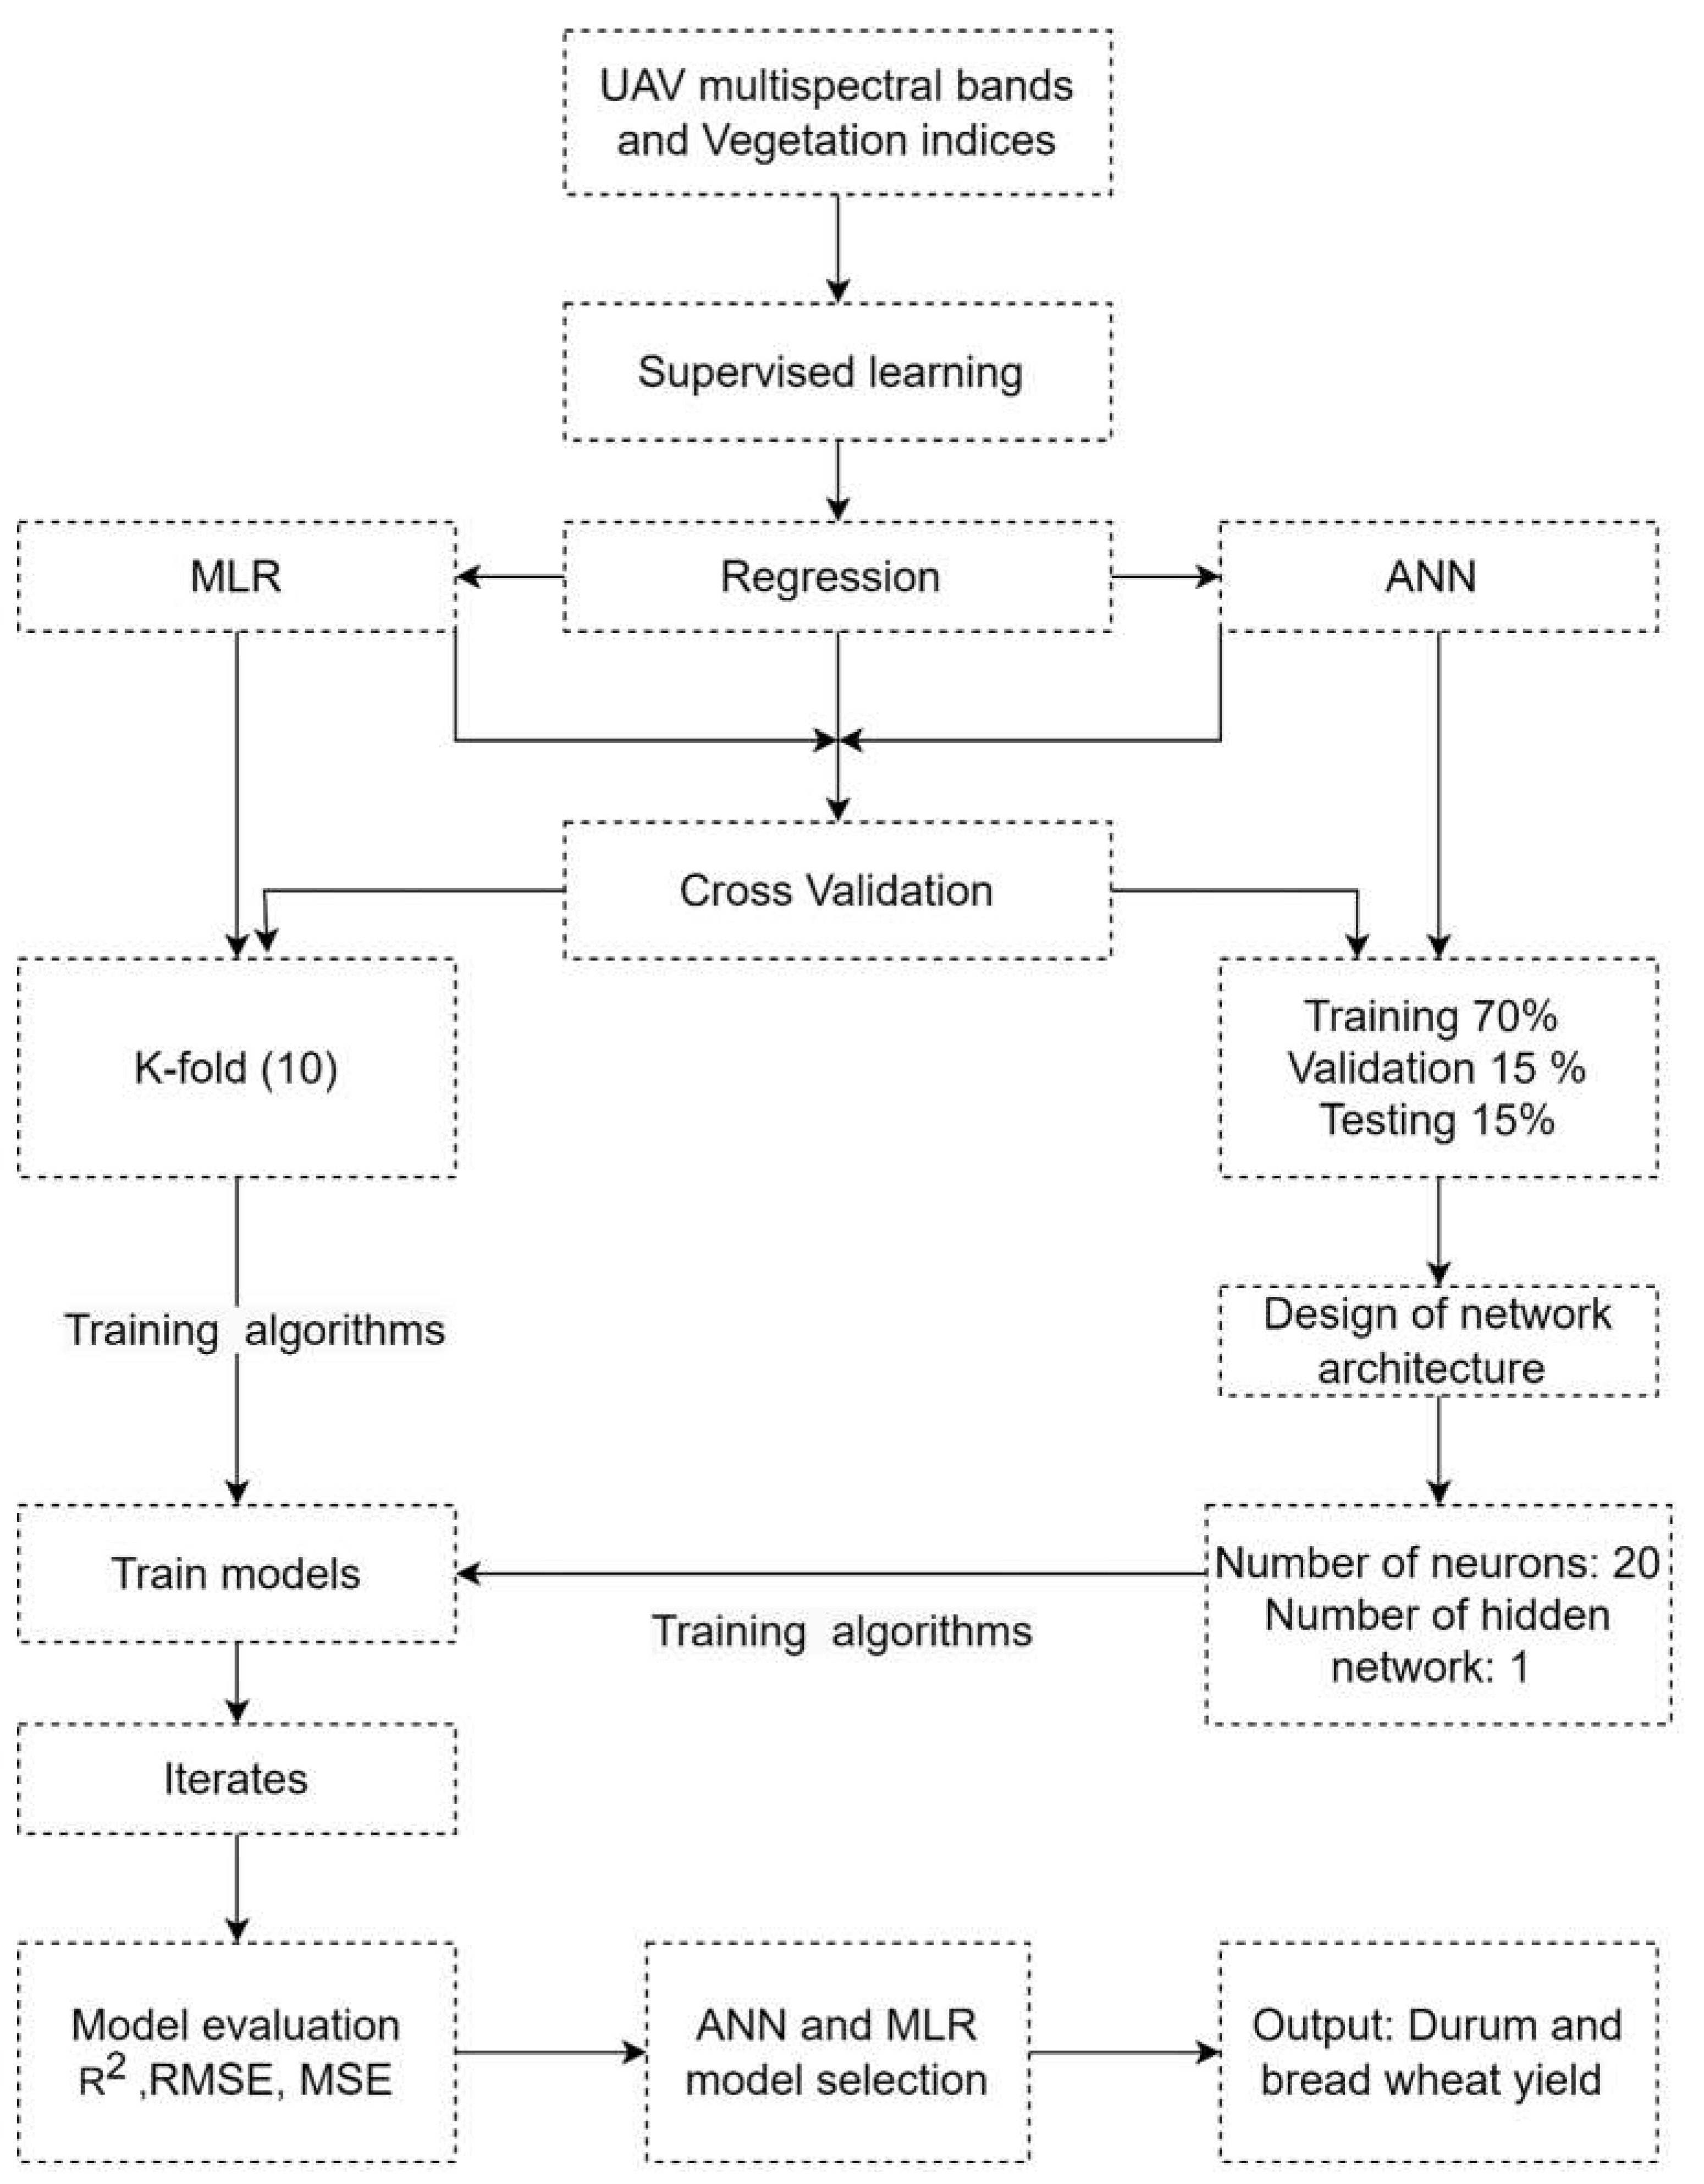
Figure 5.
ANN scatter plots under 24 kg/ha durum yield (a), and bread yield under 48 kg/ha (b).
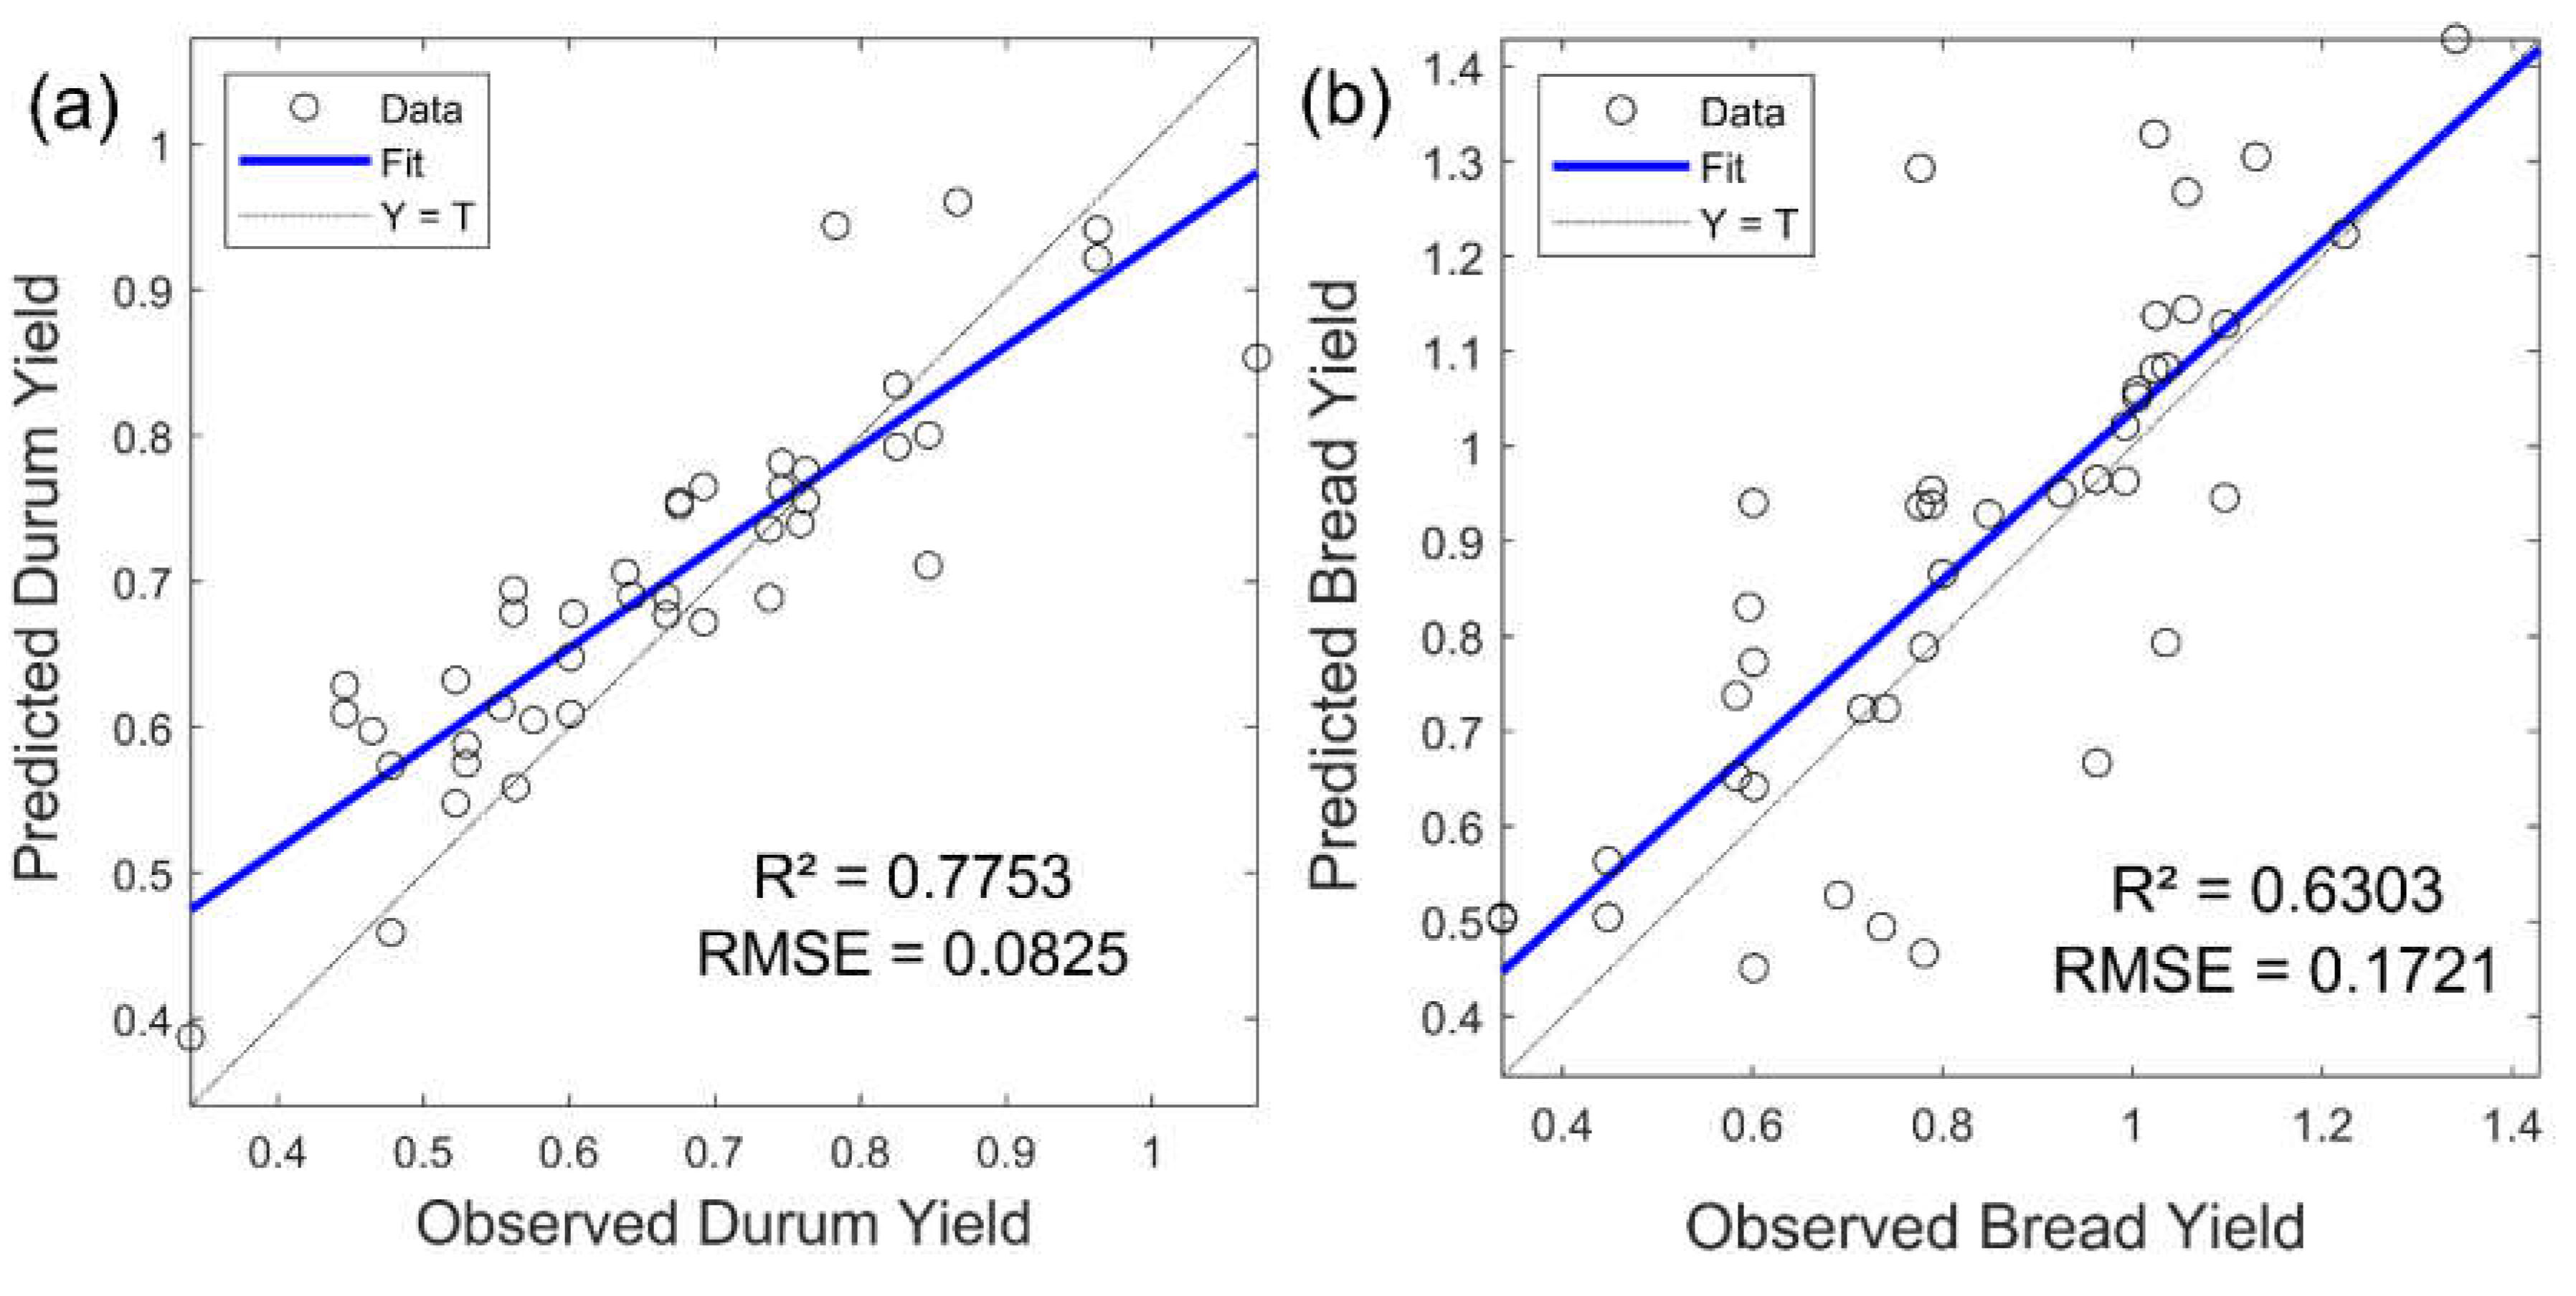
Table 1.
Characteristics of UAV MicaSense RedEdge-MX sensor.
| UAV bands | Centre wavelength | Bandwidth |
| Blue | 475 | 20 |
| Green | 560 | 20 |
| Red | 668 | 10 |
| Rededge | 717 | 10 |
| Near Infrared | 840 | 40 |
Table 2.
Crop yields under the two nitrogen application rates (Durum and Bread wheat).
| N application rate (kg/ha) | Wheat Yield (grams) | Total mass (g) | Average mass/plot (g) | Ave mass/ ha (g) | Ton per ha (t/ha) | ||
| Replicate 1 (g) | Replicate 2 (g) | Replicate 3 (g) | |||||
| Durum wheat | |||||||
| 48 | 19.19 | 20.46 | 20.47 | 59.24 | 19.75 | 730693 | 0.73 |
| 24 | 18.52 | 16.26 | 19.26 | 54.04 | 18.01 | 666462 | 0.67 |
| Bread wheat | |||||||
| 48 | 22.31 | 21.21 | 25.41 | 68.93 | 22.98 | 850101 | 0.85 |
| 24 | 20.38 | 19.68 | 19.94 | 60.01 | 20 | 740066 | 0.74 |
Table 5.
Wheat yield prediction accuracy using ANN model.
| Nitrogen application rate (kg/ha) | Wheat Type | Training | Validation | |||||
| Model | R² | MSE | RMSE | R² | MSE | RMSE | ||
| 48 | Durum | ANN | 0.7375 | 0.0247 | 0.1572 | 0.5032 | 0.0771 | 0.2776 |
| 24 | Durum | ANN | 0.7753 | 0.0068 | 0.0825 | 0.3753 | 0.0206 | 0.1435 |
| 48 | Bread | ANN | 0.6303 | 0.0296 | 0.1721 | 0.3662 | 0.0373 | 0.1931 |
| 24 | Bread | ANN | 0.2477 | 0.0861 | 0.2934 | 0.1436 | 0.1629 | 0.4036 |
Disclaimer/Publisher’s Note: The statements, opinions and data contained in all publications are solely those of the individual author(s) and contributor(s) and not of MDPI and/or the editor(s). MDPI and/or the editor(s) disclaim responsibility for any injury to people or property resulting from any ideas, methods, instructions or products referred to in the content. |
© 2025 by the authors. Licensee MDPI, Basel, Switzerland. This article is an open access article distributed under the terms and conditions of the Creative Commons Attribution (CC BY) license (http://creativecommons.org/licenses/by/4.0/).
Copyright: This open access article is published under a Creative Commons CC BY 4.0 license, which permit the free download, distribution, and reuse, provided that the author and preprint are cited in any reuse.


