Chapter 1: Introduction
1.1. Background of the Study
Zeolites are crystalline, microporous, aluminosilicate materials which have huge academic, scientific and industrial interest in the areas of ion exchange (detergent industry, radioactive waste storage, and treatment of liquid waste), separation (purification, drying, and environmental treatment) and petroleum refining along with petrochemical, coal and fine chemical industries. The ability of zeolites is to act as multi-functional materials in many industrial applications due to their inherent properties such as uniform pore size/shape, catalytic activity, mobile cation and hydrophilicity/hydrophobicity (
Sanni, 2011).
Zeolites were first discovered in 1756 by Cronstedt A.F as natural minerals in cavities and vugs of volcanic basalt rock. They are mainly used in the treatment of sewage, hard water and as a drying agent. Natural zeolites have problems of inadequate supply, impurities, non-uniform pore size and low ion exchange capacities. As a result, synthetic zeolites have been developed. This produces a material with better qualities and wider applications (
Sanni, 2011).
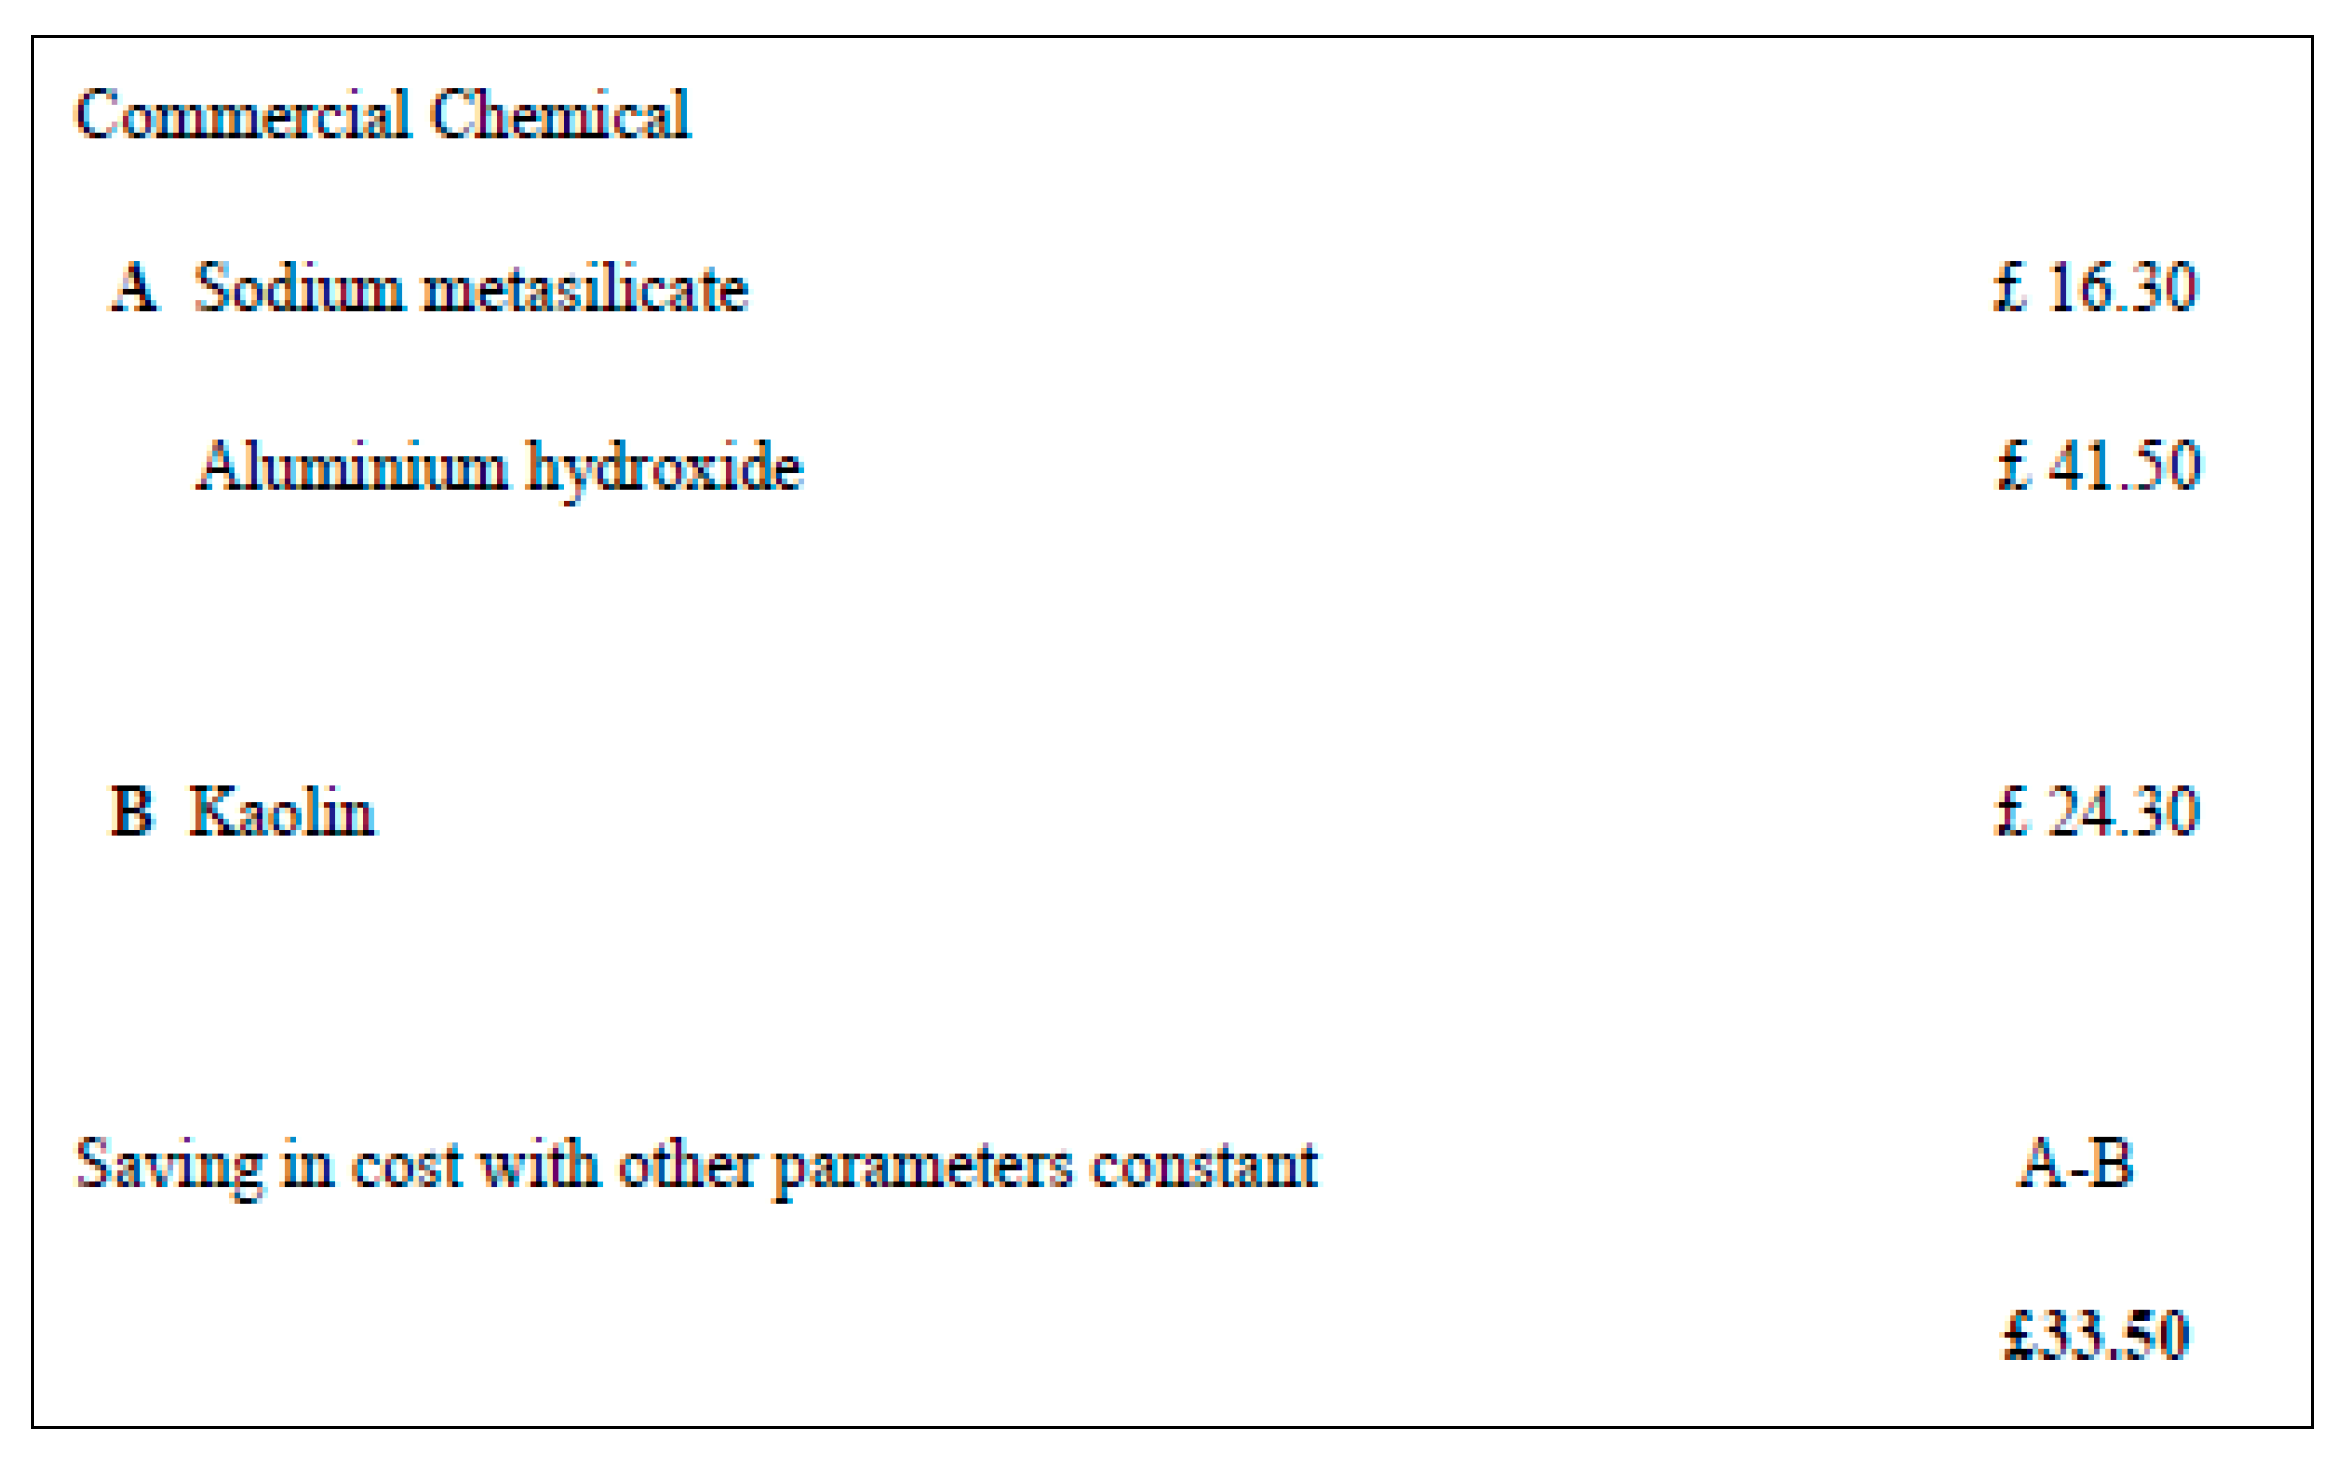
Zeolite synthesis is conventionally performed by a hydrothermal crystallization process using commercial chemicals serving as sources of silica and alumina. Examples of such chemicals include sodium metasilicate, sodium aluminate, silica gel, tetraethylorthosilicate (TEOS), and aluminium hydroxide. These chemicals are generally expensive and their process of production is complicated leading to high costs for zeolite production which limits their commercialization and uses in many industrial applications (
Sanni, 2011).
The use of a low cost, recycle waste and abundant material such as clay (spent bleaching earth) as a combined source of silica and alumina is highly desirable. A cost comparison of zeolite synthesis using commercial chemical and kaolin has been carried out by Sanni (2011). Further justification has been made by a simple cost comparison carried out which indicate a current cost advantage for kaolin as source of zeolite synthesis over commercial chemicals such as sodium metasilicate and aluminium hydroxide.
Figure 1.1.
The simple cost analysis based on the current price source from Sigma –Aldrich. (
Sanni, 2011).
Figure 1.1.
The simple cost analysis based on the current price source from Sigma –Aldrich. (
Sanni, 2011).
1.2. Problem Statement
Crude oil or raw petroleum is a fossil mass that has grouped below the earth’s surface (
Chaudhuri, 2010). In Malaysia, crude oil plays an important role for the economic sector. According to Chin and H (2013), due to the increasing of fuel prices, the interest of renewable energy also increased. As stated by Chang et al., (2011), crude oil prices have an impact economic activity including supply channel and demand channel due to the transformation of the crude oil to the variety of energy products such as diesel, gasoline, kerosene, butane which are an irreplaceable transport fuel and an essential raw material in many manufacturing processes.
Therefore, some researchers (
Mohammadi and Pak, 2003;
Prasad et al., 2007;
Abdeen et al., 2011) had found ethanol, or ethyl alcohol, C
2H
5OH, is conventionally produced by catalytic hydration of ethylene with sulphuric acid. A process which makes ethanol regarded as a petroleum product. However, the continuous depletion of petroleum has directed ethanol producers towards finding other possibilities for ethanol production.
Bioethanol is one of the fermentative products that can be generated from glycerol via anaerobic fermentation. Bioethanol is viewed as an alternative to biofuels because of its nature as a renewable bio-based resource and because it provides the potential to reduce particulate emissions. Currently, the majority of bioethanol production is from food crops such as corn, sugarcane, wheat and soy. This has led to undesirable effects with respect to food production, including increases in food prices, a shortage of fodder, and growing competition for land. The utilization of biomass or glycerol-containing-waste for the production of bioethanol therefore has considerable potential to alleviate these undesirable effects on food production (
Adnan et al., 2014)
Conventional distillation process is able to purify ethanol-water mixture up to 89.4 % mol ethanol due to the formation of minimum boiling point azeotrope composition of 89.4 % mol ethanol and 10.6 % mol water at 78.2°C and atmospheric pressure. Various ways have been used to produce anhydrous ethanol such as azeotropic distillation, extractive distillation, vacuum distillation, adsorption processes, membrane processes etc. (
Kumar et al., 2010)
One of the attractive methods is using adsorption technique to purify ethanol-water mixture. In this research, water absorbance is going to be produced from spent bleaching earth and used it for purifying ethanol-water mixture.
1.3. Significant of the Study
Traditionally, zeolites are synthesized as powder, and are used in several chemical industries and their usage has its own problems such as pressure drop, mass and heat transfer related problems when used in applications such as catalysis and adsorption. In this study, hard coherent water adsorbent is going to be produced using modified fusion method which will reduce problems such as pressure drop etc. It is also hope that the value of spent bleaching earth will increase due to the new engineering application.
1.4. Research Objectives
This research attempts to achieve the following objectives:
1.5. Scope of the Study
Parameters to be studied on the performance of water adsorbent are the effect of aging time, fusion temperature and aging temperature.
Spent Bleaching Earth is used as the main raw material to synthesize water adsorbent.
The performance of the water adsorbent will be evaluated by measuring its ability to adsorb water from azeotropic binary ethanol-water mixture by using Karl-Fisher Titrator.
Chapter 2: Literature Review
2.1. Introduction
One of the powerful treatment processes for the removal of ethanol-water mixture is adsorption. Adsorption techniques have been proven successful in removing coloured organics (Jaafar, 2006).
Adsorption is the separation of a substance from one phase accompanied by its accumulation or concentration at the surface of another. It is the process that takes place when a liquid or most commonly a gas known as the adsorbate accumulates on the surface of a solid adsorbent and forming a molecular film (Jaafar, 2006).
The adsorbent is the separating agent used to express the difference between molecules in a mixture: adsorption equilibrium or kinetics. An adsorbent is a substance, usually porous in nature and with a high surface area that can adsorb substances onto its surface by intermolecular forces. Several adsorbents are eligible for such a purpose (Jaafar, 2006).
2.2. Spent Bleaching Earth
Spent bleaching earth (SBE) is the residual adsorbent resulted from the refining process of crude palm oil (CPO) in the cooking oil industry and categorized as solid waste. Bleaching earth residue is basically the mixture of fresh bleaching earth and crude palm oil’s (CPO’s) hydrocarbon component. Hydrocarbon component is transformed into coke or charcoal. SBE waste has become a major problem facing the cooking oil industry as a consequence of its growth. (
Suhartini et al., 2011)
The SBE containing up to 20% (w/w) of oil becomes a pollutant; in addition to the release of unpleasant odors, the elements composing the residual oil represent a danger for the environment. (
Meziti and Boukerroui, 2011)
For minimizing the pollution,
Mana et al. (
2011) reported that two of the three method that used were regeneration by burning and regeneration by solvent extraction.
Farihahusnah
Hussin et al. (
2011) had reviewed several research articles about textural characteristics, surface chemistry and activation of bleaching earth.
2.2.1. Heat Treatment
Farihahusnah
Hussin et al. (
2011) reviewed that the main changes revealed by heat treatment were initially observed at temperatures below about 200 °C where the release of water absorbed in pores and on the surfaces occurs. Between 200°C and 450°C, mass loss attributed to the predehydration process takes place, as a result of the reorganization in the octahedral layer. In the temperature range 450–650°C, dehydroxylation of kaolinite and formation of metakaolinite takes place, while at about 1000°C, mullite was formed, as indicated by an exothermic peak. The observed endothermic peak with a maximum at 552°C may be attributed to dehydroxylation process. The results showed that at calcination temperatures of 550°C, 600°C and 650°C, mass loss increases up to 2 h, while prolonged heating has a negligible effect on the mass loss. For all applied heating times at temperature 700°C, the obtained values for mass loss are nearly the same ∼12%. It can be seen that at calcination temperature 650°C and heating time 2 h, mass loss is almost identical with the values obtained at 700°C. Therefore, the optimal parameters for calcination are temperature of 650°C and heating time of 2 h.
2.2.2. Microwave Treatment
Farihahusnah
Hussin et al. (
2011) reviewed that the temperature and time required by the microwave-heating method for preparing adsorbents are far shorter than by the conventional thermal activation method. Their findings indicated that, the method is simple, economic, time saving and energy efficient.
2.2.3. Optimum Operating Conditions
Farihahusnah
Hussin et al. (
2011) suggested that design of experiments (DOE) as a best technique for process characterization, optimization and modeling. They stated that the technique involves the process of planning and designing an experiment. The collected data is subsequently analyzed and interpreted.
2.3. Ethanol
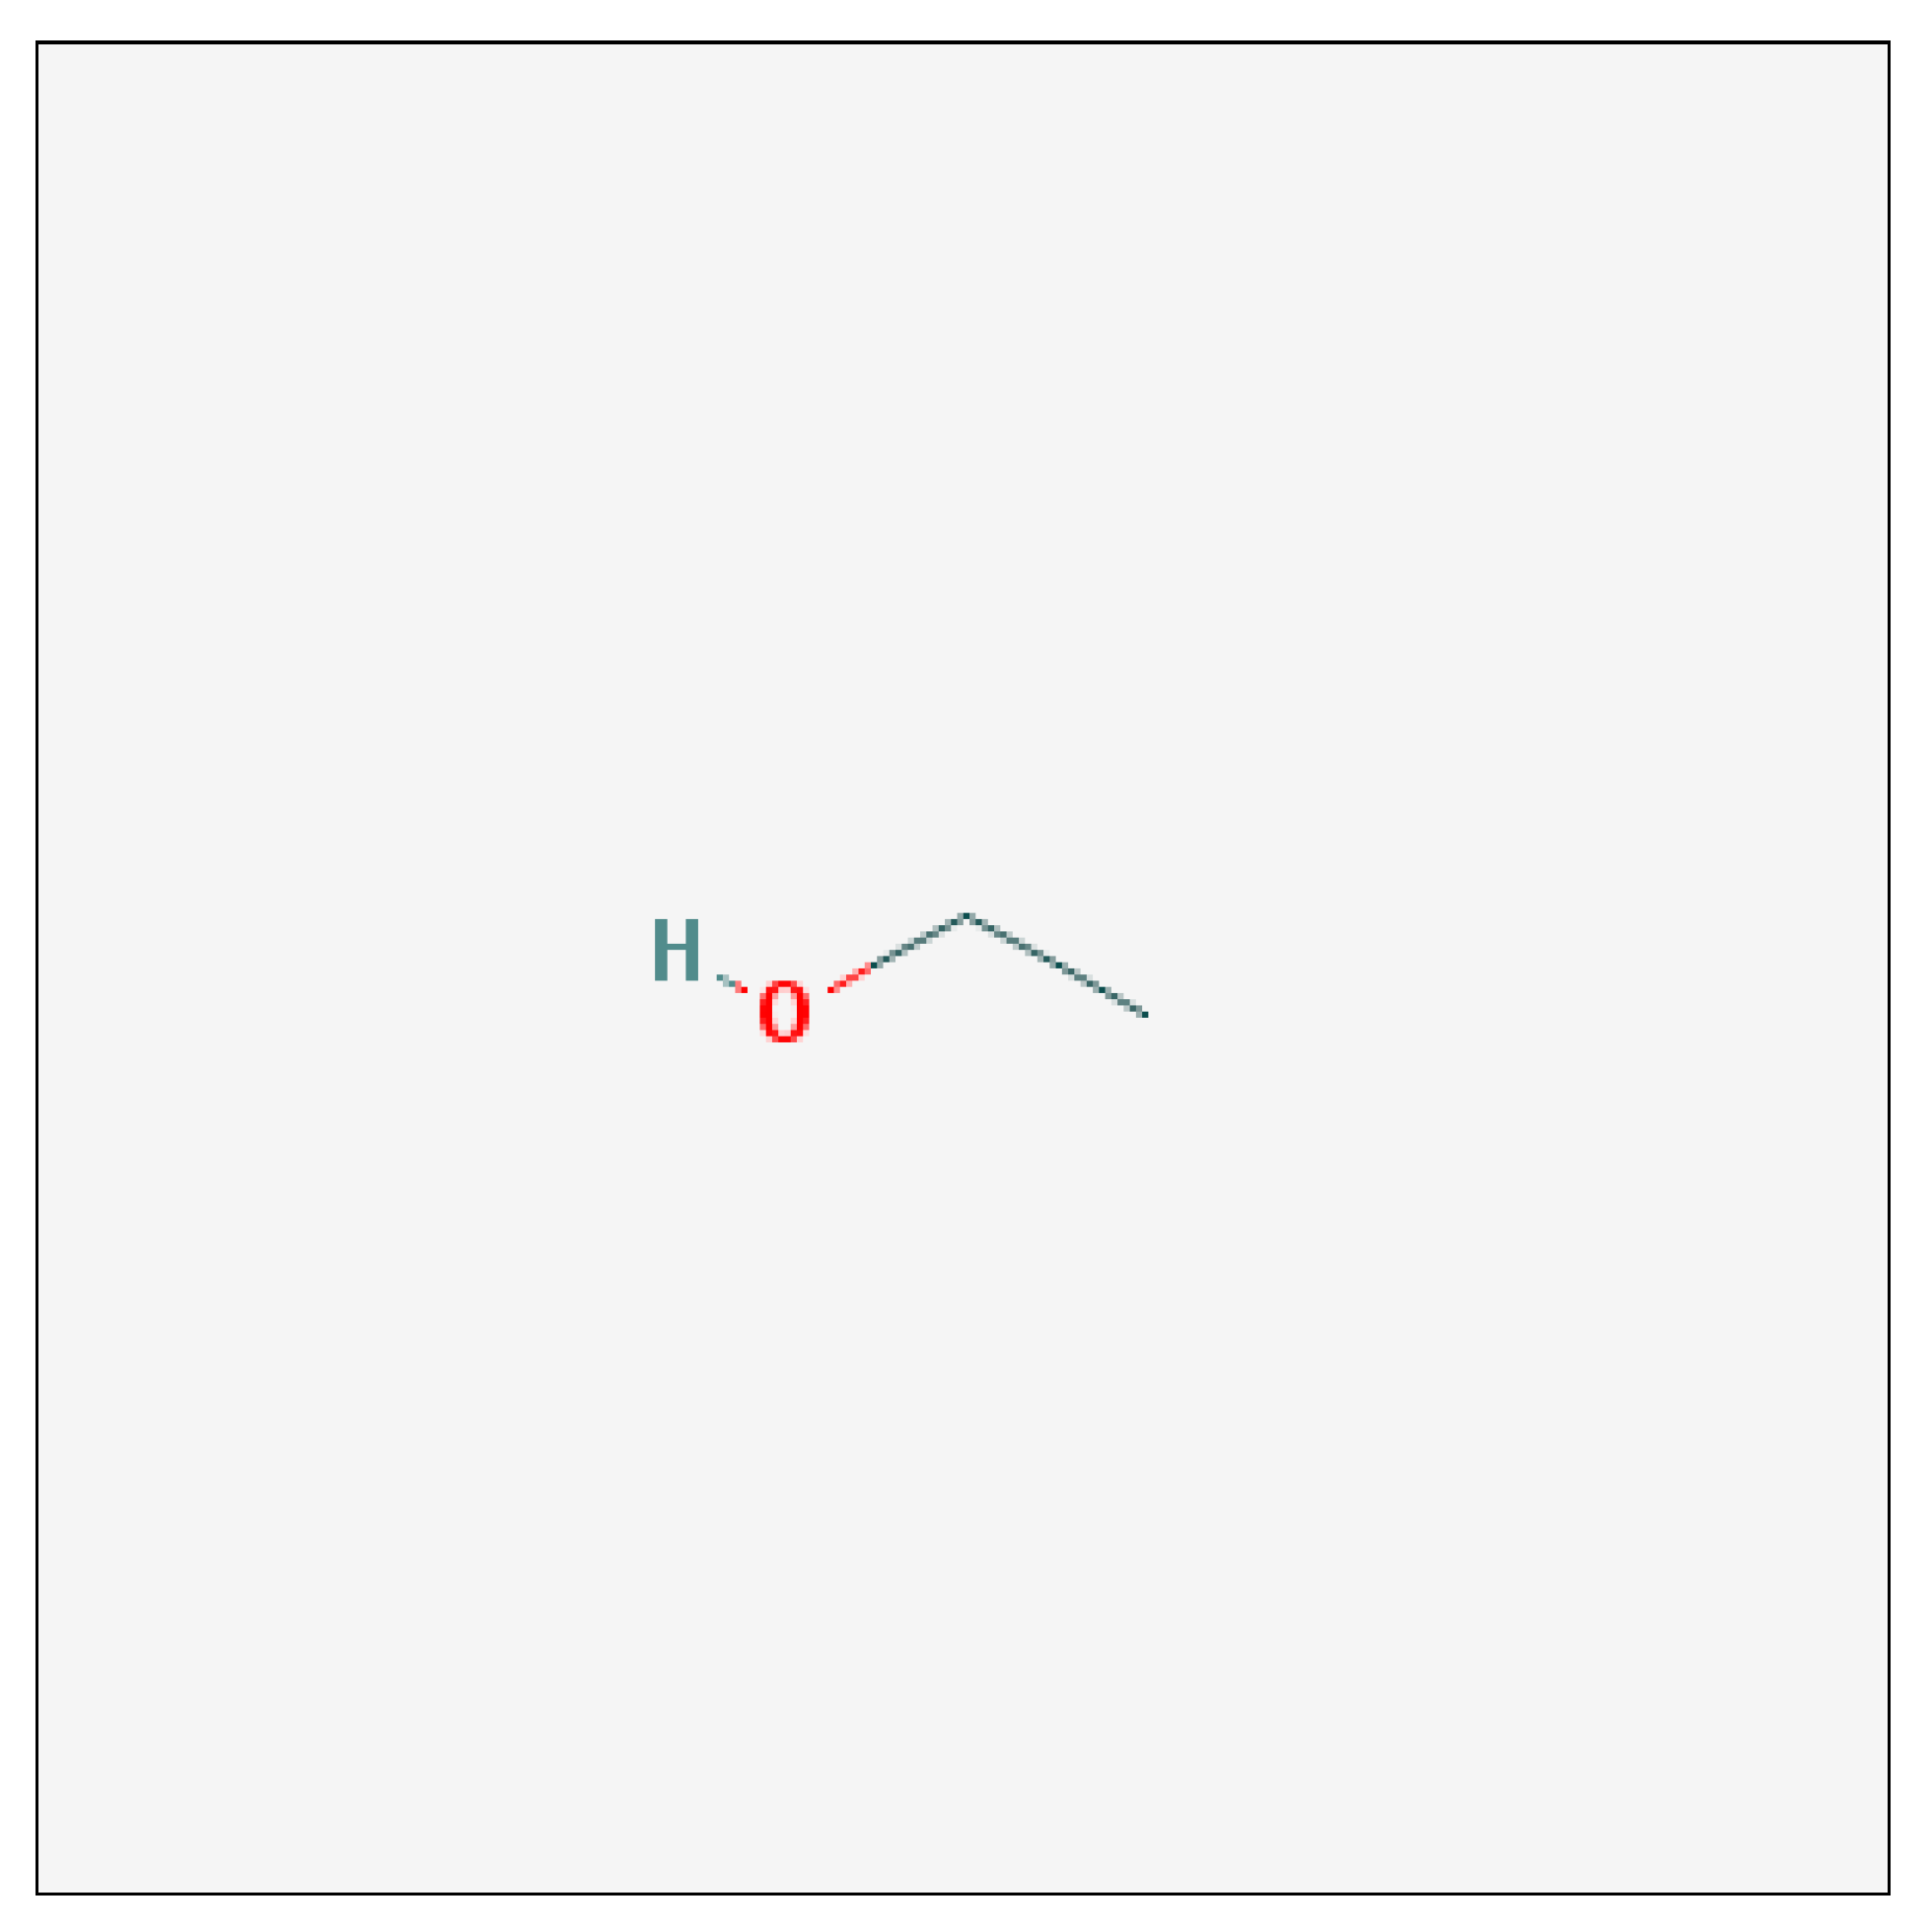
Ethanol is a 2-carbon alcohol. Its molecular formula is CH3CH2OH. An alternative notation is CH3–CH2–OH, which indicates that the carbon of a methyl group (CH3–) is attached to the carbon of a methylene group (–CH2–), which is attached to the oxygen of a hydroxyl group (–OH). It is a constitutional isomer of dimethyl ether (NCBI, 2014).
Figure 2.2.
2-D Structure of Ethanol (NCBI, 2014).
Figure 2.2.
2-D Structure of Ethanol (NCBI, 2014).
2.3.1. Chemical Properties of Ethanol
Ethanol has bactericidal activity and is used often as a topical disinfectant. It is widely used as a solvent and preservative in pharmaceutical preparations as well as serving as the primary ingredient in alcoholic beverages (NCBI, 2014).
2.3.2. Physical Properties of Ethanol
Ethanol is a clear, colourless liquid with a characteristic pleasant odour and burning taste. It is highly flammable. Ethanol is used to dissolve other chemical substances and mixes readily with water and many organic liquids. Ethanol is considered a volatile organic compound by the National Pollutant Inventory (NPI, 2014).
Table 2.1.
Physical Properties of Ethanol (NPI, 2014).
Table 2.1.
Physical Properties of Ethanol (NPI, 2014).
| Melting Point |
-114°C |
| Boiling Point |
78.5°C |
| Specific gravity |
0.8 |
| Flash point |
9-11°C |
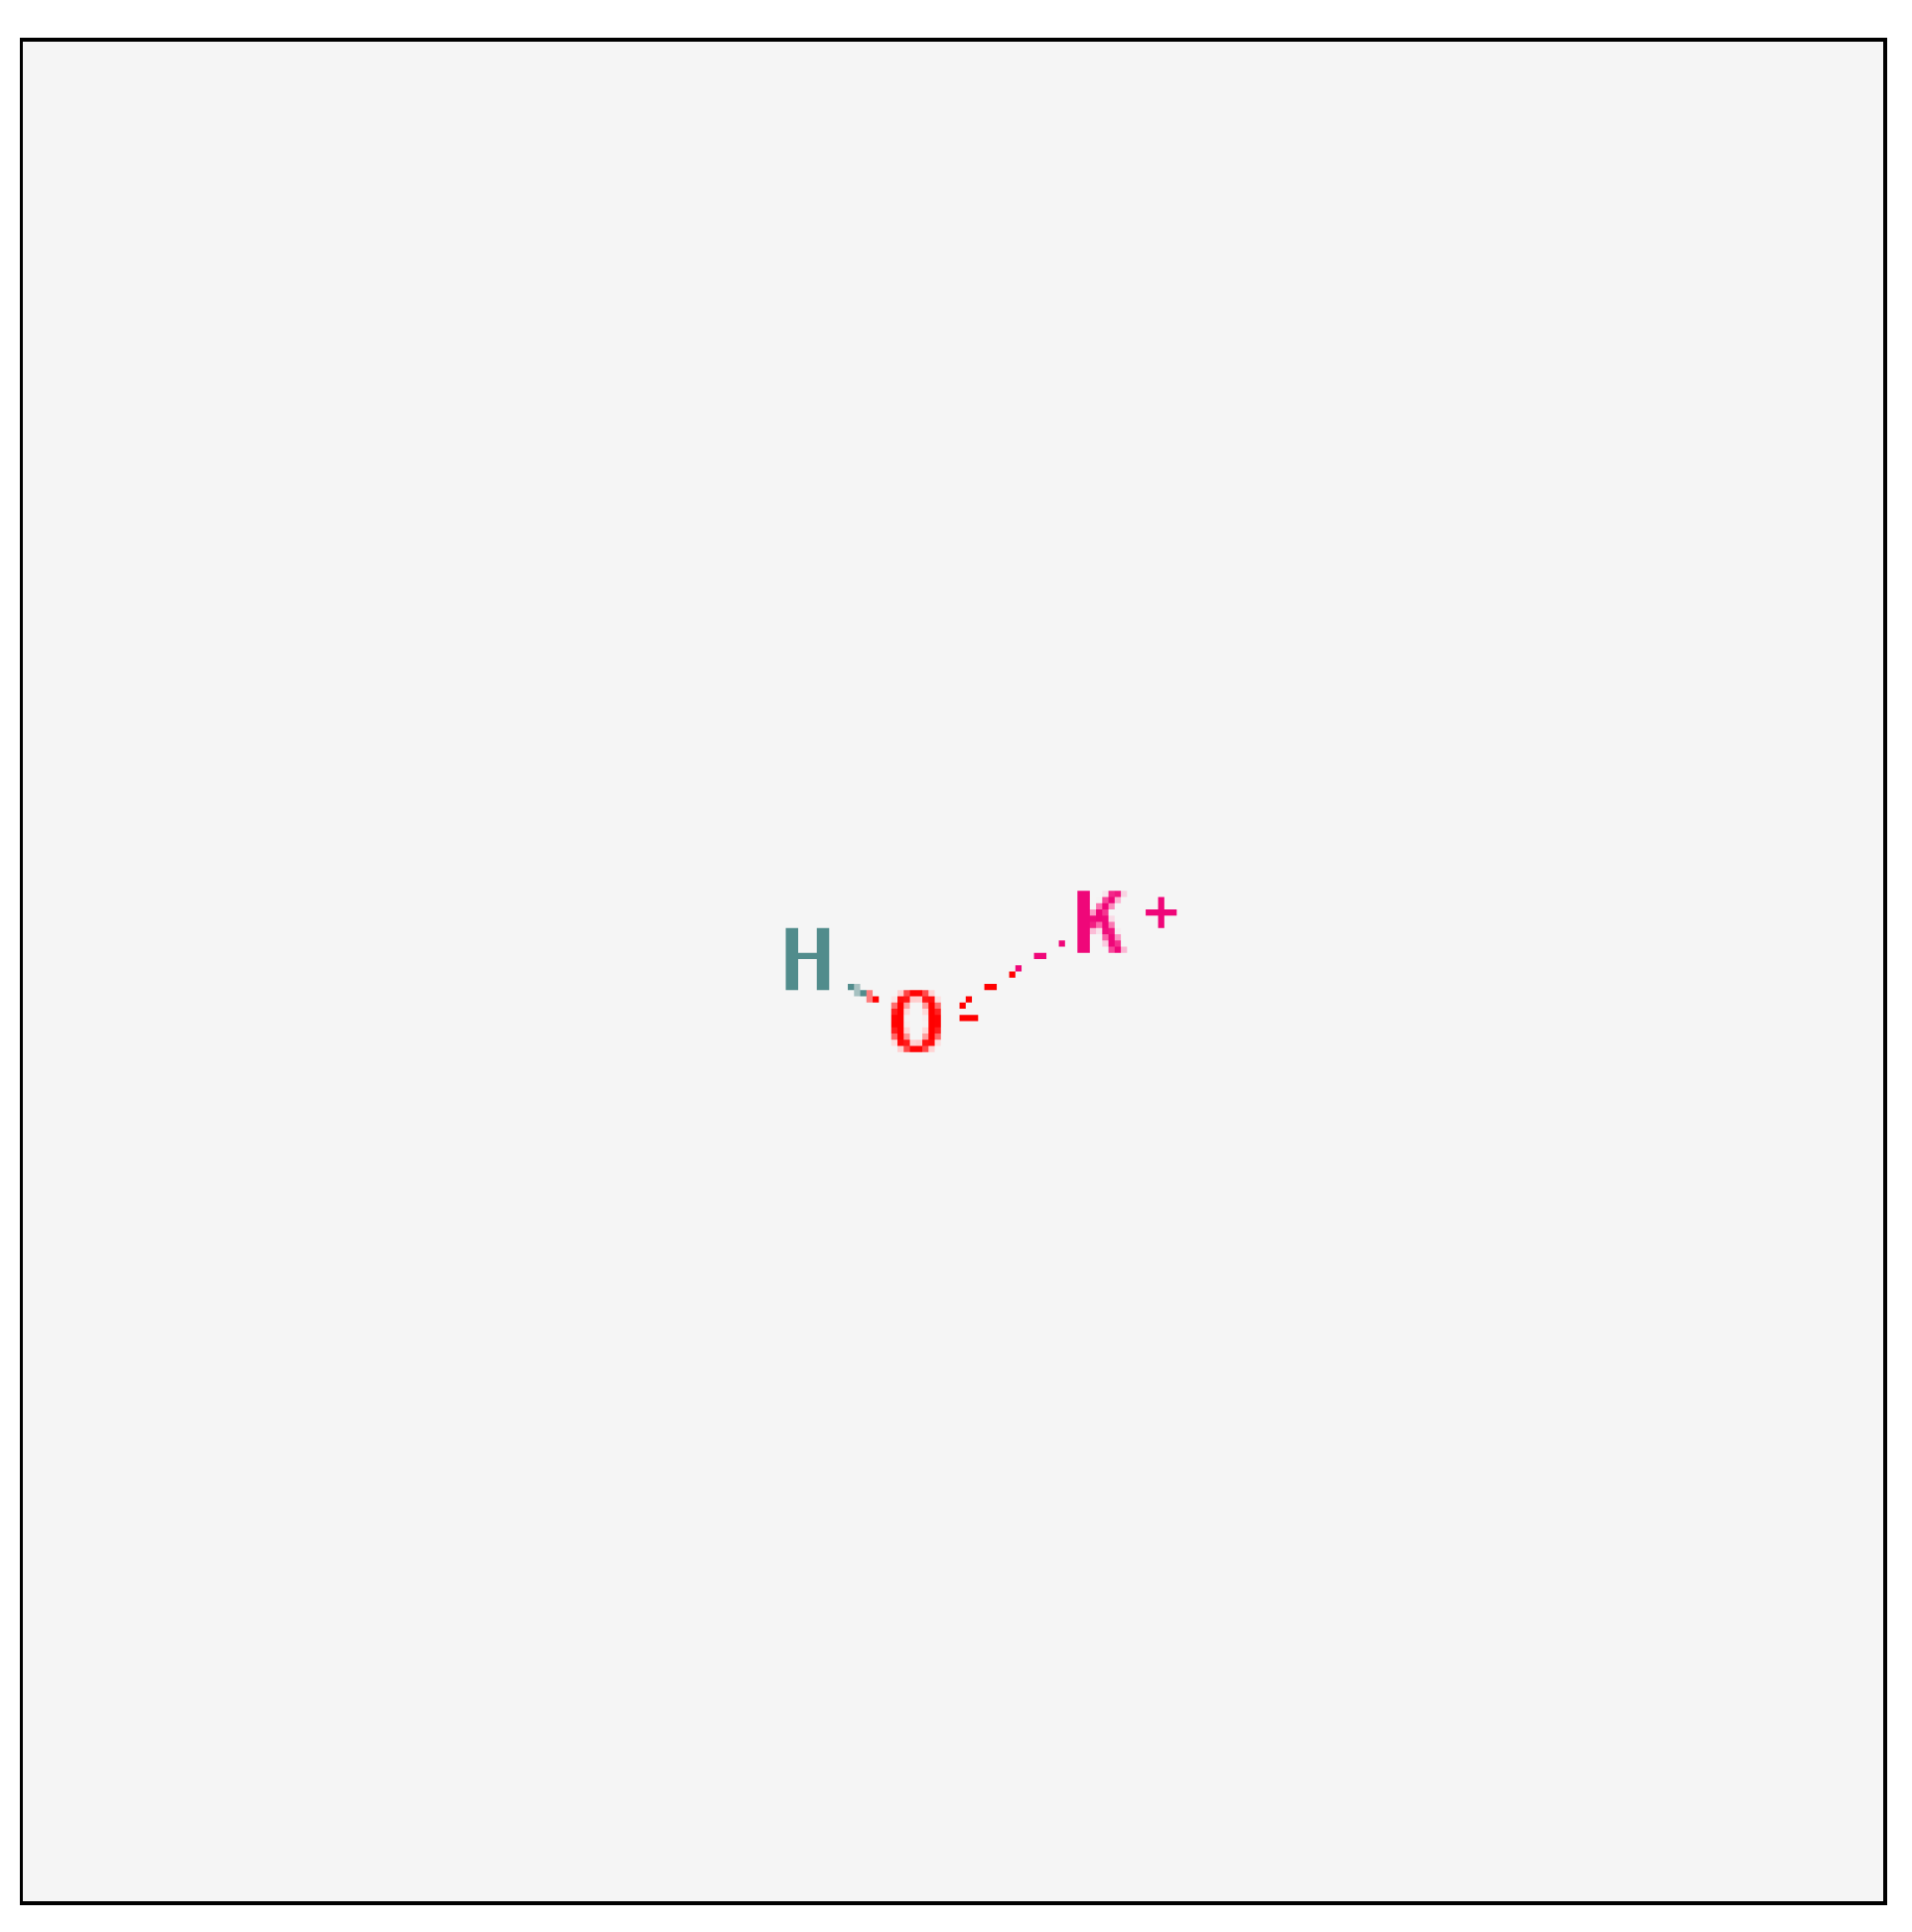
2.4. Potassium Hydroxide
2.4.1. Chemical Properties of Potassium Hydroxide
Potassium hydroxide is a strong alkaline substance that dissociates completely in water into the potassium ion (K+) and hydroxide ion (OH-). The dissolution in water generates heat, so a vigorous reaction can occur when potassium hydroxide is added to water. The vapour pressure of the substance is very low and the melting point is high. Potassium hydroxide solutions attack aluminium and its alloys, giving off hydrogen gas. It can be neutralised with acids (e.g. hydrochloric acid) giving the potassium salts of the acids, which are usually pH neutral and non-corrosive(
Euro Chloro, 2014).
2.4.2. Physical Properties of Potassium Hydroxide
Pure potassium hydroxide is a solid at room temperature, though it is often sold as a liquid. The appearance of the substance and some physical properties are mentioned in the table below(
Euro Chloro, 2014).
| Property |
KOH solid (90%) |
| Physical state |
Solid |
| Colour |
White |
| Density |
2.044 g/cm3 (20 °C) (fused solid) |
| Melting temperature |
406 °C |
| Boiling temperature |
1327 °C |
| Molecular weight |
56.1 g/mol |
2.5. Reviews on Previous Studies and Related Product
Haden (1961) described the method for making hard and coherent zeolite A from from kaolin,
To produce zeolite A, the ratio of silica to alumina should be 1.177 (±0.030) by weight. This ratio can be adjusted by additional source of alumina or silica in clay-alkali mixture. The clay must be dehydrated by calcination at a temperature of about 427 -871°C, preferably at 649 – 816°C. Calcination below 427°C is not sufficient and mullite is formed when the temperature exceeding 871°C. According to this patent, the amount of alkali to be used is in stoichiometry:
Sodium hydroxide or potassium hydroxide or mixture of both can be used as the alkali source. The range of alkali aqueous concentration should be around 30 – 50%, preferably at 40 – 50%. Low concentration yield fine powder or soft aggregate. Excess of alkali should be washed before crystallization takes place. It was reported that no zeolite A is formed when 50% weigh excess of NaOH was used. The alkali-clay mixture can be mechanically shaped by extrusion, milling, molding etc. Later, the reaction between clay and alkali is carried out at low temperature, 21°C – 46°C, preferably at 38°C to avoid the formation of sodalite at 52°C. The reaction time for completion is between 6 – 24 hours, but to ensure completion of reaction, the reaction time can be prolonged to 48 – 96 hours in closed reaction vessel to retain water. A suitable method to crystallize is refluxing the amorphous mass in 5 part 5% NaOH for 48 hours. The polycrystalline aggregate then is washed and dried preferably at 204°C – 370°C.
Ojha et al. (
2004) studied synthesis and characterization of zeolite from fly ash. Coal fly ash was used to synthesize X-type zeolite by alkali fusion followed by hydrothermal treatment. The synthesized zeolite was characterized using various techniques such as X-ray diffraction, scanning electron microscopy, Fourier transform infrared spectroscopy, BET method for surface area measurement etc. The synthesis conditions were optimized to obtain highly crystalline zeolite with maximum BET surface area. The maximum surface area of the product was found to be 383 m
2/g with high purity. The crystallinity of the prepared zeolite was found to change with fusion temperature and a maximum value was obtained at 823 K. The cost of synthesized zeolite was estimated to be almost one-fifth of that of commercial 13X zeolite available in the market.
Rios et al. (
2009) fused kaolin with NaOH with the ratio of kaolin/NaOH 1: 1.2 at the temperature of 600°C for 1 hour. The fused product was grounded and dissolved in water (ratio 1: 4.9) under stirring condition. The hydrogel was aged under static condition for 24 hours and crystallization took place in PTFE bottles at 100°C for 24, 48 and 96 hours. XRD diffraction pattern showed that the products were zeolite A.
Tanaka, H. and A. Fujii (2009) synthesized zeolite A from coal fly ash. They concluded that single phase pure zeolite A was obtained when the ratio of SiO2/Al2O3 was 1.0. At the ratio of SiO2/Al2O3 = 0.5, zeolite A was still present with trace amount of hydroxysodalite. Na-X zeolite started to emerge at the SiO2/Al2O3 ≥ 2 and single phase Na-X was formed at SiO2/Al2O3 = 4.5.
Klamrassame (2010) synthesized sodium alumino silicate from coal fly ashed. In their experiment, the coal fly ash was mixed with NaOH with the ratio of 2.25 by weight and fused in furnace at several different temperatures in air. Later the fused product was crushed and mixed with 10 ml distilled water/g coal fly ash and shake for 12 hour at room temperature. Crystallization was performed under static condition at 90°C for 4 hours.
Kosanovic et al. (
2011) used SiO
2/Al
2O
3 ranged from 1.0 to 2.2 to synthesize zeolite from sodium aluminate and sodium silicate using the method of hydrothermal treatment of the hydrogel. The zeolite produced was the type of zeolite A with different morphological forms.
Purnomo et al. (
2012) studied the synthesis of zeolite from bagasse fly ash using silicate extraction method followed by hydrothermal treatment. They found that pure zeolite X can be produced at the Si/Al ratio of 1.8. At the ratio higher than 1.8, Na-X and Na-P was formed. At lower ratio less than 1.8, zeolite Na-A plus Na-X was formed and pure Na-A can be produced using Si/Al ≤ 1.
Hamdi and Srasra (
2012) studied about removal of phosphate ions from aqueous solution using Tunisian clays minerals and synthetic zeolite. The present work deals with the removal of phosphate ions from aqueous solutions using kaolinitic and smectic clay minerals and synthetic zeolite as adsorbent. The pH effect and adsorption kinetic were studied. It was found that phosphate could be efficiently removed at acidic pH (between 4 and 6) and the second order model of kinetics is more adopted for all samples. The isotherms of adsorption of phosphate ions by the two clays and the zeolite samples show that the zeolite has the highest rate of uptake (52.9 mg P/g). Equilibrium data were well fitted with Langmuir and Freundlich isotherm.
Shah et al. (
2014) studied about the methodology to produce hard coherent water adsorbent using modified fusion method. Efforts were given to find suitable method to produce hard and coherent water adsorbent for ethanol water mixture. Three methods were studied. In the first method, calcined clay was mixed with alumina and KOH or NaOH. Water was added to get 40 -50% solution and thoroughly mixed. The mixture was aged for 48 hours in closed container at 38
oC followed by crystallization. In the second method, calcined clay or pure silica and alumina sources were mixed with NaOH or KOH and fused in furnace at 550
oC for 12 hours. The fused mixture was mixed with water to get 40-55% solution of KOH or NaOH. Aging was carried out at 38
oC for 48 hours before crystallization took place. In the third method, fused mixture from method 2 was mixed with NaOH or KOH and 5 part of water. The mixture was vigorously stirred for 3 hours and left for aging/crystallization at 60
oC for 24 hours in oven. All the products from the three methodologies were washed and dried before being tested for water adsorbance. Results showed that method 2 was able to produce water adsorbent. The experimental results also revealed that the repetition of reflux may improve the water adsorbance performance of the adsorbent. However XRD analysis showed that the product was not the type of zeolite A.
2.6. Application of Zeolites
Daramola et al. (
2012) studied about potential applications of zeolite membranes in reaction coupling separation processes. They found that zeolite has potential applications in synthesis of chemicals in the chemical and petrochemical industry, fuel cell system, selective removal of water from industrial processes, water treatment and purification industry and bio-refinery industry.
In synthesis of chemicals in the chemical and petrochemical industry, the reports have shown that zeolite membranes synthesized through pH are reproducible but the reproducibility is hampered by the quality of the ceramic supports. In general, successful fabrication of reproducible highly selective zeolite membranes, having reasonable membrane fluxes for industrial applications, depends on presence of cheap and high quality membrane supports. In some cases, cheap supports are modified before synthesis or membrane defects healed for enhancing membrane selectivity. On the other hand, optimizing membrane synthesis conditions and membrane configuration will produce result in very reasonable membrane fluxes. In this regard, the use of a hollow fiber membrane configuration is a promising option. (Daramola et al. 2012)
For fuel cell system, the study was aimed at pre-treating the H
2 feed for fuel cell application.
Daramola et al. (
2012) successfully demonstrated the potential application of Zeolite Catalytic Membrane Reactors (ZCMR), composed of a Pt-loaded zeolite Y membrane made by ion-exchanging a zeolite Y membrane with an aqueous solution of [Pt(NH
3)4]Cl
2, which can reduce the concentration of CO in the H
2 rich mixtures to 8 ppm.
In selective removal of water from industrial processes, research (Daramola et al. 2012) has shown that zeolite membranes prepared on hollow fibers could enhance membrane flux by ~30% when compared to other configurations like tubular support.
Meanwhile, for water treatment and purification industry, the authors ((Daramola et al. 2012) reported a 30% increase in total organic carbon (TOC) removal, when compared with the performance of the traditional semi-batch reactor.
In bio-refinery and biotechnological applications, membrane processes are coupled with industrially important biological reactions, for example, in the fermentation of amino acids, antibiotics, and other fine chemicals. (Daramola et al. 2012)
Chapter 3: Methodology
3.1. Materials
3.1.1. List of Chemicals:
Spent Bleaching Earth, KAOLIN MALAYSIA SDN BHD, Malaysia.
Aluminium Oxide (Al2O3), SIGMA ALDRICH, Germany.
Potassium Hydroxide (KOH), MERCK, Germany.
Ethanol (C2H6O), HmBG Chemical.
Hydranal Composite 5, FLUKA ANALYTICAL, Germany.
Deionized water & Distilled water, TATiUC Laboratory.
3.1.2. List of Equipment:
Beaker; 50 ml, 150 ml, 250 ml, PYREX, USA.
Measuring Cylinder, PYREX, USA.
Syringe, SHOTT, USA.
Test Tube, PYREX, USA.
Petri Dish, PYREX, USA.
Electrical furnace, CARBOLITE, England.
Laboratory Drying Oven, POL-EKO, Poland.
Karl Fisher Titrator, METROHM, Switzerland.
3.2. Methods
3.2.1. Method to Synthesize Water Adsorbent from Spent Bleaching Earth
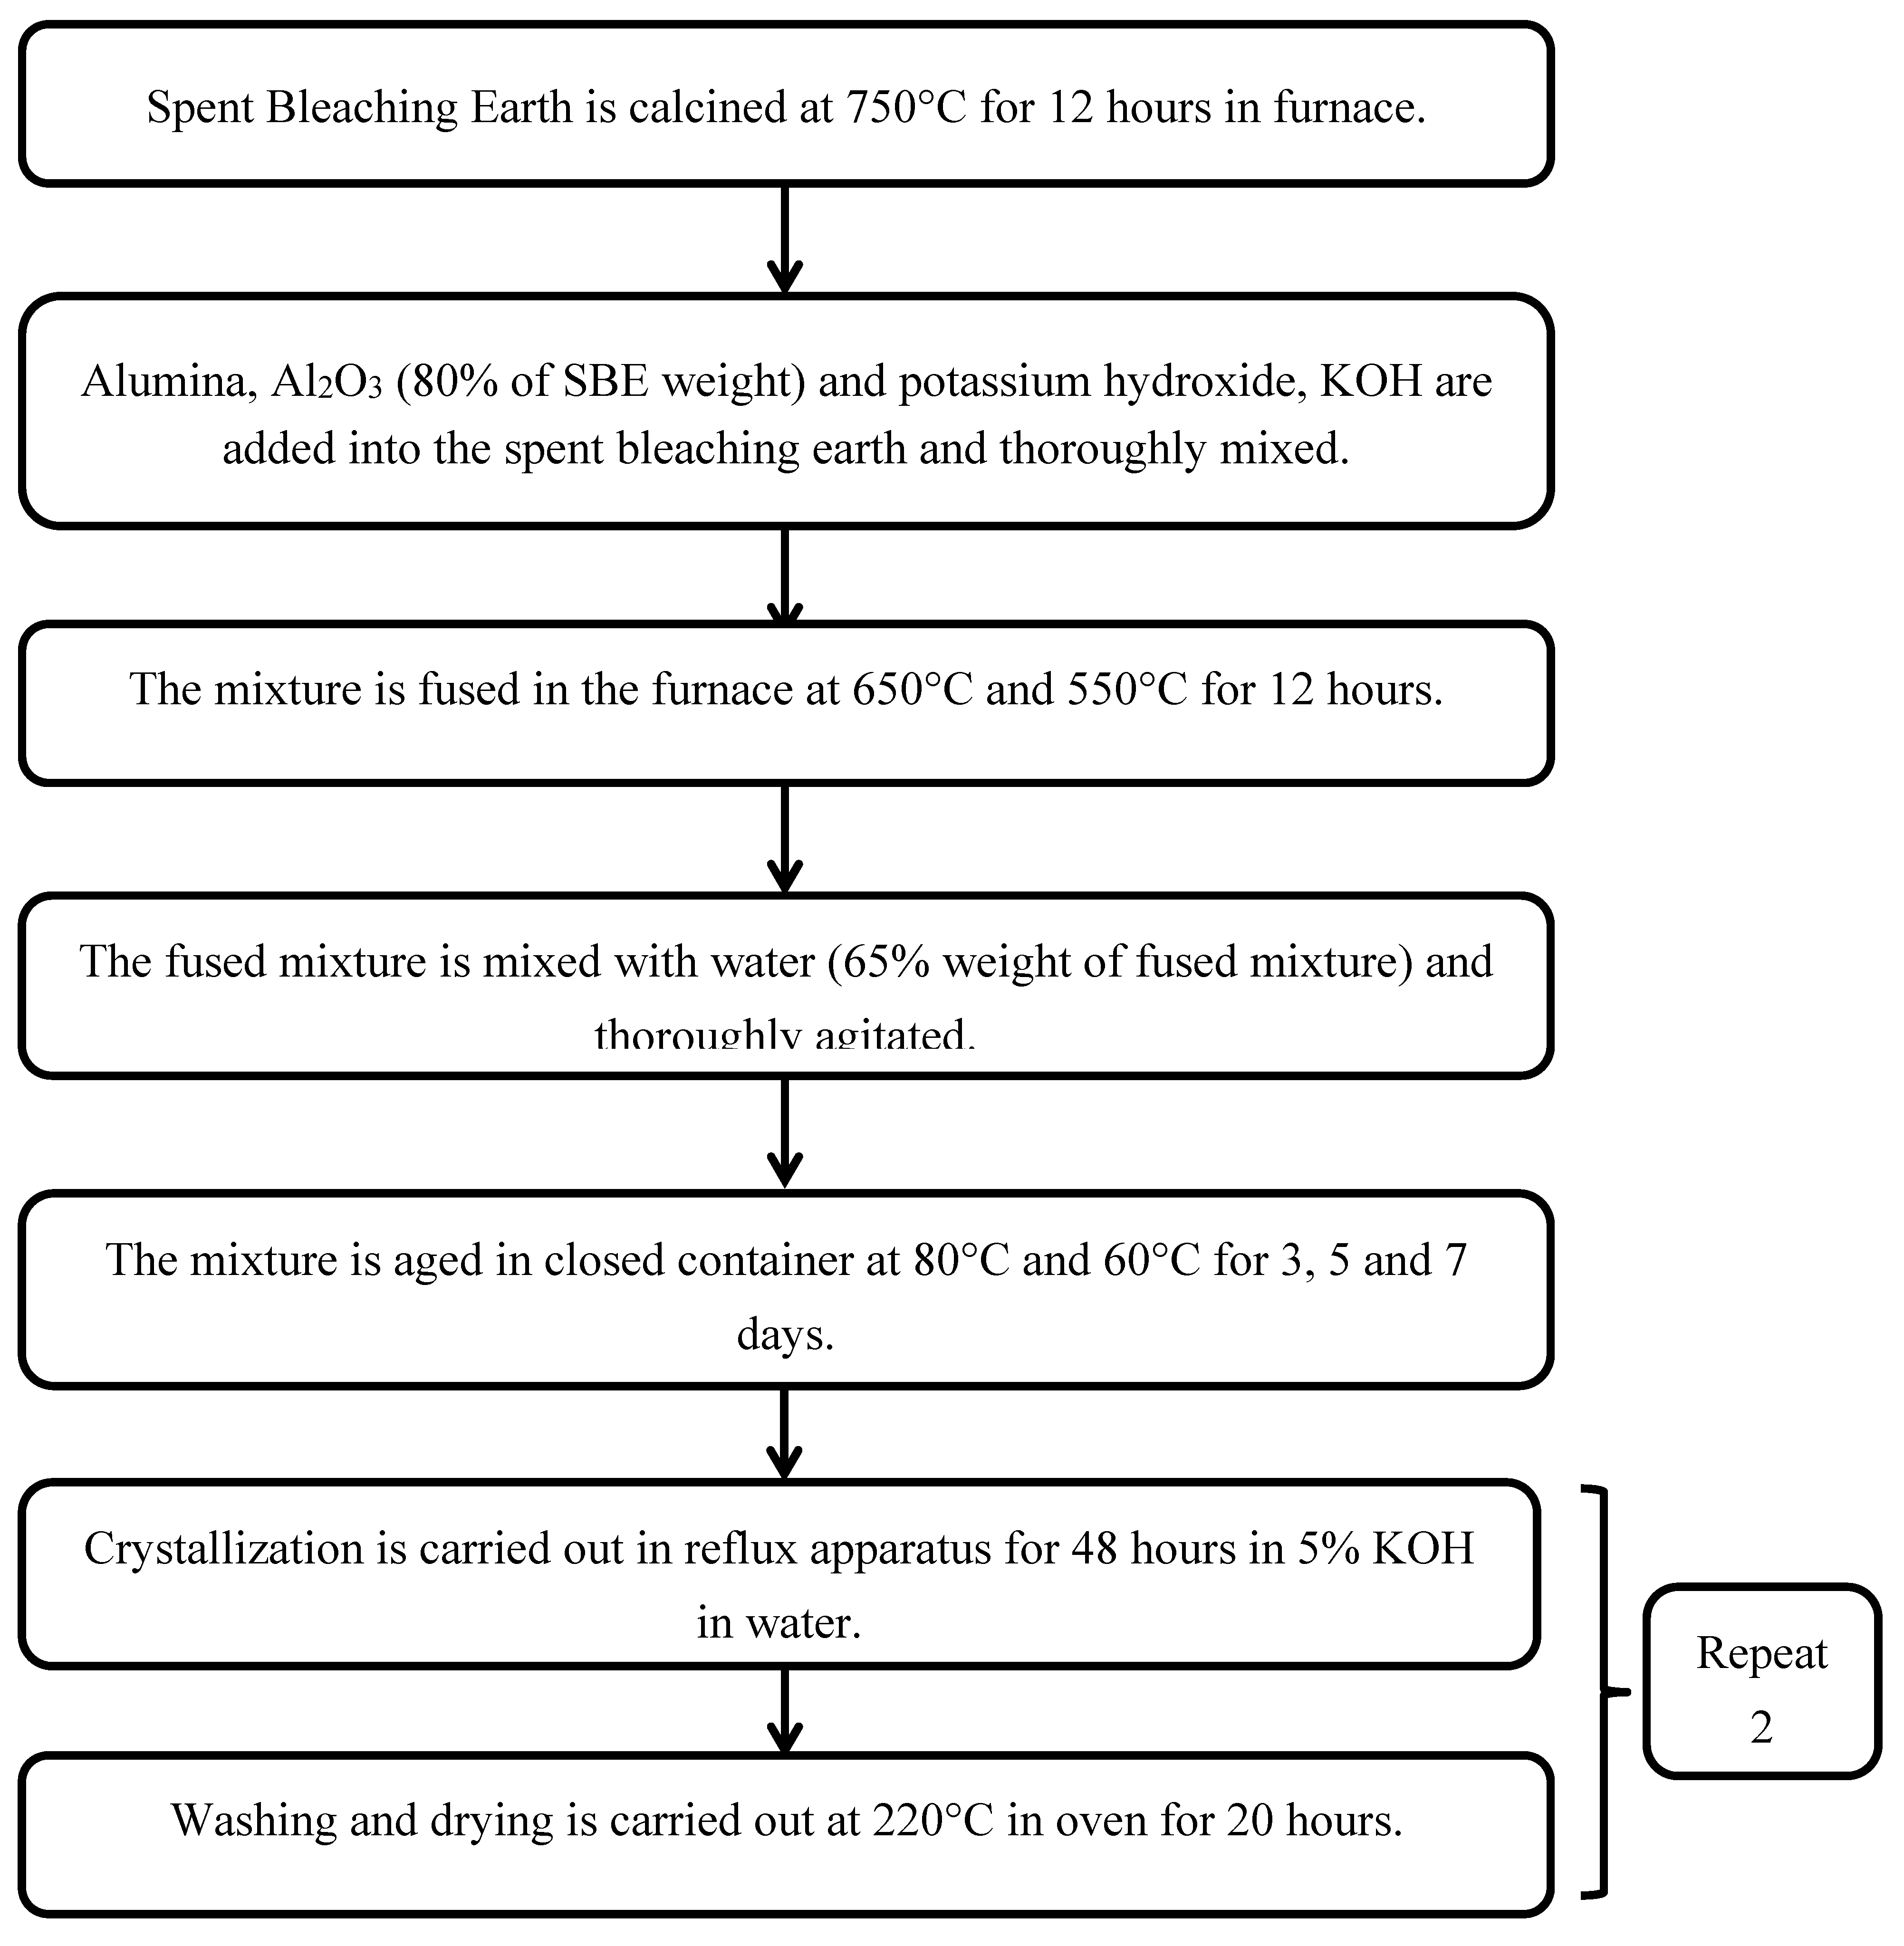
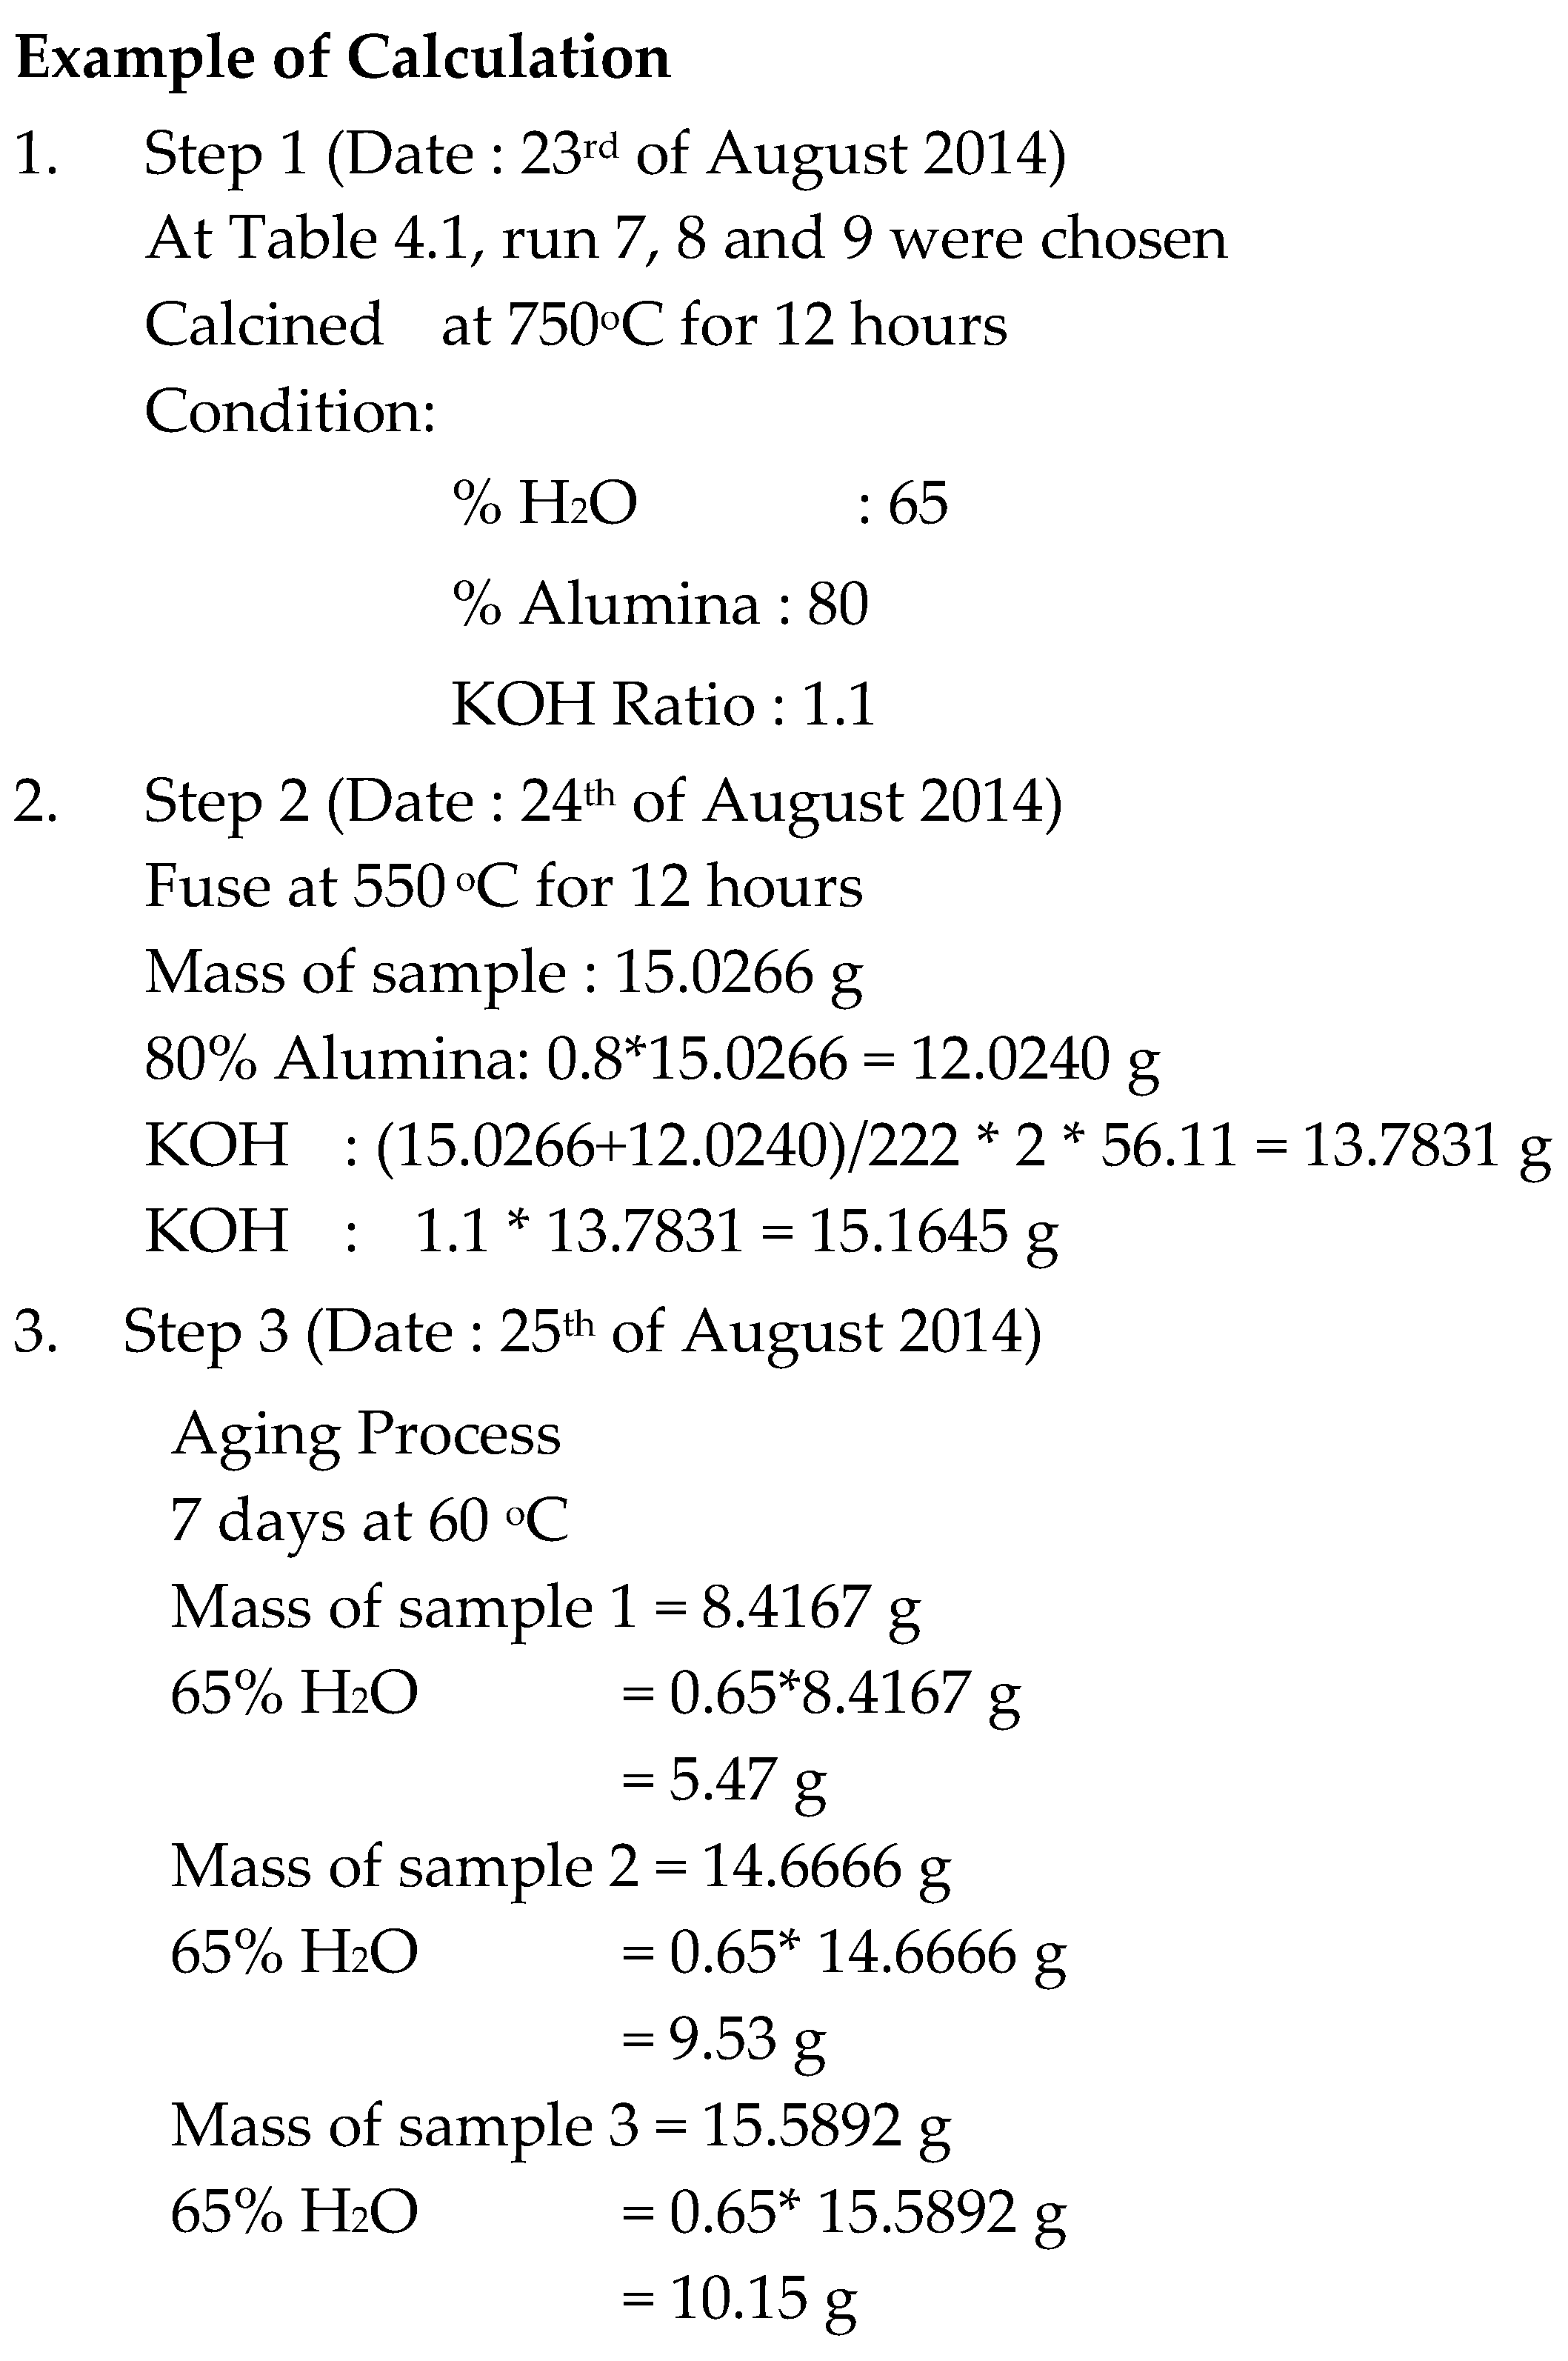
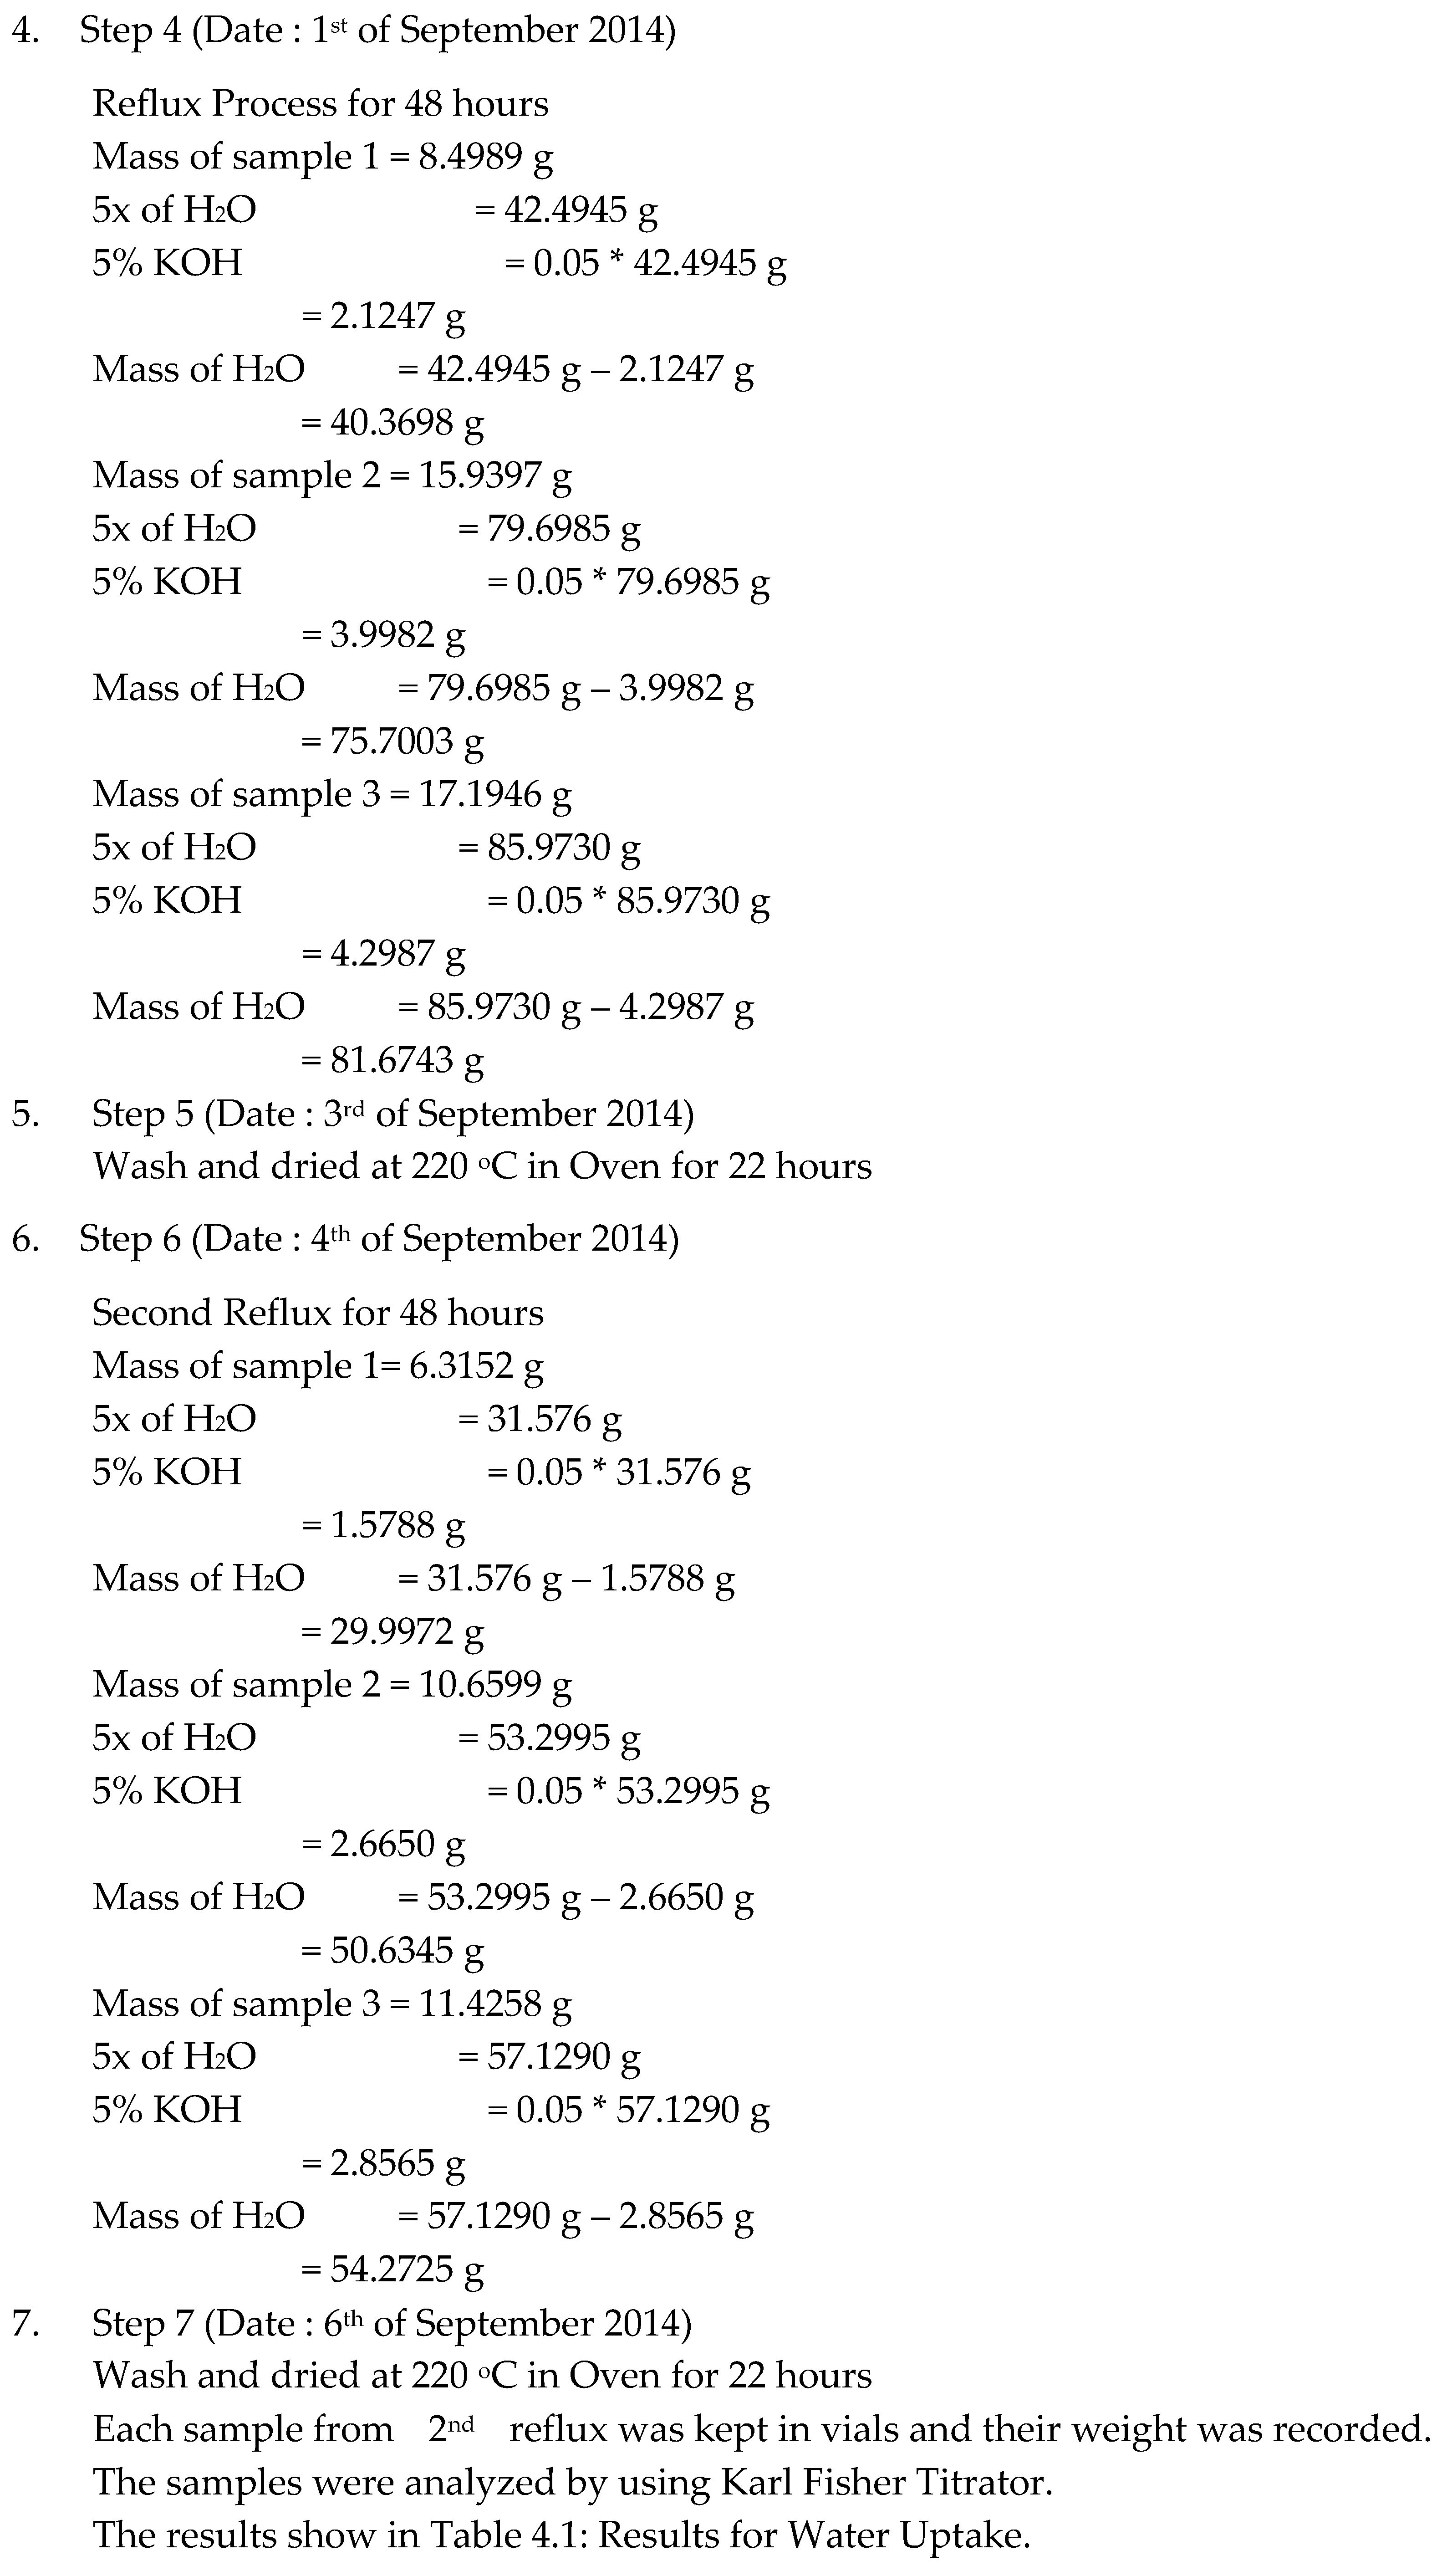
Spent Bleaching Earth is calcined at 750°C for 12 hours in furnace. Alumina, Al2O3 (80% of SBE weight) and potassium hydroxide, KOH are added into the spent bleaching earth and thoroughly mixed. Then, the mixture is fused in the furnace at 650°C and 550°C for 12 hours. The fused mixture is mixed with water (65% weight of fused mixture) and thoroughly agitated. Later, the mixture is aged in closed container at 80°C and 60°C for 3, 5 and 7 days. Crystallization is carried out in reflux apparatus for 48 hours in 5% KOH in water. Washing and drying is carried out at 220°C in oven for 20 hours.
3.2.2. Flow Chart Diagram for Synthesizing Water Adsorbent from Spent Bleaching Earth
Figure 3.4.
Flow Chart Diagram for Synthesizing Water Adsorbent from Spent Bleaching Earth.
Figure 3.4.
Flow Chart Diagram for Synthesizing Water Adsorbent from Spent Bleaching Earth.
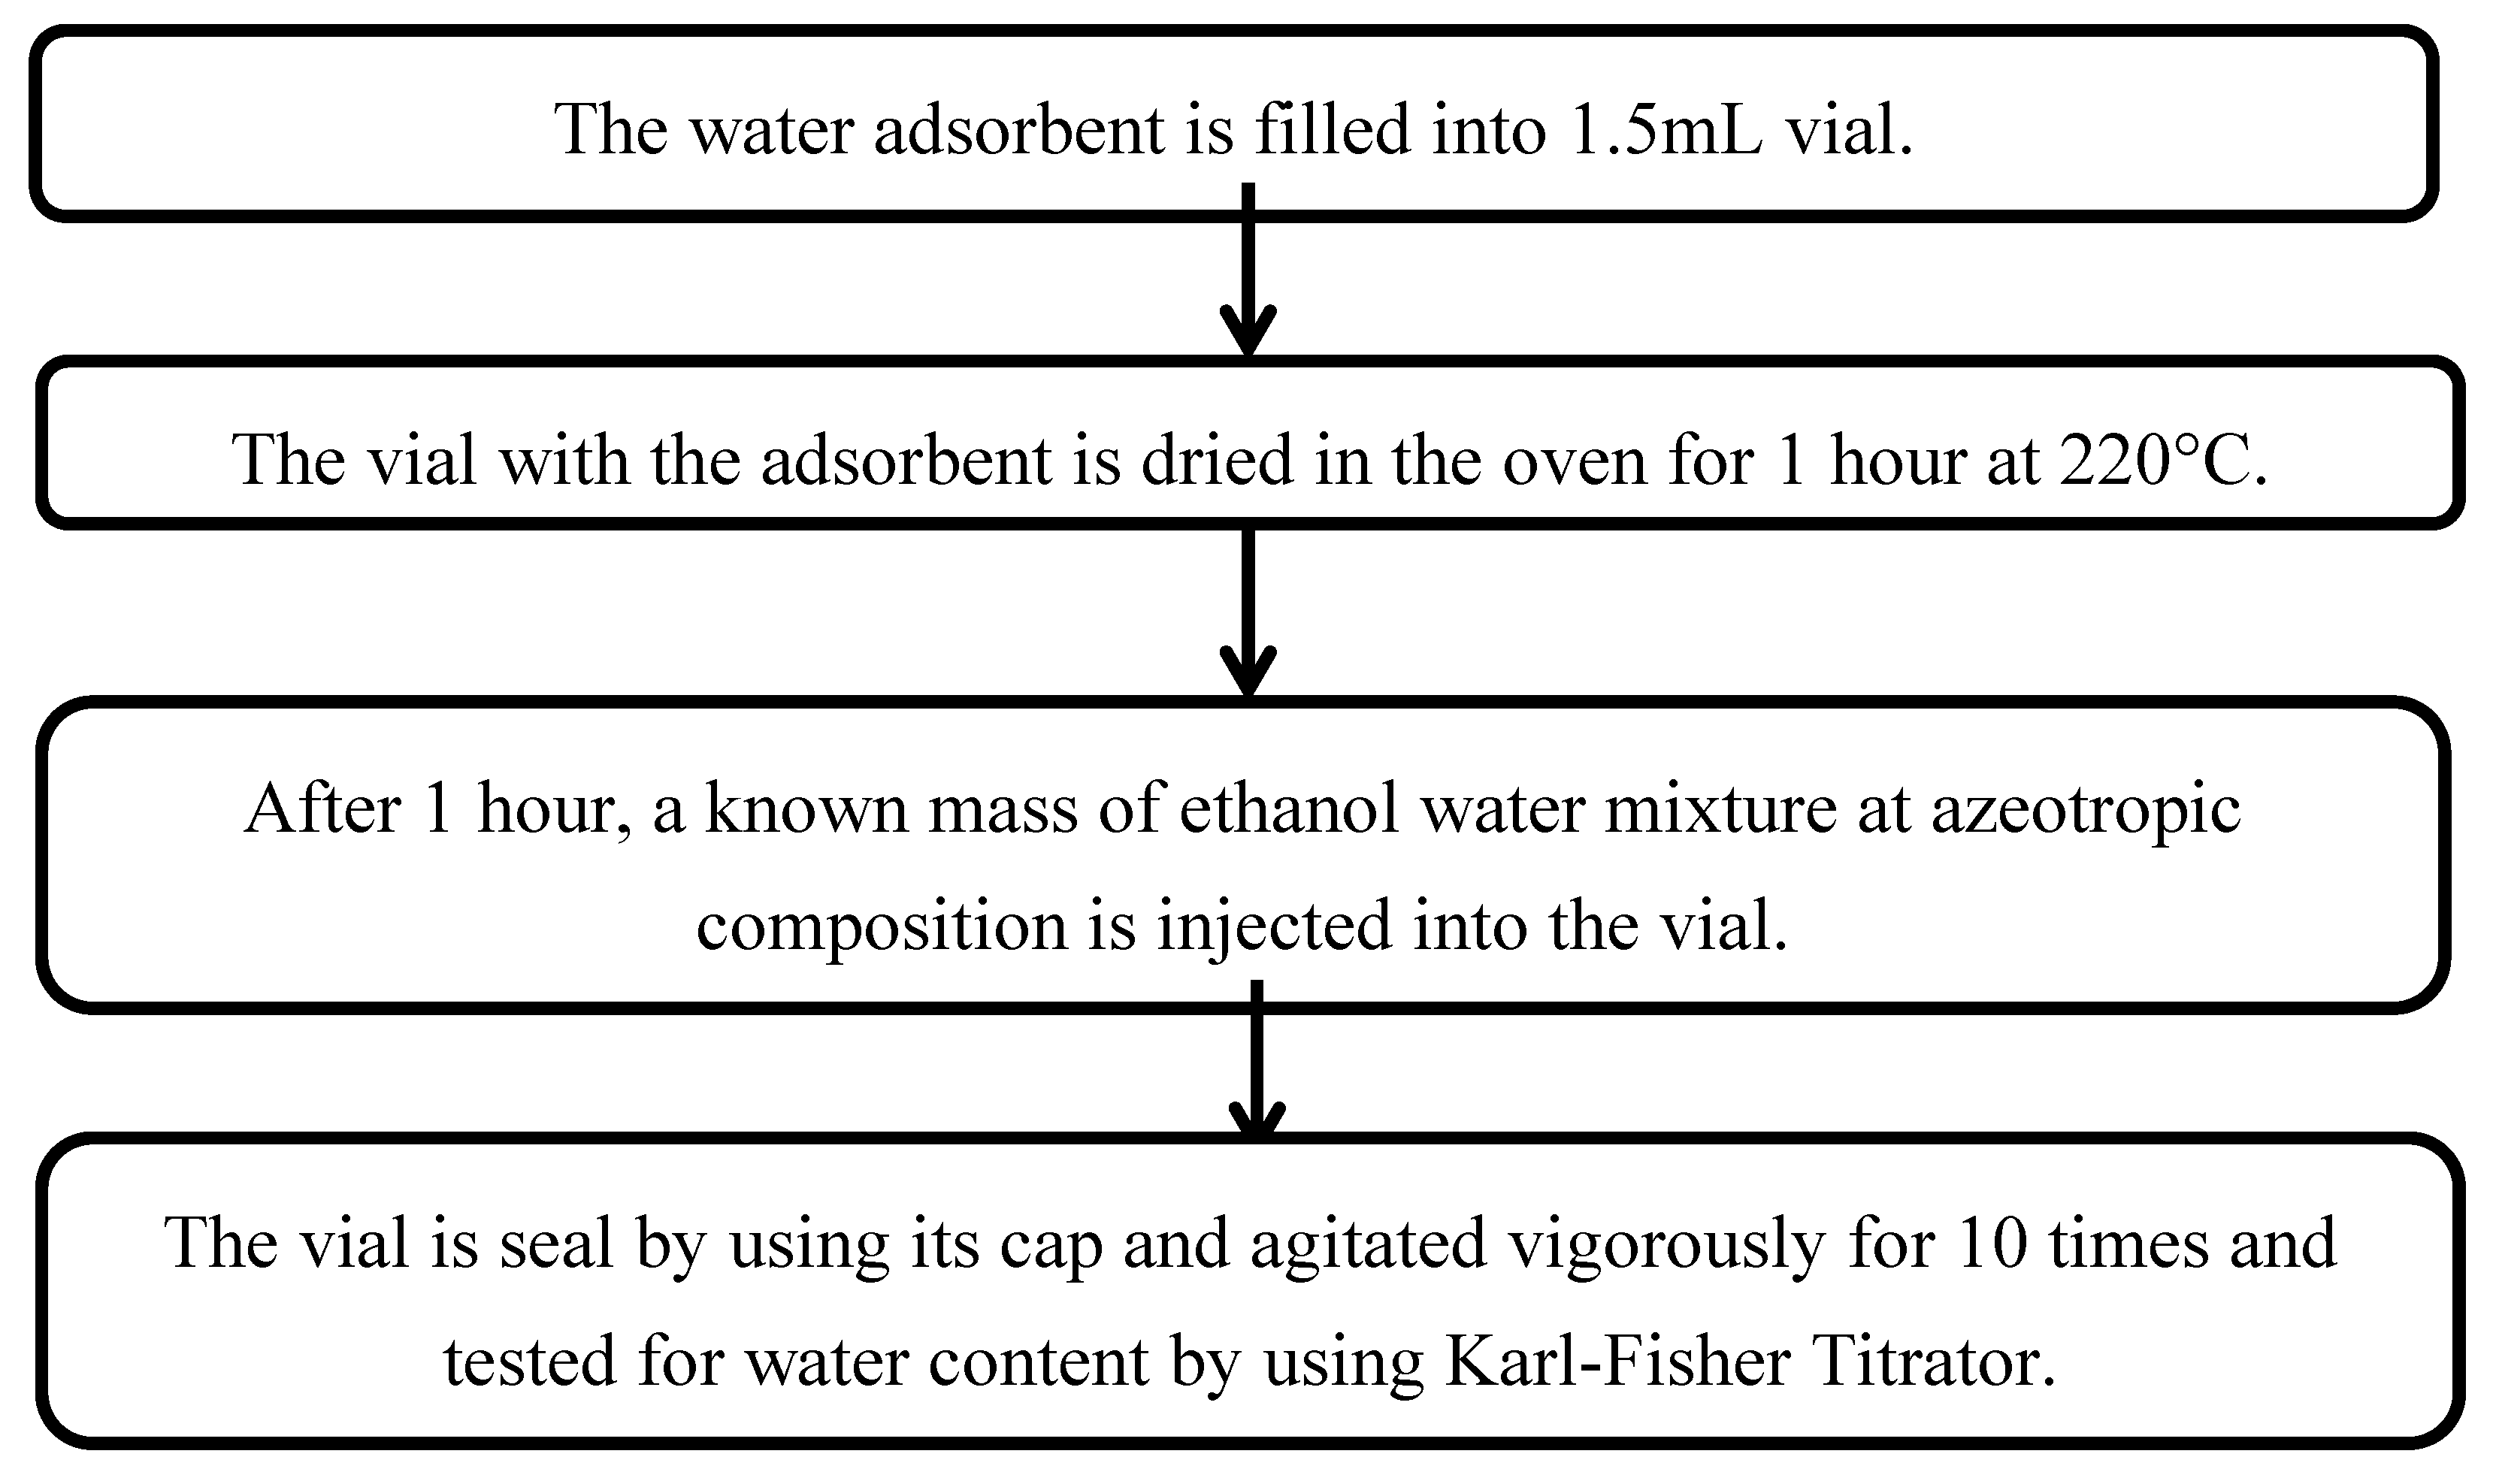
3.2.3. Method to Determine the Performance of Water Adsorbent.
To analyze the performance of water adsorbent, water analysis is carried out by using Karl Fisher Titrator. The water adsorbent is filled into 1.5mL vial. The vial with the adsorbent is dried in the oven for 1 hour at 220°C. After 1 hour, a known mass of ethanol water mixture at azeotropic composition is injected into the vial. The vial is seal by using its cap and agitated vigorously for 10 times and tested for water content by using Karl-Fisher Titrator.
3.2.4. Flow Chart Diagram in Determination the Performance of Water Adsorbent
Figure 5.
Flow Chart Diagram in Determination The Performance of Water Adsorbent.
Figure 5.
Flow Chart Diagram in Determination The Performance of Water Adsorbent.
Chapter 4: Results and Discussions
4.1. Introduction
The purpose of this section is to study the effect of fusion temperature, aging temperature and aging time to the water uptake of the synthesized water adsorbent from spent bleaching earth (SBE) using modified fusion method. Full multilevel factorial experiments were carried out and the results were analyzed for main and interaction effects using Minitab Statistical Software Release 14. With the aid of the software, a model for the response (i.e. water uptake) as the function of studied factor was generated. Finally, the best combination of factors was determined to produce water adsorbent with maximum water uptake.
4.2. Results for Synthesize from Spent Bleaching Earth
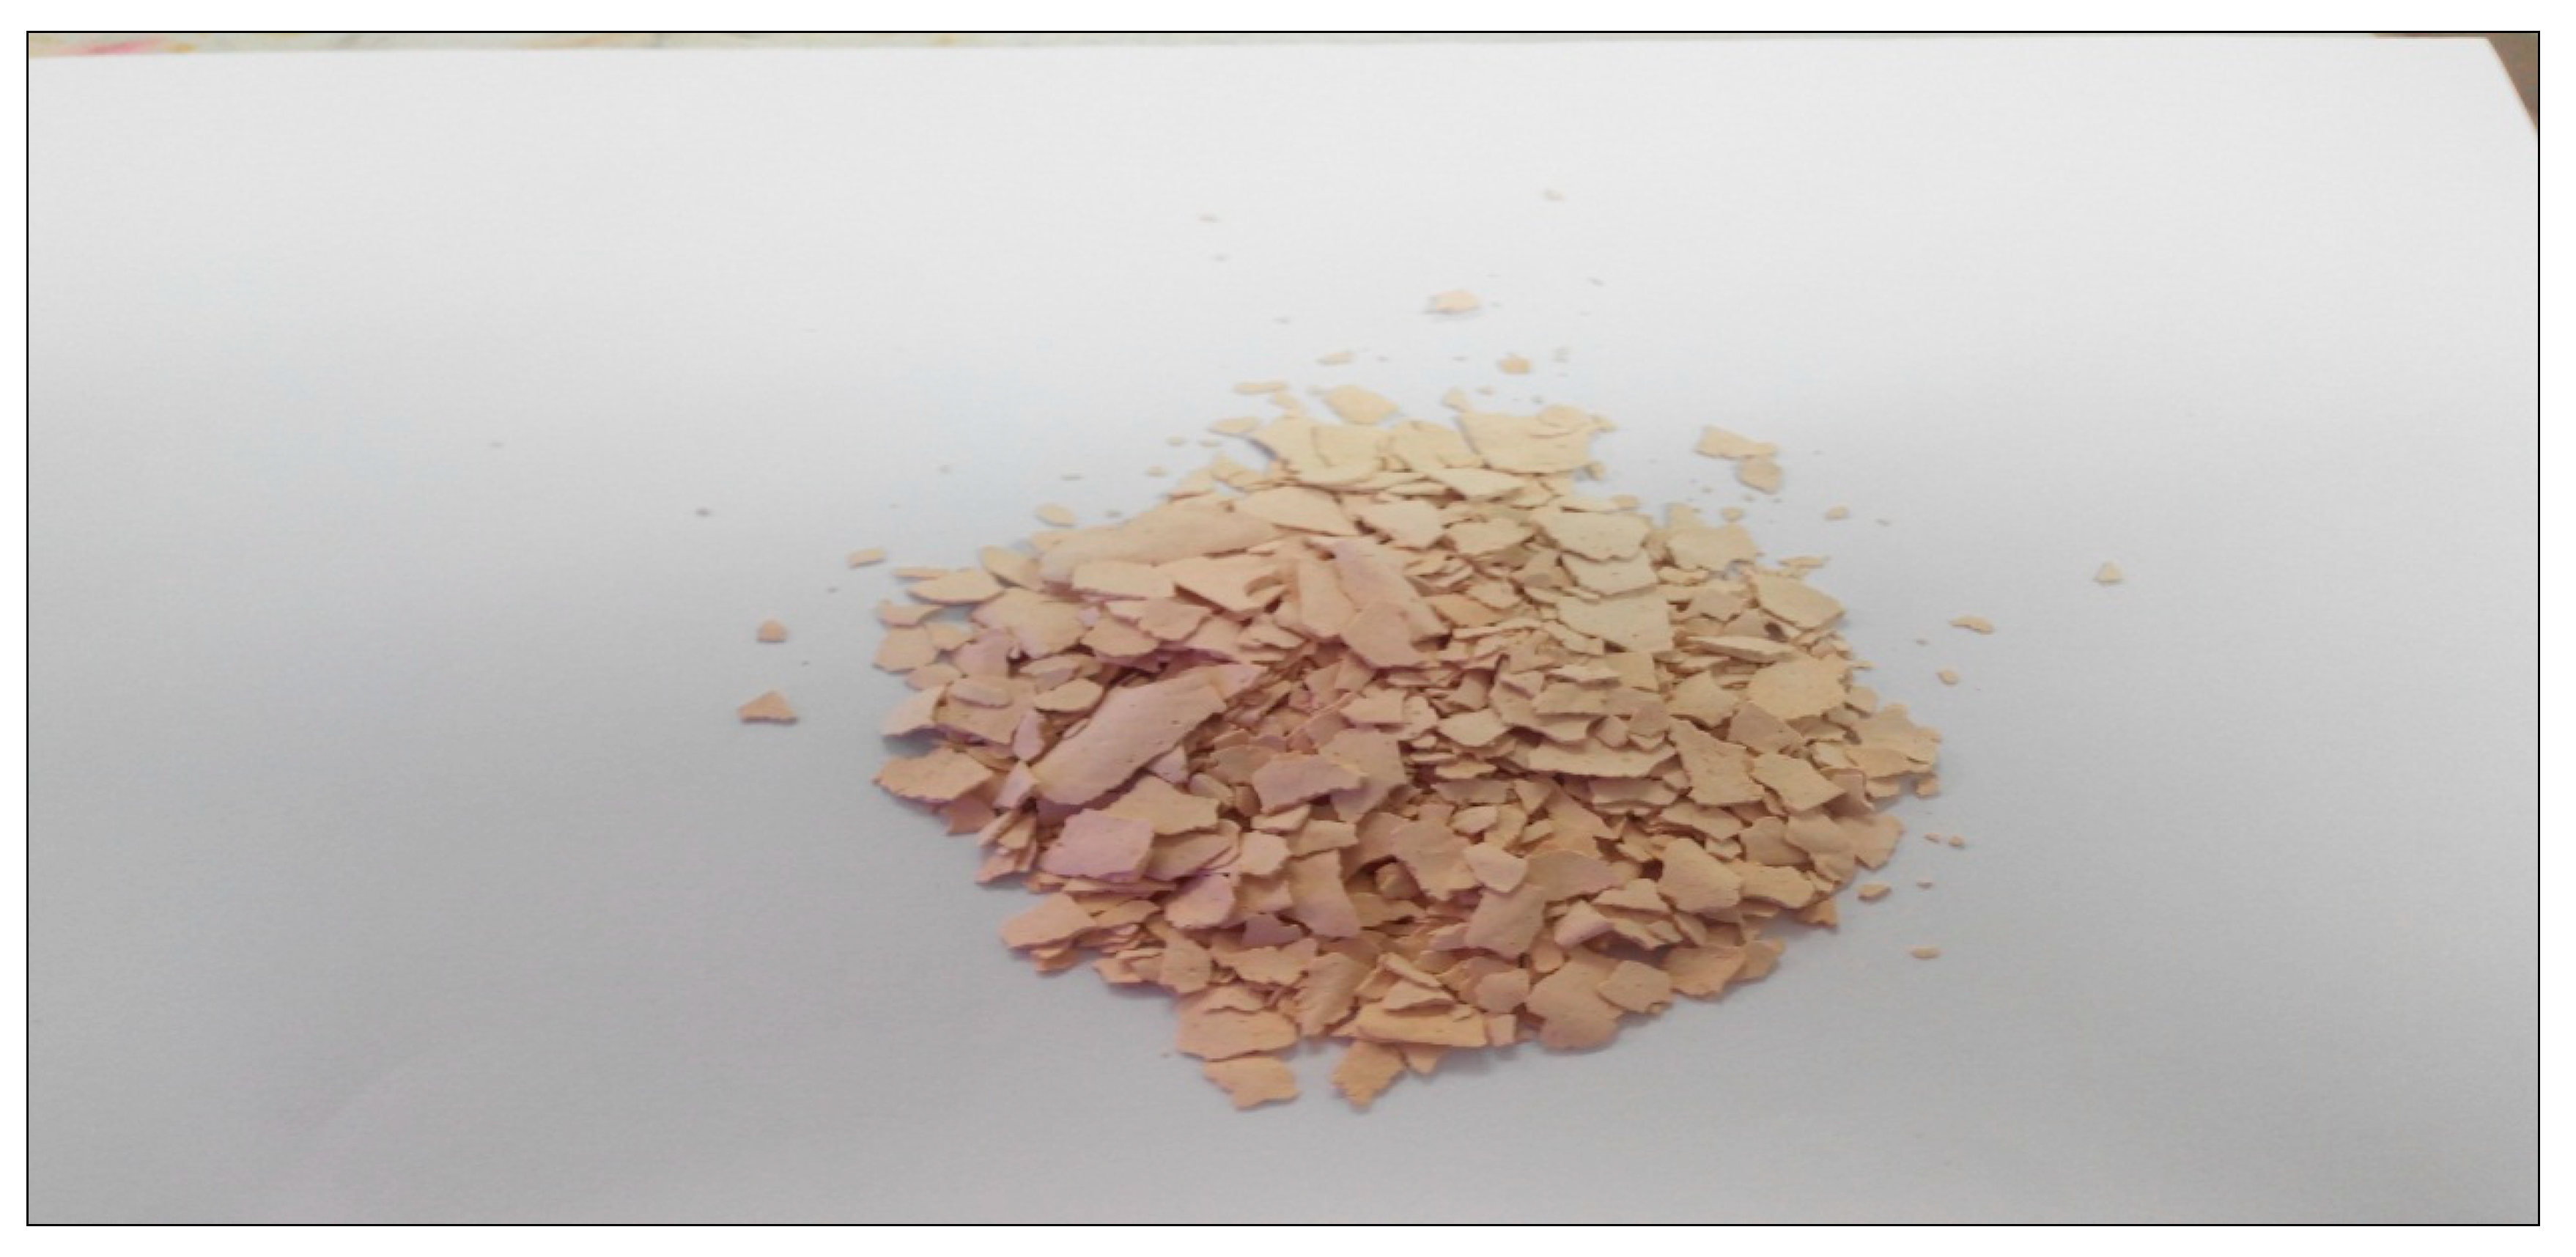
Figure 4.6 showed the figure of Spent Bleaching Earth after synthesizing in order to produce zeolite.
Figure 4.6.
Zeolite produced from Spent Bleaching Earth.
Figure 4.6.
Zeolite produced from Spent Bleaching Earth.
4.3. Results for Water Uptake
Table 4.3 showed the combination of factors and results generated by Minitab Software. The first factor is fusion temperature with the level of 550°C and 650°C. The second factor is aging temperature with the level of 60°C and 80°C. The third factor is aging time with the level of 3, 5 and 7 days. Three replicates were carried out for each set of factorial combination. The total number of experiments were 36. The response studied were water uptake. These results were further analyzed with the aid of Minitab Statistical Software for the main effects and interaction.
Table 4.3.
Results for Water Uptake.
Table 4.3.
Results for Water Uptake.
| Run |
Fusion Temperature
(°C) |
Aging Temperature
(°C) |
Aging Time
(days) |
Water Uptake
(g H2O / g Water Adsorbent) |
| 1 |
550 |
60 |
3 |
0.022100 |
| 2 |
550 |
60 |
3 |
0.028943 |
| 3 |
550 |
60 |
3 |
0.028670 |
| 4 |
550 |
60 |
5 |
0.019884 |
| 5 |
550 |
60 |
5 |
0.015150 |
| 6 |
550 |
60 |
5 |
0.017300 |
| 7 |
550 |
60 |
7 |
0.032700 |
| 8 |
550 |
60 |
7 |
0.025680 |
| 9 |
550 |
60 |
7 |
0.026140 |
| 10 |
550 |
80 |
3 |
0.039740 |
| 11 |
550 |
80 |
3 |
0.042730 |
| 12 |
550 |
80 |
3 |
0.033480 |
| 13 |
550 |
80 |
5 |
0.026800 |
| 14 |
550 |
80 |
5 |
0.032370 |
| 15 |
550 |
80 |
5 |
0.027020 |
| 16 |
550 |
80 |
7 |
0.032400 |
| 17 |
550 |
80 |
7 |
0.036320 |
| 18 |
550 |
80 |
7 |
0.025980 |
| 19 |
650 |
60 |
3 |
0.021950 |
| 20 |
650 |
60 |
3 |
0.036490 |
| 21 |
650 |
60 |
3 |
0.035500 |
| 22 |
650 |
60 |
5 |
0.032100 |
| 23 |
650 |
60 |
5 |
0.037570 |
| 24 |
650 |
60 |
5 |
0.027890 |
| 25 |
650 |
60 |
7 |
0.025130 |
| 26 |
650 |
60 |
7 |
0.023000 |
| 27 |
650 |
60 |
7 |
0.014060 |
| 28 |
650 |
80 |
3 |
0.025220 |
| 29 |
650 |
80 |
3 |
0.022400 |
| 30 |
650 |
80 |
3 |
0.029810 |
| 31 |
650 |
80 |
5 |
0.017400 |
| 32 |
650 |
80 |
5 |
0.029190 |
| 33 |
650 |
80 |
5 |
0.023400 |
| 34 |
650 |
80 |
7 |
0.011900 |
| 35 |
650 |
80 |
7 |
0.013000 |
| 36 |
650 |
80 |
7 |
0.023600 |
4.4. Analysis of Variance for Water Uptake (Factorial)
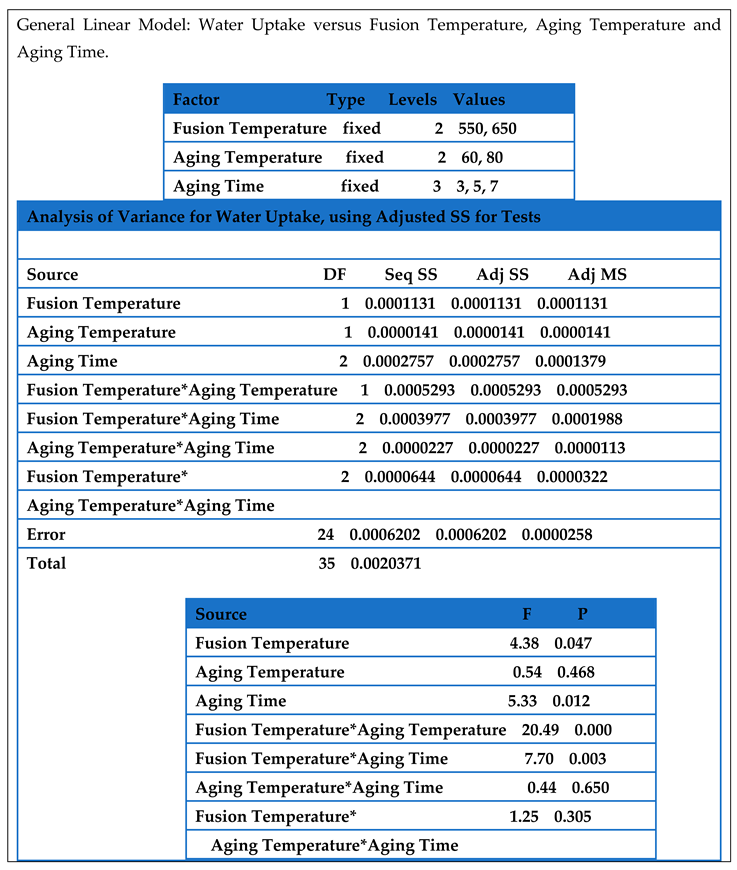
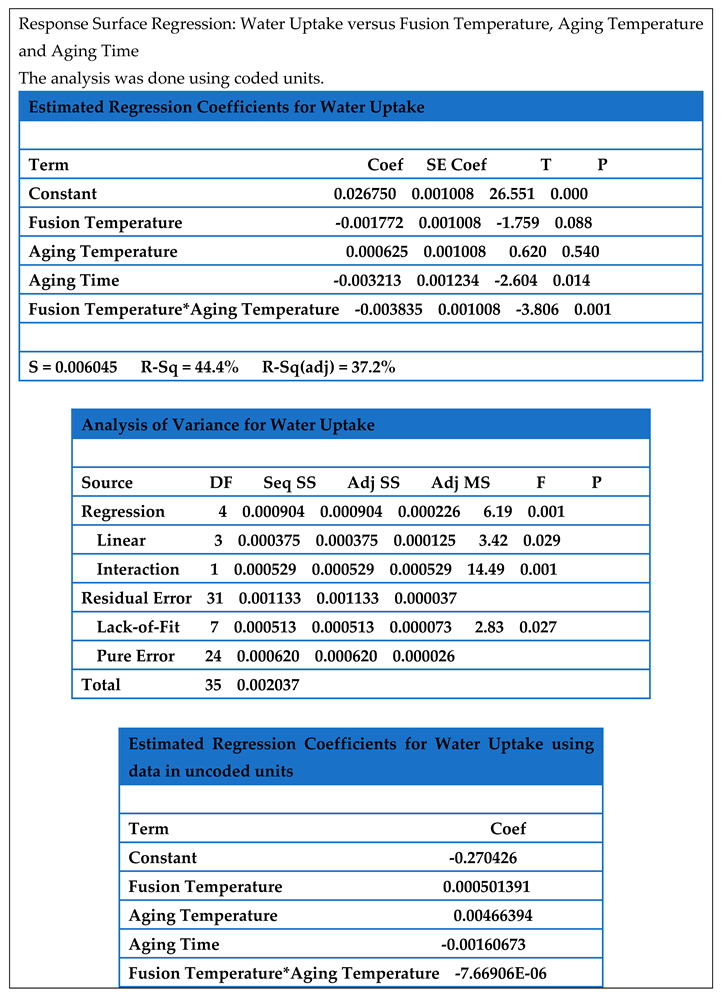
Table 4.2 showed the analysis of variance for water uptake of the synthesized sample. The P value showed that the main factors of fusion temperature and aging time were significant (P < 0.05). This analysis showed that aging temperature has little effect to the water uptake. The analysis also, showed that 2- way interaction of fusion temperature with aging temperature and fusion temperature with aging time were significant to the response (water uptake) while 3-way interaction of fusion temperature, aging temperature and aging time were not significant to the response (water uptake).
Table 4.4.
Analysis of Variance for Water Uptake.
Table 4.4.
Analysis of Variance for Water Uptake.
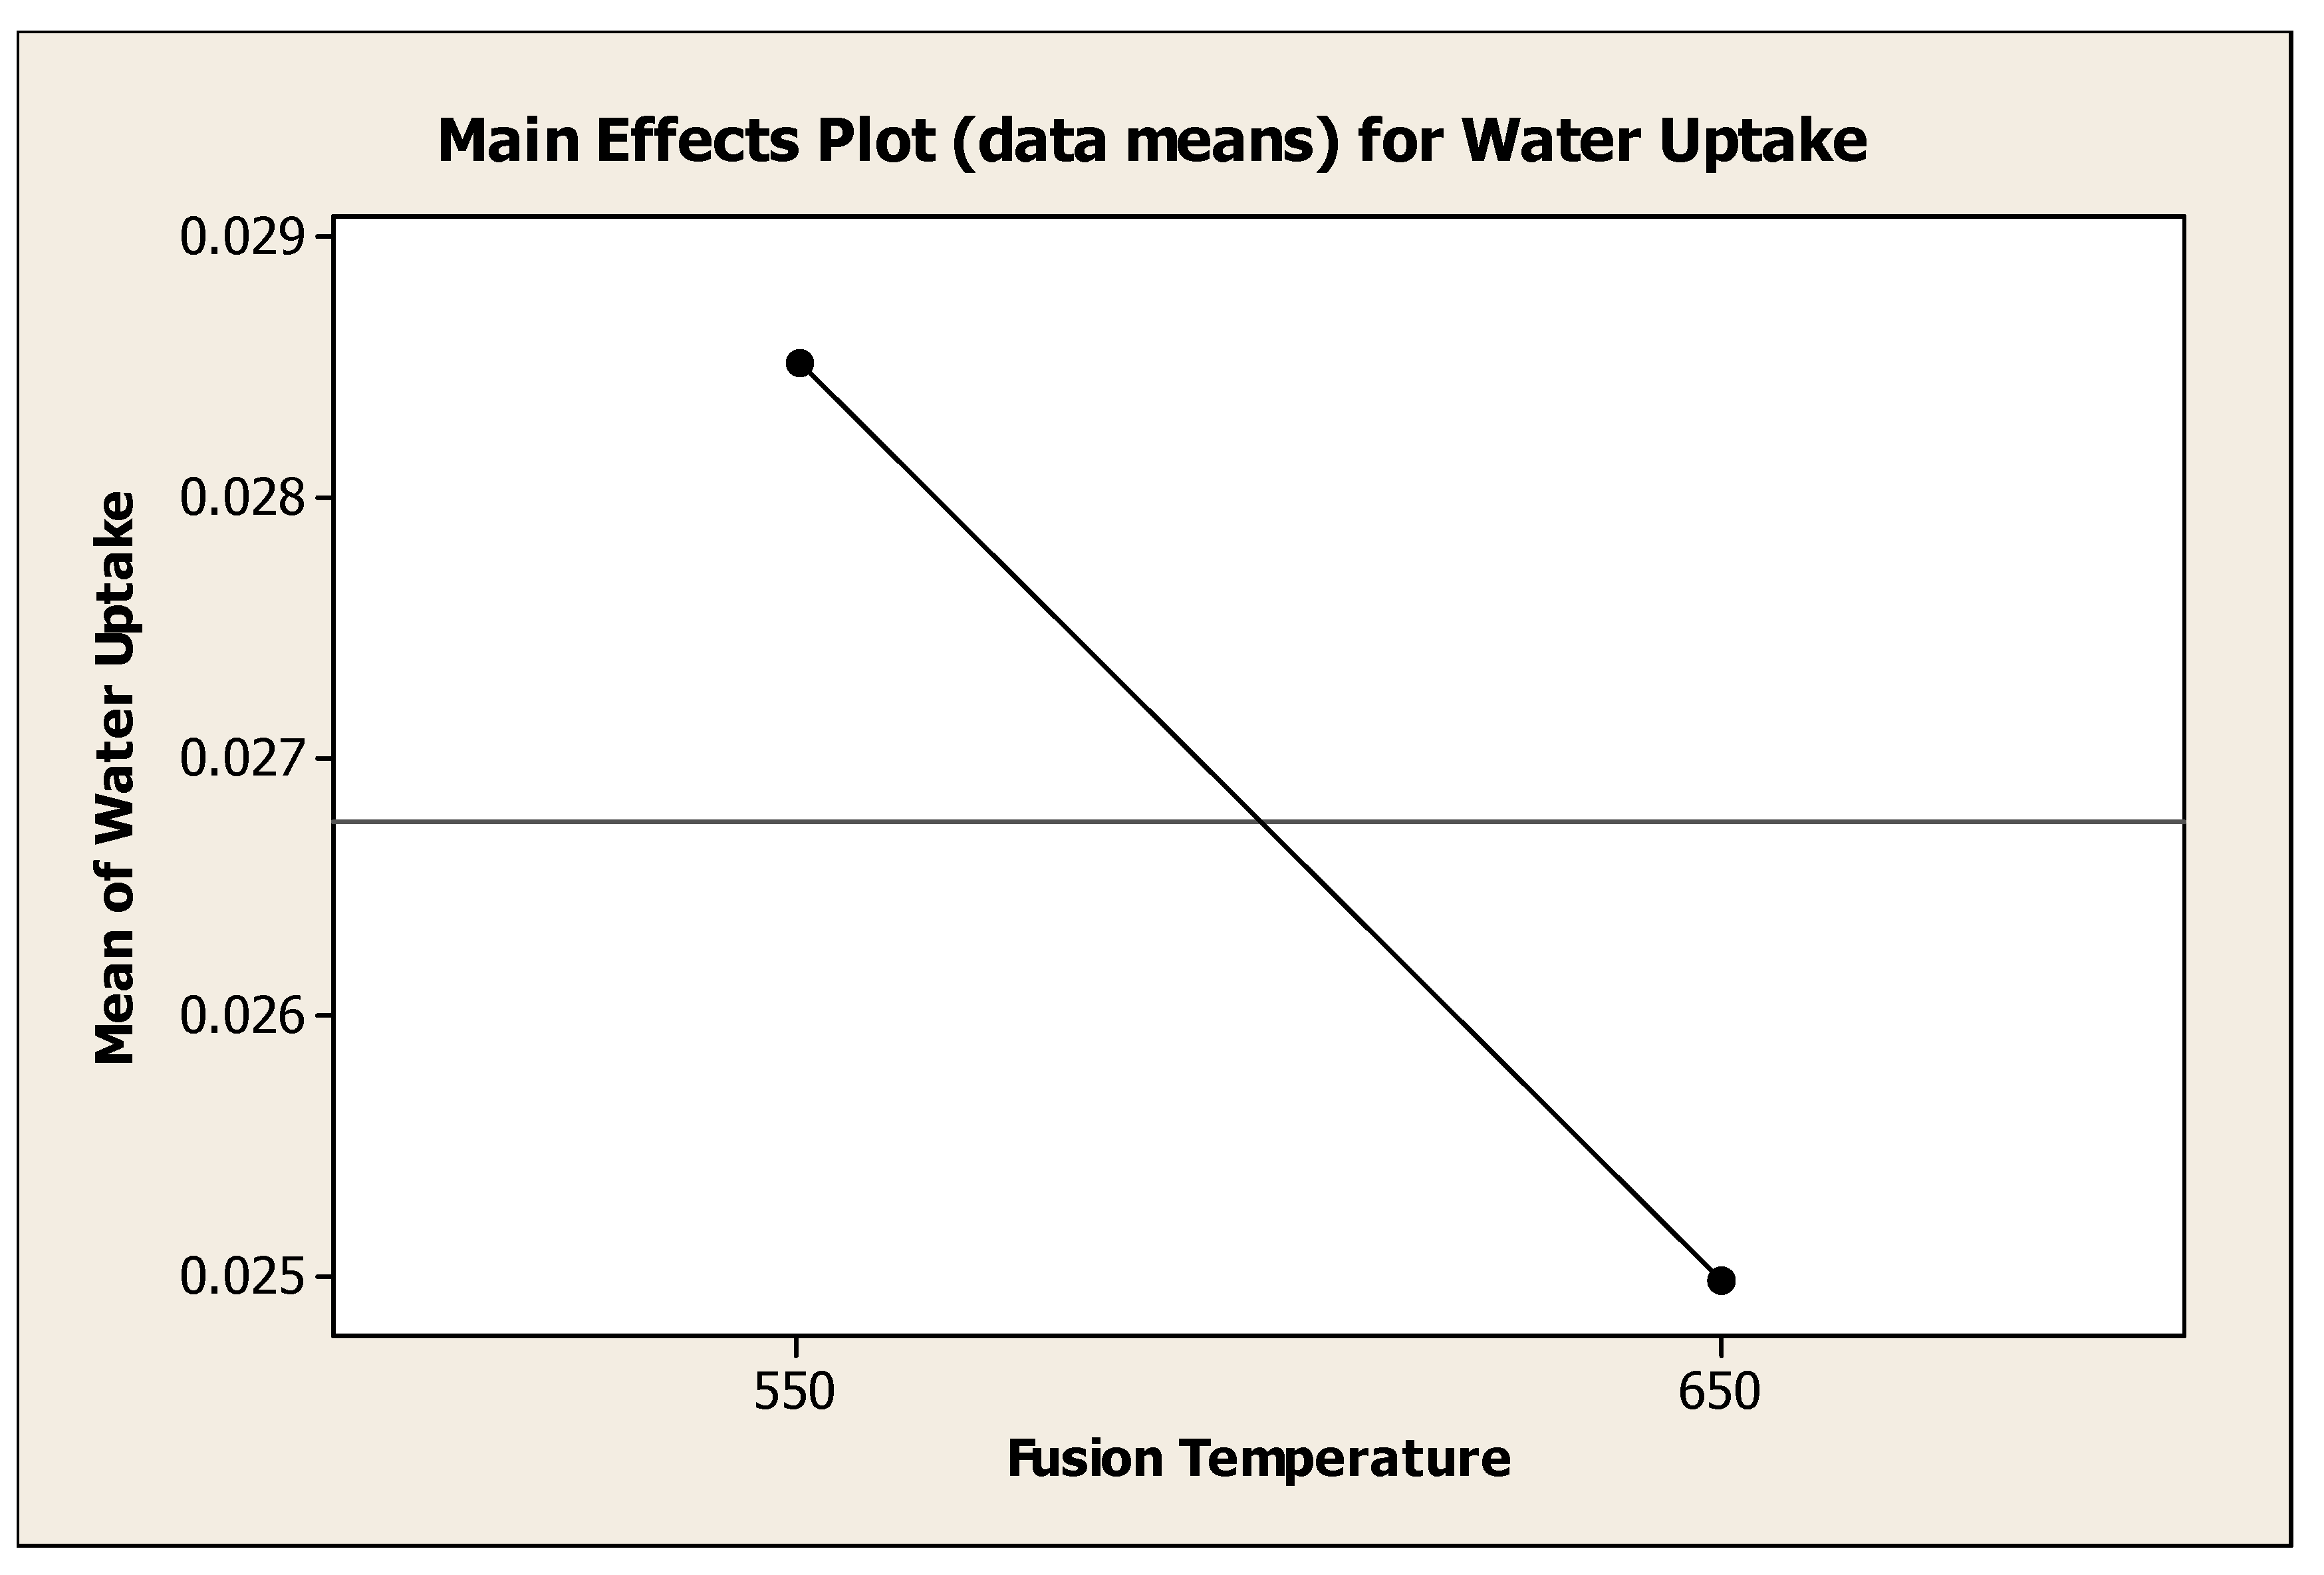
4.4.1. Effect of Fusion Temperature on Water Adsorbent Performance
Figure 4.7 showed the effect of fusion temperature to the mean of water uptake. Generally, the water uptake decrease as fusion temperature was decreased from 550°C to 650°C. Analysis of variance showed that, there was a significant change (P=0.047) with different fusion temperature. It was clearly seen that the fused temperature of 550°C was the best temperature to the water uptake with mean of water adsorbance 0.02852 g H
2O / g water adsorbent. High fusion temperature, 650°C was able to produce water adsorbent with mean water uptake of 0.02497 g H
2O / g water adsorbent.
Rios et al. (
2012) suggested that alkaline fusion was very effective in extracting the silicon and aluminium species from kaolin. The Al
2O
3 and SiO
2 from the starting materials were converted into sodium/potassium salts (Na
2SiO
3 + Na
2AlO
2). Klamrassame, T., et al. (2010) found that the optimum fusion temperature was 450°C for 1 hour for the synthesis of water adsorbent (sodium alumina silicate) from coal fly ash. Fusion method was used followed by hydrothermal treatment.
Rios et al. (
2009) fused kaolin with NaOH at the temperature of 600°C for 1 hour to produce zeolite A. The results showed that the best fusion temperature were not similar for different starting raw material. This may be attributed to the different composition of the starting material.
Figure 4.7.
Effect of Fusion Temperature to the Mean of Water Uptake.
Figure 4.7.
Effect of Fusion Temperature to the Mean of Water Uptake.
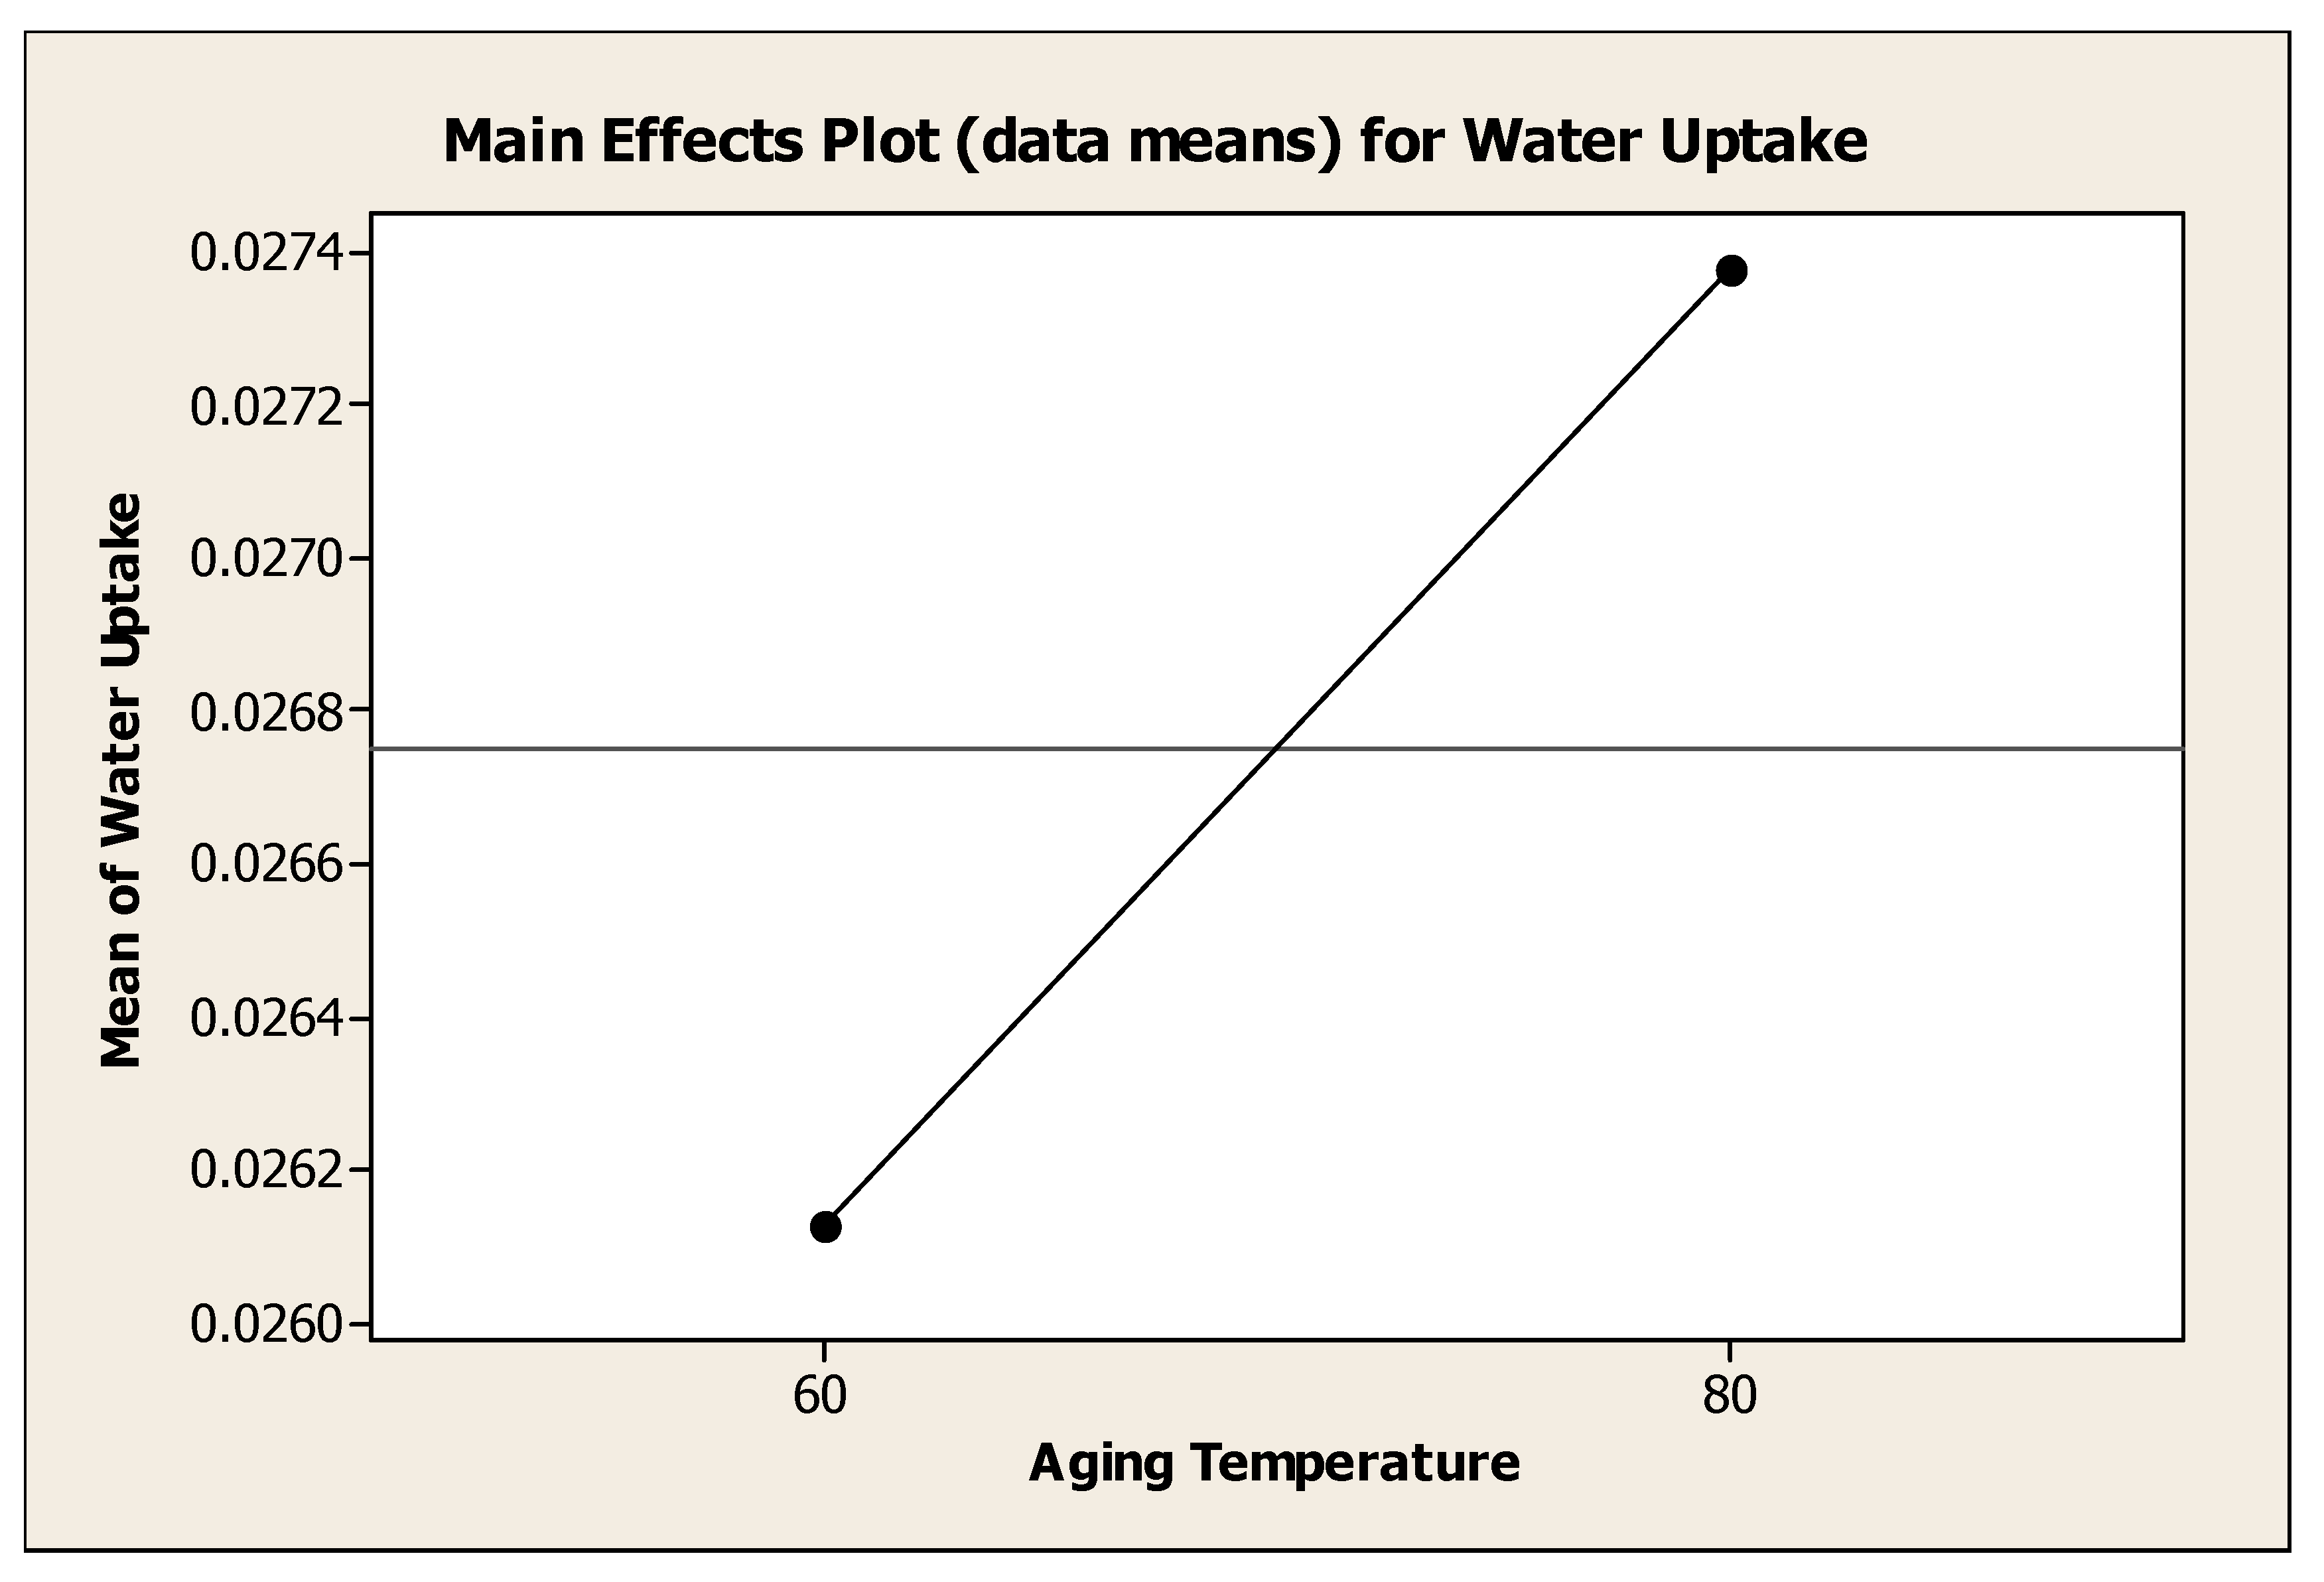
4.4.2. Effect of Aging Temperature on Water Adsorbent Performance
Figure 4.8 showed the effect of aging temperature to the mean of water uptake. Generally, the water uptake increase as aging temperature was increased from 60°C to 80°C. However, analysis of variance showed that, there was no significant change (P=0.468) with different aging temperature. It was clearly seen that the aging temperature of 80°C was the best temperature to the water uptake with mean of water adsorbance 0.02738 g H
2O / g water adsorbent. Low aging temperature, 60°C produced water adsorbent with mean of water adsorbent 0.02612 g H
2O / g water adsorbent whereby it was slightly near to the water adsorbance for the aging temperature of 80°C. Farihahusnah
Hussin et al. (
2011) reviewed that the temperature had no significant individual effect on the activation of bleaching. The results revealed that the optimum bleaching capacity was obtained at temperature (90°C). Therefore, between 90°C and 120°C, the phase temperature did not seem to significantly influence the bleaching capacity.
Figure 4.8.
Effect of Aging Temperature to the Mean of Water Uptake.
Figure 4.8.
Effect of Aging Temperature to the Mean of Water Uptake.
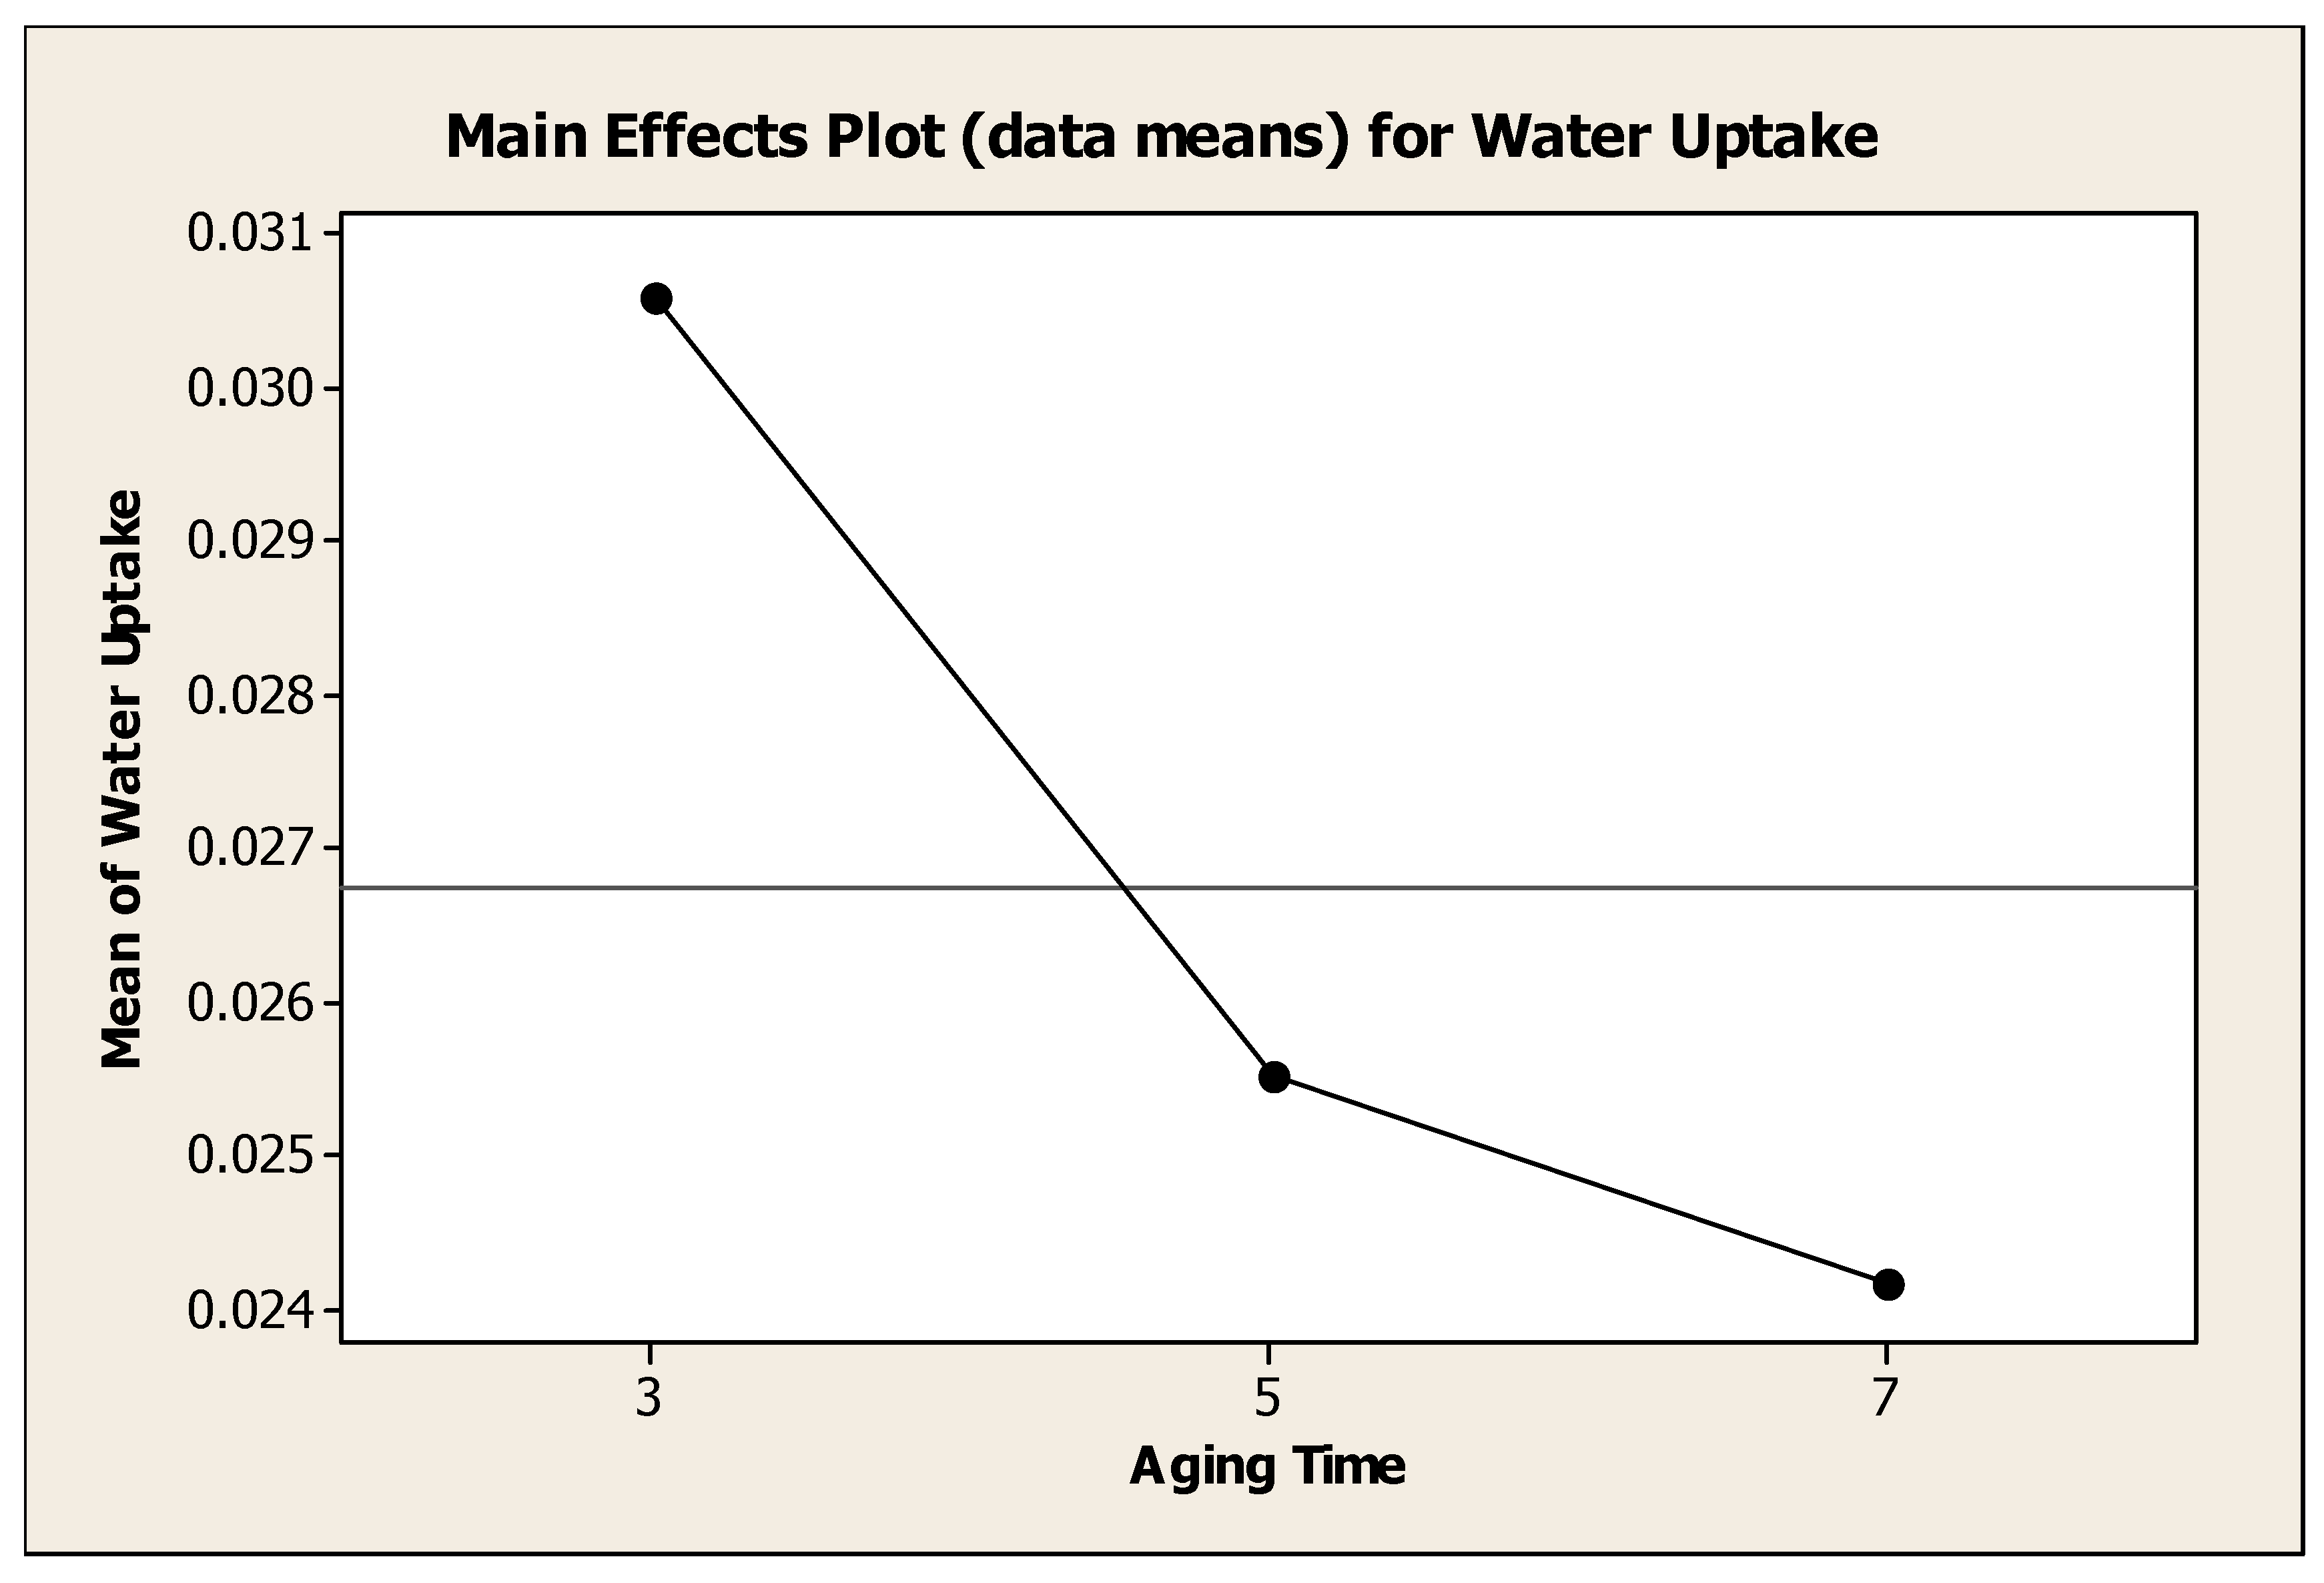
4.4.3. Effect of Aging Time on Water Adsorbent Performance
Figure 4.6 showed the effect of aging time to the mean of water uptake. Generally, the water uptake decrease as aging time was increased from 3 days to 7 days. Analysis of variance showed that, there was a significant change (P=0.012) with different aging time. It was clearly seen that the aging time of 3 days was the best temperature to the water uptake with mean of water adsorbance 0.03058 g H
2O / g water adsorbent. High aging time, 7 days produced mean of water adsorbance 0.02415 g H
2O / g water adsorbent. Meanwhile, aging time for 5 days produced mean of water adsorbance 0.02550 g H
2O / g water adsorbent. Haden et al. (1961) used the aging time of 96 hours when synthesizing zeolite A from kaolin. In their work, 60 parts by weight of kaolin was mixed and thoroughly blended with 43.2 parts by weight of 50% NaOH solution and shaped into pellets. The pellets were aged for 96 hours at 100°F before crystallization took place.
Rios et al. (
2009) aged their hydrogels under static conditions for 24 hours. In their experiment, kaolin was mixed with NaOH and fused for 1 hour at 600°C. The fused product was ground and mixed with distilled water in order to form amorphous precursor under stirring condition. This hydrogels were aged for 24 hours before hydrothermal reaction took place.
Figure 4.9.
Effect of Aging Time to the Mean of Water Uptake.
Figure 4.9.
Effect of Aging Time to the Mean of Water Uptake.
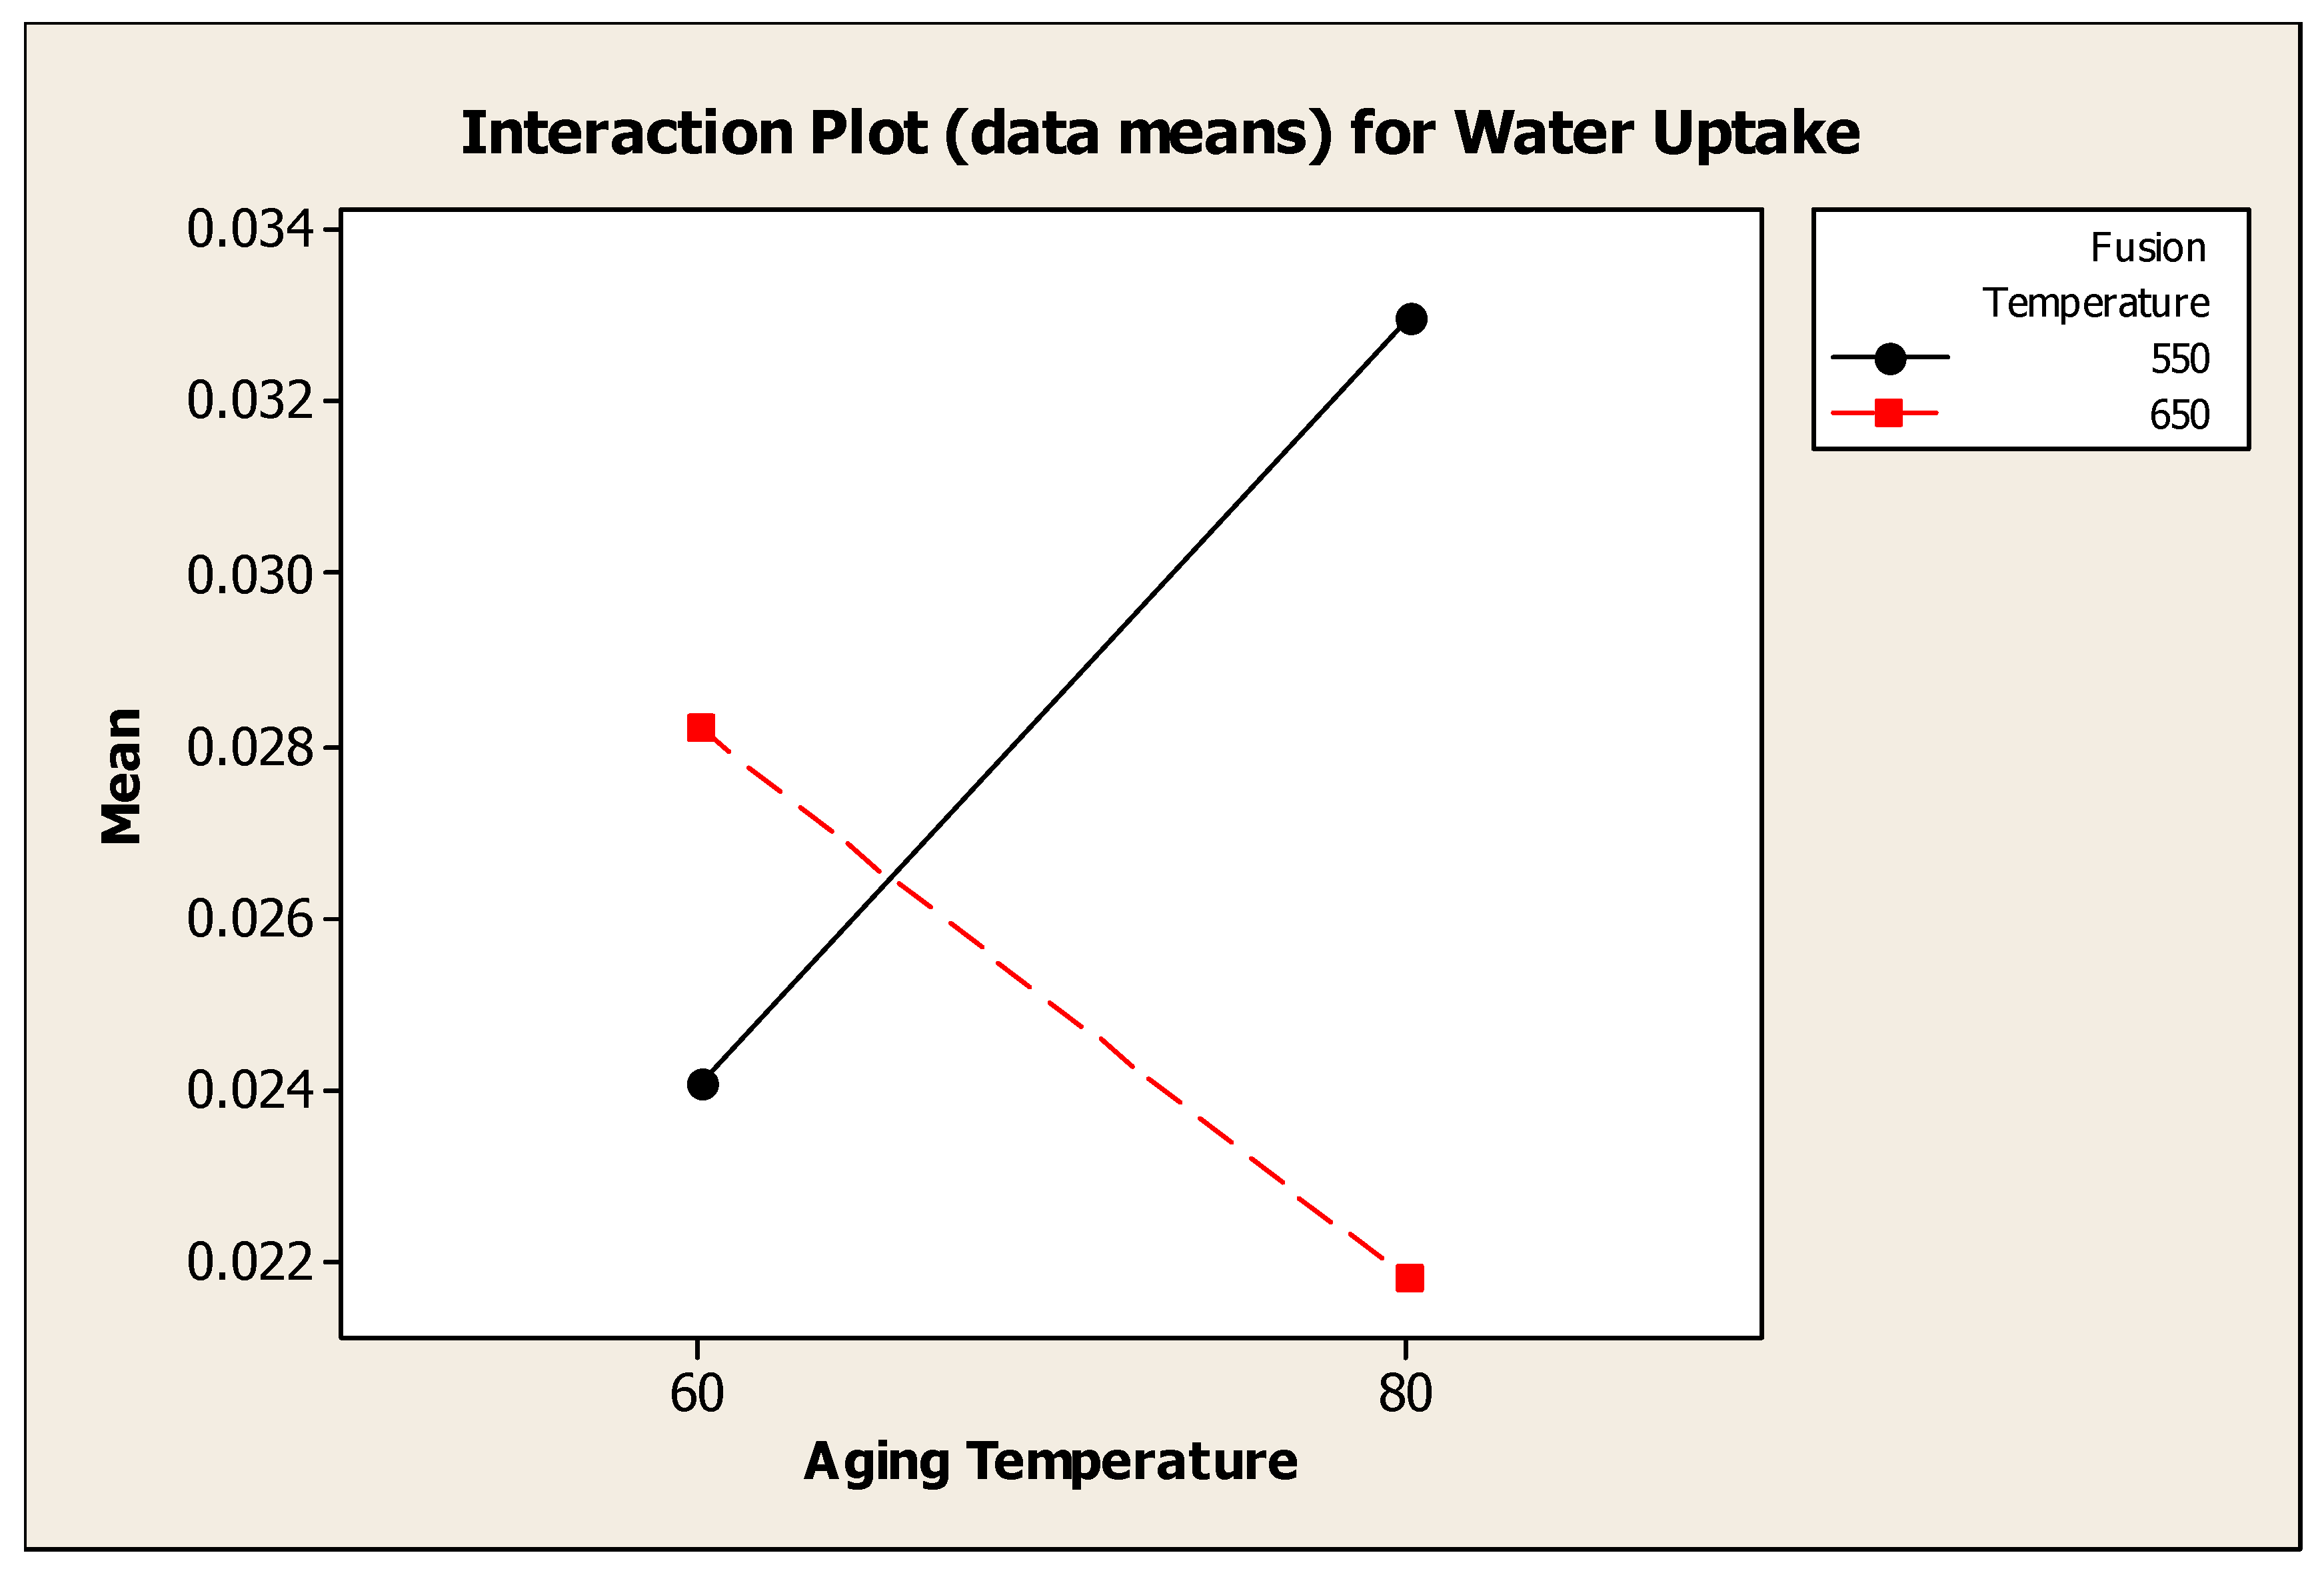
4.4.4. Interaction Effect Between Fusion Temperature and Aging Temperature
Figure 4.7 showed the interaction plot for water uptake between fusion temperature and aging temperature. Analysis of variance showed that, there was a significant interaction effect between fusion temperature and aging temperature to the water uptake. The water uptake for water adsorbent synthesized at fusion temperature 550°C was higher at aging temperature 80°C (> 0.032 g H
2O / g water adsorbent) whereas the water uptake for fusion temperature 650°C was higher at lower aging temperature, 60°C.
Figure 4.10.
Interaction Plot (data means) for Water Uptake between Fusion Temperature and Aging Temperature.
Figure 4.10.
Interaction Plot (data means) for Water Uptake between Fusion Temperature and Aging Temperature.
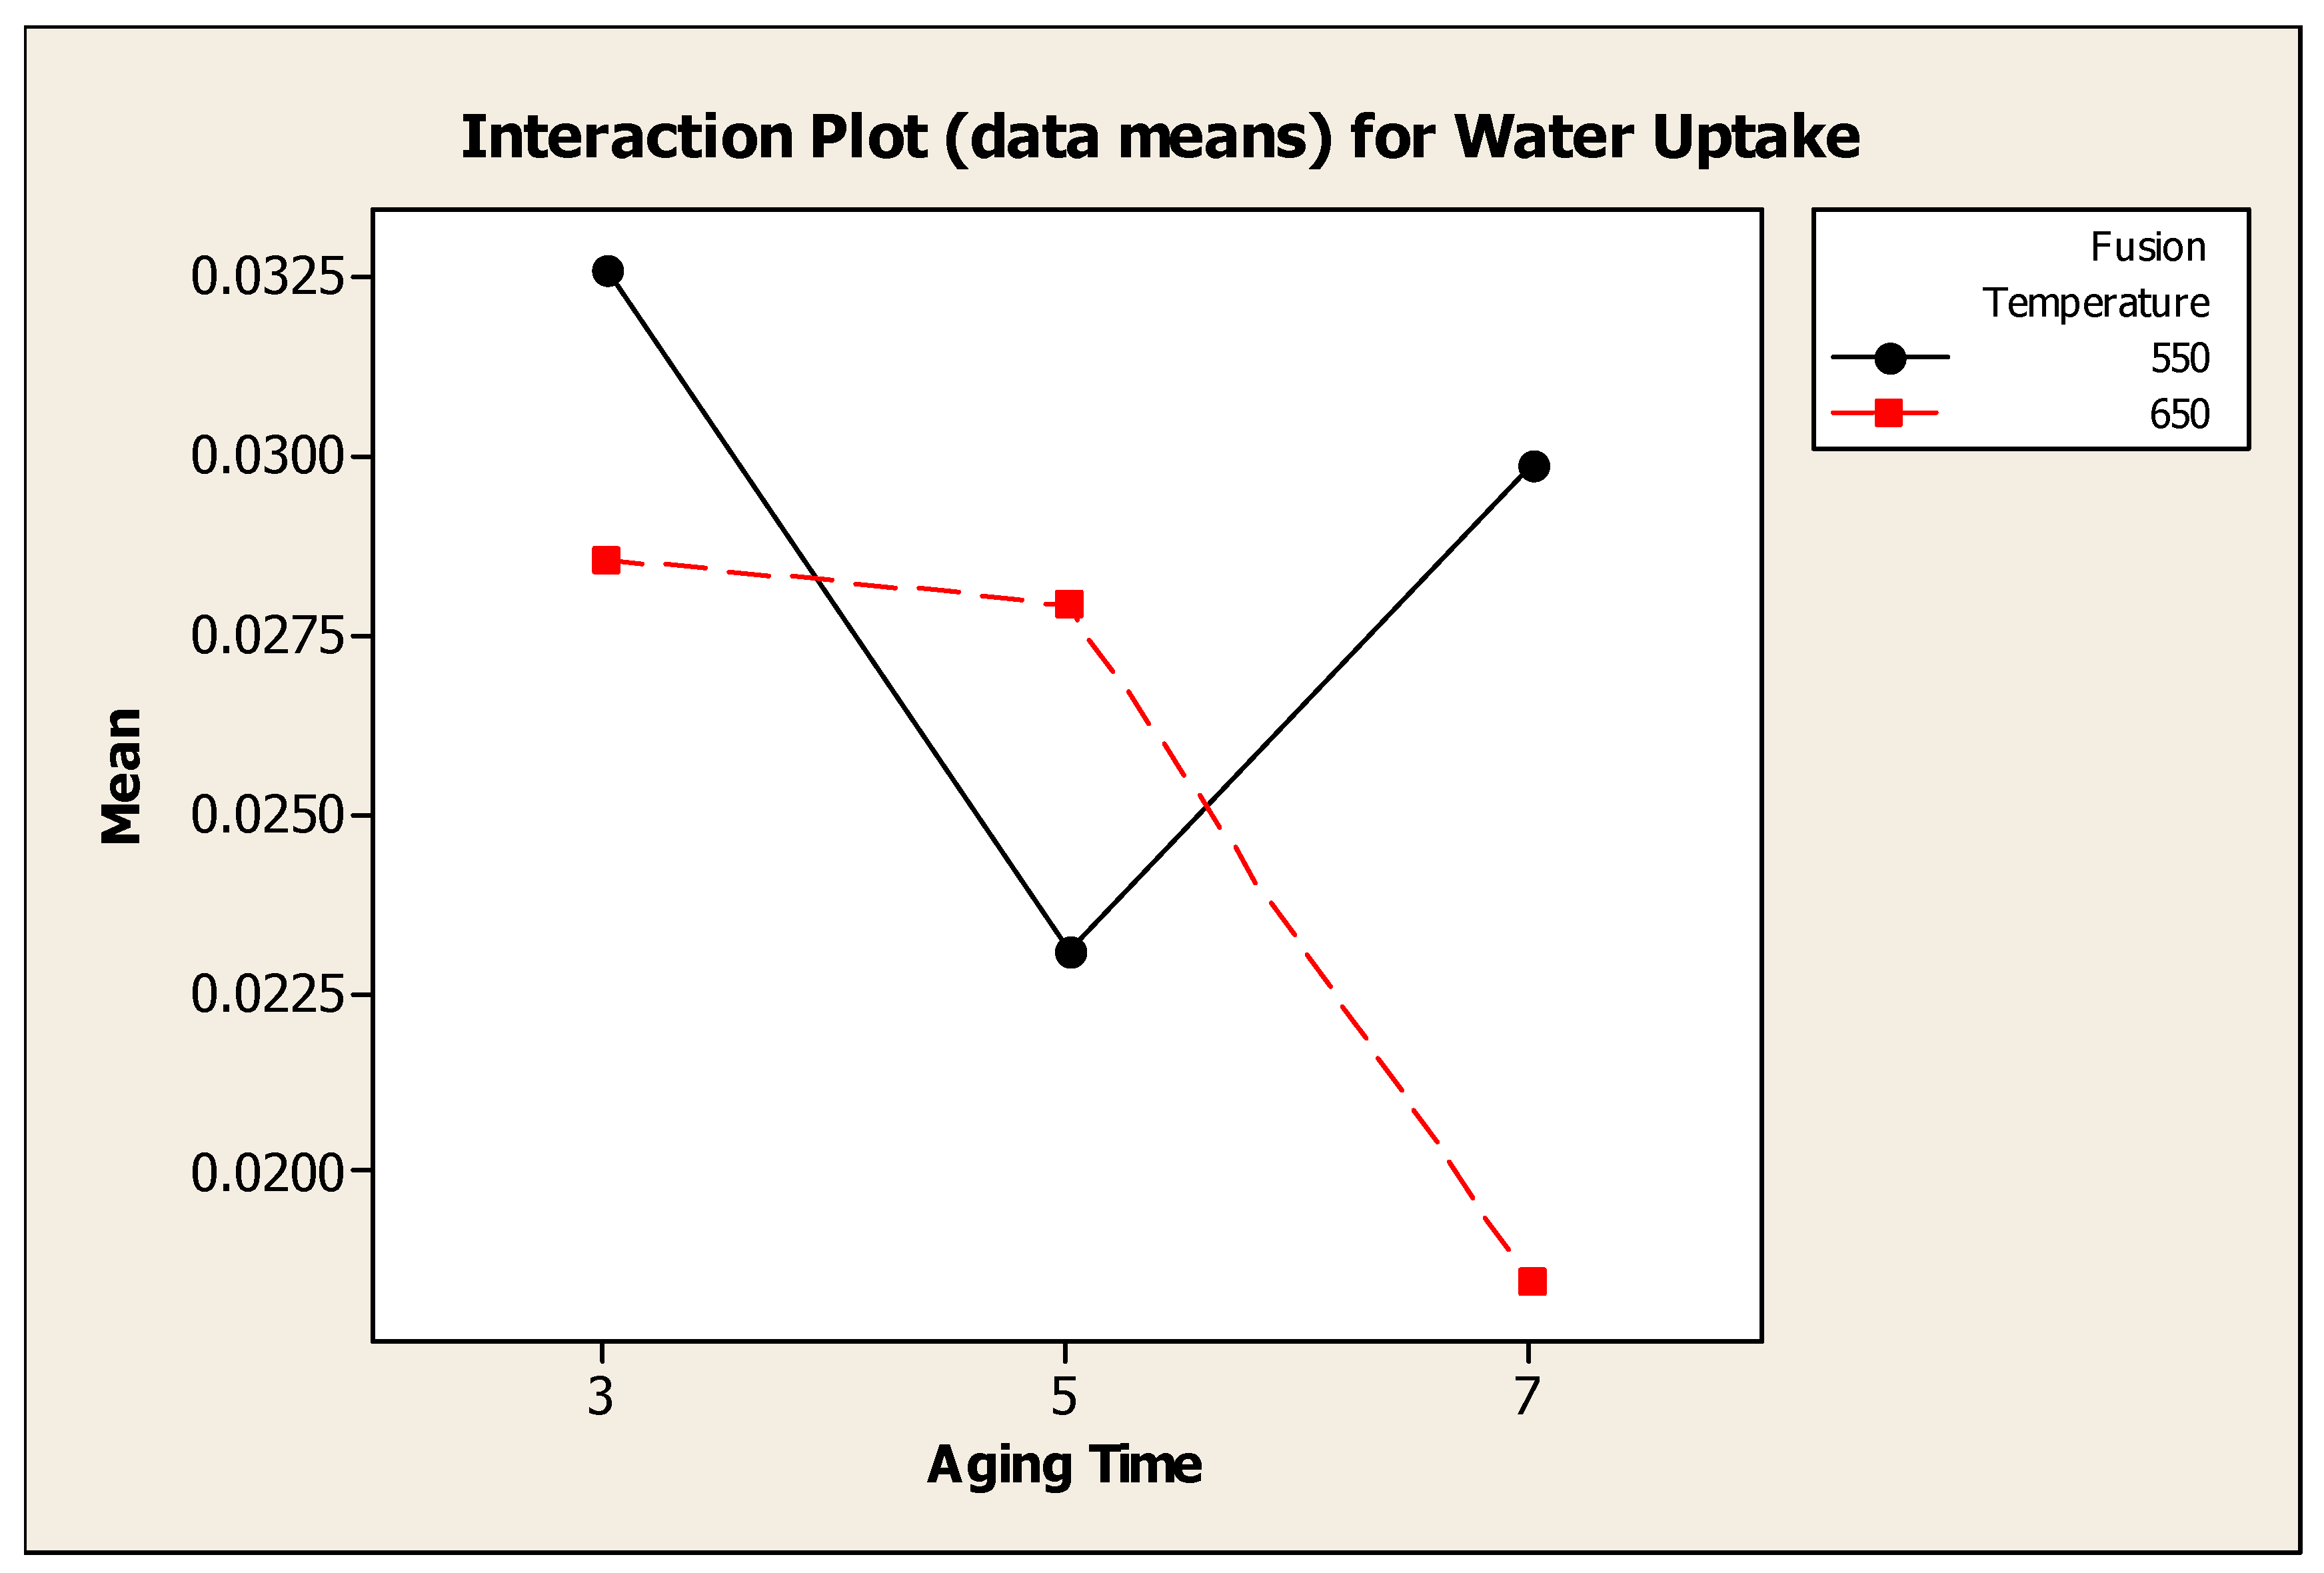
4.4.5. Interaction Effect Between Fusion Temperature and Aging Time
Figure 4.8 showed the interaction plot for water uptake between fusion temperature and aging time. Analysis of variance showed that, there was a significant interaction effect between fusion temperature and aging time. Water uptake for water adsorbent synthesized at fusion temperature 550°C was higher at 3 days compared to aging time 5 and 7 days.
Figure 4.11.
Interaction Plot (data means) for Water Uptake between Fusion Temperature and Aging Time.
Figure 4.11.
Interaction Plot (data means) for Water Uptake between Fusion Temperature and Aging Time.
4.5. Model for the Water Uptake (Response Surface Methodology, RSM)
Table 4.5 is the results of response surface regression of the data. From the analysis, the appropriate model was linear with interaction with P value < 0.05. The equation for water uptake was:
This equation can be used to determine water uptake of water adsorbent within the range of factor used in this experiment.
Table 4.5.
Analysis of Response Surface Regression Coefficients for Water Uptake.
Table 4.5.
Analysis of Response Surface Regression Coefficients for Water Uptake.
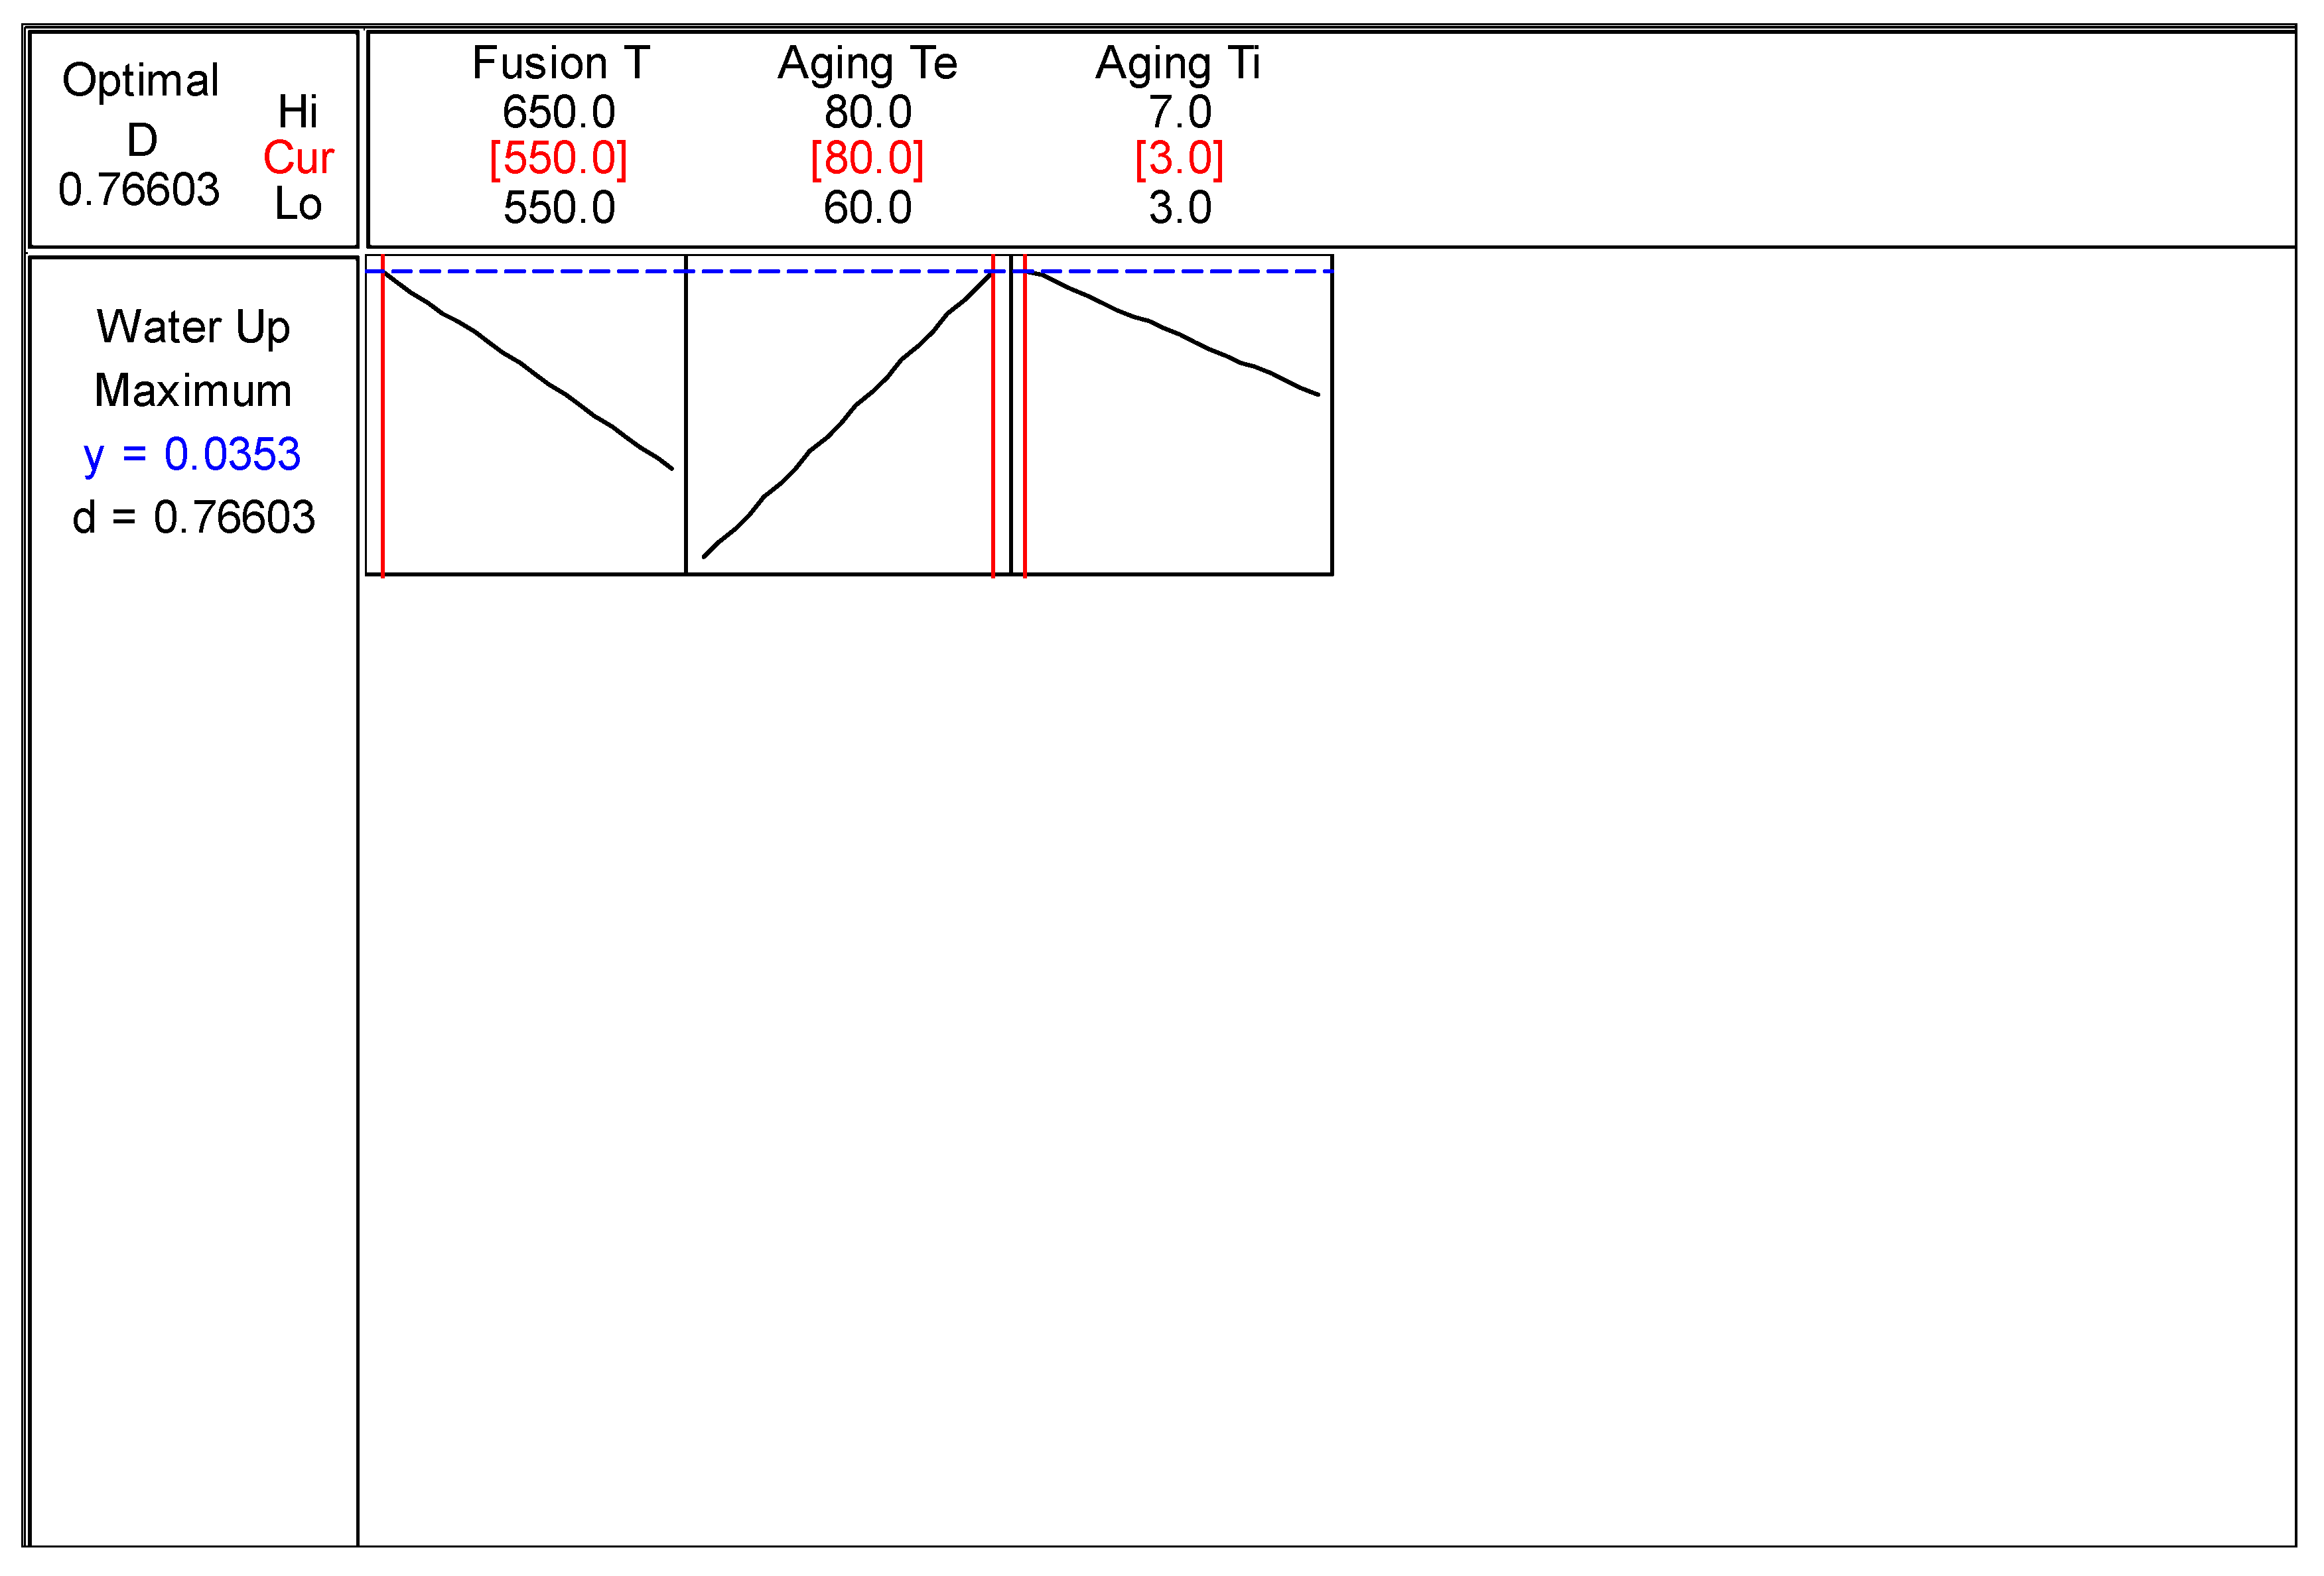
4.5.1. Response Optimizer
Figure 4.12 showed the best condition to produce water adsorbent. Minitab Release 14 software was used as a tool for determine the best combination of studied factors to produce water adsorbent with maximum water uptake. The maximum water uptake predicted was 0.0353 g H
2O / g water adsorbent by using the combination of 550°C of fusion temperature, 80°C of aging temperature and 3 days of aging time. The predicted synthesized adsorbent was approximately 84% of commercial water adsorbent. For comparison, the water uptake for commercial zeolite 3A was 0.0421 g H
2O / g water adsorbent.
Figure 4.12.
Optimum Condition for Water Uptake.
Figure 4.12.
Optimum Condition for Water Uptake.
4.5.2. Contour Plot
The contour plot was generated in order to show the best condition of the factors whereby to produce water adsorbent with high water uptake.
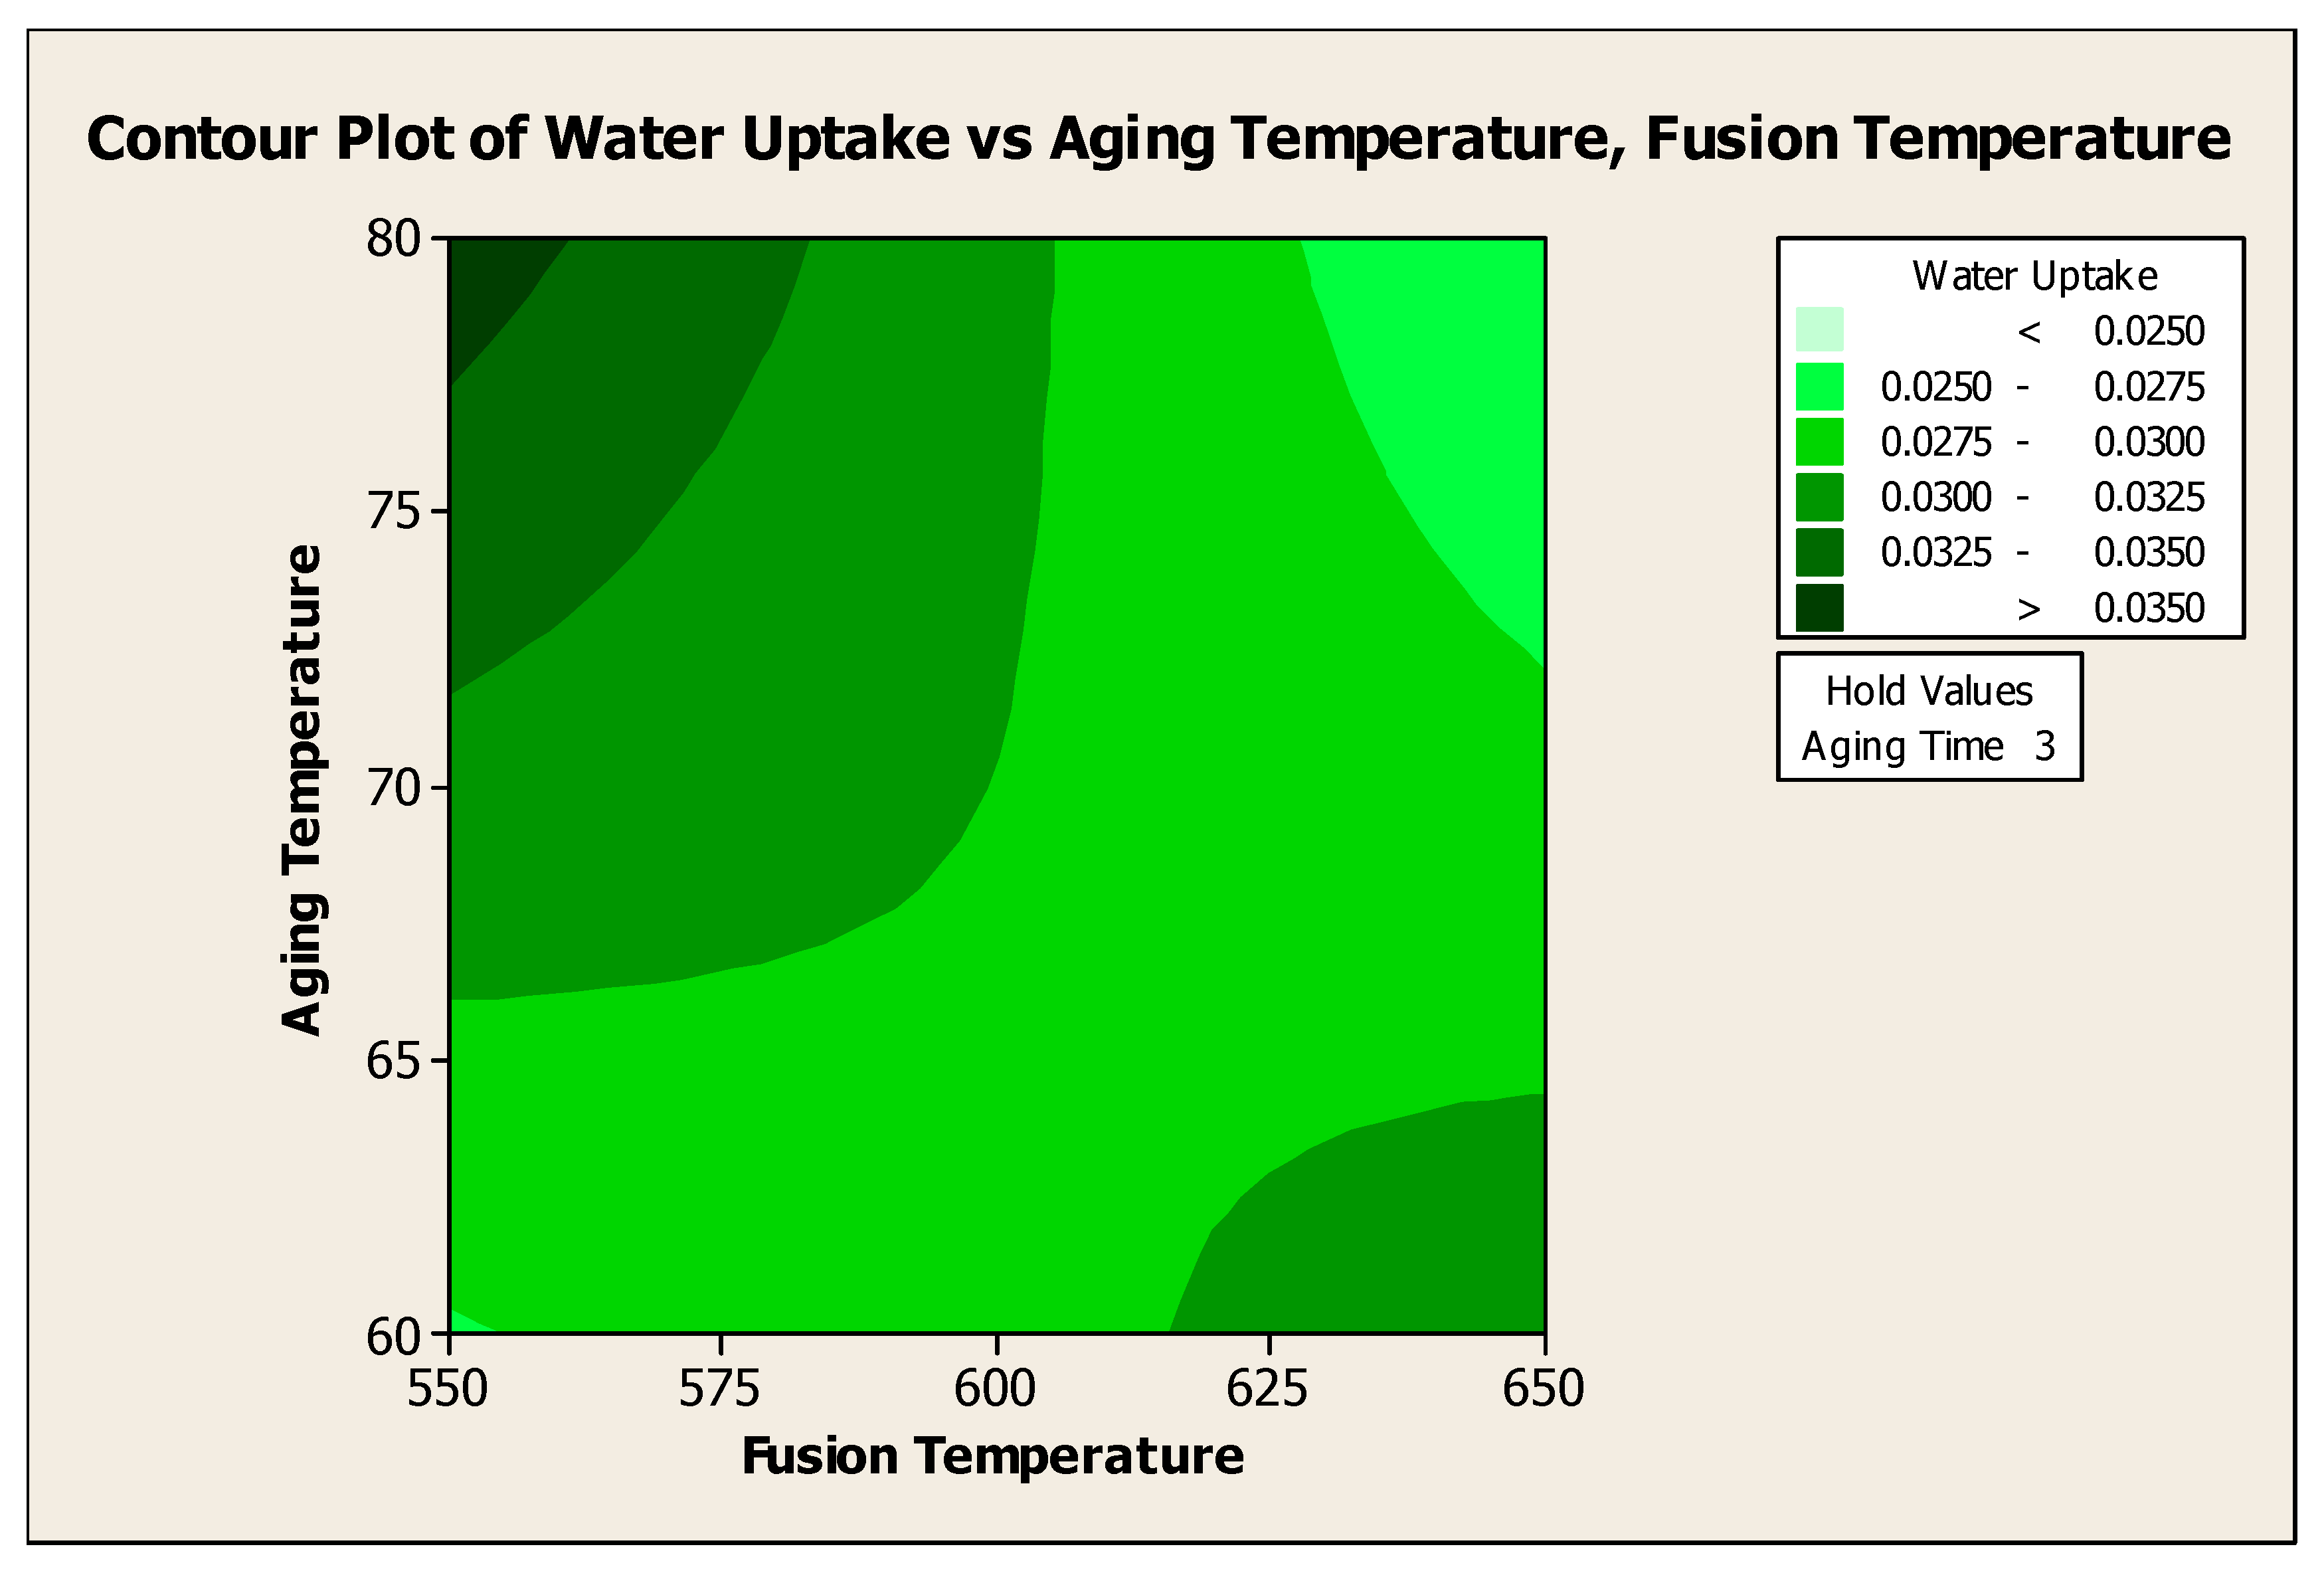
4.5.2.1. Contour Plot of Water Uptake Versus Aging Temperature, Fusion Temperature
Figure 4.13 showed the contour plot of water uptake versus Aging Temperature, Fusion Temperature at 3 days of aging time. To produce water adsorbent with > 0.0350 water uptake, the aging temperature should be at 80°C with the fusion temperature of 550°C for 3 days of aging time. Analysis of variance showed that aging temperature has insignificant effect to the water uptake. However, the above contour plot showed that aging temperature does affect the water uptake due to the significant interaction of aging temperature with fusion temperature.
Figure 4.13.
Contour Plot of Water Uptake versus Aging Temperature, Fusion Temperature.
Figure 4.13.
Contour Plot of Water Uptake versus Aging Temperature, Fusion Temperature.
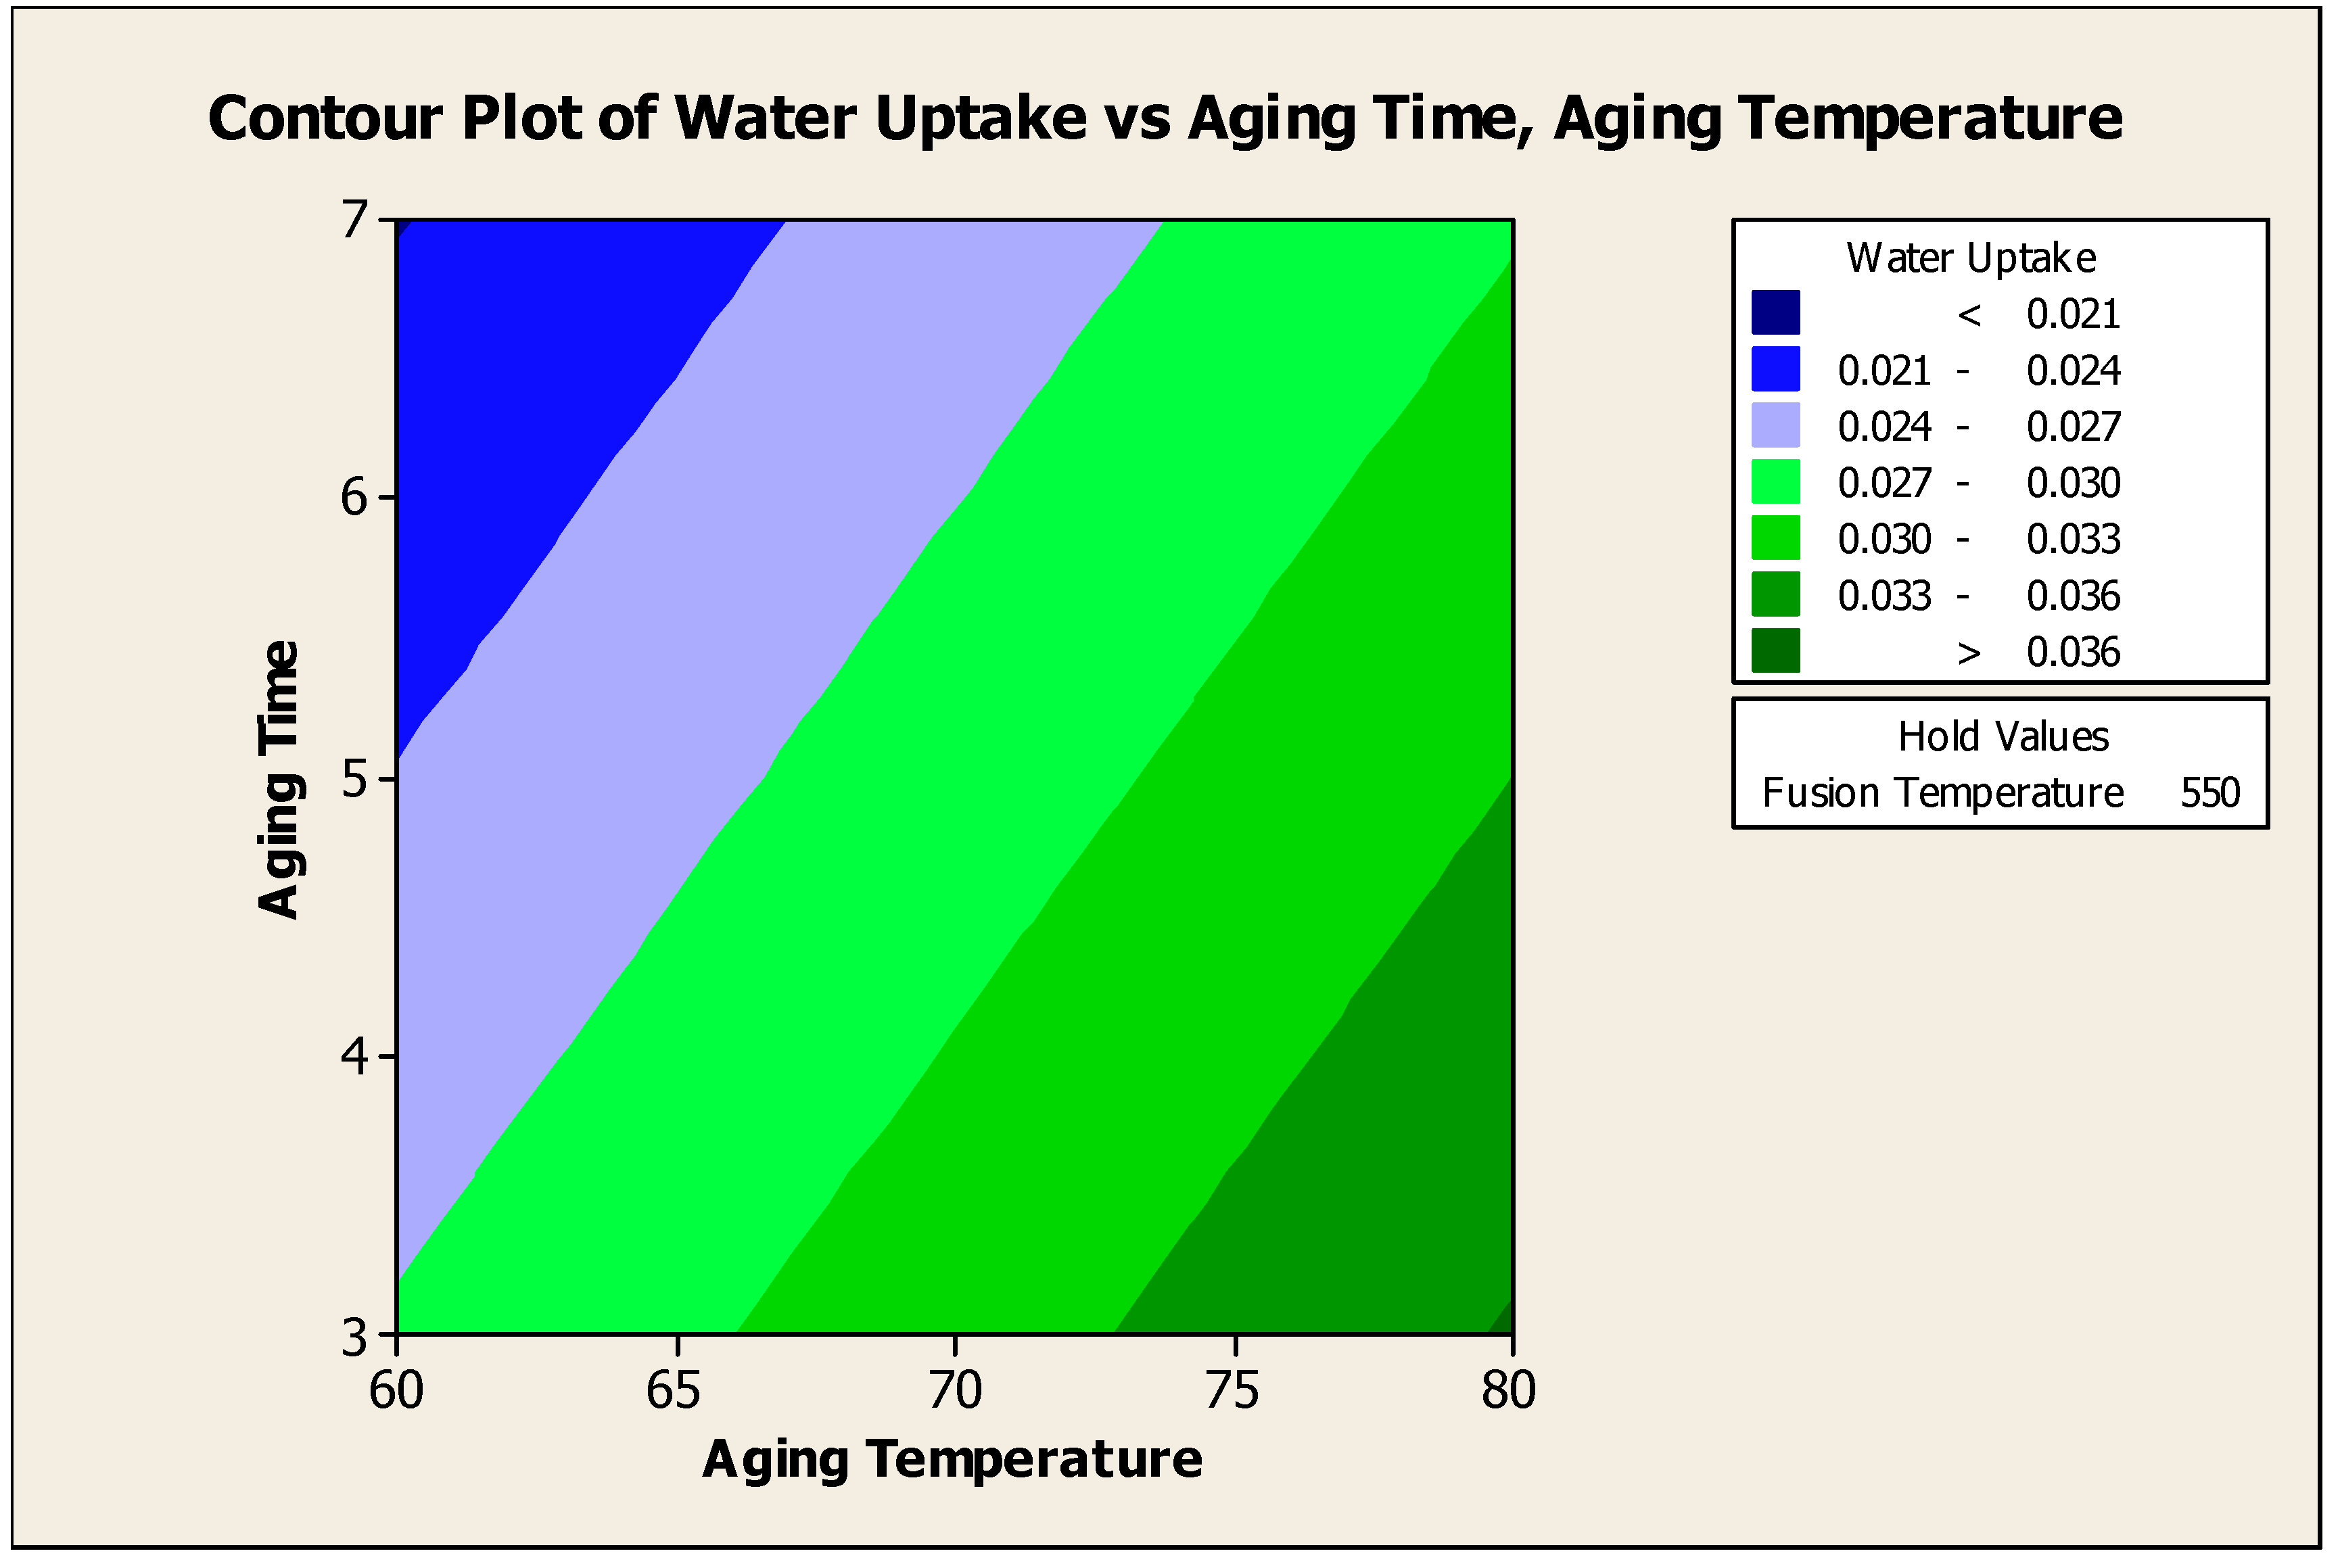
4.5.2.2. Contour Plot of Water Uptake Versus Aging Time, Aging Temperature
Figure 4.14 showed the water uptake versus aging time, aging temperature at fusion temperature 550°C. From the contour plot, to produce water uptake more than 0.0350 g H
2O / g water adsorbent, an aging time of 3 days with aging temperature of 80°C has to be used for 550°C of fusion temperature. The significant interaction effect of fusion temperature and aging temperature denied the insignificant main effect of aging temperature.
Figure 4.14.
Contour Plot of Water Uptake versus Aging Time, Aging Temperature.
Figure 4.14.
Contour Plot of Water Uptake versus Aging Time, Aging Temperature.
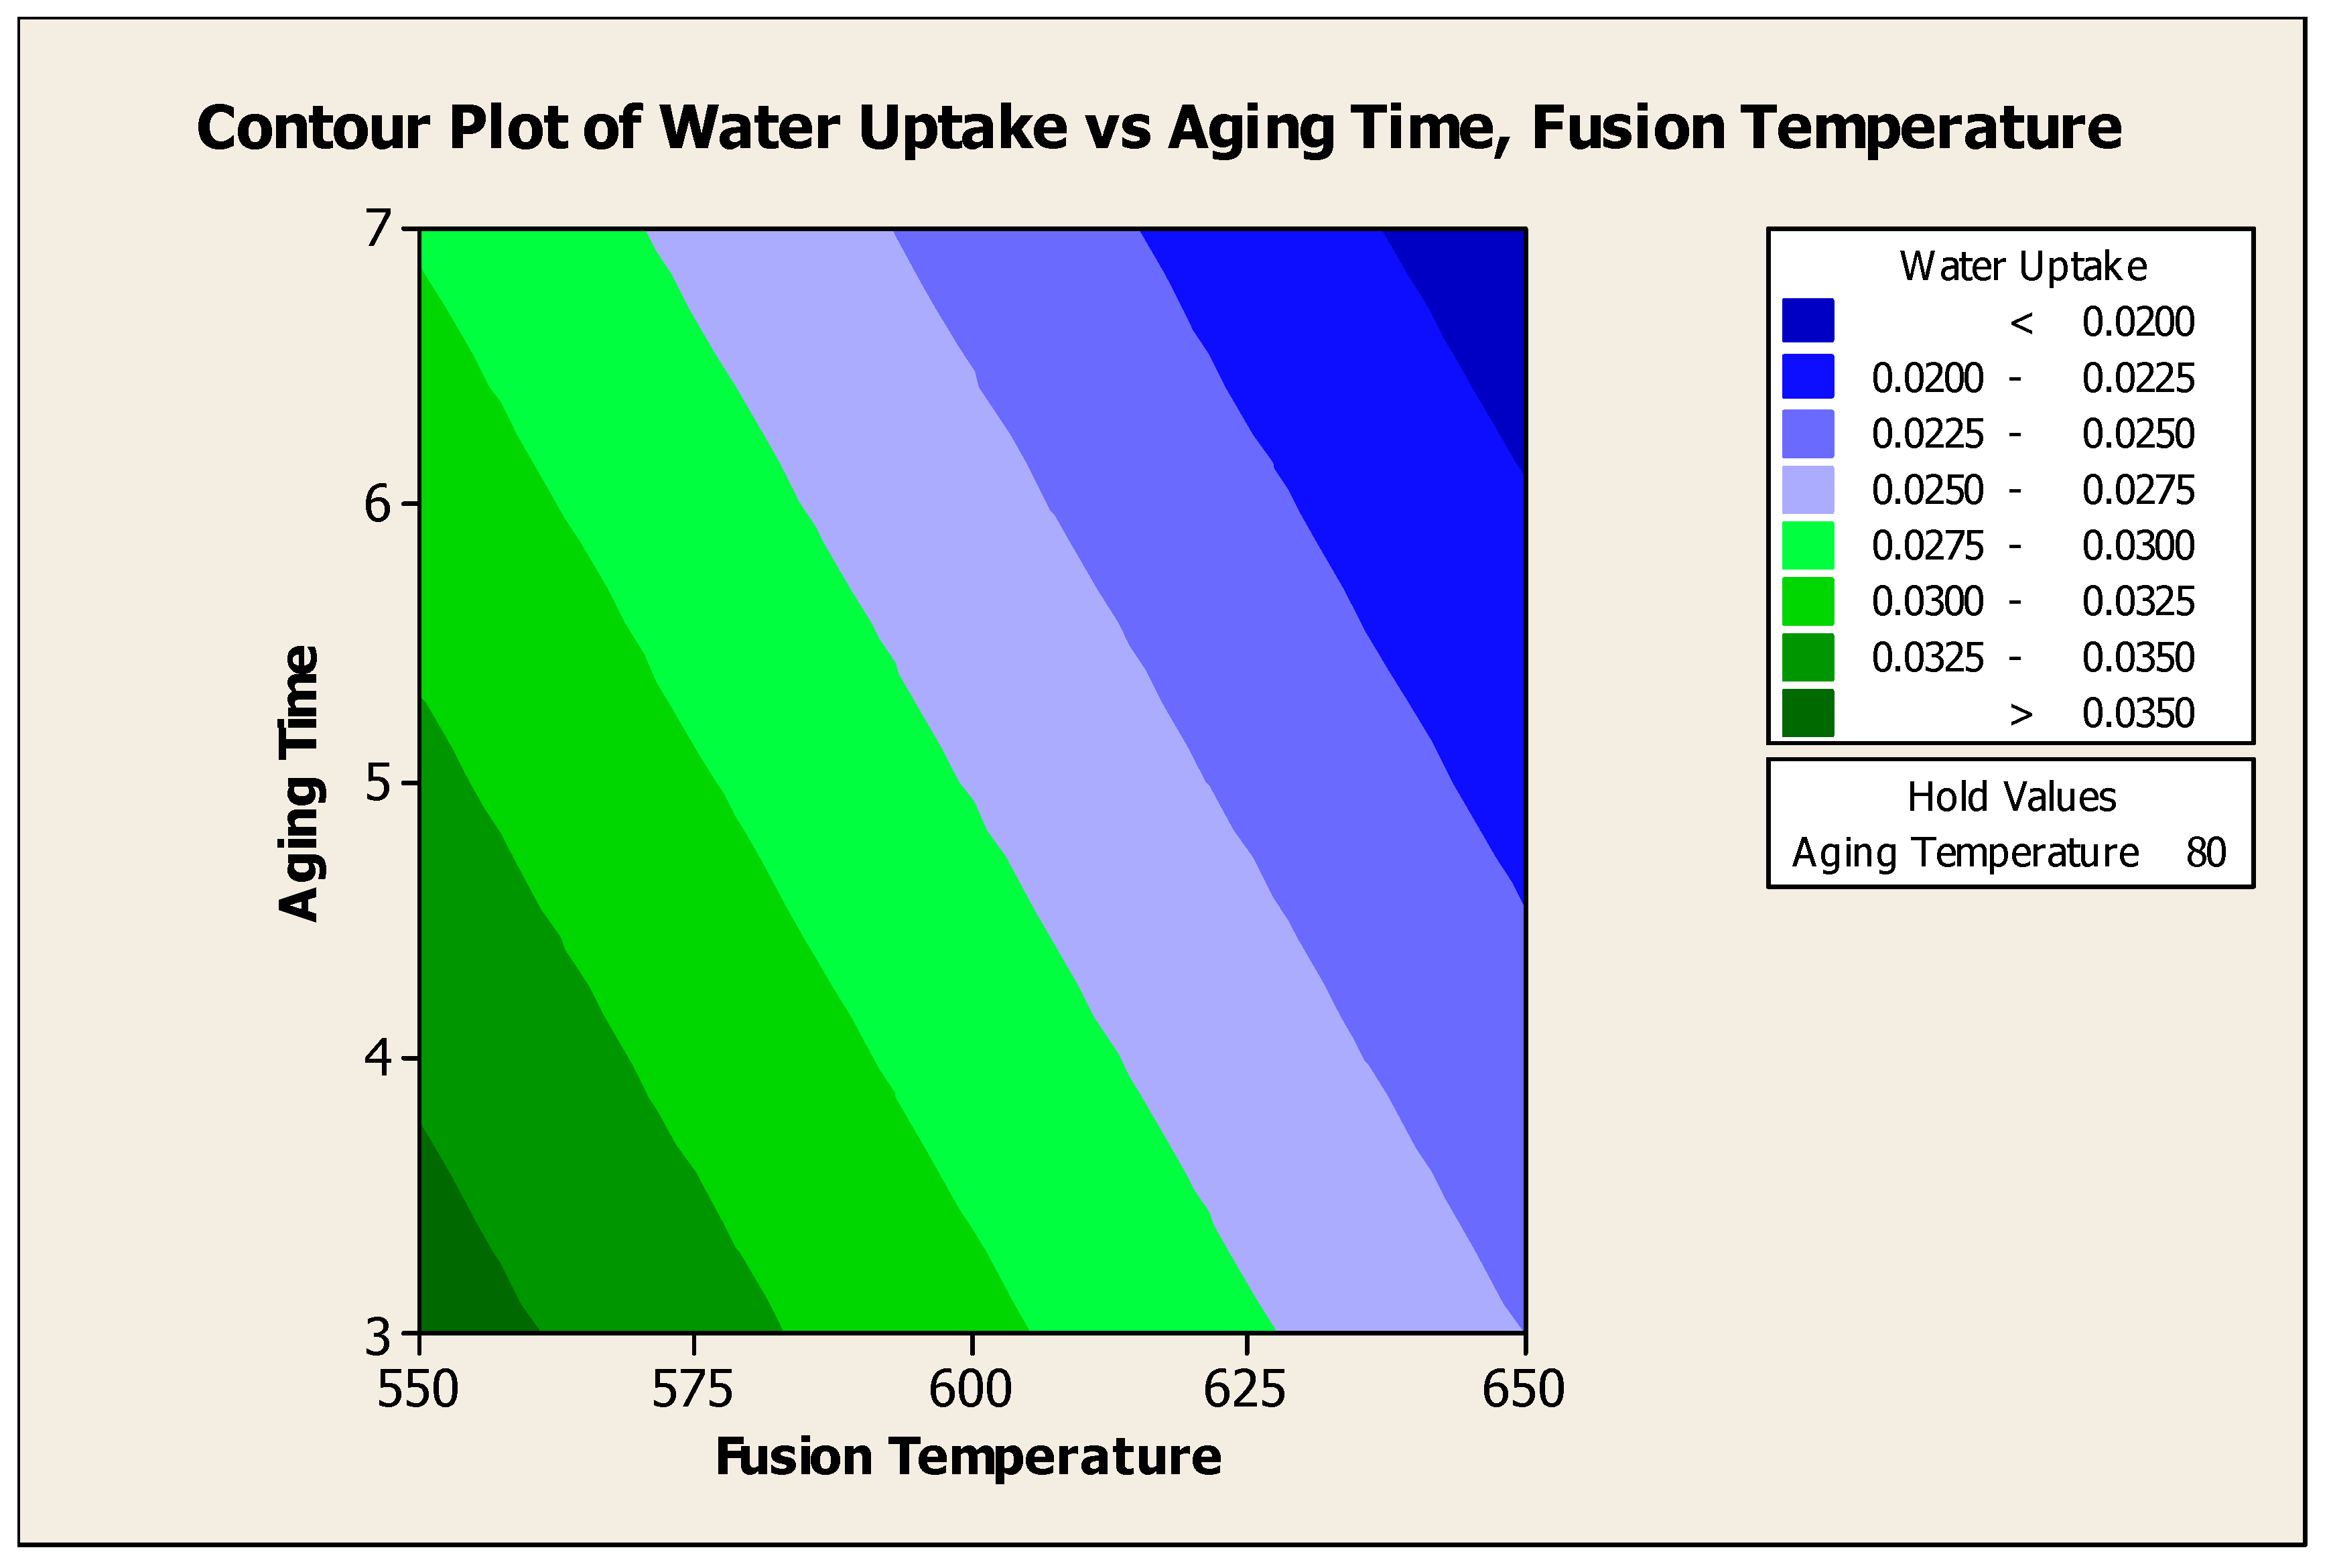
4.5.2.3. Contour Plot of Water Uptake Versus Aging Time, Fusion Temperature
Figure 4.15 showed the contour plot of water uptake versus aging time, fusion temperature at 80°C aging temperature. From the contour plot, to produce water adsorbent with water uptake > 0.035 g H
2O / g water adsorbent, the aging time of 3 days and the fusion temperature of 550°C should be used at 80°C of aging time. From the plot, it is clearly seen that aging time and fusion temperature has significant effect to the water uptake of the adsorbent.
Figure 4.15.
Contour Plot of Water Uptake versus Aging Time, Fusion Temperature.
Figure 4.15.
Contour Plot of Water Uptake versus Aging Time, Fusion Temperature.
Chapter 5: Conclusion and Recommendation
5.1. Conclusion
As a conclusion, water adsorbent can be synthesized from SBE using modified fusion method. The best conditions to synthesize the water adsorbent were: 550°C of fusion temperature, 80°C of aging temperature and 3 days of aging time with predicted water uptake of 0.0353 g H2O / g water adsorbent.
Analysis of the full factorial experiment data revealed that the fusion temperature and aging time has significant effect to the water uptake whereas the aging temperature has no significant effect to the response.
The analysis also revealed that the two-interaction between fusion temperature with aging temperature (P = 0.000) and fusion temperature with aging time (P = 0.003) were significant (P < 0.05).
The results of response surface regression of the data showed that the appropriate model was linear with interaction with P value < 0.05 whereby the P-linear value is 0.029
5.2. Recommendation
Based on the present study, for the future, some points can be recommended. Water adsorbent also can be produced by another treatment such as by acid treatment. Either organic acid treatment or inorganic acid treatment, this treatment might be able to produce better water adsorbent and in the future, this treatment should be considered.
Pore size and number of pore of an absorbent material gives a very important to its capacity to absorb solvents. These pore sizes can be characterized by using X-Ray Fluorescence Spectrometer (XRF) and Scanning Electron Microscopy (SEM) which are not available in analysis laboratory. In future, synthesized water adsorbent must be characterized in term of their pore size so that an optimum result can be achieved. The different scale of aging temperature needs to use the big scale to look at the changers of the results that can be able to adsorb the azeotrope ethanol water mixture.
Acknowledgement
In the name of Allah, The Most Gracious and The Merciful. First of all I am grateful to Allah S.W.T as gave me the opportunity and strength to beat my brains out and to finish my Final Year Project. I wish to express my sincere appreciation to my supervisor Mr. Azharin Shah bin Abd. Aziz which always gives helping hand, advices, actuation, guidance and information’s which is very useful for my project and my knowledge. At long last, my gratitude to my beloved parent Mr Abdul Kadir Bin Yunus and Mrs. Eshah Binti Ismail whom go to any lengths to make sure my Final Year Project success and to all people that involve in this project indirectly. Many thanks also to Che Hashidah, Mohamad Shahir and Intan Suraya for the advices and motivation.
Declaration
I declare that this thesis entitles: The Effect of Fusion Temperature, Aging Time and Aging Temperature to The Water Adsorbent Synthesized from Spent Bleaching Earth to Purify Ethanol-Water Mixture are the result of my own research except as cited in the references. The thesis has not been accepted for any degree and is not concurrently submitted in candidature of any other degree.
List of Abbreviations
| C2H5OH |
Ethyl Alcohol / Ethanol |
| ºC |
Degree Celsius |
| % mol |
Percentage mol |
| SBE |
Spent Bleaching Earth |
| %w/w |
Percentage weight per weight |
| CPO |
Crude Palm Oil |
| H |
Hour |
| ± |
Plus minus |
| ≤ |
Less than equals |
| SiO2
|
Silicone Oxide |
| Si |
Silicone |
| Na-X |
Natrium X |
| Na-P |
Natrium Phosphorus |
| Na-A |
Natrium A |
| Al |
Aluminium |
| Al2O3
|
Alumina |
| CO |
Carbon Monoxide |
| H2
|
Hydrogen |
| ZCMR |
Zeolite Catalytic Membrane Reactors |
| [Pt(NH3)4]Cl2
|
Tetraammine Platinum(II) Chloride |
| Ppm |
Parts per million |
| TOC |
Total Organic Carbon |
| H2O |
Water |
| Na2SiO3
|
Sodium Metasilicate |
| Na2AlO2
|
Sodium Aluminate |
| P |
P factorial |
| °F |
Degree Fahrenheit |
| > |
More than |
Appendix A
Aluminium Oxide required,
Potassium Hydroxide (KOH) required,
Appendix B

References
- Abdeen, F. R. H., M. Mel, M. Al-khatib, and A. S. Azmi. 2011. Dehydration of Ethanol on Zeolite Based Media Using. , 8–9. [Google Scholar]
- Adnan, N. A. A., S. N. Suhaimi, S. Abd-Aziz, M. A. Hassan, and L.-Y. Phang. 2014. Optimization of bioethanol production from glycerol by Escherichia coli SS1. Renewable Energy 66: 625–633. [Google Scholar] [CrossRef]
- Chang, Y., K. Jha, K. M. Fernandez, and N. Fatein. 2011. Oil Price Fluctuations and Macroeconomic Performances in Asian and Oceanic Economies. , 1–47. [Google Scholar]
- Chaudhuri, U. 2010. Fundamentals of Petroleum and Petrochemical Engineering. CRC Press: Vol. 20106146. [Google Scholar] [CrossRef]
- Chin, K. L., and P. S. H. 2013. A Real Story of Bioethanol from Biomass : Malaysia Perspective.
- Daramola, M., E. Aransiola, and T. Ojumu. 2012. Potential Applications of Zeolite Membranes in Reaction Coupling Separation Processes. Materials 5, 12: 2101–2136. [Google Scholar] [CrossRef]
- Chloro, Euro. 2014. Product Safety Summary of Potassium Hydroxide. ICCA. Retrieved from www.eurochlor.org/media/61561/potassium_hydroxide_gps_final.doc.
- H. and A. Fujii, T. 2009. Effect of Stirring On The Dissolution of Coal Fly Ash And Synthesis of Pure-Form Na-A and–X Zeolites By Two Step Process. Advanced Powder Technology 20: 473–479. [Google Scholar]
- Haden, L., *!!! REPLACE !!!* W., and *!!! REPLACE !!!* J. 1961. Metuchen and Dzierzanowski. US Patent 2992068. [Google Scholar]
- Hamdi, N., and E. Srasra. 2012. Removal of phosphate ions from aqueous solution using Tunisian clays minerals and synthetic zeolite. Journal of Environmental Sciences 24, 4: 617–623. [Google Scholar] [CrossRef] [PubMed]
- Hussin, F., M. K. Aroua, and W. M. A. W. Daud. 2011. Textural characteristics, surface chemistry and activation of bleaching earth: A review. Chemical Engineering Journal 170, 1: 90–106. [Google Scholar] [CrossRef]
- Klamrassame, T., P. P., and N. L. 2010. Synthesis of Zeolite From Coal Fly Ash: Its Application as Water Adsorbent. Engineering Journal 14, 1: 37–44. [Google Scholar] [CrossRef]
- Kosanovic, C., T.A., Jelic, J. Bronic, D. Kralj, and B. Subotic. 2011. Chemically Controlled Particulate Properties of Zeolites: Towards The Face-less Particles of Zeolite A. Part 1. Influence of The Batch Molar Ratio [SiO2/Al2O3] On The Size ande Shape of Zeolite A Crystals. Microporous and Mesoporous Materials 137: 72–82. [Google Scholar] [CrossRef]
- Kumar, S., N. Singh, and R. Prasad. 2010. Anhydrous ethanol: A renewable source of energy. Renewable and Sustainable Energy Reviews 14, 7: 1830–1844. [Google Scholar] [CrossRef]
- Mana, M., M. S. Ouali, L. C. de Menorval, J. J. Zajac, and C. Charnay. 2011. Regeneration of spent bleaching earth by treatment with cethyltrimethylammonium bromide for application in elimination of acid dye. Chemical Engineering Journal 174, 1: 275–280. [Google Scholar] [CrossRef]
- Meziti, C., and A. Boukerroui. 2011. Regeneration of a solid waste from an edible oil refinery. Ceramics International 37, 6: 1953–1957. [Google Scholar] [CrossRef]
- Mohammadi, T., and A. Pak. 2003. Separation of water/ethanol mixtures using zeolite A membranes. In 5th International Membrane Science and Technology Conference. Sydney, Australia. [Google Scholar]
- National Center for Biotechnology Information. 2014. Compound Summary for CID 702. PubChem Open Chemistry Database. Available online: http://pubchem.ncbi.nlm.nih.gov/compound/702.
- National Pollutant Inventory. 2014. Ethanol (ethyl alcohol). Department of Environment, Australian Government. Available online: http://www.npi.gov.au/resource/ethanol-ethyl-alcohol.
- Ojha, K., N. C. Pradhan, and A. N. Samanta. 2004. Zeolite from fly ash: synthesis and characterization. Bulletin of Materials Science 27, 6: 555–564. [Google Scholar] [CrossRef]
- Prasad, S., A. Singh, and H. C. Joshi. 2007. Ethanol as an alternative fuel from agricultural, industrial and urban residues. Resources, Conservation and Recycling 50, 1: 1–39. [Google Scholar] [CrossRef]
- Purnomo, W.P., S. C., and H. H. 2012. Synthesis of Pure Na-X and Na-A Zeolite From Bagasse Fly Ash. Microporous and Mesoporous Material 162: 6–13. [Google Scholar] [CrossRef]
- Rios, C.A., D. W. C., and A. F. M. 2009. Nucleation And Growth History of Zeolite LTA Synthesized From Kaolinite By Two Different Methods. Applied Clay Science 42: 446–454. [Google Scholar] [CrossRef]
- Rios, C.A., C.D., William, and O.M. Castanellos. 2012. Crystallization of Low Silica Na-A and Na-X Zeolites From Transformation of Kaolin and Obsidian by Alkaline Fusion. Ingeniera Y Competividad 14, 2: 125–137. [Google Scholar]
- Sanni, A. 2011. Development of zeolites and zeolite membranes from Ahoko Nigerian Kaolin. University of Manchester. [Google Scholar]
- Shah, A. A. A., H. N. A. H. Nour, and M. Y. R. M. Yunos. 2014. Australian Journal of Basic and Applied Sciences Methodology To Produce Hard Coherent Water Adsorbent Using Modified Fusion Method. 8, 4: 235–240. [Google Scholar]
- Nhatasha, Sharifah & Jaafar. 2006. Adsorption Study–Dye Removal Using Clay. University College of Engineering & Technology Malaysia. [Google Scholar]
- Suhartini, S., N. Hidayat, and S. Wijaya. 2011. Physical properties characterization of fuel briquette made from spent bleaching earth. Biomass and Bioenergy 35, 10: 4209–4214. [Google Scholar] [CrossRef]
|
Disclaimer/Publisher’s Note: The statements, opinions and data contained in all publications are solely those of the individual author(s) and contributor(s) and not of MDPI and/or the editor(s). MDPI and/or the editor(s) disclaim responsibility for any injury to people or property resulting from any ideas, methods, instructions or products referred to in the content. |
© 2025 by the authors. Licensee MDPI, Basel, Switzerland. This article is an open access article distributed under the terms and conditions of the Creative Commons Attribution (CC BY) license (http://creativecommons.org/licenses/by/4.0/).