Submitted:
15 February 2025
Posted:
18 February 2025
You are already at the latest version
Abstract
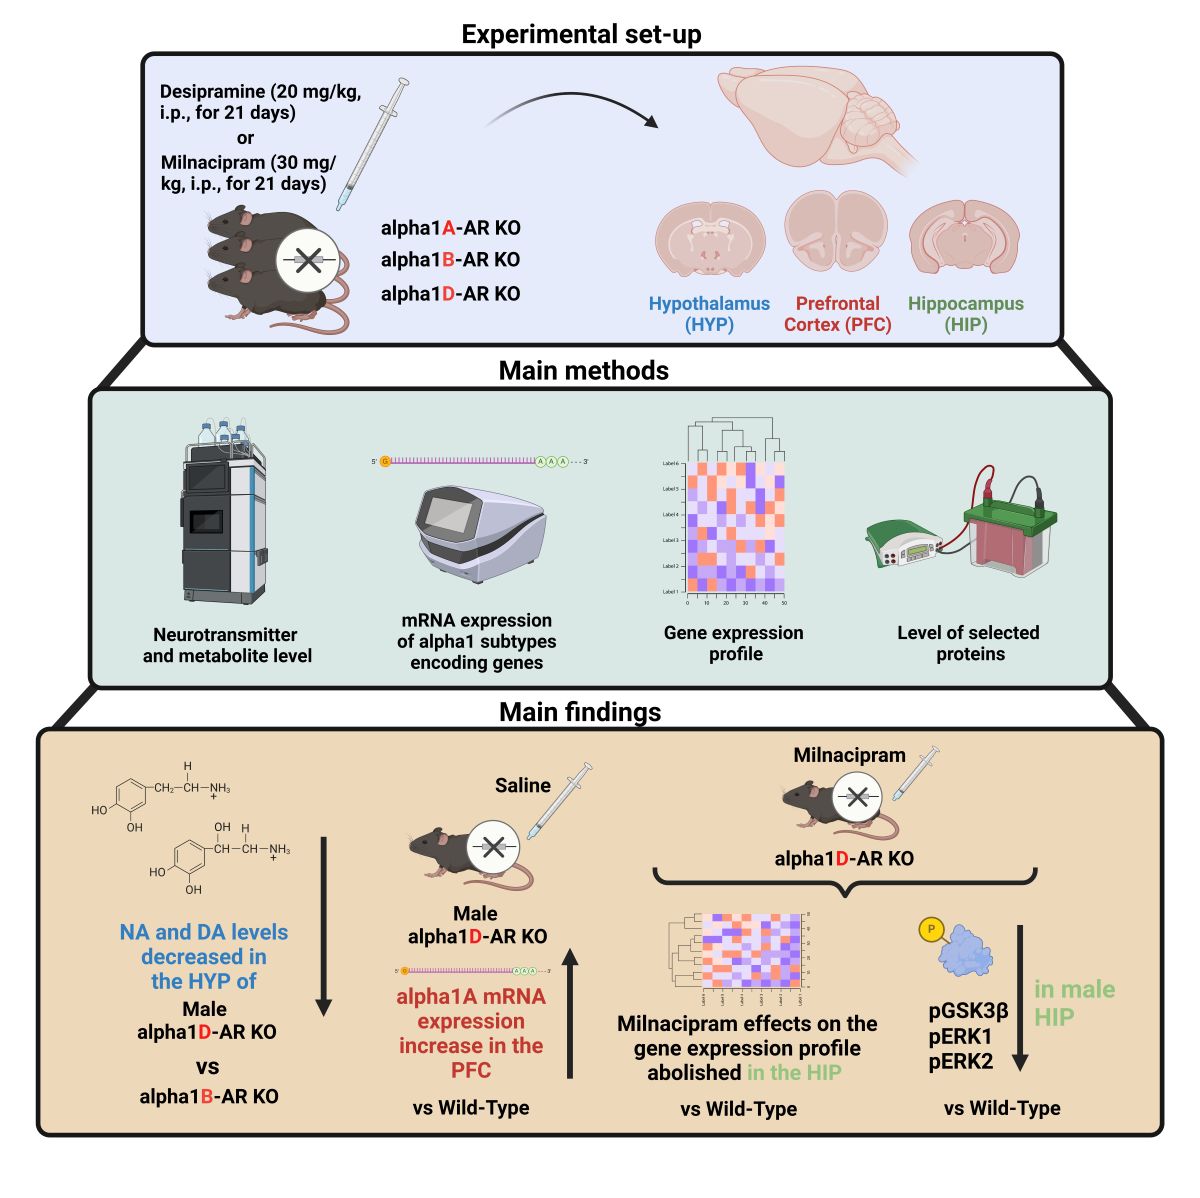
We investigated whether the functional involvement of α1-adrenergic receptors (α1-AR) in the effects induced by antidepressant drugs, desipramine, and milnacipran varies depending on the α1-AR subtype. First, using a mouse line with triple knockout (KO) of genes encoding all three α1-AR subtypes (ABD-KO) and autoradiographic analysis, we demonstrated that the inactivation of α1-AR did not affect the density of other types of adrenergic receptors, α2- and β-AR in the mouse brain. Subsequently, we utilized three mouse knockout lines with selective inactivation of the gene encoding a single α1-adrenergic receptor subtype (A-KO, B-KO, and D-KO). We analyzed the impact of these mutations on tissue levels of monoaminergic neurotransmitters in the hypothalamus. Next, we assessed how a specific mutation affects the long-term effects of desipramine and milnacipran in the selected brain regions of male and female mice at various molecular levels: mRNA expression of α1-AR subtypes, gene expression profiling, and activation of selected signaling proteins (ERK1/2, Akt, GSK3). The main finding is that the inactivation of the α1D subtype modulates at various molecular levels the long-term effects of desipramine or milnacipran in a sex-dependent manner. Our study revealed the functional diversity between α1-AR subtypes in the molecular mechanisms of antidepressants’ drug action.
Keywords:
desipramine
; milnacipran
; knockout mice
; quantitative autoradiography
; UHPLC
; mRNA
; DNA microarray
; ERK1/2
; Akt
; GSK3
1. Introduction
Noradrenaline, the neurotransmitter released from the locus coeruleus neurons of the brain and the adrenal gland, typically alongside adrenaline, generally mobilizes the brain and body for action, reaching significantly higher levels in stress situations. In the brain, noradrenaline increases arousal and alertness, supports wakefulness, enhances memory formation and recall, enables concentration, and also increases anxiety and fear, excess of which can lead to anxiety disorders [1,2,3]. The actions of noradrenaline result from the activation of different adrenoceptors widely distributed in the central and peripheral nervous systems. These receptors are the seven transmembrane-spanning receptors that belong to the sizeable G-protein-coupled receptor (GPCR) superfamily. The adrenergic receptors are classified into three subfamilies: α1-adrenoceptors (α1-ARs), α2-AR-adrenoceptors (α2-ARs), and β-adrenoceptors (β-ARs), based on their pharmacological profiles, central coupling to signaling pathways and phylogeny [4,5,6]. Each of these subfamilies consists of three receptor subtypes.
The α1-AR subfamily was the subject of the present work. When considering the subtypes of α1-AR, namely α1A-AR, α1B-AR, and α1D-AR, some similarities can be observed among them, but at the same time, there are noticeable differences. All three receptor subtypes are coupled to Gq/11 and phospholipase Cβ (PLC), which stimulate phosphoinositide hydrolysis to produce two second messengers, inositol trisphosphate and diacylglycerol (DAG), followed by increased mobilization of intracellular Ca2+and protein kinase C (PKC) activation which can phosphorylate many other types of proteins and signals downstream in the signaling cascade. The α1-ARs function as stimulatory receptors. However, each subtype is encoded by a separate gene on different chromosomes, has a distinct pharmacological profile and amino acid sequence, and is differentially distributed [7,8,9].
Although all three subtypes of α1-AR activate the same main signaling pathway, the profiles of gene expression changes induced within the cell through their signaling may not always be identical. Differences between individual subtypes of α1-ARs were also observed in regulating their activity following stimulation by their physiological agonist noradrenaline or synthetic agonistic compounds [10,11,12,13,14]. This partly determines the intracellular changes profile after stimulation of specific α1-AR subtypes.
Furthermore, it appears that there are ligand-dependent phosphorylation patterns of α1-ARs [11,15], which should be considered when the drug action mechanisms are explored. Ultimately, the α1-ARs can signal either through G-protein-dependent or G-protein-independent mechanisms involving β-arrestins. The latter act as scaffolds to recruit and activate other second messengers, such as extracellular signal-regulated kinases 1/2 (ERK 1/2), p38, and Src [16,17].
The diverse distribution and functions of α1-AR subtypes in peripheral tissues are relatively well characterized, especially in the cardiovascular and urogenital systems [7,18,19,20,21,22]. However, these α1-AR subtypes are less explored when considering the central nervous system. While it is known that these receptors are expressed in the brain [23], attempts to determine the localization of individual α1-AR subtypes have been challenging. In addition to the lack of highly selective ligands and specific antibodies, a significant limitation has been the selective permeability of the blood-brain barrier, which is often not to be exceeded for many chemical compounds.
With methodological progress, diverse expression patterns of α1-AR subtypes in the brain have been identified through genetic engineering and the construction of transgenic mouse models with fluorescently tagged receptors and knockout (KO) mice. Studies using these approaches have shown that the α1A and α1B subtypes are widely distributed in brain tissue, with their highest expression observed primarily in neurons of structures such as the cerebral cortex, amygdala, hypothalamus, and cerebellum [24,25]. In contrast, the α1D subtype exhibits low expression levels in the brain and is mainly localized in the cerebral cortex, hippocampus, and specific thalamic nuclei [26].
For many years, cerebral α1-adrenoceptors (α1-ARs) have interested researchers in studying neurochemical and molecular mechanisms of antidepressant drugs’ action. Tricyclic antidepressants are drugs that often interact directly with these receptors; they possess an affinity and can directly bind to α1-ARs, which, unfortunately, results in the undesired cardiovascular effects associated with these drugs (see [27]). Additionally, the pharmacological target of most antidepressants is the reuptake process of catecholamines and serotonin (into neurons), leading to the enhanced postsynaptic stimulation of α1-ARs (see [28]). In our previous studies, repeated administration of an antidepressant drug, imipramine, at least for three weeks, resulted in increased density of α1-ARs as observed in a rat model and affected the mRNA expression of genes encoding α1-AR subtypes in a varied manner [29]. These changes suggested the differential involvement of receptor subtypes in the mechanism of action of antidepressant drugs.
While initial hypotheses regarding the etiology of depression linked this disorder to impairment of monoaminergic pathways in the brain, the currently most prevalent theory suggests that disrupted neuroplasticity underlies depressive disorders [8,28,30]. Imaging and postmortem brain studies in depressed human subjects and animal behavioral models of depression have identified several different cellular events and intracellular signaling pathways that are modulated by stress and are potential mediators of antidepressant action [31]. Considering the numerous changes in intracellular signaling that occur upon stimulation of monoaminergic receptors, including α1-ARs and their subtypes, prolonged and frequent stimulation of these receptors can lead to adaptive changes that influence neuroplasticity processes.
Among intracellular signaling pathways implicated in mood disorders are ERK 1/2, the central MAPK proteins [32] that were shown to be downregulated in the hippocampus of depressed suicide subjects [33]. As our previous studies in the rat model have shown, chronic treatment with imipramine increases the level of ERK1 phosphorylation, indicating enhanced activation of ERK1 by imipramine [34]. Other intracellular signaling pathways implicated in neuropsychiatric disorders are phosphatidylinositol 3-kinase (PI3K)-Akt signaling and the glycogen synthase kinase-3 beta (GSK3beta) signaling cascade (see [31,35]) and subtypes of α1-AR were shown to be involved in the regulatory mechanisms of these proteins [36,37,38,39].
In the present study, we investigated whether the functional involvement of α1-AR in the effects induced by chronic treatment with antidepressant drugs, desipramine (DMI) and milnacipran (MIL), varies depending on the α1-AR subtype. The study utilized three mouse knockout lines with selective inactivation of the gene encoding a single α1-AR subtype (A-KO, B-KO, and D-KO). We assessed whether and how a specific mutation affects the long-term effects of DMI and MIL in the selected brain regions of male and female mice at various molecular levels, including mRNA expression of α1-AR subtypes, gene expression profiling, and expression and activation of selected signaling proteins (ERK1/2, Akt, GSK3β).
2. Results
2.1. Autoradiographic Analyses of the Density of α1-AR, α2-AR, and β-AR Receptors in the Brains of Triple ABD-KO Mice
The ABD-KO transgenic mouse line was evaluated for the efficiency of mutations affecting α1-AR, assessed based on the quantity of [3H]-prazosin binding sites and the impact of mutations on other AR subclasses. Quantitative in vitro receptor autoradiography was conducted on male ABD-KO and WT mice brain sections, examining the distribution and binding site densities of α1-AR, α2-AR, and β-AR receptors. The analysis was performed on brain sections corresponding to the bregma levels of +1.70 mm (Supplementary Figure S1A) and -1.34 mm (Supplementary Figure S1B), selected based on literature data and our previous papers describing the adrenergic receptors localization and abundance in brains of laboratory rodents, particularly α1-AR, which exhibits high expression in several brain regions including the cerebral cortex, hippocampus, and thalamus [40,41,42,43,44]. Quantitative autoradiography of all types of adrenergic receptors is shown in Figure 1.
In WT mice, the [3H]prazosin α1-AR binding sites were found in the most significant quantity in the cerebral cortical regions and thalamic nuclei, with moderate levels in the accumbens nuclei and hippocampus (Figure 1A). In turn, the highest densities of α2-AR in mouse brains were found in the infralimbic cortex, prelimbic cortex, and thalamic nuclei with lower densities throughout the other cortical regions, accumbens, and hippocampus, based on [3H]RX821002 autoradiography (Figure 1D). In contrast to the α1-ARs, the β-AR – quantified as [3H]CGP12177 binding sites exhibited a similar level in almost all brain regions examined. An exception was observed in the hippocampus, where the density of the β-AR was half as low compared to other studied brain regions (Figure 1G).
In the case of α1-AR density measurements in ABD-KO mice, a signal originating exclusively from non-specific background binding was observed (Figure 1B,C, lower panels). The absence of specific signals in the analyzed brain structures of ABD-KO mice indicates either an absence or trace amounts of [3H]-prazosin binding sites, confirming the effectiveness of the mutation-induced inactivation of all three subtypes of α1-AR. The bars in Figure 1A depict the α1-AR density level in the brains of only WT controls. Significantly, the ABD-KO mutation did not affect the density of α2-AR (Figure 1D-F) and β-AR (Figure 1G-I), which did not differ from the density of these receptors in the examined brain structures of the WT control mice.
2.2. Neurotransmitters’ and Their Metabolite Levels in the Cerebral Hypothalamic Tissues of Genetically Modified Mice
The characterization of mouse transgenic lines A-KO, B-KO, and D-KO began with investigating the impact of mutations on the levels of noradrenaline (NA), dopamine (DA), its metabolites such as 3,4-dihydroxyphenylacetic acid (DOPAC) and homovanillic acid (HVA), as well as serotonin (5-HT) along with its metabolite 5-hydroxyindoleacetic acid (5-HIAA) in the hypothalamus (HY) of male mice. The neurotransmitters’ tissue levels were measured using ultra-high-performance liquid chromatography (UHPLC) with coulochemical detection (Figure 2 A-F). Furthermore, the results were presented as ratios of metabolite concentrations to their corresponding analytes, allowing assessment of the mutation’s impact on the quantities of neurotransmitters in the examined tissues and their metabolism (turnover) (Figure 2 G, H, I).
The analyses of the obtained data by use of one-way ANOVA indicated the impact of deletion of individual α1A-AR, α1B-AR, or α1D-AR subtypes on the tissue levels of NA (genotype effect F(3, 26)=4.3404, p=0.01316), DA (genotype effect F(3, 24)=5.3497, p=0.00577), and 5-HT (genotype effect F(3, 24)=3.1527, p=0.04335) in the HY of mice (Figure 2A-C). The posthoc analysis showed no differences in the levels of neurotransmitters compared to the control group, which consisted of WT littermates from respective transgenic breeding lines. However, in the hypothalamus of D-KO mice, the levels of NA and DA were significantly lower compared to the B-KO individuals (Figure 2A, B). Deleting any of the α1-AR subtypes did not affect the levels of the investigated metabolites in this brain structure (Figure 2D – F). However, the mutation impacted the ratio of DOPAC to DA concentrations (effect of genotype F(3, 24)=4.5336, p=0.01179) and 5-HIAA to 5-HT concentrations (effect of genotype F(3, 23)=5.0017, p=0.00815) (Figure 2G, I).
2.3. The Impact of α1-AR Subtype-Specific Deletions and Antidepressant Drugs on the mRNA Levels of Remaining α1-AR Subtypes
To obtain a picture of potential compensatory effects that might be caused by the deletion of particular α1-AR subtype on other subtypes, we have determined mRNA expression levels of individual α1-AR subtypes in the prefrontal cortex (PFC) of male α1A-AR (A-KO), α1B-AR (B-KO) and α1D-AR (D-KO) knock-out animals. The quantification was done in animals repeatedly injected with saline, DMI, or MIL. The mRNA levels of the ADRA1A, ADRA1B, and ADRA1D genes were quantified using the quantitative real-time polymerase chain reaction (qRT-PCR) method.
The obtained results indicate that in the case of mRNA levels of the gene encoding α1A-AR (ADRA1A) and the gene encoding α1B-AR (ADRA1B), deletion of α1D-AR subtype and repeated antidepressant drug administration elicit similar effects (Figure 3 A, B). Both α1A-AR and α1B-AR subtypes mRNA showed upregulation (α1A-AR, Figure 3A) or a tendency toward upregulation (α1B-AR, Figure 3B) in saline-injected D-KO animals, and both DMI and MIL treatments reversed this. A two-way analysis of variance (ANOVA) showed that the effect of antidepressant drug alone influenced the mRNA levels of these genes (ADRA1A: drug effect F(2, 86)=4.258, p=0.0172; ADRA1B: drug effect F(2, 88)=6.212, p=0.0030) as well the mutation in combination with the repeated antidepressant drug administration (ADRA1A: interaction effect F(4, 86)=4.713, p=0.0017; ADRA1B: interaction effect F(4, 88)=2,870, p=0,0276). In the case of the gene encoding α1D-AR (ADRA1D), it was demonstrated that mutation and repeated antidepressant drug administrations did not influence its mRNA expression in the PFC (prefrontal cortex) of mice, compared to the control group consisting of WT individuals from respective transgenic lines (Figure 3C).
2.4. Assessment of the Impact of α1-AR Subtype Deletions and Antidepressant Drugs on the Gene Expression Profile
The impact of mutations and repeated administration of DMI or MIL on gene expression profiles in the hippocampus (HIP) of A-KO, B-KO, and D-KO mice was investigated using DNA microarray technology.
Total RNA isolated from male HIP samples was subjected to quality and integrity selection and then used as a template for cDNA synthesis via reverse transcription PCR. The resulting cDNA was hybridized to the GeneChip Mouse Genome 430A 2.0 microarray (Affymetrix, USA). These arrays include over 45,000 oligonucleotide probes that can detect more than 39,000 transcripts, allowing for whole-genome expression profiling of the mouse genome. The results underwent bioinformatic analysis using the Multiple Experiment Viewer (MeV) to visualize differential gene expression following hierarchical clustering (linkage method: average linkage clustering). Finally, the data was presented as heat maps illustrating gene expression patterns (Figure 4).
Based on the analysis of the gene expression profiling results, a total of 151 transcripts were found to be significantly altered due to the deletion of one of the α1-ARs subtypes. Comparable numbers of transcripts were affected by the deletion of α1A-AR or α1D-AR (52 in A-KO, 45 in D-KO), while the deletion of α1B-AR resulted in nearly twice as many affected transcripts (83 in B-KO). Some significantly regulated transcripts were shared between two of the three transgenic lines. However, no transcripts were found to be significantly regulated in both A-KO and B-KO or D-KO mice simultaneously (Figure 4 C). Furthermore, analysis of gene expression patterns presented in heat maps using clustering methods also indicates a distinct gene expression profile in the hippocampus of B-KO mice compared to A-KO and D-KO mice (Figure 4 A).
The impact of multiple administrations of antidepressant drugs on gene expression profiles in the hippocampus of WT mice was demonstrated for both investigated antidepressants, with a more pronounced effect observed with MIL (99 significantly regulated transcripts) compared to DMI (36 significantly regulated transcripts). Similarly to the mutation effect, a small number of transcripts were found to be regulated by both drugs (Figure 4 D). Analysis of gene expression patterns also indicates a distinct impact of multiple administrations of DMI and MIL on gene expression profiles in the hippocampus of WT mice (Figure 4 B). Additionally, ontological gene analysis was performed for transcripts significantly regulated by multiple administrations of MIL, and the results are presented in Figure 5.
Due to the markedly more significant effect at the transcriptomic level of multiple administrations of MIL compared to DMI, the impact of deleting individual α1-AR subtypes and antidepressant drugs action on gene expression profiles in the hippocampus of mice was decided to be presented in more detail using the example of MIL results (Figure 6). Analysis of gene expression patterns corresponding to transcripts significantly regulated by MIL in WT mice (WT MIL group) and WT (WT sal) and A-KO, B-KO, and D-KO mice receiving MIL administrations indicates the abolition of drug effects due to deletion of α1D-AR, with these changes not observed in the case of α1A-AR or α1B-AR deletions. Furthermore, the gene expression profile in B-KO mice after MIL administration is notably similar to the gene expression profile in WT mice after MIL administration, suggesting that at the transcriptomic level, the α1B subtype (unlike the α1D subtype) does not influence the effects of MIL observed in WT mice compared to WT mice.
On the other hand, the deletion of α1A-AR appears to intensify the impact of MIL observed in WT MIL animals compared to WT SAL animals, although these changes are not unequivocal.
2.5. Evaluation of the Impact of α1-AR Subtypes’ Deletions and Repeatedly Given Antidepressant Drugs on the Phosphorylation of Selected Protein Kinases
To assess the impact of mutations and repeated administration of DMI or MIL on intracellular signaling pathways, the levels of phosphorylation and expression of several proteins involved in α1-AR signaling or considered as intracellular targets of antidepressant drug action were measured, including ERK1/2, Akt, and GSK-3β. These assessments were conducted using Western blot analysis in the hippocampi (HIP) of male and female A-KO, B-KO, and D-KO mice and wild-type (WT) individuals – the littermates from respective transgenic lines.
In male mice, selective deletion of any of the three subtypes (A, B, and D) of the α1-AR receptor did not induce changes in the phosphorylation of ERK1 (Figure 7A and 7F) and ERK2 (Figure 7C – 7H, and 7M) compared to WT animals, except for a slight increase of the ERK1 phosphorylated form in D-KO animals (Figure 7K). However, changes were observed following chronic administration of antidepressant drugs and were limited to the α1B-AR and the α1D-AR. In B-KO mice, both DMI and MIL treatment increased the ERK1 phosphorylation (Figure 7F), and MIL increased ERK2 phosphorylation (Figure 7H), [pERK1/ERK1: interaction effect F(1, 25)=6,4607, p=0,01760)]. In D-KO mice, the impact of the two drugs varied. Chronic DMI did not induce changes in the hippocampus of WT mice; however, it enhanced the phosphorylation of ERK1 and ERK2 in D-KO individuals (pERK1/ERK1: genotype effect F(1, 27)=12,000, p=0,00179 and pERK2/ERK2: genotype effect F(1, 26)=10,780, p=0,00293). In the case of MIL, the opposite effect was observed. The drug enhanced the phosphorylation of ERKs in WT mice, but this effect was reduced in D-KO mice lacking the α1D-AR receptor (pERK1/ERK1: interaction effect F(1, 24)=4,6700, p=0,04089; pERK2/ERK2: interaction effect F(1, 24)=6,6086, p=0,01678) (Figure 7K and 7M).
In male mice, selective inactivation of α1A-AR did not affect the expression and phosphorylation levels of Akt and GSK-3β compared to WT animals, and multiple administrations of antidepressant drugs did not result in changes in the examined proteins (Figure 8A-E). Similarly, selective deletion of α1B-AR did not influence the expression levels of Akt and GSK-3β proteins (Figure 8F-J); however, chronic administration of MIL increased the phosphorylation of Akt protein (manifested as an increased ratio of pAkt/Akt) in B-KO compared to WT mice (interaction effect F(1, 25) = 4.5793, p = 0.04231) (Figure 8F). The GSK3β activity (pGSK3β/GSK3β ratio) was similarly enhanced by DMI and MIL administration, and the drugs’ effects were unchanged by B-KO mutation (Figure 8H). Selective inactivation of α1D-AR did not affect the expression levels of Akt and GSK-3β compared to WT animals, which also remained unchanged following multiple administrations of DMI or MIL (Figure 8L and 8N). However, α1D-AR inactivation influenced the phosphorylation of Akt and GSK-3β proteins by increasing the ratio of phosphorylated form to total form compared to the ratio observed in WT animals. Importantly, for both proteins, multiple administrations of MIL resulted in decreased phosphorylation levels in mutants compared to WT animals (p/tAkt: interaction effect F(1, 24) = 11.309, p = 0.00258; p/tGSK-3β: interaction effect F(1, 22) = 18.292, p = 0.00031) (Figure 8K and 8M). On the other hand, repetitive administrations of DMI led to decreased phosphorylation levels only for Akt protein in D-KO mutants compared to WT controls (interaction effect F(1, 26) = 12.740, p = 0.00142) (Figure 8K).
Analysis of the results in female mice showed that selective inactivation of α1A-AR did not affect the expression and phosphorylation levels of ERK1 and ERK2 proteins in the hippocampus compared to WT animals, and this lack of effect was sustained even after multiple administrations of DMI or MIL (Figure 9). Selective inactivation of α1B-AR did not lead to changes in the phosphorylation of ERK1 and ERK2 proteins, but it did affect the levels of their total forms. Specifically, the mutation resulted in a decrease in ERK2 expression compared to the WT group, and this effect was mitigated by repeated administration of DMI and reversed by multiple administrations of MIL (interaction effect F(1, 25) = 58.117, p = 0.00000) (Figure 9I). A similar effect was observed in the expression level of the total form of ERK1 protein, where an increase in its level was also noted in α1B-AR knockout mice after multiple administrations of MIL (interaction effect F(1, 27) = 7.9829, p = 0.00877) (Figure 9G). In D-KO mutants, a decrease in ERK2 expression compared to WT animals was observed, and chronic administrations of DMI or MIL reversed this effect (DMI: interaction effect F(1, 26) = 9.6884, p = 0.00447; MIL: interaction effect F(1, 26) = 7.6880, p = 0.01014) (Figure 9N). On the other hand, selective inactivation of α1D-AR affected the phosphorylation of ERK1 and ERK2 proteins. A decrease in the ratio of phosphorylated form to total form was observed in D-KO mice following multiple administrations of DMI (pERK1/ERK1: genotype effect F(1, 27) = 6.4779, p = 0.01695; p/tERK2: genotype effect F(1, 27) = 7.1601, p = 0.01273) (Figure 9K and 9M).
In A-KO female mice, no changes were observed in the expression level of GSK-3β protein (Figure 10D); however, a decrease in Akt protein level was noted in mutants after chronic administration of MIL (interaction effect F(1, 28) = 6.9259, p = 0.01366) (Figure 10B). The activity of Akt and GSK3β (assessed as their pAkt/Akt and pGSK3β ratio, respectively) in A-KO mice were affected by MIL administration but in the opposite manner (Figure 10A and 10C). The selective inactivation of α1B-AR did not result in changes in the expression levels of Akt and GSK-3β proteins or the phosphorylation of GSK-3β compared to WT animals, and these proteins remained unchanged following multiple administrations of DMI or MIL (Figure 10G and 10I). However, it should be noted that both drugs enhanced the phosphorylation of GSK-3β (pGSK-3β/GSK-3β ratio) in the WT group and in animals with the B-KO mutation compared to the groups receiving saline injections (Figure 10H). Furthermore, for Akt protein, it was observed that multiple administrations of DMI increased the ratio of phosphorylated form to total form (pAkt/Akt) in B-KO mice compared to the WT group (interaction effect F(1, 25) = 6.2888, p = 0.01901) (Figure 10F). The inactivation of α1D-AR in female mice did not affect the expression levels of Akt and GSK-3β proteins or the phosphorylation of GSK-3β compared to WT animals, and this remained unchanged following multiple administrations of DMI or MIL (Figure 10L-10N). In this case, the only change was noticed in the pAkt/Akt ratio, which was affected by treatment with MIL and was similarly decreased in the D-KO and WT groups (Figure 10K).
3. Discussion
Although research on the α1-AR subtypes has been ongoing for over three decades, the specific functions regulated by individual subtypes in the brain remain poorly explained. Nevertheless, many essential processes are controlled by activating the α1-ARs, including behavioral responses [47]. These receptors are engaged in neuroplasticity processes, long-term potentiation (LTP), and memory-related phenomena. In vivo genetic models in research have revealed diverse involvement of α1-AR subtypes in cognitive processes [see [8]]. In transgenic mice of the CAM (constitutively active mutant) type exhibiting systemic overexpression of the constitutively active α1A subtype (α1A-CAM), significantly better performance was observed in behavioral tests assessing learning and spatial memory compared to wild-type mice, and such mutants exhibited antidepressant and anxiolytic phenotypes [48,49]. Additionally, an enhancement of long-term potentiation (LTP) in the hippocampus was observed in these mice—a brain structure involved in the regulation of neurogenesis and characterized by high α1A-AR expression [49]. In the case of mice with systemic overexpression of the constitutively active α1B subtype (α1B-CAM), distinct effects are observed. These animals develop synucleinopathies, progressive neurodegeneration, and locomotor disturbances resembling Parkinsonian symptoms. The phenotype of α1B-CAM mice exhibits many similarities to the progression of multiple system atrophy (MSA), particularly in terms of autonomic dysfunction, bradycardia, and decreased serum levels of catecholamines and cortisol [50]. However, the role of the α1D subtype in the central nervous system appears to be the least understood. Nevertheless, the available literature data suggest its involvement in working memory, attention, and motor coordination processes [51]. Knockout mice lacking α1D-AR expression (α1D-KO) exhibit limitations in exploratory behaviors in the novel environment test [26].
Our study, which investigates the functional involvement of α1-ARs in the effects induced by antidepressant drugs, DMI and MIL, takes an innovative approach. We utilized three transgenic mouse lines with selective knockout of individual α1-AR subtypes: α1A (A-KO), α1B (B-KO), and α1D (D-KO). Before this, we confirmed the efficacy of the mutations using mice with a triple knockout of all three α1-AR subtypes (ABD-KO) via autoradiography. This thorough approach ensured the accuracy and reliability of our results. In the analyzed brain structures, no specific radioligand binding signal to α1-ARs was observed, confirming the effectiveness of the ABD-KO mutation. Significantly, the inactivation of α1-ARs did not affect the density of the remaining types of adrenergic receptors, the α2-AR and β-AR, which could have impacted the results of the assays planned for subsequent stages of the experiment had such an effect occurred.
Next, we investigated the impact of A-KO, B-KO, and D-KO mutations on the levels of selected neurotransmitters and their metabolites in the hypothalamus tissue. Our study demonstrated that the D-KO mutation resulted in a decrease in noradrenaline levels compared to the B-KO subtype, where mutation, similarly to the A-KO, did not affect noradrenaline levels in the brain structure examined. Although this effect was not statistically significant compared to control animals, it suggests a potentially important role of the α1D-AR subtype in noradrenergic transmission in the hypothalamus. Furthermore, it may indicate a failure of adaptive mechanisms in the absence of functional α1D-AR, possibly related to its unique constitutive activity [8,52]. Interestingly, Konstandi et al. [53] demonstrated an increase in noradrenaline levels in the hypothalamus of mice under physical stress. One can speculate that the D-KO mutation could potentially impact the functions of the hypothalamic-pituitary-adrenal (HPA) axis and reduce the susceptibility of animals to stress.
In the second part of our research, we delved into the involvement of α1-ARs in the mechanism of molecular effects of two antidepressant drugs, DMI and MIL. This research is of utmost importance as it sheds light on the intricate molecular mechanisms underlying the action of these drugs. The antidepressant, DMI, as a secondary amine and a systemic metabolite of imipramine, exhibits much more potent inhibition of norepinephrine reuptake compared to serotonin, to the extent that it could be classified as an NRI (norepinephrine reuptake inhibitor) in this regard [54]. The second selected drug, MIL, belongs to the SNRI (serotonin-norepinephrine reuptake inhibitor) group. MIL also inhibits the reuptake of both norepinephrine (NA) and serotonin (5-HT); however, unlike tricyclic antidepressants (TCA) such as DMI, MIL exhibits feeble receptor-binding activity [55].
We assessed the mRNA expression levels of individual α1-ARs’subtypes in the prefrontal cortex of A-KO, B-KO, D-KO, and WT mice. We found that the knockout of α1A or α1B subtypes did not alter ADRA1D mRNA expression. However, the knockout of the α1D subtype led to a statistically significant increase in the ADRA1A gene expression and a tendency toward the ADRA1B subtype upregulation (in saline-injected D-KO mice), and both DMI and MIL treatments reverted these changes. These findings strongly support our hypothesis that the α1D-AR subtype may play a particular role in the effects of the investigated antidepressant drugs. Though the ADRA1D gene mRNA expression, by itself, was not affected by repeated antidepressant drug administrations, an intact α1D-AR was necessary for DMI and MIL-induced changes in the expression of genes encoding the remaining subtypes of the α1-ARs, at least in the PFC. Furthermore, we noted that the knockout of α1B prevents the DMI-induced increase of the α1A mRNA observed in WT animals, which corresponds with the results of our earlier in vitro studies, also highlighting the significant role of the α1B subtype in the action of this drug [56].
In the next step, gene expression profiling was performed in the hippocampus (HIP) of A-KO, B-KO, and D-KO mice. The mutation and repeated administration of antidepressant drugs moderately affected the gene expression profile, as statistically significant changes were observed in a relatively small number of transcripts. Moreover, none of these transcripts were regulated in all three transgenic lines, and only a few were regulated in two. Along with the fact that B-KO mice exhibited a different gene expression profile compared to A-KO and D-KO mice, this somewhat confirms the functional diversity of α1-AR subtypes. An exciting result was obtained when analyzing the effects of repeated MIL administration in D-KO animals. Ontological analysis of transcripts significantly regulated in the HIP due to MIL treatment revealed their involvement in processes such as ceramide biosynthesis, oligodendrocyte differentiation, and glycolipid metabolism. These processes are closely interconnected, as ceramides mediate the organization of lipid rafts in the cell membrane, which include glycolipids involved in oligodendrocyte differentiation. In neurons, lipid rafts play a crucial role in modulating ion channels and neurotransmitter receptors and in neurotransmitter release via exocytosis [57]. The involvement of the sphingomyelin signaling pathway, in which DAG mediates stimulation of the hydrolysis of sphingomyelin into ceramide, has been repeatedly demonstrated in the action of antidepressant drugs [58,59,60,61,62]. Nevertheless, the results obtained in the current study add to this knowledge by highlighting another drug, MIL. Furthermore, based on the analysis of gene expression patterns corresponding to transcripts significantly regulated in HIP of A-KO, B-KO, and D-KO mice following repeated MIL administration, we found that the inactivation of α1D-AR abolished the effects of this drug, further highlighting the vital role of this α1-AR subtype in the action of MIL.
The following experiment also showed the involvement of the α1D subtype in the action of MIL. In it, we assessed the level of selected protein kinases’ expression and phosphorylation in the same brain structure of the same subjects, as described above. Particularly noteworthy are our results concerning the GSK-3β protein. This protein kinase has been extensively studied in the context of depression, with recent reports suggesting it plays a crucial role in the etiology and pharmacotherapy of this disorder [35,63]. Over the past few years, it has been repeatedly shown that both chronic stress and antidepressant drugs affect GSK-3β activity in the hippocampus (HIP) [64,65,66,67]. Moreover, silencing GSK-3β expression in the HIP is sufficient to induce an antidepressant effect in behavioral tests on mice subjected to chronic stress [68].
GSK-3β is part of many cellular pathways, and its activity can be regulated by various other kinases, including Akt and ERK1/2, which inhibit GSK-3β by phosphorylating its serine residue (Ser9). Our study demonstrated that the inactivation of α1D-AR resulted in increased phosphorylation of GSK-3β and, consequently, its functional inhibition and enhanced phosphorylation of Akt, corresponding to the latter’s activation, may occur. A rise in the phosphorylation of ERK1 and ERK2, and thus their activation, was also noted, although this increase was much weaker than the other two kinases. In animal studies, different authors have reported changes in GSK-3β, Akt, and ERK protein activity. In chronic stress models, activation of GSK-3β and inhibition of Akt and ERK were shown, while following the administration of antidepressant drugs from various groups, the inhibition of GSK-3β and activation of Akt and ERKs were observed [69].
Furthermore, our results show that α1D-AR inactivation attenuated the MIL-induced increase in phosphorylation of GSK-3β in the hippocampus, which is consistent with gene expression profiling results (this study) showing the importance of an intact α1D-AR for MIL effects. Since GSK-3β inhibition is necessary for the antidepressant effect of some drugs [66] and evidence exists that α1A-AR action may regulate GSK-3β, increasing its phosphorylation, thus inhibiting the kinase activity [70], our findings suggest that, in this case, the α1D- and α1A-AR subtypes they can compensate for each other’s function depending on the antidepressant drug used. This hypothesis is exciting in light of reports indicating GSK-3β’s involvement in the modulation of the α1A-AR function and regulation [37].
The results obtained in the current study also highlight the differences between α1-AR subtypes, as the inactivation of α1A-AR or α1B-AR, unlike α1D-AR, did not cause changes in the activity (phosphorylation) of the proteins as mentioned earlier. The effect of mutations on MIL-induced changes in the activity of the tested kinases was also observed in B-KO animals. Still, they differed from those in D-KO animals, manifesting as an increase in Akt activation and ERK1 expression. Moreover, these findings emphasize an essential methodological aspect, increasingly discussed in the literature concerning the etiology and pharmacotherapy of mental disorders—namely, sex differences [71,72,73,74,75]. It turns out in our study that while in male D-KO mice, most of the results observed the impact of mutation on the effects of MIL action, in female D-KO mice, the impact of mutation was mainly seen in the case of DMI. Furthermore, the profile of changes in protein activity in females was also different, as inactivation of α1D-AR did not affect GSK-3β and Akt activation but decreased ERK1 and ERK2 activation. Thus, in the hippocampus of female D-KO mice, repeated administration of DMI produced the opposite effect compared to repeated MIL administration in the same structure in male D-KO mice.
This represents an entirely new observation regarding sex differences in the effects of DMI, contrasting with previously published studies that focused solely on one sex or the impact of a single drug administration [76,77]. The only notable exception in the literature is a recent study conducted in the hippocampus of rats, which suggests that different molecular mechanisms may be responsible for the therapeutic effects of DMI in males and females [78]. As for MIL, the number of reports addressing sex differences in its effects is even smaller [79,80], although such differences have been demonstrated for other drugs in the SNRI class [81,82,83]. The latest research using compounds affecting noradrenergic transmission suggests that α1-AR may be responsible for the sex differences in the noradrenergic modulation of attention and impulsivity [84]. In this context, our study’s findings indicate the promising potential of α1-AR subtypes in developing sex-specific antidepressant therapies, representing a crucial area for future research and clinical applications.
4. Materials and Methods
4.1. Animals
The study was conducted on male and female knockout mice (KO) targeting α1A (A-KO), α1B (B-KO), or α1D (D-KO) adrenergic receptor subtypes. All three lines were kept in the C57Bl6/J background as they originated when creating the KO (for a complete description of the genetic background, see [85,86,87]). Wild-type (WT) mice were always the littermates of KO animals from breeding each line. Only in the case of the autoradiography analyses of adrenergic receptors, naïve mice with knockout of all three α1-AR subtypes (ABD-KO) (a gift from Professors J. C. McGrath and C. J. Daly, University of Glasgow) were used.
4.2. Mice Breeding and Genotyping
A-KO, B-KO, and D-KO mice were bred according to standard procedure by crossing heterozygous mice of each line. The mice were genotyped by PCR using the following predesigned primers:
A-KO:
AGCTAACCATTTCAGCAAAGAC
CAAGATCACCCCAAGTAGAATG
TAACCGTGCATCTGCCAGTTTG
B-KO:
ATTTGTCACGTCCTGCACGAC
CCTGCAGGTATGAGGTCTGTG
CCAAAATGCTCCCAACTCTG
D-KO:
CTTTGTTAAGAAGGGTGAGAA CAGAG
GCTAGGAAGACACCCACTCC
GACATCCTGAGCGTCACTTTC
A tail biopsy for genotyping was completed between 21 and 30 days of age. Mice were also re-genotyped after completed experiments. DNA digestion and genotyping were performed with a commercially available kit (AccuStart™ II Mouse Genotyping Kit, QuantaBio/VWR) according to the manufacturer’s protocol and as described previously [88]. Male and female mice were kept separately with their control (w/t) littermates of the same sex in self-ventilated cages under standard laboratory conditions (12 h light/dark cycle, food and water ad libitum). The study followed the guidelines in the Guide for the Care and Use of Laboratory Animals of the National Institutes of Health. The protocol for all the behavioral studies and tail biopsy and mouse sacrifice was approved by the Animal Ethical Committee at the Maj Institute of Pharmacology, Polish Academy of Sciences (Permit Number: 1233/2015). The GMO animal colony was maintained with the permission of the Polish Ministry of Environment (Permit Numbers: 59/2013, 161/2018).
4.3. Drugs
Desipramine HCl (DMI, 20 mg/kg, i.p., Sigma-Aldrich, USA) and Milnacipran HCl (MIL, 30 mg/kg, i.p., Biosynth Carbosynth, U.K.) were injected once daily for 21 consecutive days. Control mice received vehicle injections, precisely a solution of 0.9% NaCl (saline) (Polpharma, Poland).
4.4. Autoradiography of Adrenergic Receptors in the Brain of WT and ABD-KO Mice
Quantitative autoradiography was carried out as described by [41,43,44]. The male ABD-KO (triple KO) and control WT mice were decapitated, and their brains were removed and stored at – 80°C until subsequent processing. Frozen brains were cut in the coronal plane at - 21°C, using a LEICA Jung CM 3000 cryostat (Leica, Germany), into 12 μm-thick sections. Tissue sections at bregma + 1.70 ± 0.1 mm and – 1.34 ± 0.1 mm, according to Paxinos and Franklin [89], were used. The sections were sectioned and thaw-mounted on gelatin-coated glass microscope slides. They were then stored at - 80°C. Immediately before use, the slide-mounted sections were dried at room temperature.
4.4.1. [3H]prazosin Binding to α1-AR
For α1-ARs binding, slide-mounted sections were thawed and preincubated for 1 h at room temperature in a Krebs-modified buffer (KRBM) pH 7.8, containing 10 mM Na2HPO4, pH 7.8; 119 mM NaCl, 6 mM KCl, 1.2 mM MgSO4, and 1.3 mM CaCl2. For the α1-adrenoceptor assay, sections were further incubated for 1 h in the same buffer containing 0.9 nM [3H]prazosin (Perkin Elmer, USA; specific activity 85 Ci/mmol). Adjacent sections were incubated with radioligand plus 10 µM WB4101 (Sigma-Aldrich, USA) to determine nonspecific binding. Following incubation, sections were rinsed twice for 3 sec and four times for 10 min with ice-cold KRBM and dipped briefly into ice-cold water. The preparations were then dried in a stream of cold air.
4.4.2. [3H]RX821002 Binding to α2-ARs
For α2-ARs binding, the slides were pre-incubated (15 min/RT) in 50 mM phosphate buffer, pH 7.4. Radioligand binding was performed using the same buffer with [3H]RX821002 (specific activity: 63.8 Ci/mmol; NEN Life Science Products, USA) at a concentration of 0.5 nM and the incubation lasted for 20 min. Non-specific binding was determined in the presence of 5 µM RX 821002 (Sigma Aldrich, USA). Sections were rinsed twice with ice-cold buffer and once with deionized water at 4°C, each lasting 1 min. The preparations were then dried in a stream of cold air.
4.4.3. [3H]CGP121 Binding to β-ARs
For β-ARs binding tissue sections were pre-incubated (15 min/RT) in 50 mM Tris-HCl buffer (pH 7.4) containing 120 mM NaCl and 5 mM KCl. Incubation with the radioligand [3H]CGP12177 (specific activity: 37.7 Ci/mmol; NEN Life Science Products, USA) at a concentration of 4 nM was performed for 60 min. Propranolol (10 µM; Sigma-Aldrich, USA) was used to determine nonspecific labeling. Sections were washed twice for 1 min in 50 mM Tris-HCl buffer (pH 7.4) at 4°C. The sections were then dried in a stream of cool air.
4.4.4. Quantitative Image Analysis of the Autoradiographs
Dried tissue sections were exposed for 10 days to tritium-sensitive screens Fujibas TR2024 (Fujifilm, Tokyo, Japan) along with [3H]microscales (Amersham, USA) as standard. The images, obtained employing a FujiFilm BAS 5000 Phosphorimager, were analyzed using FujiFilm software (Image Gauge, Version 3.0) and quantified by computer-generated curves derived from the standards. The pixels of images from sections showing nonspecific binding were subtracted from those of adjacent sections with total binding. The results are expressed as fmol of bound radioligand per mg protein.
4.5. Measurement of Neurotransmitters and Their Metabolite Levels in Brain Tissue
The hypothalamic tissue level of noradrenaline (NA), dopamine (DA), its two metabolites 3,4-dihydroxyphenylacetic acid (DOPAC), and homovanillic acid (HVA), and serotonin (5-HT), with its metabolite 5-hydroxyindoleacetic acid (5-HIAA) in the hypothalamus were assessed by ultra-high-performance liquid chromatography (UHPLC) with coulochemical detection using previously described method with minor modifications [90,91]. Samples of the hypothalamus dissected from the brain of male mice were homogenized by sonification in 20 volumes (v/w) of ice-cold 0.1 M perchloric acid (HClO4). Homogenates were centrifuged at 15,000 g for 15 min at 4°C. The obtained supernatants transferred to new Eppendorf tubes were centrifuged at 15,000 g for 5 min at 4°C and were filtered through a 0.2-μm membrane filter. The final samples were stored at 80℃ until further analysis. Subsequently, 10 μl aliquots were injected into the UHPLC Ultimate 3000 system Dionex (Thermo Scientific, Germering, Germany). The system used consisted of an ECD-3000RS electrochemical detector, 6011RS ultra coulometric analytical cell, WPS-3000RS autosampler, and a Hypersil Gold analytical column 3 µm, 100 x 3 mm (Thermo Scientific, Waltham, MA, USA). Neurotransmitters and their metabolites were eluted using the mobile phase, which included: KH2PO4 (0.1 M), EDTA (0.5 mM), sodium 1-octane sulfonate (80 mg/l), methanol (4%), adjusted to pH = 4.0 with 85% H3PO4, at the flow rate 0.6 ml/min and the column temperature of 300C. The potentials of coulometric cells were: E1= −50 mV, E2= +350 mV [91]. The identification and quantification of the chromatographic peaks were made by comparison with the reference standard peaks: NA, DA, 5-HT, DOPAC, and 5-HIAA (Sigma) at concentrations of 50 ng/ml and HVA (Sigma) at a concentration of 100 ng/ml [90]. The data was analyzed and processed using Chromoleon 7 software (Thermo Scientific, Waltham, MA, USA) [91]. The limit of detection of noradrenaline, dopamine, DOPAC, HVA, and 5-HIAA was 0.5 pg/10 μL, and serotonin was 1 pg/10 μL.
4.6. RNA Isolation and Gene Expression Analysis
Prefrontal cortex brain tissue was stored in RNAlater stabilizing solution (Thermo Scientific, AM7021, Waltham, MA, USA) at -20°C. Tissue was homogenized with TissueLyser II apparatus (Qiagene, Hilden, Germany) in Lysis Buffer provided as part of the RNeasy Mini kit (Qiagene, #74106, Hilden, Germany), which was used to isolate RNA, according to manufacturer’s instructions. Absorbance measurements determined the quantity and quality of RNA at 260/280 nm on NanoPhotometer (Implen, Munchen, Germany).
Reverse transcription was performed with a High Capacity cDNA Reverse Transcription Kit (Thermo Scientific, #4374966, Waltham, MA, USA) utilizing random primers and 1.5µg of RNA per reaction in 15µL volume. Reaction conditions were 25°C for 10min, 37°C for 120 min, and 85°C for 5 min. Gene expression analysis of adrenergic receptors was done by quantitative real-time polymerase chain reaction (qPCR) utilizing SYBR Green chemistry. Reaction was carried in 96 well plates (MicroAmp® Fast Optical 96-Well Reaction Plate, 0.1 mL, Thermo Scientific, #4346907, Waltham, MA, USA). In each well, there was a total of 10µL reaction volume, containing 20ng cDNA template (assuming 1:1 reverse transcription efficiency), 5 µL of RT HS-PCR Mix SYBR A master mix (AA biotechnology, #2017-100A, Gdansk, Poland) and appropriate primers (see Supplementary Table S1). Each reaction was done in triplicate on the QuantStudio 12 Flex (Thermo Scientific, Waltham, MA, USA) in the following conditions: 1 cycle at 50°C for 2 min, one cycle at 95°C for 5 min followed by 40 cycles of: 95°C for 15s, 60°C for 30s, 72°C for 30s each. The threshold value (Ct) was automatically determined by QuantStudio Felx software, and expression levels were calculated using the standard curve method. Phosphoglycerate kinase 1 (PGK1) and hypoxanthine-guanine phosphoribosyltransferase (HPRT) were reference genes.
4.7. Gene Expression Profiling
Gene expression analysis was performed in the hippocampus of male control (WT), A-KO, B-KO, and D-KO mice aged approx. 12 weeks. Brain structures were dissected and preserved immediately in stabilization reagent RNAlater (ThermoFisher Scientific, MA, USA). Total RNA was isolated using the RNeasy Mini Kit (Qiagen, Hilden, Germany) strictly per the manufacturer’s protocol. RNA integrity from all samples was spectrophotometrically assessed following quality control performed with Bioanalyzer 2100 (Agilent Technologies, CA, USA). Only the samples fulfilling the best quality criteria based on RIN number values (RIN > 8.0) were qualified for microarrays. RNA was reverse transcribed, and cDNA representing a single animal was hybridized to a GeneChip Mouse Genome 430A 2.0 array (Affymetrix) for a total of 14 arrays. Array data analysis was performed as described before [92]. Briefly, raw data were normalized and expression values were computed using affy and gcrma packages from R/Bioconductor [93]. Statistical analysis was performed vs the control untreated group (control_veh) separately for drug and mutation effect to dissect the effects of the evaluated pharmaceuticals (MIL, DMI) or the effects of the mutation (α1-AR subtype deletion) itself. Ontology analyses were carried out using Gene Set Enrichment Analysis (GSEA) [45] and the Panther Classification System [46]. MultiExperiment Viewer (MeV ver. 4.81 for Mac OS) was utilized to identify patterns of gene expression and data visualization (heat maps presented in the paper). The raw microarray data are stored in the GEO database (https://www.ncbi.nlm.nih.gov/geo/query/acc.cgi?acc=GSE272818).
4.8. Western Blot Analyses of Protein Levels
Protein extraction, sample denaturation, and western blot procedure were based on the protocol described elsewhere [94]. Briefly, radioimmunoprecipitation assay (RIPA) buffer (MilliporeSigma, Burlington, MA, USA) was served for total protein extraction. Equal amounts of protein extracts were boiled in Laemmli buffer containing 1% 2-mercaptoethanol for 5 min. Denatured samples were run on SDS-PAGE gels and then transferred to nitrocellulose membranes. Membranes were then blocked with 5% nonfat dry milk in Tris-buffered saline with 0.1% Tween-20 (TBST; pH = 7.6) for 1 h at room temperature and incubated with specific primary antibodies. After overnight incubation at 4°C with primary antibodies and three washes with blocking solution, the membranes were incubated with appropriate secondary antibodies for 1 h at room temperature, followed by three washes with TBST. Antibody binding was detected using a Clarity Western ECL Substrate (Bio-Rad, Hercules, California, USA). Equal loading proteins were further confirmed by probing with anti-calnexin antiserum (1:1000; ADI-SPA-865-F, Enzo Life Sciences, Farmingdale, NY, USA). The following antibodies were used in the experiment: pERK1/2 (1:2000, cat. sc-7383, Santa Cruz Biotechnology, Dallas, TX, USA); ERK1/2 (1:2000, cat. sc-93, Santa Cruz Biotechnology, Dallas, TX, USA); p(S473)Akt (1:2500, cat.4060, Cell Signaling Technology, Danvers, MA, USA); Akt (1:3000, cat. 9272, Cell Signaling Technology, Danvers, MA, USA); p(S21/9)GSK-3α/β (1:1000, cat. 9331, Cell Signaling Technology, Danvers, MA, USA); GSK-3α/β (1:1000, cat. 5676, Cell Signaling Technology, Danvers, MA, USA). All western blot analyses were performed at least twice to confirm the results. The chemiluminescence of specific signals was visualized with the PXi4 (Syngene, Cambridge, UK), and the immunoreactive bands were quantified by an image analyzer (MultiGauge V3.0, Fujifilm, Tokyo, Japan). Original blot images for results presented in the manuscript are shown in Supplementary Figure S2.
5. Conclusions
The results of this study demonstrated at different molecular levels that the inactivation of the α1D-AR subtype in mice modulates the effects of chronic treatments with DMI or MIL in a sex-dependent manner. Together with the possible mutual compensation of α1D—and α1A-AR, these findings highlight the functional diversity between α1-AR subtypes in antidepressants’ drug action and their potential implications for developing sex-specific antidepressant therapies.
Supplementary Materials
The following supporting information can be downloaded at the website of this paper posted on Preprints.org. Figure S1: These brain areas were considered in the autoradiographic analyses of the adrenergic receptors’ density; Figure S2: Original Blot Images for results presented in the manuscript; Table S1: The sequences of primers used in the qRT-PCR procedure.
Author Contributions
Conceptualization, I.N., G.K., A.Z-M, P.C.; methodology, K.C., P.C., K.M., J.K., A.Z-M., G.K., A.H.; formal analysis, I.N., M.W., W.A.D.; investigation, K.C., G.K., J.K., K.M., A.Z.-M., M.K., P.C., A.H.; data curation, K.C., G.K., P.C., A.Z-M., M.K., I.N.; writing—original draft preparation, I.N. and K.C.; writing—review and editing, I.N. and W.A.D.; visualization, K.C., P.C., M.W., G.K., A.Z.-M.; supervision, I.N.; project administration, I.N. and M.K.; funding acquisition, I.N. All authors have read and agreed to the published version of the manuscript.
Funding
This research was financially supported by the National Science Centre, Poland, grant number 2015/17/B/NZ7/03018 (assigned to I.N.) and by statutory funds from the Maj Institute of Pharmacology, Polish Academy of Sciences, Kraków, Poland.
Institutional Review Board Statement
All procedures used in this study were conducted in compliance with the rules and principles of the 86/609/EEC Directive and were approved by the Local Bioethical Committee for Animal Experiments at the Maj Institute of Pharmacology of Polish Academy of Sciences, Krakow, Poland (Permit Number: 1233/2015). The GMO animal colony was maintained with the permission of the Polish Ministry of Environment (Permit Numbers: 59/2013, 161/2018).
Informed Consent Statement
Not applicable.
Data Availability Statement
The data are contained within the article and the supplementary materials. The raw microarray data are stored in the GEO database (https://www.ncbi.nlm.nih.gov/geo/query/acc.cgi?acc=GSE272818).
Acknowledgments
We thank Prof. John C. (Ian) McGrath and Prof. Craig J. Daly from the University of Glasgow, GB, for their generous gift of the triple α1ABD-AR knockout mice (ABD-KO). The Authors also thank Ms. Monika Bagińska for her excellent technical assistance with mice breeding and genotyping. Dr. Katarzyna Chorązka acknowledges the fellowship with the project POWR.03.02.00-00-I013/16. The graphical abstract was created with BioRender. Nalepa, I. (2024) BioRender.com/j55p125
Conflicts of Interest
The authors declare no conflict of interest. The funders had no role in the study’s design, data collection, analysis, interpretation, manuscript writing, or decision to publish the results.
Abbreviations
The following abbreviations are used in this manuscript:
| α1-AR | α1-adrenergic receptors |
| Akt | Akt kinase, also known as protein kinase B (PKB) |
| CAM | constitutively active mutant |
| DA | dopamine |
| DAG | diacylglycerol |
| DMI | desipramine |
| DOPAC | 3,4-dihydroxyphenylacetic acid |
| ERK1/2 | extracellular signal-regulated kinases 1/2 |
| GPCR | G-protein-coupled receptor |
| GSK3β | Glycogen synthase kinase-3 beta |
| 5-HIAA | 5-hydroxy indole acetic acid |
| HIP | hippocampus |
| HPA | hypothalamic-pituitary-adrenal axis |
| HPRT | hypoxanthine-guanine phosphoribosyltransferase |
| 5-HT | serotonin |
| HVA | homovanillic acid |
| HY | hypothalamus |
| LTP | long-term potentiation |
| MDPI | Multidisciplinary Digital Publishing Institute |
| MIL | milnacipran |
| MSA | multiple system atrophy |
| NA | noradrenaline |
| NRI | norepinephrine reuptake inhibitor |
| PFC | prefrontal cortex |
| PGK1 | phosphoglycerate kinase 1 |
| PI3K | phosphatidylinositol 3-kinase |
| PKC | protein kinase C |
| PLC | phospholipase Cβ |
| SNRI | serotonin and norepinephrine reuptake inhibitors |
| TCA | tricyclic antidepressants |
| UHPLC | ultra-high-performance liquid chromatography |
| WT | wild-type |
References
- Aston-Jones, G.; Rajkowski, J.; Cohen, J. Role of Locus Coeruleus in Attention and Behavioral Flexibility. Biological Psychiatry 1999, 46, 1309–1320. [Google Scholar] [CrossRef] [PubMed]
- Berridge, C.W.; Waterhouse, B.D. The Locus Coeruleus–Noradrenergic System: Modulation of Behavioral State and State-Dependent Cognitive Processes. Brain Research Reviews 2003, 42, 33–84. [Google Scholar] [CrossRef]
- Breton-Provencher, V.; Drummond, G.T.; Sur, M. Locus Coeruleus Norepinephrine in Learned Behavior: Anatomical Modularity and Spatiotemporal Integration in Targets. Front. Neural Circuits 2021, 15, 638007. [Google Scholar] [CrossRef] [PubMed]
- Alexander, S.P.H.; Benson, H.E.; Faccenda, E.; Pawson, A.J.; Sharman, J.L.; McGrath, J.C.; Catterall, W.A.; Spedding, M.; Peters, J.A.; Harmar, A.J.; et al. The Concise Guide to PHARMACOLOGY 2013/14: Overview. British J Pharmacology 2013, 170, 1449–1458. [Google Scholar] [CrossRef] [PubMed]
- Alexander, S.P.H.; Benson, H.E.; Faccenda, E.; Pawson, A.J.; Sharman, J.L.; Spedding, M.; Peters, J.A.; Harmar, A.J. CGTP Collaborators The Concise Guide to PHARMACOLOGY 2013/14: G Protein-Coupled Receptors. British J Pharmacology 2013, 170, 1459–1581. [Google Scholar] [CrossRef]
- Hieble, J.P.; Bylund, D.B.; Clarke, D.E.; Eikenburg, D.C.; Langer, S.Z.; Lefkowitz, R.J.; Minneman, K.P.; Ruffolo, R.R. International Union of Pharmacology. X. Recommendation for Nomenclature of Alpha 1-Adrenoceptors: Consensus Update. Pharmacol Rev 1995, 47, 267–270. [Google Scholar] [CrossRef]
- Akinaga, J.; García-Sáinz, J.A.; Pupo, A.S. Updates in the Function and Regulation of α 1 -adrenoceptors. British J Pharmacology 2019, 176, 2343–2357. [Google Scholar] [CrossRef]
- Nalepa, I.; Kreiner, G.; Bielawski, A.; Rafa-Zabłocka, K.; Roman, A. α1-Adrenergic Receptor Subtypes in the Central Nervous System: Insights from Genetically Engineered Mouse Models. Pharmacological Reports 2013, 65, 1489–1497. [Google Scholar] [CrossRef]
- Perez, D.M. α1-Adrenergic Receptors in Neurotransmission, Synaptic Plasticity, and Cognition. Front. Pharmacol. 2020, 11, 581098. [Google Scholar] [CrossRef]
- Akinaga, J.; Lima, V.; Kiguti, L.R.D.A.; Hebeler-Barbosa, F.; Alcántara-Hernández, R.; García-Sáinz, J.A.; Pupo, A.S. Differential Phosphorylation, Desensitization, and Internalization of α 1A−Adrenoceptors Activated by Norepinephrine and Oxymetazoline. Mol Pharmacol 2013, 83, 870–881. [Google Scholar] [CrossRef]
- Alcántara-Hernández, R.; Hernández-Méndez, A.; Romero-Ávila, M.T.; Alfonzo-Méndez, M.A.; Pupo, A.S.; García-Sáinz, J.A. Noradrenaline, Oxymetazoline and Phorbol Myristate Acetate Induce Distinct Functional Actions and Phosphorylation Patterns of α1A-Adrenergic Receptors. Biochimica et Biophysica Acta (BBA) - Molecular Cell Research 2017, 1864, 2378–2388. [Google Scholar] [CrossRef] [PubMed]
- Chalothorn, D.; McCune, D.F.; Edelmann, S.E.; Garcı́a-Cazarı́n, M.L.; Tsujimoto, G.; Piascik, M.T. Differences in the Cellular Localization and Agonist-Mediated Internalization Properties of the α 1 -Adrenoceptor Subtypes. Mol Pharmacol 2002, 61, 1008–1016. [Google Scholar] [CrossRef] [PubMed]
- Cotecchia, S. The α 1 -Adrenergic Receptors: Diversity of Signaling Networks and Regulation. Journal of Receptors and Signal Transduction 2010, 30, 410–419. [Google Scholar] [CrossRef] [PubMed]
- Garcı́a-Sáinz, J.A.; Vázquez-Prado, J.; Del Carmen Medina, L. α1-Adrenoceptors: Function and Phosphorylation. European Journal of Pharmacology 2000, 389, 1–12. [Google Scholar] [CrossRef]
- García-Sáinz, J.A.; Vázquez-Cuevas, F.G.; Romero-Ávila, M.T. Phosphorylation and Desensitization of α1d-Adrenergic Receptors. Biochemical Journal 2001, 353, 603–610. [Google Scholar] [CrossRef]
- Perez-Aso, M.; Segura, V.; Montó, F.; Barettino, D.; Noguera, M.A.; Milligan, G.; D’Ocon, P. The Three α1-Adrenoceptor Subtypes Show Different Spatio-Temporal Mechanisms of Internalization and ERK1/2 Phosphorylation. Biochimica et Biophysica Acta (BBA) - Molecular Cell Research 2013, 1833, 2322–2333. [Google Scholar] [CrossRef]
- Segura, V.; Pérez-Aso, M.; Montó, F.; Carceller, E.; Noguera, M.A.; Pediani, J.; Milligan, G.; McGrath, I.C.; D’Ocon, P. Differences in the Signaling Pathways of α1A- and α1B-Adrenoceptors Are Related to Different Endosomal Targeting. PLoS ONE 2013, 8, e64996. [Google Scholar] [CrossRef]
- Cotecchia, S.; Del Vescovo, C.D.; Colella, M.; Caso, S.; Diviani, D. The Alpha1-Adrenergic Receptors in Cardiac Hypertrophy: Signaling Mechanisms and Functional Implications. Cellular Signalling 2015, 27, 1984–1993. [Google Scholar] [CrossRef]
- Docherty, J.R. Subtypes of Functional α1-Adrenoceptor. Cell. Mol. Life Sci. 2010, 67, 405–417. [Google Scholar] [CrossRef]
- McGrath, J.C. Localization of α-adrenoceptors: JR V Ane M Edal L Ecture. British J Pharmacology 2015, 172, 1179–1194. [Google Scholar] [CrossRef]
- Perez, D.M. Current Developments on the Role of α1-Adrenergic Receptors in Cognition, Cardioprotection, and Metabolism. Front. Cell Dev. Biol. 2021, 9, 652152. [Google Scholar] [CrossRef] [PubMed]
- Sanbe, A.; Tanaka, Y.; Fujiwara, Y.; Tsumura, H.; Yamauchi, J.; Cotecchia, S.; Koike, K.; Tsujimoto, G.; Tanoue, A. α1-Adrenoceptors Are Required for Normal Male Sexual Function. British Journal of Pharmacology 2007. [Google Scholar] [CrossRef]
- Unnerstall, J.R.; Fernandez, I.; Orensanz, L.M. The Alpha-Adrenergic Receptor: Radiohistochemical Analysis of Functional Characteristics and Biochemical Differences. Pharmacology Biochemistry and Behavior 1985, 22, 859–874. [Google Scholar] [CrossRef]
- Papay, R.; Gaivin, R.; McCune, D.F.; Rorabaugh, B.R.; Macklin, W.B.; McGrath, J.C.; Perez, D.M. Mouse α1B -adrenergic Receptor Is Expressed in Neurons and NG2 Oligodendrocytes. J of Comparative Neurology 2004, 478, 1–10. [Google Scholar] [CrossRef]
- Papay, R.; Gaivin, R.; Jha, A.; Mccune, D.F.; Mcgrath, J.C.; Rodrigo, M.C.; Simpson, P.C.; Doze, V.A.; Perez, D.M. Localization of the Mouse α1A-Adrenergic Receptor (AR) in the Brain: α1A-AR Is Expressed in Neurons, GABAergic Interneurons, and NG2 Oligodendrocyte Progenitors. Journal of Comparative Neurology 2006, 497, 209–222. [Google Scholar] [CrossRef]
- Sadalge, A.; Coughlin, L.; Fu, H.; Wang, B.; Valladares, O.; Valentino, R.; Blendy, J.A. α1d Adrenoceptor Signaling Is Required for Stimulus Induced Locomotor Activity. Mol Psychiatry 2003, 8, 664–672. [Google Scholar] [CrossRef]
- Nalepa, I.; Sulser, F. New Hypotheses to Guide Future Antidepressant Drug Development. In Antidepressants: Past, Present and Future; Preskorn, S.H., Feighner, J.P., Stanga, C.Y., Ross, R., Eds.; Handbook of Experimental Pharmacology; Springer Berlin Heidelberg: Berlin, Heidelberg, 2004; ISBN 978-3-642-62135-2. [Google Scholar]
- Vetulani, J.; Nalepa, I. Antidepressants: Past, Present and Future. European Journal of Pharmacology 2000, 405, 351–363. [Google Scholar] [CrossRef]
- Nalepa, I.; Kreiner, G.; Kowalska, M.; Sanak, M.; Zelek-Molik, A.; Vetulani, J. Repeated Imipramine and Electroconvulsive Shock Increase α1A-Adrenoceptor mRNA Level in Rat Prefrontal Cortex. European Journal of Pharmacology 2002, 444, 151–159. [Google Scholar] [CrossRef]
- Duman, R.S.; Aghajanian, G.K.; Sanacora, G.; Krystal, J.H. Synaptic Plasticity and Depression: New Insights from Stress and Rapid-Acting Antidepressants. Nat Med 2016, 22, 238–249. [Google Scholar] [CrossRef]
- Duric, V.; Duman, R.S. Depression and Treatment Response: Dynamic Interplay of Signaling Pathways and Altered Neural Processes. Cell. Mol. Life Sci. 2013, 70, 39–53. [Google Scholar] [CrossRef]
- Roskoski, R. ERK1/2 MAP Kinases: Structure, Function, and Regulation. Pharmacological Research 2012, 66, 105–143. [Google Scholar] [CrossRef] [PubMed]
- Dwivedi, Y.; Rizavi, H.S.; Roberts, R.C.; Conley, R.C.; Tamminga, C.A.; Pandey, G.N. Reduced Activation and Expression of ERK1/2 MAP Kinase in the Post-mortem Brain of Depressed Suicide Subjects. Journal of Neurochemistry 2001, 77, 916–928. [Google Scholar] [CrossRef] [PubMed]
- Zalewska, T.; Bielawski, A.; Stanaszek, L.; Wieczerzak, K.; Ziemka-Nałęcz, M.; Nalepa, I. Imipramine Administration Induces Changes in the Phosphorylation of FAK and PYK2 and Modulates Signaling Pathways Related to Their Activity. Biochimica et Biophysica Acta - General Subjects 2016, 1860, 424–433. [Google Scholar] [CrossRef] [PubMed]
- Jope, R.; Roh, M.-S. Glycogen Synthase Kinase-3 (GSK3) in Psychiatric Diseases and Therapeutic Interventions. CDT 2006, 7, 1421–1434. [Google Scholar] [CrossRef]
- Alcántara Hernández, R.; García-Sáinz, J.A. Roles of Phosphoinositide-Dependent Kinase-1 in α1B-Adrenoceptor Phosphorylation and Desensitization. European Journal of Pharmacology 2012, 674, 179–187. [Google Scholar] [CrossRef]
- Alcántara-Hernández, R.; Carmona-Rosas, G.; Hernández-Espinosa, D.A.; García-Sáinz, J.A. Glycogen Synthase Kinase-3 Modulates α1A-Adrenergic Receptor Action and Regulation. European Journal of Cell Biology 2020, 99, 151072. [Google Scholar] [CrossRef]
- Ballou, L.M.; Cross, M.E.; Huang, S.; McReynolds, E.M.; Zhang, B.-X.; Lin, R.Z. Differential Regulation of the Phosphatidylinositol 3-Kinase/Akt and P70 S6 Kinase Pathways by the α1A-Adrenergic Receptor in Rat-1 Fibroblasts. Journal of Biological Chemistry 2000, 275, 4803–4809. [Google Scholar] [CrossRef]
- Ballou, L.M.; Lin, H.-Y.; Fan, G.; Jiang, Y.-P.; Lin, R.Z. Activated Gαq Inhibits P110α Phosphatidylinositol 3-Kinase and Akt. Journal of Biological Chemistry 2003, 278, 23472–23479. [Google Scholar] [CrossRef]
- Coccurello, R.; Bielawski, A.; Zelek-Molik, A.; Vetulani, J.; Kowalska, M.; D’Amato, F.R.; Nalepa, I. Brief Maternal Separation Affects Brain α1-Adrenoceptors and Apoptotic Signaling in Adult Mice. Progress in Neuro-Psychopharmacology and Biological Psychiatry 2014, 48, 161–169. [Google Scholar] [CrossRef]
- Nalepa, I.; Vetulani, J.; Borghi, V.; Kowalska, M.; Przewłocka, B.; Pavone, F. Formalin Hindpaw Injection Induces Changes in the [3H]Prazosin Binding to α1-Adrenoceptors in Specific Regions of the Mouse Brain and Spinal Cord. J Neural Transm 2005, 112, 1309–1319. [Google Scholar] [CrossRef]
- Nalepa, I.; Witarski, T.; Kowalska, M.; Vetulani, J. Effect of Cocaine Sensitization on α1-Adrenoceptors in Brain Regions of the Rat: An Autoradiographic Analysis. Pharmacological Reports 2006, 58, 827. [Google Scholar] [PubMed]
- Sanders, J.D.; Szot, P.; Weinshenker, D.; Happe, H.K.; Bylund, D.B.; Murrin, L.C. Analysis of Brain Adrenergic Receptors in Dopamine-β-Hydroxylase Knockout Mice. Brain Research 2006, 1109, 45–53. [Google Scholar] [CrossRef] [PubMed]
- Dziedzicka-Wasylewska, M.; Faron-Górecka, A.; Kuśmider, M.; Drozdowska, E.; Rogóż, Z.; Siwanowicz, J.; Caron, M.G.; Bönisch, H. Effect of Antidepressant Drugs in Mice Lacking the Norepinephrine Transporter. Neuropsychopharmacol 2006, 31, 2424–2432. [Google Scholar] [CrossRef] [PubMed]
- Subramanian, A.; Tamayo, P.; Mootha, V.K.; Mukherjee, S.; Ebert, B.L.; Gillette, M.A.; Paulovich, A.; Pomeroy, S.L.; Golub, T.R.; Lander, E.S.; et al. Gene Set Enrichment Analysis: A Knowledge-Based Approach for Interpreting Genome-Wide Expression Profiles. Proc. Natl. Acad. Sci. U.S.A. 2005, 102, 15545–15550. [Google Scholar] [CrossRef]
- Mi, H.; Muruganujan, A.; Thomas, P.D. PANTHER in 2013: Modeling the Evolution of Gene Function, and Other Gene Attributes, in the Context of Phylogenetic Trees. Nucleic Acids Research 2012, 41, D377–D386. [Google Scholar] [CrossRef]
- España, R.A.; Schmeichel, B.E.; Berridge, C.W. Norepinephrine at the Nexus of Arousal, Motivation and Relapse. Brain Research 2016, 1641, 207–216. [Google Scholar] [CrossRef]
- Doze, V.A.; Handel, E.M.; Jensen, K.A.; Darsie, B.; Luger, E.J.; Haselton, J.R.; Talbot, J.N.; Rorabaugh, B.R. α1A- and α1B-Adrenergic Receptors Differentially Modulate Antidepressant-like Behavior in the Mouse. Brain Research 2009, 1285, 148–157. [Google Scholar] [CrossRef]
- Doze, V.A.; Papay, R.S.; Goldenstein, B.L.; Gupta, M.K.; Collette, K.M.; Nelson, B.W.; Lyons, M.J.; Davis, B.A.; Luger, E.J.; Wood, S.G.; et al. Long-Term α 1A -Adrenergic Receptor Stimulation Improves Synaptic Plasticity, Cognitive Function, Mood, and Longevity. Mol Pharmacol 2011, 80, 747–758. [Google Scholar] [CrossRef]
- Zuscik, M.J.; Sands, S.; Ross, S.A.; Waugh, D.J.J.; Gaivin, R.J.; Morilak, D.; Perez, D.M. Overexpression of the α1B-Adrenergic Receptor Causes Apoptotic Neurodegeneration: Multiple System Atrophy. Nat Med 2000, 6, 1388–1394. [Google Scholar] [CrossRef]
- Mishima, K.; Tanoue, A.; Tsuda, M.; Hasebe, N.; Fukue, Y.; Egashira, N.; Takano, Y.; Kamiya, H.; Tsujimoto, G.; Iwasaki, K.; et al. Characteristics of Behavioral Abnormalities in α1d-Adrenoceptors Deficient Mice. Behavioural Brain Research 2004, 152, 365–373. [Google Scholar] [CrossRef]
- García-Sáinz, J.A.; Romero-Ávila, M.T.; Medina, L.D.C. α1D-Adrenergic Receptors. In Methods in Enzymology; Elsevier, 2010; Vol. 484, pp. 109–125 ISBN 978-0-12-381298-8.
- Konstandi, M.; Johnson, E.; Lang, M.A.; Malamas, M.; Marselos, M. NORADRENALINE, DOPAMINE, SEROTONIN: DIFFERENT EFFECTS OF PSYCHOLOGICAL STRESS ON BRAIN BIOGENIC AMINES IN MICE AND RATS. Pharmacological Research 2000, 41, 341–346. [Google Scholar] [CrossRef] [PubMed]
- Gillman, P.K. Tricyclic Antidepressant Pharmacology and Therapeutic Drug Interactions Updated. British J Pharmacology 2007, 151, 737–748. [Google Scholar] [CrossRef]
- Puozzo, C.; Panconi, E.; Deprez, D. Pharmacology and Pharmacokinetics of Milnacipran. International Clinical Psychopharmacology 2002, 17, S25–S35. [Google Scholar] [CrossRef]
- Chmielarz, P.; Kuśmierczyk, J.; Rafa-Zabłocka, K.; Chorązka, K.; Kowalska, M.; Satała, G.; Nalepa, I. Antidepressants Differentially Regulate Intracellular Signaling from α1-Adrenergic Receptor Subtypes in Vitro. International Journal of Molecular Sciences 2021, 22, 5–8. [Google Scholar] [CrossRef]
- Jana, A.; Hogan, E.L.; Pahan, K. Ceramide and Neurodegeneration: Susceptibility of Neurons and Oligodendrocytes to Cell Damage and Death. Journal of the Neurological Sciences 2009, 278, 5–15. [Google Scholar] [CrossRef]
- Gulbins, E.; Palmada, M.; Reichel, M.; Lüth, A.; Böhmer, C.; Amato, D.; Müller, C.P.; Tischbirek, C.H.; Groemer, T.W.; Tabatabai, G.; et al. Acid Sphingomyelinase–Ceramide System Mediates Effects of Antidepressant Drugs. Nat Med 2013, 19, 934–938. [Google Scholar] [CrossRef]
- Kornhuber, J.; Müller, C.P.; Becker, K.A.; Reichel, M.; Gulbins, E. The Ceramide System as a Novel Antidepressant Target. Trends in Pharmacological Sciences 2014, 35, 293–304. [Google Scholar] [CrossRef]
- Gulbins, E.; Walter, S.; Becker, K.A.; Halmer, R.; Liu, Y.; Reichel, M.; Edwards, M.J.; Müller, C.P.; Fassbender, K.; Kornhuber, J. A Central Role for the Acid Sphingomyelinase/Ceramide System in Neurogenesis and Major Depression. Journal of Neurochemistry 2015, 134, 183–192. [Google Scholar] [CrossRef]
- Dinoff, A.; Herrmann, N.; Lanctôt, K.L. Ceramides and Depression: A Systematic Review. Journal of Affective Disorders 2017, 213, 35–43. [Google Scholar] [CrossRef]
- Schumacher, F.; Edwards, M.J.; Mühle, C.; Carpinteiro, A.; Wilson, G.C.; Wilker, B.; Soddemann, M.; Keitsch, S.; Scherbaum, N.; Müller, B.W.; et al. Ceramide Levels in Blood Plasma Correlate with Major Depressive Disorder Severity and Its Neutralization Abrogates Depressive Behavior in Mice. Journal of Biological Chemistry 2022, 298, 102185. [Google Scholar] [CrossRef]
- Duda, P.; Hajka, D.; Wójcicka, O.; Rakus, D.; Gizak, A. GSK3β: A Master Player in Depressive Disorder Pathogenesis and Treatment Responsiveness. Cells 2020, 9, 727. [Google Scholar] [CrossRef] [PubMed]
- Silva, R.; Mesquita, A.R.; Bessa, J.; Sousa, J.C.; Sotiropoulos, I.; Leão, P.; Almeida, O.F.X.; Sousa, N. Lithium Blocks Stress-Induced Changes in Depressive-like Behavior and Hippocampal Cell Fate: The Role of Glycogen-Synthase-Kinase-3β. Neuroscience 2008, 152, 656–669. [Google Scholar] [CrossRef] [PubMed]
- Okamoto, H.; Voleti, B.; Banasr, M.; Sarhan, M.; Duric, V.; Girgenti, M.J.; DiLeone, R.J.; Newton, S.S.; Duman, R.S. Wnt2 Expression and Signaling Is Increased by Different Classes of Antidepressant Treatments. Biological Psychiatry 2010, 68, 521–527. [Google Scholar] [CrossRef] [PubMed]
- Beurel, E.; Song, L.; Jope, R.S. Inhibition of Glycogen Synthase Kinase-3 Is Necessary for the Rapid Antidepressant Effect of Ketamine in Mice. Mol Psychiatry 2011, 16, 1068–1070. [Google Scholar] [CrossRef]
- Pardo, M.; Abrial, E.; Jope, R.S.; Beurel, E. GSK3β Isoform-selective Regulation of Depression, Memory and Hippocampal Cell Proliferation. Genes Brain and Behavior 2016, 15, 348–355. [Google Scholar] [CrossRef]
- Omata, N.; Chiu, C.-T.; Moya, P.R.; Leng, Y.; Wang, Z.; Hunsberger, J.G.; Leeds, P.; Chuang, D.-M. Lentivirally Mediated GSK-3β Silencing in the Hippocampal Dentate Gyrus Induces Antidepressant-like Effects in Stressed Mice. International Journal of Neuropsychopharmacology 2011, 14, 711–717. [Google Scholar] [CrossRef]
- Marsden, W.N. Synaptic Plasticity in Depression: Molecular, Cellular and Functional Correlates. Progress in Neuro-Psychopharmacology and Biological Psychiatry 2013, 43, 168–184. [Google Scholar] [CrossRef]
- Ballou, L.M.; Tian, P.-Y.; Lin, H.-Y.; Jiang, Y.-P.; Lin, R.Z. Dual Regulation of Glycogen Synthase Kinase-3β by the α1A-Adrenergic Receptor. Journal of Biological Chemistry 2001, 276, 40910–40916. [Google Scholar] [CrossRef]
- LeGates, T.A.; Kvarta, M.D.; Thompson, S.M. Sex Differences in Antidepressant Efficacy. Neuropsychopharmacol 2019, 44, 140–154. [Google Scholar] [CrossRef]
- Kokras, N.; Hodes, G.E.; Bangasser, D.A.; Dalla, C. Sex Differences in the Hypothalamic–Pituitary–Adrenal Axis: An Obstacle to Antidepressant Drug Development? British J Pharmacology 2019, 176, 4090–4106. [Google Scholar] [CrossRef]
- Bangasser, D.A.; Cuarenta, A. Sex Differences in Anxiety and Depression: Circuits and Mechanisms. Nat Rev Neurosci 2021, 22, 674–684. [Google Scholar] [CrossRef] [PubMed]
- Sramek, J.J.; Murphy, M.F.; Cutler, N.R. Sex Differences in the Psychopharmacological Treatment of Depression. Dialogues in Clinical Neuroscience 2016, 18, 447–457. [Google Scholar] [CrossRef] [PubMed]
- Pavlidi, P.; Kokras, N.; Dalla, C. Sex Differences in Depression and Anxiety. In Sex Differences in Brain Function and Dysfunction; Gibson, C., Galea, L.A.M., Eds.; Current Topics in Behavioral Neurosciences; Springer International Publishing: Cham, 2022; ISBN 978-3-031-26722-2. [Google Scholar]
- Simpson, J.; Ryan, C.; Curley, A.; Mulcaire, J.; Kelly, J.P. Sex Differences in Baseline and Drug-Induced Behavioural Responses in Classical Behavioural Tests. Progress in Neuro-Psychopharmacology and Biological Psychiatry 2012, 37, 227–236. [Google Scholar] [CrossRef]
- Shah, A.; Frazer, A. Influence of Acute or Chronic Administration of Ovarian Hormones on the Effects of Desipramine in the Forced Swim Test in Female Rats. Psychopharmacology 2014, 231, 3685–3694. [Google Scholar] [CrossRef]
- Ledesma-Corvi, S.; García-Fuster, M.J. Revisiting the Antidepressant-like Effects of Desipramine in Male and Female Adult Rats: Sex Disparities in Neurochemical Correlates. Pharmacol. Rep 2022, 74, 626–636. [Google Scholar] [CrossRef]
- Morishita, S.; Arita, S. Differential Effects of Milnacipran, Fluvoxamine and Paroxetine for Depression, Especially in Gender. Eur. psychiatr. 2003, 18, 418–420. [Google Scholar] [CrossRef]
- Naito, S.; Sato, K.; Yoshida, K.; Higuchi, H.; Takahashi, H.; Kamata, M.; Ito, K.; Ohkubo, T.; Shimizu, T. Gender Differences in the Clinical Effects of Fluvoxamine and Milnacipran in Japanese Major Depressive Patients. Psychiatry Clin Neurosci 2007, 61, 421–427. [Google Scholar] [CrossRef]
- Xing, Y.; He, J.; Hou, J.; Lin, F.; Tian, J.; Kurihara, H. Gender Differences in CMS and the Effects of Antidepressant Venlafaxine in Rats. Neurochemistry International 2013, 63, 570–575. [Google Scholar] [CrossRef]
- Gray, V.C.; Hughes, R.N. Drug-, Dose- and Sex-Dependent Effects of Chronic Fluoxetine, Reboxetine and Venlafaxine on Open-Field Behavior and Spatial Memory in Rats. Behavioural Brain Research 2015, 281, 43–54. [Google Scholar] [CrossRef]
- Xu, Y.; Ma, L.; Jiang, W.; Li, Y.; Wang, G.; Li, R. Study of Sex Differences in Duloxetine Efficacy for Depression in Transgenic Mouse Models. Front. Cell. Neurosci. 2017, 11, 344. [Google Scholar] [CrossRef]
- Mei, X.; Wang, L.; Yang, B.; Li, X. Sex Differences in Noradrenergic Modulation of Attention and Impulsivity in Rats. Psychopharmacology 2021, 238, 2167–2177. [Google Scholar] [CrossRef] [PubMed]
- Rokosh, D.G.; Simpson, P.C. Knockout of the α1A͞C-Adrenergic Receptor Subtype: The α1A͞C Is Expressed in Resistance Arteries and Is Required to Maintain Arterial Blood Pressure. MEDICAL SCIENCES.
- Cavalli, A.; Lattion, A.-L.; Hummler, E.; Nenniger, M.; Pedrazzini, T.; Aubert, J.-F.; Michel, M.C.; Yang, M.; Lembo, G.; Vecchione, C.; et al. Decreased Blood Pressure Response in Mice Deficient of The. Proc. Natl. Acad. Sci. USA 1997, 94, 11589–11594. [Google Scholar] [CrossRef] [PubMed]
- Tanoue, A.; Nasa, Y.; Koshimizu, T.; Shinoura, H.; Oshikawa, S.; Kawai, T.; Sunada, S.; Takeo, S.; Tsujimoto, G. The α1D-Adrenergic Receptor Directly Regulates Arterial Blood Pressure via Vasoconstriction. J. Clin. Invest. 2002, 109, 765–775. [Google Scholar] [CrossRef]
- Rafa–Zabłocka, K.; Kreiner, G.; Bagińska, M.; Kuśmierczyk, J.; Parlato, R.; Nalepa, I. Transgenic Mice Lacking CREB and CREM in Noradrenergic and Serotonergic Neurons Respond Differently to Common Antidepressants on Tail Suspension Test. Sci Rep 2017, 7, 13515. [Google Scholar] [CrossRef]
- Paxinos, G.; Franklin, K.B.J. The Mouse Brain in Stereotaxic Coordinates; Academic Press, 2001; ISBN 978-0-12-547636-2.
- Haduch, A.; Bromek, E.; Wojcikowski, J.; Gołembiowska, K.; Daniel, W.A. Melatonin Supports CYP2D-Mediated Serotonin Synthesis in the Brain. Drug Metabolism and Disposition 2016, 44, 445–452. [Google Scholar] [CrossRef]
- Haduch, A.; Danek, P.J.; Kuban, W.; Pukło, R.; Alenina, N.; Gołębiowska, J.; Popik, P.; Bader, M.; Daniel, W.A. Cytochrome P450 2D (CYP2D) Enzyme Dysfunction Associated with Aging and Serotonin Deficiency in the Brain and Liver of Female Dark Agouti Rats. Neurochemistry International 2022, 152, 105223. [Google Scholar] [CrossRef]
- Kreiner, G.; Bierhoff, H.; Armentano, M.; Rodriguez-Parkitna, J.; Sowodniok, K.; Naranjo, J.R.; Bonfanti, L.; Liss, B.; Schütz, G.; Grummt, I.; et al. A Neuroprotective Phase Precedes Striatal Degeneration upon Nucleolar Stress. Cell Death Differ 2013, 20, 1455–1464. [Google Scholar] [CrossRef]
- Gentleman, R.C.; Carey, V.J.; Bates, D.M.; Bolstad, B.; Dettling, M.; Dudoit, S.; Ellis, B.; Gautier, L.; Ge, Y.; Gentry, J.; et al. Bioconductor: Open Software Development for Computational Biology and Bioinformatics. Genome Biology 2004, 5, 1–16. [Google Scholar] [CrossRef]
- Zelek-Molik, A.; Bobula, B.; Gądek-Michalska, A.; Chorązka, K.; Bielawski, A.; Kuśmierczyk, J.; Siwiec, M.; Wilczkowski, M.; Hess, G.; Nalepa, I. Psychosocial Crowding Stress-Induced Changes in Synaptic Transmission and Glutamate Receptor Expression in the Rat Frontal Cortex. Biomolecules 2021, 11, 294. [Google Scholar] [CrossRef]
Figure 1.
The density of α1-adrenergic receptors (α1-AR; [3H]prazosin binding) (A-C), α2-adrenergic receptors (α2-AR; [3H]-RX821002 binding) (D-F), and β-adrenergic receptors (β-AR; [3H]CGP12177 binding) (G-I) in selected brain structures of wild-type (WT) mice and mice with knockout of all three α1-AR subtypes (ABD-KO). Left panels (A, D, and G) – the data represent mean specific signal values (fmol/mg of tissue ± SEM) from n = 9 sections, analyzed using one-way analysis of variance (ANOVA) and post-hoc Fisher’s Least Significant Difference (LSD) test. Light gray bars represent WT mice (littermates group), and dark gray bars represent ABD-KO mutants. Right panels: B-C, E-F, and H-I – examples of autoradiographic images showing the binding of radioligands to α1-AR (B-C), and α2-AR (E-F), and β-AR (H-I) in the brains of wild-type mice (WT) and mice with knockout of all three α1-AR subtypes (ABD-KO). Abbreviations: IL - infralimbic cortex, PrL - prelimbic cortex, Cg - cingulate cortex, M2 - secondary motor cortex, M1 - primary motor cortex, AcbC - accumbens nucleus, core, AcbSh – accumbens nucleus, shell, S1 - primary somatosensory cortex, CPu - caudate putamen (striatum), HIP - hippocampus, RSG - retrosplenial granular cortex, RSA - retrosplenial agranular cortex, CL - centrolateral thalamic nucleus, PC - paracentral thalamic nucleus, MDL - mediodorsal thalamic nucleus, lateral part, MDC – mediodorsal thalamic nucleus, central part, MDM - mediodorsal thalamic nucleus, medial part, IMD - inter mediodorsal thalamic nucleus, CM - central medial thalamic nucleus.
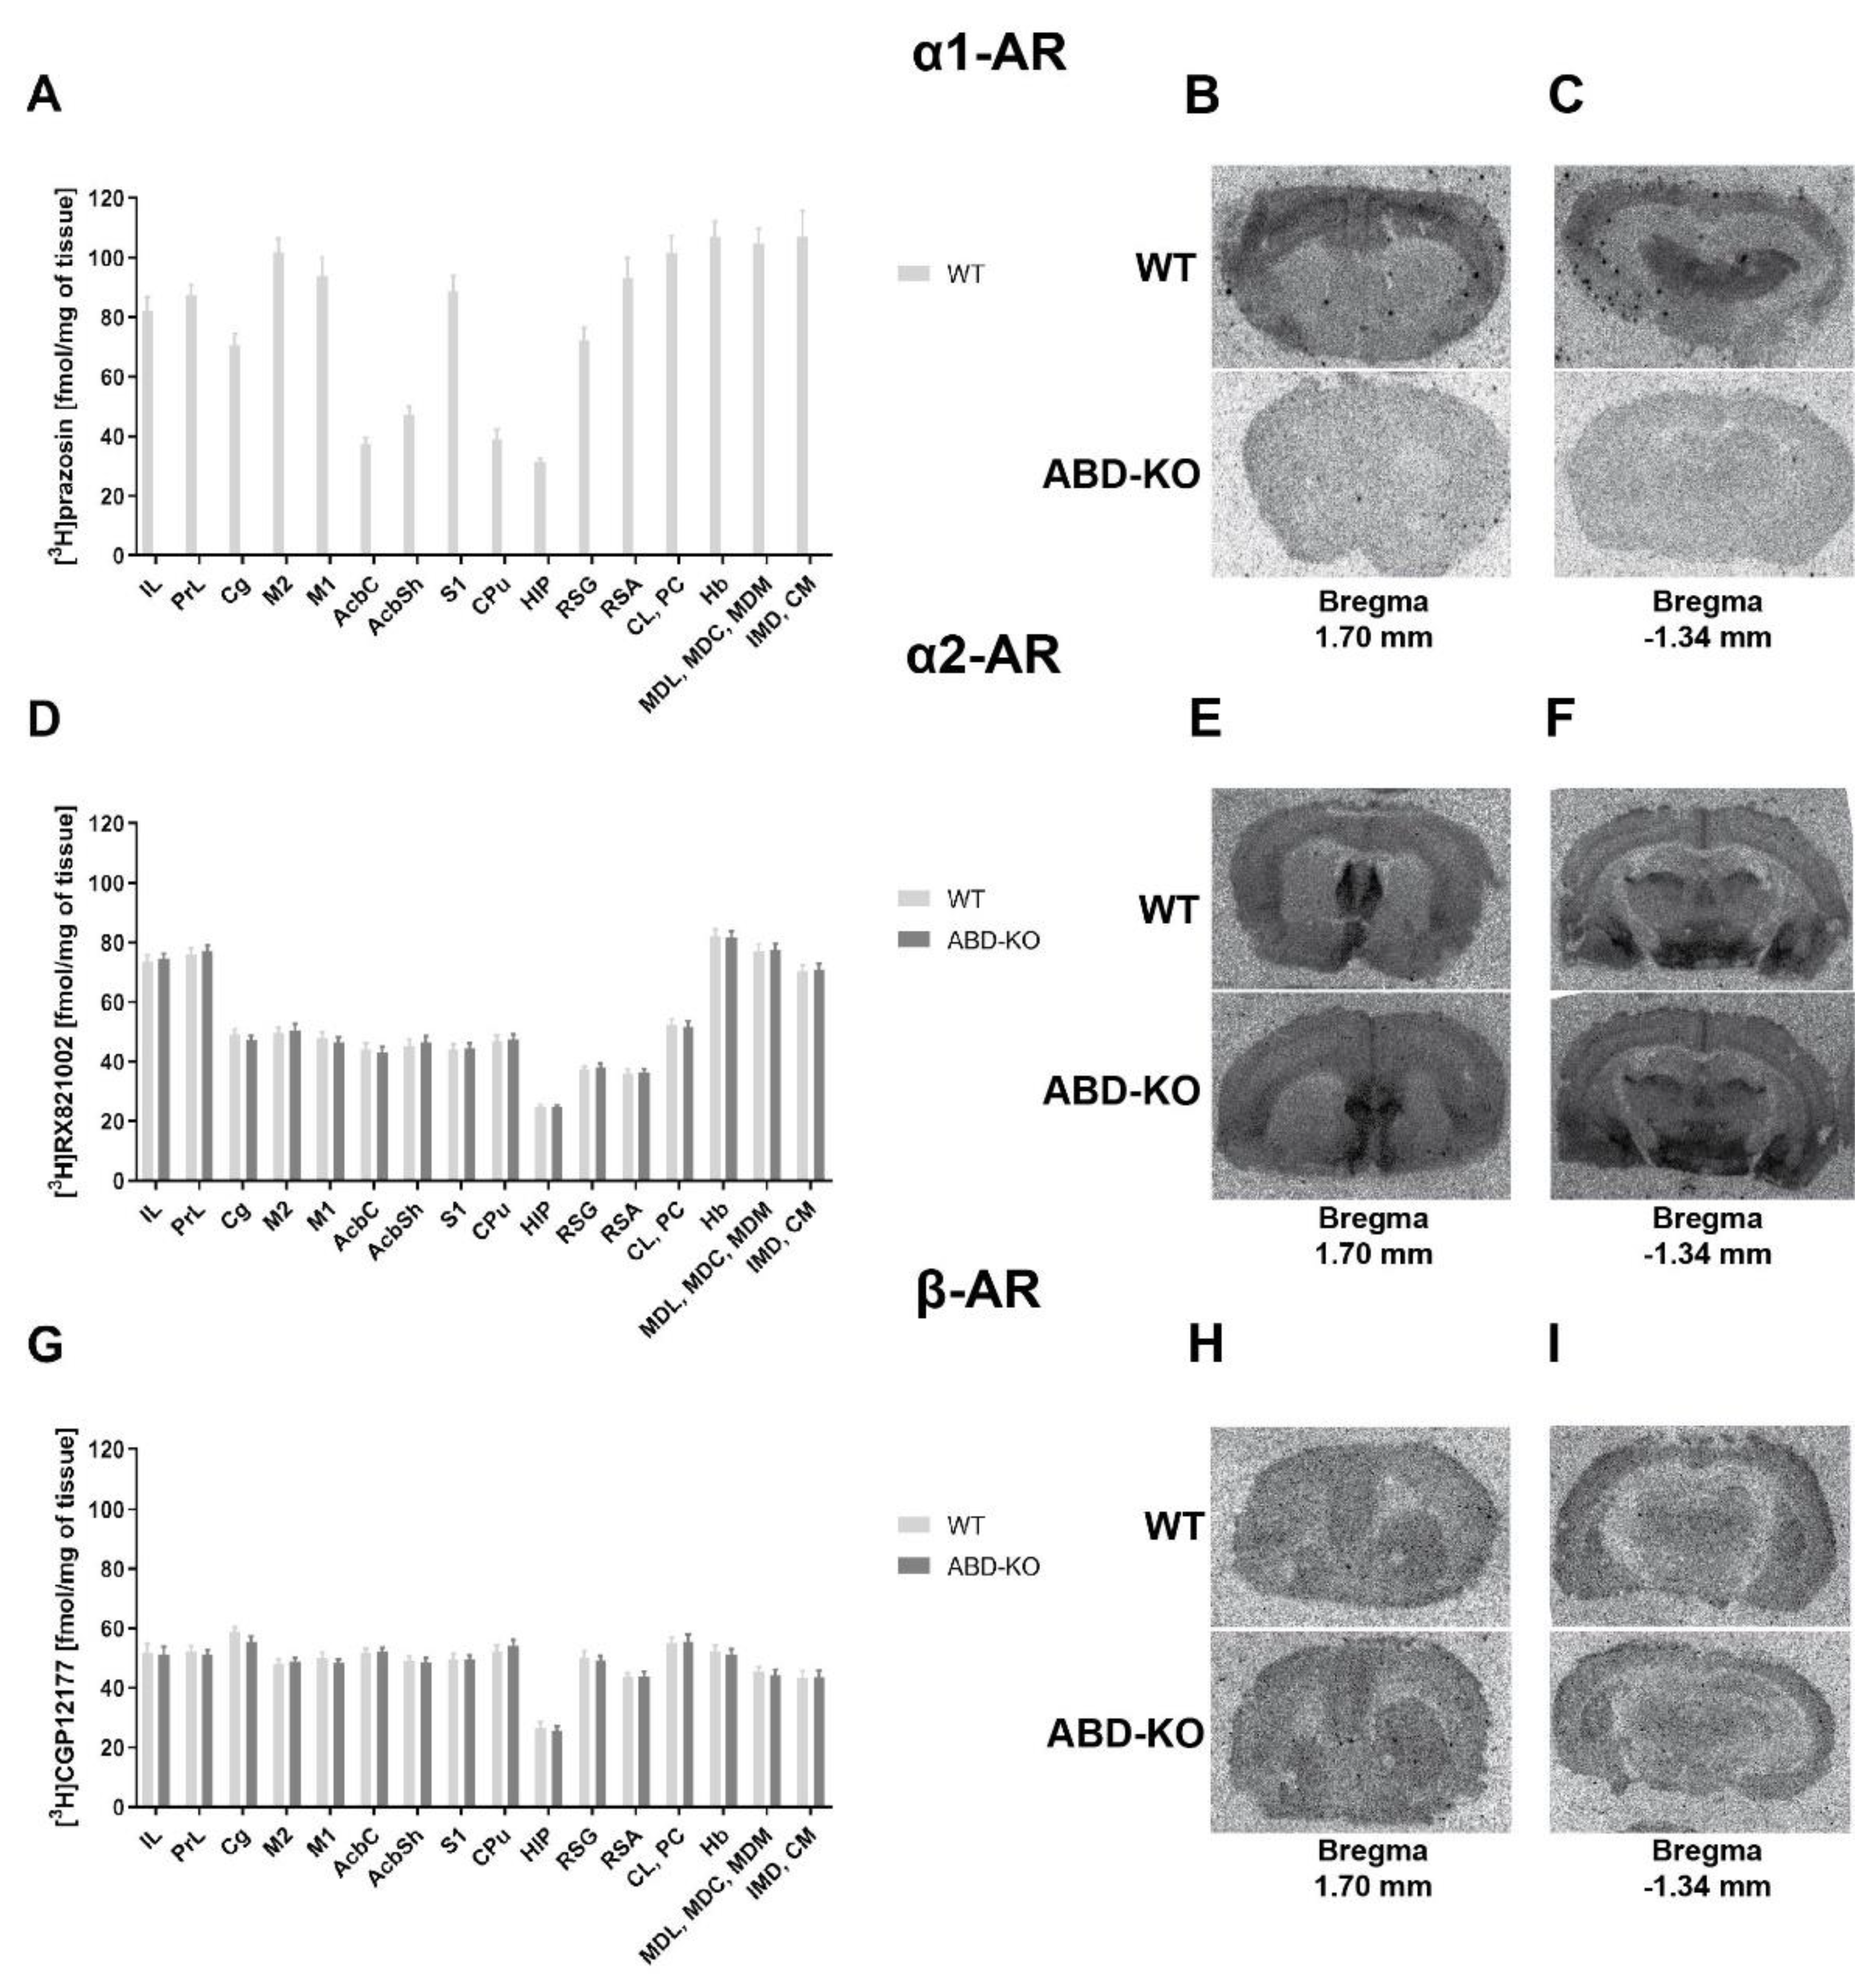
Figure 2.
Levels of noradrenaline (NA) (A), dopamine (DA) (B), serotonin (5-HT) (C), 3,4-dihydroxyphenylacetic acid (DOPAC) (D), homovanillic acid (HVA) (E), and 5-hydroxy indole acetic acid (5-HIAA) (F), as well as turnover of DA (G, H) and 5-HT (I) in the hypothalamus of wild-type (WT) mice and knockout mice with selective inactivation of α1A adrenergic receptor (A-KO), α1B adrenergic receptor (B-KO), or α1D adrenergic receptor (D-KO). Data represent mean values (pg/mg tissue ± SEM) from n = 7-8, analyzed using one-way analysis of variance (ANOVA) and post-hoc Tukey’s test for unequal sample sizes (Unequal N HSD). *p < 0.05, **p < 0.01.
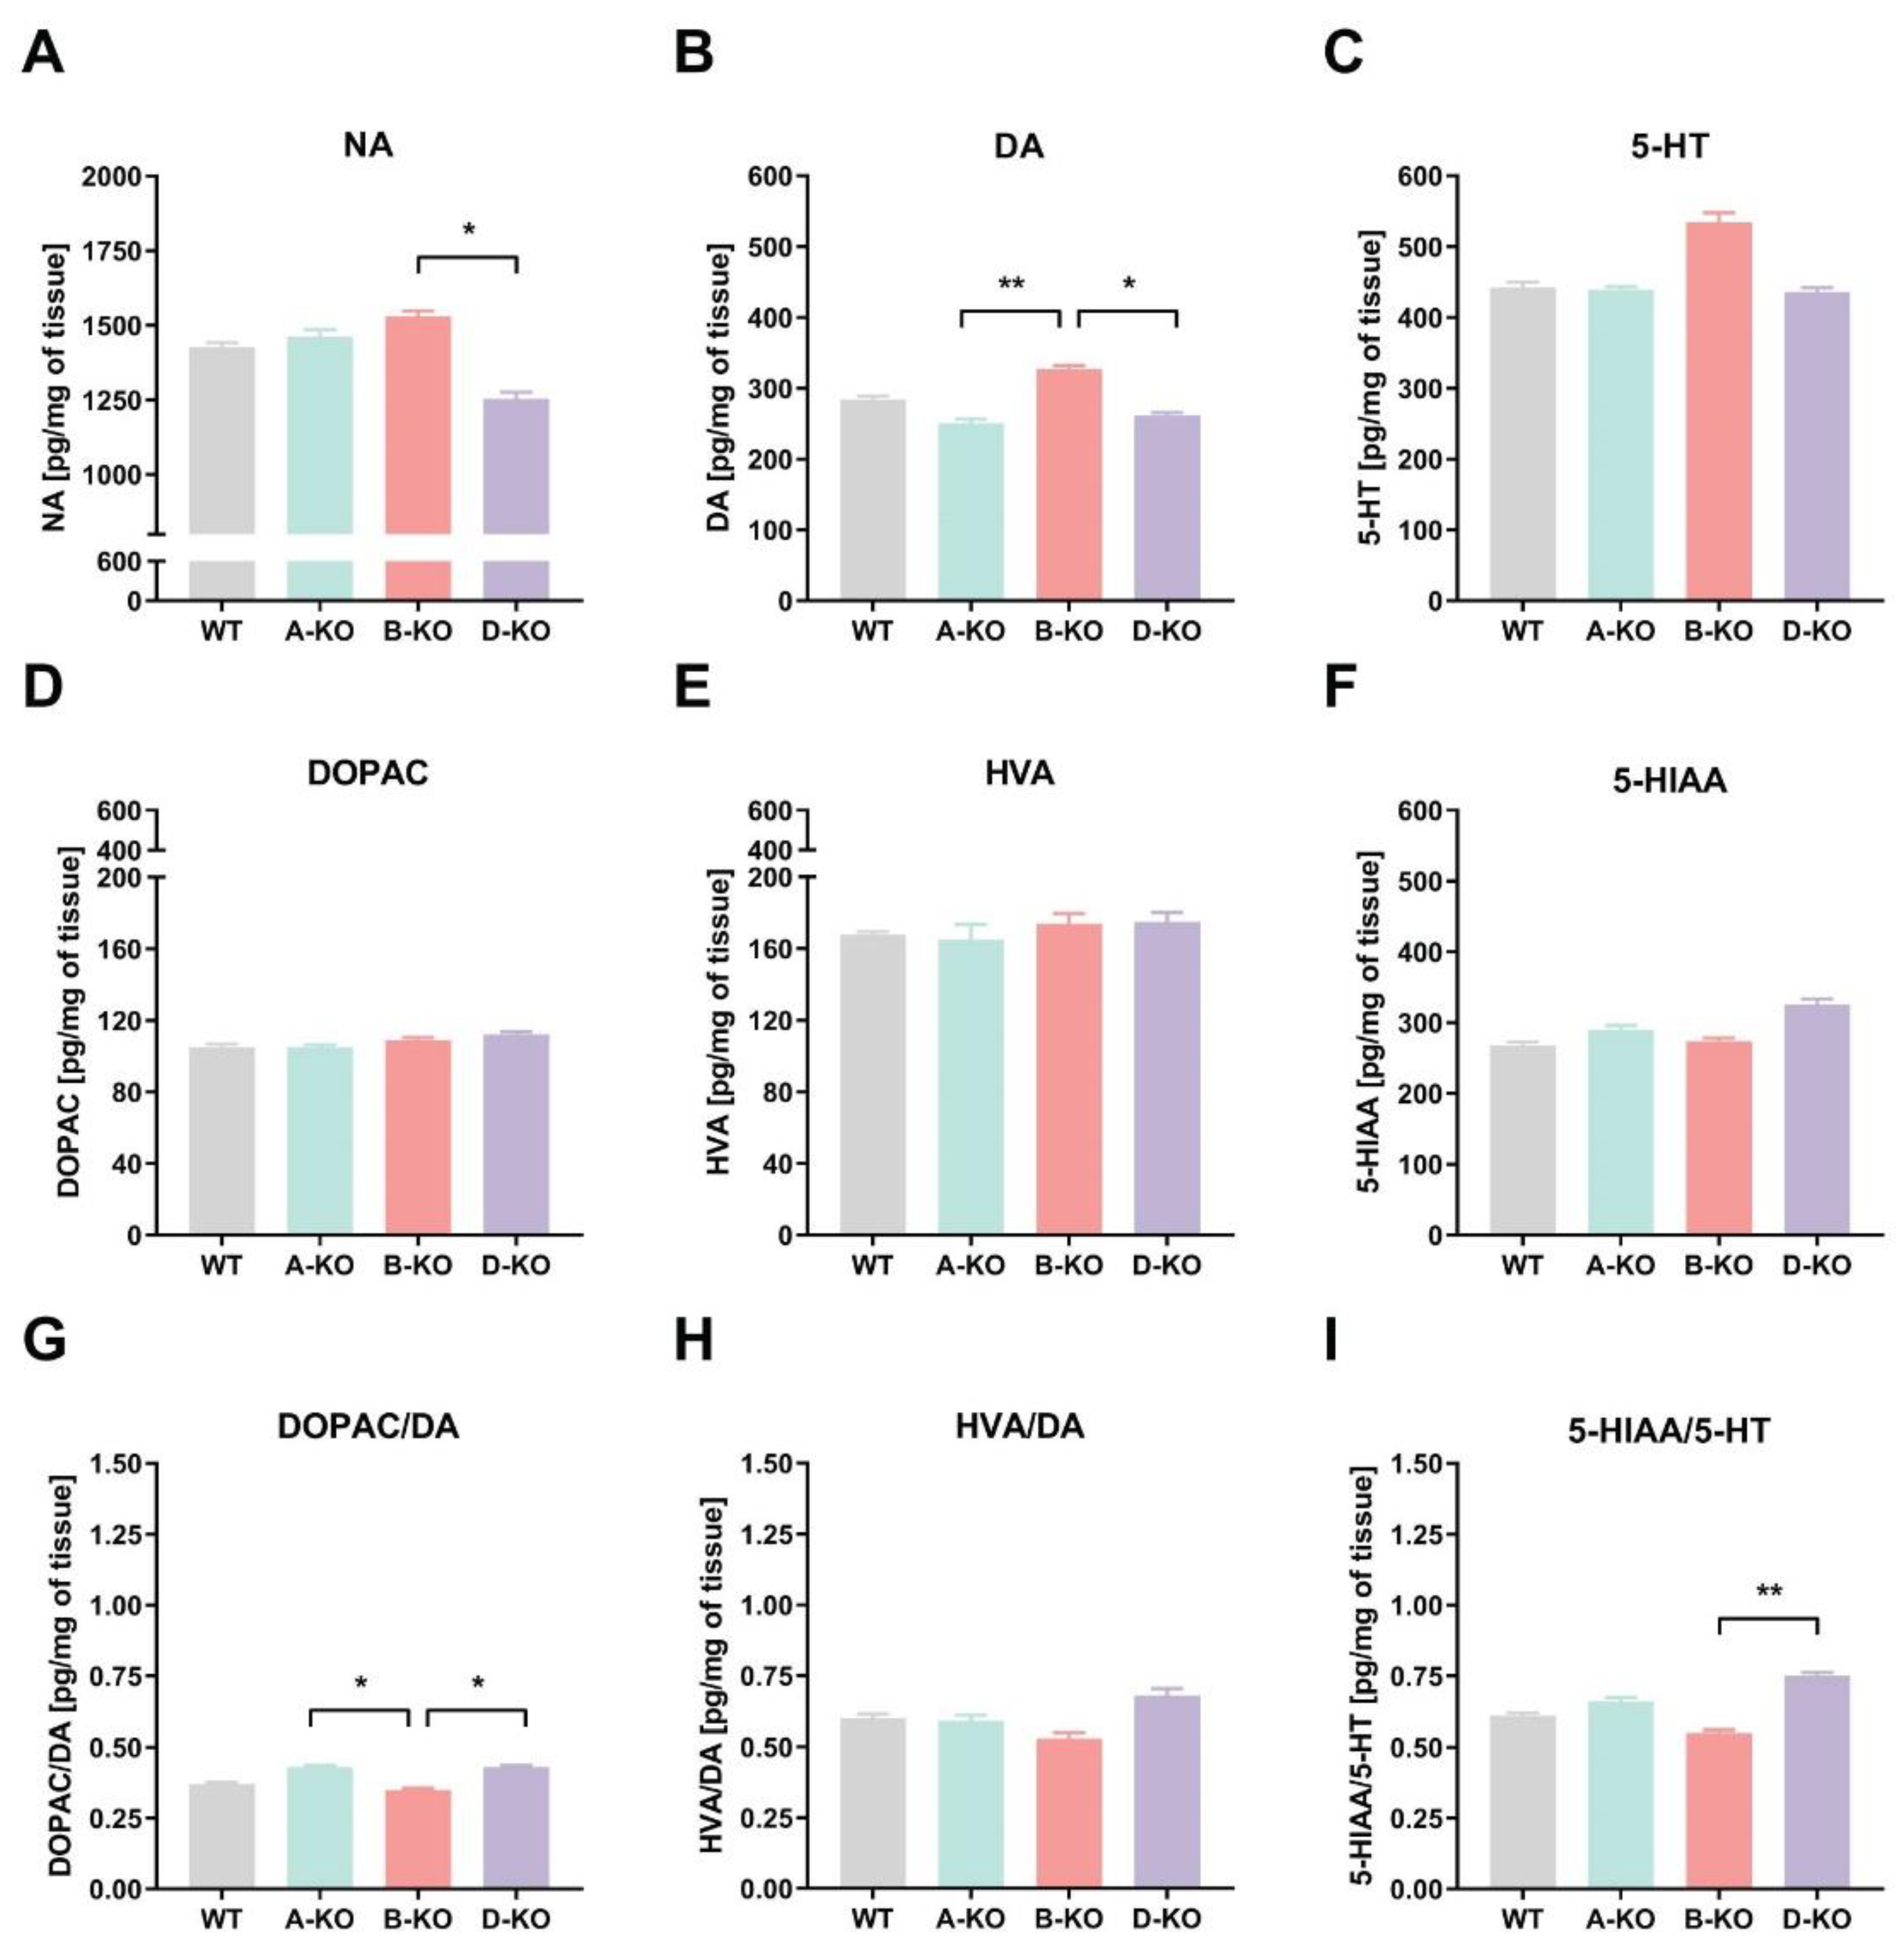
Figure 3.
Levels of mRNA expression of the ADRA1A (A), ADRA1B (B), and ADRA1D (C) genes in the prefrontal cortex of wild-type (WT, grey bars) mice and knockout mice with selective inactivation of α1- adrenergic receptor (A-KO, green bars), α1B-adrenergic receptor (B-KO, red bars), or α1D-adrenergic receptor (D-KO, violet-blue bars), treated with saline (sal), desipramine (DMI), or milnacipran (MIL). Data represent mean values ± SEM from n = 5–23, analyzed using two-way analysis of variance (ANOVA) and post-hoc Fisher’s Least Significant Difference (LSD) test. * p < 0.05, ** p < 0.01, *** p < 0.001.
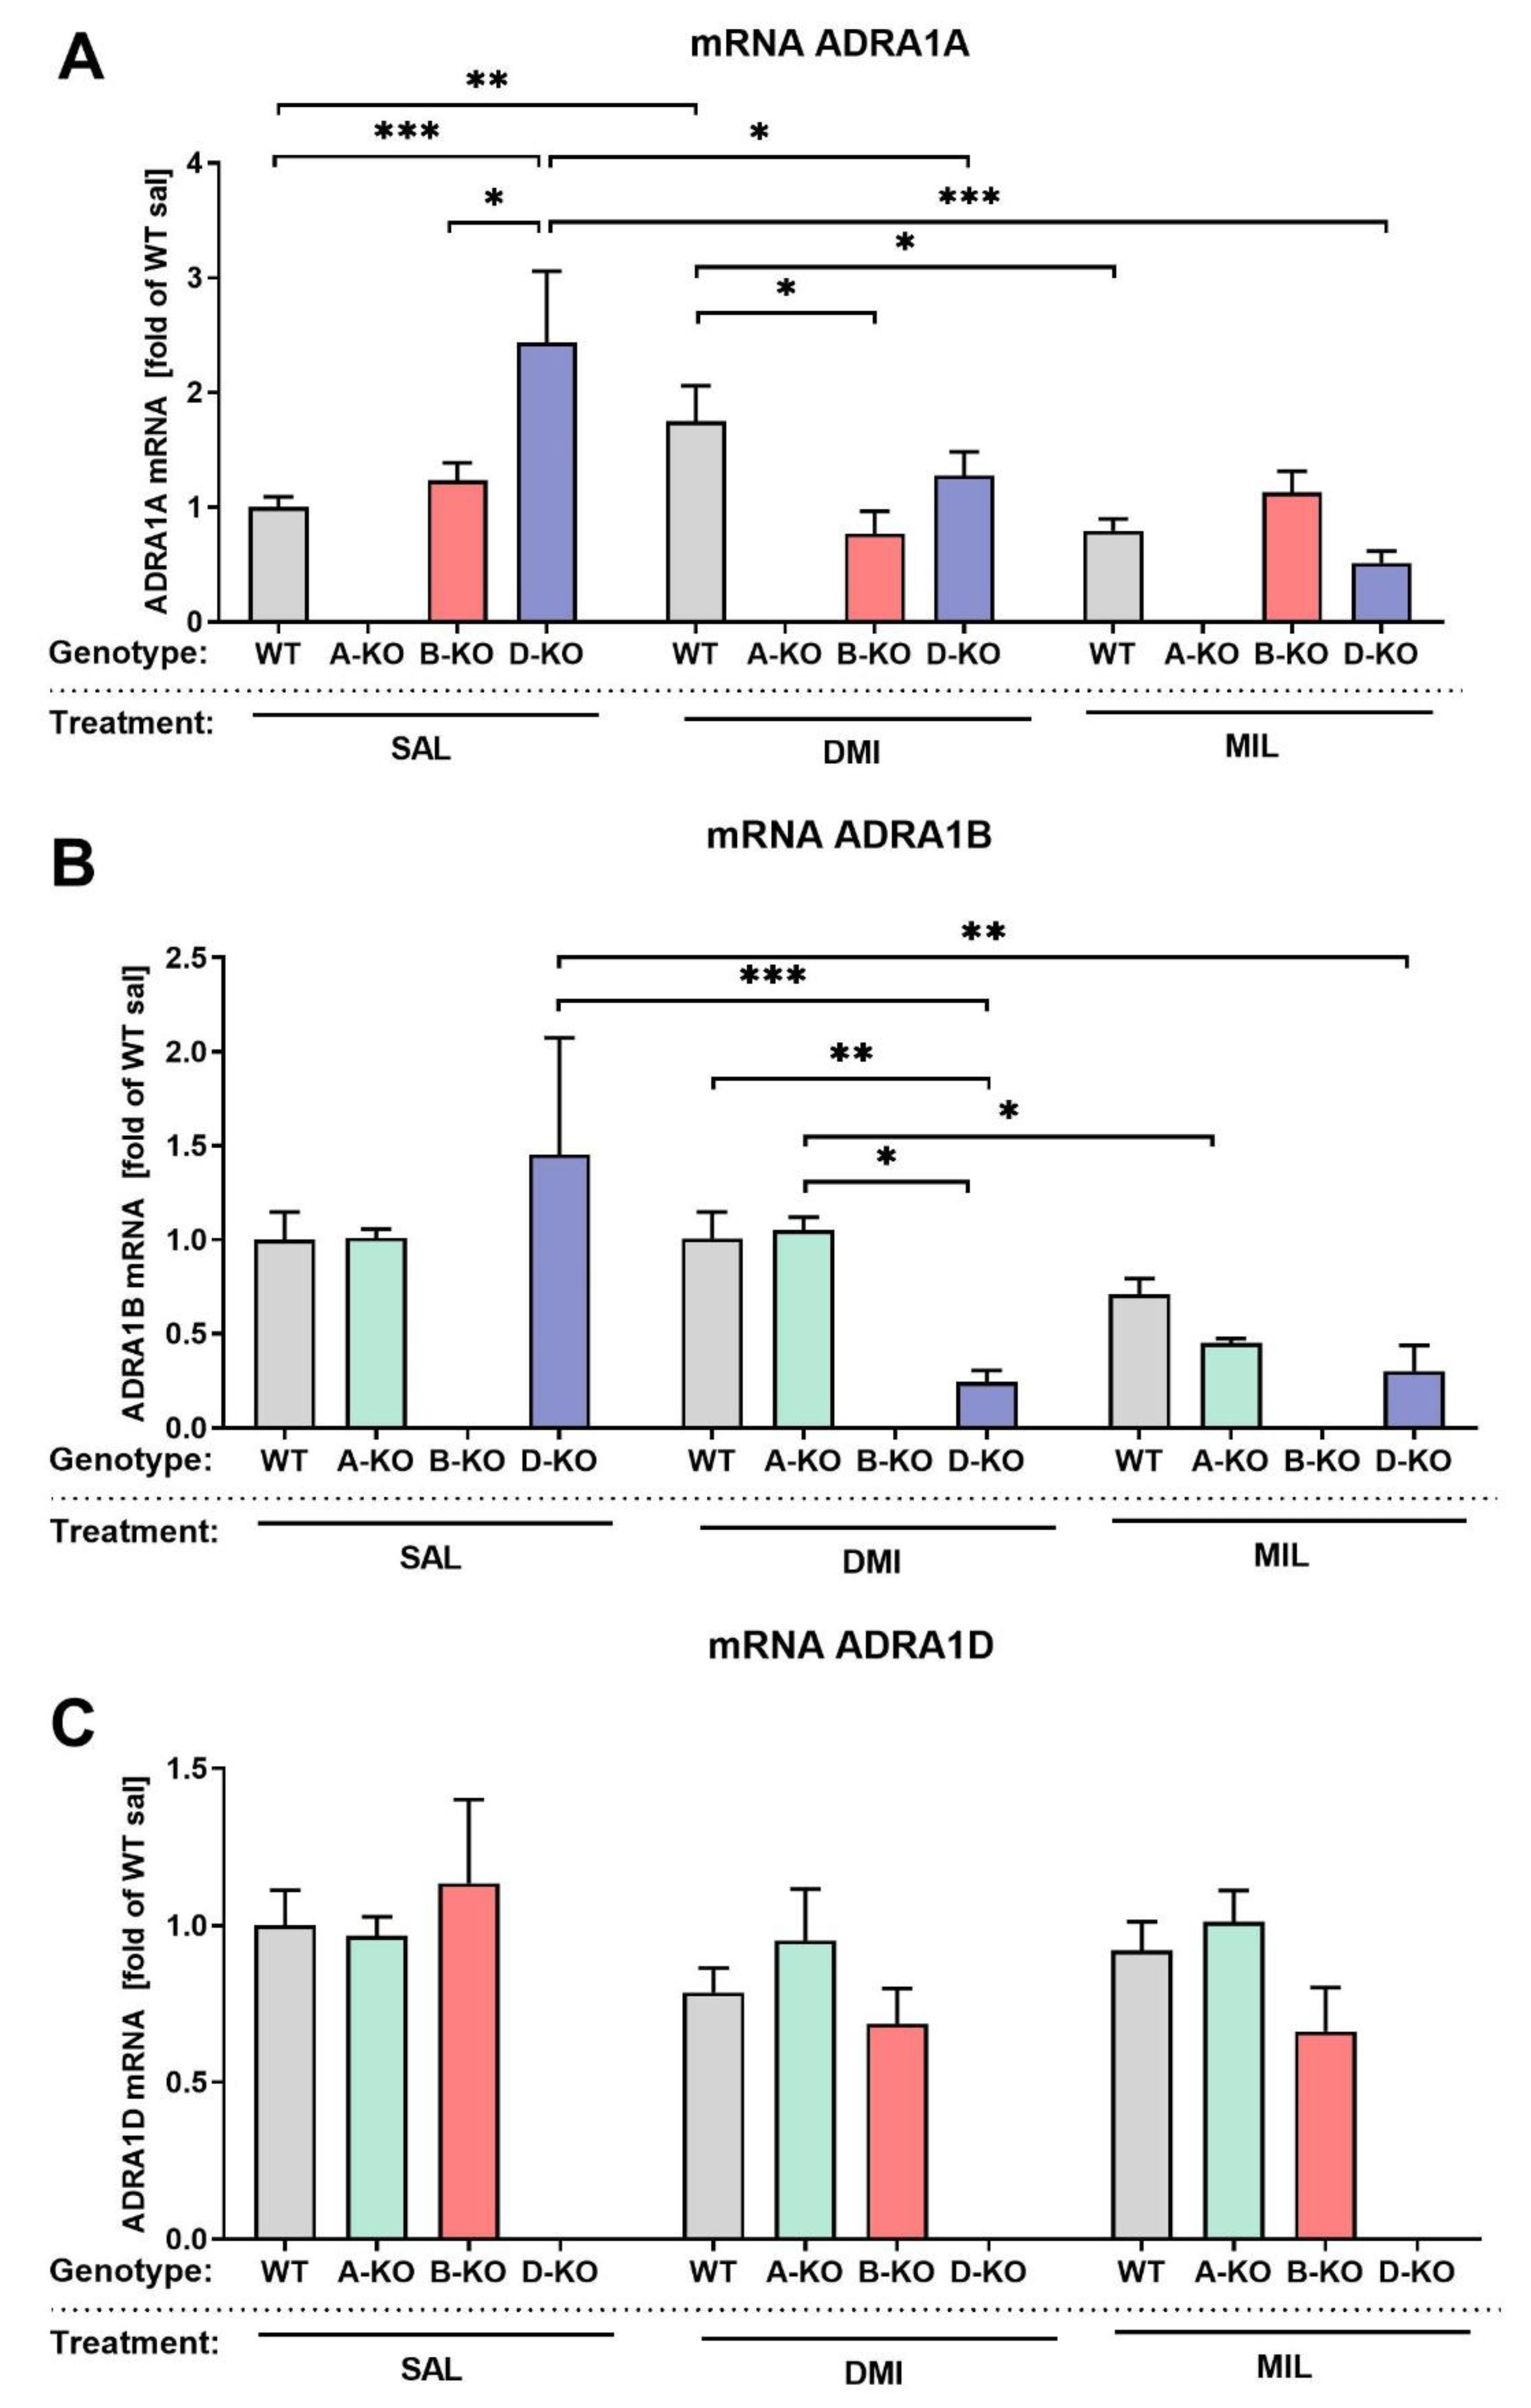
Figure 4.
Heat maps illustrating gene expression patterns in the hippocampus of wild-type (WT) mice and knockout mice with selective inactivation of the α1A (A-KO), α1B (B-KO), or α1D (D-KO) adrenergic receptors (A) alongside WT mice treated with physiological saline (sal), desipramine (DMI), or milnacipran (MIL) (B). The Venn diagrams indicate the number of transcripts whose expression changed significantly based on the mouse genotype (C) or the administered antidepressant drug (D). The significance threshold was established at p < 0.05 and fold change > 1.5 (log2).
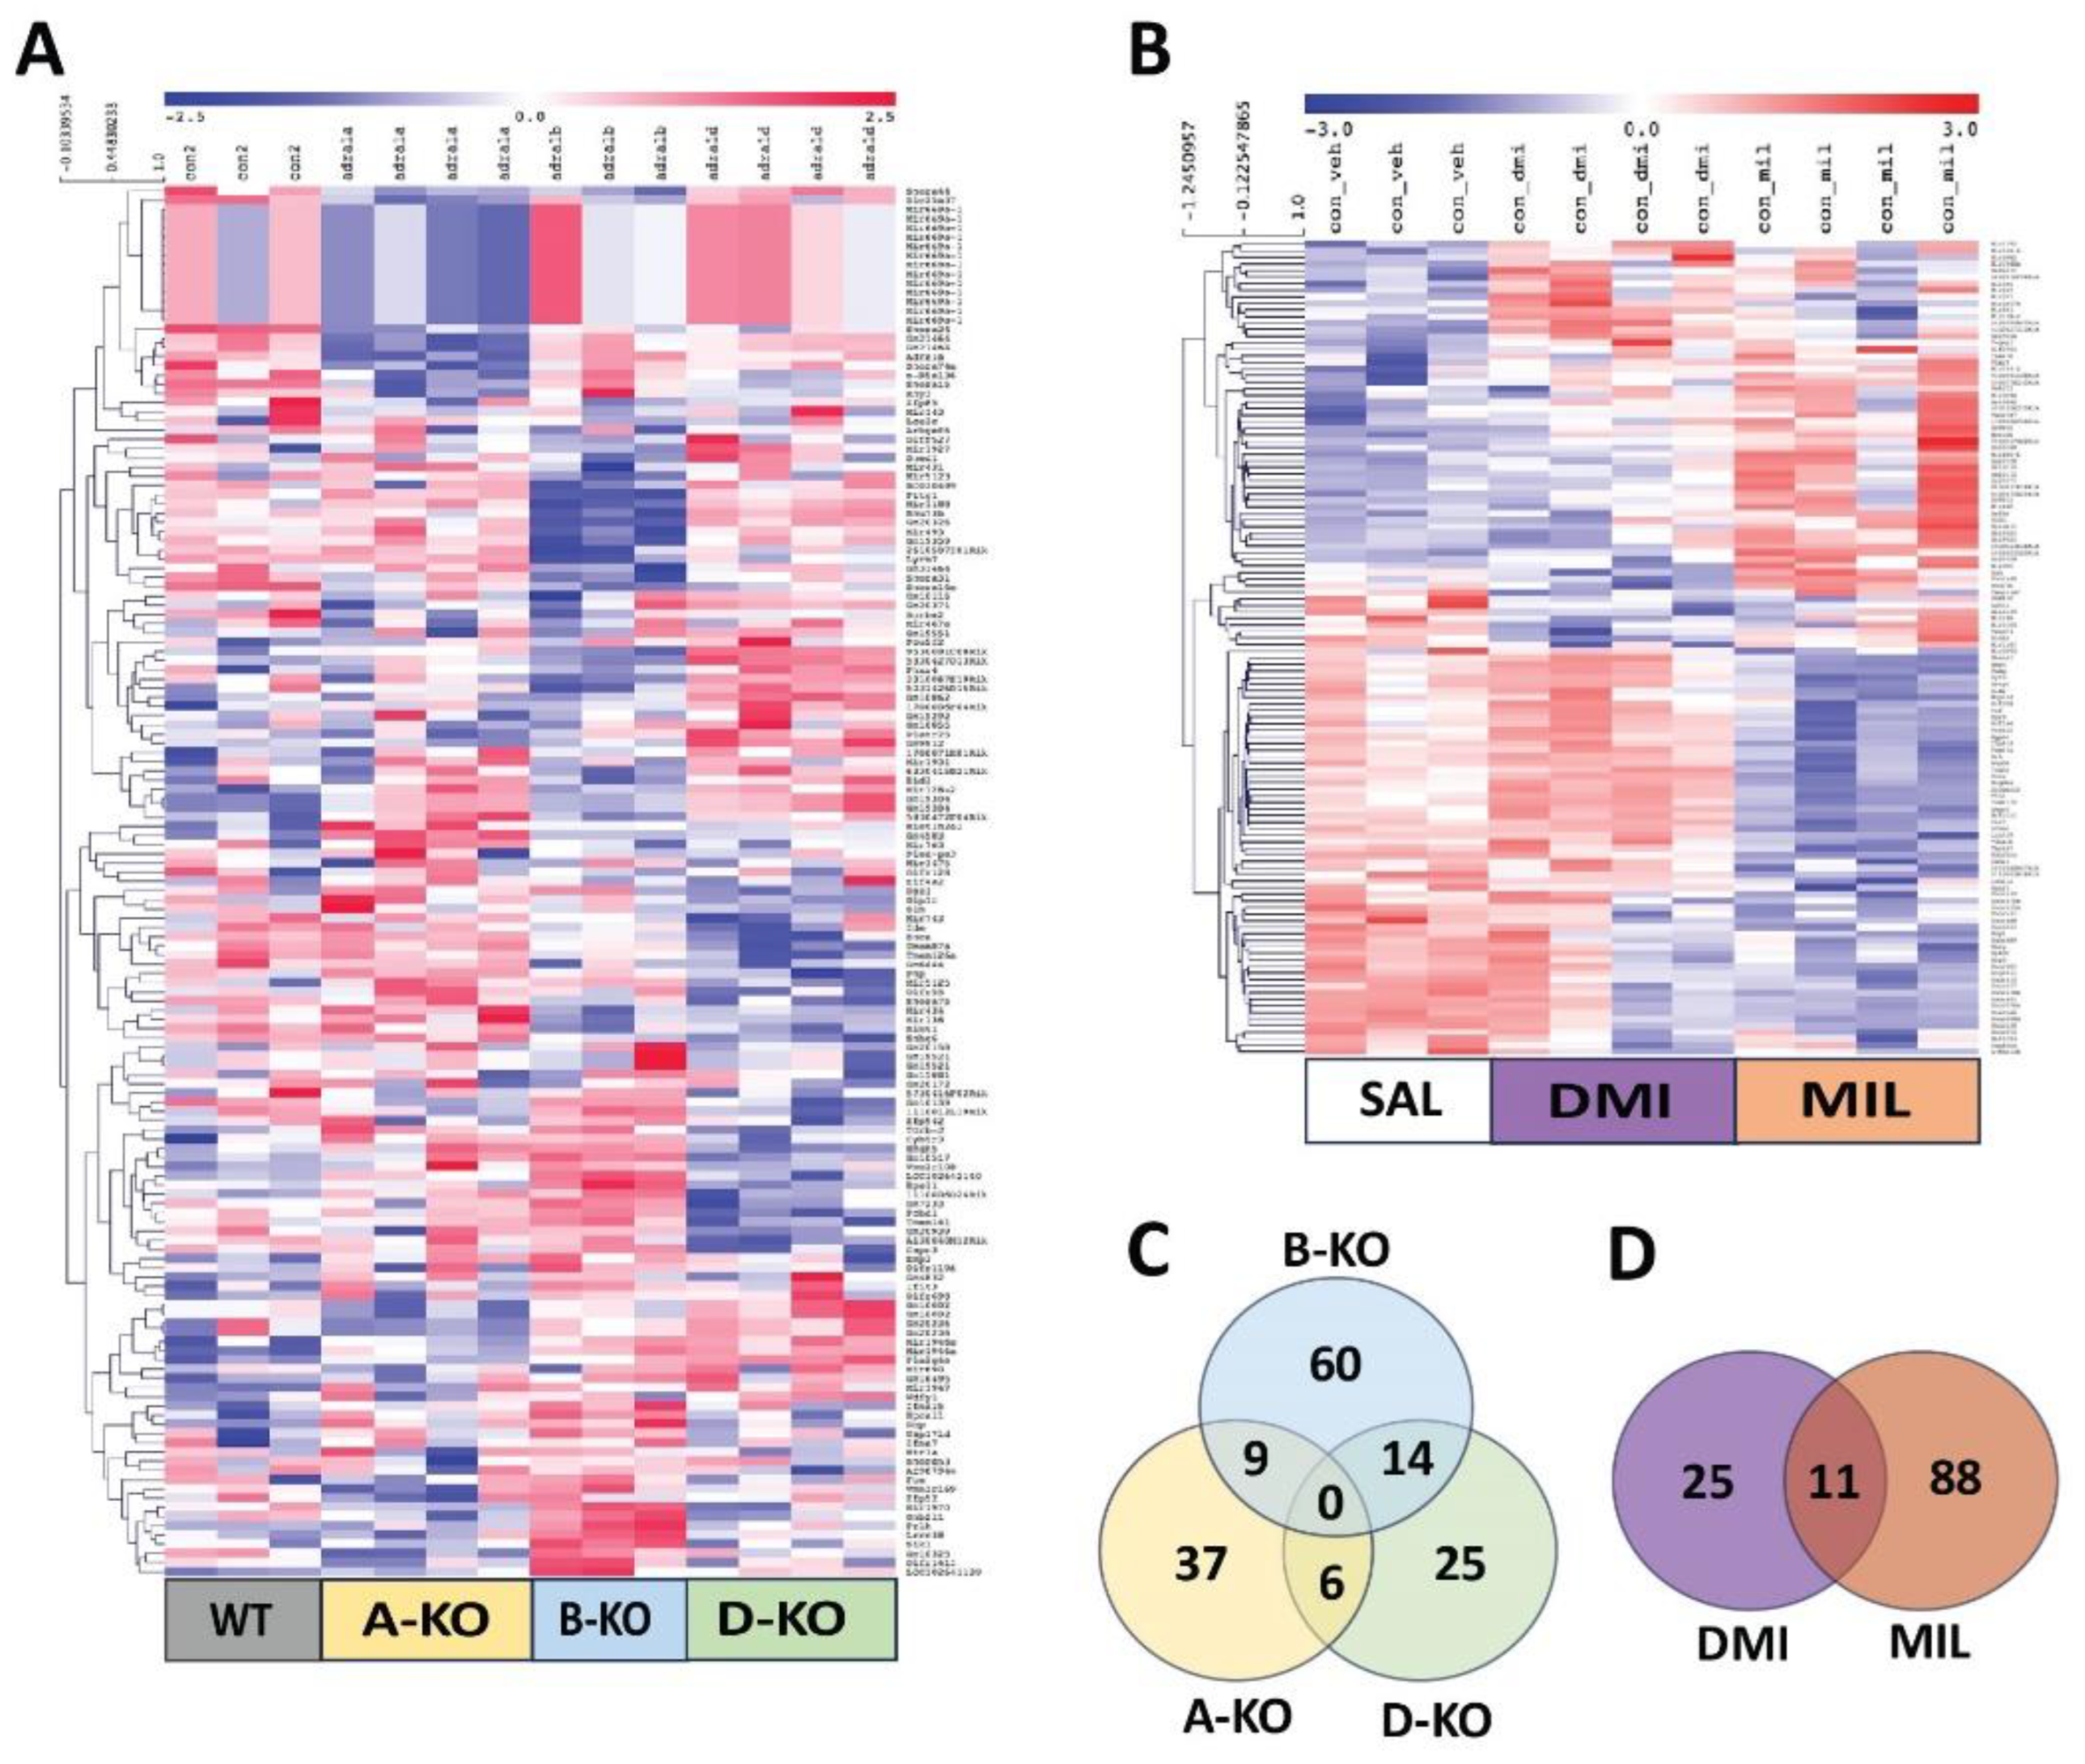
Figure 5.
The transcriptomic analysis results indicate that the transcripts’ levels in the hippocampus of wild-type mice were significantly altered due to repeated administration of milnacipran. This analysis was subjected to ontological evaluation using the Gene Set Enrichment Analysis (GSEA) method [45] and the Panther classification system [46].
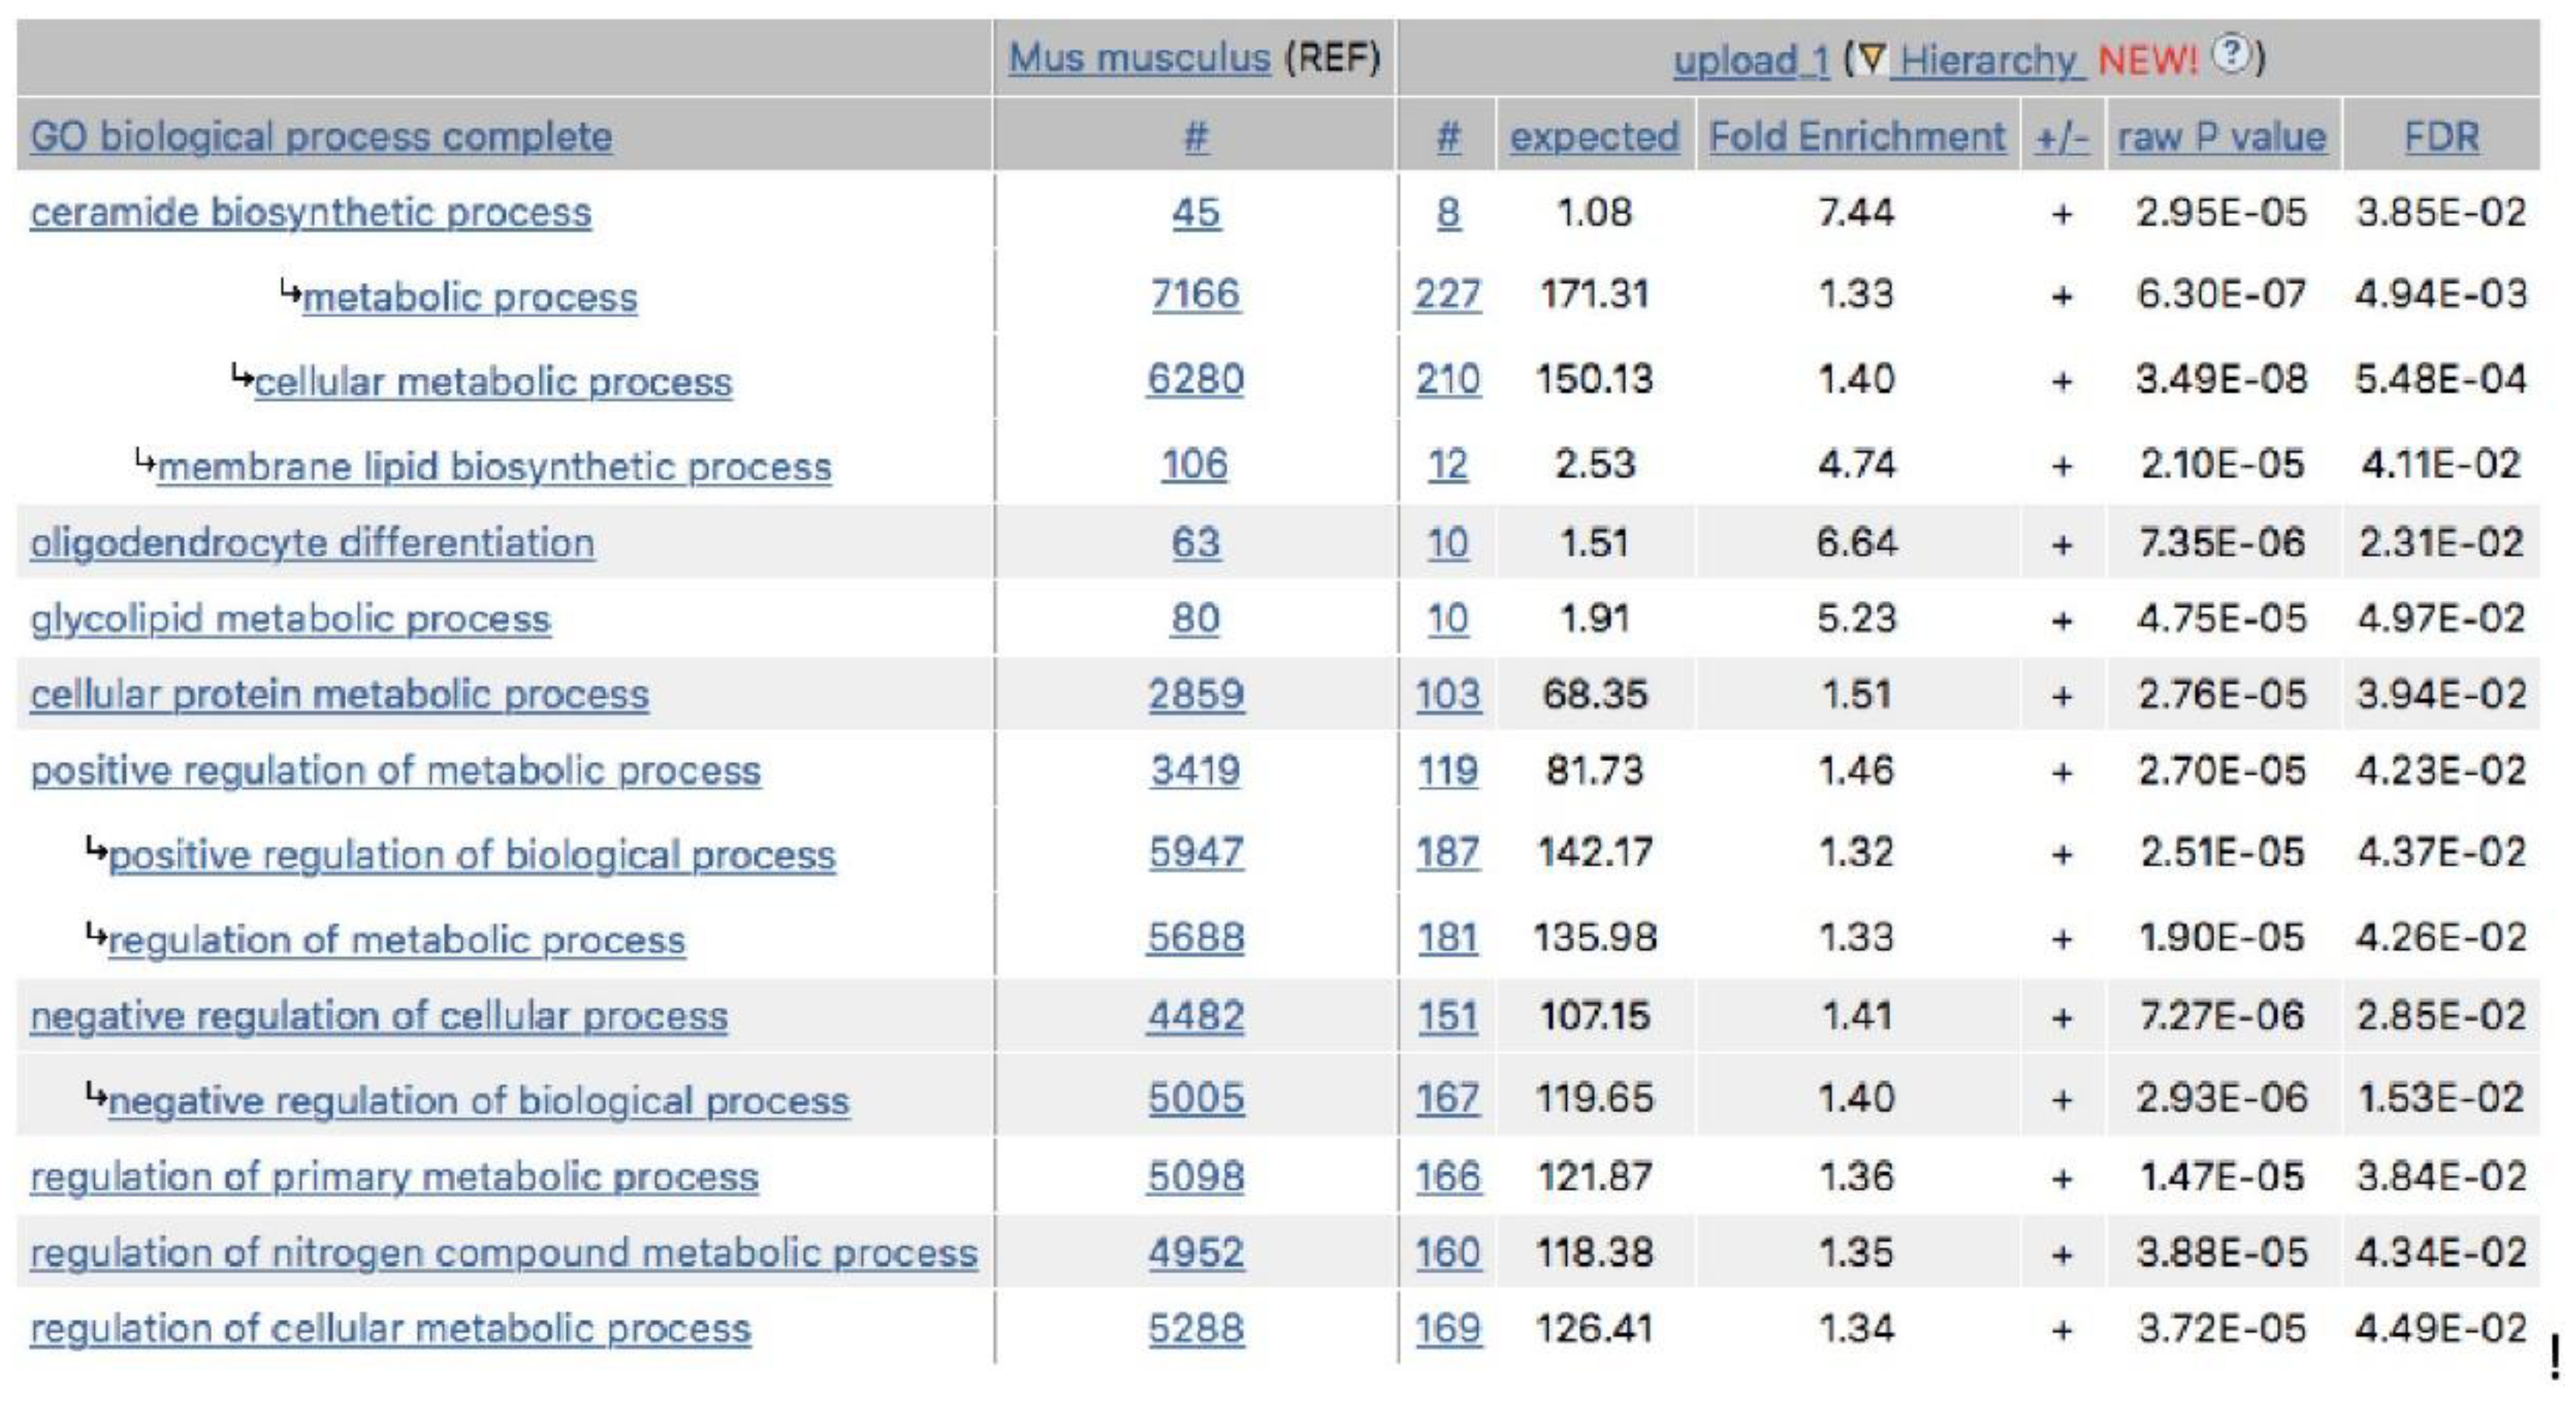
Figure 6.
The heat map of gene expression patterns in the hippocampus of wild-type (WT) mice and knockout mice with selective inactivation of α1A-adrenoceptor (A-KO), α1B-adrenoceptor (B-KO), or α1D-adrenoceptor (D-KO), treated with either physiological saline (sal) or milnacipran (MIL).
Figure 6.
The heat map of gene expression patterns in the hippocampus of wild-type (WT) mice and knockout mice with selective inactivation of α1A-adrenoceptor (A-KO), α1B-adrenoceptor (B-KO), or α1D-adrenoceptor (D-KO), treated with either physiological saline (sal) or milnacipran (MIL).
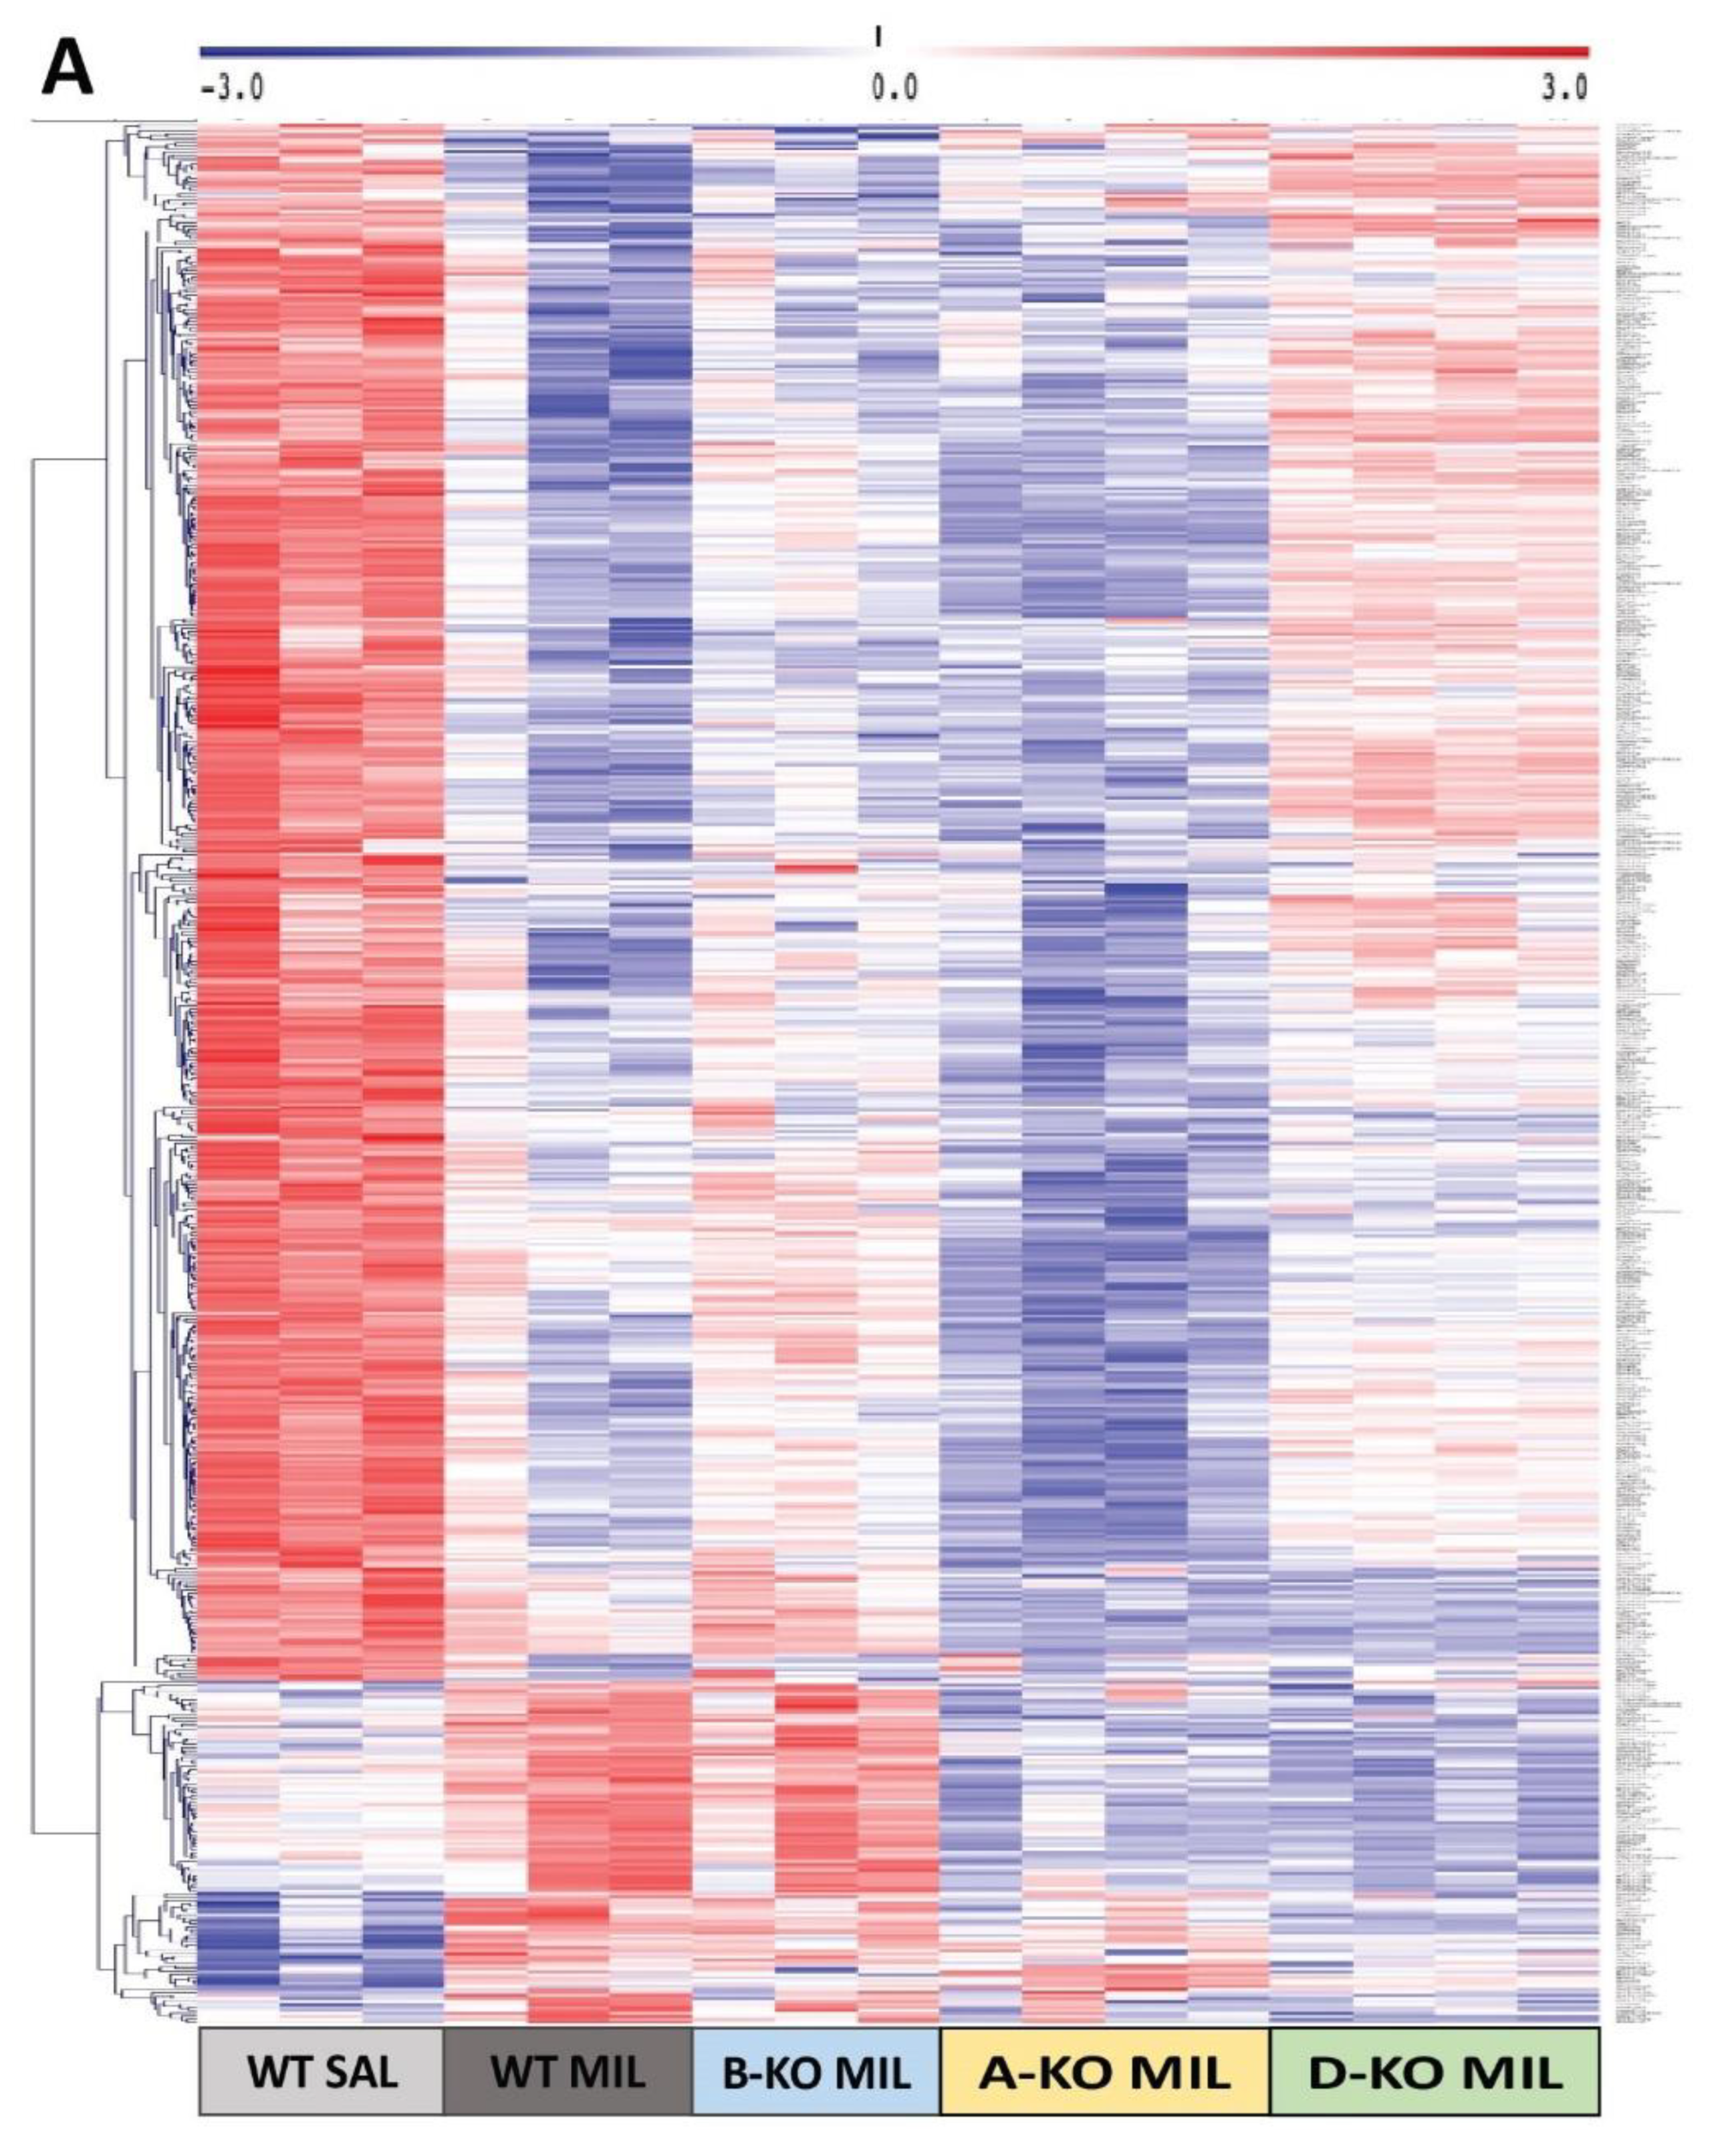
Figure 7.
Impact of repeatedly given antidepressant drugs, desipramine (DMI) or milnacipran (MIL), and the mutation effect on phosphorylation and protein levels of ERK1 and ERK2 in the hippocampus of male wild-type (WT, grey bars) mice and knockout mice with selective inactivation of α1A-adrenoceptor (A-KO, green bars) (graphs A-E), α1B-adrenoceptor (B-KO, red bars) (graphs F-J), and α1D-adrenoceptor (D-KO, violet bars) (graphs K-O), are presented. Representative immunoblot images are shown for each protein and subtype of the receptor tested (E, J, O). CNX – cyclophilin, a housekeeping gene. Data are shown as mean values ± SEM with n = 4-8, analyzed using one-way analysis of variance (ANOVA) and Tukey’s post-hoc test for unequal group sizes (Unequal N HSD). * p < 0.05 vs. WT sal, *** p < 0.001 vs. WT sal, # p < 0.05 vs. KO sal, ## p < 0.01 vs. KO sal, $ p < 0.05 vs. WT drug.
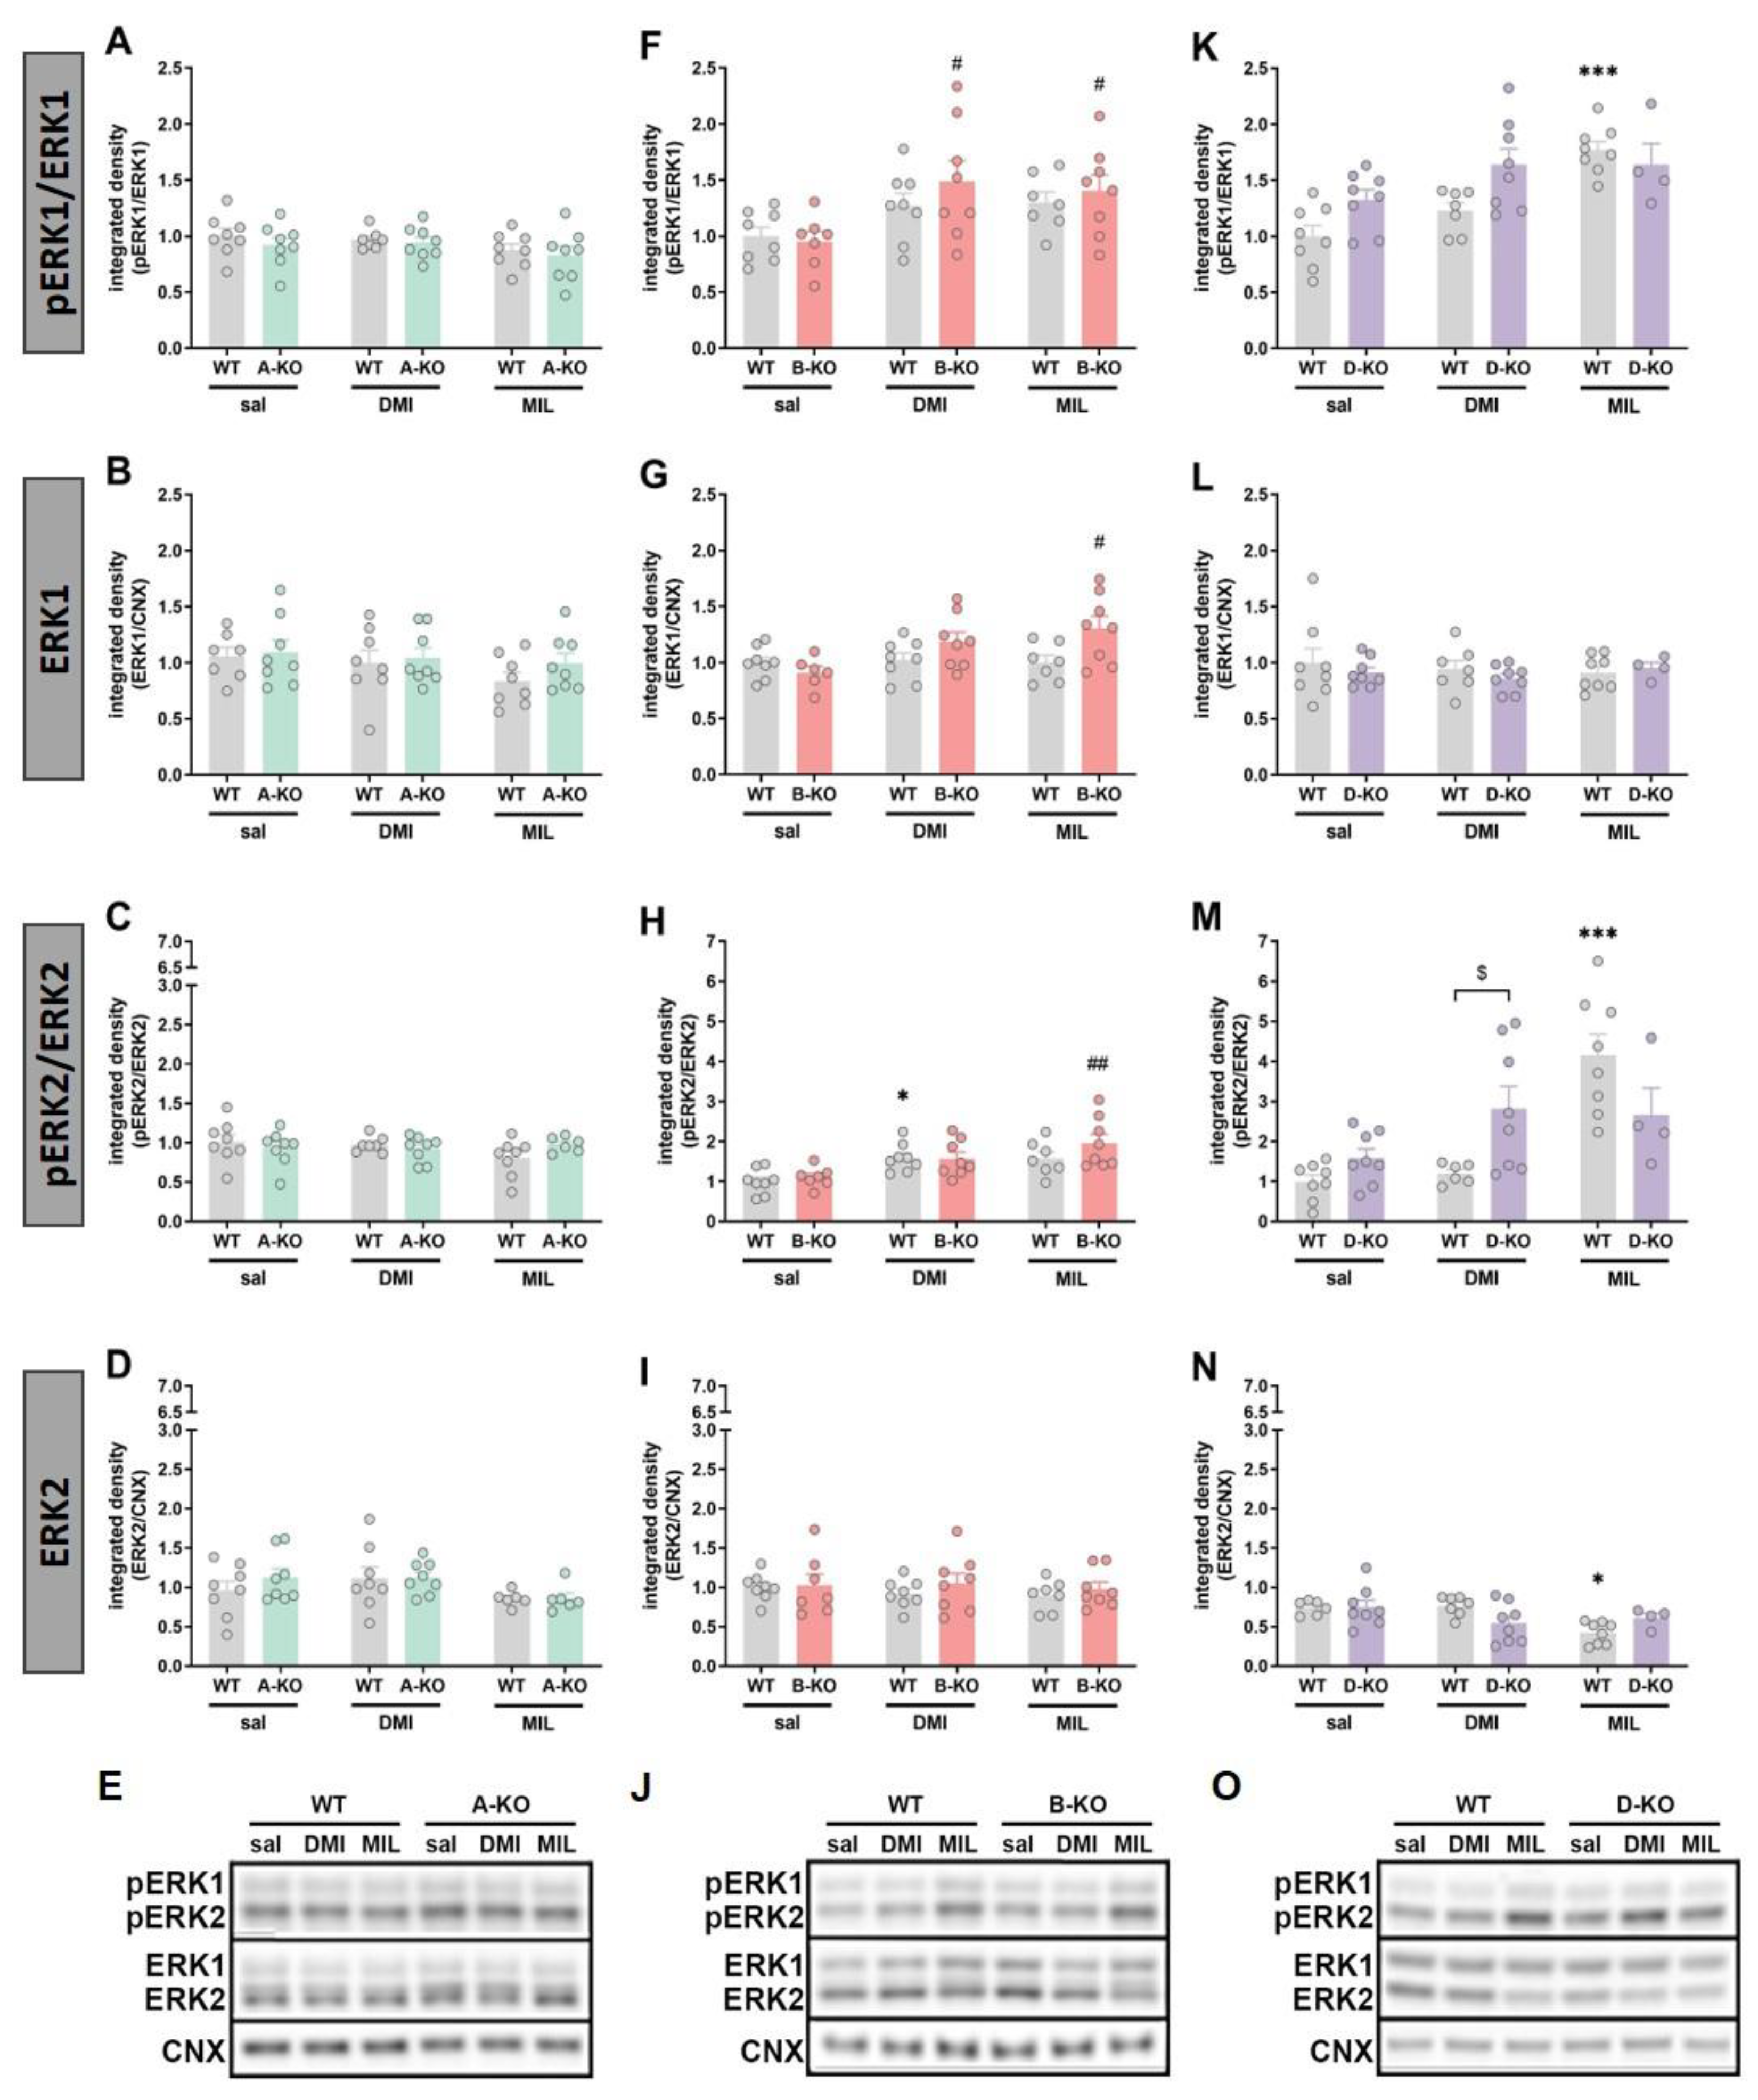
Figure 8.
Impact of repeatedly given antidepressant drugs, desipramine (DMI) or milnacipran (MIL), and the mutation effect on phosphorylation and protein levels of Akt and GSK-3β in the hippocampus of male wild-type (WT) mice and knockout mice with selective inactivation of α1A-adrenoceptor (A-KO) (graphs A-E), α1B-adrenoceptor (B-KO) (graphs F-J), and α1D-adrenoceptor (D-KO) (graphs K-O), are presented. Data are shown as mean values ± SEM with n = 4-8, analyzed using one-way analysis of variance (ANOVA) and Tukey’s post-hoc test for unequal group sizes (Unequal N HSD).* p < 0.05 vs. WT sal, ** p < 0.01 vs. WT sal, *** p < 0.001 vs. WT sal, # p < 0.05 vs. KO sal, ## p < 0.01 vs. KO sal, $ p < 0.05 vs. WT drug. Please refer to Figure 7 for the remaining descriptions.
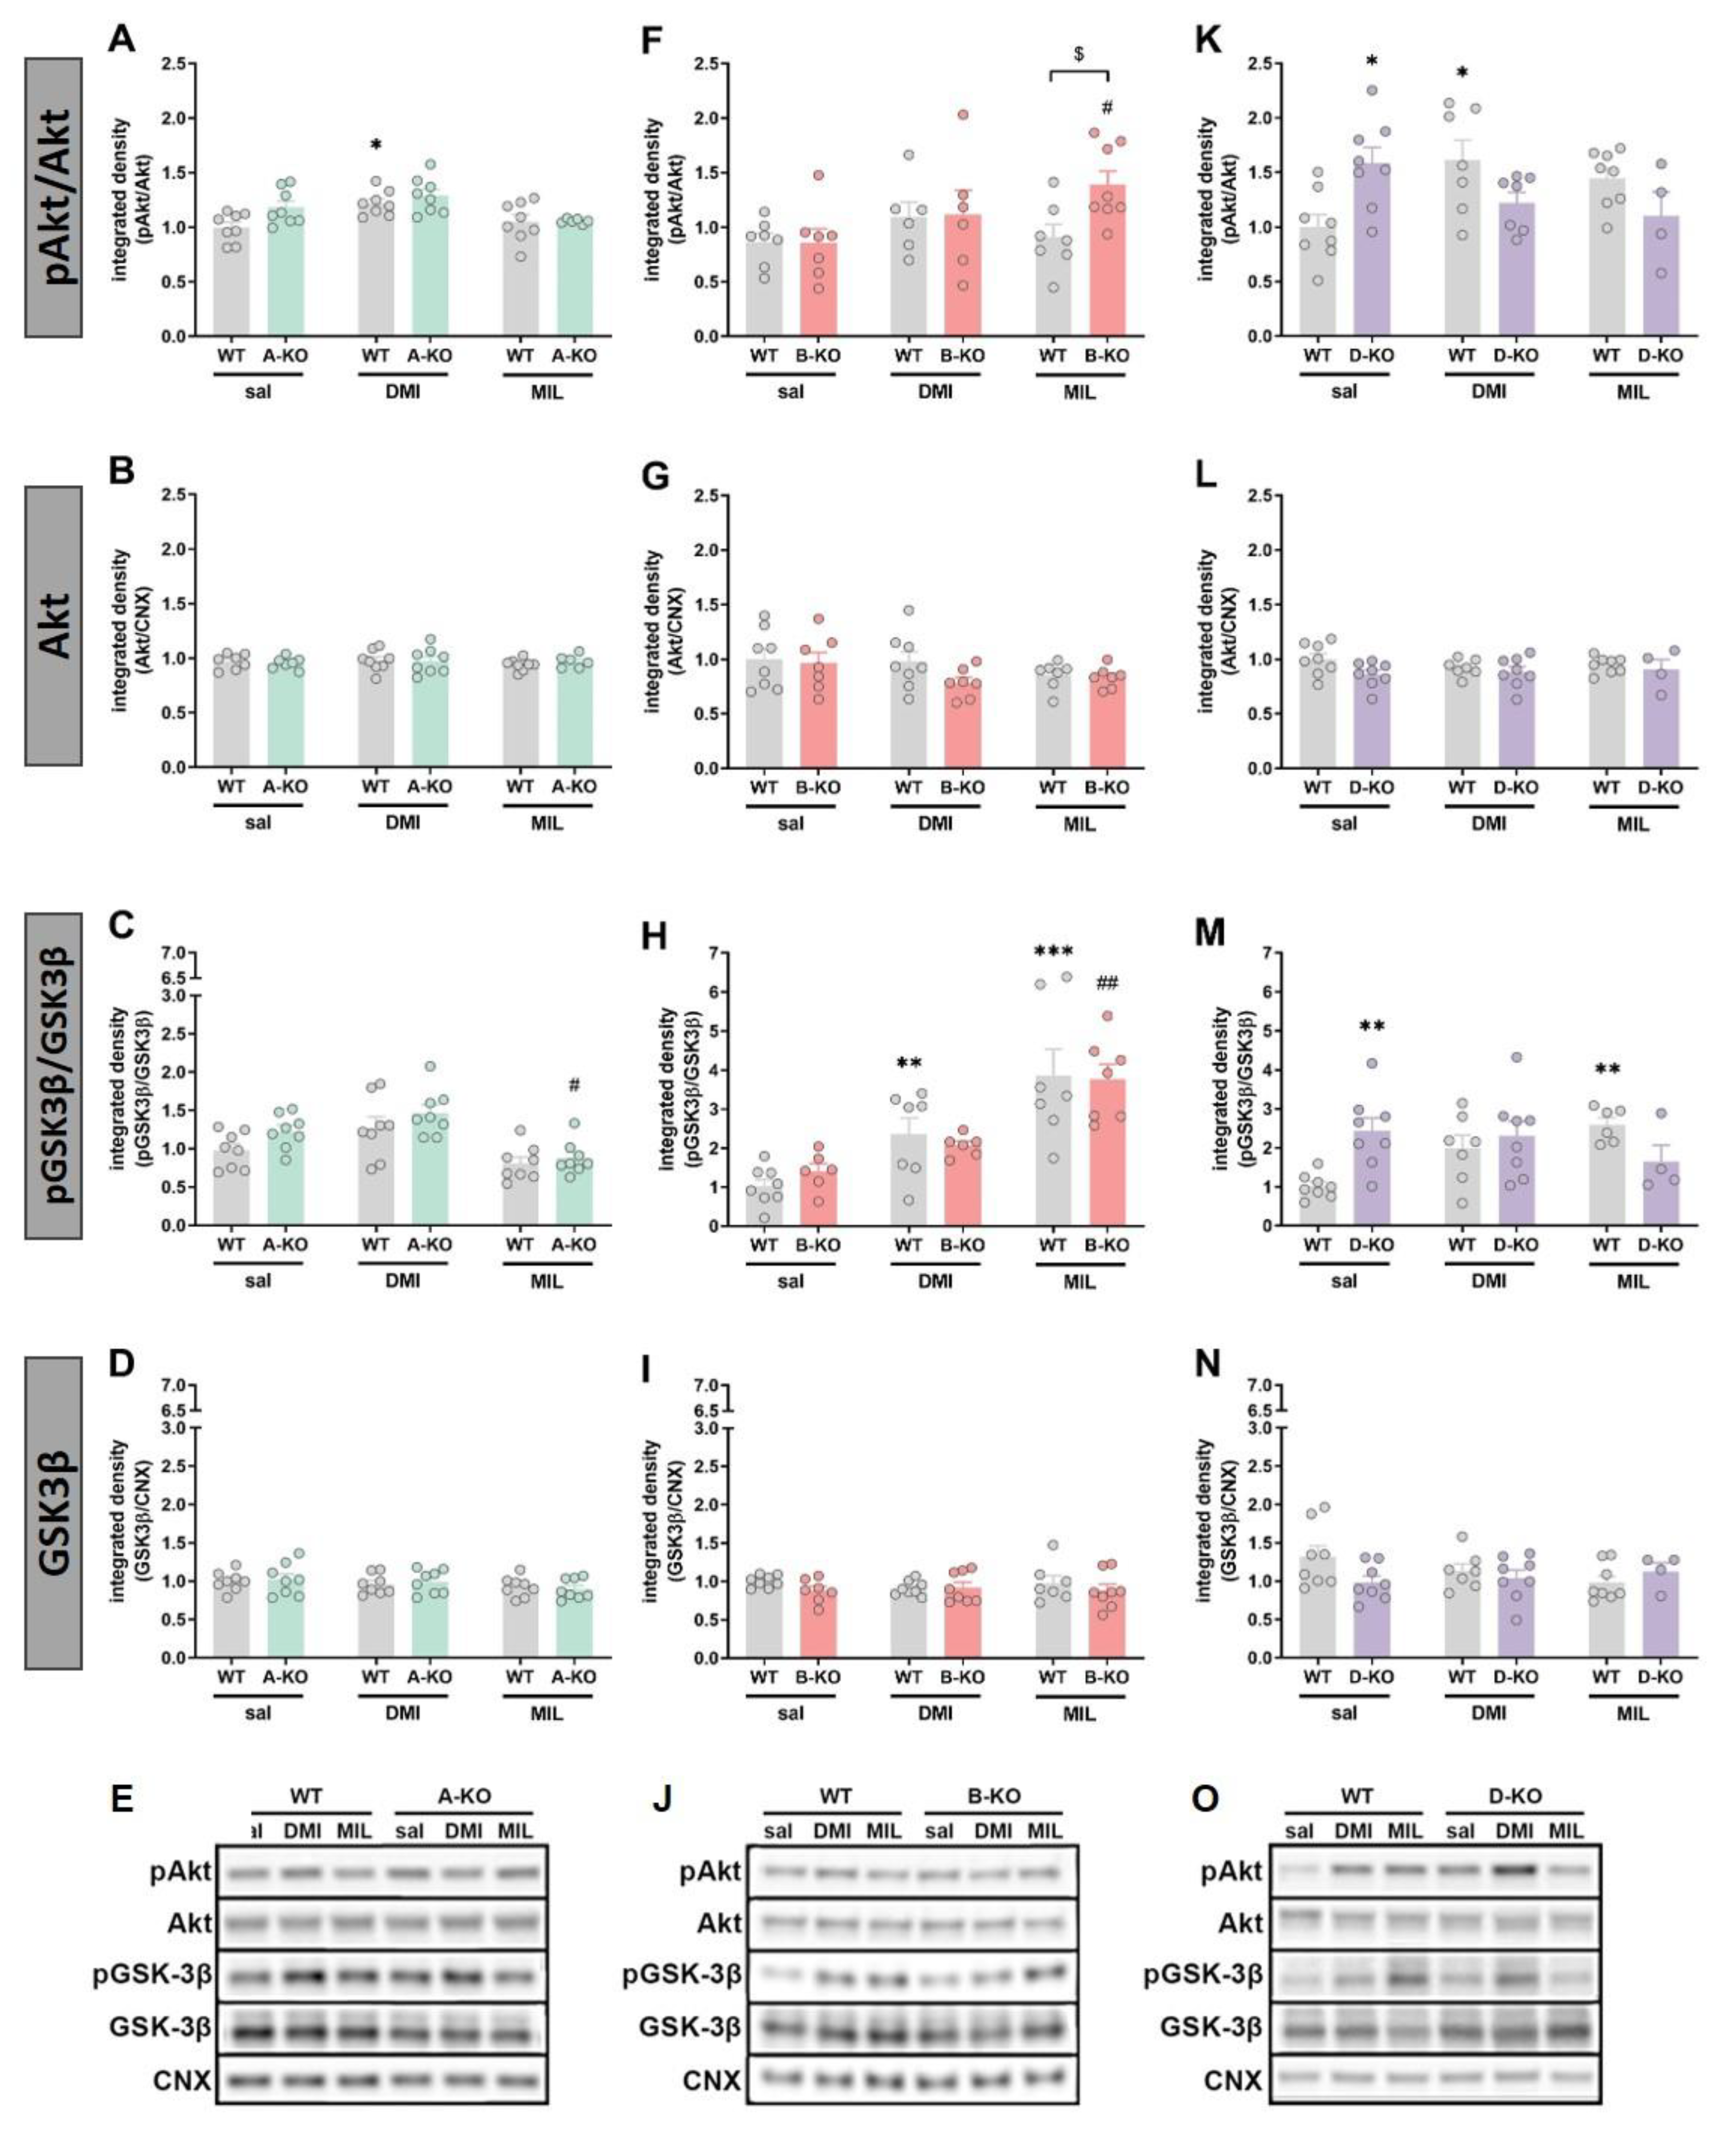
Figure 9.
Phosphorylation and protein levels of ERK1 and ERK2 in the hippocampus of female wild-type (WT) mice and knockout mice with selective inactivation of α1A-adrenoceptor (A-KO) (graphs A-E), α1B-adrenoceptor (B-KO) (graphs F-J), and α1D-adrenoceptor (D-KO) (graphs K-O), and after chronic treatment with desipramine (DMI) or milnacipran (MIL). Data are shown as mean values ± SEM with n = 4-8, analyzed using one-way analysis of variance (ANOVA) and Tukey’s post-hoc test for unequal group sizes (Unequal N HSD). * p < 0.05 vs. WT sal, # p < 0.05 vs. KO sal, ## p < 0.01 vs. KO sal, ### p < 0.001 vs. KO sal, $$ p < 0.01 vs. WT lek, $$$ p < 0.001 vs. WT drug. Please refer to Figure 7 for the remaining descriptions.
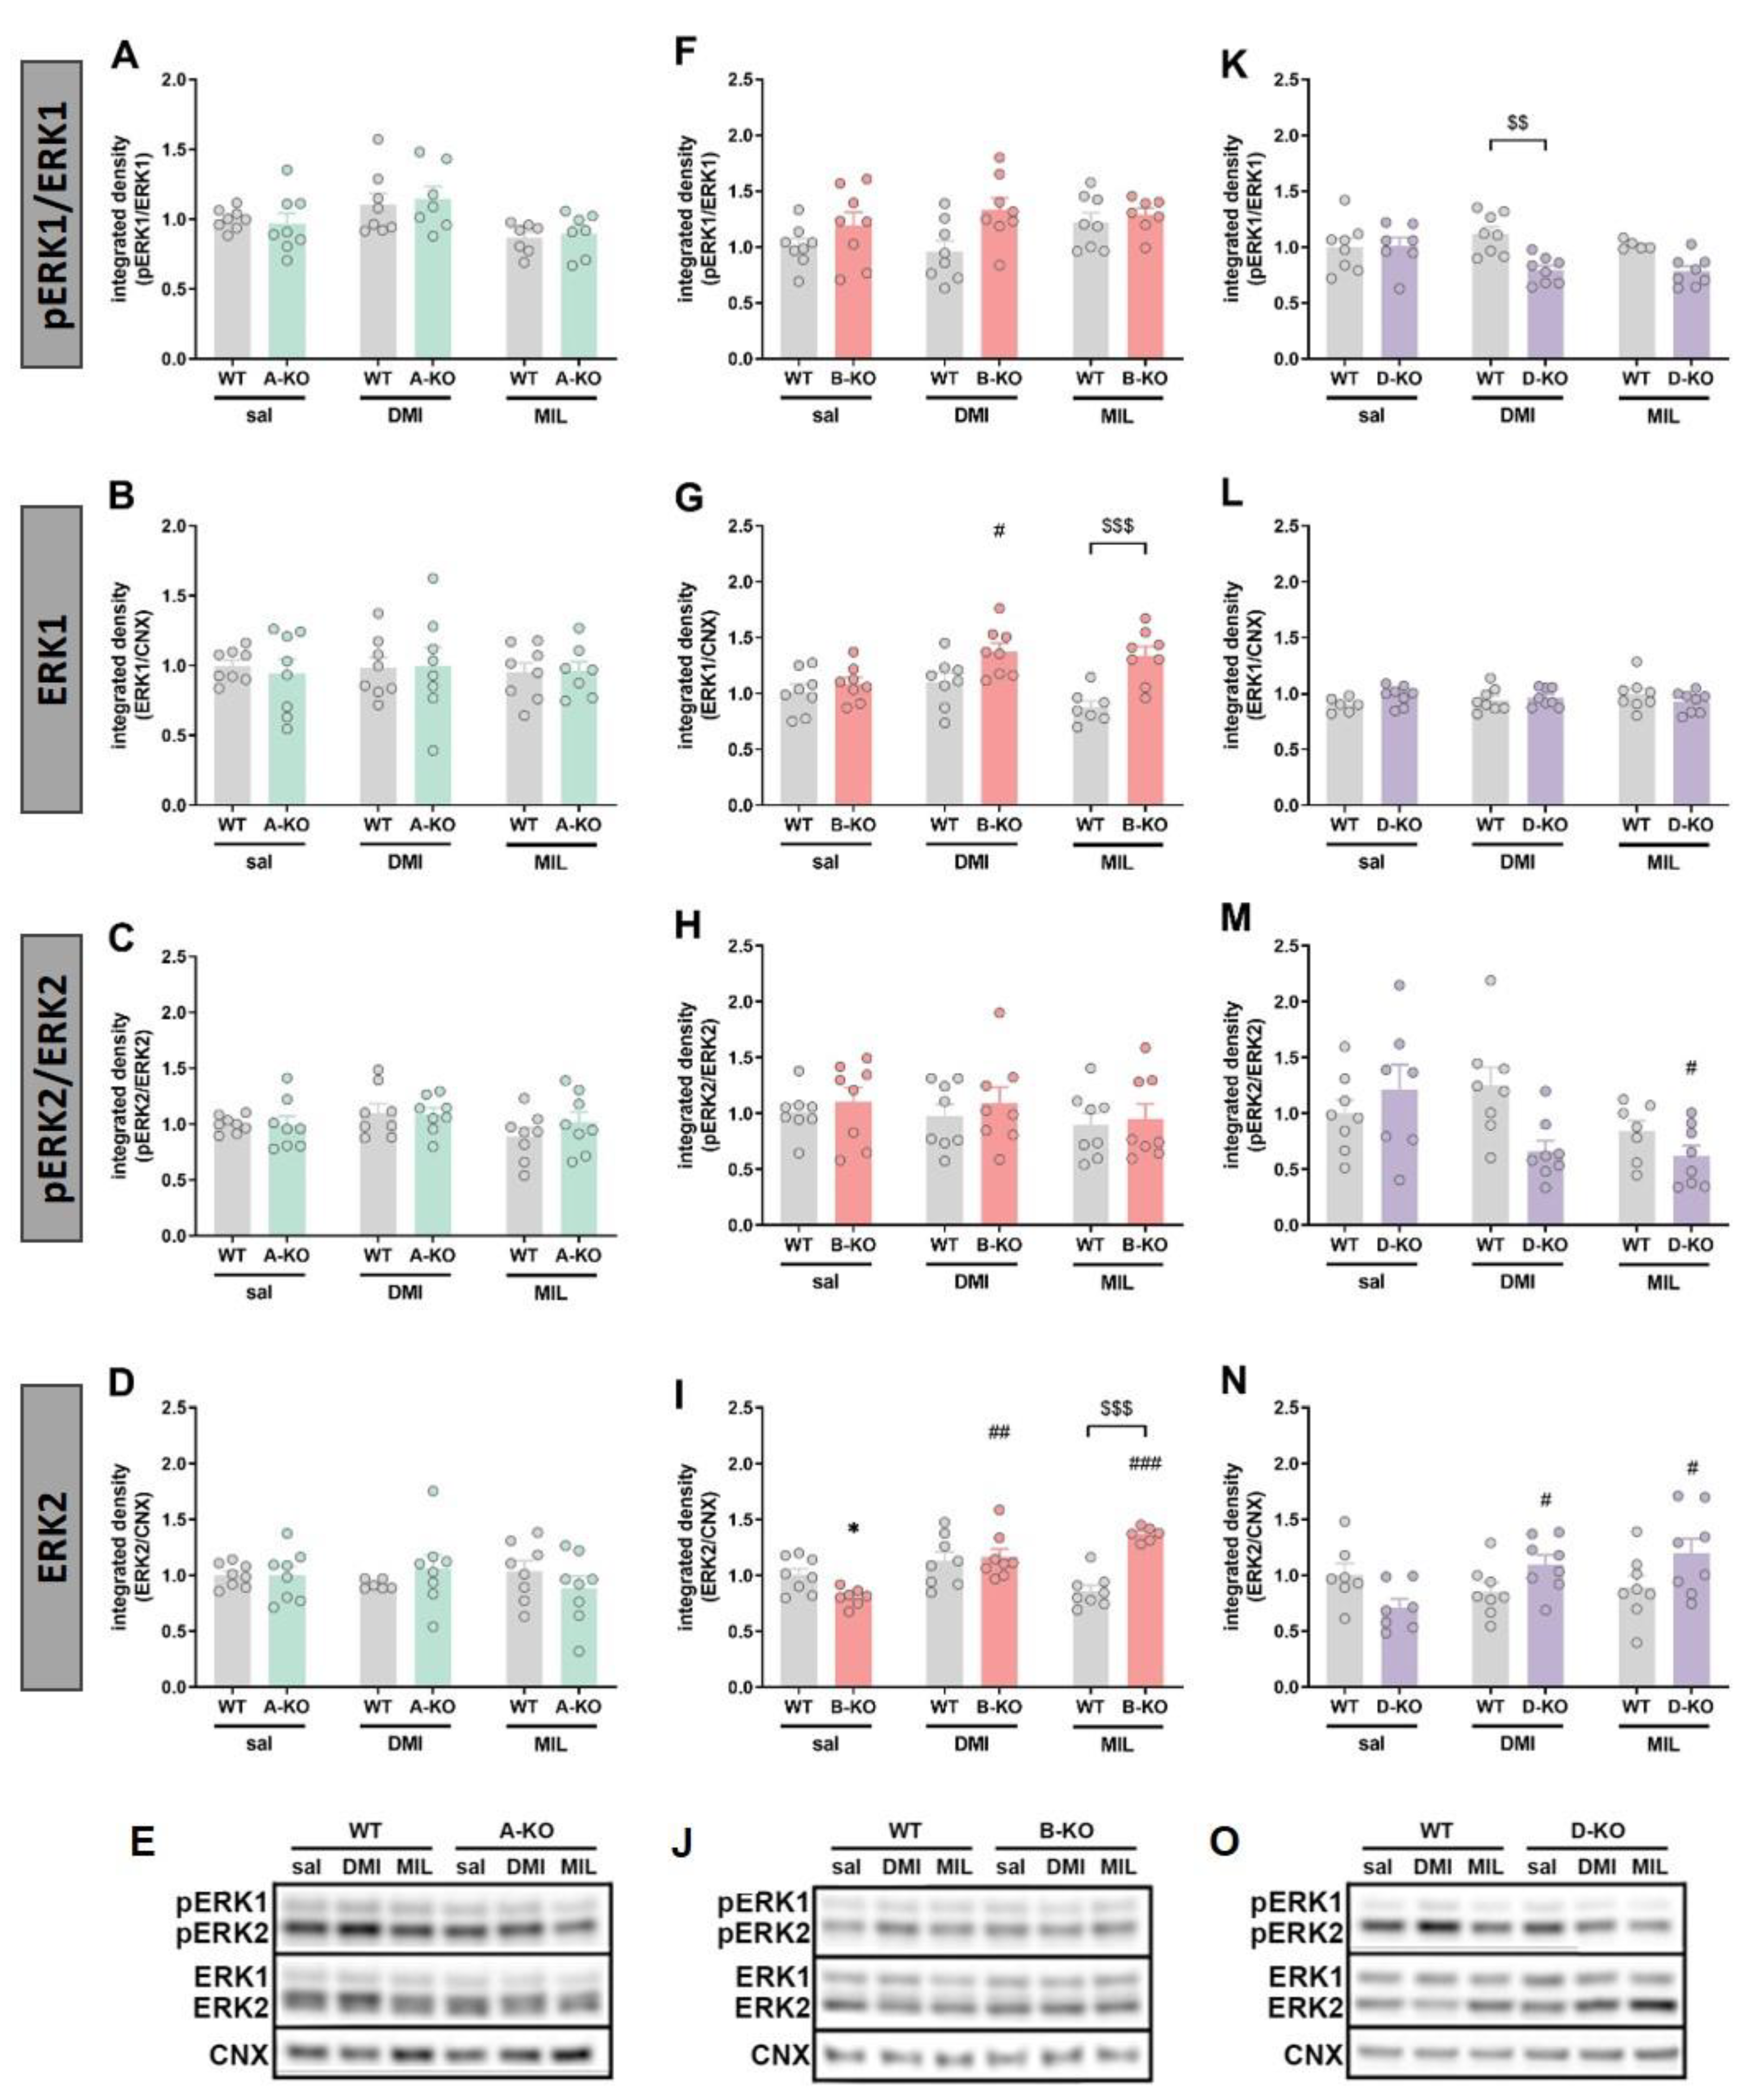
Figure 10.
Phosphorylation and protein levels of Akt and GSK-3β in the hippocampus of female wild-type (WT) mice and knockout mice with selective inactivation of α1A-adrenoceptor (A-KO) (graphs A-E), α1B-adrenoceptor (B-KO) (graphs F-J), and α1D-adrenoceptor (D-KO) (graphs K-O), and after chronic treatment with DMI or MIL. Data are shown as mean values ± SEM with n = 4-8, analyzed using one-way analysis of variance (ANOVA) and Tukey’s post-hoc test for unequal group sizes (Unequal N HSD). * p < 0.05 vs. WT sal, ** p < 0.01 vs. WT sal, *** p < 0.001 vs. WT sal, # p < 0.05 vs. KO sal, ## p < 0.01 vs. KO sal, ### p < 0.001 vs. KO sal, $ p < 0.05 vs. WT drug. Please refer to Figure 7 for the remaining descriptions.
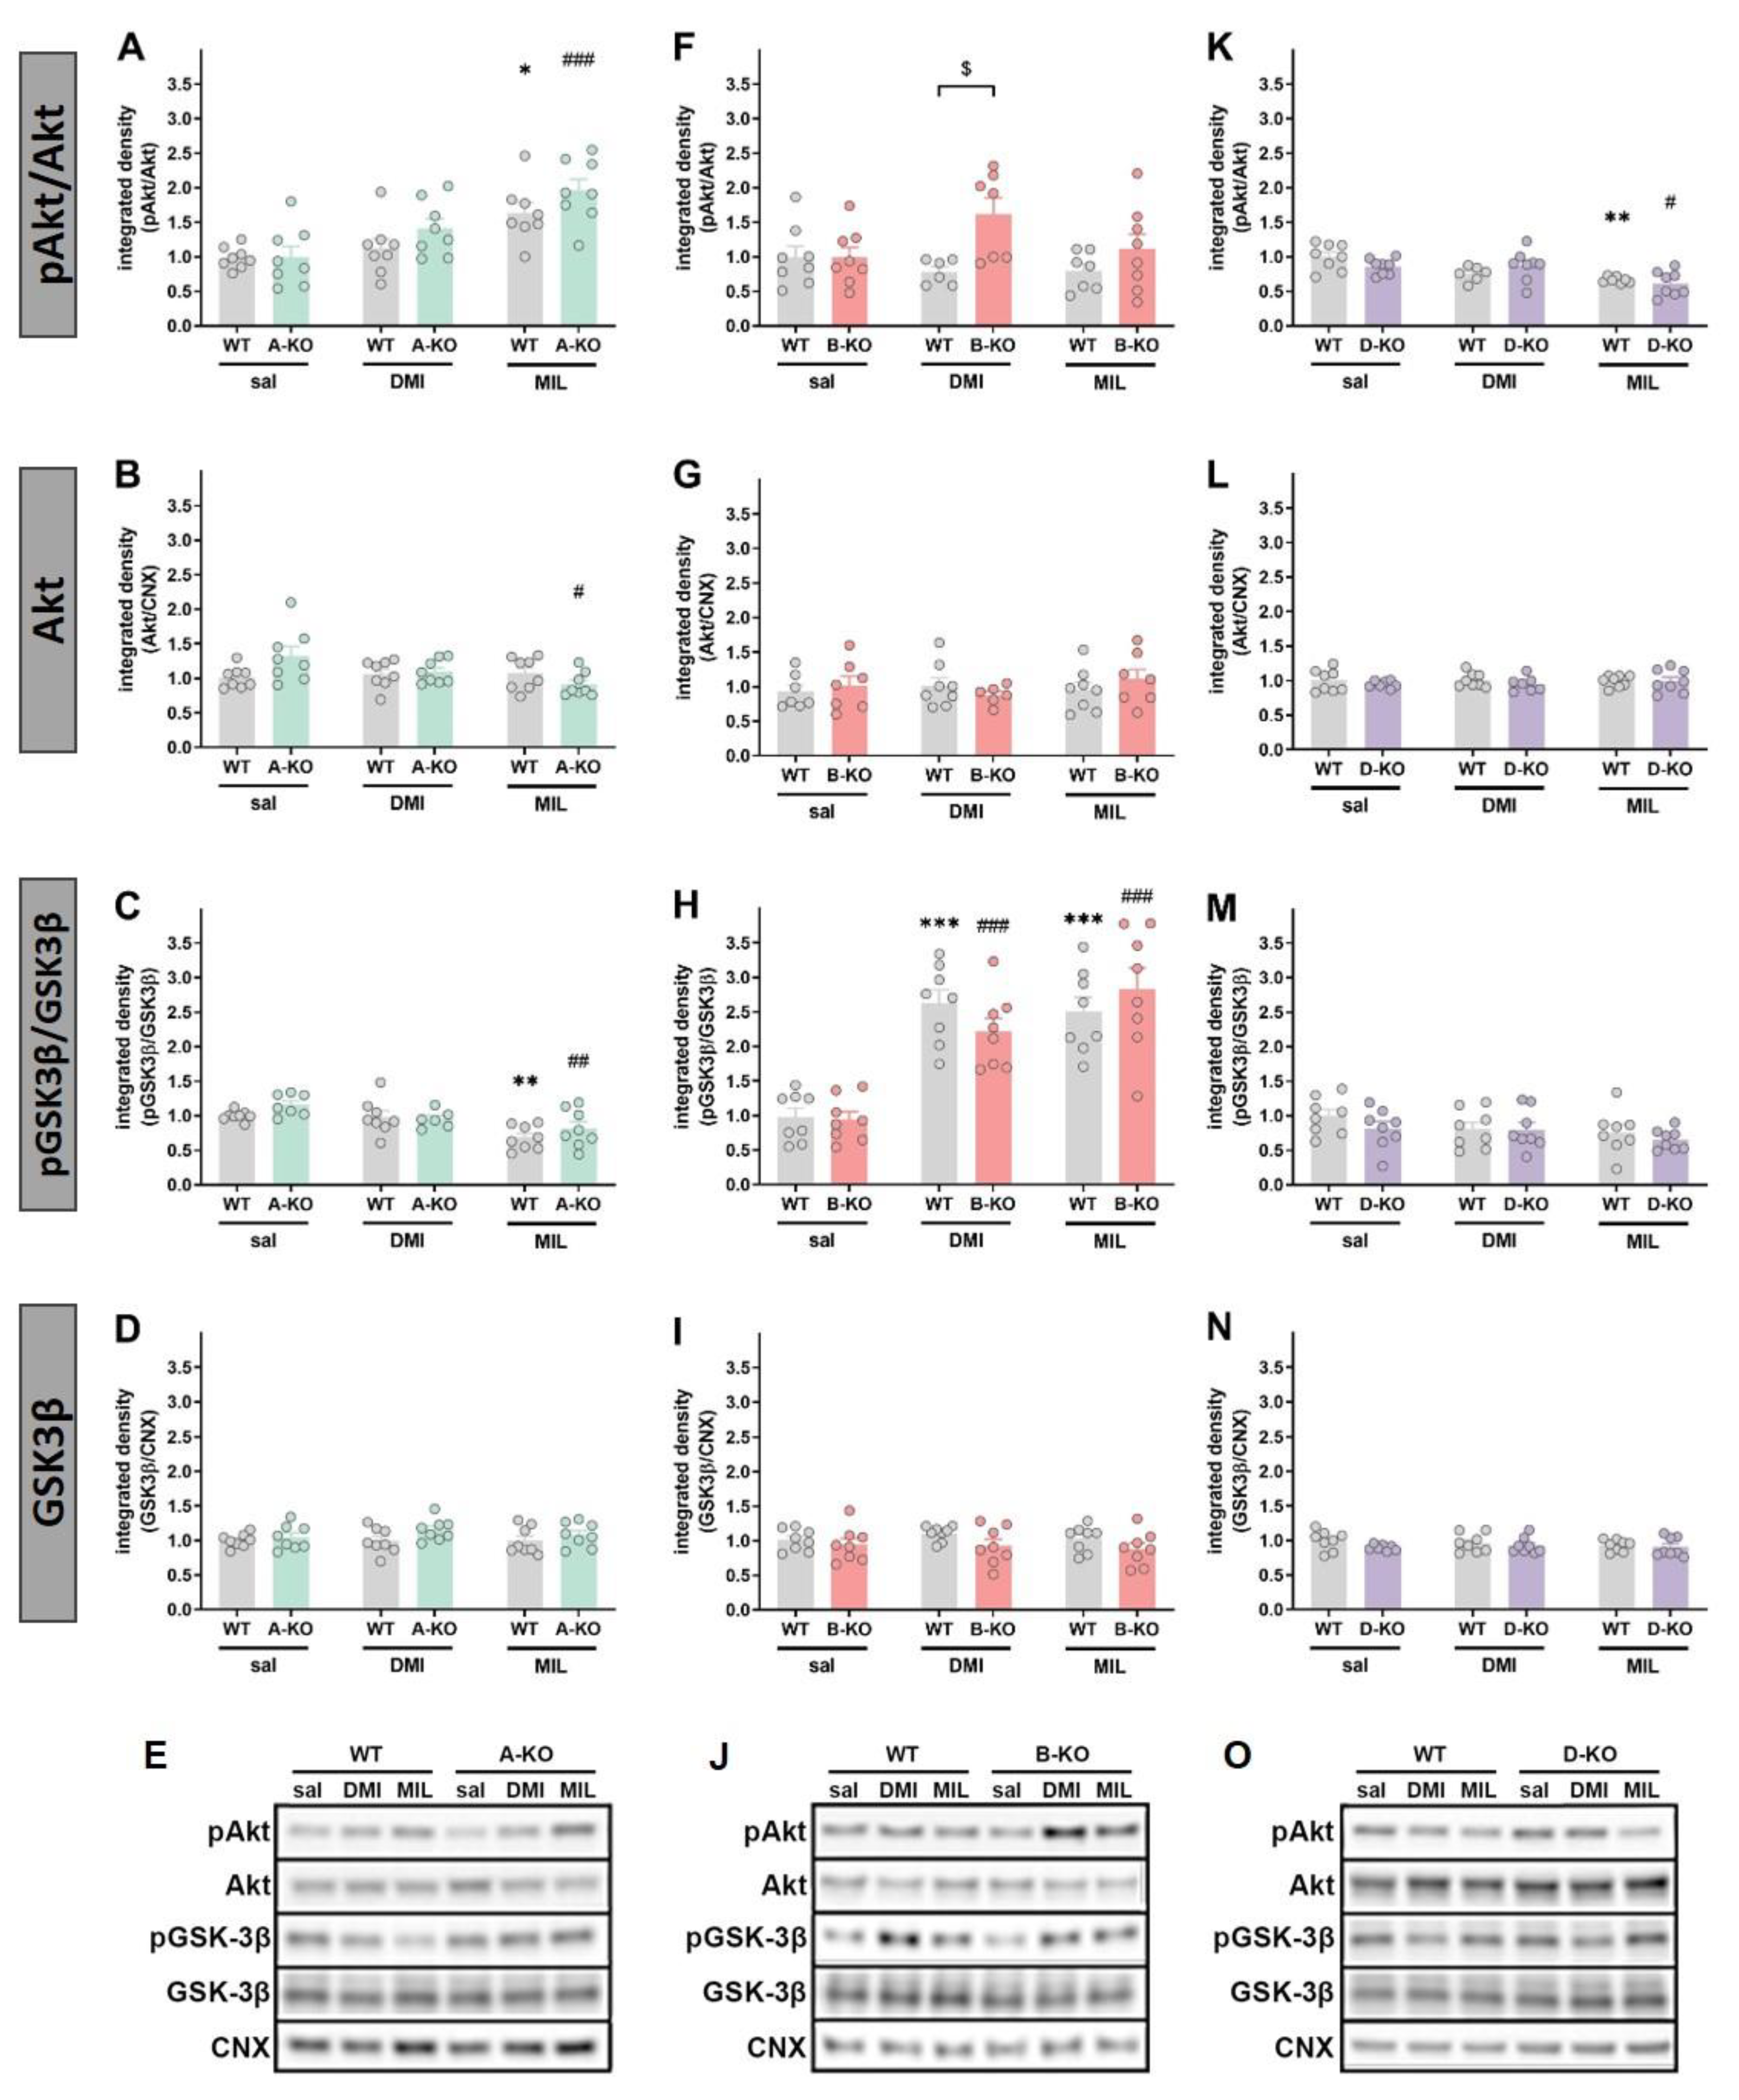
Disclaimer/Publisher’s Note: The statements, opinions and data contained in all publications are solely those of the individual author(s) and contributor(s) and not of MDPI and/or the editor(s). MDPI and/or the editor(s) disclaim responsibility for any injury to people or property resulting from any ideas, methods, instructions or products referred to in the content. |
© 2025 by the authors. Licensee MDPI, Basel, Switzerland. This article is an open access article distributed under the terms and conditions of the Creative Commons Attribution (CC BY) license (http://creativecommons.org/licenses/by/4.0/).
Copyright: This open access article is published under a Creative Commons CC BY 4.0 license, which permit the free download, distribution, and reuse, provided that the author and preprint are cited in any reuse.


