Preprint
Article

Differences in Port Pricing Strategies: Case of Port and Fairway Fees in Northern Baltic Sea Countries

This version is not peer-reviewed.

Submitted:

14 February 2025

Posted:

17 February 2025

You are already at the latest version

Abstract

Ports and waterways are integral components of the maritime transport system, facilitating global trade and logistics. Governments, ports, and service providers levy charges on vessels for the use of fairways, port access, and associated services. This study analyzes the port and fairway fee strategies of seven major Baltic Sea ports across four countries: Estonia (Tallinn and Sillamäe), Latvia (Riga and Ventspils), Finland (Helsinki and HaminaKotka), and Sweden (Stockholm). The analysis evaluates the application of general port pricing principles in these ports' strategies. The findings reveal that port fees are predominantly value-based, with tariff rates varying by vessel type and cargo. However, no uniform structure exists for fairway fees. Notably, incorporating environmental components into fairway fee calculations emerges as a promising mechanism to promote sustainability in maritime transport. By incentivizing the adoption of environmentally friendly vessels through differentiated fee structures, ports and policymakers can accelerate the transition toward greener shipping practices. This study highlights the role of economic instruments in advancing environmental objectives and emphasizes the need for a harmonized, sustainability-driven approach to fairway and port pricing in the Baltic Sea region.

Keywords: 
;  ;  

1. Introduction

Maritime transport is vital to global trade, with over 80 per cent of global trade being carried by sea. Ports play an important role in this system, acting as interfaces between maritime transport and other modes of transportation. They also support important supply chain services, such as customs processing, container depots, and other logistics functions [1]. Unlike shipping, ports are closely linked to their location and the state or country in which they are located. The state plays a significant role in keeping ports sustainable by setting up a supportive regulatory framework. In addition, the state also has certain responsibilities, such as the management of public waterways and the fairways connecting ports [2,3].
The state charges fairway fees to ensure maritime safety. Depending on the country, this can mean managing and maintaining public fairways, navigational signs and structures, and information systems, as well as providing icebreaking services. As a rule, all costs of maritime transport incurred to the state are covered by a special due, the fairway fee, collected from the fairway user, the vessel, e.g. the shipowner [4]. In reality, this is not always the case. Fairway fees have long been calculated based on a vessel's size and, in northern regions, its ice class. Ships with higher ice classes can navigate icy waters without icebreaker assistance and receive lower tariff rates [5].
The state may also implement policies to achieve certain objectives [6], e.g. climate goals. In the case of fairway fees, the state can encourage shipowners to use more environmentally friendly vessels by introducing environmental performance indicators as a component of the fee. However, the state's role is not limited to this. In the event of abrupt changes in market conditions, the state can support shipping companies by reducing fairway fees, as seen in Estonia's response during the COVID-19 pandemic [5,7]
A pricing strategy of fairway fees can focus on one or many objectives. Strategic pricing objectives can include profit maximization, throughput maximization, job creation, fostering economic activity, supporting regional development, reducing vessel turnaround time in ports, and promoting trade [8]. These objectives, while beneficial, may also conflict with each other, adding a layer of complexity to the maritime industry. Pricing systems should be transparent, durable, cost-effective, easy to operate, and straightforward to understand, with the ideal goal of comparability across ports [1].
This article compares various port and fairway fee strategies. It analyses port and fairway fees on vessels in seven major Baltic Sea ports of four countries: Estonia, Finland, Latvia, and Sweden. The selected ports are Tallinn and Sillamäe in Estonia, Riga and Ventspils in Latvia, Helsinki and HaminaKotka in Finland and Stockholm in Sweden. We examine how well the general principles of port pricing are applied in real-world port strategies. Charges for stevedoring operations, bunkering and other stock replenishment are not covered by this article.
The research questions are:
  • What are the port and fairway fees in the case countries with selected vessels?
  • How are the port and fairway fees structured in the case countries?
  • Is there a general structure of the port and fairway fees used by the countries?
This paper is organized as follows: The second chapter discusses the principles of port pricing, followed by the principles of fairway fees and charges levied on ships. The third chapter presents the structure of port fees in the ports under review, shows which vessels were used for the calculation of port fees and the port fees by type of vessel. The final chapter analyses and discusses the results of the study and gives ideas for further research.

2. Literature Review: Basis of the Port Fees

2.1. Port Pricing Policies

Ports are interfaces connecting maritime transport with the rest of the logistic chain. Ports offer services related to infrastructure, cargo, and vessels and navigation. In addition to the port authority, there are other public bodies, state or municipally operated departments or enterprises and private companies, that also provide services and facilities in a port [9]. These actors together form the pricing system in a specific port. A port's scope extends beyond its physical boundaries, encompassing public fairways used by vessels, which incur fairway fees, as well as hinterland connections like railways, roads, and inland waterways.
In principle, pricing system of a port must be balanced to the competitive position of other ports. Pricing can be based on typical strategies with normal competition between ports, intense regional competition, or competition for the same hinterland. However, there are also specific cases where pricing may not be subject to normal competitive principles. Ports may also face little competition or pose minimal competitive pressure [8]. Port serves local industries and is essential for regional development, as it is often the only major economic actor in the area [8]. There are also cases where one port serves different markets (like passenger and bulk) and therefore has different pricing strategies for them. There are cargo flows that the port serves in a highly competitive market and there are cargo flows where the same port faces little competition.
Recently, there has been a fundamental change in port management. Whereas a couple of decades ago, ports were seen as mainly as extension of public authorities, and the objectives of their activities were other than making a profit. Today the ports have increasingly moved towards operating models, acting as commercial enterprises, focusing more on increasing profit/revenue from their activities and by that securing the financial sustainability of port authority [10]. Operating as commercial enterprises and making profit or at least covering the costs, it is understandable that one of the basis of port pricing should be cost-related [8,11,12,13]. In addition, there are additional aspects to consider, like market conditions and external costs like congestion [14] and environmental aspects [15].
Port pricing strategies can be categorized as follows. [12,16,17,18]:
  • Cost-based – based on the cost of products or services plus adding profit margin.
  • Performance-based – based on the utilization of the facility above or below the optimum level with the objective of efficient use of the facility, e.g. berth utilisation.
  • Value-based pricing – products and services are priced on their perceived value to the customer. Cargo groups with different price elasticities are charged differently based on the value of service. The strategy allows the port to promote specific market segments.
  • Competition-based pricing – based on competitors expected or observed price levels
  • Strategic port pricing or market-based pricing – expected market demand is the base for port tariffs.
Whatever the pricing strategy, port customers need to have a clear and unambiguous understanding of what they are paying for. The criteria for port pricing include explainability, longevity, cost-effective construction and operation, as well as being understandable and comparable [1]. It is a common perception that the user pays for the services it uses [13,14]. In ports, we can separate the services that are related to infrastructural services, services to vessels, and cargo, and nautical services [1]. Most important port users are shipping companies (incl. shipping lines), terminal operators, and shippers (importers and exporters) [13]. These companies can be called as “core users” of the port [13] as they are involved with the port’s core business, cargo handling [8], and they are the ones most affected by port pricing.

2.2. Components of Port Fees and Charges

Port fees are levied on ships for marine services provided by the port or another party, e.g., the state. Port visit incurs significant costs to parties providing marine services. Such costs, often referred as marine service costs [12], including constructing and maintaining quays, maintaining public waterways, dredging, maintaining navigational aids, VTS management, assistance in mooring operations, pilotage, towing, etc. To cover their costs, ports and relevant institutions impose a system of charges, collectively referred to as port fees [19].
All port fees can be divided into two broad categories based on their organizational and economic nature: compulsory and service charges. First group, compulsory charges are charges for which no specific quantifiable service is provided and may include ship, dock, port, tonnage, lighthouse, quay, and canal fees. Despite the superficial nature of such charges, they are also related in substance to the safe entry and standing of ships in port [19]. Second group, service charges are charged for the provision of specifically quantifiable services to ships. These are pilotage, towage, mooring, etc. fees [19]. There can also be fees that are charged belonging to the second group, but they are collected as the first group, as compulsory charges, e.g., waste fees.
Waste fees have been introduced recently, with the rising importance of saving the environment to follow the UN’s Sustainable Development Goal 14. The International Maritime Organization and the European Union have taken steps to eliminate and reduce marine litter. One measure to achieve that in European Union is the introduction of compulsory indirect waste fee as part of port fees [20]. The ship can discharge a specified amount of certain types of waste in return for a compulsory fee. More waste than the specified amount or other types of waste must be discharged for an additional fee.
Which party is responsible for the provision of a particular service and who collects a particular port fee is determined by the country's policies and the port's institutional position. For example, in Estonia, the fairway fee is levied by the Transport Administration [5], the pilotage fee by Estonian State Fleet [5], other fees such as tonnage fee and waste fee are levied by port authorities. In the Latvian port Ventspils, the pilotage fee is among the fees collected by the port authority [21].

3. Port Pricing in Case Ports

3.1. Structure of the Port Fees

In our study, we found that the main port fees collected from vessels can be divided into two groups. The first group comprises fees levied by the port authority, and the second group is levied by other public institutions, e.g. customs. Table 1 shows the fees and charges a ship must pay when calling at a port. Services can also be provided to the vessel and charged by the port authority, but the service itself is carried out by a third party. Such is the case in Tallinn, where mooring services are outsourced.
As seen from the table, the port authority is responsible for infrastructure and operations in the port area, apart from pilotage. Pilotage, which is mainly carried out on public waterways, and guaranteeing safe public waterways are the responsibilities of states, for which specific fees are collected by different public institutions.
While calculating criteria of port fees in different ports, they are quite similar, but fairway fee strikes out with different approaches. While in Estonia and Finland the base criteria are vessel size (gross tonnage) and ice-class, in Latvia vessel size (gross tonnage) and vessel type, Sweden’s approach is very different. In Sweden, the fee is based on four components: readiness fee, vessel-based fee, the cargo quantity loaded or unloaded and number of passengers [31]. The amount of the fee depends on the size of the vessel (net tonnage), the environmental category of the vessel, the frequency of visits per month, and the already mentioned loaded and unloaded quantity of cargo and number of passengers. Vessel’s environmental characteristics mostly define the amount of fairway fees. The environmental category is determined based on the verified Clean Shipping Index (CSI) [31].
The diversity of criteria for calculating fees is illustrated by the following list:
  • type of vessel;
  • regular/repeat visit or single visit within a certain period (may be more than one year);
  • usually GT (Estonia, Sweden, Latvia) or NT (Finland, Sweden) of the vessels. In the case of fairway fees, the ice-class;
  • per call, per operation, per time unit, per volume of service provided;
  • in the case of a cargo charge, either weight, volume or unit;
  • in the case of a passenger charge, the passenger (age restriction and other distinctions may apply);
  • the environmental performance of the vessel;
  • the purpose of the port call – loading, unloading, bunkering, etc.
  • a number of surcharges and discounts have been introduced to port fees. These usually apply to general charges. Examples of basis of discounts are:
  • the number of visits during a given period;
  • the direction of the goods and the quantity of goods loaded/unloaded/on board;
  • the number of times the ship has called at ports in the same country;
  • the environmental performance of the ship;
  • minimum/maximum charge limits may apply;
  • non-commercial vessels, certain types of vessels (e.g. fishing vessels), vessels engaged in certain activities/activities or port calls fee to special circumstances may benefit from substantial discounts or be exempted from part of the charges;
  • special permits.
Surcharges can be time-related, e.g. work in winter, evening/night work, weekends or holidays.
In addition, there are environmental port charges. In line with the principles established in the European Union (e.g. Directive (EU) 2019/883 of the European Parliament and of the Council and the European Commission Implementing Regulation (EU) 2022/91) [20,36], in order to preserve the environment, ports have introduced various forms of waste charges, which are compulsory for visiting ships and guarantee the free disposal of a certain amount of waste in port. Admittedly, the amounts may vary from port to port. Additional waste must be paid for separately.
Ports are using different approaches to offer incentives to ships with a lower environmental impact. Such incentives are a way in which countries/ports/port operators can contribute to the development of more environmentally friendly maritime transport. Such incentives are available in the ports of the countries under review:
  • Environmental Ship Index (ESI) - e.g. Tallinn, Stockholm, Helsinki.
  • Clean Shipping Index (CSI) - e.g. Helsinki, Stockholm, Sweden’s fairway fee.
  • Green Award Certificate.
  • Noise level.
  • On investment/innovation verifiable by calculations/measurements – e.g. Helsinki.
  • Rebate depending on the type of fuel used- e.g. Riga - LNG.
  • Equipment on board - e.g. Ventspils, whether certain ships have an incinerator on board.
  • Ship uses shore-side electricity under certain conditions for longer - e.g., Stockholm.
In this list, several indices and certificates stand out, the application for which represents an additional administrative burden for the shipping company. The introduction of different criteria for obtaining the incentives may also increase the administrative burden on the port.

3.2. Calculation of Port Fees

In this study we have calculated port fees are based on public documents and information available on the websites of ports, maritime administrations, and other relevant institutions of Estonia, Finland, Latvia, and Sweden. The port fees and fairway fees were calculated for seven existing vessels (Table 2) to give an overview of the costs in different cases: general cargo vessel, tanker (reduced GT), bulker, ro-ro vessel, passenger ferry, and cruise vessel.
Vessels were selected as examples of the types of vessels calling at case ports, based on the Estonian Electronic Maritime Information System (EMDE) [44] vessel traffic data. The port and fairway fee comparison is based on one single voyage for each type of vessel and, for possible liner vessels, on several voyages. In the case of cargo vessels, the vessel calls at a port to load or unload cargo. Bulkers and tankers are fully loaded, and general cargo vessels are partly loaded. Partially loaded or partly loaded cargo is also the basis for container vessels, ro-ro vessels, and passenger ferries. Partially loaded cargo has also been used in the case of passenger ferries and cruise ships.

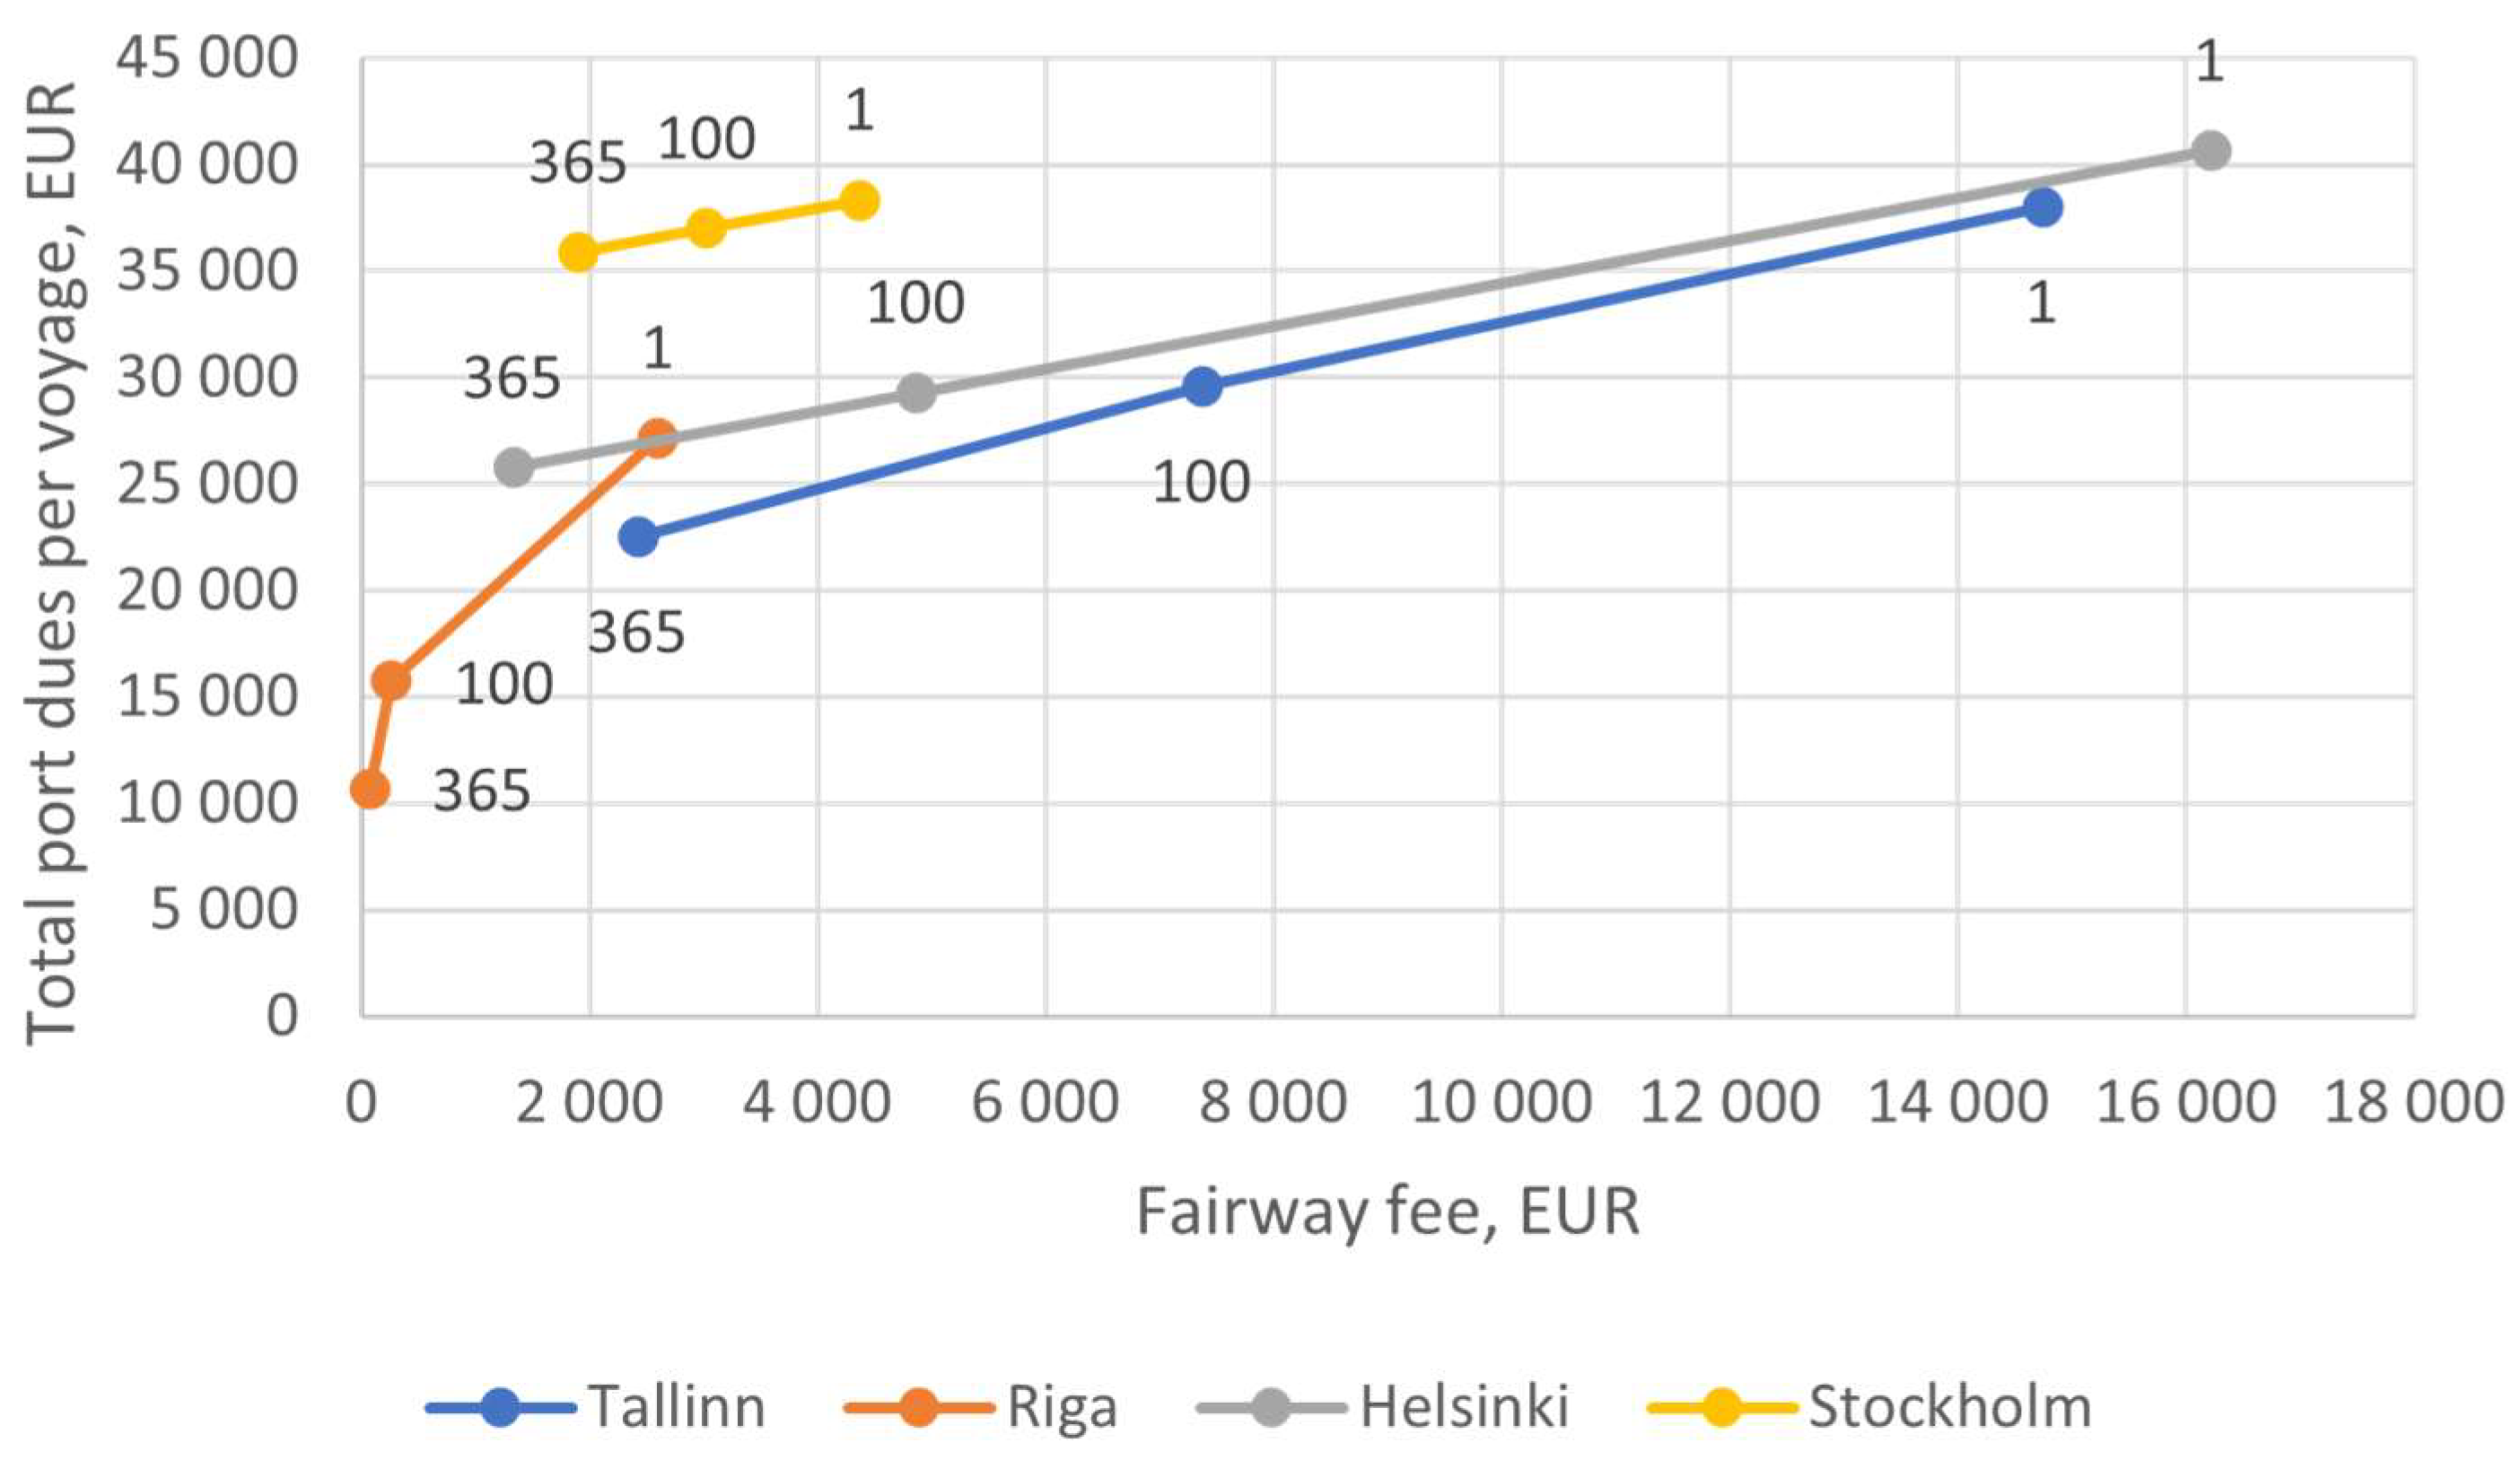
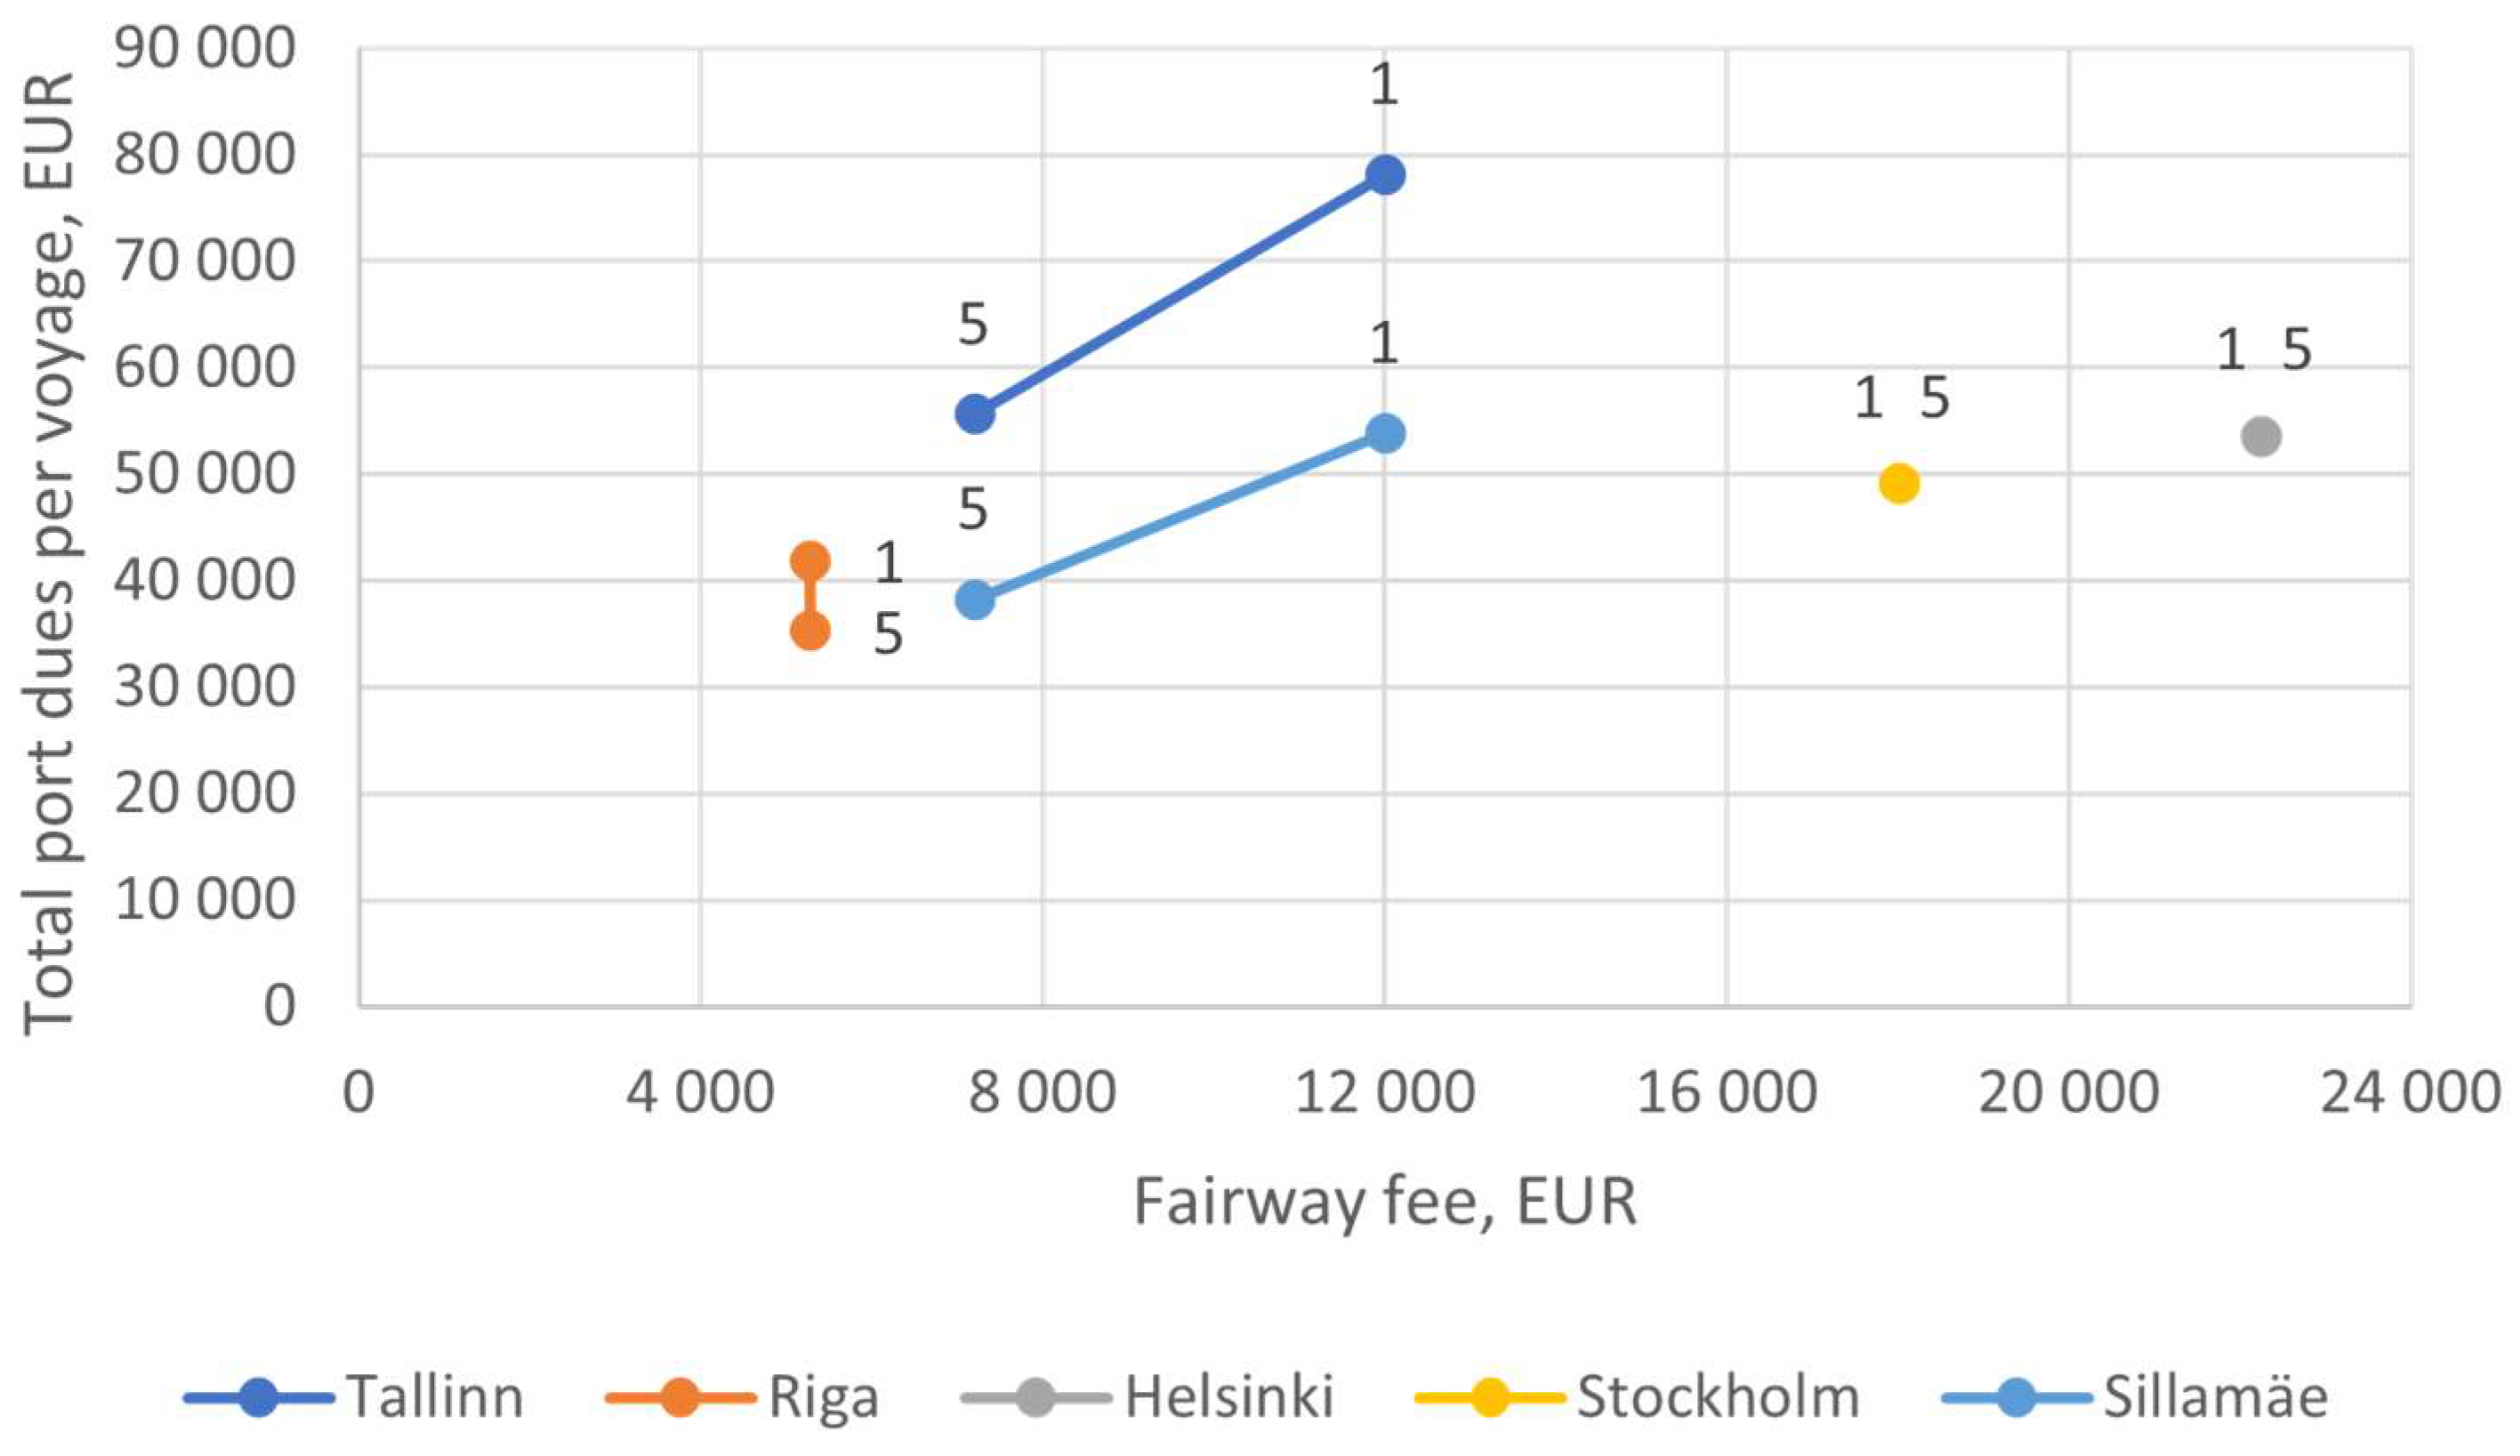
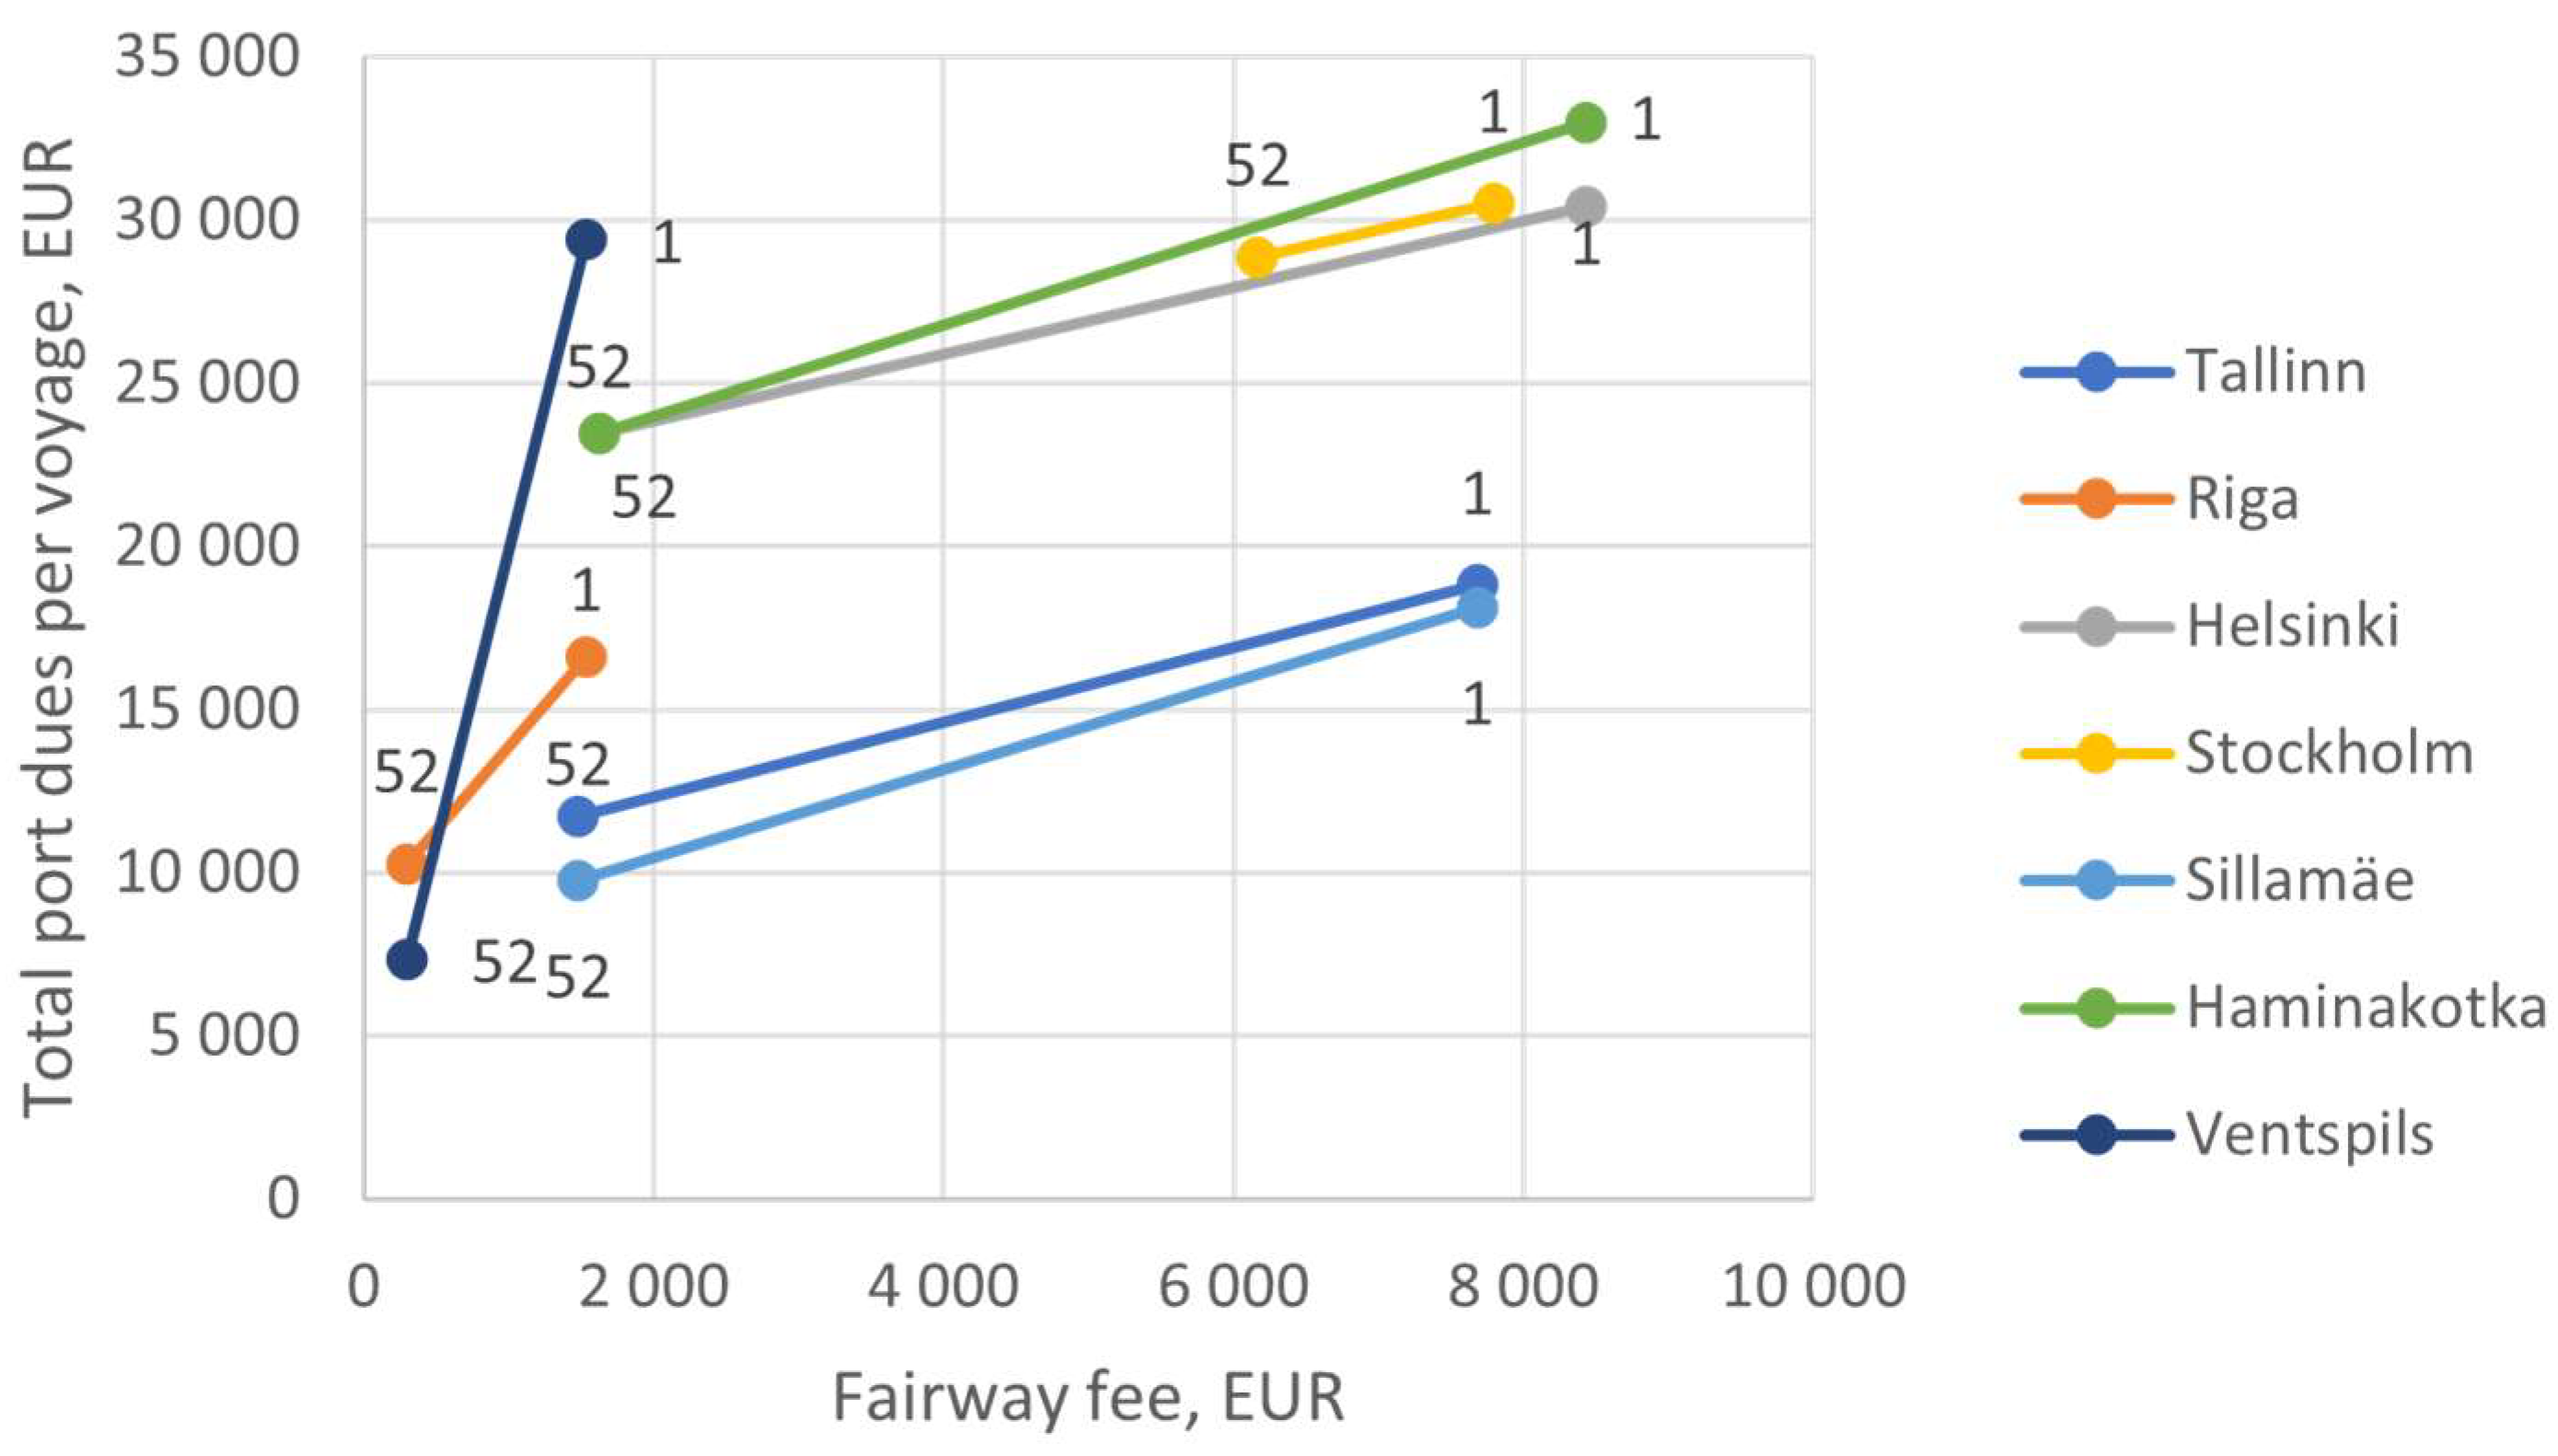
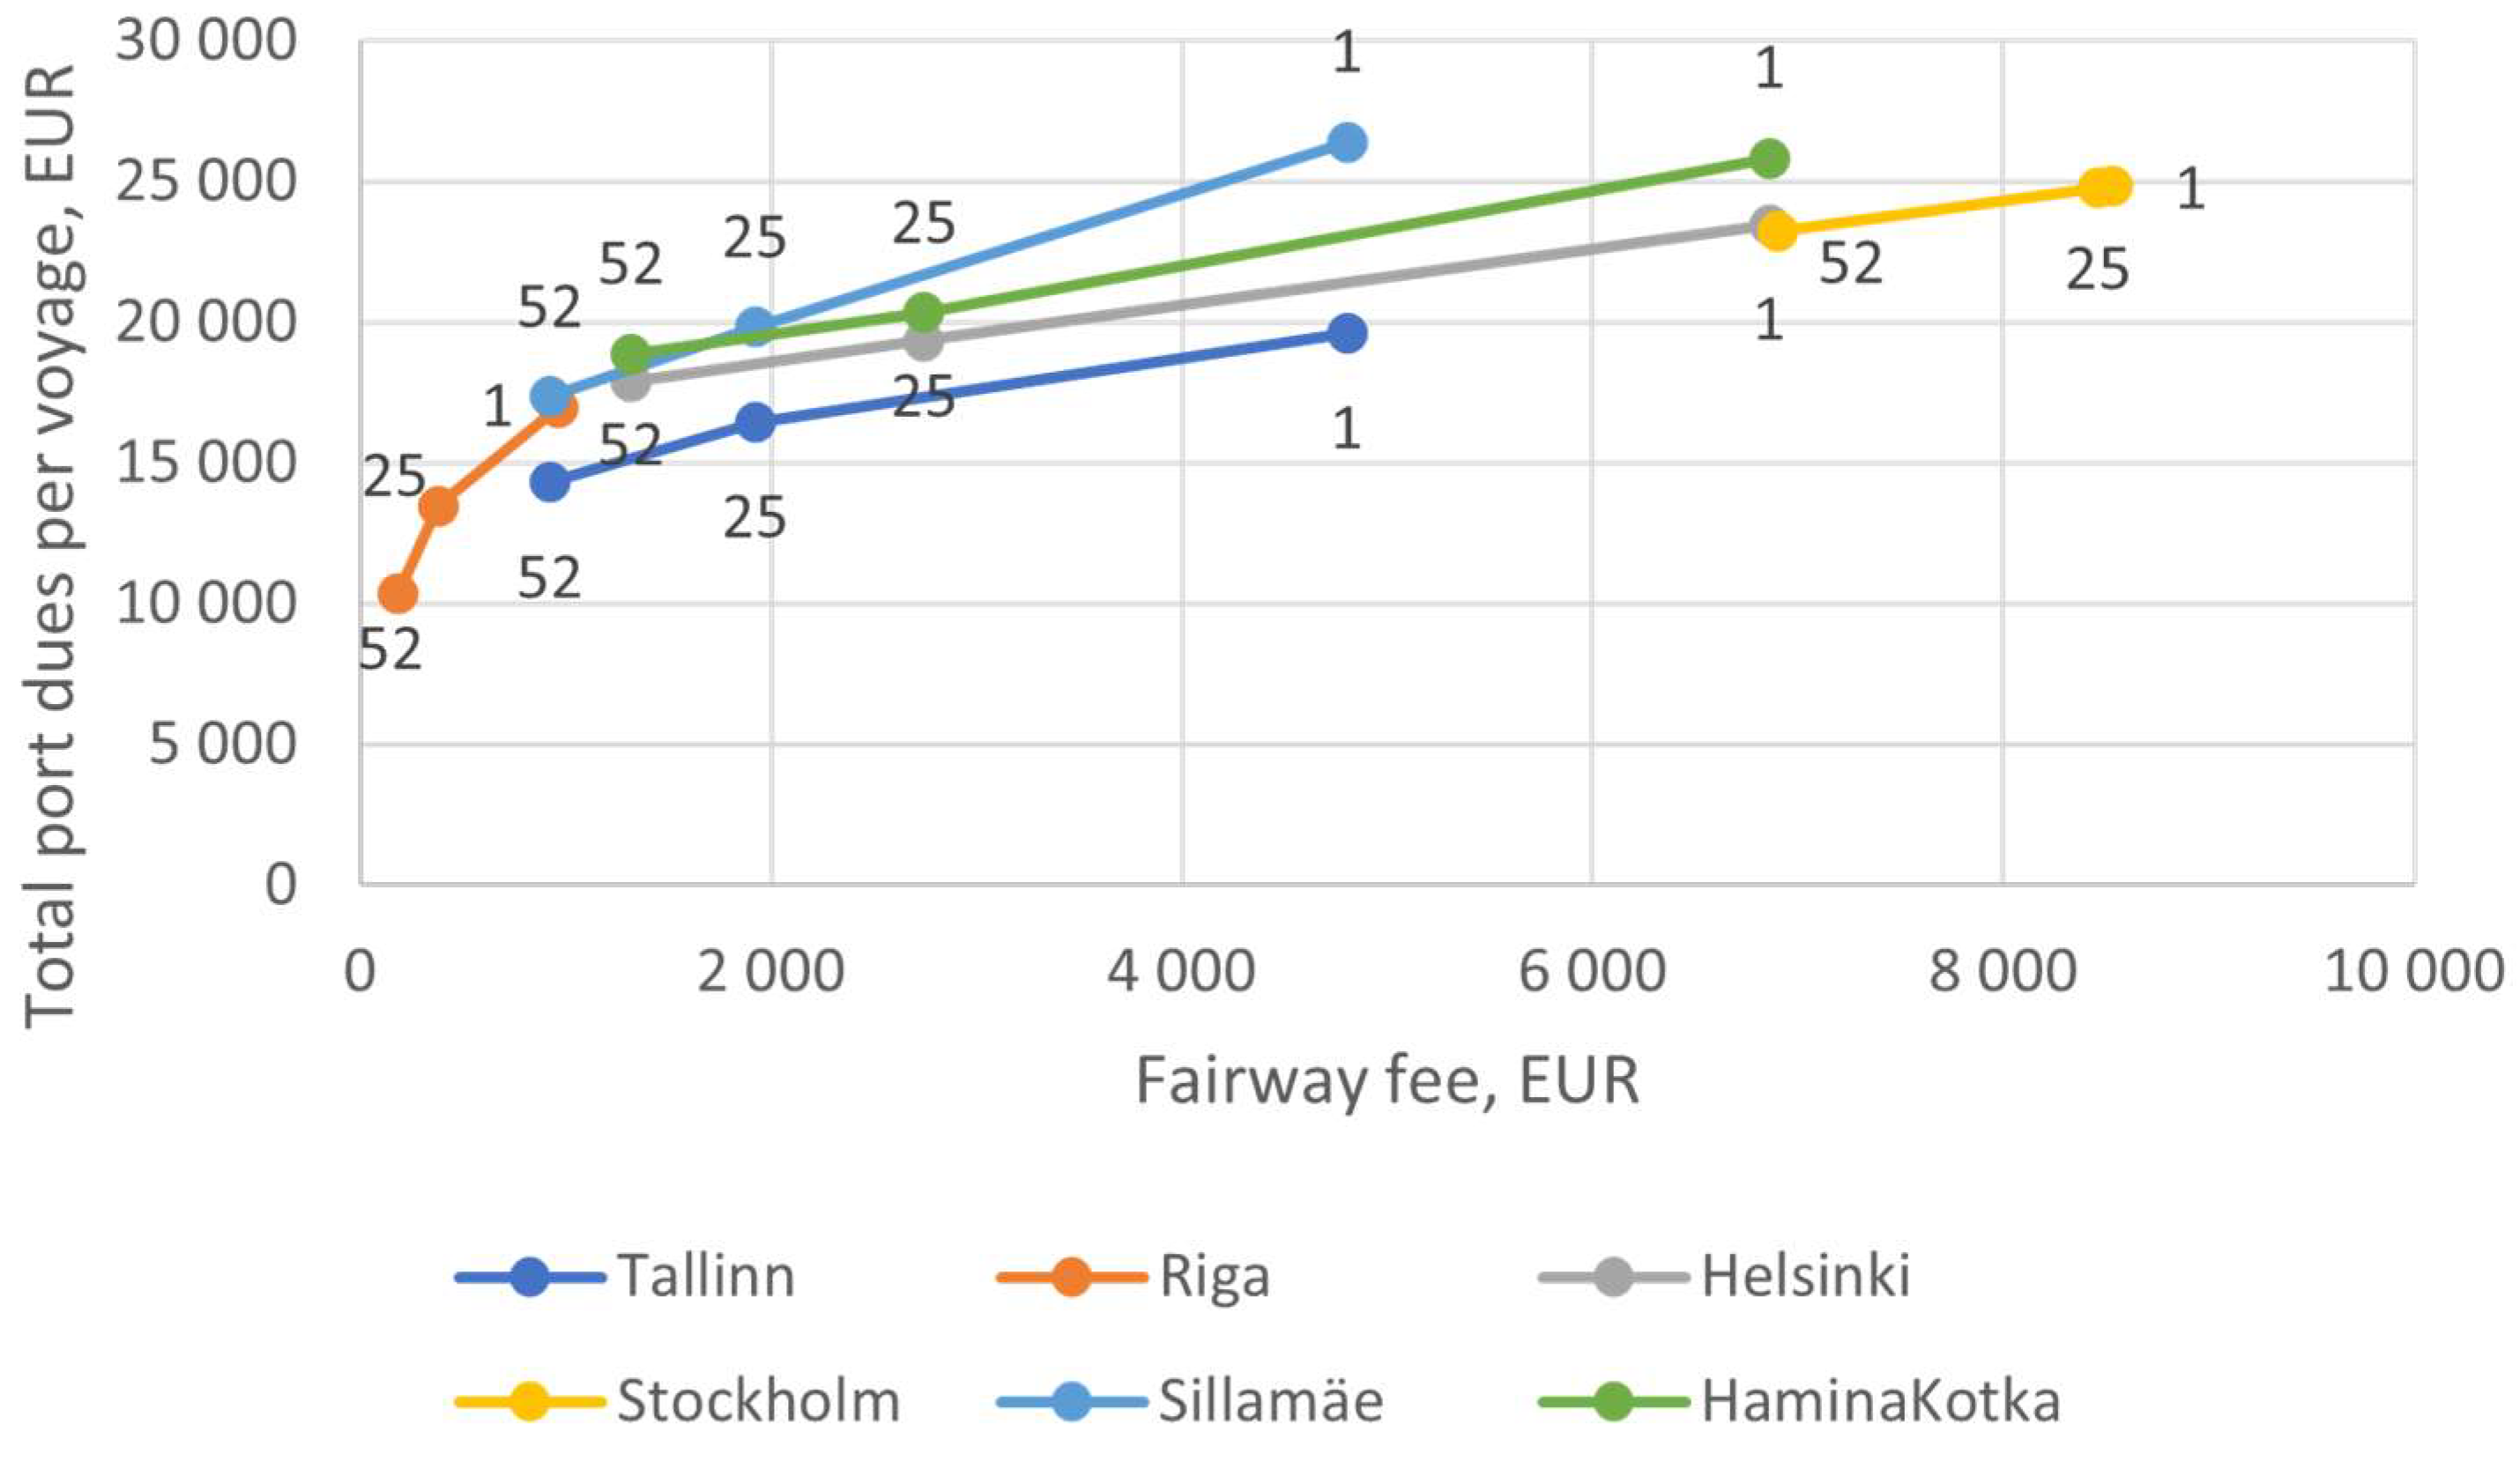
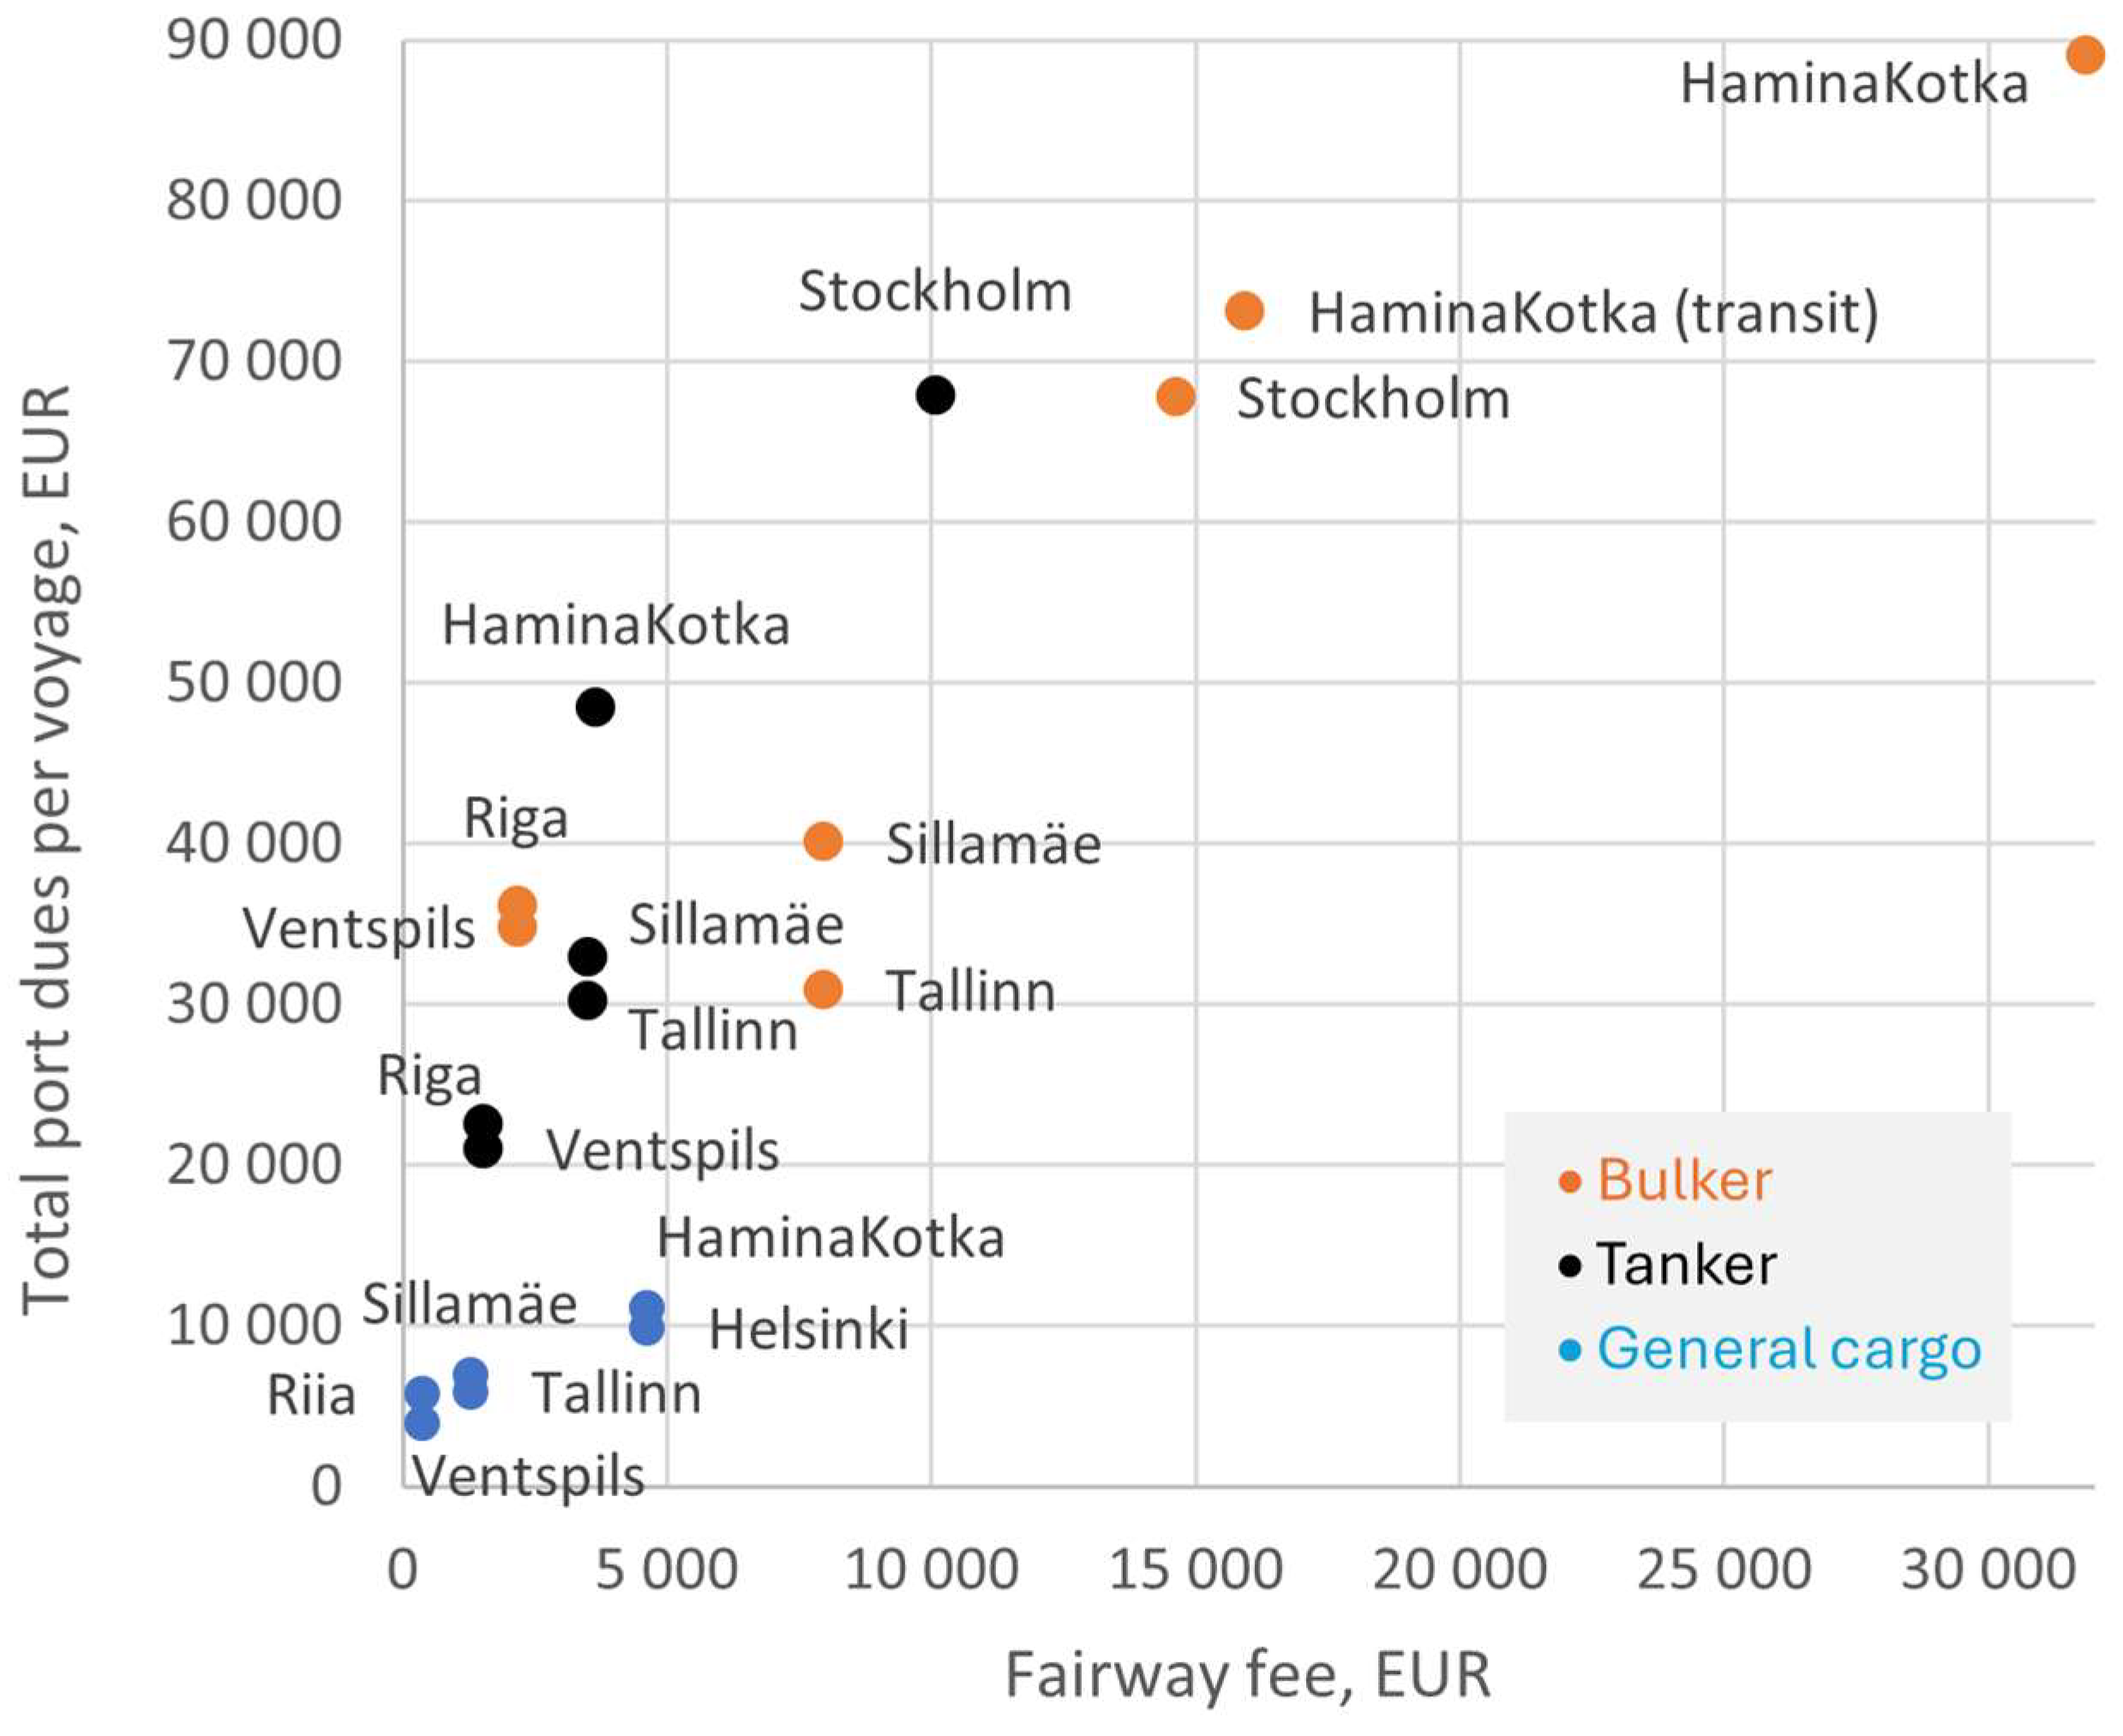
3.3. Comparison of Port Fees

In this study, the passenger ferry ports are Helsinki, Tallinn, Riga, and Stockholm. Passenger ferries are sailing as liner vessels, and therefore we made calculations for both one and several voyages over the accounting period. Due to the unique geographical location of Tallinn and Helsinki ports connecting two mid-size capitals [45], the number of voyages is very high. Demand between those two ports was 7 mln passengers in 2023; before the Covid-19 pandemic, the demand was almost 9 mln passengers [46]. Therefore, these two ports offer significant discounts to vessels on a large number of voyages (Figure 1).
Figure 1 shows total port fees per voyage (including port and fairway fees) and the fairway fee share for a ro-ro passenger vessel. Frequent traffic reduces costs per voyage, with Riga being notably cheaper than other ports.
The cruise industry in the northern Baltic Sea is seasonal, with Helsinki, Riga, Stockholm, and Tallinn playing significant roles in this context. Some of the vessels make more than one visits to the port during the season. Figure 2 shows total port fees per voyage (including port and fairway fees) and the fairway fee share for a cruise vessel. Frequent traffic lowers costs per voyage, while Helsinki and Stockholm are significantly more expensive than other ports.
Ro-ro vessels are vital for regional short sea shipping, benefiting from discounts due to their importance as liner connections (Figure 3). Figure 3 shows total port fees per voyage (including port and fairway fees) and the fairway fee share for a ro-ro vessel. Frequent traffic reduces costs per voyage, with Latvian ports (Riga and Ventspils) being significantly cheaper than others.
Container vessels are key to global trade, making them a highly competitive market for ports. The surveyed ports primarily serve feeder lines, handling import-export cargo flows. All ports offer discounts for container liner vessels, primarily through fairway fees (all countries), tonnage fees (Estonia), vessel fees (Finland), and canal/quay fees (Latvia). However, specific services like pilotage, mooring, and waste management remain undiscounted. Figure 4 shows total port fees per voyage (including port and fairway fees) and the fairway fee share for container vessels. Frequent traffic reduces costs per voyage, with Latvian ports again being the cheapest.
Figure 5 shows that Finnish ports (Helsinki and HaminaKotka) have high fairway fees for bulkers but low fees for general cargo vessels, with fees in Finland based on vessel ice-class. Both the bulker and general cargo vessel in this study have a low ice-class (1C).
While Estonia also calculates fairway fees based on ice-class, the price differences are less pronounced. In Estonia, the highest (1A Super) and lowest (1B, 1C, II, III) ice-class fees differ by 1.25 times, compared to a 9.32-fold difference in Finland. Similarly, the next level (1A) differs by 1.17 times in Estonia and 3.99 times in Finland.

4. Discussion

There is no uniform policy in various countries on how the port fees are collected. Different countries have developed their own systems, with different ports collecting port charges with the same name. In addition, some fees can be collected on governmental level, while others on port level. Usually, on a governmental level, fees are set and collected by public institutions. Other fees are usually set by the port authority or company that is providing the specific service. However, these other collected fees can be set by law as well. As is done in Latvia, where the “Law on Ports” states which fees port authorities may charge [47]. There may not even be a uniform approach within a single country. For example, Estonian ports collect fees for the same purpose with different names and calculation criteria. The latter is especially the case for Estonia's smaller ports, which are not covered in this article.
Comparing port fees between ports in different countries is complex. Ports use different principles and criteria for different ships and different goods. If previously the fees were differentiated mainly according to ship types, goods, and certain characteristics of the ship (e.g. ice-class), then due to greater attention to environmental protection, the differentiation of port fees according to the environmental indicators of ships is starting to be more and more widely used. This diversity of criteria in port fees calculations supports Meersman's [48] argument that port prices involve a complex set of decisions, including discounts, adjustments, and rebates.
Comparing port fees for specific ships and goods provides insights into fee structures but not operational cost differences between ports, as these depend on turnover and investment needs. Ports with lower volumes may deprioritize certain segments, which is reflected in their fee structures. Port fees should be assessed across segments, as competitive dynamics vary.
For cruise vessels, ports like Helsinki, Stockholm, Tallinn, and Riga often serve the same Baltic Sea roundtrips. Ro-ro and container ports primarily handle import-export flows, limiting competition. However, ro-ro vessels may compete with ro-pax vessels for certain flows. In the Baltic container market, cargo destined for one country may be unloaded in another and transported overland, as seen with containers destined for Estonia being offloaded in Riga or Klaipeda.
Bulkers and tankers previously faced intense competition for east-west transit flows (e.g., Estonia, Latvia, Russia, Lithuania) driven by global demand for dry and liquid bulk. These segments provided additional revenue but posed higher environmental risks. Due to the Russian war and sanctions, these cargo flows have largely ceased.
Port and fairway fees follow a general pattern: Latvian ports have the lowest fees, while Finnish and Swedish ports are more expensive than Estonian ports. Similarly, fairway fees are highest in Finland and Sweden and lowest in Latvia. Discounts vary significantly: Swedish ports offer minimal reductions, while Tallinn provides notable discounts for cruise ships. Helsinki and Stockholm do not discount repeat cruise visits. Cruise vessels are subject to fairway fees in Helsinki and Tallinn, but since they typically operate in summer, ice-class fees are avoided. Stockholm’s high fairway fees are partly due to the low environmental category of some cruise vessels.
Fairway fee calculations differ by country. Finland and Sweden base fees on net tonnage (NT), while Estonia and Latvia use gross tonnage (GT). Ice-class significantly impacts fees in Finland and Estonia, with high ice-class vessels benefiting from lower rates. For example, in Finland, fees for 1A Super ice-class vessels are 9.32 times lower than for lower classes, compared to a 1.25-fold difference in Estonia.
Sweden uses an environmentally driven fee system, offering up to €10,000 in vessel-based discounts in 2022. In 2023, updated principles tied readiness fees to environmental categories, allowing reductions of up to 90%. These environmental incentives demonstrate a clear push toward greener shipping practices (Figure 6).
Our study highlights that fairway fees, regulated and collected by countries, are a key component of port pricing and serve as a policy implementation tool. In Sweden, fairway charges are based on a vessel's environmental performance, allowing more environmentally friendly ships with similar operational characteristics to pay significantly lower fees. In contrast, Estonia adjusted its fairway charges during the COVID-19 pandemic, initially exempting vessels from these fees and subsequently reducing them incrementally by 50%, 37.5%, and 15% [51].
Port fees are typically justified based on costs, but various pricing strategies are employed. Infrastructure investments, such as fairways, are not directly allocatable to individual users, as the required investment and maintenance remain constant regardless of usage levels. For liner shipping, calculating the cost per voyage becomes complex with an increasing number of voyages.
Ports adjust discounts based on the specific characteristics of the routes, including voyage duration, frequency, passenger and vehicle volumes, and other factors. For instance, a passenger ferry making frequent use of fairways does not proportionally increase fairway maintenance costs. Consequently, discounts for higher numbers of visits are justified. These discounts not only reduce pressure on ferry ticket prices but also encourage greater utilization of ferry services.
Notteboom et al. [1] emphasized that stable pricing development requires a stable environment. In cases of prolonged disruptions, such as significant changes in cargo flows or vessel traffic, a review of pricing strategies for certain cargo groups or service segments may become necessary. When pricing is cost-based, adverse long-term events that reduce traffic should justify adjustments, including increasing fees for other user groups.
Our study found no single unified strategy for port fees, nor a consistent structure for port and fairway fees across the studied countries. Port authority fees are primarily value-based, with tariff rates varying by vessel type or cargo (e.g., vessel fees, compulsory waste management fees). In contrast, specific services such as mooring and pilotage are typically cost-based. Notably, before the COVID-19 pandemic and the imposition of Russian sanctions, there was intense competition among regional ports to attract bulker and tanker trade.
Fairway fees, although named differently in each country, are designed to ensure maritime safety and are generally cost-based. However, long-term stability in fee structures can be affected by changes in vessel traffic volumes, potentially leading to cost imbalances. Fairway fees also serve as tools for state policy implementation. For example, Sweden incorporates environmental components into fairway fee calculations to incentivize the use of environmentally friendly vessels, demonstrating a long-term policy approach that aligns with sustainability goals.
Other countries have also adjusted fairway fees in response to economic and environmental challenges. Estonia's significant discounts during the COVID-19 pandemic represent a short-term policy adjustment aimed at maintaining shipping activity. Similarly, Finland halved fairway fees in 2015 to offset increased shipping costs from mandatory sulfur emission reductions. While this reduction has been extended several times, it is expected to end by late 2024, potentially making Finnish fairway fees the highest in our comparison [52].
These examples highlight the role of fairway fee policies in balancing economic stability with environmental objectives. The integration of sustainability-driven incentives, such as Sweden’s differentiated fees, provides a model for encouraging cleaner maritime transport. Moving forward, harmonized approaches to fairway fee structures that reward sustainable shipping practices could enhance both economic resilience and environmental responsibility in the Baltic Sea region.
This study focused on Baltic Sea ports, offering insights into regional port pricing strategies. For future research, we recommend expanding the analysis to include ports in other regions and vessel types. For instance, comparing pricing strategies for large deep-sea container vessels would provide valuable insights. In addition, a case study on deep-sea container ports could reveal how international ports design and justify their port and fairway fees within a broader global context.

Author Contributions

Conceptualization, U.T.; methodology, T.H.; formal analysis, T.H.; investigation, T.H.; data curation, T.H.; writing—original draft preparation, T.H.; writing—review and editing, U.T., J.K.; visualization, T.H.; supervision, U.T, J.K. All authors have read and agreed to the published version of the manuscript.

Funding

This research received funding from Horizon-Widera-2023-Access-02-02 under the grant agreement no. 101159424 project titled '' Twinning to enable Baltic Sea vessels to meet Fit-for-55 regulations'' by the European Research Executive Agency (REA) delegated by the European Commission. The views and opinions expressed are those of the author(s) only and do not necessarily reflect those of the European Union or REA. Neither the European Union nor the granting authority can be held responsible for these views and opinions."

Data Availability Statement

Data for the figures presented in this paper can be acquired from the authors.

Conflicts of Interest

The authors declare no conflicts of interest.

Abbreviations

The following abbreviations are used in this manuscript:
CSI Clean Shipping Index
DWT Deadweight
EMDE Estonian Electronic Maritime Information System
ESI Environmental Ship Index
EU European Union
EUR Euro
GT Gross Tonnage
NT Net Tonnage
lm Lane Meter
LNG Liquified Natural Gas
m Metre (UK) /meter (US)
mln Million
RGT Reduced Gross Tonnage
ro-ro Roll on-roll off
TEU Twenty Foot Equivalent Unit
UN United Nations
VTS Vessel Traffic Services

References

  1. T. Notteboom, A. Pallis, and J.-P. Rodrigue, Port Economics, Management and Policy, 1st ed. London: Routledge, 2022. [Online]. [CrossRef]
  2. FINLEX ® - Ajantasainen lainsäädäntö: Laki Väylävirastosta 862/2009. Oikeusministeriö, Edita Lakitieto Oy. Accessed: Feb. 07, 2025. [Online]. Available: https://finlex.fi/fi/laki/ajantasa/2009/20090862.
  3. “Transpordiameti põhimäärus–Riigi Teataja.” Accessed: Feb. 07, 2025. [Online]. Available: https://www.riigiteataja.ee/akt/109122020001?leiaKehtiv.
  4. “Meresõiduohutuse seadus–Riigi Teataja.” Accessed: Feb. 07, 2025. [Online]. Available: https://www.riigiteataja.ee/akt/MSOS.
  5. “Maritime Safety Act–Riigi Teataja.” Accessed: Apr. 05, 2024. [Online]. Available: https://www.riigiteataja.ee/en/eli/511012024001/consolide.
  6. G. Sootla, L. Kalev, and K. Kattai, Eds., Avalik poliitika. I, Avaliku poliitika kujundamise protsess. Tallinn: TLÜ Kirjastus, 2021. Accessed: Feb. 07, 2025. [Online]. Available: https://www.digar.ee/arhiiv/nlib-digar:994949.
  7. Parliament of Estonia, “Riigi 2020. aasta lisaeelarve seadusega seonduvate seaduste muutmise seadus (COVID-19 haigust põhjustava koroonaviiruse levikuga seotud meetmed) 169 SE,” Riigikogu. Accessed: Feb. 03, 2025. [Online]. Available: https://www.riigikogu.ee/tegevus/eelnoud/eelnou/cad9e912-b0d8-428d-be1f-b14e22ed5ecd/riigi-2020.-aasta-lisaeelarve-seadusega-seonduvate-seaduste-muutmise-seadus-covid-19-haigust-pohjustava-koroonaviiruse-levikuga-seotud-meetmed/.
  8. H. E. Haralambides, “Competition, Excess Capacity, and the Pricing of Port Infrastructure,” Marit Econ Logist, vol. 4, no. 4, pp. 323–347, Dec. 2002. [CrossRef]
  9. U. Tapaninen, Maritime transport : shipping logistics and operations. London [etc.]: Kogan Page, 2020.
  10. Meyiwa and M. Chasomeris, “South Africa’s port doctrine: dilemmas and the way forward,” Maritime Studies, vol. 19, no. 2, pp. 179–191, Jun. 2020. [CrossRef]
  11. H. Haralambides, E. Musso, and M. Benacchio, “Port Financing and Pricing in the European Union: Theory, Politics and Reality,” Maritime Economics and Logistics, vol. 3, pp. 368–386, Dec. 2001. [CrossRef]
  12. S. E. Mthembu and M. Chasomeris, “Revisiting marine services pricing in South Africa’s ports,” WMU Journal of Maritime Affairs, vol. 23, no. 1, pp. 5–24, Mar. 2024. [CrossRef]
  13. R. Van Den Berg, P. W. De Langen, and P. C. J. Van Zuijlen, “Revisiting port pricing; a proposal for seven port pricing principles,” WMU J Marit Affairs, vol. 16, no. 3, pp. 421–438, Sep. 2017. [CrossRef]
  14. M. Acciaro, “A Critical Review of Port Pricing Literature: What Role for Academic Research?,” The Asian Journal of Shipping and Logistics, vol. 29, no. 2, pp. 207–228, Aug. 2013. [CrossRef]
  15. R. Bergqvist and N. Egels-Zandén, “Green port dues — The case of hinterland transport,” Research in Transportation Business & Management, vol. 5, pp. 85–91, Dec. 2012. [CrossRef]
  16. “Comparative analysis of port tariffs in the ESCAP region.” 2002. [Online]. Available: https://hdl.handle.net/20.500.12870/2916.
  17. Hinterhuber, “Customer value-based pricing strategies: why companies resist,” Journal of Business Strategy, vol. 29, no. 4, pp. 41–50, Jan. 2008. [CrossRef]
  18. Lavissiere, “Vessel Port Dues: An Influence from Path Dependency rather than Geography of Ports,” The Asian Journal of Shipping and Logistics, vol. 34, no. 2, pp. 61–70, Jun. 2018. [CrossRef]
  19. Eidast, Meretranspordi kommertsekspluatatsioon. Tallinn: Tallinn : Eesti Mereakadeemia, 2007.
  20. Directive (EU) 2019/883 of the European Parliament and of the Council of 17 April 2019 on port reception facilities for the delivery of waste from ships, amending Directive 2010/65/EU and repealing Directive 2000/59/EC (Text with EEA relevance), vol. 151. 2019. Accessed: Dec. 02, 2022. [Online]. Available: http://data.europa.eu/eli/dir/2019/883/oj/eng.
  21. “Port Fees and Rules - Freeport of Ventspils authority.” Accessed: Oct. 10, 2022. [Online]. Available: https://www.portofventspils.lv/en/port-services/port-fees-and-rules/.
  22. “Port Dues | Freeport of Riga Authority.” Accessed: Oct. 10, 2022. [Online]. Available: https://rop.lv/en/port-dues.
  23. “Information Regarding Navigation Due For Vessels Entering Latvian Ports.” Cabinet of Ministers of the Republic of Latvia, Dec. 21, 2021. Accessed: Dec. 05, 2022. [Online]. Available: https://www.lja.lv/sites/default/files/pricelist_attachments/Navigation_due_2022.docx.
  24. “Price List 2022 | Helsinki.” Port of Helsinki, 2021. Accessed: Sep. 08, 2022. [Online]. Available: https://www.portofhelsinki.fi/sites/default/files/attachments/Price%20List%202022_0.pdf.
  25. “Additional information and implementation guidelines concerning the environmental discount 2022.” Port of Helsinki, 2021. Accessed: Sep. 08, 2022. [Online]. Available: https://www.portofhelsinki.fi/sites/default/files/attachments/Additional%20information%20and%20implementation%20guidelines%20concerning%20the%20environmental%20discount%20_2022.pdf.
  26. “Fairway dues - Finnish Customs,” Tulli. Accessed: Oct. 12, 2022. [Online]. Available: https://tulli.fi/en/businesses/transport-and-warehousing/fairway-dues.
  27. “Pilotage fees,” Finnpilot. Accessed: Nov. 12, 2022. [Online]. Available: https://finnpilot.fi/en/for-customers/pilotage-fees/.
  28. “Prices for services/tariffs - portsofstockholm.com.” Accessed: Sep. 16, 2022. [Online]. Available: https://www.portsofstockholm.com/about-us/prices-for-servicestariffs/.
  29. “price-list-2022_eng.pdf.” Accessed: Jul. 16, 2024. [Online]. Available: https://www.sjofartsverket.se/contentassets/ac04e861247b4019a9c0a9ea848904f3/price-list-2022_eng.pdf.
  30. “sjofartsverkets-foreskrifter-sjofs-2022-2-om-tillhandahallande-av-lots-lotsbestallning-tilldelning-av-lots-och-lotsavgifter---english-version.pdf.” Accessed: Jul. 16, 2024. [Online]. Available: https://www.sjofartsverket.se/globalassets/om-sjofartsverket/lagrum/oversatta-forfattningar/sjofartsverkets-foreskrifter-sjofs-2022-2-om-tillhandahallande-av-lots-lotsbestallning-tilldelning-av-lots-och-lotsavgifter---english-version.pdf.
  31. “Dues and fees.” Accessed: Jul. 03, 2024. [Online]. Available: https://www.sjofartsverket.se/en/about-us/about-the-swedish-maritime-administration/dues-and-fees/#fairway-dues.
  32. “Lootsitasud — Eesti loots.” Accessed: Oct. 10, 2022. [Online]. Available: https://www.loots.ee/lootsitasud/.
  33. “Sadamatasud_al_01_05_2022_002_.pdf.” Accessed: Jul. 16, 2024. [Online]. Available: https://www.ts.ee/wp-content/uploads/2022/05/Sadamatasud_al_01_05_2022_002_.pdf.
  34. “silport_sadamaeeskirjad.pdf.” Accessed: Jul. 16, 2024. [Online]. Available: https://www.silport.ee/silport_sadamaeeskirjad.pdf?rand=77.
  35. “Maritime Safety Act–Riigi Teataja.” Accessed: Sep. 28, 2022. [Online]. Available: https://www.riigiteataja.ee/en/eli/ee/520122021001/consolide.
  36. Commission Implementing Regulation (EU) 2022/91 of 21 January 2022 defining the criteria for determining that a ship produces reduced quantities of waste and manages its waste in a sustainable and environmentally sound manner in accordance with Directive (EU) 2019/883 of the European Parliament and of the Council (Text with EEA relevance), vol. 015. 2022. Accessed: Dec. 02, 2022. [Online]. Available: http://data.europa.eu/eli/reg_impl/2022/91/oj/eng.
  37. “ABS: American Bureau of Shipping.” Accessed: Jun. 21, 2024. [Online]. Available: https://absrecord.eagle.org/#/absrecord/details.
  38. “DNV Vessel Register.” Accessed: Jun. 21, 2024. [Online]. Available: https://vesselregister.dnv.com/vesselregister/details/32300.
  39. “DNV Vessel Register.” Accessed: Jun. 21, 2024. [Online]. Available: https://vesselregister.dnv.com/vesselregister/details/23655.
  40. “DNV Vessel Register.” Accessed: Jun. 21, 2024. [Online]. Available: https://vesselregister.dnv.com/vesselregister/details/G113538.
  41. “DNV Vessel Register.” Accessed: Jun. 21, 2024. [Online]. Available: https://vesselregister.dnv.com/vesselregister/details/31618.
  42. “Fleet,” Hansa Shipping AS. Accessed: Jun. 21, 2024. [Online]. Available: https://www.hansashipping.ee/fleet.
  43. “Megastar - Tallink Silja Line.” Accessed: Jun. 21, 2024. [Online]. Available: https://www.tallink.com/fleet/fast-vessels/megastar.
  44. “Electronic Maritime Information System / TRANSPORDIAMET.” Accessed: Aug. 06, 2022. [Online]. Available: https://www.emde.ee/pm5052/vi-.
  45. U. Tapaninen and R. Palu, “Recovery of ro-pax ferry traffic from covid-19 under tightening environmental regulations: case Helsinki-Tallinn,” Journal of Shipping and Trade, vol. 7, no. 1, p. 10, May 2022. [CrossRef]
  46. “Key Figures,” Port of Tallinn. Accessed: Jun. 14, 2024. [Online]. Available: https://www.ts.ee/en/investor/key-figures/.
  47. “Ostu likums,” LIKUMI.LV. Accessed: Apr. 10, 2024. [Online]. Available: https://likumi.lv/doc.php?id=57435.
  48. H. Meersman, S. P. Strandenes, and E. van de Voorde, “Port Pricing: Principles, Structure and Models,” SSRN Journal, 2014. [CrossRef]
  49. “BV Fleet | Marine & Offshore.” Accessed: Jul. 16, 2024. [Online]. Available: https://marine-offshore.bureauveritas.com/bv-fleet/#/bv-fleet/.
  50. “v.3-price-list-fairway-and-pilot-fees-2024.pdf.” Accessed: Jul. 18, 2024. [Online]. Available: https://www.sjofartsverket.se/globalassets/tjanster/anlopstjanster/avgiftsforandringar-2024/v.3-price-list-fairway-and-pilot-fees-2024.pdf.
  51. Transpordi ja liikuvuse programm 2024-2027. 2024. Accessed: Jul. 18, 2024. [Online]. Available: http://data.europa.eu/eli/dir/2019/883/oj/eng.
  52. “Esitys väylämaksulain muuttamisesta lausunnoille,” Valtioneuvosto. Accessed: Jul. 24, 2024. [Online]. Available: https://valtioneuvosto.fi/-/1410829/esitys-vaylamaksulain-muuttamisesta-lausunnoille.
Figure 1. Ro-Pax vessel’s fairway fees total port fees per voyage in EUR for 1, 100 and 365 voyages, 2022.
Preprints 149389 g001
Figure 2. Cruise vessel’s fairway fees as a percentage of total port fees and port fees per voyage in EUR for 1 and 5 voyages, 2022.
Preprints 149389 g002
Figure 3. Ro-ro vessel’s fairway fees as a percentage of total port fees and port fees per voyage in EUR for 1 and 52 voyages, 2022.
Preprints 149389 g003
Figure 4. Container vessel’s fairway fees as a percentage of total port fees and port fees per voyage in EUR for 1, 25 and 52 voyages, 2022.
Preprints 149389 g004
Figure 5. Fairway fees and total port fees per voyage for bulkers, tankers and general cargo vessels in EUR, 2022.
Preprints 149389 g005
Figure 6. Variation in the amount of the Swedish fairway fees’ vessel-based and readiness components in 2022 and 2024 due to the environmental category, in EUR, based on the passenger ferry net tonnage.[29,49,50].
Preprints 149389 g006
Table 1. Fees paid by vessel visiting ports and main calculation criteria in 2022. Sources: Compiled by authors based on sources [21,22,23,24,25,26,27,28,29,30,31,32,33,34,35].
Fee type Estonia Latvia Finland Sweden Alternative term used
Tallinn Sillamäe Riga Ventspils Helsinki Hamina Kotka Stockholm
Vessel fee GT, vessel type GT, vessel type GT, vessel type NT cargo or passenger vessel NT cargo or passenger vessel GT tonnage fee; vessel charge
Canal fee GT, vessel type GT
Berth(ing) fee GT, vessel type GT
Waste management charges GT, vessel type GT, vessel type GT, vessel type Vessel type, GT, staying time span NT, cargo or passenger vessel NT, cargo or passenger vessel Fixed, GT, m3, ton waste fee; sanitary fee; solid waste + sewage + oil-containing waste originating from engine room
Mooring and unmooring carges Per operation, GT range Per operation, GT range, vessel type Per operation, GT range Per operation, GT range Per operation, NT range Per operation, NT range Per operation, vessel length, time
Passenger fee Passenger Passenger Passenger Passenger Passenger Passenger passenger
Cargo charge Cargo unit* Cargo unit/ ton Cargo unit/ ton Cargo unit/ ton/ lm * vehicle cargo charge
Pilotage charge GT range, pilotage in port+ distance 1 GT range, pilotage in port+ distance 1 GT, operation, (+ distance on sea if needed) NT range, base fee+ distance 3 NT range, base fee+ distance 3 NT range, base fee+ distance 2
Fairway fee GT, ice-class 2 GT, ice-class 2 GT, vessel type 2 GT, vessel type 2 NT, ice-class, amount of cargo 4 NT, ice-class, amount of cargo 4 NT range, vessel’s environmental category, goods/passengers 2 fairway due,
waterway fee/due, navigation fee/due
Remarks: Colours: Port Authority; Public Institution – Maritime Administration; Public Institution – Other institution. GT – Gross Tonnage. NT – Net Tonnage. 1 – until 1st of July 2023 service was provided by AS Eesti Loots (government-owned company), since 2023 Estonian State Fleet. 2 - Maritime Administration of the respective country (Estonian Transport Administration, Latvijas Jūras administrācija, Sjöfartsverket). 3 – Finnpilot. 4 – Customs organization (Tulli).
Table 2. Vessels’ characteristics. Sources: [37,38,39,40,41,42,43].
General Cargo vessel Container vessel Tanker Bulker Ro-ro vessel Cruise vessel Passenger Ferry
Length, m 100.71 170.02 169.5 187 187.06 293.2 212
GT 3610 16023 15980 22746 25609 99526 49134
RGT 12748
NT 1783 6251 7777 12344 7682 63078 15621
DWT 5164 20073 25117 36746 11702 7900 6080
TEU 1440 156
Passengers 2506 2800
Ro-ro capacity, lm 3322 3653
Ice-class 1C 1A 1A Super 1C 1A --- 1A
Remarks: RGT – Reduced Gross Tonnage; DWT – Deadweight; TEU – Twenty Foot Equivalent Unit; lm – lane meters.
Disclaimer/Publisher’s Note: The statements, opinions and data contained in all publications are solely those of the individual author(s) and contributor(s) and not of MDPI and/or the editor(s). MDPI and/or the editor(s) disclaim responsibility for any injury to people or property resulting from any ideas, methods, instructions or products referred to in the content.
Copyright: This open access article is published under a Creative Commons CC BY 4.0 license, which permit the free download, distribution, and reuse, provided that the author and preprint are cited in any reuse.

Downloads

34

Views

32

Comments

0

Subscription

Notify me about updates to this article or when a peer-reviewed version is published.

Email

Prerpints.org logo

Preprints.org is a free preprint server supported by MDPI in Basel, Switzerland.

Subscribe

© 2025 MDPI (Basel, Switzerland) unless otherwise stated