
Submitted:
29 January 2025
Posted:
17 February 2025
You are already at the latest version
Abstract
Objective: The objective was to assess the differences about the prevalence of high blood pressure values in adolescents by applying the 2016 ESH and the 2017 AAP hypertension guidelines and analyze the relationship of pressure increases with lifestyles and potentially risky behaviors, which in Italy are little investigated.
Design and method: Blood pressure levels of 1301 students aged between 13 and 20 were recorded. Two questionnaires were administered, one related to anamnestic data and anthropometric parameters and a second one, combined with the measurement of blood pressure, investigated the prevalence of hypertension and its relationship with lifestyle. Three blood pressure and heart rate measurements were taken and the average of these measurements was calculated. For the diagnosis of increased blood pressure both ESH and AAP criteria were considered. For the definition of the height centiles as well as for the BMI, reference was made to the tables produced by WHO 2007.
Results: The main result concern the greater prevalence of high blood pressure values by applying new AAP criteria (14,8%) than ESH guidelines (7,5%). In our study we found significant correlation of systolic values and anthropometrics variables: weight (r = 0,342) height (r = 0,321) and BMI (r = 0,318) in the entire population. The condition of overweight in hypertensive subjects in comparison to normotensive was evident, while the prevalence of obesity despite being tendentially greater in hypertensives was not significantly higher. Higher SBP (systolic blood pressure) and DBP (diastolic blood pressure) values are associated with a higher mean heart rate (88 ± 18 bpm). No significant correlations was found with smoking, height and sex.
Conclusions: At the best of our knowledge, this study is the first in our country, which investigates the prevalence of hypertension in adolescents, after the publication of 2017 AAP guidelines. Results shows how hypertension is not a rare phenomenon in this age group and confirm that it deserves more attention and following studies.
Keywords:
hypertension
; juvenile hypertension
; adolescents
; HT Guidelines
1. Introduction
In recent years, the notion that primary or essential hypertension is not a rare condition in the pediatric population has become well-established. It is now recognized as the most prevalent form of hypertension in this age group, with both its incidence and prevalence showing an upward trend. The definition of normal blood pressure values in pediatric patients is complicated by the close correlation between blood pressure and growth parameters, such as height and weight. Consequently, it is essential to establish normative criteria based on age- and height-specific percentiles, which should ideally be derived from data collected in the relevant geographical populations. However, in last years, even in Italy, the percentiles developed from North American pediatric populations have been employed. More recently, the European Society of Hypertension (2016) and the American Academy of Pediatrics (AAP) (2017) released updated guidelines for the screening and management of hypertension in children and adolescents [1,2]. These guidelines differ not only from one another but also from the American guidelines established in 2004, leading to considerable uncertainty and confusion among pediatricians and healthcare professionals managing hypertensive children. Few studies have systematically compared the effects of reclassifying blood pressure values based on the application of these two distinct sets of guidelines, particularly within the adolescent population.
The aim of our study was to assess the prevalence of elevated blood pressure values as estimated according to both the most recent both American and European guidelines, and to analyze the relationship between blood pressure increases and lifestyle factors and potentially risky behaviors in adolescents from a school-based population in Western Sicily.
2. Materials and Methods
The study was conducted using data collected during the XV World Hypertension Day in May 2019, which involved measuring blood pressure values and interviewing students from seven secondary schools in Western Sicily. After obtaining written informed consent from the parents for the evaluation of their children, 1301 students aged between 13 and 20 years, enrolled in the aforementioned schools, were recruited. The students were administered a questionnaire consisting of questions related to their medical history and anthropometric parameters, a tool that has been used for several years during World Hypertension Day events (Attachment 1). Additionally, a second, more comprehensive questionnaire was provided, partly based on the one used in the I-Game study (a multicenter observational study proposed by the Italian Society of Hypertension (SIIA) aimed at assessing risk factors for juvenile hypertension)[3]. This second questionnaire gathered information on family history of hypertension, cardiovascular, renal, and cancer-related diseases, birth weight, dietary habits, frequency of smartphone and computer usage, consumption of coffee, drugs, alcohol, and tobacco, as well as physical activity (Attachment 2). All participants underwent blood pressure measurement using one of two validated oscillometric devices (Omron M6 Comfort and Microlife BPA150). Three blood pressure and heart rate measurements were taken, and the mean of these measurements was calculated. To diagnose an increase in blood pressure values, we applied both the ESH and AAP criteria. According to all international guidelines, a single blood pressure measurement does not reliably define the presence of hypertension. Hypertension can only be diagnosed, as per both current and previous European and U.S. guidelines, when elevated blood pressure is confirmed on at least three separate occasions. Therefore, we prefer not to label the detection of blood pressure values exceeding the normal ranges outlined by the aforementioned guidelines as "hypertension." Instead, we will refer to this condition as "increased blood pressure."
For the definition of height percentiles, which are essential for determining normal blood pressure thresholds in students under 16 years old according to European guidelines, and in those under 13 years old according to North American guidelines, we used the WHO growth tables[4].
To define overweight and obesity, we calculated the body mass index (BMI) using the standard formula (Weight/Height²), based on the anthropometric measurements provided in the students' questionnaires. The resulting BMI value was then used to calculate the BMI Z-score for each individual, using the formula: (Xn – µ) / σ, where Xn represents the individual BMI value, µ is the mean BMI of the entire population, and σ is the corresponding standard deviation, applying the criteria suggested by the WHO in 2007. The Z-score measures how many standard deviations each sample value deviates from the mean.
In accordance with de Onis et al. [4], individuals with a BMI Z-score ≥1.04 (or ≥85th percentile) were classified as overweight, and those with a BMI Z-score ≥1.64 (or ≥95th percentile) were considered obese. The decision to use WHO criteria aligns with recommendations from consensus by the Italian Society of Pediatrics and the Italian Society of Pediatric Endocrinology and Diabetes [5]. This approach is based on the need to offer a system that, while not ideal for comparing the growth of individual children or groups, demonstrates greater sensitivity in identifying overweight and obese children and adolescents compared to older Italian criteria, likely due to the fact that the measurements underlying the WHO criteria were taken following the epidemic increase in obesity.
3. Results
The prevalence of increased blood pressure was 7.5% when assessed using the ESH classification criteria, and almost twice as high when the AAP criteria were applied (Figure 1). This discrepancy was more pronounced in females than in males.
Table 1 presents the main demographic and anthropometric characteristics of the entire study group, as well as the two subgroups with and without elevated blood pressure, classified according to the threshold values outlined in the aforementioned guidelines.
It can be observed that individuals with blood pressure above the normal range are younger and have a higher body weight, BMI, and consequently a higher prevalence of overweight and obesity compared to those with normal blood pressure, regardless of the guidelines used for categorization. A higher prevalence of males and greater height in the group with elevated blood pressure is observed only when using the AAP criteria.
Individuals with higher systolic blood pressure (SBP) and diastolic blood pressure (DBP) also exhibit a higher heart rate, regardless of the criteria used to classify the population. (Table 2).
Regarding lifestyle factors, differences emerged only when using the ESH guidelines to classify the population, specifically a higher consumption of alcoholic beverages and drugs (the latter at the borderline of statistical significance) among individuals with normal blood pressure. Additionally, within this group, there was a tendency (also with borderline significance) for a higher percentage of students engaging in regular physical activity. (Table 3)
Table 4 shows the correlations between blood pressure values and anthropometric variables in the total population and by sex. Statistically significant correlations were found between systolic blood pressure and height, weight, and BMI (Figure 2). It is noticeable that the correlations of these parameters are stronger in males compared to females. Diastolic blood pressure values, on the other hand, showed significant correlations only with weight and BMI.
In addition to evaluating the correlations between BMI and blood pressure values, we also correlated the latter, particularly systolic blood pressure, with the difference between the observed BMI value and the diagnostic BMI obesity cut-off suggested by the WHO (specific to age and sex). This was considered given that the thresholds for defining obesity and overweight in adolescents differ from those in adults and vary according to the demographic characteristics of the individuals examined. The association between systolic blood pressure and this body size index was found to be as significant, if not more so, than the relationship between the observed BMI and systolic blood pressure (Figure 3).
4. Discussion
Our study, conducted on a sample of adolescents attending some secondary schools in Western Sicily, stems from the desire to assess the distribution of blood pressure values and determine the differences in the prevalence of various blood pressure categories identified according to the new American and European guidelines, as well as to analyse the relationships with medical history data and lifestyle factors.
A key finding is the higher prevalence of elevated blood pressure values when using the new 2017 AAP criteria compared to the ESH guidelines. This result was widely anticipated, given that the American guidelines for adolescents over the age of 13 suggest abandoning the percentile method for diagnosing hypertension and using the same threshold values as adults, which were lowered to 130/80 mmHg in the 2017 guidelines of the American Heart Association and the American College of Cardiology[6]. In contrast, the ESH guidelines for pediatric hypertension management start equating blood pressure reference values to those of adults only at the age of 16, and the adult diagnostic cut-offs have remained the traditional 140/90 mmHg[7]. As a result, it is not uncommon to find individuals identified as hypertensive based on the American classifications who are not classified as such according to European criteria.
The prevalence found in our study was 7.5% when applying the European guidelines and almost double (14.8%) when using the AAP criteria. This discrepancy was also observed to varying degrees, in other studies dedicated to this comparison and confirmed by a meta-analysis conducted by Goulas et al. in 2021[8]
In CARITALY study by Di Bonito et al. [9], authors found a 4.1% increase when using the AAP 2017 guidelines compared to the ESH 2016 guidelines, and then, the study by Lurbe et al.[10], showed a prevalence of 6.6% according to the ESH guidelines versus 10.5% with the AAP guidelines.
More recently, Fanelli and colleagues[11], in a cohort of 624 adolescents, reported a prevalence of elevated blood pressure values of 32.7% according to the 2017 AAP guideline cut-offs, compared to only 17.6% based on the 2016 ESH definition. This difference was statistically significant (p < 0.01). The use of the AAP nomograms consistently identified a higher proportion of hypertensive individuals across all subgroups stratified by age, sex, and BMI.
In a retrospective analysis of 395 adolescents aged 13 to 16, Aksoy et al. evaluated both office and 24-hour ambulatory blood pressure measurements, categorizing participants into three subgroups based on body mass index (BMI). Unlike the previously mentioned studies, authors found that, across the entire cohort, the prevalence of hypertension was 32.4% according to the ESHG2016 and 34.4% according to AAPG2017. Among obese adolescents, these rates increased to 38.8% and 43.3%, respectively. The diagnosis of hypertension was confirmed using both guidelines, with substantial agreement observed in both the obese subgroup and the overall study population, as indicated by kappa values of 0.738 and 0.785, respectively[12].
In our study, the correlations between systolic blood pressure values and anthropometric variables that were statistically significant included weight (r = 0.432), height (r = 0.321), and BMI (r = 0.318) in the total population. When differentiated by sex, the correlation indices were r = 0.398, r = 0.233, and r = 0.338 for males, and r = 0.256, r = 0.089, and r = 0.226 for females. Diastolic blood pressure values, on the other hand, showed significant correlations only with weight and BMI. The findings confirm what has been highlighted in the studies previously cited.
The prevalence of obesity and overweight among the participants in our study was 22%. Obesity is increasing at an alarming rate among children and adolescents in all developed societies, with the United States leading the way, as they do with other aberrant behaviors [13]. Unfortunately, childhood obesity closely correlates with adult obesity[14], laying the foundation for all other consequences. An increase in abdominal circumference in school-aged children, measured at the abdomen, is a particularly unfavorable predictor of metabolic syndrome, which now affects most adults in the United States[15]. The causes of increased obesity in children and adolescents are due both to the increased caloric intake from the ever-growing number of fast food outlets [16] and, perhaps even more importantly, to the reduction in physical activity. The American Academy of Pediatrics has officially called for reduced access to canned drinks in schools [17], but this action alone will not be sufficient unless it is accompanied by measures addressing other involved factors [18]. Most notably, as a consequence of the rise in obesity, mean blood pressure in children and adolescents in the U.S. increased by 1.4/3.3 mmHg from 1990 to 2000 [19], which corresponds to significant increases in childhood hypertension, with higher likelihoods of hypertension in adulthood. These overweight children with hypertension may also experience more severe cardiovascular disease, as reflected in surrogate markers such as dyslipidemia [20], increased left ventricular mass, and carotid intima-media thickness [21]. The combination of obesity, increased blood pressure, and other cardiovascular risk factors has led to the prediction of a cardiovascular disease epidemic in adults in the near future [22]. Furthermore, obese children have been found to have an increased frequency of breathing disorders and sleep apnea [23], which can, as in adults, increase blood pressure. These children may experience less frequent sleep apnea than adults, usually exhibiting tachypnea and increased dyspnea [24].
In our study, we observed a prevalence of obesity and overweight, when considered together, of 22%; this figure is very similar to the results from the study by Buscemi et al. [25], which found a prevalence of 21.6% in a population of 478 teenagers. BMI in our study showed a stronger correlation with systolic blood pressure than with diastolic blood pressure, the latter not being statistically significant in females. It is likely that the greater impact of BMI on systolic blood pressure is related to the close relationship between body mass and cardiac output, which is one of the main determinants of systolic blood pressure.
The exact pathophysiological mechanism by which obesity causes hypertension is not well understood. The obesity-hypertension link is a complex, multifactorial condition that seems to involve insulin resistance, hyperactivation of the sympathetic nervous system, the renin-angiotensin system, abnormal renal sodium retention, possible leptin resistance, altered vascular reactivity, and changes in the hypothalamic-pituitary-adrenal axis. Many authors believe that fluid retention is the common factor linking obesity to hypertension. It seems that endogenous hyperinsulinemia in obese children following glucose load induces urinary sodium retention [26]. Another hypothesis is that of insulin receptor structure alteration or a defect in the target tissue [27]. Finally, structural changes in the kidneys of obese individuals may cause fluid retention. Insulin resistance seems to be the metabolic link connecting obesity to hypertension. Children with borderline blood pressure have higher plasma insulin levels and greater weight than normotensive individuals. The renin-angiotensin-aldosterone system plays a crucial role in regulating the tone of the glomerular efferent arteries and sodium reabsorption. Its activity is modulated by salt intake and blood pressure.
Rocchini et al. [26] observed that an increase in plasma renin activity caused a greater increase in aldosterone concentration in obese adolescents compared to normal-weight controls. Regarding the SNS, it is thought that in obese individuals, it is chronically activated in an attempt to prevent further weight gain, and that hypertension is a byproduct of an overactive SNS [28]. The Bogalusa Heart Study reports that in a group of children, resting heart rate correlated positively with blood pressure and subscapular skinfold thickness [29].
The particular attention to this phenomenon is justified by the evidence that the combination of obesity and hypertension creates a double burden on the heart, ultimately leading to reduced ventricular function [30,31], which is why the importance of diagnosis and management in this age group is recognized. Hypertension not only affects the heart but also the kidneys, CNS, and blood vessels, causing early functional and structural changes that can be significant.
Therefore, early organ damage, as a measure of the clinical consequences of increased blood pressure, is essential for managing hypertension in youth. Monitoring organ damage in children and adolescents with high blood pressure is even more important because the cardiovascular/renal sequelae of hypertension that begins in childhood may not become clinically relevant until adulthood[32,33].
The results of our study should be interpreted with caution, considering some of its methodological limitations. One of the main limitations is the inability to diagnose hypertension definitively, as blood pressure values were measured only once. Blood pressure measurement, according to all international guidelines, when taken on a single occasion, cannot reliably define the presence of hypertension. Indeed, this diagnosis can only be made, according to both the ESH and AAP guidelines, when elevated blood pressure levels are confirmed on at least three different occasions. Therefore, as mentioned earlier, we preferred not to use the term "hypertension" to define cases where blood pressure values exceeded the normal ranges set by the aforementioned guidelines. Instead, we identified such cases as "increased blood pressure." However, it is worth noting that in most pediatric hypertension screening studies, as in our study, blood pressure values have been measured on a single occasion. In the Di Bonito study [9], where blood pressure was measured only once, increased blood pressure was defined as a "high-risk hypertension condition"; in the study by Lurbe et al. [10], only part of the studied population received a formal diagnosis of hypertension based on repeated measurements at three different times and sometimes with the help of 24-hour blood pressure monitoring.
Another significant limitation of our study is the use of self-reported data, particularly anthropometric measurements, and the use of questionnaires that did not guarantee anonymity for the collection of medical history and lifestyle data, with the greater risk of frequent misperceptions of body size, especially among females. This method of data collection, while necessary for practical purposes, exposes the study to the risk of inaccurate information. However, even with self-reported anthropometric data, the prevalence results are similar to those from the ABCD study [25], where such data were measured directly.
On the other hand, our study, to the best of our knowledge, is the only one to analyse the prevalence of increased blood pressure and its relationship with lifestyle factors and anthropometric data in adolescence in our region. We aim not only to increase the sample size but also to confirm the diagnosis of hypertension in individuals who showed an increase in blood pressure and to objectively assess the self-reported risk factors and examine other parameters (e.g., uric acid), which were not assessed in the present study.
Authors should discuss the results and how they can be interpreted from the perspective of previous studies and of the working hypotheses. The findings and their implications should be discussed in the broadest context possible. Future research directions may also be highlighted.
5. Conclusions
Despite the methodological limitations previously described, our study has confirmed that elevated blood pressure is far from rare during adolescence. This finding underscores the need for greater attention to this issue, recognizing that non-pharmacological interventions can prevent the onset of serious complications in adulthood.
Funding
This research received no external funding
Institutional Review Board Statement
The study was conducted in accordance with the Declaration of Helsinki, and approved by the Ethics Committee of PALERMO CEL 1 (protocol n.28 10/12/2024).
Informed Consent Statement
Informed consent was obtained from all subjects involved in the study.
Data Availability Statement
The datasets generated and/or analysed during the current study are available from the corresponding author on reasonable request.
Acknowledgments
In this section, you can acknowledge any support given which is not covered by the author contribution or funding sections. This may include administrative and technical support, or donations in kind (e.g., materials used for experiments).
Conflicts of Interest
The authors declare no conflicts of interest.
References
- «2016 European Society of Hypertension guidelines for the management of high blood pressure in children and adolescents - PubMed». Consultato: 26 gennaio 2025. [Online]. Disponibile su. Available online: https://pubmed.ncbi.nlm.nih.gov/27467768/.
- J. T. Flynn et al., «Clinical Practice Guideline for Screening and Management of High Blood Pressure in Children and Adolescents», Pediatrics, vol. 140, fasc. 3, p. e20171904, set. 2017. [CrossRef]
- Battistoni, F. Canichella, G. Pignatelli, A. Ferrucci, G. Tocci, e M. Volpe, «Hypertension in Young People: Epidemiology, Diagnostic Assessment and Therapeutic Approach», High Blood Press Cardiovasc Prev, vol. 22, fasc. 4, pp. 381–388, dic. 2015. [Google Scholar] [CrossRef]
- M. de Onis, A. W. Onyango, E. Borghi, A. Siyam, C. Nishida, e J. Siekmann, «Development of a WHO growth reference for school-aged children and adolescents», Bull World Health Organ, vol. 85, fasc. 9, pp. 660–667, set. 2007. [CrossRef]
- G. V. Giuliana, G. Saggese, e C. Maffeis, «Diagnosi, trattamento e prevenzione dell’obesità del bambino e dell’adolescente», Area Pediatrica, vol. 18, fasc. 4, pp. 150–157, ott. 2017.
- P. K. Whelton et al., «2017 ACC/AHA/AAPA/ABC/ACPM/AGS/APhA/ASH/ASPC/NMA/PCNA Guideline for the Prevention, Detection, Evaluation, and Management of High Blood Pressure in Adults: A Report of the American College of Cardiology/American Heart Association Task Force on Clinical Practice Guidelines», Hypertension, vol. 71, fasc. 6, pp. e13–e115, giu. 2018. [CrossRef]
- Mancia, «2013 ESH/ESC guidelines for the management of arterial hypertension: the Task Force for the Management of Arterial Hypertension of the European Society of Hypertension (ESH) and of the European Society of Cardiology (ESC)», Eur Heart J, vol. 34, fasc. 28, pp. 2159–2219, lug. 2013. [CrossRef]
- Goulas I, Farmakis I, Doundoulakis I, Antza C, Kollios K, Economou M, Kotsis V, Stabouli S. Comparison of the 2017 American Academy of Pediatrics with the fourth report and the 2016 European Society of Hypertension guidelines for the diagnosis of hypertension and the detection of left ventricular hypertrophy in children and adolescents: a systematic review and meta-analysis. J Hypertens. 2022 Feb 1;40(2):197-204. [CrossRef] [PubMed]
- Di Bonito P, Valerio G, Pacifico L, Chiesa C, Invitti C, Morandi A, et al. Impact of the 2017 blood pressure guidelines by the American Academy of Pediatrics in overweight/obese youth. J Hypertens. 2018; 36, 2018.
- E. Lurbe et al., «Impact of ESH and AAP hypertension guidelines for children and adolescents on office and ambulatory blood pressure-based classifications», Journal of Hypertension, vol. 37, fasc. 12, p. 2414, dic. 2019. [CrossRef]
- Fanelli, Elvira; Di Monaco, Silvia; Pappaccogli, Marco; Eula, Elisabetta; Fasano, Chiara; Masera, Guglielmo; Rabbone, Ivana; Rabbia, Franco; Veglio, Franco. IMPACT OF 2017 AAP AND 2016 ESH GUIDELINES ON PAEDIATRIC HYPERTENSION PREVALENCE. Journal of Hypertension 39(): p e188, April 2021. [CrossRef]
- G. K. Aksoy, D. Yapar, N. S. Koyun, e Ç. S. Doğan, «Comparison of ESHG2016 and AAP2017 hypertension guidelines in adolescents between the ages of 13 and 16: effect of body mass index on guidelines», Cardiol Young, vol. 32, fasc. 1, pp. 94–100, gen. 2022. [CrossRef]
- Lissau, «Body mass index and overweight in adolescents in 13 European countries, Israel, and the United States», Arch Pediatr Adolesc Med, vol. 158, fasc. 1, pp. 27–33, gen. 2004. [CrossRef]
- Kvaavik E, Tell GS, Klepp KI. Predictors and tracking of body mass index from adolescence into adulthood: follow-up of 18 to 20 years in the Oslo Youth Study. Arch Pediatr Adolesc Med. 2003 Dec;157(12):1212-8. doi: 10.1001/archpedi.157.12.1212. PMID: 14662578.«Predictors and tracking of body mass index from adolescence into adulthood: follow-up of 18 to 20 years in the Oslo Youth Study - PubMed».
- C. J. Rudolf et al., «Rising obesity and expanding waistlines in schoolchildren: a cohort study», Arch Dis Child, vol. 89, fasc. 3, pp. 235–237, mar. 2004. [CrossRef]
- « Bowman SA, Gortmaker SL, Ebbeling CB, Pereira MA, Ludwig DS. Effects of fast-food consumption on energy intake and diet quality among children in a national household survey. Pediatrics. 2004 Jan;113(1 Pt 1):112-8. [CrossRef] [PubMed]
- American Academy of Pediatrics Medical Home Initiatives for Children With Special Needs Project Advisory Committee, «Policy statement: organizational principles to guide and define the child health care system and/or improve the health of all children», Pediatrics, vol. 113, fasc. 5 Suppl, pp. 1545–1547, mag. 2004.
- S. Wiehe, H. Lynch, e K. Park, «Sugar high: the marketing of soft drinks to America’s schoolchildren», Arch Pediatr Adolesc Med, vol. 158, fasc. 3, pp. 209–211, mar. 2004. [CrossRef]
- « Muntner P, He J, Cutler JA, Wildman RP, Whelton PK. Trends in blood pressure among children and adolescents. JAMA. 2004 ;291(17):2107-13. 5 May. [CrossRef] [PubMed]
- Flynn JT, Alderman MH. Characteristics of children with primary hypertension seen at a referral center. Pediatr Nephrol. 2005 Jul;20(7):961-6. [CrossRef] [PubMed]
- J. M. Sorof et al., «Cardiovascular risk factors and sequelae in hypertensive children identified by referral versus school-based screening», Hypertension, vol. 43, fasc. 2, pp. 214–218, feb. 2004. [CrossRef]
- R. Daniels, «Is there an epidemic of cardiovascular disease on the horizon?», J Pediatr, vol. 134, fasc. 6, pp. 665–666, giu. 1999. [CrossRef]
- Wing YK, Hui SH, Pak WM, Ho CK, Cheung A, Li AM, Fok TF. A controlled study of sleep related disordered breathing in obese children. Arch Dis Child. 2003 Dec;88(12):1043-7. [CrossRef] [PubMed]
- Guilleminault, K. Li, A. Khramtsov, L. Palombini, e R. Pelayo, «Breathing patterns in prepubertal children with sleep-related breathing disorders», Arch Pediatr Adolesc Med, vol. 158, fasc. 2, pp. 153–161, feb. 2004. [Google Scholar] [CrossRef]
- Buscemi S, Giordano C. Physical activity and cardiovascular prevention: Is healthy urban living a possible reality or utopia? Eur J Intern Med. 2017 May;40:8-15 Epub 2017 Feb 16. PMID: 28215975.«Physical activity and cardiovascular prevention: Is healthy urban living a possible reality or utopia? - PubMed». [CrossRef] [PubMed]
- Rocchini AP, Katch V, Kveselis D, Moorehead C, Martin M, Lampman R, Gregory M. Insulin and renal sodium retention in obese adolescents. Hypertension. 1989 Oct;14(4):367-74. [CrossRef] [PubMed]
- G. Kolterman, J. Insel, M. Saekow, e J. M. Olefsky, «Mechanisms of insulin resistance in human obesity: evidence for receptor and postreceptor defects», J Clin Invest, vol. 65, fasc. 6, pp. 1272–1284, giu. 1980. [CrossRef]
- G. M. Reaven, H. Chang, B. B. Hoffman, e S. Azhar, «Resistance to insulin-stimulated glucose uptake in adipocytes isolated from spontaneously hypertensive rats», Diabetes, vol. 38, fasc. 9, pp. 1155–1160, set. 1989. [CrossRef]
- S. Freedman, W. H. Dietz, S. R. Srinivasan, e G. S. Berenson, «The relation of overweight to cardiovascular risk factors among children and adolescents: the Bogalusa Heart Study», Pediatrics, vol. 103, fasc. 6 Pt 1, pp. 1175–1182, giu. 1999. [CrossRef]
- Reaven GM, Ho H, Hoffmann BB. Somatostatin inhibition of fructose-induced hypertension. Hypertension. 1989 Aug;14(2):117-20. [CrossRef] [PubMed]
- « Funahashi T, Matsuzawa Y. Metabolic syndrome: clinical concept and molecular basis. Ann Med. 2007;39(7):482-94. [CrossRef] [PubMed]
- Kishi S, Teixido-Tura G, Ning H, Venkatesh BA, Wu C, Almeida A, Choi EY, Gjesdal O, Jacobs DR Jr, Schreiner PJ, Gidding SS, Liu K, Lima JA. Cumulative Blood Pressure in Early Adulthood and Cardiac Dysfunction in Middle Age: The CARDIA Study. J Am Coll Cardiol. 2015 Jun 30;65(25):2679-87. [CrossRef] [PubMed]
- Aatola H, Magnussen CG, Koivistoinen T, Hutri-Kähönen N, Juonala M, Viikari JS, Lehtimäki T, Raitakari OT, Kähönen M. Simplified definitions of elevated pediatric blood pressure and high adult arterial stiffness. Pediatrics. 2013 Jul;132(1):e70-6. [CrossRef] [PubMed]
Figure 1.
Prevalence of elevated blood pressure according to the 2017 AAP and the 2016 ESH guidelines.
Figure 1.
Prevalence of elevated blood pressure according to the 2017 AAP and the 2016 ESH guidelines.
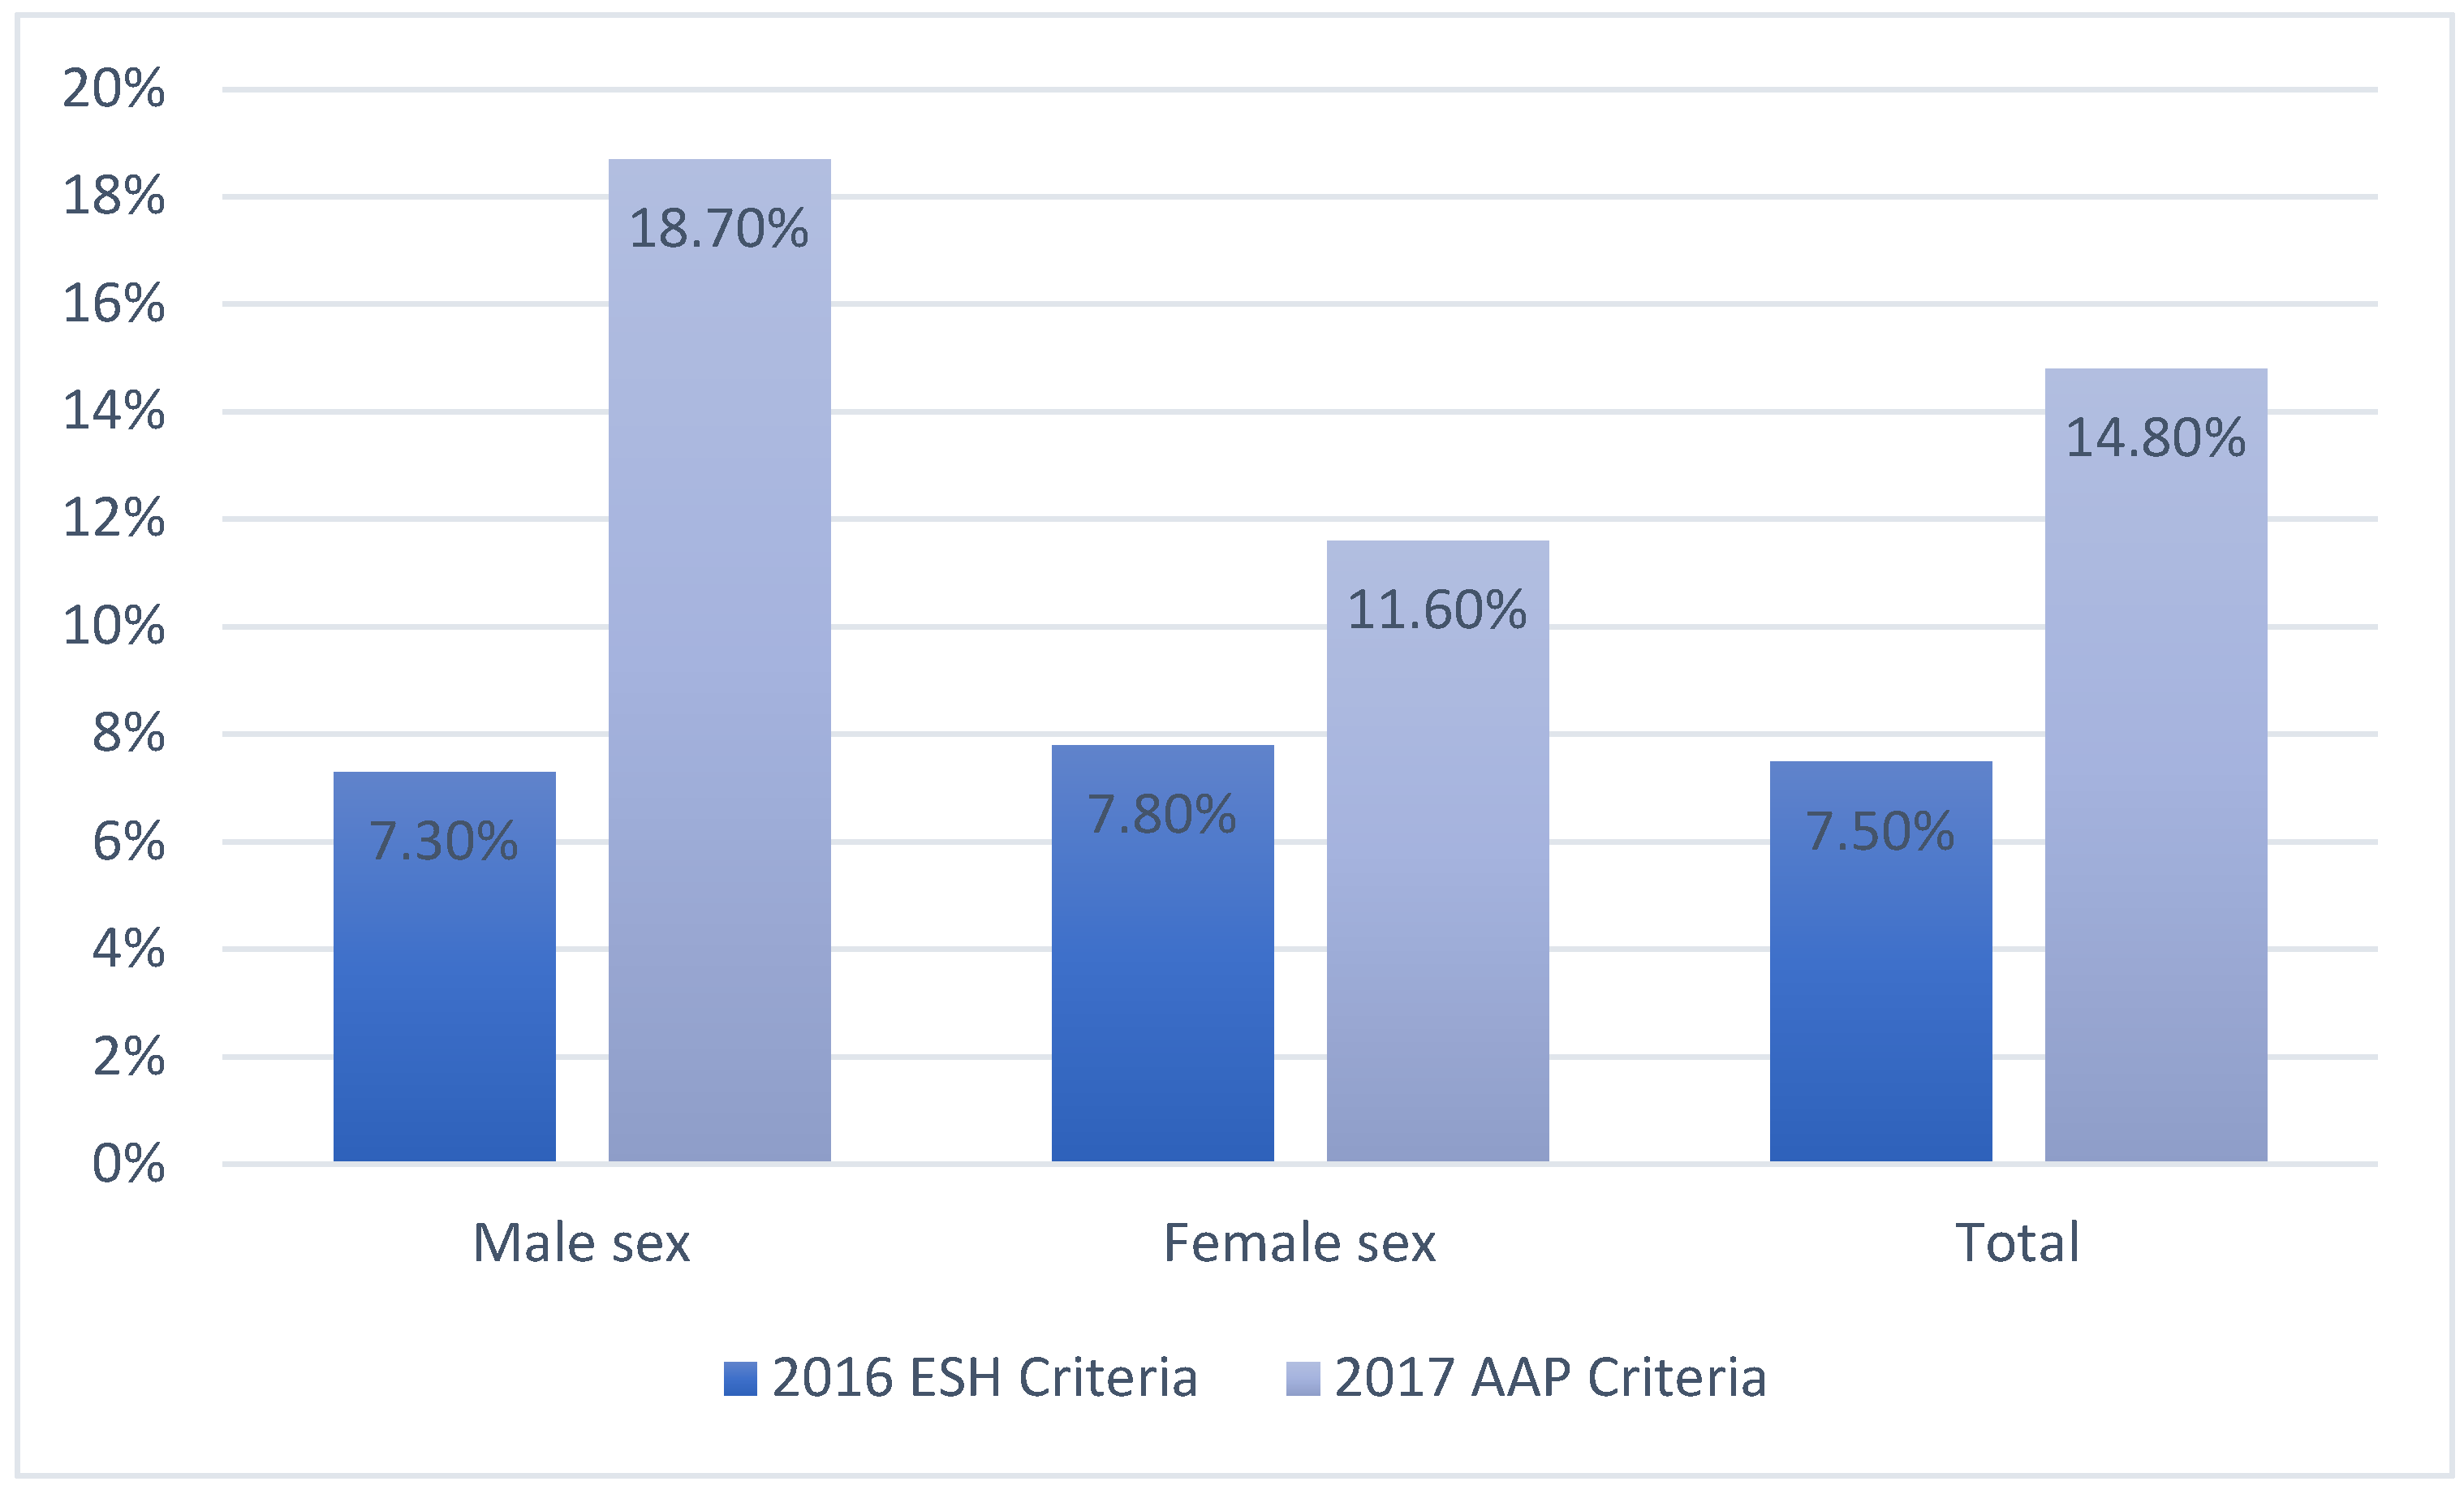
Figure 2.
Correlation between systolic blood pressure and BMI.
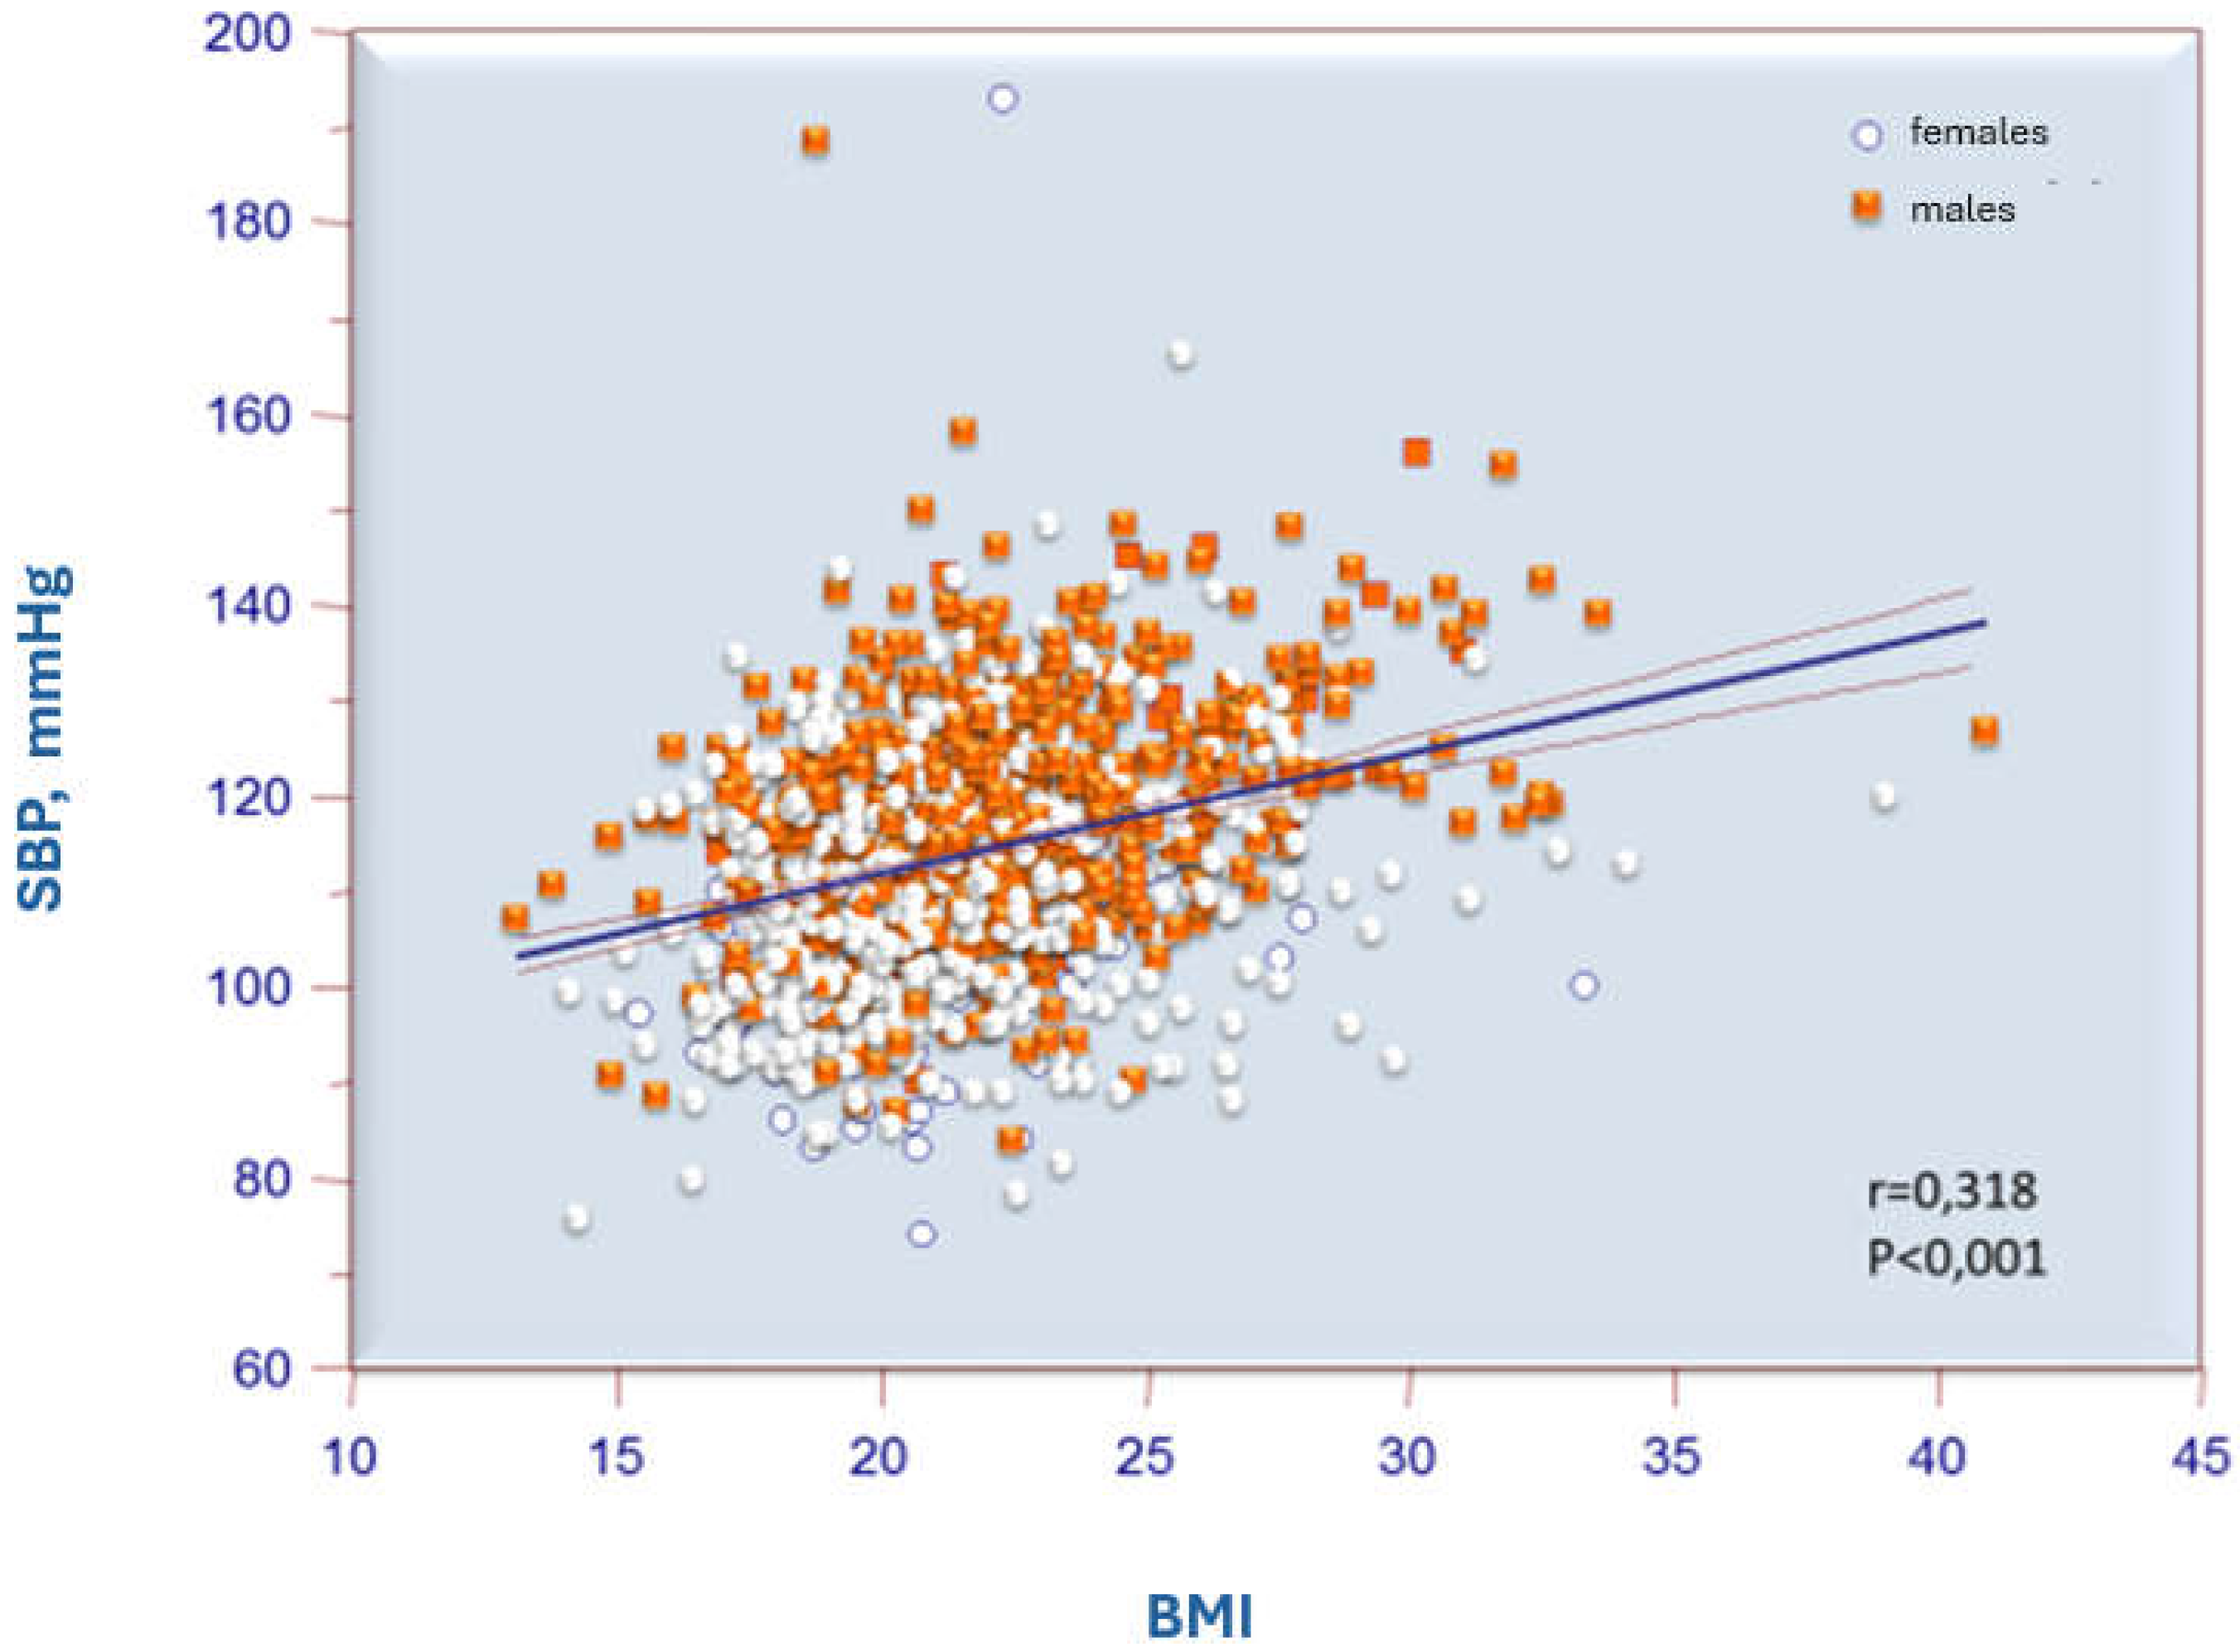
Figure 3.
Correlation of systolic blood pressure with the difference (delta) between the observed BMI and the diagnostic BMI cut-off for obesity suggested by WHO (specific for age and sex).
Figure 3.
Correlation of systolic blood pressure with the difference (delta) between the observed BMI and the diagnostic BMI cut-off for obesity suggested by WHO (specific for age and sex).
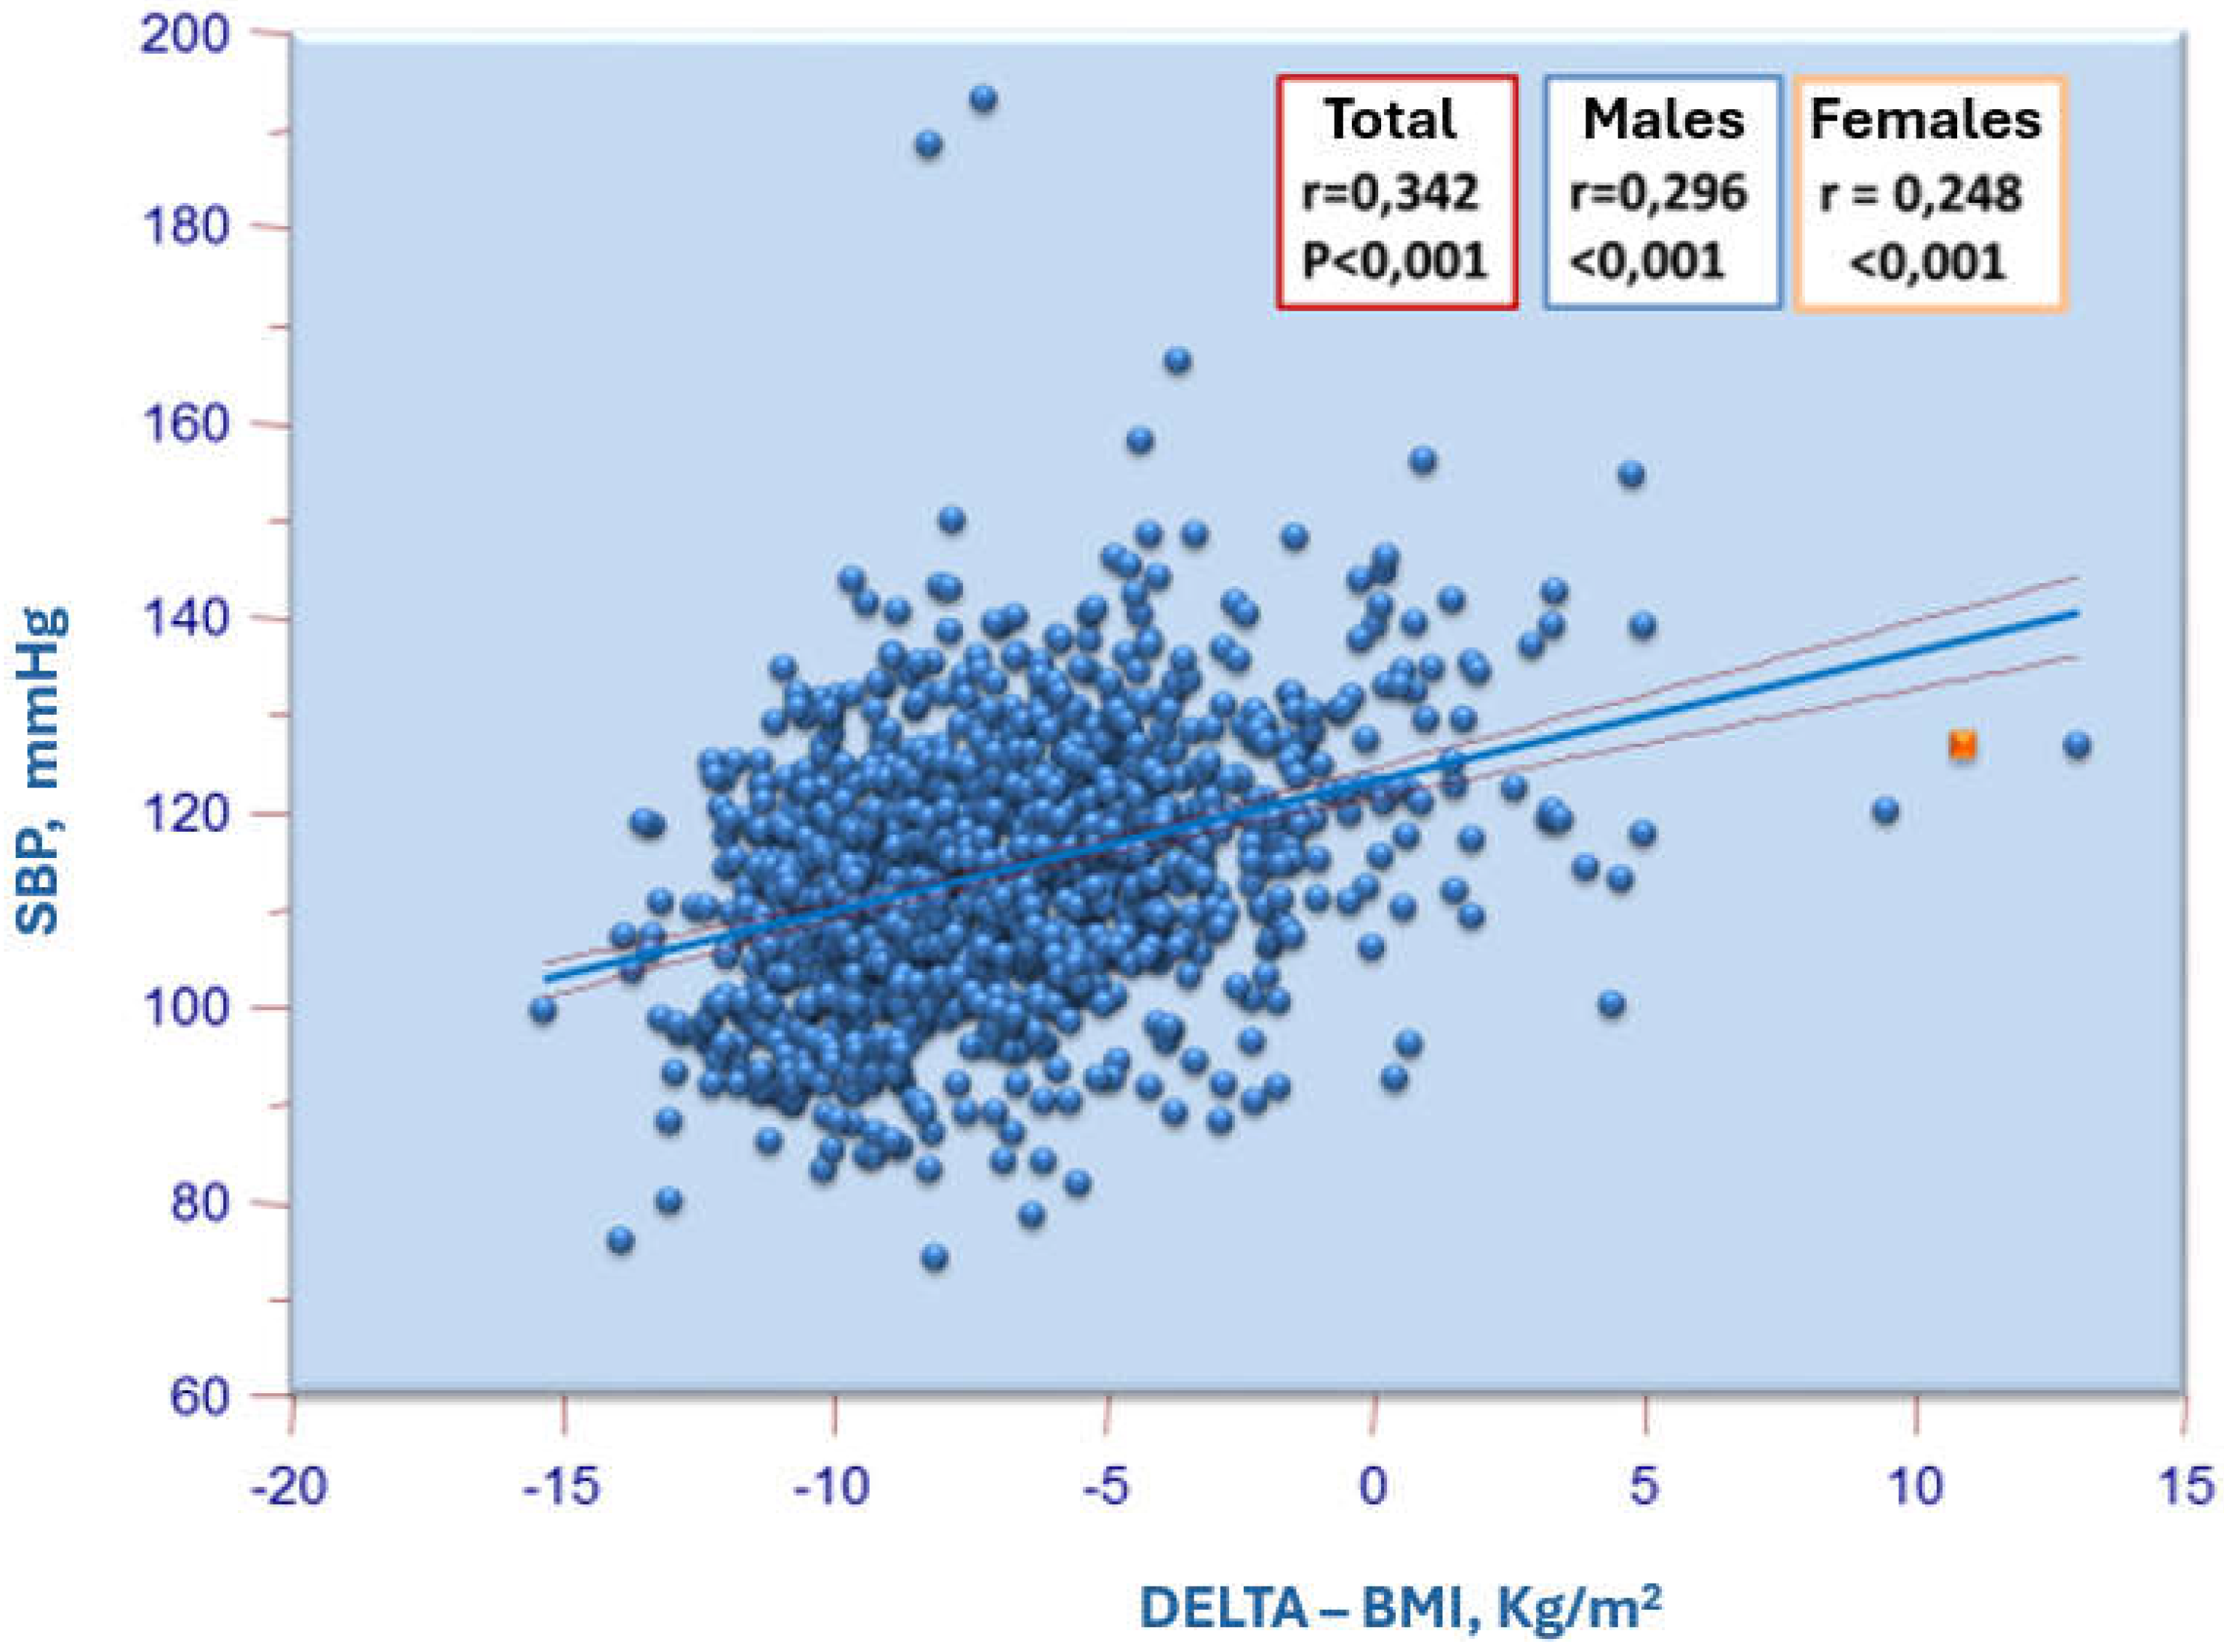

Table 1.
Demographic and anthropometric characteristics of the study population and the two subgroups classified according to the ESH and the AAP Criteria.
Table 1.
Demographic and anthropometric characteristics of the study population and the two subgroups classified according to the ESH and the AAP Criteria.
| 2016 ESH Criteria | 2017 AAP Criteria | ||||||
|---|---|---|---|---|---|---|---|
| TOTAL (n=1301) | Increased BP(n=99) | Normal BP (n=1202) | p | Increased BP (n=195) | Normal BP (n=1122) | p | |
| Age (years) | 15.6 ± 1.7 | 16.6 ± 1.55 | <0.001 | 16.8 ± 1.7 | 16.5 ± 1.6 | 0.006 | |
| Male sex.n (%) | 46 (46) | 541 (45) | 0.753 | 110 (56) | 477 (43) | <0.001 | |
| Height (cm) | 168.9 ± 9.6 | 168.7 ± 9.1 | 0.443 | 171 ± 9.3 | 168.2 ± 9 | <0.001 | |
| Weight (kg) | 65.7 ± 13.8 | 61.3 ± 11.8 | <0.001 | 69.2 ± 14 | 60.3 ± 11 | <0.001 | |
| BMI (kg/m²) | 23 ± 3.4 | 21.5 ± 3.2 | <0.001 | 23.4 ± 3.7 | 21.2 ± 3 | <0.001 | |
| Overweight, n(%) | 39 (39.4) | 202 (16.8) | <0.001 | 66 (33.8) | 175 (15.5) | <0.001 | |
| Obesity, n (%) | 11 (11.1) | 35 (2.9) | <0.001 | 23 (11.8) | 23 (2) | <0.001 | |
Table 2.
Blood pressure values and heart rate of the study population and the two subgroups classified according to the ESH and the AAP Criteria.
Table 2.
Blood pressure values and heart rate of the study population and the two subgroups classified according to the ESH and the AAP Criteria.
| 2016 ESH Criteria | 2017 AAP Criteria | ||||||
|---|---|---|---|---|---|---|---|
| Total(n=1301) | Increased BP(n=99) | Normal BP (n=1202) | p | Increased BP (n=195) | Normal BP (n=1122) | P | |
| SBP (mmHg) | 114 ± 12 | 132±15 | 112±11 | <0.001 | 16.8 ± 1.7 | 16.5 ± 1.6 | 0.006 |
| DBP (mmHg) | 46 (46) | 541 (45) | 0.753 | 110 (56) | 477 (43) | <0.001 | |
| HR (bpm) | 168.9 ± 9.6 | 168.7 ± 9.1 | 0.443 | 171 ± 9.3 | 168.2 ± 9 | <0.001 | |
Abbreviation: (SBP= systolic blood pressure, DBP= diastolic blood pressure, HR= heart rate).
Table 3.
Prevalence of lifestyle habits and regular physical activity, as reported in questionnaires administered to students, in the entire study population and in the two subgroups defined according to the ESH and AAP criteria.
Table 3.
Prevalence of lifestyle habits and regular physical activity, as reported in questionnaires administered to students, in the entire study population and in the two subgroups defined according to the ESH and AAP criteria.
| Total | Increased BP | Normal BP | P | Increased BP | Normal BP | P | |
|---|---|---|---|---|---|---|---|
| 2016 ESH | 2017 AAP | ||||||
| Current smokers, n (%) | 203 (15) | 13 (13) | 190 (16) | 0.56 | 35 (18) | 168 (15) | 0.284 |
| Alcohol consumption, n (%) | 267 (21) | 9 (9) | 258 (21) | 0.03 | 42 (25) | 227(20) | 0.7 |
| Drugs consumption, n (%) | 88 (7) | 2 (2) | 86 (7) | 0.058 | 17 (9) | 71 (6) | 0.2 |
| Regular physical activity, n (%) | 192 (15) | 8 (8) | 185 (15) | 0.055 | 34(17) | 163 (15) | 0.32 |
Table 4.
Pearson correlation coefficients of SBP and DBP with selected variables examined in the entire study population and stratified by gender.
Table 4.
Pearson correlation coefficients of SBP and DBP with selected variables examined in the entire study population and stratified by gender.
| Total | Males | Females | |||||
|---|---|---|---|---|---|---|---|
| SBP | DBP | SBP | DBP | SBP | DBP | ||
| Height. cm | r | 0.321 | 0.02 | 0.233 | 0.038 | 0.089 | 0.039 |
| p | <0.001 | 0.47 | <0.001 | 0.362 | 0.018 | 0.305 | |
| Weight. Kg | r | 0.432 | 0.102 | 0.398 | 0.15 | 0.256 | 0.099 |
| p | <0.001 | <0.001 | <0.001 | <0.001 | <0.001 | 0.009 | |
| BMI | r | 0.318 | 0.116 | 0.338 | 0.157 | 0.226 | 0.087 |
| p | <0.001 | <0.001 | <0.001 | <0.001 | <0.001 | 0.023 | |
Disclaimer/Publisher’s Note: The statements, opinions and data contained in all publications are solely those of the individual author(s) and contributor(s) and not of MDPI and/or the editor(s). MDPI and/or the editor(s) disclaim responsibility for any injury to people or property resulting from any ideas, methods, instructions or products referred to in the content. |
© 2025 by the authors. Licensee MDPI, Basel, Switzerland. This article is an open access article distributed under the terms and conditions of the Creative Commons Attribution (CC BY) license (http://creativecommons.org/licenses/by/4.0/).
Copyright: This open access article is published under a Creative Commons CC BY 4.0 license, which permit the free download, distribution, and reuse, provided that the author and preprint are cited in any reuse.


