Submitted:
13 February 2025
Posted:
16 February 2025
You are already at the latest version
Abstract
Introduction Neurodegenerative diseases like progressive supranuclear palsy (PSP) present challenges concerning their diagnosis. Neuroimaging using magnetic resonance (MRI) may add diagnostic value. However, modern techniques such as volumetric assessment using Voxel Based Morphometry (VBM), although proven to be more accurate and superior methods compared to MRI, have not gained popularity among scientists in the investigation of neurological disorders, due to their higher cost and time‐consuming applications. Conventional brain MRI methods may present a quick, practical, and easy to use imaging rating tool for the differential diagnosis of PSP. The purpose of this study is to evaluate a string of existing visual MRI rating scales and signs with regards to their impact for the diagnosis of PSP. Materials and Methods The population study consisted of 30 patients suffering from PSP and 72 healthy controls. Each study participant underwent a brain MRI, which was subsequently examined by two independent researchers, in a double-blinded fashion. Fifteen visual rating scales and signs were evaluated including pontine atrophy, cerebellar atrophy, midbrain atrophy, aqueduct of Sylvius enlargement, cerebellar peduncles hyperintensities, οκι8θ of the fourth ventricle (100% sensitivity ‐ 71% specificity) and left temporal lobe atrophy (97% sensitivity ‐ 78% specificity). Conclusions Enlargement of Sylvius aqueduct, enlargement of the fourth ventricle and atrophy of both temporal lobes together with presence of morning glory and hummingbird signs can be easily and quickly distinguished and identified by an experienced radiologist without involving any complex analysis making them a useful tool for the PSP diagnosis. MRI visual scale measurements could be added to the diagnostic criteria of PSP and may serve as an alternative to highly technical and more sophisticated quantification methods.
Keywords:
1. Introduction
2. Materials and Methods
- (i)
- Hot Cross Bun sign. It refers to atrophy and degeneration observed in the pons. This radiological finding is characterized by a cruciform or cross-like hyperintensity in the pons on T2-weighted or fluid-attenuated inversion recovery (FLAIR) MRI sequences [24].
- (ii)
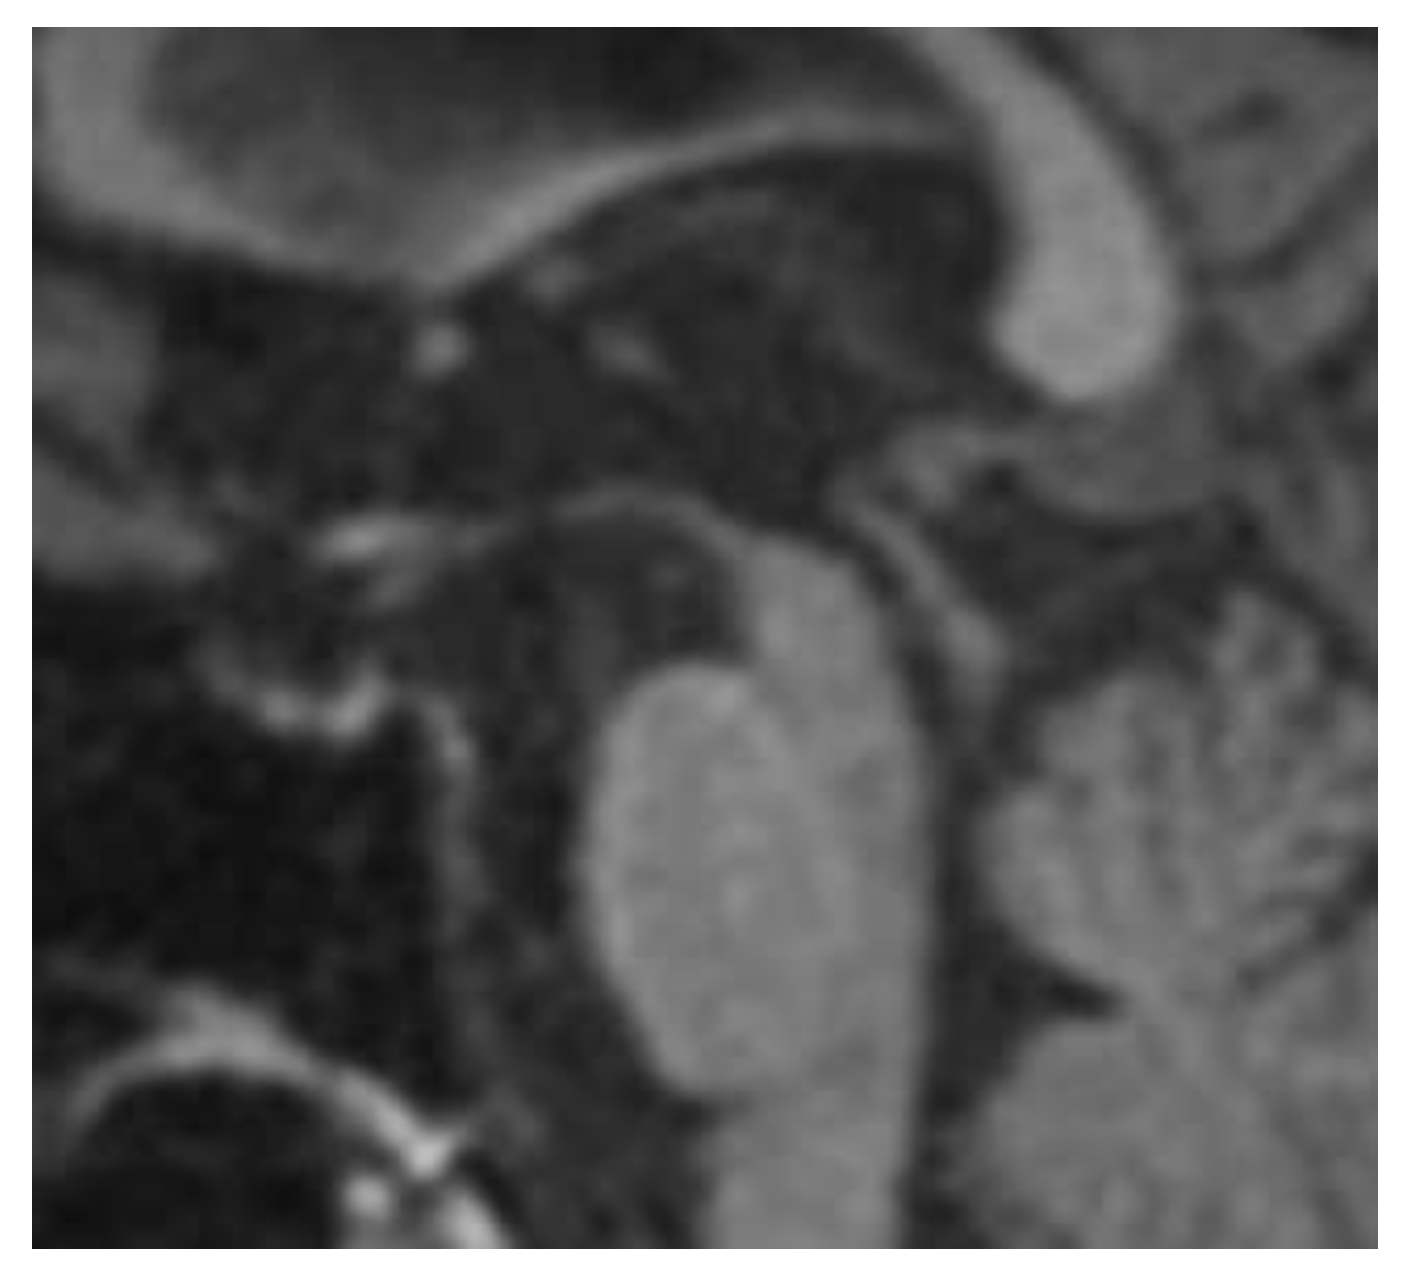
- Hummingbird sign. In midbrain atrophy, the thinning of the midbrain tegmentum and the widening of the superior cerebellar peduncles contribute to this distinctive imaging pattern. The superior cerebellar peduncles extend upward, and when combined with the atrophy of the midbrain, they create a silhouette reminiscent of a hummingbird (Figure 1) [25].
- (iii)
Statistical Analysis
3. Results
3.1. Demographic Characteristics
3.2. Inter-Rater Reliability
3.3. Comparison of MRI Ordinal Visual Rating Scales Between Groups (Control vs. PSP)

| Control (ν=72) | PSP (ν=30) | p-value | |
|---|---|---|---|
| Enlargement of the third ventricle | 0,53±0,79 | 2.00±0.91 | <0.005 |
| Enlargement of the forth ventricle | 0,35±0,59 | 1.80±0.76 | <0.005 |
| Lateral ventricle enlargement | 0,31±0,68 | 1.10±0.66 | <0.005 |
| Aqueduct of Sylvius enlargement | 0,08±0,33 | 1.17±0.59 | <0.005 |
| Midbrain atrophy | 0,28±0,45 | 1.87±0.73 | <0.005 |
| Atrophy of the right temporal lobe | 1,01±0,80 | 2.50±0.73 | <0.005 |
| Atrophy of the left temporal lobe | 0,99±0,72 | 2.70±0.79 | <0.005 |
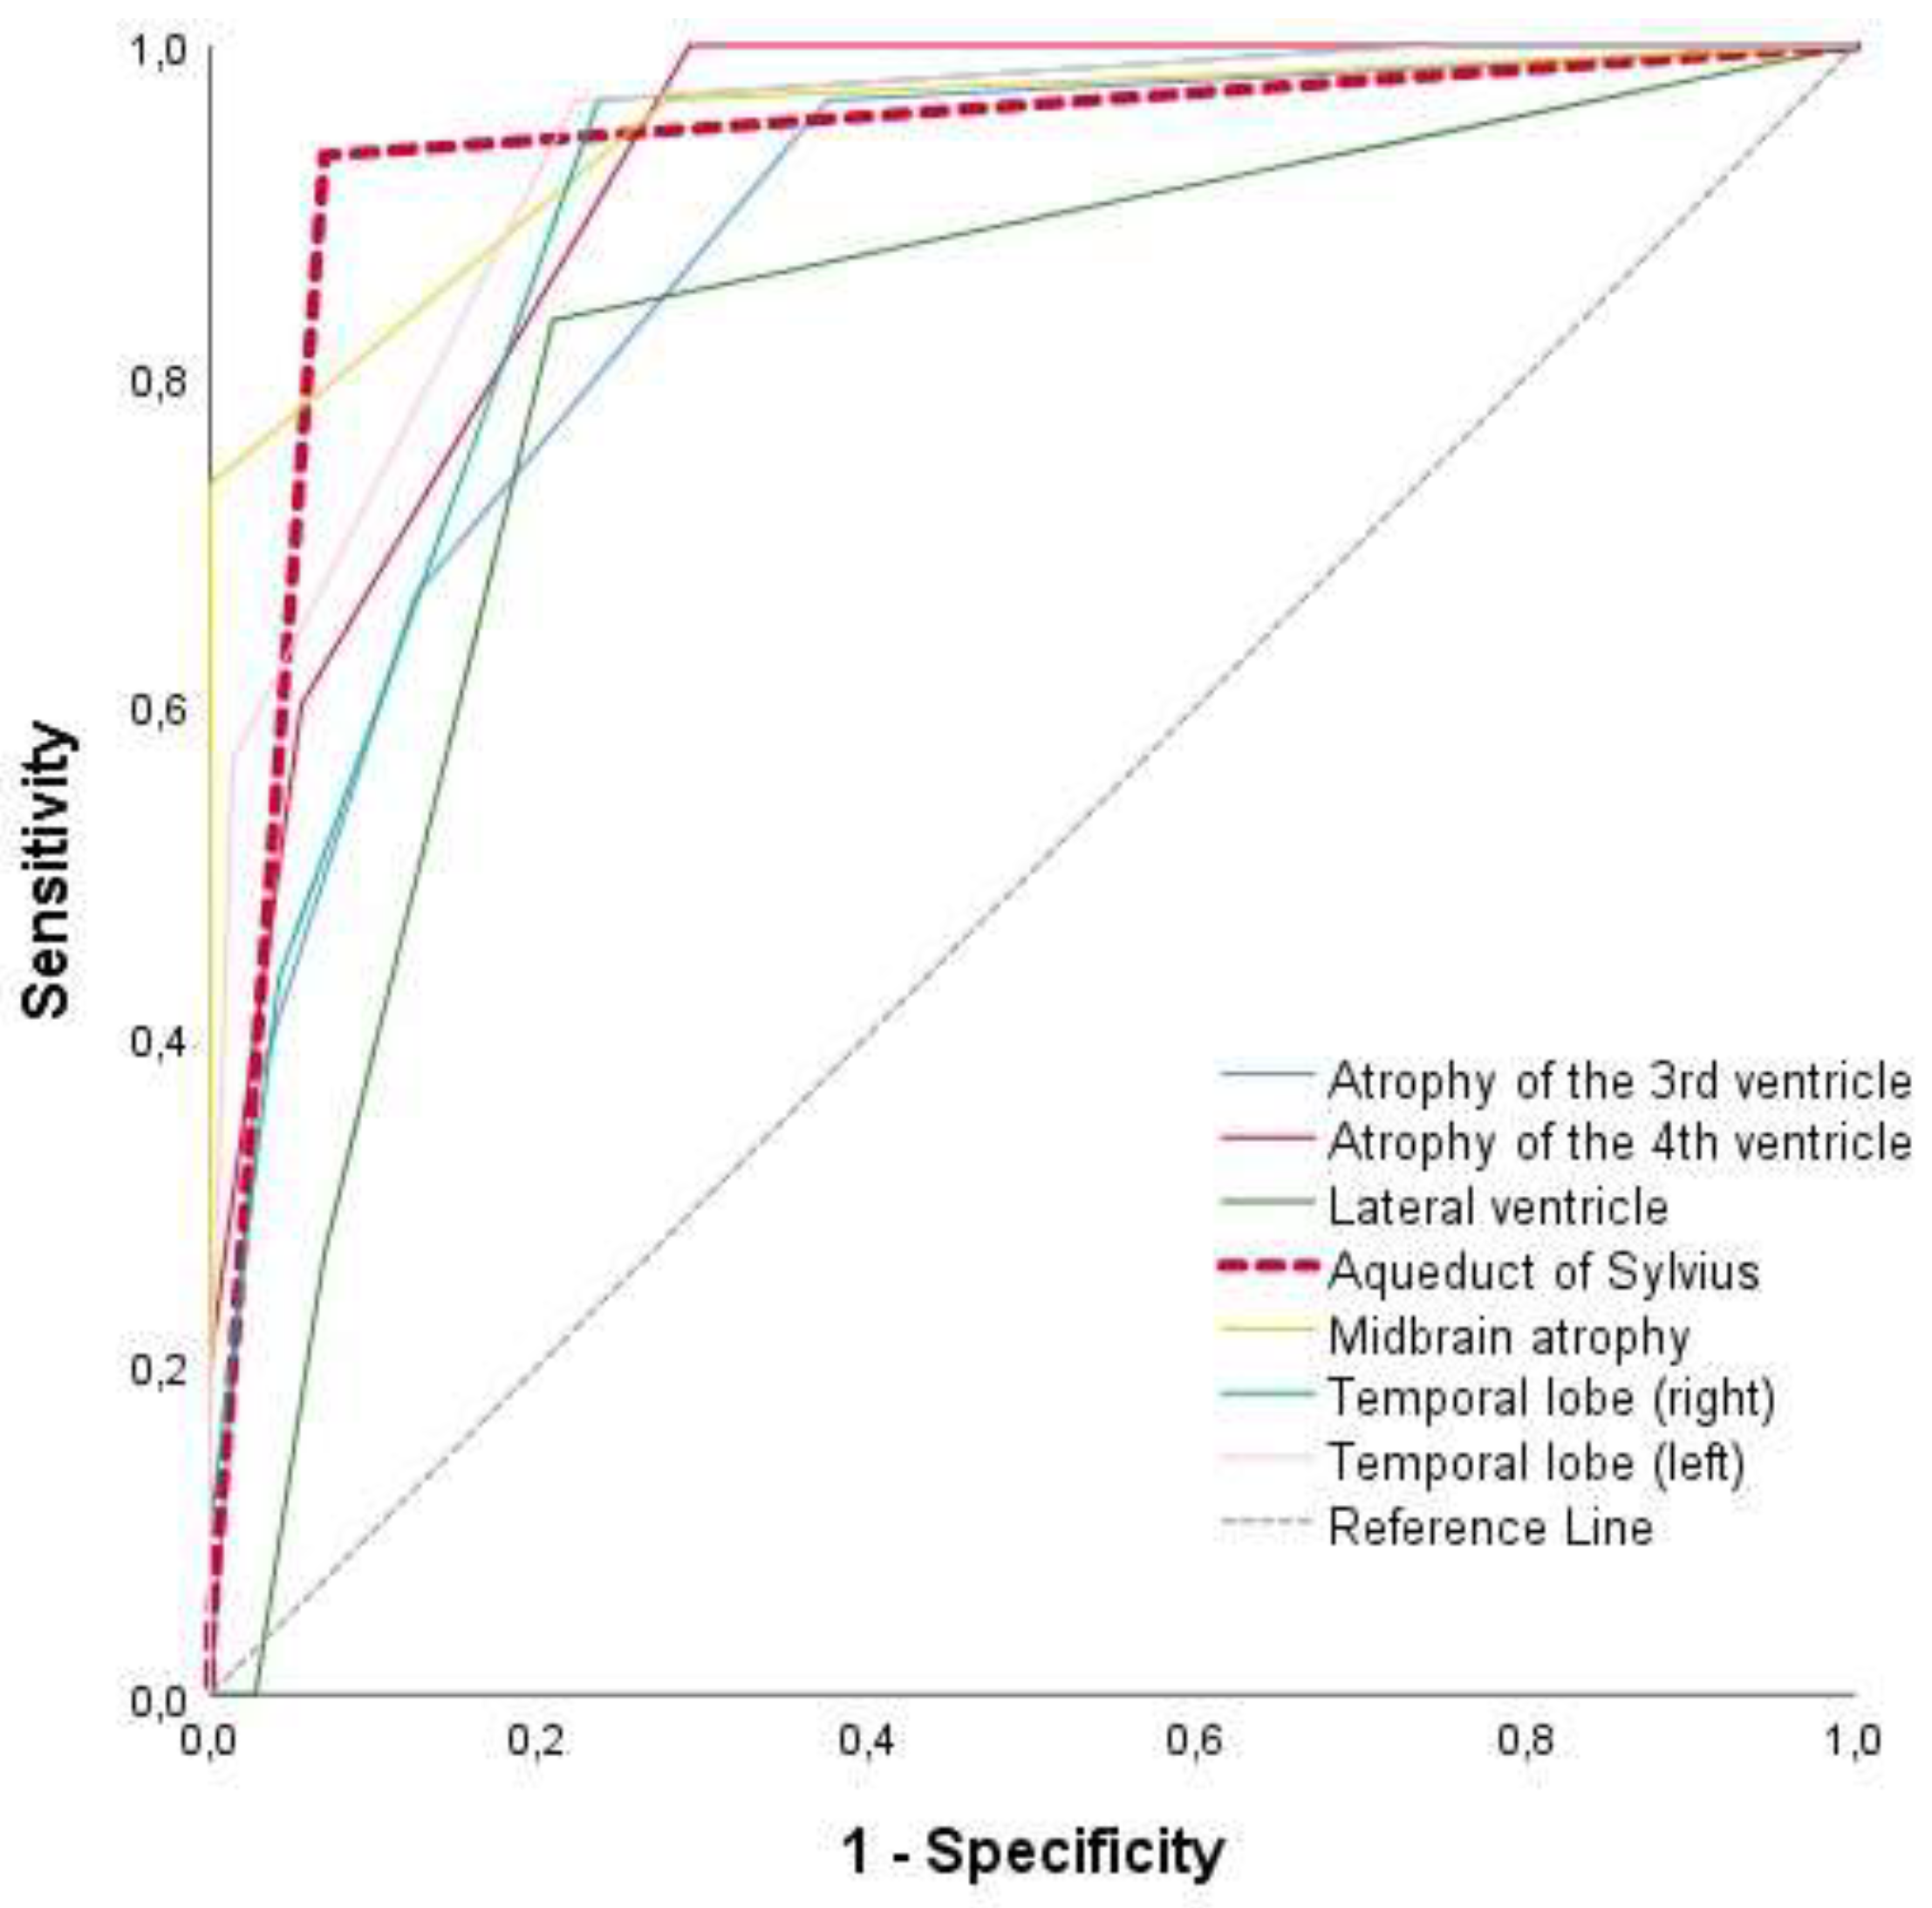
| AUC | 95%C.I | p-value | Sensitivity | Specificity | ||
|---|---|---|---|---|---|---|
| Enlargement of the third ventricle | 0,874 | 0,80 | 0,95 | <0.005 | 97% | 63% |
| Enlargement of the forth ventricle | 0,919 | 0,87 | 0,97 | <0.005 | 100% | 71% |
| Lateral ventricle enlargement | 0,808 | 0,71 | 0,90 | <0.005 | 83% | 79% |
| Aqueduct of Sylvius enlargement | 0,933 | 0,87 | 0,99 | <0.005 | 93% | 93% |
| Midbrain atrophy | 0,946 | 0,89 | 1,00 | <0.005 | 97% | 72% |
| Atrophy of the right temporal lobe | 0,903 | 0,84 | 0,96 | 0.013 | 97% | 76% |
| Atrophy of the left temporal lobe | 0,934 | 0,89 | 0,98 | <0.005 | 97% | 78% |
| Control (n = 72) | PSP (n = 30) | p-value | ||
|---|---|---|---|---|
| Hot Cross Bun sign | negative | 70 (97,2) | 26 (86.7) | 0.06 |
| positive | 2 (2,8) | 4 (13.3) | ||
| Morning Glory sign | negative | 68 (94,4) | 3 (10.0) | <0.005 |
| positive | 4 (5,6) | 27 (90.0) | ||
| Hummingbird sign | negative | 68 (94,4) | 3 (10.0) | <0.005 |
| positive | 4 (5,6) | 27 (90.0) |
| Reference category | OR | 95% CI | p-value | ||
|---|---|---|---|---|---|
| Aqueduct of Sylvius enlargement | Below 0.5 | 48.25 | 6.71 | 346.76 | <0.005 |
| Morning Glorysign | negative | 36.04 | 5.27 | 246.49 | <0.005 |
3.4. Comparison of MRI Qualitative Visual Rating Scales Between Groups (Control vs. PSP)
3.5. ROC Analysis for the Differentiation Between Control and PSP Groups
3.6. Logistic Regression Using the Forward LR Method for the Examination of Predictive Ability of MRI Visual Rating Scales for Differentiating the PSP Patients from the Control Population
4. Discussion
5. Conclusions
Conflicts of Interest
References
- Dickson DW, Ahmed Z, Algom AA, Tsuboi Y, Josephs KA. Neuropathology of variants of progressive supranuclear palsy. Curr Opin Neurol. 2010, 23, 394–400. [Google Scholar] [CrossRef] [PubMed]
- Litvan I, Agid Y, Calne D, Campbell G, Dubois B, Duvoisin RC, et al. Clinical research criteria for the diagnosis of progressive supranuclear palsy (Steele-Richardson-Olszewski syndrome): report of the NINDS-SPSP international workshop. Neurology 1996, 47, 1–9. [Google Scholar] [CrossRef] [PubMed]
- Boxer AL, Yu JT, Golbe LI, Litvan I, Lang AE, Höglinger GU. Advances in progressive supranuclear palsy: new diagnostic criteria, biomarkers, and therapeutic approaches. Lancet Neurol. 2017, 16, 552–563. [Google Scholar] [CrossRef]
- Armstrong, MJ. Progressive Supranuclear Palsy: an Update. Curr Neurol Neurosci Rep. 2018, 18, 12. [Google Scholar] [CrossRef]
- Höglinger GU, Respondek G, Stamelou M, Kurz C, Josephs KA, Lang AE, et al. Clinical diagnosis of progressive supranuclear palsy: The movement disorder society criteria. Mov Disord. 2017, 32, 853–864. [Google Scholar] [CrossRef]
- Josephs KA, Dickson DW. Diagnostic accuracy of progressive supranuclear palsy in the Society for Progressive Supranuclear Palsy brain bank. Mov Disord. 2003, 18, 1018–1026. [Google Scholar] [CrossRef] [PubMed]
- O'Sullivan SS, Massey LA, Williams DR, Silveira-Moriyama L, Kempster PA, Holton JL, et al. Clinical outcomes of progressive supranuclear palsy and multiple system atrophy. Brain 2008, 131 Pt 5, 1362–1372. [Google Scholar] [CrossRef]
- Bensimon G, Ludolph A, Agid Y, Vidailhet M, Payan C, Leigh PN. Riluzole treatment, survival and diagnostic criteria in Parkinson plus disorders: the NNIPPS study. Brain 2009, 132 Pt 1, 156–171. [Google Scholar] [CrossRef]
- Righini A, Antonini A, De Notaris R, Bianchini E, Meucci N, Sacilotto G, et al. MR imaging of the superior profile of the midbrain: differential diagnosis between progressive supranuclear palsy and Parkinson disease. AJNR Am J Neuroradiol. 2004, 25, 927–932. [Google Scholar]
- Gröschel K, Kastrup A, Litvan I, Schulz JB. Penguins and hummingbirds: midbrain atrophy in progressive supranuclear palsy. Neurology 2006, 66, 949–950. [Google Scholar] [CrossRef]
- Adachi M, Kawanami T, Ohshima H, Sugai Y, Hosoya T. Morning glory sign: a particular MR finding in progressive supranuclear palsy. Magn Reson Med Sci. 2004, 3, 125–132. [Google Scholar] [CrossRef]
- Arabia G, Quattrone A. The midbrain to pons ratio: a simple and specific MRI sign of progressive supranuclear palsy. Neurology 2013, 81, 2147. [Google Scholar] [CrossRef] [PubMed]
- Longoni G, Agosta F, Kostić VS, Stojković T, Pagani E, Stošić-Opinćal T, et al. MRI measurements of brainstem structures in patients with Richardson's syndrome, progressive supranuclear palsy-parkinsonism, and Parkinson's disease. Mov Disord. 2011, 26, 247–255. [Google Scholar] [CrossRef] [PubMed]
- Kim YH, Ma HI, Kim YJ. Utility of the Midbrain Tegmentum Diameter in the Differential Diagnosis of Progressive Supranuclear Palsy from Idiopathic Parkinson's Disease. J Clin Neurol. 2015, 11, 268–274. [Google Scholar] [CrossRef]
- Kataoka H, Tonomura Y, Taoka T, Ueno S. Signal changes of superior cerebellar peduncle on fluid-attenuated inversion recovery in progressive supranuclear palsy. Parkinsonism Relat Disord. 2008, 14, 63–65. [Google Scholar] [CrossRef] [PubMed]
- Oka M, Katayama S, Imon Y, Ohshita T, Mimori Y, Nakamura S. Abnormal signals on proton density-weighted MRI of the superior cerebellar peduncle in progressive supranuclear palsy. Acta Neurol Scand. 2001, 104, 1–5. [Google Scholar] [CrossRef]
- Sakurai K, Tokumaru AM, Shimoji K, Murayama S, Kanemaru K, Morimoto S, et al. Beyond the midbrain atrophy: wide spectrum of structural MRI finding in cases of pathologically proven progressive supranuclear palsy. Neuroradiology 2017, 59, 431–443. [Google Scholar] [CrossRef]
- Josephs KA, Whitwell JL, Dickson DW, Boeve BF, Knopman DS, Petersen RC, et al. Voxel-based morphometry in autopsy proven PSP and CBD. Neurobiol Aging 2008, 29, 280–289. [Google Scholar] [CrossRef]
- Price S, Paviour D, Scahill R, Stevens J, Rossor M, Lees A, et al. Voxel-based morphometry detects patterns of atrophy that help differentiate progressive supranuclear palsy and Parkinson's disease. Neuroimage 2004, 23, 663–669. [Google Scholar] [CrossRef]
- Rolland Y, Vérin M, Payan CA, Duchesne S, Kraft E, Hauser TK, et al. A new MRI rating scale for progressive supranuclear palsy and multiple system atrophy: validity and reliability. J Neurol Neurosurg Psychiatry 2011, 82, 1025–1032. [Google Scholar] [CrossRef]
- Jang JW, Park SY, Park YH, Baek MJ, Lim JS, Youn YC, et al. A comprehensive visual rating scale of brain magnetic resonance imaging: application in elderly subjects with Alzheimer's disease, mild cognitive impairment, and normal cognition. J Alzheimers Dis. 2015, 44, 1023–1034. [Google Scholar] [CrossRef] [PubMed]
- Ferreira D, Cavallin L, Larsson EM, Muehlboeck JS, Mecocci P, Vellas B, et al. Practical cut-offs for visual rating scales of medial temporal, frontal and posterior atrophy in Alzheimer's disease and mild cognitive impairment. J Intern Med. 2015, 278, 277–290. [Google Scholar] [CrossRef]
- Scheltens P, Leys D, Barkhof F, Huglo D, Weinstein HC, Vermersch P, et al. Atrophy of medial temporal lobes on MRI in "probable" Alzheimer's disease and normal ageing: diagnostic value and neuropsychological correlates. J Neurol Neurosurg Psychiatry 1992, 55, 967–972. [Google Scholar] [CrossRef]
- Portet M, Filyridou M, Howlett DC. Hot cross bun sign. J Neurol. 2019, 266, 2573–2574. [Google Scholar] [CrossRef]
- Mueller C, Hussl A, Krismer F, Heim B, Mahlknecht P, Nocker M, et al. The diagnostic accuracy of the hummingbird and morning glory sign in patients with neurodegenerative parkinsonism. Parkinsonism Relat Disord. 2018, 54, 90–94. [Google Scholar] [CrossRef]
- Peeraully, T. Multiple system atrophy. Semin Neurol. 2014, 34, 174–181. [Google Scholar] [CrossRef]
- Paviour DC, Price SL, Jahanshahi M, Lees AJ, Fox NC. Longitudinal MRI in progressive supranuclear palsy and multiple system atrophy: rates and regions of atrophy. Brain 2006, 129 Pt 4, 1040–1049. [Google Scholar] [CrossRef] [PubMed]
- Shi HC, Zhong JG, Pan PL, Xiao PR, Shen Y, Wu LJ, et al. Gray matter atrophy in progressive supranuclear palsy: meta-analysis of voxel-based morphometry studies. Neurol Sci. 2013, 34, 1049–1055. [Google Scholar] [CrossRef] [PubMed]
- Virhammar J, Blohmé H, Nyholm D, Georgiopoulos C, Fällmar D. Midbrain area and the hummingbird sign from brain MRI in progressive supranuclear palsy and idiopathic normal pressure hydrocephalus. J Neuroimaging 2022, 32, 90–96. [Google Scholar] [CrossRef]
- Massey LA, Micallef C, Paviour DC, O'Sullivan SS, Ling H, Williams DR, et al. Conventional magnetic resonance imaging in confirmed progressive supranuclear palsy and multiple system atrophy. Mov Disord. 2012, 27, 1754–1762. [Google Scholar] [CrossRef]
- Zhao P, Zhang B, Gao S, Li X. Clinical, MRI and 18F-FDG-PET/CT analysis of progressive supranuclear palsy. J Clin Neurosci. 2020, 80, 318–323. [Google Scholar] [CrossRef]
- Wattjes MP, Huppertz HJ, Mahmoudi N, Stöcklein S, Rogozinski S, Wegner F, et al. Brain MRI in Progressive Supranuclear Palsy with Richardson's Syndrome and Variant Phenotypes. Mov Disord. 2023, 38, 1891–1900. [Google Scholar] [CrossRef] [PubMed]
- Zhang Y, Walter R, Ng P, Luong PN, Dutt S, Heuer H, et al. Progression of Microstructural Degeneration in Progressive Supranuclear Palsy and Corticobasal Syndrome: A Longitudinal Diffusion Tensor Imaging Study. PLoS One 2016, 11, e0157218. [Google Scholar]
- Morelli M, Arabia G, Novellino F, Salsone M, Giofrè L, Condino F, et al. MRI measurements predict PSP in unclassifiable parkinsonisms: a cohort study. Neurology 2011, 77, 1042–1047. [Google Scholar] [CrossRef] [PubMed]
- Massey LA, Jäger HR, Paviour DC, O'Sullivan SS, Ling H, Williams DR, et al. The midbrain to pons ratio: a simple and specific MRI sign of progressive supranuclear palsy. Neurology 2013, 80, 1856–1861. [Google Scholar] [CrossRef]
| Demographic Characteristics | Control (ν=72) | PSP (ν=30) | p-value |
| Age (years) , mean±SD | 66.06±6.88 | 69.16±7.09 | 0.065 |
| Gender , male/female; n(%) | 30(41.7)/42(58.3) | 17(56.7)/13(43.3) | 0.131 |
| Εducation (years), mean±SD | 12.92±3.73 | 12.17±3.00 | 0.290 |
| Dominant hand , Right/Left/Ambidextous; n(%) | 65(90.3)/ 5(7.0)/ 2(2.8) |
27(90.0)/ 2(6.7)/ 1(3.3) |
0.988 |
| ICC | 95% CI | p-value | |
| Enlargement of the third ventricle | 0.935 | 0.90-0.96 | <0.005 |
| Enlargement of the forth ventricle | 0.891 | 0.83-0.93 | <0.005 |
| Lateral ventricle enlargement | 0.968 | 0.95-0.98 | <0.005 |
| Aqueduct of Sylvius enlargement | 0.938 | 0.90-0.96 | <0.005 |
| Midbrain atrophy | 0.966 | 0.95-0.98 | <0.005 |
| Atrophy of the right temporal lobe | 0.965 | 0.95-0.98 | <0.005 |
| Atrophy of the left temporal lobe | 0.961 | 0.94-0.98 | <0.005 |
| Kappa | 95% CI | p-value | |
| Hot Cross Bun sign | 1.00 | 1.00-1.00 | <0.005 |
| Morning glory sign | 1.00 | 1.00-1.00 | <0.005 |
| Hummingbird sign | 1.00 | 1.00-1.00 | <0.005 |
Disclaimer/Publisher’s Note: The statements, opinions and data contained in all publications are solely those of the individual author(s) and contributor(s) and not of MDPI and/or the editor(s). MDPI and/or the editor(s) disclaim responsibility for any injury to people or property resulting from any ideas, methods, instructions or products referred to in the content. |
© 2025 by the authors. Licensee MDPI, Basel, Switzerland. This article is an open access article distributed under the terms and conditions of the Creative Commons Attribution (CC BY) license (http://creativecommons.org/licenses/by/4.0/).


