
Submitted:
13 February 2025
Posted:
14 February 2025
You are already at the latest version
Abstract
Thousands of biomarkers have been discovered to solve the mechanism of cancer but dynamic alterations of the parameters affecting the cancer progression cause chaotic disease status. This is the reason why it is essential to deal with cancer with an eye to analyzing all parameters including pathway information to understand the molecular level of action. In our study, we applied multi-omics data integration method for microbiome, transcriptome and microbial pathway datasets obtained from colorectal cancer patients by including the transcriptome pathway information. Cldn7 gene and Fusobacteria were found to be highly associated, and they both take role in stability of intestinal barrier (r= 0.71). Klf3 was another gene that played a significant role in activation of WNT1 and WNT/β-catein pathways and it demonstrated high correlation with Fusobacteria which was also found to be involved in same pathways. In addition, The Glutaryl-CoA degradation and p-cymene degradation pathways demonstrated a strong positive association with the expression of Ahcy, Eis2s2, Hsp90ab1, Psma7, Lbr, Rpl7l1, Cse1l, Cbx3, Ncl, Hspd1, Tpx2, and Top2a genes (r > 0.65), suggesting their potential involvement in the regulation and metabolic integration of these pathways at the transcriptional level.
Keywords:
Multi-omics data integration
; microbiome
; transcriptome
; metabolic pathways
; colorectal cancer
1. Introduction
Development in the next generation sequencing and bioinformatics have revolutionized our ability to understand the complex biological systems and their relationship with disease occurrence [1,2,3]. Multi-omics data integration is a computational approach that combines multiple layers of omics datasets. It has emerged as a significant tool to unravel biological mechanisms, and this provides comprehensive understanding of the molecular changes in disease occurrence [4].
Omics studies like metagenomics, genomics, transcriptomics, proteomics, metabolomics etc. provides remarkable insights to comprehend the disease states [5,6]. However, only one omics analysis is not enough to evaluate the diseases [7,8]. Especially cancer like complex diseases needs the combination of the omics study outputs to provide the evaluation of disease from all perspectives [9]. PCA (Principal Component Analysis), CCA (Canonical Correlation Analysis), CoIA (Co-Inertia Analysis), MFA (Multivariate Factor Analysis), PMA (Penalized Multivariate Analysis), PLS (Partial Least Square), Recursive Feature Elimination (RFE), Graph-Fused methods, Lasso Penalization methods, Bayesian classification methods, Regression methods are most preferred multi-omics integration techniques [10,11,12,13]. They generally focus on collecting the most explanatory features from different layers of omics datasets and merging all this information to obtain interactions. Despite the number of integration studies increasing dramatically, it is still difficult to obtain a golden standard. Because, handling large number of datasets containing huge number of variables is still challenging [14,15]. However, the results obtained from developed multi-omics analyzing packages provide promising results especially to explain complex cancer diseases [16,17,18]. In research conducted by Vartika Bisht and his colleagues, Recursive Feature Elimination (RFE), BART method and Bayesian classification were used for integration of omics datasets, and they discovered Kiaa1199, Cdh3, Guca2b, Lgals4, Ca7, Nrc3c2, Abcg2 and Aqp8 genes associated with cancer pathophysiology. Furthermore, they also concluded that Staphylococcus, Blautia and Roseburia were interacting with cholesteryl ester metabolite which is prominent in colorectal cancer patients [19]. All have shown remarkable cancer hallmarks such as resistance to apoptosis, angiogenesis, cell evasion, cancer pathogenicity etc. for enlightened understanding of cancer mechanism of action.
Colorectal cancer (CRC) is the third most common cancer type across the world and it demonstrates quite dynamic changes caused by environmental effects such as geography, climate, lifestyle habits (good/bad), diet, genetic information etc. [20,21]. Scientists have been trying to find potential biomarkers based of stages information and classify the CRC patients into four groups named Consensus Molecular Subtypes (CMS1, CMS2, CMS3, and CMS4) [22]. In a study published in 2017, transcriptome dataset of the 377 patients (data obtained from The Cancer Genome Atlas) were analyzed and expression level of Nek4, Rnf34, Hist3h2bb, Nudt6, Lrch4, Glb1l, Hist2h4a, Tmem79, Amıgo2, C20orf135 and Spsb3 genes were significantly differed between cancer stages (p= 0.0001) [6]. CMS groups are constructed based on immune infiltration and activation, signaling pathway information, metabolic dysregulation and stromal infiltration. Another study revealed the association of microbial changes between CMS groups. According to the results, Fusobacteria and Bacteroidetes were found to be enriched, whereas Firmicutes and Proteobacteria decreased in CMS1 subgroups. In addition to that Fusobacterium hwasookii and Porphyromonas gingavilis demonstrated the highest enrichment in CMS1 subgroup. Selenomonas and Prevotella species were discovered to indicate significant increase in CMS2 subgroup [24]. This grouping approaches are quite important to better diagnose of the patients and selecting the best treatment methodology. Studies that focused on the assessment of gut microbiome and host transcriptome provided in depth knowledge about colorectal cancer occurrence. However, it still needs the integration of omics results to provide pathway specific interactions.
In this study, we aimed to integrate microbiome, transcriptome and microbial pathway datasets obtained from CRC patients to unveil the specific interactions of host genome and microbial community. The results of the integration were consolidated by the host pathway dataset obtained from transcriptome data and the databases like genecard, metacyc, ncbi, KEGG (Kyoto Encyclopedia of Genes and Genomes) and Uniprot (Universal Protein Knowledgebase) [25,26,27,28,29]. Our analysis consisted of two approaches, one focusing on the integration of all information of the omics analysis results to provide a more comprehensive perspective not to neglect any potential interaction. The second one was more specific, it only focused on the integration of statistically significant outputs of the omics analysis. Both approaches presented non-negligible outcomes by providing latent interactions between datasets.
2. Materials and Methods
2.1. Patient Cohort and Experimental Design
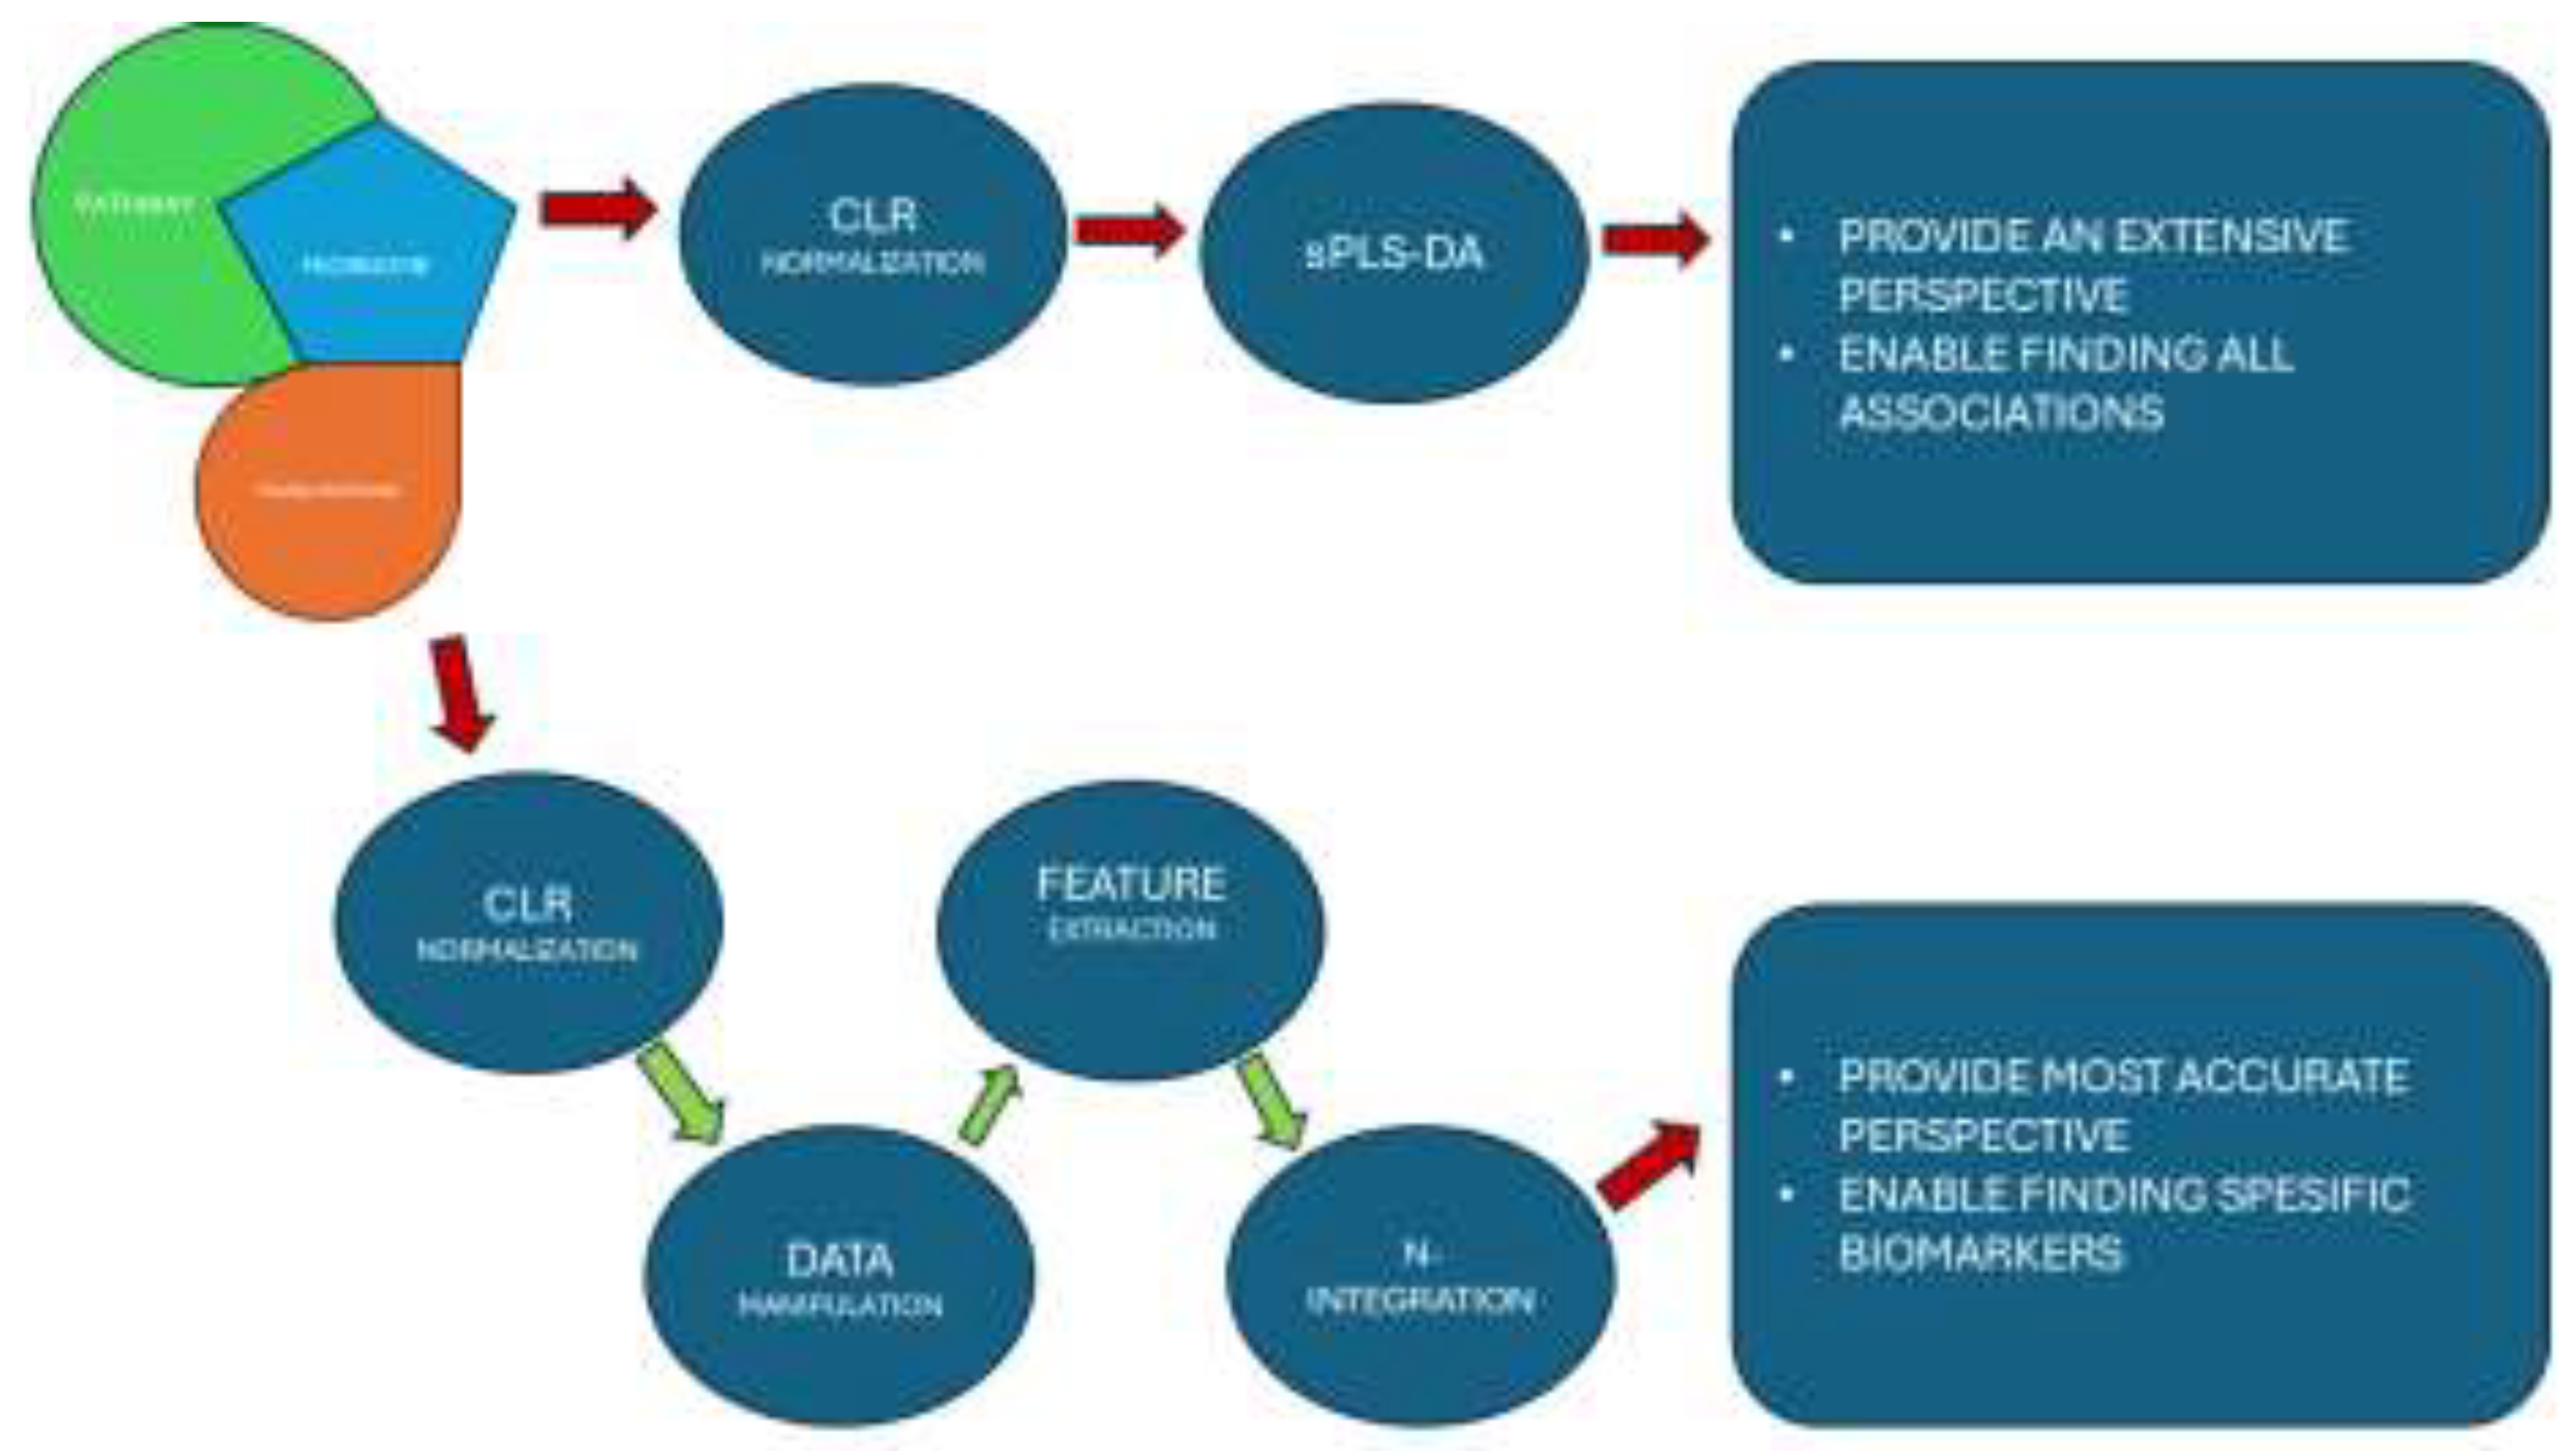
Transcriptome and microbiome 16SrRNA raw datasets were obtained from recent study “Distinct gut microbiome patterns associate with consensus molecular subtypes of colorectal cancer” published by Rachel V. Purcell et. al. in 2017 [24]. Tumor samples were obtained from 34 colorectal cancer patients. 20 of them were collected from female and remaining 14 samples from male patients with the age ranged from 44-88 years (mean 74, S.D. ± 8.4). Beside age and gender, metadata also contains “Site” referring to the site of the tumor samples (one sample was obtained from rectum and others were collected from colon), “Side” referring to the position of the tumor samples (21 from right-side and 12 from left-side), “Stage” referring to the stage of the cancer patient (5 tumor tissue were stage 1, 14 were stage 2, 13 were stage 3 and 1 sample was stage 4) and “CMS” referring to which consensus molecular subtype that the tumor sample belongs (6 of them belonged to CMS1 group, 13 of them belonged to CMS2 group, 9 samples belonged to CMS3 group and 5 weren’t classified properly and were reported as unclassified (UC)). Both transcriptome and microbiome raw datasets were analyzed again including the pathway analysis. Microbial pathway abundance data was constructed because of pathway analysis of 16SrRNA analysis. Microbial pathway abundance data, transcriptome data and microbiome datasets were integrated by using two approaches. The first approach includes normalization and sparse partial least square discriminant analysis, and the second one includes normalization, feature selection and N-integration method. Dataset obtained from transcriptome analysis, genecard database and metacyc databases were used for the validation of the information obtained from integration of three datasets.
Figure 1.
The chart demonstrates the experimental flow and adventages of both aproaches at the end.
2.2. Microbiome and Pathway Analysis
16SrRNA analysis were performed for determining the microbial community on tumour samples. Raw datasets that were generated by Illumina Miseq platform contained 250bp long reads that cover V3-V4 region of 16SrRNA gene. FLASh (ver. 1.2.11) was used for merging forward and reverse reads. Pre-processing analysis was done by using QIIME2 (ver. 2023.5) [30]. Quality assessment and removal of chimeric sequences were performed by DADA2 (ver. 3.19) [31]. The taxonomic classification was performed using the q2-feature-classifier plugin within the QIIME2 framework, leveraging the Greengenes database as a reference. Operational Taxonomic Unit (OTU) tables were subsequently generated. Differential abundance analysis was conducted using ANCOM-BC (version 3.19).
Furthermore, the biom files derived from the QIIME2 pipeline were utilized for microbial functional pathway prediction analysis that was carried out by using PICRUST2 (ver. 2.4.1.) plugin of QIIME2 analysis platform [32]. KEGG orthology database was used for estimation of molecular functions. 16SrRNA dataset and microbial pathway abundance dataset were saved for further integration analysis.
2.3. Transcriptome and Pathway Analysis
Tumor samples were sequenced using the Illumina HiSeq platform, generating 125 bp paired-end reads. Adapter sequences were removed using Fastq-mcf (v1.1.2.537), followed by quality-based trimming of long reads, removal of reads shorter than 50 bp, and exclusion of low-quality reads using SolexaQA++ (v3.1.6). Filtered reads were aligned to the human genome reference GRCh38 using the STAR mapping tool (v2.5.2b). The resulting alignments were processed with Samtools (v1.3.1) for read merging and quantification via htseq-count.
Raw read counts were normalized to transcripts per million (TPM) using the DESeq2 package (v1.10.1) in R. RNA-Seq analysis culminated in pathway enrichment analysis using the pathfindR package (v2.1.0) in R [33]. Pathway annotations were retrieved from the KEGG database, with significant pathways filtered based on a false discovery rate (FDR) threshold of 0.05. Pathways meeting the FDR-adjusted p-value criteria were selected for downstream analyses. Transcriptome datasets were reserved for further integration analysis, whereas host (human) pathway datasets were kept for validation of the results obtained from multi-omics data integration.
2.4. Data Standardization and Pre-Processing
16SrRNA microbiome data (at each taxonomic level), microbial pathway abundance data and the transcriptome data were normalized by using centered log ratio (CLR) normalization method. Spls-DA was applied to data to fulfil our first approach in the multi-omics integration. Preprocessing was applied to each dataset for the improvement of the machine learning model accuracy and correlation coefficient obtained at the end of the first approach integration. Samples that belong to the UC group were excluded from the dataset directly by using dplyr package (ver. 1.1.4.) and tidyverse package (ver. 2.0.0.). Then, feature selection was applied based on the significance of the variables in the datasets. First, Shapiro-Wilk test was applied to check the normality of the data and Kruskal-Wallis’s test was performed . Variables that were found to be non-significant were filtered out from the datasets. We constructed new microbiome (phylum level, n=5 where n refers to number of variables), transcriptome (n=851) and microbial pathway abundance (n=26) datasets containing only significant variables at the end of the preprocessing step. CLR normalization was applied to new datasets to be used in N-Integration method.
2.5. Data Integration by Using sPLS Analysis
Sparse Partial Least Square-Discriminant Analysis (sPLS-DA) was performed by mixomics package (version 6.10) in R, for 16SrRNA microbiome, transcriptome and the microbial pathway abundance datasets as pairs to understand the association between them [34]. PLS models were tuned based on 10-fold cross validation, the parameters were used as default applied for two matrices X and Y which corresponds with omics datasets in our case. Selected explanatory variables were used for visualization of CMS groups via Principal Component Analysis (PCA) and correlation between variables that were selected from different datasets were displayed as heatmaps constructed based on hierarchical clustering with Euclidean distance method.
2.6. Data Integration by Using N-Integration
Data integration Analysis for Biomarker discovery (DIABLO) method which is also named as N-Integration method was used for specific detection of biomarkers. Preprocessed datasets were used for increasing the accuracy of the model compared to previous approach. Supervised model was tuned based on 10-fold cross validation for 10 times. Most explanatory variables obtained from constructed components were separated and underwent correlation. Heatmaps based on hierarchical clustering with Euclidean distance method and network visualization based on correlations between variables were used to illustrate the association of different omics datasets.
2.7. Statistical Analysis
All statistical analyses were conducted using R (version 4.4.1) [35]. Data distribution was assessed using the Shapiro-Wilk test. For subgroup comparisons, the Kruskal-Wallis test and pairwise Wilcoxon tests were applied, with multiple testing correction performed using the Benjamini-Hochberg method. A false discovery rate (FDR)-adjusted p-value threshold of <0.05 was set for statistical significance. Mixomics package was used for discovering the correlation of variables by using Machine learning methodologies were implemented utilizing mixOmics (v6.10) and caret (v6.0.94) packages, facilitating advanced data integration and predictive modeling workflows.
3. Results
3.1. This Microbiome Analysis and Functional Pathway Prediction
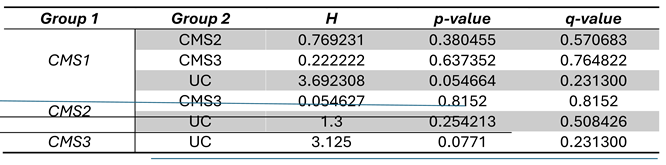
The results of 16SrRNA microbiome analysis indicated that CRC patients that belong to CMS1 group had enriched level of Fusobacteria (p < 0.05) and Bacteroidetes (p > 0.05) and decreased level of Firmicutes (p > 0.05) and Proteobacteria (p < 0.05) at phylum level (p < 0.05) (Figure 2). Results at genus level demonstrate that the abundance of Prevotella significantly increased in CMS1 group. Moreover, Bacteroides was significantly enriched in CMS2 and CMS3 groups. The most abundant genera were Bacteroides in each CMS group in CMS1 is 48%, 65% in CMS2 and 29% in CMS3. It was followed by Faecalibacterium as the second highest abundant genera in CMS1 and CMS2, with 15% and 4% percentage respectively. Clostridium and Faecalibacterium had almost the same relative abundance in CMS3 patient group with 5.5%. The data normality was checked by Shapiro test and the non-linear distribution of variables were confirmed. So, pairwise Wilcoxon test was applied to each CMS group to observe a significant differences between each group. The results showed no significant difference between CMS subgroups, the statistical results obtained from pairwise Wilcoxon test were indicated in Table 1. Picrust2 plugin was used for functional characterization of OTU tables. Pathway information was driven from Kyoto Encyclopedia of Genes and Genomes (KEGG) database. 478 pathways (shown in Supplementary_File_1) were found by pathway prediction analysis, univariate feature selection was performed to determine significant variables (pathways) that were decreased to 26 after selection. These pathways were kept for the multi-omics integration analysis.
3.2. Transcriptome and Pathway Enrichment Analysis
Results generated from RNA-Seq analysis were demonstrated in a volcano plot. Rn7sk, Rpph1, Rn7sl1, Rn7sl2, Znf460, Snord17, Snora73b, H1-4, H4c12, H3c7 genes were discovered to be highly upregulated in tumor tissue collected from colorectal cancer patients (Figure 3A). PCA was also carried out for RNA-Seq results. Variables that are included in transcriptome data did not cluster each CMS group properly (Figure 3B). RNA-Seq analysis was followed by pathway enrichment analysis to observe which gene is upregulated or downregulated in their related pathways. 179 pathways (from KEGG database) were found to be associated with over 5000 genes that are either downregulated or upregulated indicated in Supplementary_File_2. The pathway enrichment results were not used for the integration of omics datasets, it was driven for the validation of the selected genes attained from sPLS and DIABLO multi-omic integration analysis.
3.3. Integration of Microbiome and Transcriptome Datasets Using sPLS Method
Pairwise multi-omics integration was carried out by sPLS model for dataset generated as a result of 16SrRNA and transcriptome analysis. This first approach of our integration analysis aimed to find association by including all variables to be able to observe the relation in a comprehensive way. Variables that were selected by regression were used for creating a heatmap to illustrate the correlation between each dataset.
The heatmap analysis exhibits intricate correlation between phylum level microorganisms and gene expression profiles derived from transcriptomic data (Figure 4A). Excluding the Spirochaetes and Verrucomicrobia, the heatmap directly discriminates patients into two groups. The first cluster includes Klf3, Cldn7, Plekhg3, Mall, Rna5-8n2, Snord10, Sytl2, Dnm2, Cxadr, Tff3, Serpina1, Fam120a, Rtn4, Mıb1, Oip5-as1, S100a6, and H1-5 genes, along with the phyla Actinobacteria, Cyanobacteria, Tenericutes, TM7, Bacteroidetes, Firmicutes, and Proteobacteria. The second group encompasses the genes Adar, Csnk2a1, Rpl37, Ahctf1, Odc1, Nup98, Ccdc14, Znf292, Ccnd2, Igkc, Prdx5, Gpsm2, Gpx2, Pan3, Tkt, Rpl22, Ahcy, Nme2, Rbm12, Cct6a, Rplp2, and Slc7a1, together with the bacterial phyla Synergistetes and Fusobacteria. Notably, a strong positive correlation was observed between the phylum Spirochaetes and the expression of Oip5-as1, S100a6, H1-5, and Adar genes (r = 0.71), indicating a potential regulatory relationship. Likewise, Fusobacteria exhibited a significant positive association with Klf3, Cldn7, Sytl2, Dnm2, and Tff3 genes (r = 0.70), underscoring its potential involvement in related molecular pathways. Correlations with a coefficient below 0.5 were excluded from further investigation. Negative correlations were also identified: Spirochaetes indicates a strong negative relationship with Tff3, Serpina1, and Prdx5 (r = -0.71). In addition, Fusobacteria is inversely correlated with Odc1, Nup98, Ccdc14, Ahcy, and Cct6a genes (r = -0.69). Furthermore, Synergistetes shows negative associations with Rpl22, Ahcy, and Gpsm2.
These findings highlight the complex interplay between microbial taxa and host gene expression, emphasizing key correlations that may provide insights into functional and pathological mechanisms. The PCA that was conducted on selected variables obtained from microbiome and transcriptome datasets did not manage to discriminate each CMS group (Figure 4B).
3.4. DIABLO Integration for preprocessed microbiome, transcriptome and microbial pathway datasets
Unclassified samples were extracted from microbiome, transcriptome and microbial pathway abundance datasets and non-significant variables from each data were excluded via pairwise Wilcoxon test based on CMS subgroups. This second approach with cleanup preprocessing was applied for both increasing the model accuracy and for obtaining more precise correlations by minimizing data heterogeneity. DIABLO was carried out to integrate omics data. Pre-processed data underwent sparse partial least square regression discriminant analysis (sPLS-DA) first and the components are constructed that have variables from each omics block. The majority of explanatory variables were identified using a supervised learning model, and these variables were consolidated into components. For downstream analysis, the most informative components (the first and second ones in our case) were selected. To evaluate the discriminative power of the variables comprising these components, sample plot was employed, revealing their ability to delineate and characterize group differences effectively. Notably, variables derived from the transcriptome block demonstrated a robust capacity to capture the segregation and intricate relationships among the molecular subtypes (Figure 5).
Significant features are selected as explanatory variables for the classification of CMS subgroups as a result of the sPLS-DA regression model. Rothia from microbiome data and L.lysing and CRNFORCAT pathways were selected from microbial pathway data to explain the patient status of CMS1 subgroup. The model did not identify any transcriptomic features as discriminative for the CMS1 subgroup. However, for the CMS2 subgroup, the transcriptomic analysis highlighted key genes, including Top2a, Hsp90ab1, Ncl, Ahcy, Hspd1, Psma7, Eif2s2, Cbx3, Cse1l, Lbr, and Tpx2 as critical for distinguishing this molecular subtype. Additionally, the microbial pathway analysis identified the p-Cymene degradation pathway and the glutaryl-CoA degradation pathway, while Dialister from the microbiome data showed the highest explanatory value in classifying the CMS2 subgroup.
For the CMS3 subgroup, the model pinpointed Atp8a1, Akap13, and Reg4 from the transcriptomic dataset as highly informative. Furthermore, microbial taxa such as Desulfovibrionaceae, Gamellaceae, and Paraprevotella were identified as significant contributors from the microbiome dataset. From the microbial pathway dataset, the myo-Inositol degradation pathway was selected for its relevance in explaining the CMS3 subgroup. These multi-omics features collectively provide a comprehensive framework for understanding the molecular and microbial underpinnings of the CMS subgroups (Figure 6).
Circle plot was used to observe the relation of the variables that are obtained from different omics datasets (Figure 6). Variable coordinates are determined by correlation of component 1 and component 2 obtained from features extracted by 10-fold cross validation Features that construct the component 1 and component 2 are plotted in coordinate system. Proximity of the variables at the poles demonstrates the strong biological relation.
Further investigation was made into understanding the relation between variables. Association was demonstrated by network visualization and circos plot. Glutaryl Coa degradation and p-cymene degradation pathways were positively associated with Ahcy, Eif2s2, Hsp90ab1, Psma7, Lbr, Rpl7l1, Cse1l, Cbx3, Ncl, Hspd1, Tpx2 and Top2a genes. Especially, association of these pathways (Glutaryl Coa degradation and p-cymene degradation pathways) with Cse1l and Tpx2 genes were quite remarkable with highest correlation coefficient value (r = +0.94) (Figure 8).
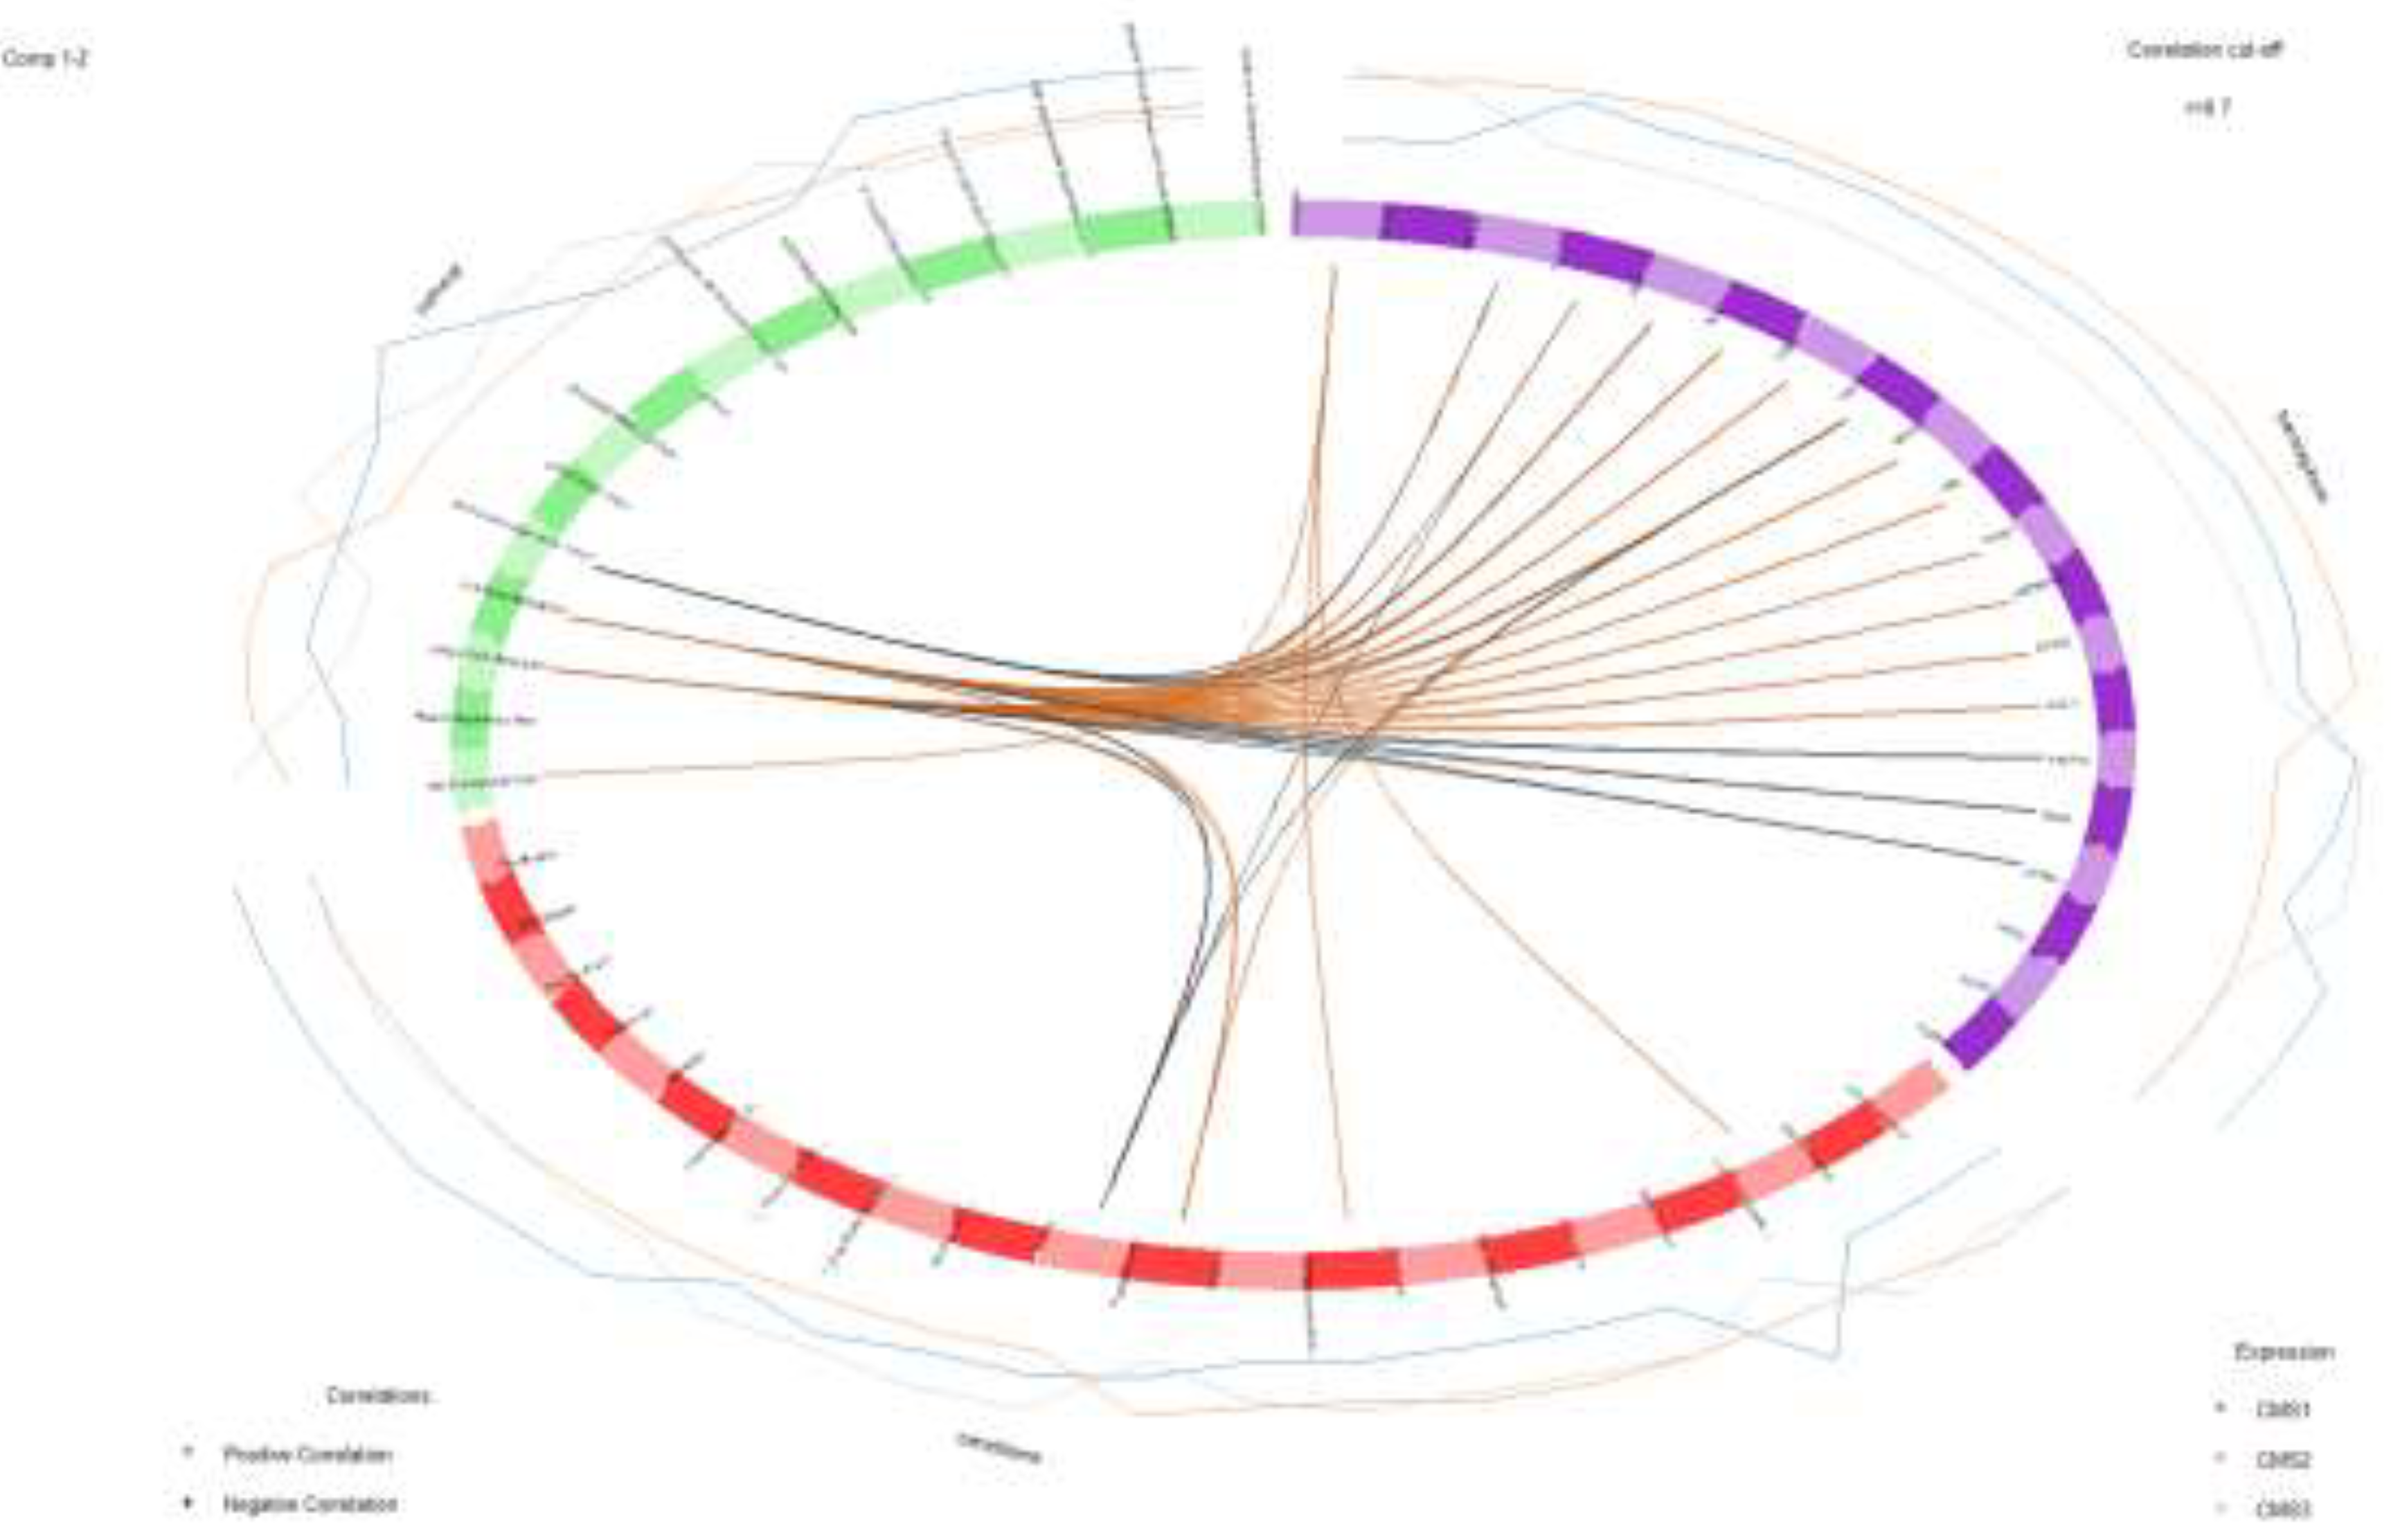
Circos plot was generated to observe the correlation between variables attained from each omics data, in a closer way (Figure 9). It indicates positively and negatively correlated features by connecting them with the lines. In our study, the myo-Inositol degradation pathway exhibited a significant negative association with the genes Top2a, Tpx2, Hspd1, and Cse1l. Similarly, the glutaryl-CoA degradation pathway and p-cymene degradation pathway were negatively correlated with Paraprevotella (from microbiome dataset) and the transcriptomic genes Akap13, Reg4, and Atp8a1.
Conversely, the methionine acetate pathway demonstrated a positive correlation with the Sema5a gene. Positive associations were also identified between the glutaryl-CoA degradation pathway and p-cymene degradation pathway and the Dialister genus. Additionally, Ruminococcaceae and Lachnospiraceae were positively linked to Sema5a, while Dialister showed a positive correlation with Cse1l. In contrast, Paraprevotella displayed a negative association with the genes Tpx2 and Cse1l, underscoring a complex interplay between these microbial and transcriptomic elements within the dataset. These findings provide nuanced insights into the interconnected pathways and their relationships across multiple data modalities.
4. Discussion
Huge number of variables, content and structure of different omics datasets have been an issue to deal with. Nevertheless, the number of multi-omics integration studies increases because it provides great insights to understand complex mechanisms. In our study we aimed to produce interactions of transcriptome, microbiome, and microbial pathway datasets obtained from colorectal cancer patients. Pathway enrichment analysis was done for transcriptome data and human pathways associated with up-regulated and down-regulated genes were recorded. Both microbial pathway dataset obtained from 16SrRNA analysis and pathway enrichment table results obtained from transcriptome analysis gave promising outputs in mechanisms of colorectal cancer progression. Metacyc, Biocyc, Genecard and KEGG databases were used to evaluate the functional interactions came by the multi-omics integration analysis.
4.1. sPLS for Multi-Omics Data Integration
Partial Least Squares (PLS) was selected among numerous available approaches due to its proven utility in multi-omics integration studies and its robustness for continuous development. The sparse Partial Least Square (sPLS) provided a comprehensive overview of the data, despite the known limitation of reduced explanatory power for individual components. This limitation arises from the method’s emphasis on retaining as many variables as possible to maximize covariance between datasets. Nevertheless, the results derived from the subsequent correlation analysis following sPLS regression were highly interpretable and biologically relevant.
Notably, the analysis revealed a remarkable association between the Cldn7 gene and Fusobacteria. Cldn7, a critical member of the claudin family, plays a fundamental role in the structural integrity of tight junctions. The reduced expression level of this gene has been strongly linked to the progression of cancer [36]. Fusobacteria species, frequently detected in colorectal cancer, are known to disrupt the intestinal barrier. Previous studies have demonstrated that Fusobacterium nucleatum compromises the oral mucosal epithelial barrier by inhibiting Cldn4, another claudin family member [37,38]. Our findings suggest that the observed strong correlation between Fusobacteria and Cldn7 may indicate a similar mechanism leading to tight junction disruption and subsequent barrier collapse.
In addition, Klf3 was identified as positively correlated with Fusobacteria. Klf3 is a transcription factor that plays a pivotal role in activating WNT1 and the WNT/β-catenin signaling pathway, which are key drivers of colorectal cancer progression [39]. Supporting this observation, previous research has demonstrated that Fusobacterium nucleatum promotes colorectal cancer progression through Cdk5-mediated activation of the WNT/β-catenin pathway [40].
RNA-Seq enrichment analysis further supported these associations, revealing downregulation of Wnt2, Wnt3, Notum, Lrp5, Lrp6, Csnk2a2, Gsk3b, Chd8, Crebbp, Ep300, Tbl1xr1, Invs, Plcb3 and upregulation of Wnt2b, Wnt5b, Serpinf1, Dkk1, Sfrp1, Sfrp2, Sfrp4, Rspo2, Rspo3, Fzd1, Fzd4, Frat1, Tcf7l1, Cby1, Sox17, Ctnnd2, Ccnd3, Prkaca, Skp1, Rbx1, Ror1, Prickle1, Daam2, Rhoa, Rac2, Mapk10, Ppp3ca, Ppp3cb all of which are involved in the WNT signaling pathway.
Without the integrative capability of sPLS, the identification of the interplay between Klf3 and Fusobacteria, or Cldn7 and Fusobacteria, would have been overlooked. Specifically, the association of Fusobacteria with Cldn7 suggests a potential role in tight junction destabilization, while its correlation with Klf3 points to its involvement in WNT/β-catenin pathway dysregulation in colorectal cancer. These findings underscore the value of sPLS in revealing complex biological relationships, despite its lower explanatory power for individual components. By offering a comprehensive integrative perspective, sPLS provides essential insights for pathway-driven diagnostics, which are crucial for understanding multifaceted diseases such as cancer.
4.2. Impact of the Pre-Processing Datasets
First approach aimed to include all the variables not to miss any detailed information. Despite the fact that, even potential outcomes were received by sPLS analysis, we still needed to get rid of the noise of the datasets to produce more significant interactions. Unclassified samples were extracted from the datasets and Wilcoxon test was performed to keep only significant features. This preprocessing provided the reduction of noisiness in data and performing DIABLO for this preprocessed data demonstrated increased accuracy of the model. As well as it also increased the correlation coefficients values obtained from correlation of the variables constructed the components of the model. Especially, explanatory variables obtained from transcriptome dataset provided best discrimination of CMS subgroups.
4.3. Multi-Block sPLS for Multi-Omics Data Integration for Pre-Processed Datasets
As we interpret the results from microbial pathway point, we discovered that Glutaryl Coa degradation and p-cymene degradation pathways were positively associated with Ahcy, Eif2s2, Hsp90ab1, Psma7, Lbr, Rpl7l1, Cse1l, Cbx3, Ncl, Hspd1, Tpx2 and Top2a genes (r > 0.65). Particularly, correlation of these pathways with Cse1l and Tpx2 genes were significantly high (r = 0.94). P.cymene degradation pathway demonstrates antitumor influence on cancer patients. The mechanism behind this is thought of as a reduction of inflammatory factors like IL-1 and LEP, whereas upregulation of IL-6 that promotes growth of Bifidobacteria and Clostridium IV [41]. Another prominently identified microbial pathway was the Glutaryl-CoA degradation pathway, which plays a pivotal role in the metabolism of lysine, tryptophan, and hydroxylysine, and has been recognized for its anti-tumor properties. Prior research demonstrated that inhibition of this pathway induces NRF2 glutarylation, thereby enhancing its stability. This process subsequently activates the ATF4-ATF3 signaling cascade, ultimately leading to cancer cell apoptosis [42]. In the present study, the observed increase in p-cymene levels within tumor tissue suggests that this compound may represent a host immune response mechanism, potentially mediated by commensal microbiota to counteract tumor development and progression. Evidence of p.cymene mediated inhibition of MMP-9 (matrix metalloproteinases) expression shows its anti-tumor activity. Besides that, MMP-2 and MMP-9 inhibition play an important role in degradation of extracellular matrix. Moreover, ERK1/2 and p38 MAPK signal pathways were also inhibited by p-cymene [43]. Direct or the indirect impact of the p-cymene on the inhibition of these genes emerges promising therapeutic strategy. In our study we have found that MMP-2 genes were downregulated in diabetic cardiopathy I, preteoglycyns in cancer, estrojen signaling, fluid shear stress and atherosclerosis, relaxing signaling, bladder cancer, and GnRH signaling pathways (Table S1). So that, our results that are strengthened by literature strongly propose the potential interaction of p.cymene on MMP-2 inhibition.
Hspd1 gene is a heat shock protein which is related to transcription and peroxisomal lipid metabolism. The Hspd1 gene has been identified as essential for maintaining metabolic fitness, with its activity being critical for sustaining cellular energy homeostasis. A study published in 2021 demonstrated that loss-of-function mutations in Hspd1 lead to a profound energetic collapse, which directly impairs the ability of cancer cells to proliferate and expand, thereby disrupting tumor progression. [44]. Cbx3 is taking role in transcription, RNA polymerase and promoter opening pathways. Also, studies indicate that this gene is overexpressed in a variety of cancers but still a poor prognosis biomarker in cancer patients [45,46]. Cse1l gene is chromosome segregation 1 like gene that play role in p53 effector and Golgi to endoplasmic reticulum traffic pathways. Researchers discovered that Cse1l directly promotes the development of tumors in various malignancies [47]. Lbr gene is Lamin B receptor that takes role in super pathway of cholesterol biosynthesis and transcription pathways. Its role in cancer was revealed as Lbr protects the genome from tumorigenesis and chromosomal instability [48]. Tpx2 gene is a microtubule nucleation factor found in microtubule organization pathways. It depicts upregulated expression level profiles in CRC patients [49]. In our study, significantly discovered microbial pathways were having a notable protective role against cancer, whereas significantly found genes were generally oncogenes. This indicates the impact of the microbial community on tumor tissue to suppress tumor growth. Further research is needed to unravel the exact mechanism of action in these microbial pathways against cancer and their relation through these oncogenes.
Circos plot was generated to observe the correlation between variables in a closer way. It indicates positive and negatively correlated features by connecting them with the lines with the correlation cut off = 0.7. In our study, MYO-inostol degradation pathway was found to be negatively associated with Top2a, Tpx2, Hspd1 and Csel1 genes. In addition to that, The Glutaryl-CoA degradation and p-cymene degradation microbial pathways demonstrated a negative association with Paraprevotella in the microbiome dataset and with the Akap13, Reg4, and Atp8a1 genes in the transcriptome dataset. Conversely, the meth-acetate pathway exhibited a positive correlation with the Sema5a gene. Additionally, Glutaryl-CoA degradation and p-cymene degradation pathways were positively linked to the Dialister genus.
Notably, both Ruminococcaceae and Lachnospiraceae showed a positive correlation with the Sema5a gene, while Dialister was positively associated with the Csel1 gene. In contrast, Paraprevotella exhibited a negative association with Tpx2 and Csel1 genes, suggesting potential functional interactions between microbial communities and host gene expression.
Components of the last integration model with implementation of preprocessing datasets was constructed by Hspd1, Cbx3, Csel1, Lbr and Tpx2genes from transcriptome data, Actinobacteria, Spirochaetes, Fusobacteria, Bacteroidetes and Proteobacteria from microbiome data and cholorthocleavage pathway, crnforcat pathway, MYOinotsitol degradation pathway, p.cymene degradation pathway and glutaryl.CoA degradation pathway from microbial pathway abundance dataset. Contribution of the datasets to explain CMS groups were increased and weights for transcriptome, microbiome and pathway are reached to 0.80, 0.73 and 0.60 respectively. Model that was designed to predict CMS groups achieve over 95%. Correlation analysis made for the explanatory components and Hspd1, Cbx3, Csel1, Lbr and Tpx2 genes were discovered to be highly associated with p.cymene degradation and glutaryl-CoA degradation pathways.
Hspd1, Cbx3, Csel1, Ncl, Top2a and Tpx2 genes and Proteobacteria indicated negative association. Moreover, Proteobacteria was also found to be negatively correlated with p.cymene degradation and glutaryl CoA degradation pathways. P.cymene promotes the growth of genus Bifidobacterium and genus Clostridium which they belong to Actinomycetota and Firmicutes respectively[41]. Including this negative association, all output shows reasonable significant outcomes which are potential candidates raking part in colorectal cancer progression. However experimental validation is still necessary to comprehend the exact mechanism of action at molecular level.
5. Conclusions
Cancer is one of the most studied diseases worldwide, however there is still no exact treatment approach to get over it. Rather than discovering new biomarkers, it is quite significant to understand a person’s specific outputs to unravel the mystery behind complex biological mechanisms in cancer like complex diseases. Strong interactions of Klf3 and Cldn genes with Fusobacteria were quite promising output to protect the tight junction structure on intestinal barrier. Also, the role of p-cymene degradation and Glutaryl-Coa degradation pathways was discovered as very important defensive mechanisms against tumor. All these findings are quite promising to be validated in further experimental research. Increasing number of multi-omics integration approaches in research will provide to evaluate the details of the molecular mechanisms and eventually we will be able to serve person specific, pathway dependent solutions to cure the cancer.
Supplementary Materials
The following supporting information can be downloaded at the website of this paper posted on Preprints.org. Microbial pathway abundance csv file obtained from picrust2 analysis and pathway enrichment csv file obtained was used as Supplementary_File_1, Supplementary_File_2 respectively.
Author Contributions
T.K.: Conceptualization, Investigation, Formal analysis, Validation, Visualization, Writing original draft. S.O.O.: Project administration, Validation, Editing. G.B.A.: Project administration, Methodology, Validation, Editing. O.U.S.: Project administration, Methodology, Writing-review and editing, Supervision.
Funding
This study was funded by the TÜBİTAK 2244 Program, which supported Tayyip Karaman with a scholarship and provided access to computational resources for performing all necessary analyses.
Data Availability Statement
Transcriptome and microbiome 16SrRNA raw datasets were obtained from recent study “Distinct gut microbiome patterns associate with consensus molecular subtypes of colorectal cancer” published by Rachel V. Purcell et. al. in 2017 by the permission of the authors. The datasets can be found in pubmed database https://pubmed.ncbi.nlm.nih.gov/31278253/ .
Conflicts of Interest
The authors declare no conflicts of interest.
Abbreviations
The following abbreviations are used in this manuscript:
| PCA | Principle Component Analysis |
| CCA | Canonical correlation Analysis |
| CoIA | Co-Inertia Analysis |
| MFA | Multivariate Factor Analysis |
| PMA | Penalized Multivariate Analysis |
| PLD | Partial Least Square |
| RFE | Recursive Feature Elimination |
| CRC | Colorectal Cancer |
| CMS | Consensus Molecular Subtype |
| Ncbi | National Center for Biotechnology Information |
| KEGG | Kyoto Encyclopedia of Genes ad Genomes |
| Uniprot | Universal Protein Knowledgebase |
| SPLS-DA | Sparse Partial Least Squares Discriminant Analysis |
| FDR | False Discovery rate |
| TPM | Transcript per Million |
References
- Author 1. Hu, T.; Chitnis, N.; Monos, D.; Dinh, A. Next-Generation Sequencing Technologies: An Overview. Human Immunology 2021, 82, 801–811. [CrossRef]
- Watts, G.S.; Hurwitz, B.L. Metagenomic Next-Generation Sequencing in Clinical Microbiology. Clinical Microbiology Newsletter 2020, 42, 53–59. [Google Scholar] [CrossRef]
- Review on Mechanism of DNA Sequencing Technologies in Crop Improvement. International Journal of Research Studies in Agricultural Sciences 2021, 7. [CrossRef]
- Reel, P.S.; Reel, S.; Pearson, E.; Trucco, E.; Jefferson, E. Using Machine Learning Approaches for Multi-Omics Data Analysis: A Review. Biotechnology Advances 2021, 49, 107739. [Google Scholar] [CrossRef]
- Chiu, C.Y.; Miller, S.A. Clinical Metagenomics. Nat Rev Genet 2019, 20, 341–355. [Google Scholar] [CrossRef] [PubMed]
- Huo, T.; Canepa, R.; Sura, A.; Modave, F.; Gong, Y. Colorectal Cancer Stages Transcriptome Analysis. PLoS ONE 2017, 12, e0188697. [Google Scholar] [CrossRef] [PubMed]
- Zou, S.; Yang, C.; Zhang, J.; Zhong, D.; Meng, M.; Zhang, L.; Chen, H.; Fang, L. Multi-Omic Profiling Reveals Associations between the Gut Microbiome, Host Genome and Transcriptome in Patients with Colorectal Cancer. J Transl Med 2024, 22, 175. [Google Scholar] [CrossRef]
- Xie, Z.; Huang, J.; Sun, G.; He, S.; Luo, Z.; Zhang, L.; Li, L.; Yao, M.; Du, C.; Yu, W.; et al. Integrated Multi-Omics Analysis Reveals Gut Microbiota Dysbiosis and Systemic Disturbance in Major Depressive Disorder. Psychiatry Research 2024, 334, 115804. [Google Scholar] [CrossRef] [PubMed]
- Creighton, C.J. Clinical Proteomics towards Multiomics in Cancer. Mass Spectrometry Reviews 2024, 43, 1255–1269. [Google Scholar] [CrossRef]
- Sankaran, K.; Holmes, S.P. Multitable Methods for Microbiome Data Integration. Front. Genet. 2019, 10, 627. [Google Scholar] [CrossRef]
- Liu, Z.; Ma, A.; Mathé, E.; Merling, M.; Ma, Q.; Liu, B. Network Analyses in Microbiome Based on High-Throughput Multi-Omics Data. Briefings in Bioinformatics 2021, 22, 1639–1655. [Google Scholar] [CrossRef]
- Misra, B.B.; Langefeld, C.; Olivier, M.; Cox, L.A. Integrated Omics: Tools, Advances and Future Approaches. Journal of Molecular Endocrinology 2019, 62, R21–R45. [Google Scholar] [CrossRef] [PubMed]
- Chun, H.; Keleş, S. Sparse Partial Least Squares Regression for Simultaneous Dimension Reduction and Variable Selection. Journal of the Royal Statistical Society Series B: Statistical Methodology 2010, 72, 3–25. [Google Scholar] [CrossRef] [PubMed]
- Wang, Q.; Wang, K.; Wu, W.; Giannoulatou, E.; Ho, J.W.K.; Li, L. Host and Microbiome Multi-Omics Integration: Applications and Methodologies. Biophys Rev 2019, 11, 55–65. [Google Scholar] [CrossRef]
- Holowatyj, A.N.; Gigic, B.; Herpel, E.; Scalbert, A.; Schneider, M.; Ulrich, C.M.; Achaintre, D.; Brezina, S.; Van Duijnhoven, F.J.B.; Gsur, A.; et al. Distinct Molecular Phenotype of Sporadic Colorectal Cancers Among Young Patients Based on Multiomics Analysis. Gastroenterology 2020, 158, 1155–1158e2. [Google Scholar] [CrossRef] [PubMed]
- Daliri, E.B.-M.; Ofosu, F.K.; Chelliah, R.; Lee, B.H.; Oh, D.-H. Challenges and Perspective in Integrated Multi-Omics in Gut Microbiota Studies. Biomolecules 2021, 11, 300. [Google Scholar] [CrossRef]
- Louis, P.; Hold, G.L.; Flint, H.J. The Gut Microbiota, Bacterial Metabolites and Colorectal Cancer. Nat Rev Microbiol 2014, 12, 661–672. [Google Scholar] [CrossRef]
- Son, J.W.; Shoaie, S.; Lee, S. Systems Biology: A Multi-Omics Integration Approach to Metabolism and the Microbiome. Endocrinol Metab 2020, 35, 507–514. [Google Scholar] [CrossRef]
- Bisht, V.; Nash, K.; Xu, Y.; Agarwal, P.; Bosch, S.; Gkoutos, G.V.; Acharjee, A. Integration of the Microbiome, Metabolome and Transcriptomics Data Identified Novel Metabolic Pathway Regulation in Colorectal Cancer. IJMS 2021, 22, 5763. [Google Scholar] [CrossRef]
- Kuipers, E.J.; Grady, W.M.; Lieberman, D.; Seufferlein, T.; Sung, J.J.; Boelens, P.G.; Van De Velde, C.J.H.; Watanabe, T. Colorectal Cancer. Nat Rev Dis Primers 2015, 1, 15065. [Google Scholar] [CrossRef]
- Granados-Romero, J.J.; Valderrama-Treviño, A.I.; Contreras-Flores, E.H.; Barrera-Mera, B.; Herrera Enríquez, M.; Uriarte-Ruíz, K.; Ceballos-Villalba, J.C.; Estrada-Mata, A.G.; Alvarado Rodríguez, C.; Arauz-Peña, G. Colorectal Cancer: A Review. Int J Res Med Sci 2017, 5, 4667. [Google Scholar] [CrossRef]
- Guinney, J.; Dienstmann, R.; Wang, X.; De Reyniès, A.; Schlicker, A.; Soneson, C.; Marisa, L.; Roepman, P.; Nyamundanda, G.; Angelino, P.; et al. The Consensus Molecular Subtypes of Colorectal Cancer. Nat Med 2015, 21, 1350–1356. [Google Scholar] [CrossRef]
- Thanki, K.; Nicholls, M.E.; Gajjar, A.; Senagore, A.J.; Qiu, S.; Szabo, C.; Hellmich, M.R.; Chao, C. Consensus Molecular Subtypes of Colorectal Cancer and Their Clinical Implications. 2018.
- Purcell, R.V.; Visnovska, M.; Biggs, P.J.; Schmeier, S.; Frizelle, F.A. Distinct Gut Microbiome Patterns Associate with Consensus Molecular Subtypes of Colorectal Cancer. Sci Rep 2017, 7, 11590. [Google Scholar] [CrossRef]
- Rebhan, M.; Chalifa-Caspi, V.; Prilusky, J.; Lancet, D. GeneCards: A Novel Functional Genomics Compendium with Automated Data Mining and Query Reformulation Support. Bioinformatics 1998, 14, 656–664. [Google Scholar] [CrossRef] [PubMed]
- Krieger, C.J. MetaCyc: A Multiorganism Database of Metabolic Pathways and Enzymes. Nucleic Acids Research 2004, 32, 438D–442. [Google Scholar] [CrossRef] [PubMed]
- Sayers, E.W.; Bolton, E.E.; Brister, J.R.; Canese, K.; Chan, J.; Comeau, D.C.; Connor, R.; Funk, K.; Kelly, C.; Kim, S.; et al. Database Resources of the National Center for Biotechnology Information. Nucleic Acids Research 2022, 50, D20–D26. [Google Scholar] [CrossRef]
- Kanehisa, M.; Goto, S. KEGG: Kyoto Encyclopedia of Genes and Genomes.
- The UniProt Consortium UniProt: The Universal Protein Knowledgebase. Nucleic Acids Res 2017, 45, D158–D169. [CrossRef]
- Bolyen, E.; Rideout, J.R.; Dillon, M.R.; Bokulich, N.A.; Abnet, C.C.; Al-Ghalith, G.A.; Alexander, H.; Alm, E.J.; Arumugam, M.; Asnicar, F.; et al. Reproducible, Interactive, Scalable and Extensible Microbiome Data Science Using QIIME 2. Nat Biotechnol 2019, 37, 852–857. [Google Scholar] [CrossRef]
- Narayan, N.R.; Weinmaier, T.; Laserna-Mendieta, E.J.; Claesson, M.J.; Shanahan, F.; Dabbagh, K.; Iwai, S.; DeSantis, T.Z. Piphillin Predicts Metagenomic Composition and Dynamics from DADA2-Corrected 16S rDNA Sequences. BMC Genomics 2020, 21, 56. [Google Scholar] [CrossRef]
- Douglas, G.M.; Maffei, V.J.; Zaneveld, J.R.; et al. PICRUSt2 for prediction of metagenome functions. Nat Biotechnol 2020, 38, 685–688. [Google Scholar] [CrossRef]
- Ulgen, E.; Ozisik, O.; Sezerman, O.U. pathfindR: An R Package for Comprehensive Identification of Enriched Pathways in Omics Data Through Active Subnetworks. Front. Genet. 2019, 10, 858. [Google Scholar] [CrossRef] [PubMed]
- Rohart, F.; Gautier, B.; Singh, A.; Lê Cao, K.-A. mixOmics: An R Package for ‘omics Feature Selection and Multiple Data Integration. PLoS Comput Biol 2017, 13, e1005752. [Google Scholar] [CrossRef]
- R Core Team (2023). _R: A Language and Environment for Statistical, Computing_. R Foundation for Statistical Computing, Vienna, Austria.
- Wang, K.; Xu, C.; Li, W.; Ding, L. Emerging Clinical Significance of Claudin-7 in Colorectal Cancer: A Review. CMAR 2018, Volume 10, 3741–3752. [Google Scholar] [CrossRef]
- Karahashi, Y.; Cueno, M.E.; Kamio, N.; Takahashi, Y.; Takeshita, I.; Soda, K.; Maruoka, S.; Gon, Y.; Sato, S.; Imai, K. Fusobacterium Nucleatum Putatively Affects the Alveoli by Disrupting the Alveolar Epithelial Cell Tight Junction, Enlarging the Alveolar Space, and Increasing Paracellular Permeability. Biochemical and Biophysical Research Communications 2023, 682, 216–222. [Google Scholar] [CrossRef] [PubMed]
- Yang, C.L.; Yang, M.; Wang, YCF.; Song, C.C.; DU G.H.; Tang G.Y. [Effects of Fusobacterium nucleus derived outer membrane vesicles on claudin-4 expression in oral epithelial cells]. Shanghai Kou Qiang Yi Xue 2023, 32(2), 126-131, PMID: 37153991.
- Shen, W.; Yuan, L.; Hao, B.; Xiang, J.; Cheng, F.; Wu, Z.; Li, X. KLF3 Promotes Colorectal Cancer Growth by Activating WNT1. Aging 2024. [CrossRef] [PubMed]
- Li, X.; Huang, J.; Yu, T.; Fang, X.; Lou, L.; Xin, S.; Ji, L.; Jiang, F.; Lou, Y. Fusobacterium Nucleatum Promotes the Progression of Colorectal Cancer Through Cdk5-Activated Wnt/β-Catenin Signaling. Front. Microbiol. 2021, 11, 545251. [Google Scholar] [CrossRef]
- Jin, H.; Leng, Q.; Zhang, C.; Zhu, Y.; Wang, J. P-Cymene Prevent High-Fat Diet-Associated Colorectal Cancer by Improving the Structure of Intestinal Flora. J. Cancer 2021, 12, 4355–4361. [Google Scholar] [CrossRef]
- Minogue, E.; Cunha, P.P.; Wadsworth, B.J.; Grice, G.L.; Sah-Teli, S.K.; Hughes, R.; Bargiela, D.; Quaranta, A.; Zurita, J.; Antrobus, R.; et al. Glutarate Regulates T Cell Metabolism and Anti-Tumour Immunity. Nat Metab 2023, 5, 1747–1764. [Google Scholar] [CrossRef]
- Li, J.; Liu, C.; Sato, T. Novel Antitumor Invasive Actions of p-Cymene by Decreasing MMP-9/TIMP-1 Expression Ratio in Human Fibrosarcoma HT-1080 Cells. Biological & Pharmaceutical Bulletin 2016, 39, 1247–1253. [Google Scholar] [CrossRef]
- Parma, B.; Ramesh, V.; Gollavilli, P.N.; Siddiqui, A.; Pinna, L.; Schwab, A.; Marschall, S.; Zhang, S.; Pilarsky, C.; Napoli, F.; et al. Metabolic Impairment of Non-Small Cell Lung Cancers by Mitochondrial HSPD1 Targeting. J Exp Clin Cancer Res 2021, 40, 248. [Google Scholar] [CrossRef] [PubMed]
- Lin, H.; Zhao, X.; Xia, L.; Lian, J.; You, J. Clinicopathological and Prognostic Significance of CBX3 Expression in Human Cancer: A Systematic Review and Meta-Analysis. Disease Markers 2020, 2020, 1–11. [Google Scholar] [CrossRef]
- Niu, H.; Chen, P.; Fan, L.; Sun, B. Comprehensive Pan-Cancer Analysis on CBX3 as a Prognostic and Immunological Biomarker. BMC Med Genomics 2022, 15, 29. [Google Scholar] [CrossRef] [PubMed]
- Li, H.; Wang, L.; Ruan, Z.; Li, X.; Yang, Y.; Fang, J.; Wang, R. CSE1L as a prognostic biomarker associated with pan cancer immune infiltration and drug sensitivity. Expert Review of Clinical Immunology, 2024, 20(9), 1113–1125. [CrossRef]
- Shaath, H.; Vishnubalaji, R.; Elango, R.; Velayutham, D.; Jithesh, P.V.; Alajez, N.M. Therapeutic Targeting of the TPX2/TTK Network in Colorectal Cancer. Cell Commun Signal 2023, 21, 265. [Google Scholar] [CrossRef] [PubMed]
- Patil, S.; Deshpande, S.; Sengupta, K. Nuclear Envelope Protein Lamin B Receptor Protects the Genome from Chromosomal Instability and Tumorigenesis. Human Molecular Genetics 2023, 32, 745–763. [Google Scholar] [CrossRef]
Figure 2.
Boxplot shows the relative abundance difference between CMS1(blue), CMS2(yellow) and CMS3(red) groups. A) Fusobacteria significantly differed (p < 0.05). B) Abundance of Bacteroidetes slightly changed in three groups (p > 0.05). C) Firmicutes abundance percentile showed a little bit of increase from CMS1 to CMS3 (p > 0.05). D) Sharp increment of Proteobacteria was observed in CMS3 group (p < 0.05).
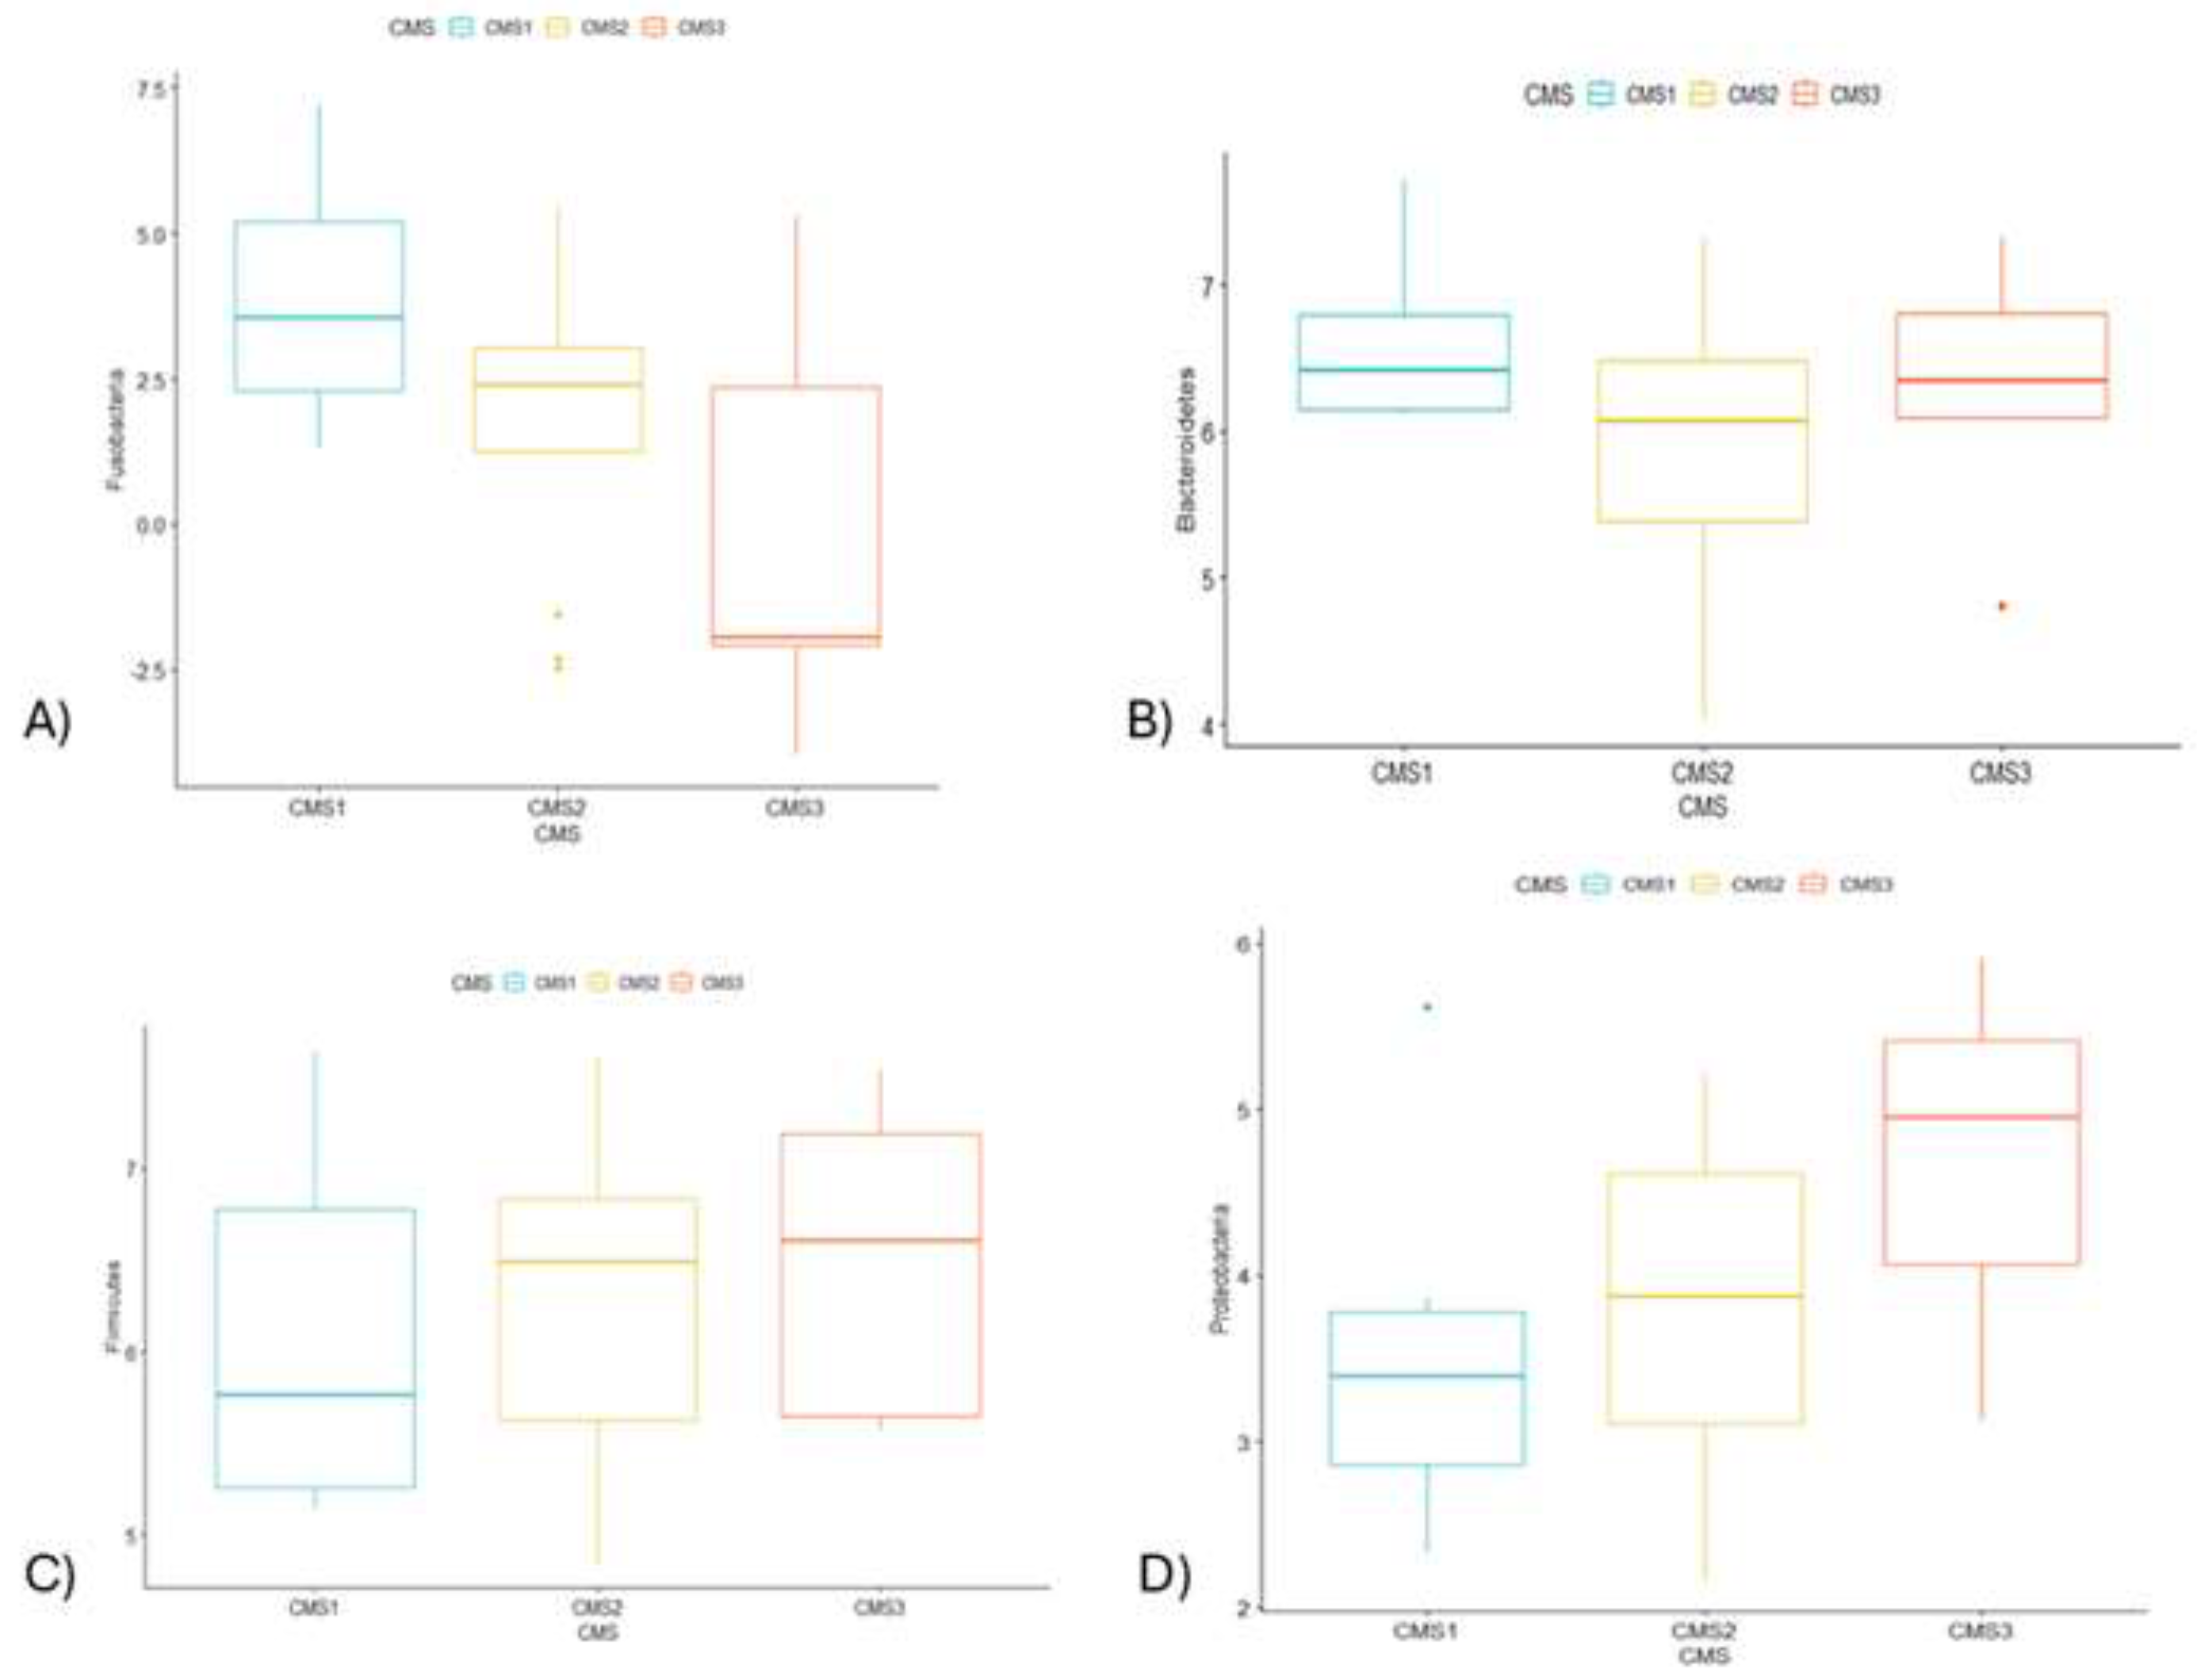
Figure 3.
A) Differentially expressed genes between CMS subgroups are illustrated in volcano plot (p < 0.05). B) The principal component analysis (PCA) visualization graph demonstrates the clustering of CMS subgroups based on RNA-Seq data. Distinct groups are identified as follows: CMS1 is represented in red, CMS2 is denoted in green, CMS3 is illustrated in blue, and the UC subgroup is highlighted in purple.
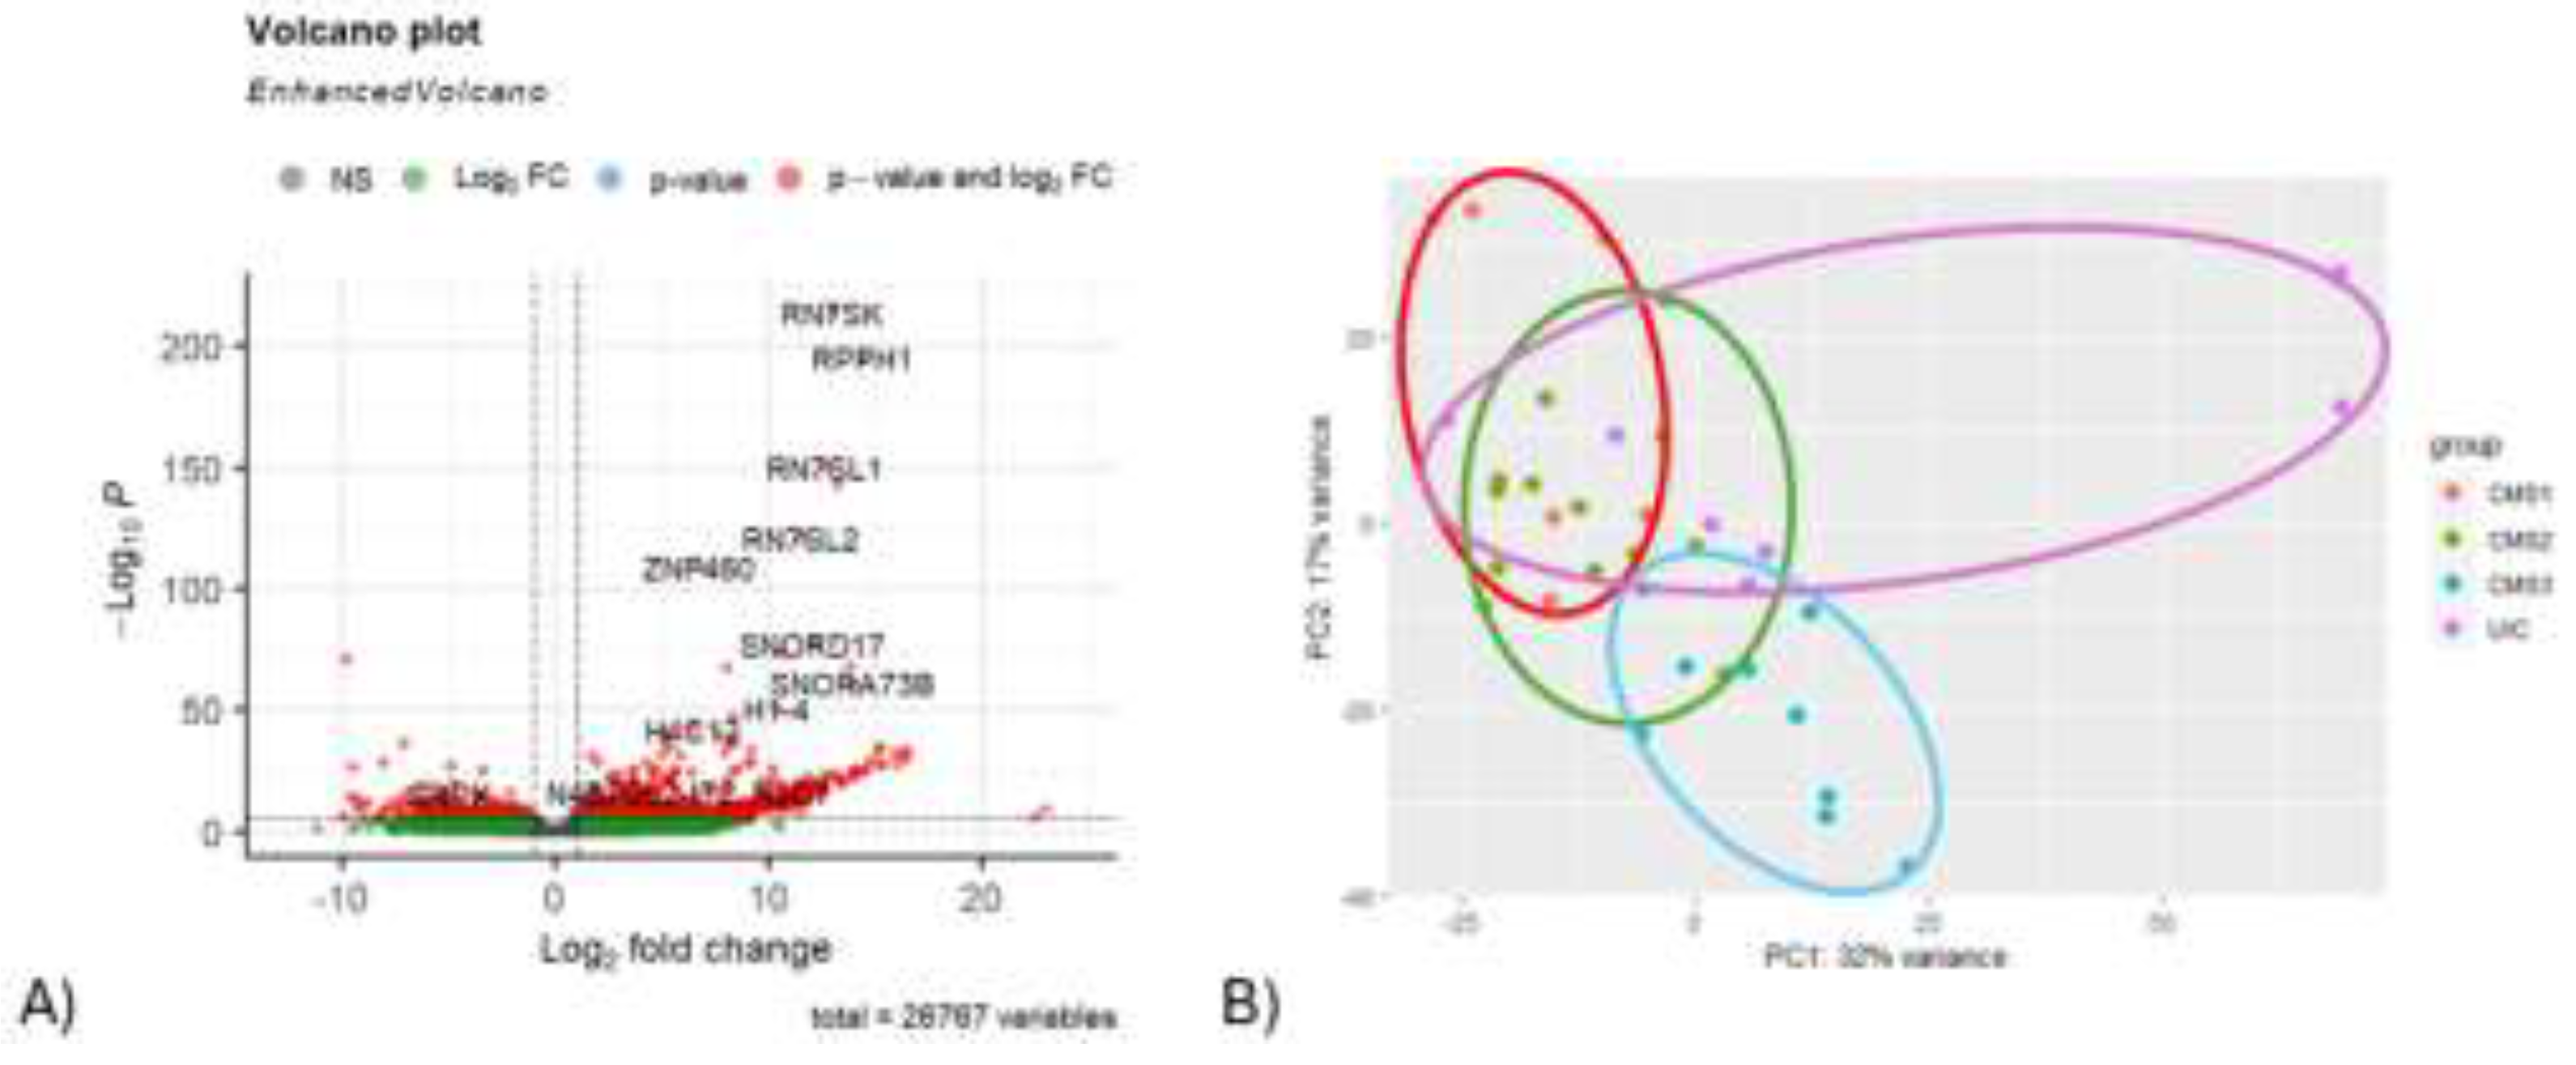
Figure 4.
A) Clustered heatmap illustration from sPLS-DA indicates the correlation between microbiome (phylum) and transcriptome datasets (r = ±0.71). B) Illustration projects on how selected samples are clustered by PCA. Block X represents the microbiome dataset and block Y represents the transcriptome dataset. CMS1 is indicated in blue circle, CMS2 is displayed in orange color, CMS3 was shown in grey color, and UC group was represented in green.
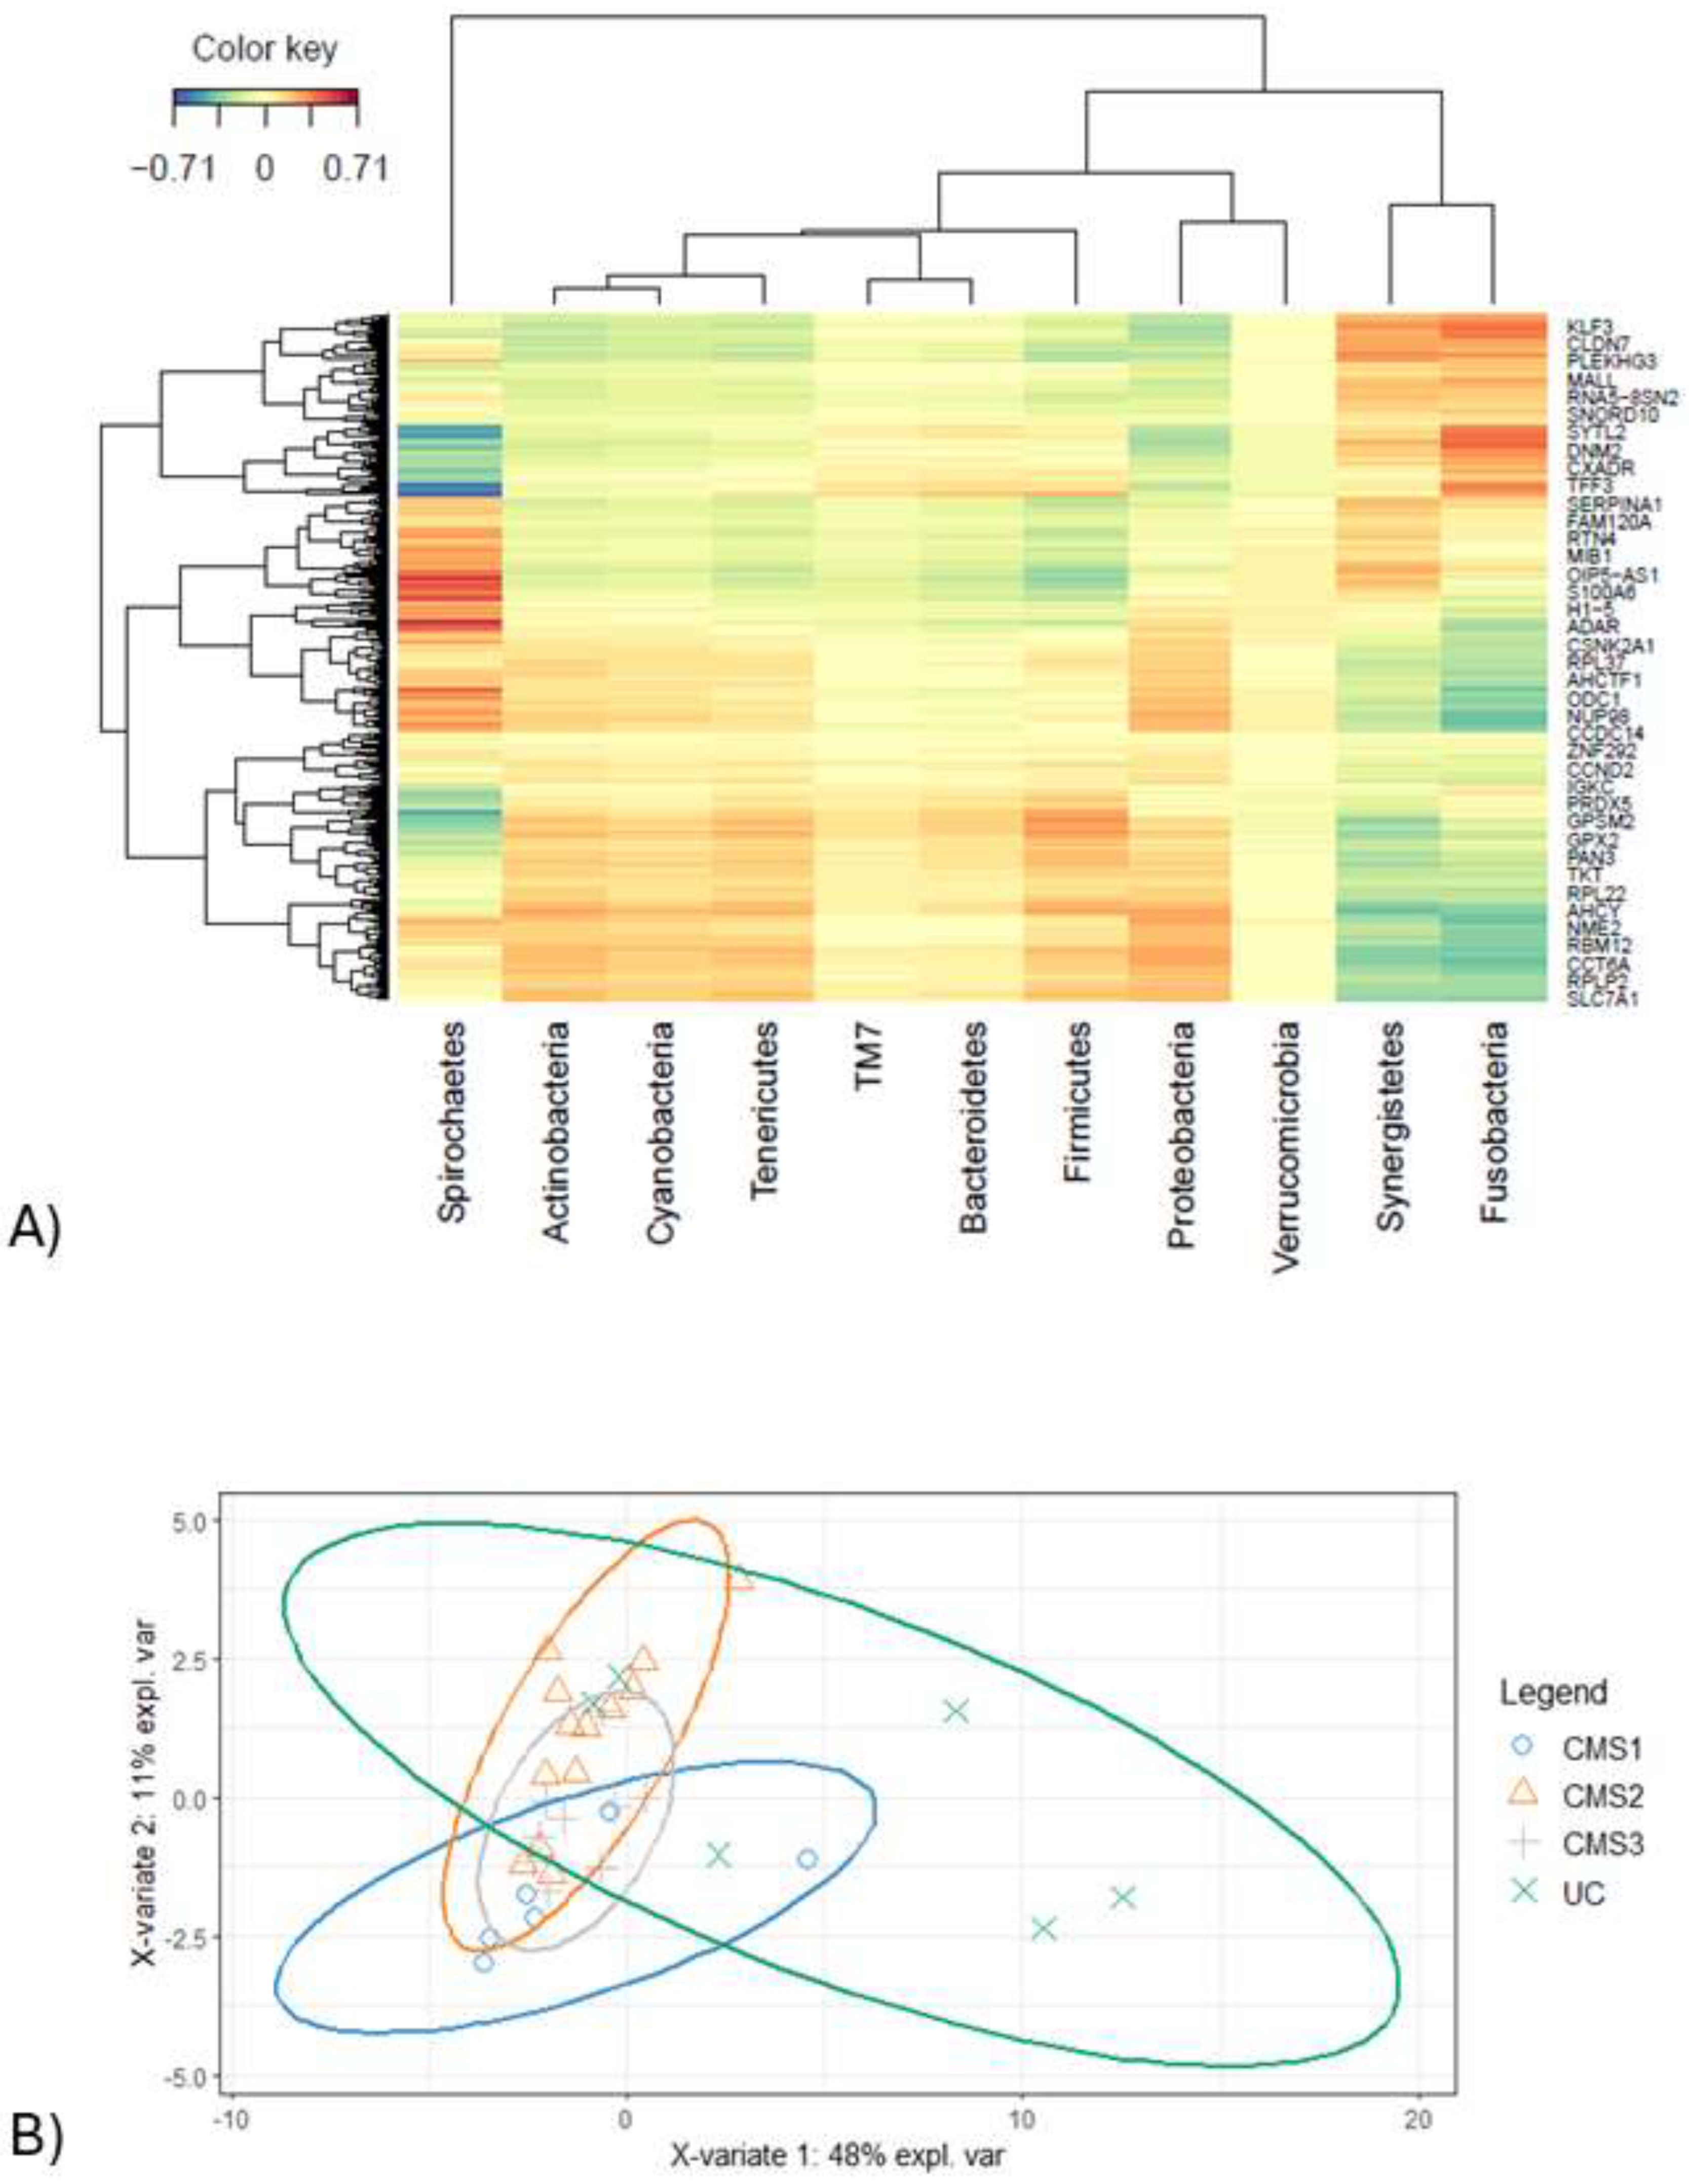
Figure 5.
The samples are plotted according to their scores obtained from the first two components for each datasets. Variables are colored by CMS subgroups and classified into three classes: CMS1 (blue colored), CMS2 (orange colored) and CMS3 (grey colored).
Figure 5.
The samples are plotted according to their scores obtained from the first two components for each datasets. Variables are colored by CMS subgroups and classified into three classes: CMS1 (blue colored), CMS2 (orange colored) and CMS3 (grey colored).
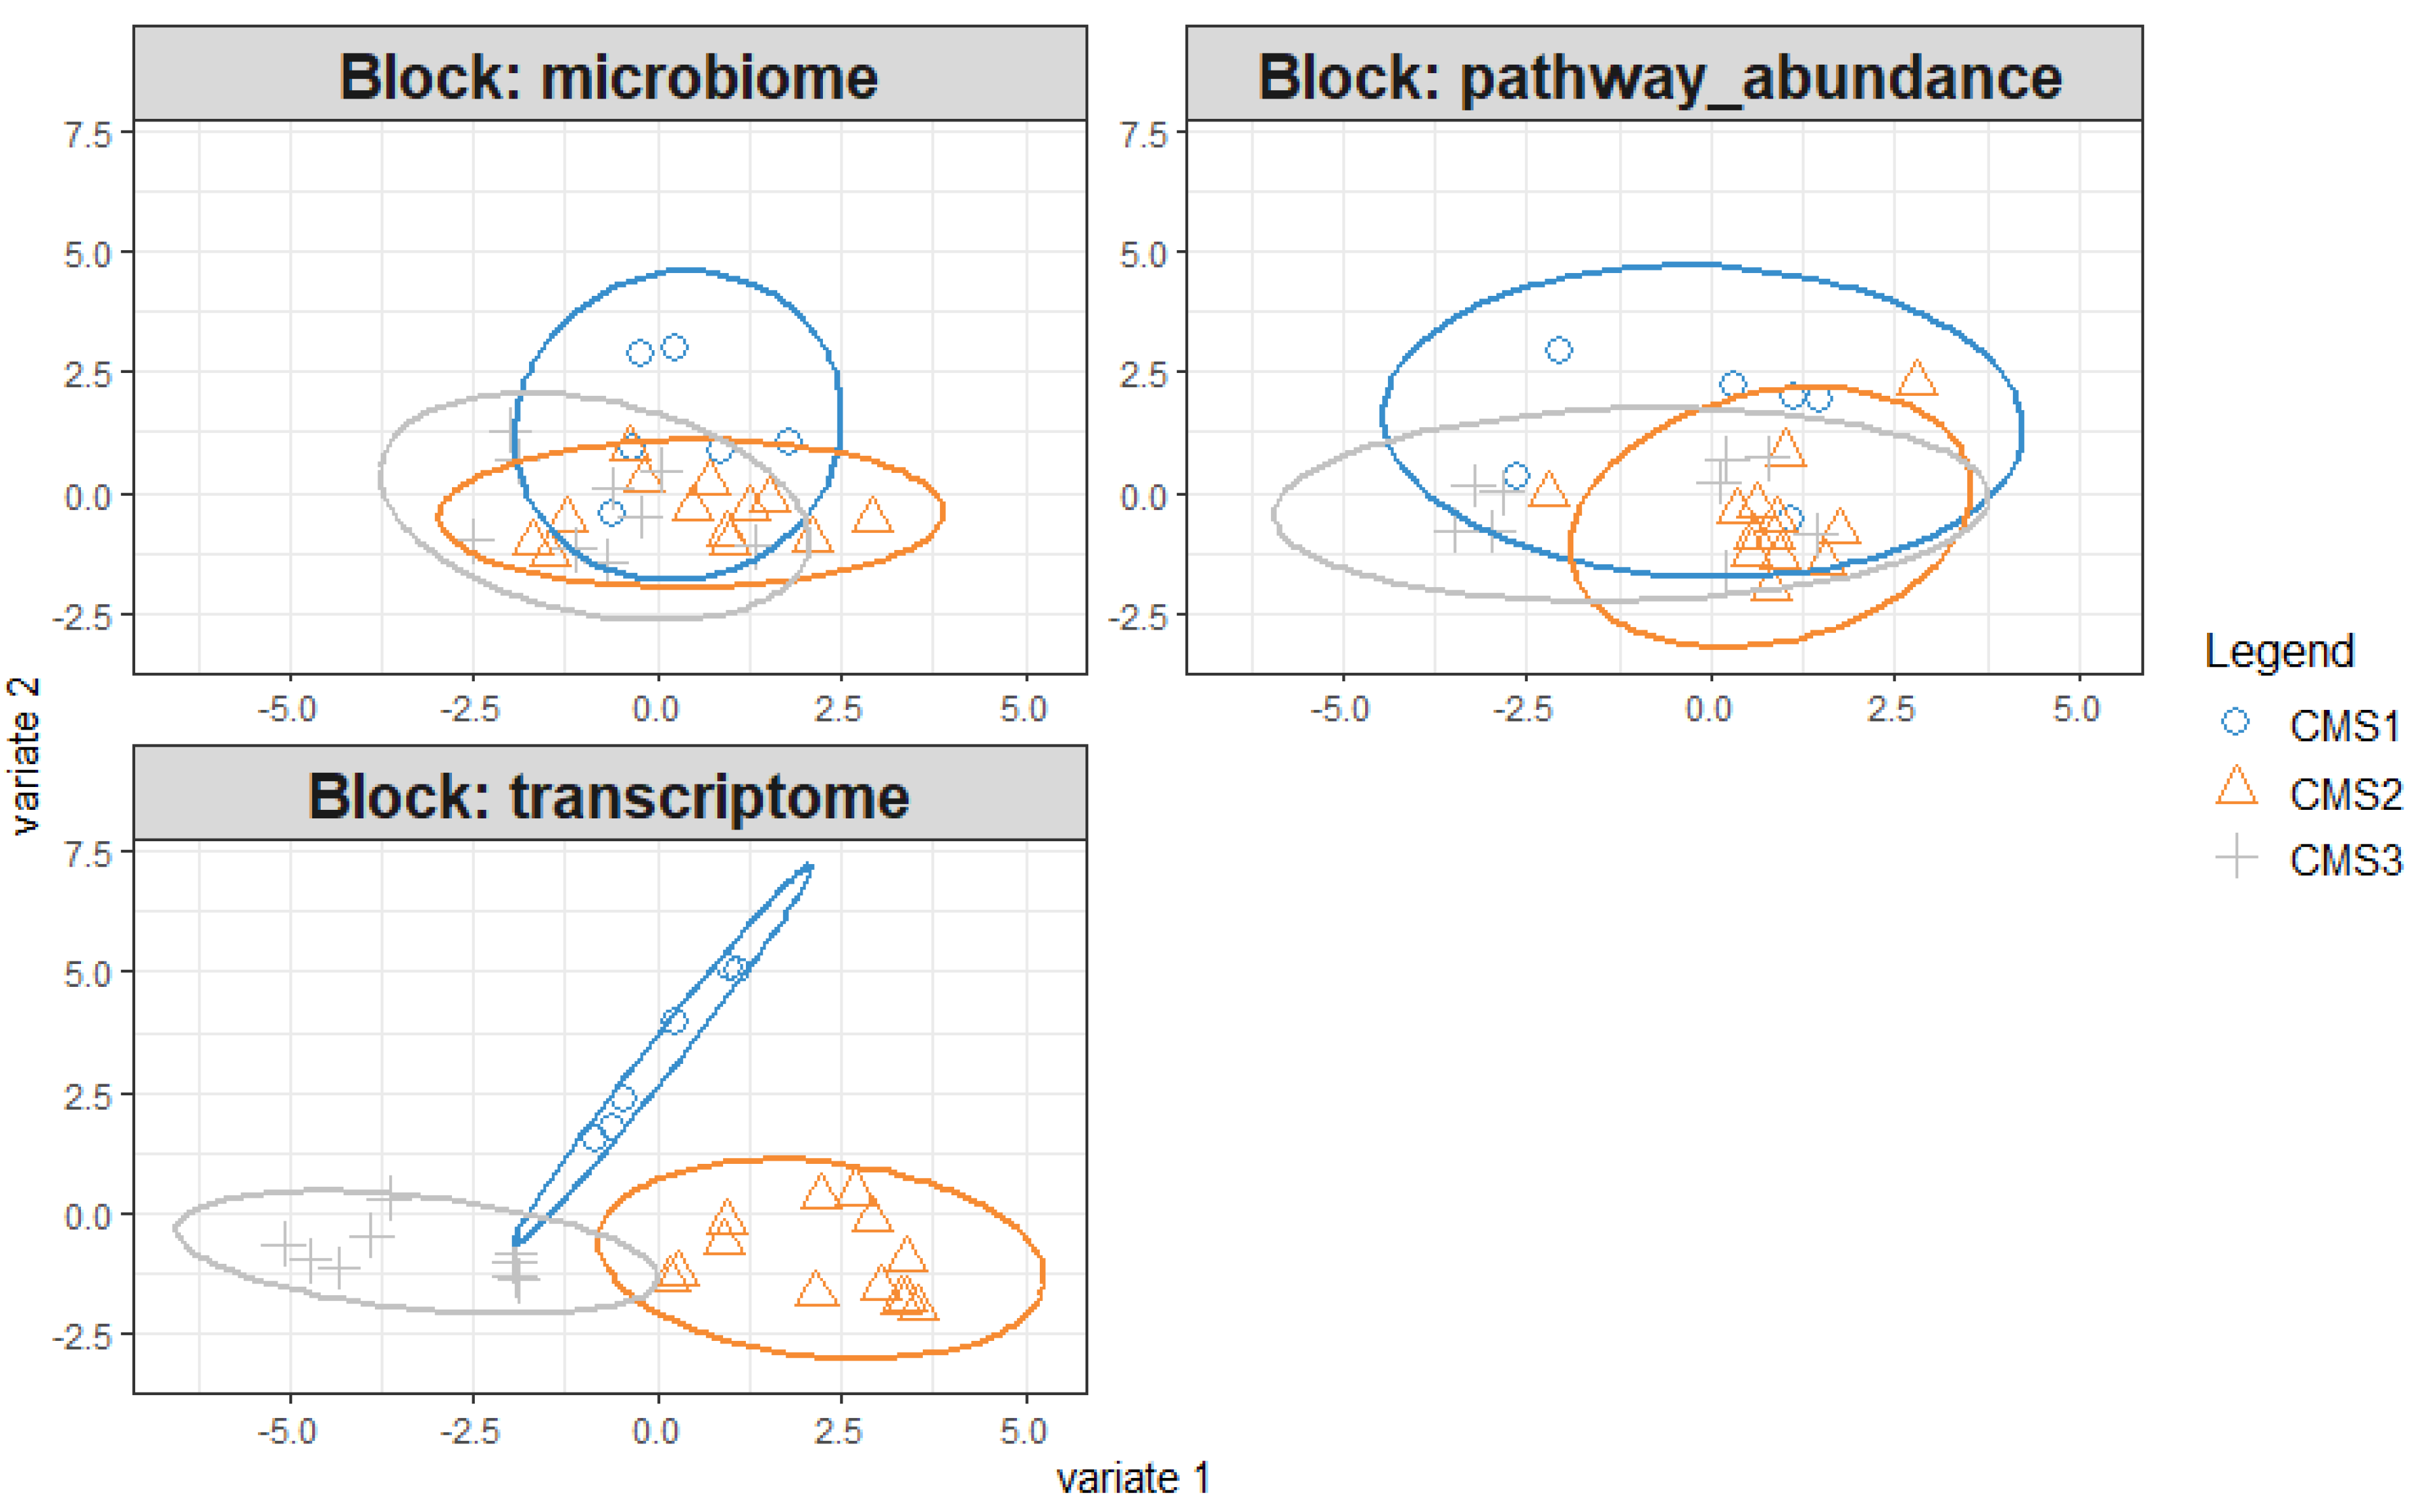
Figure 6.
Significant contributors that construct component 1 obtained from pre-processed transcriptome, microbiome, and microbial pathway datasets are indicated. Blue colored features are chosen to explain CMS1, orange ones represent the CMS2 subgroup and gray contributors are chosen as explanatory variables of CMS3.
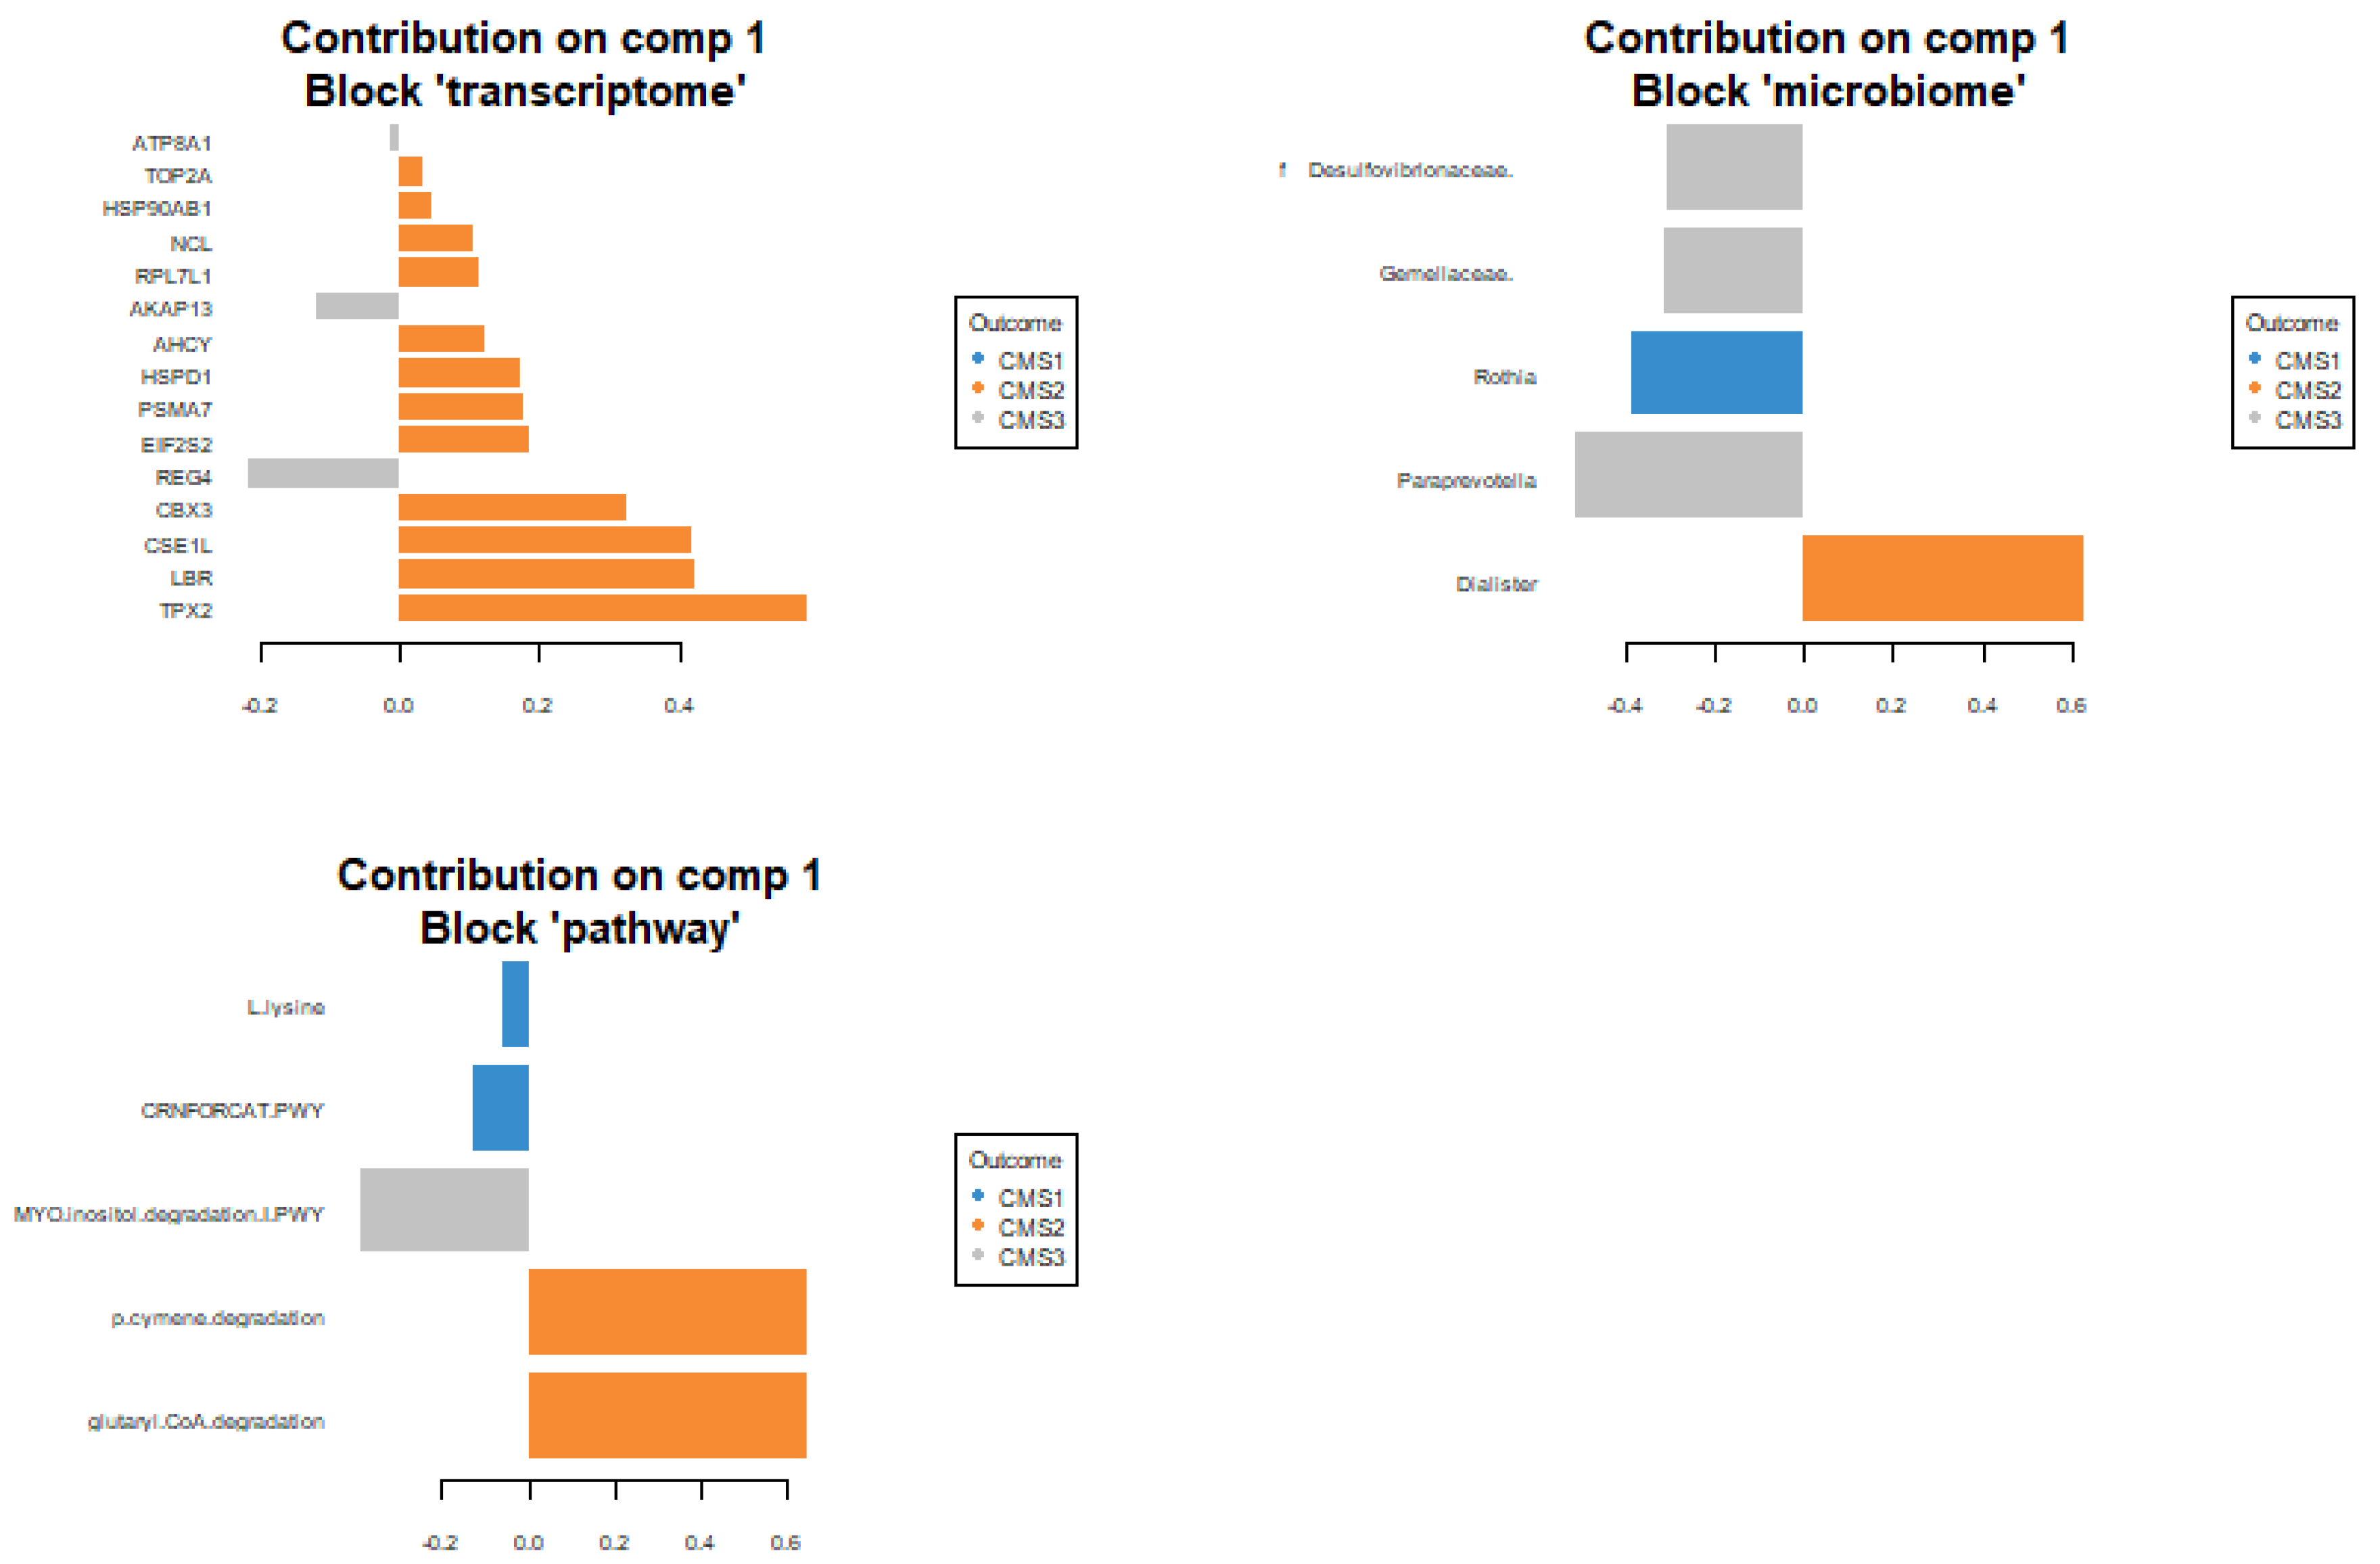
Figure 7.
Circle plot is showing the most predictive variables that locates at the poles. The purple ones are features that are obtained from transcriptome data, microbiome features are shown as red triangles and microbial pathways are indicated as green square.
Figure 7.
Circle plot is showing the most predictive variables that locates at the poles. The purple ones are features that are obtained from transcriptome data, microbiome features are shown as red triangles and microbial pathways are indicated as green square.
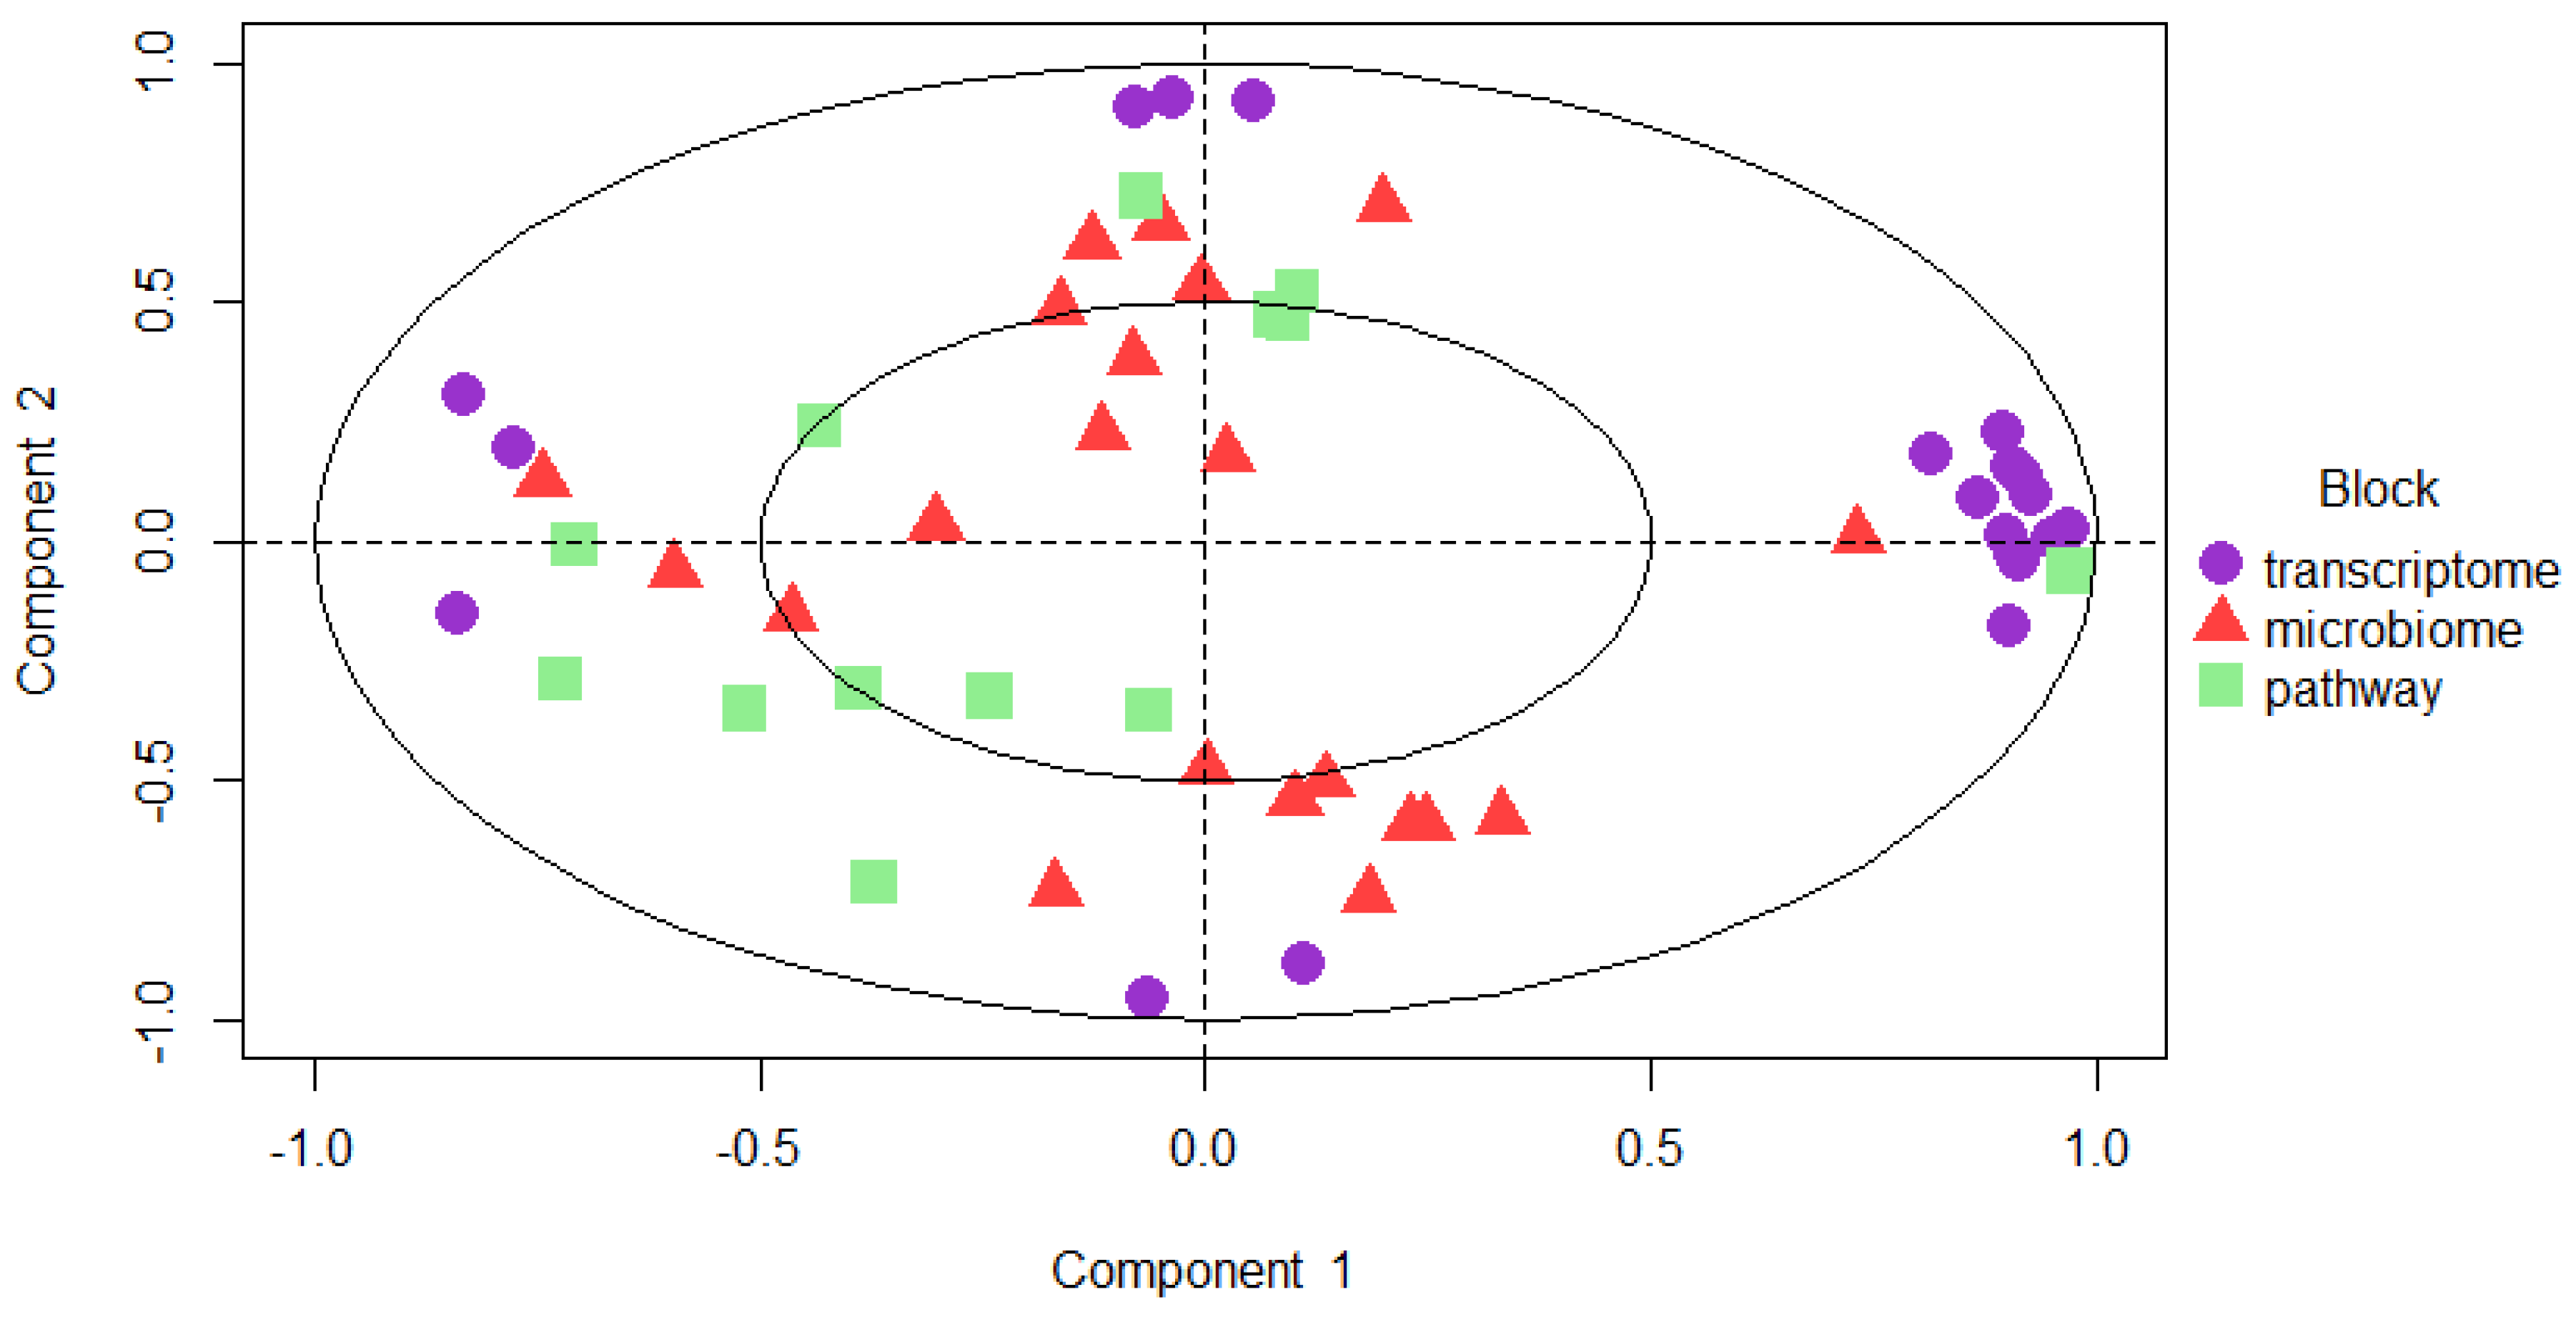
Figure 8.
Relevance network for features selected by sPLS-DA performed on transcriptome and microbial pathway abundance data. Each node contains variables; green nodes represent the microbial pathways and orange ones indicate the genes. Line that connects the features shows the relation between variables. Red colored lines show the positive correlation and green ones are indicating negative correlation.
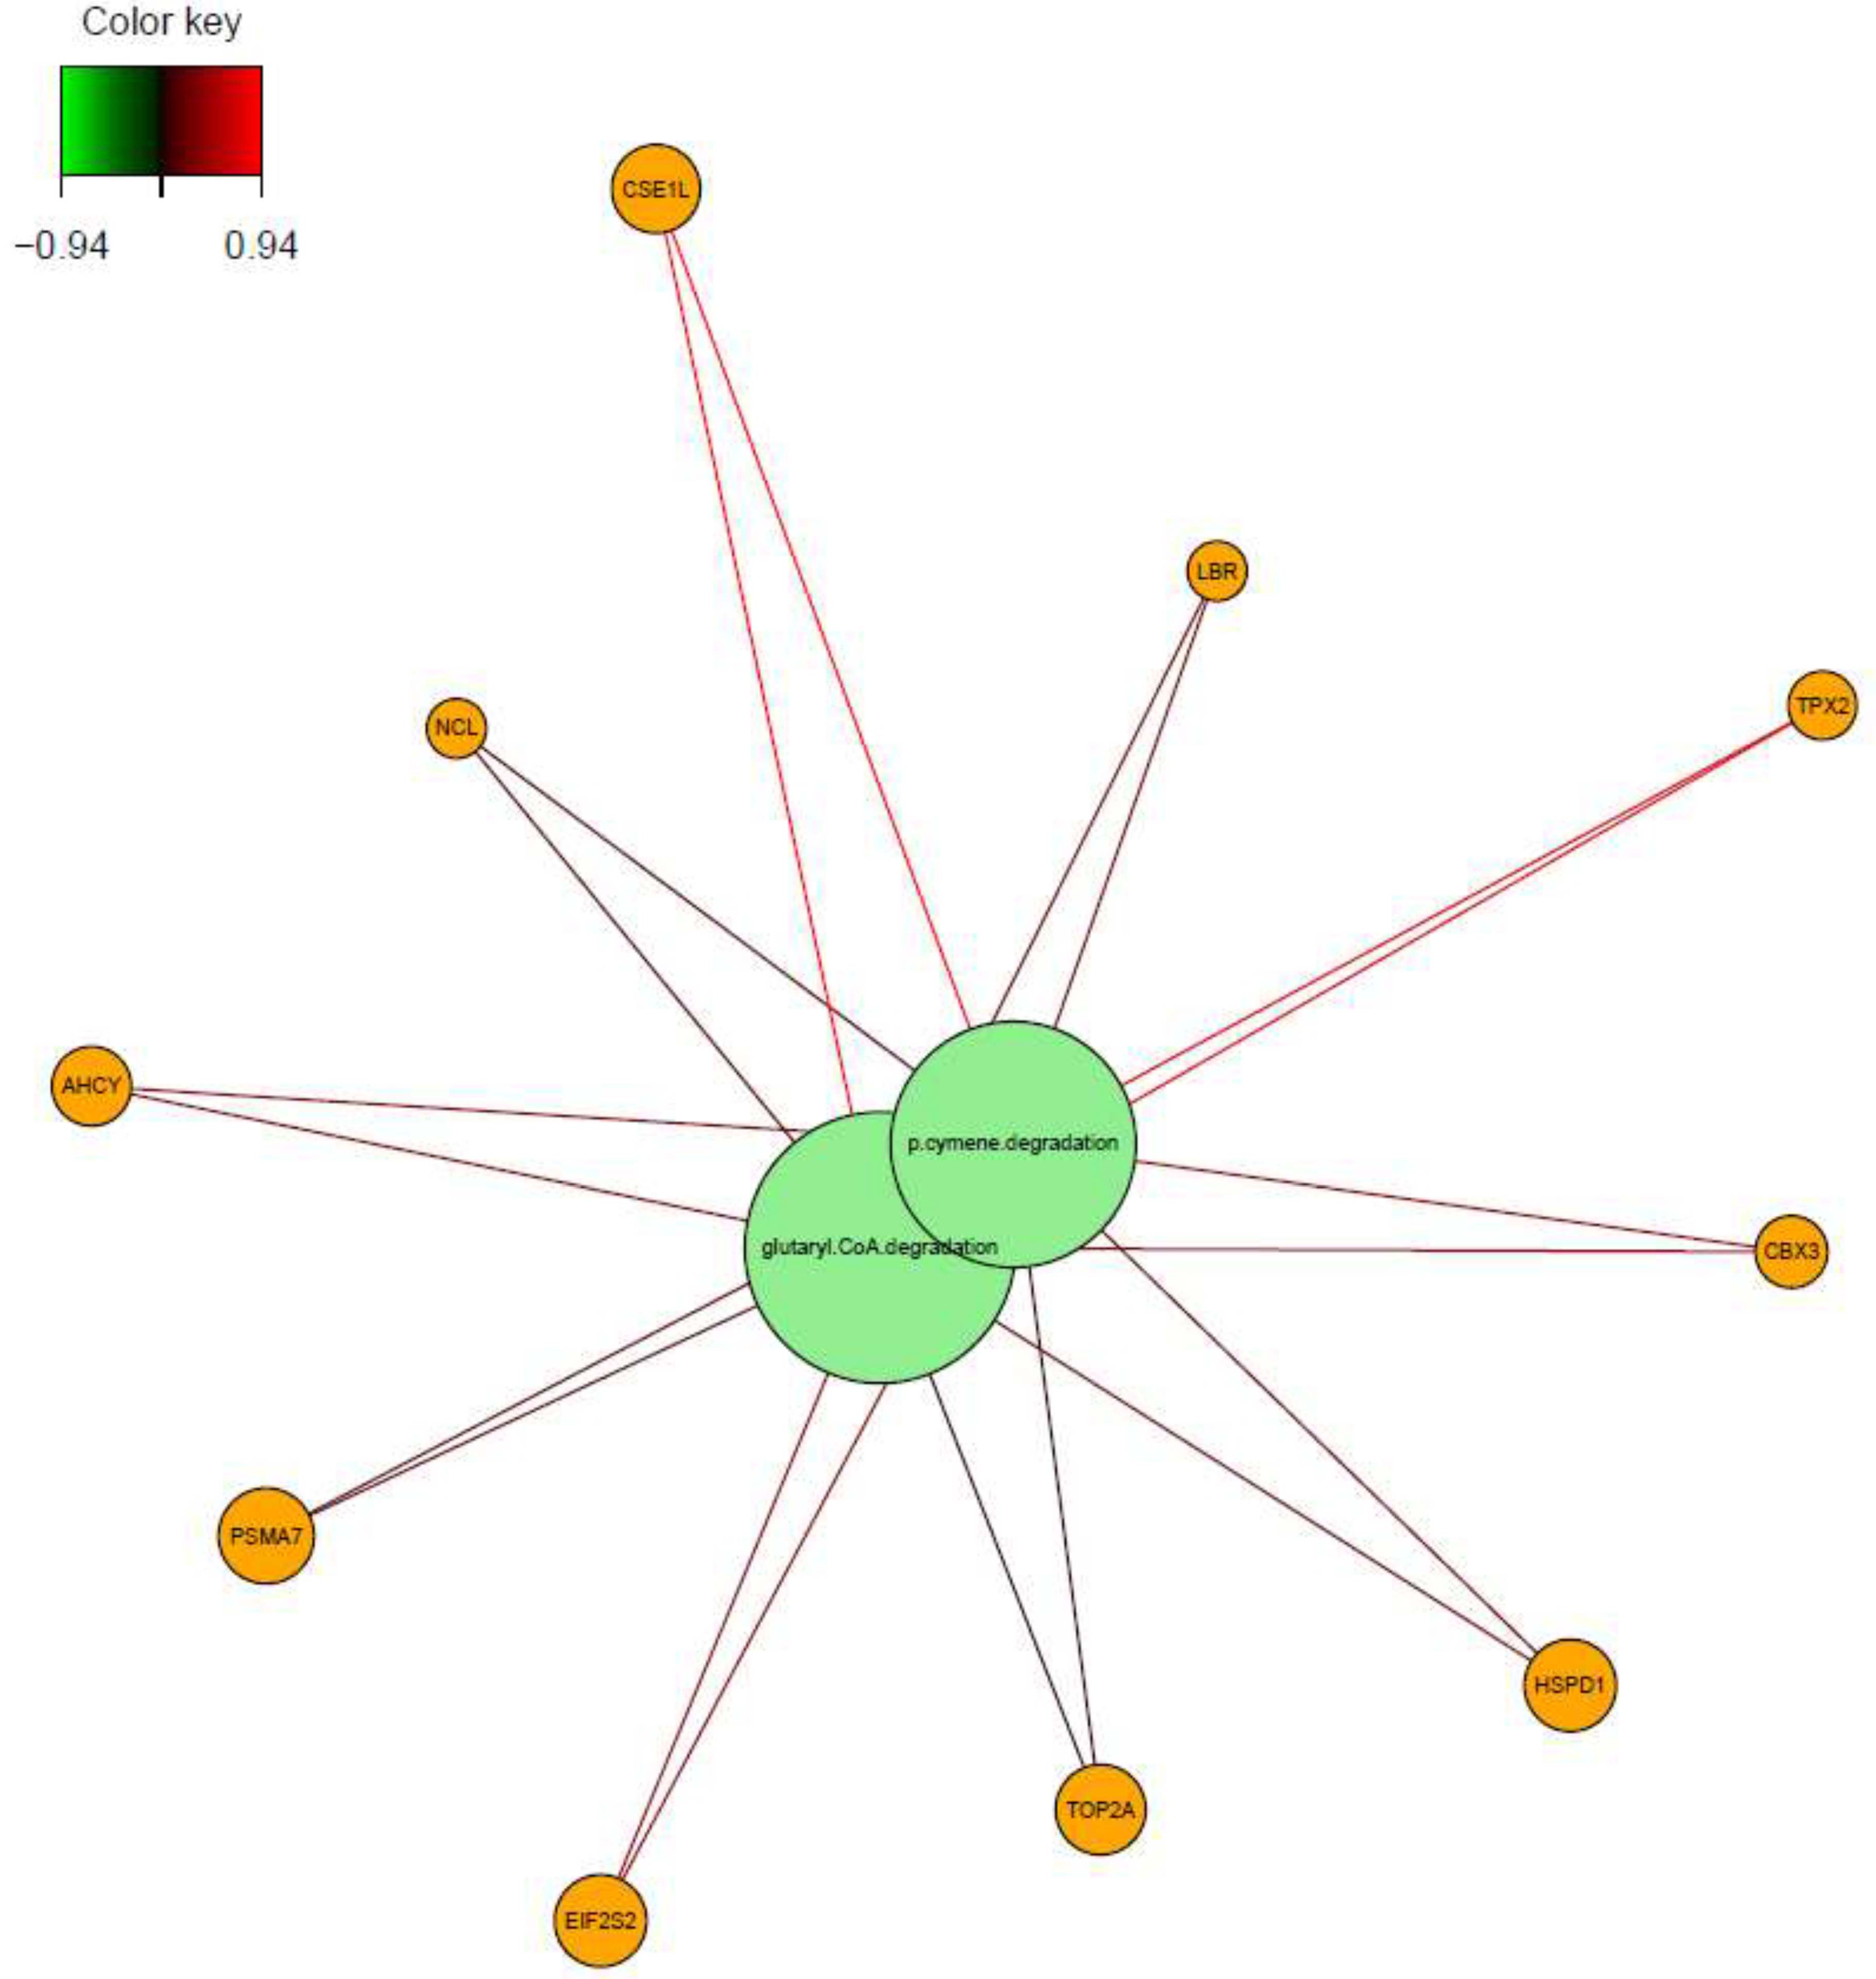
Figure 9.
Correlations greater than 0.7 between variables obtained from microbiome transcriptome and microbial pathway abundance represented on quadrants. Outer lines indicate the expression level of each sample group (CMS1, CMS2 and CMS3). Inner lines show the positive (orange) and negative (black) correlations among variables.
Disclaimer/Publisher’s Note: The statements, opinions and data contained in all publications are solely those of the individual author(s) and contributor(s) and not of MDPI and/or the editor(s). MDPI and/or the editor(s) disclaim responsibility for any injury to people or property resulting from any ideas, methods, instructions or products referred to in the content. |
© 2025 by the authors. Licensee MDPI, Basel, Switzerland. This article is an open access article distributed under the terms and conditions of the Creative Commons Attribution (CC BY) license (http://creativecommons.org/licenses/by/4.0/).
Copyright: This open access article is published under a Creative Commons CC BY 4.0 license, which permit the free download, distribution, and reuse, provided that the author and preprint are cited in any reuse.


