Submitted:
12 February 2025
Posted:
13 February 2025
You are already at the latest version
Abstract
Designing reinforced concrete sections of various shapes, including those with variable geometry, holes, and arbitrary distribution of reinforcing steel bars, is a common task in civil engineering involving reinforced concrete structures. This design process requires integrating non-linear stress fields over complex shapes due to the non-linear behavior of concrete in compression. In this paper, we propose a novel algorithm based on the simplex method to calculate the ultimate strength of reinforced concrete and steel concrete composite sections under biaxial bending and axial force. The proposed algorithm is validated by comparing its analytical results with methods suggested by other authors and with experimental results available in the literature.
Keywords:
concrete
; steel
; axial force
; biaxial bending
; simplex (linear programming)
1. Introduction
Designing cross sections of reinforced concrete is a routine task in structural engineering and typically involves structures such as reinforced concrete buildings, bridges, and underground constructions. Cross sections come in various shapes, and when combined with bending moments acting on both axes simultaneously along with axial force, this makes the design a highly non-linear problem.
Using computer programs to design reinforced concrete cross sections is now standard practice. Bentz [1] discusses how a computer application can handle reinforced concrete sections of any shape, including any placement of reinforcement bars. Papanikolao [2] emphasizes that the algorithm used to determine the ultimate strength of various cross sections, as well as the material constitutive laws, line subdivision, and stress integration methods, are key elements of these algorithms.
Regarding the material constitutive laws for concrete in compression, Eurocode 2 defines concrete in compression as parabolic-linear for designing reinforced concrete cross sections (clause 3.1.7), and this relationship is followed in this study. Rosati et al. [3] also use parabolic-linear behavior for concrete. Papanikolaou [2] explores the impact of using completely arbitrary material laws for concrete in compression.
The efficiency of algorithms largely depends on how the section is subdivided and the stress integration method. Charalampakis and Koumousis [4] divide any section using curvilinear trapezoids and employ closed-form solutions to compute internal forces, achieving exact results. Sfakianakis [5] suggests computing internal forces without subdividing the section, using fiber integration, though this may yield approximate results based on mesh division. Dias da Silva et al. [6] apply a closed-form algorithm for multi-rectangular sections followed by Gauss–Legendre integration, showing that closed-form solutions are preferred for computational efficiency. Rodriguez and Aristizabal-Ochoa [7] propose an algorithm that subdivides sections into polygons and performs closed-form integration per polygon. Pallarès et al. [8] perform closed-form integration without section subdivision, while De Vivo and Rosati [9] introduce an integration scheme using boundary integrals.
This paper introduces a new approach that uses fibre section model combined with simplex (linear programming).
2. Analysis of Plastic Resistance of Different Sections
The static or lower bound theorem is applied. The equilibrium and plastic condition are satisfied in order to achieve plastification factor equal or smaller than the plastic one.
The following method has been implemented in a computer program.
The Software can be found in the following blog:
Section with Fibers NMyMz:
2.1. Method to Obtain Plastic Parameters
The following tables explain how to obtain the plastic resistance. The cross section is divided into n fibers of Area A(i), coordinates y(i),z(i) of its centroid. The normal stress σ(i) values at each fiber are optimized to maximize the different linear functions in the tables with the corresponding linear constraints, this problema can be solved using simplex (Linear programming).
Case 1: Computation of plastic parameters:
| Maximize | |||
| Constraints | |||
|
Steel concrete | |||
Case 2: Computation of plastic parameters maximum:
| Maximize | |||
| Constraints |
Steel concrete |
||
2.2. Method to Obtain Interaction Diagram
To obtain the interaction diagram N My Mz, the plastification factor ξ (is the factor by which internal forces must be multiplied to reach the plastic resistance of cross section) can be obtained for each combination in of N1, My1, Mz1 applying the static or lower bound theorem:
| Maximize | ξ |
| constraint | |
|
Steel concrete |
3. Comparison with Experimental Results and Other Authors
3.1. Reinforced Concrete Section
Ppred= Load predicted by the numerical method.
Ptest= Load obtained with the test.
Figure 1.
(a) Fibre section Luis Test. (b) Ramamurthy Tests.
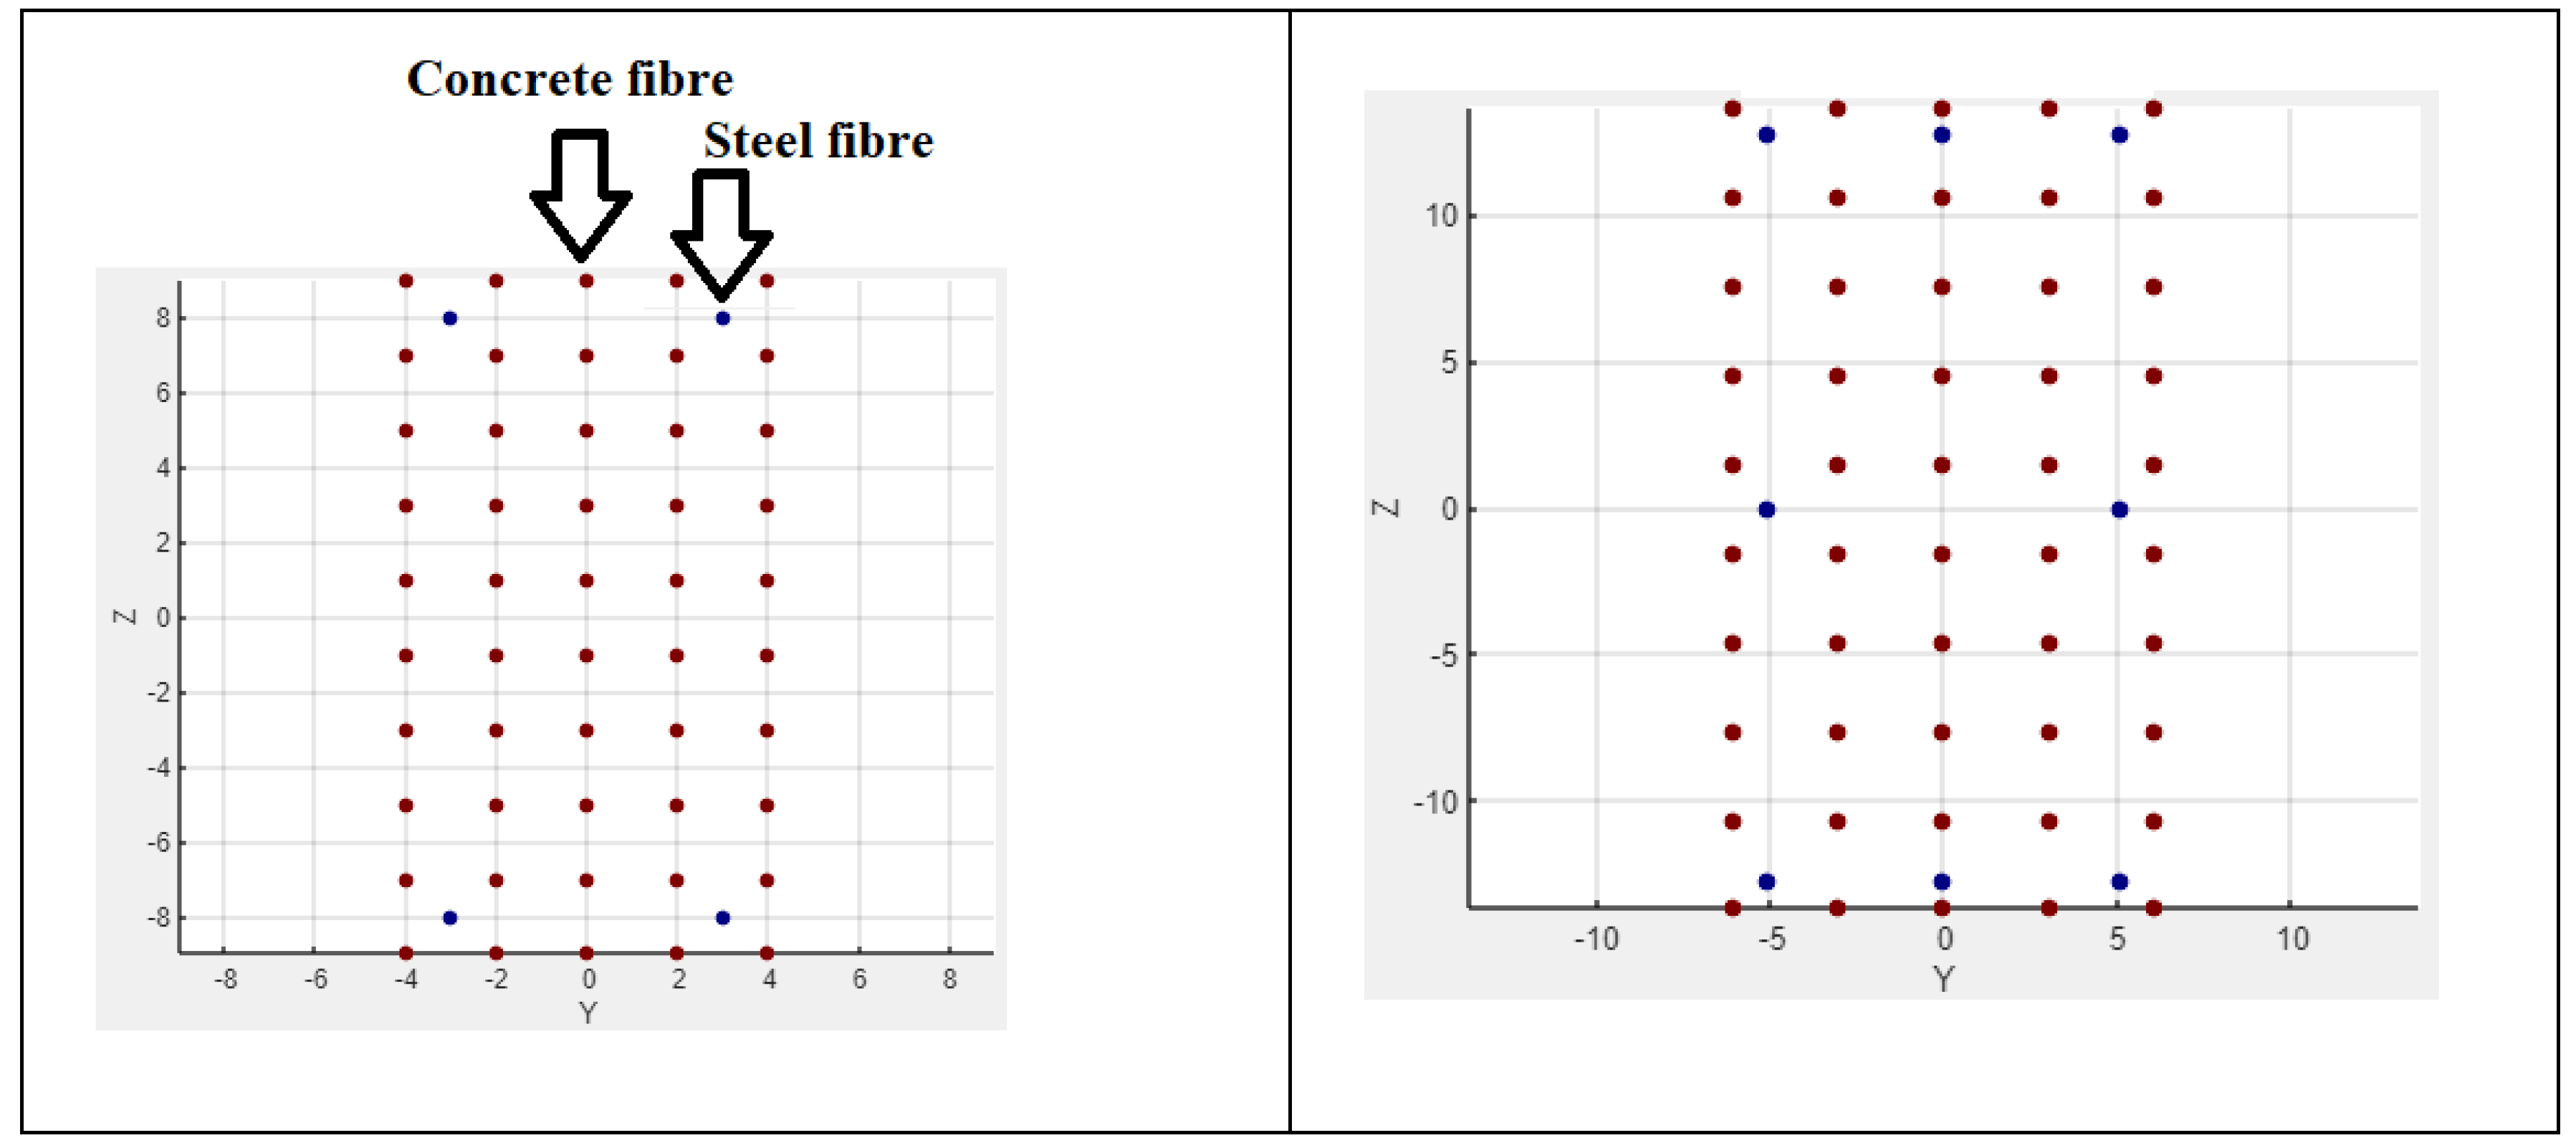
Luis [8,10] Test.
| Test | P (kN) | Ppred/Ptest | |
| Vaz Rodrigues | Proposal | ||
| 10_05_3 | 473 | 1.15 | 1.16 |
| 10_05_4 | 175 | 1.09 | 1.11 |
| 10_1_4 | 166 | 1.12 | 1.108 |
| 10_2_2 | 899 | 1.17 | 1.09 |
| 10_2_3 | 436 | 1.27 | 1.19 |
| 10_2_4 | 142 | 1.44 | 1.264 |
Ramamurthy [11] Test.
| Test | Ppred/Ptest | |
| Vaz Rodrigues | Proposal | |
| A1 | 1.06 | 1.085 |
| A2 | 0.97 | 0.994 |
| A3 | 0.99 | 1.022 |
| A4 | 0.96 | 0.989 |
| A5 | 0.91 | 0.921 |
| A6 | 0.99 | 1.043 |
| A7 | 0.92 | 0.954 |
| A8 | 1.05 | 1.074 |
| A9 | 0.92 | 0.95 |
| A10 | 1.08 | 1.184 |
| A11 | 1.12 | 1.26 |
| A12 | 1.07 | 1.153 |
| A13 | 0.94 | 1.048 |
| A14 | 0.88 | 0.929 |
| A15 | 0.91 | 1.023 |
| B3 | 0.94 | 1.057 |
| B4 | 0.98 | 1.109 |
| B6 | 0.97 | 1.138 |
| B7 | 0.88 | 1.025 |
| B8 | 0.92 | 1.075 |
| C6 | 0.88 | 1.022 |
| R138 | 0.83 | 0.91 |
| R238 | 0.83 | 0.886 |
| R338 | 0.85 | 0.879 |
| D2 | 1.08 | 0.996 |
| D3 | 1.02 | 0.93 |
| D5 | 0.98 | 1.018 |
| D6 | 0.85 | 1.078 |
| E1 | 1.27 | 0.82 |
| E2 | 1.34 | 0.843 |
| E3 | 1.2 | 0.978 |
| E4 | 1.11 | 1.195 |
| F2 | 1.41 | 1.224 |
| F4 | 1.4 | 1.249 |
| F5 | 1.17 | 1.159 |
| G2 | 1.21 | 0.881 |
| G3 | 1.42 | 1.138 |
| G4 | 1.29 | 1.016 |
| Mean Value | Proposal | Vaz Rodrigues |
| Luis Tests | 1.1537 | 1.2067 |
| Ramamurthy Tests | 1.033 | 1.0421 |
| Standard deviation Value | Proposal | Vaz Rodrigues |
| Luis Tests | 0.0657 | 0.1297 |
| Ramamurthy Tests | 0.1129 | 0.1698 |
4. Examples of Interaction Diagram
Interaction diagram Luis test and Rama. Test A1…
Figure 2.
Luis Test interaction diagram.
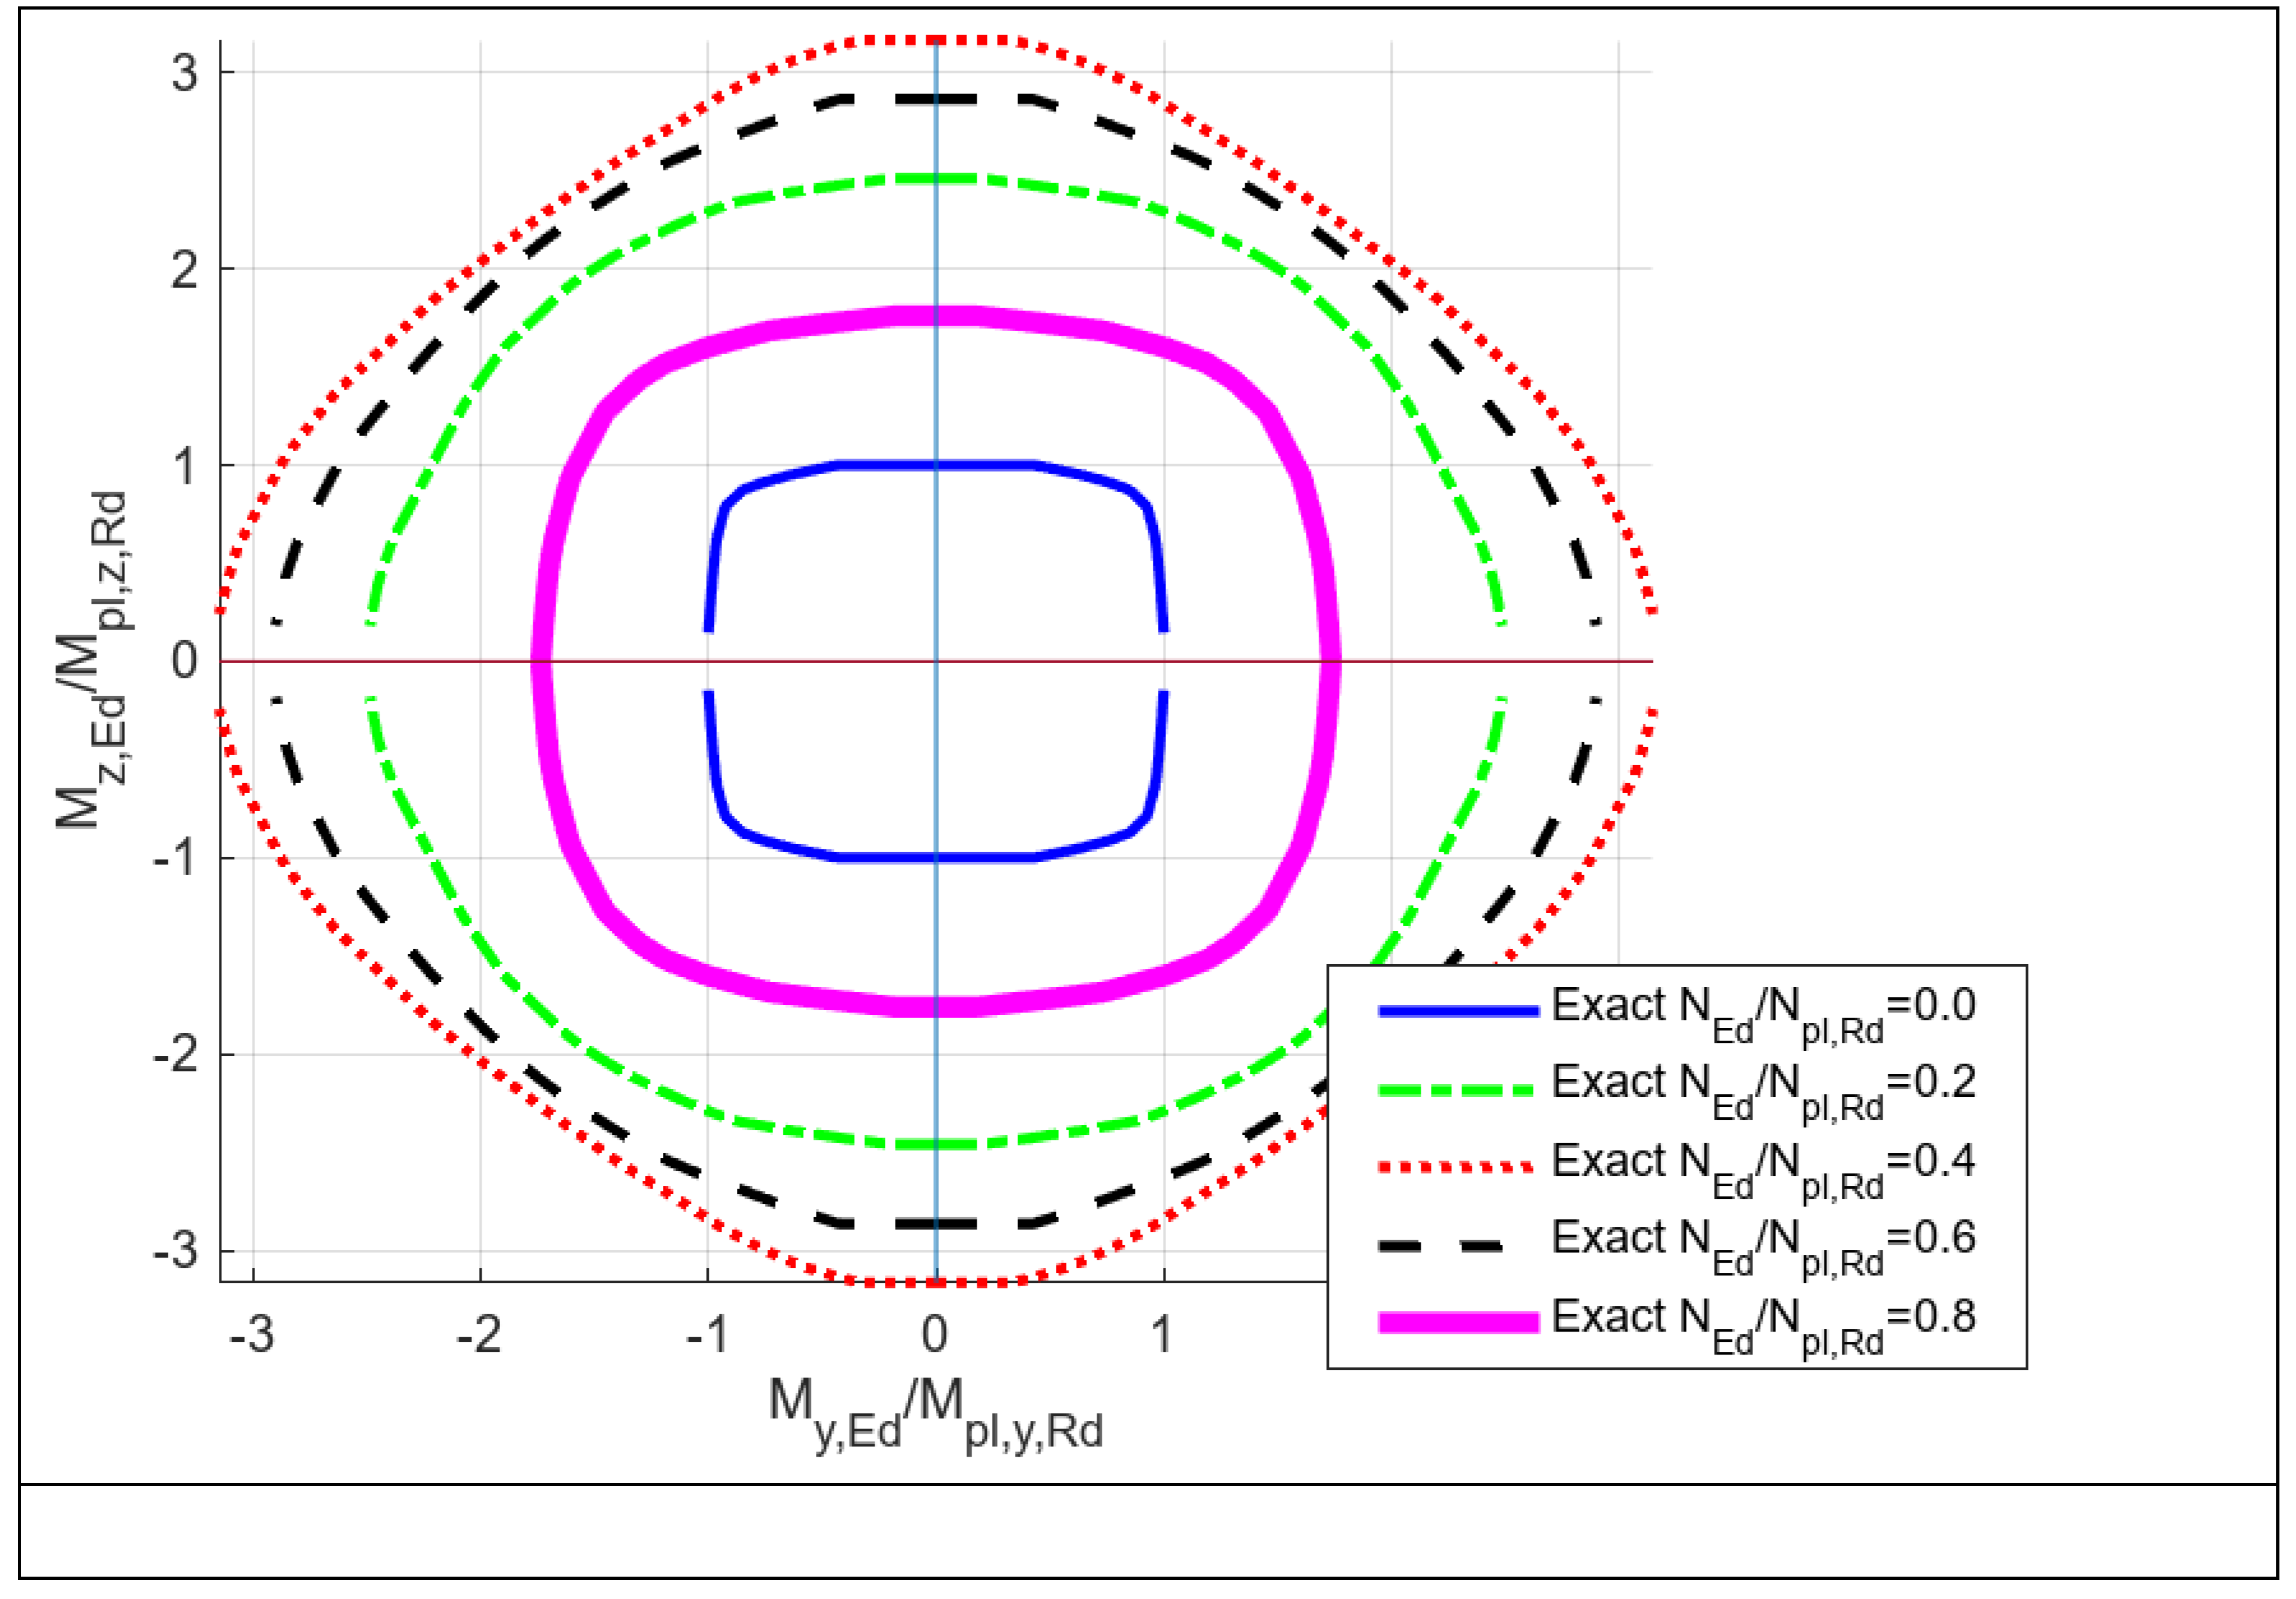
Luis Test:
Units kN,cm
Mypl = -1543.530 Mzpl = -701.205 Npl = -1586.501
Myplmax = -4930.410 Nc = -705.600Mzc = -0.000
Mzplmax = -2219.344 Nc = -846.720Myc = 0.000
Nplmax = -1586.501 Mzc = -0.000Myc = 0.000
Figure 3.
Ramamurthy Test A1 to A15 interaction diagram.
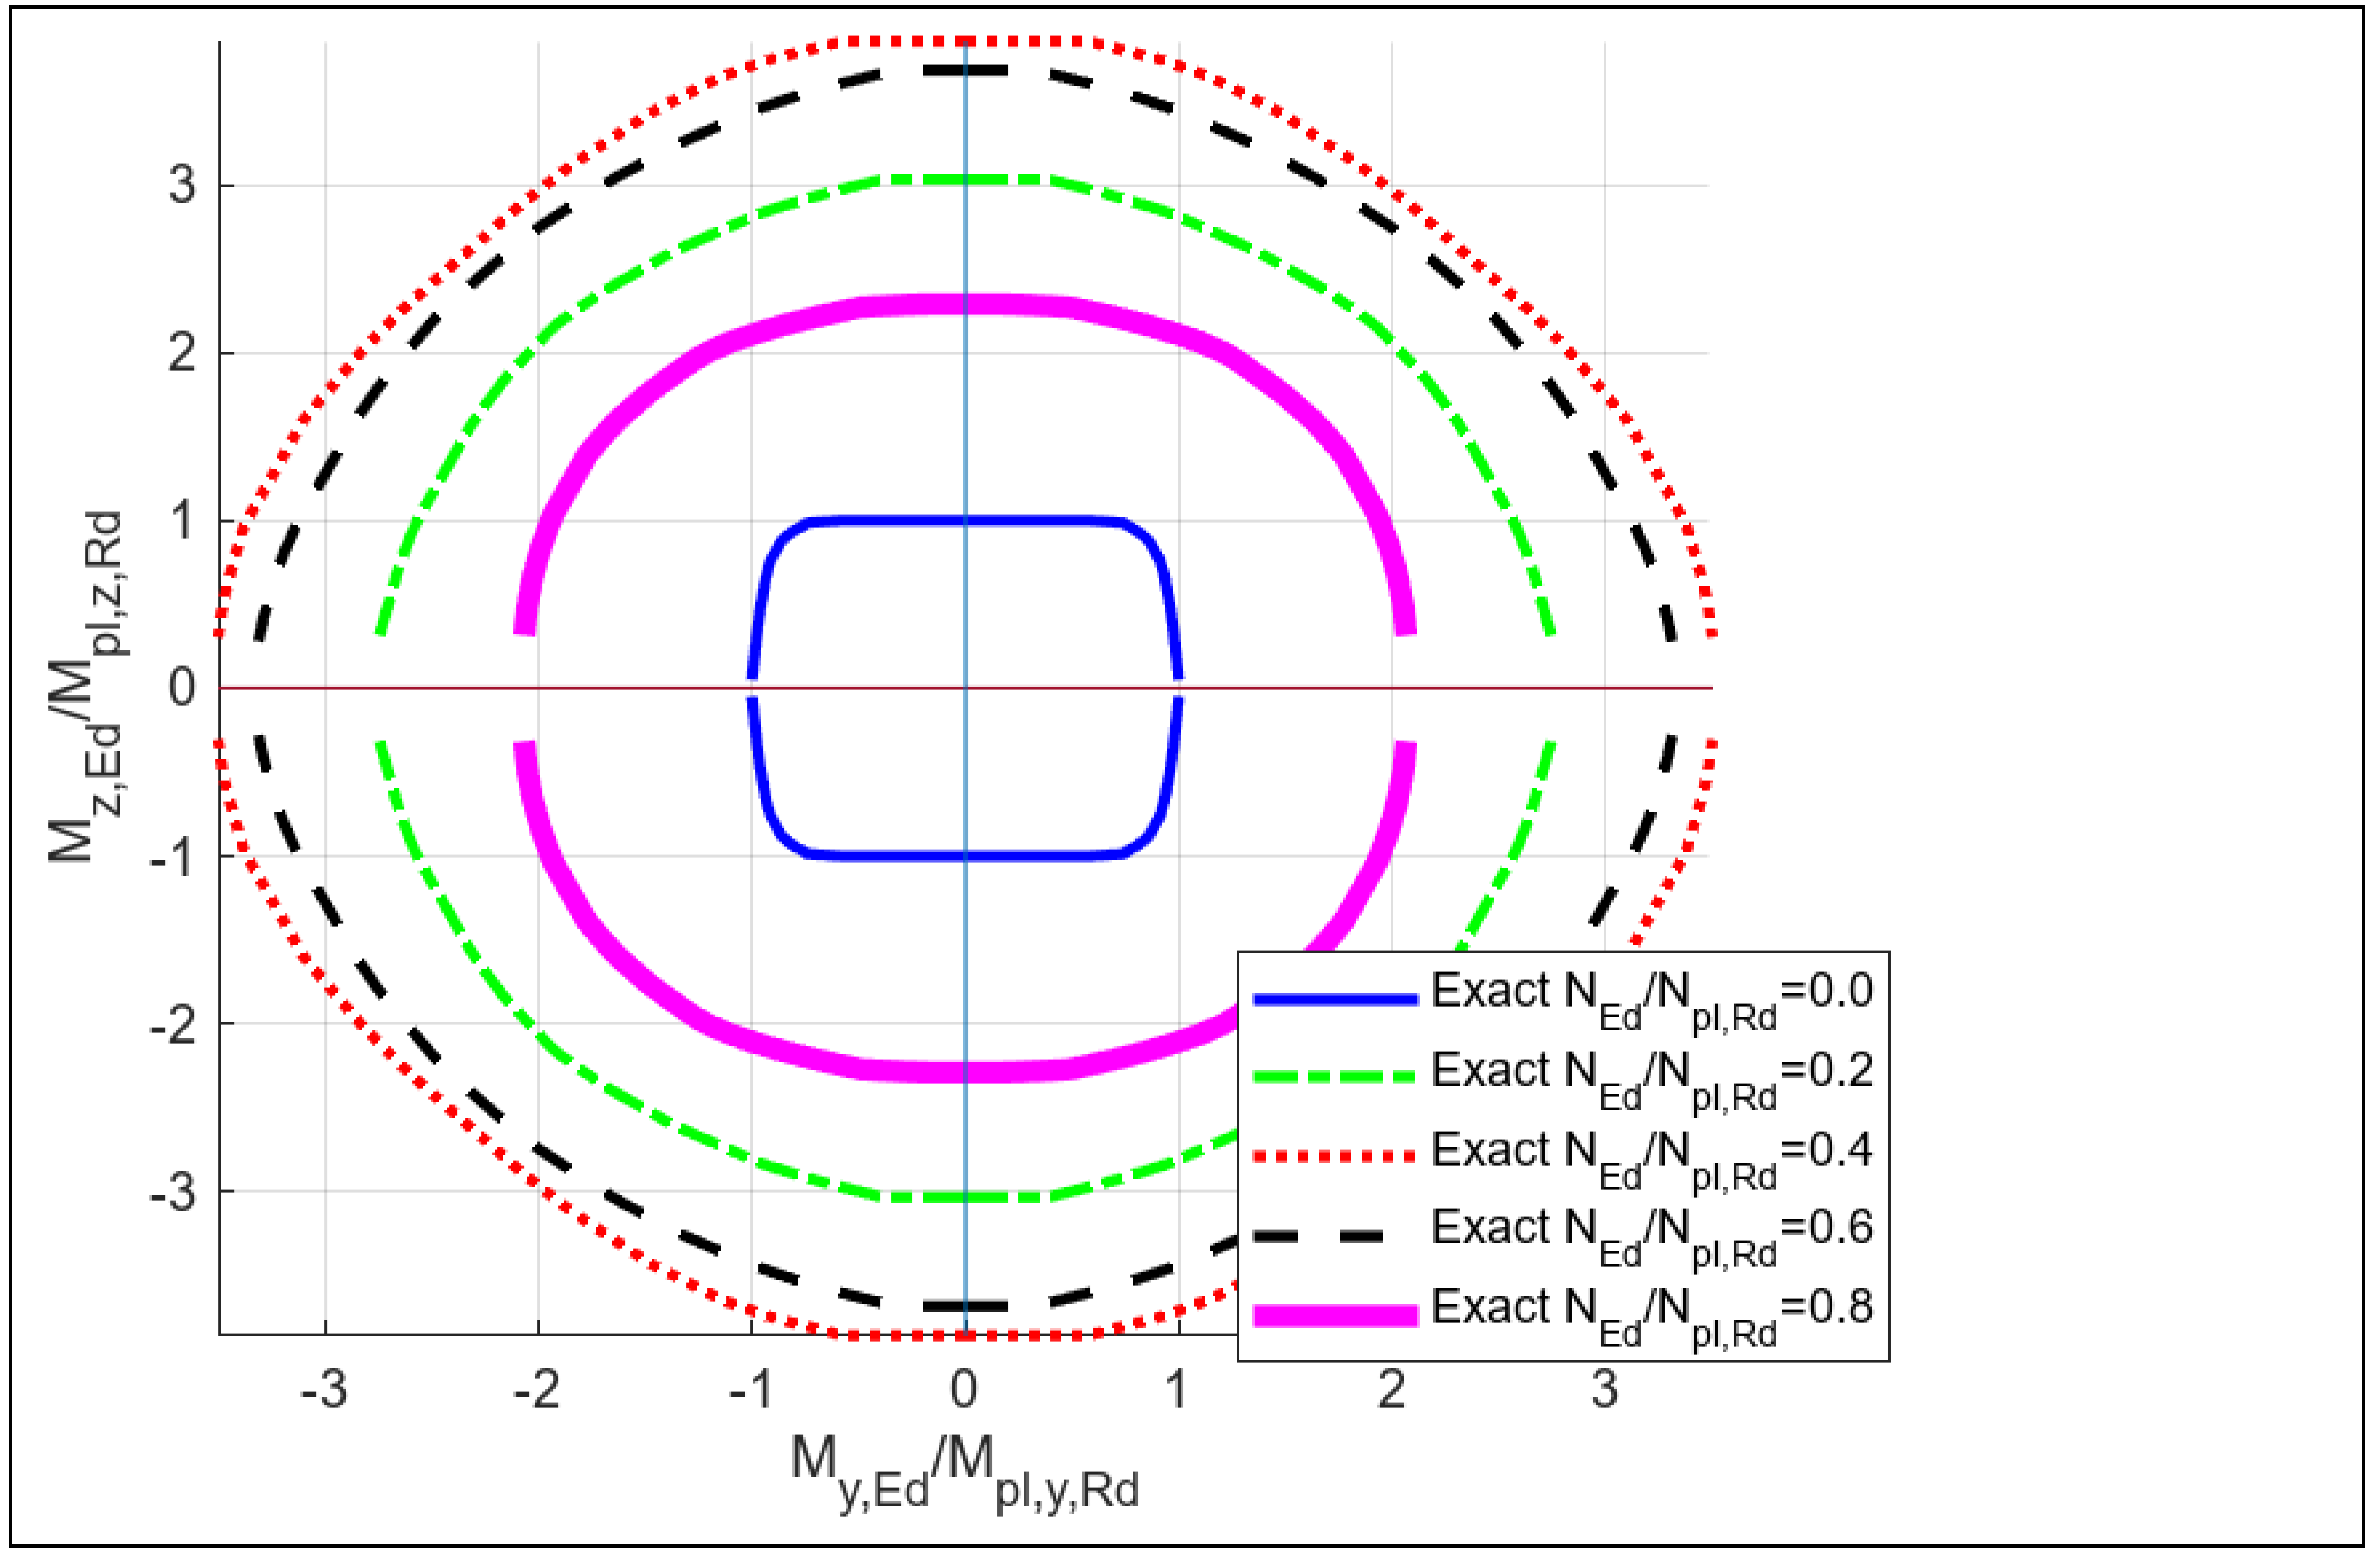
Ramamurthy Test A1-A15
Mypl = -6133.744 Mzpl = -2770.356 Npl = -2423.834
Myplmax = -11914.623 Nc = -1095.302Mzc = -0.000
Mzplmax = -5370.853 Nc = -1291.040Myc = -0.000
Nplmax = -2423.834 Mzc = 0.000Myc = -0.000
Interaction diagram composite section
Figure 4.
Composite section fiber model.
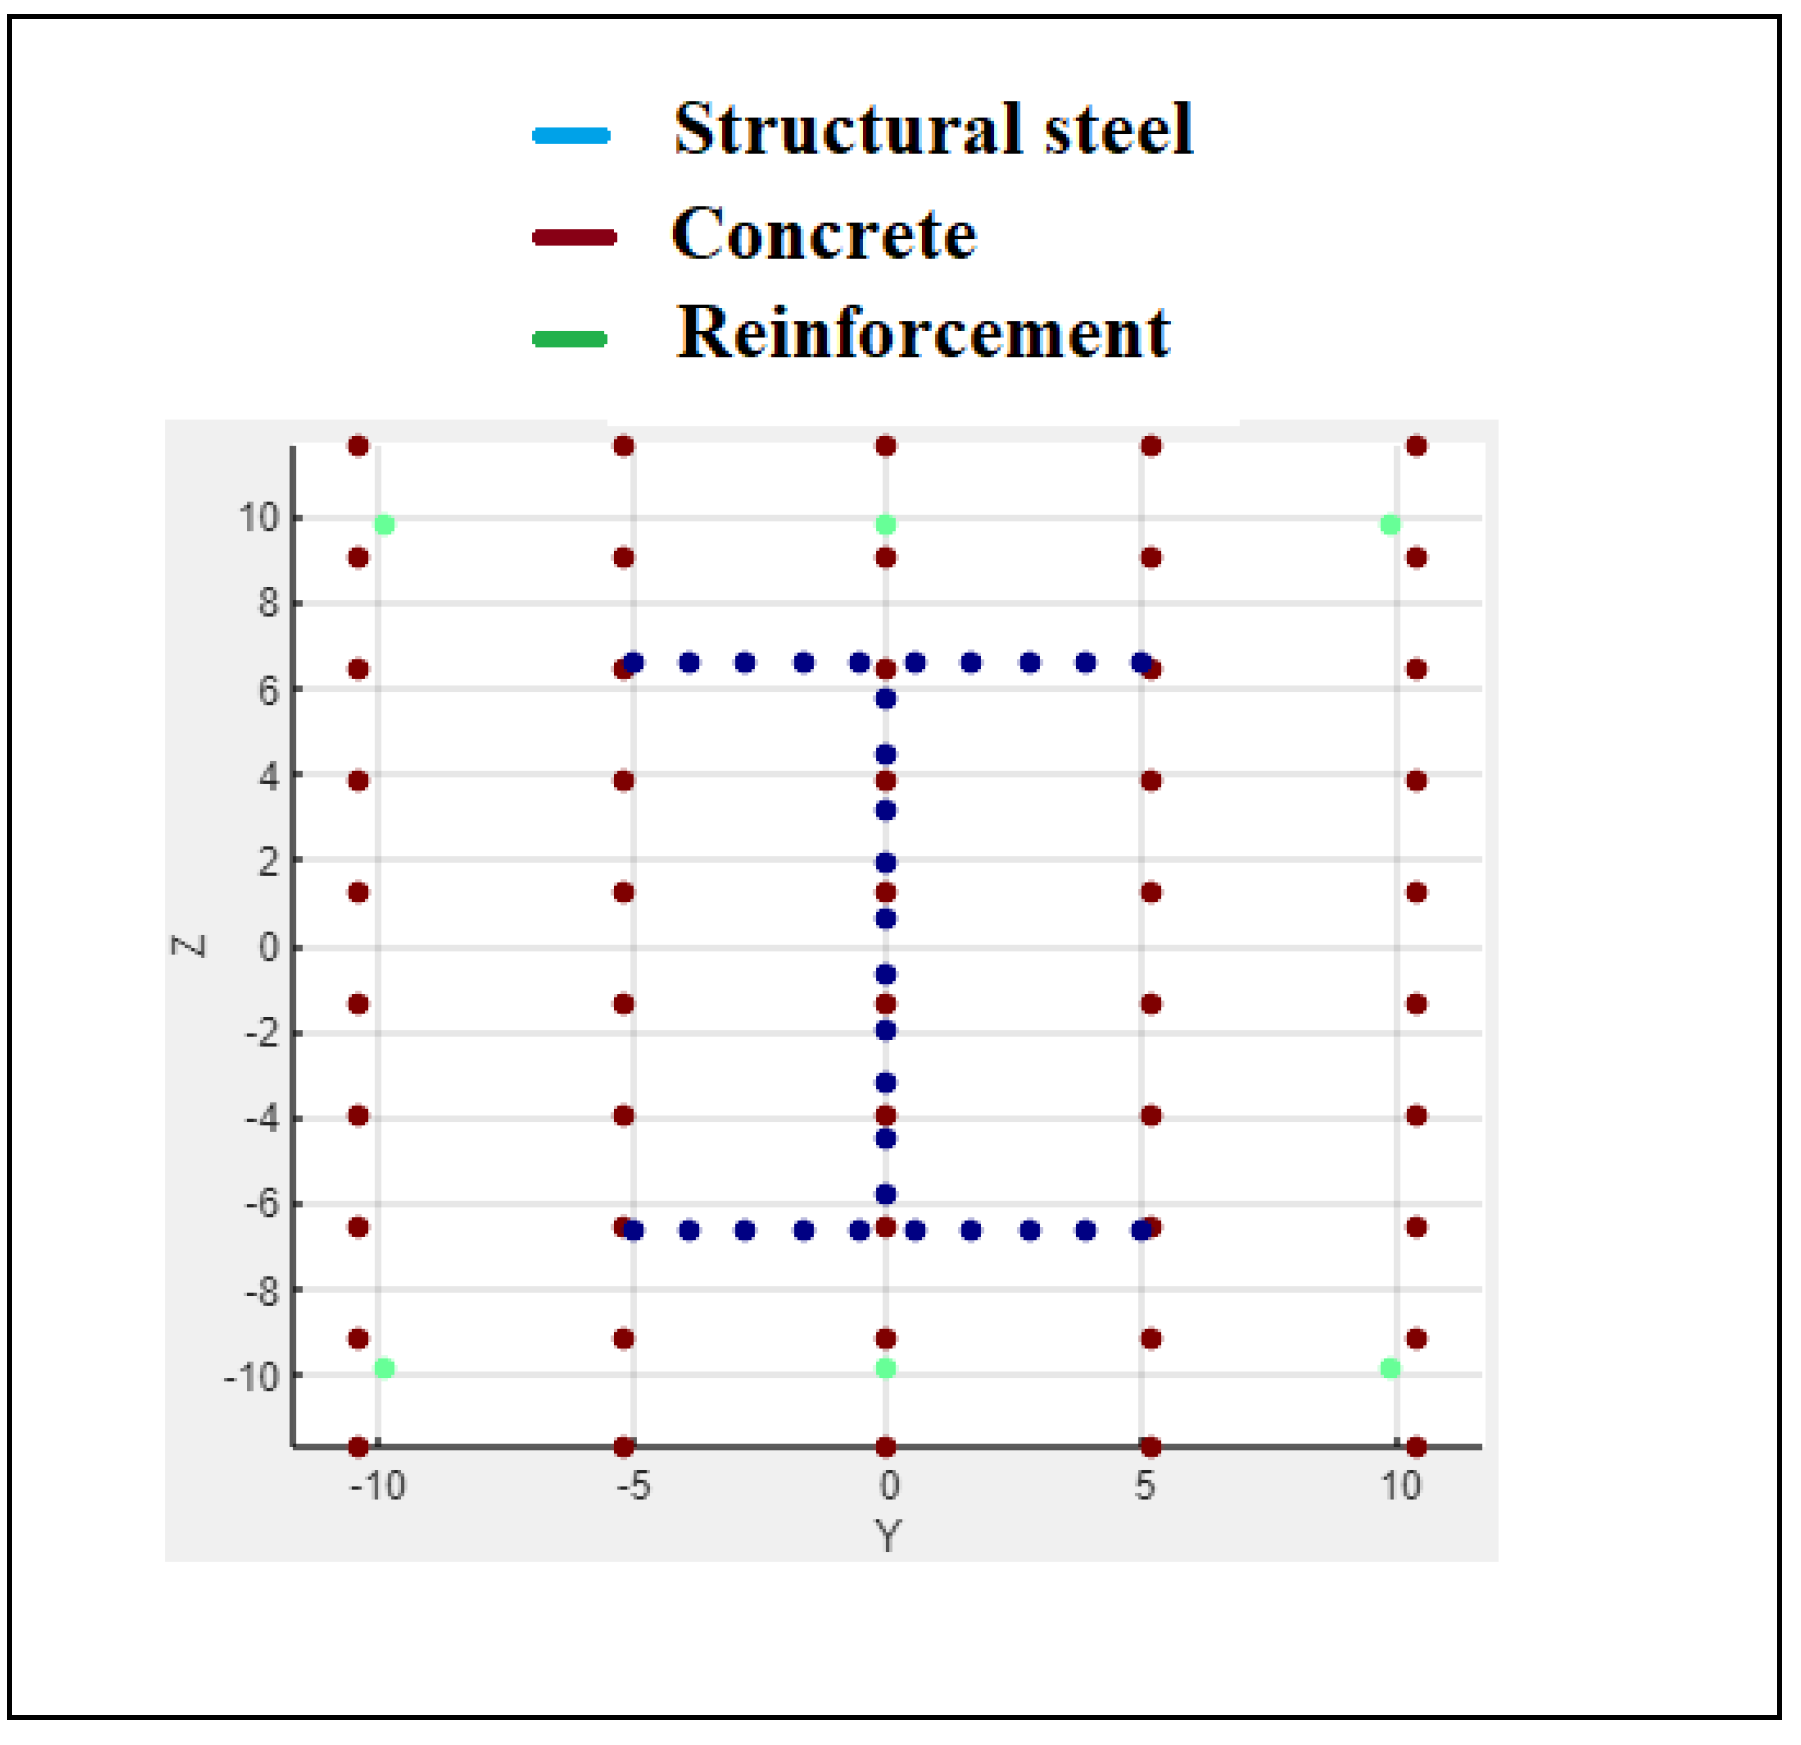
Figure 5.
Composite section real section.
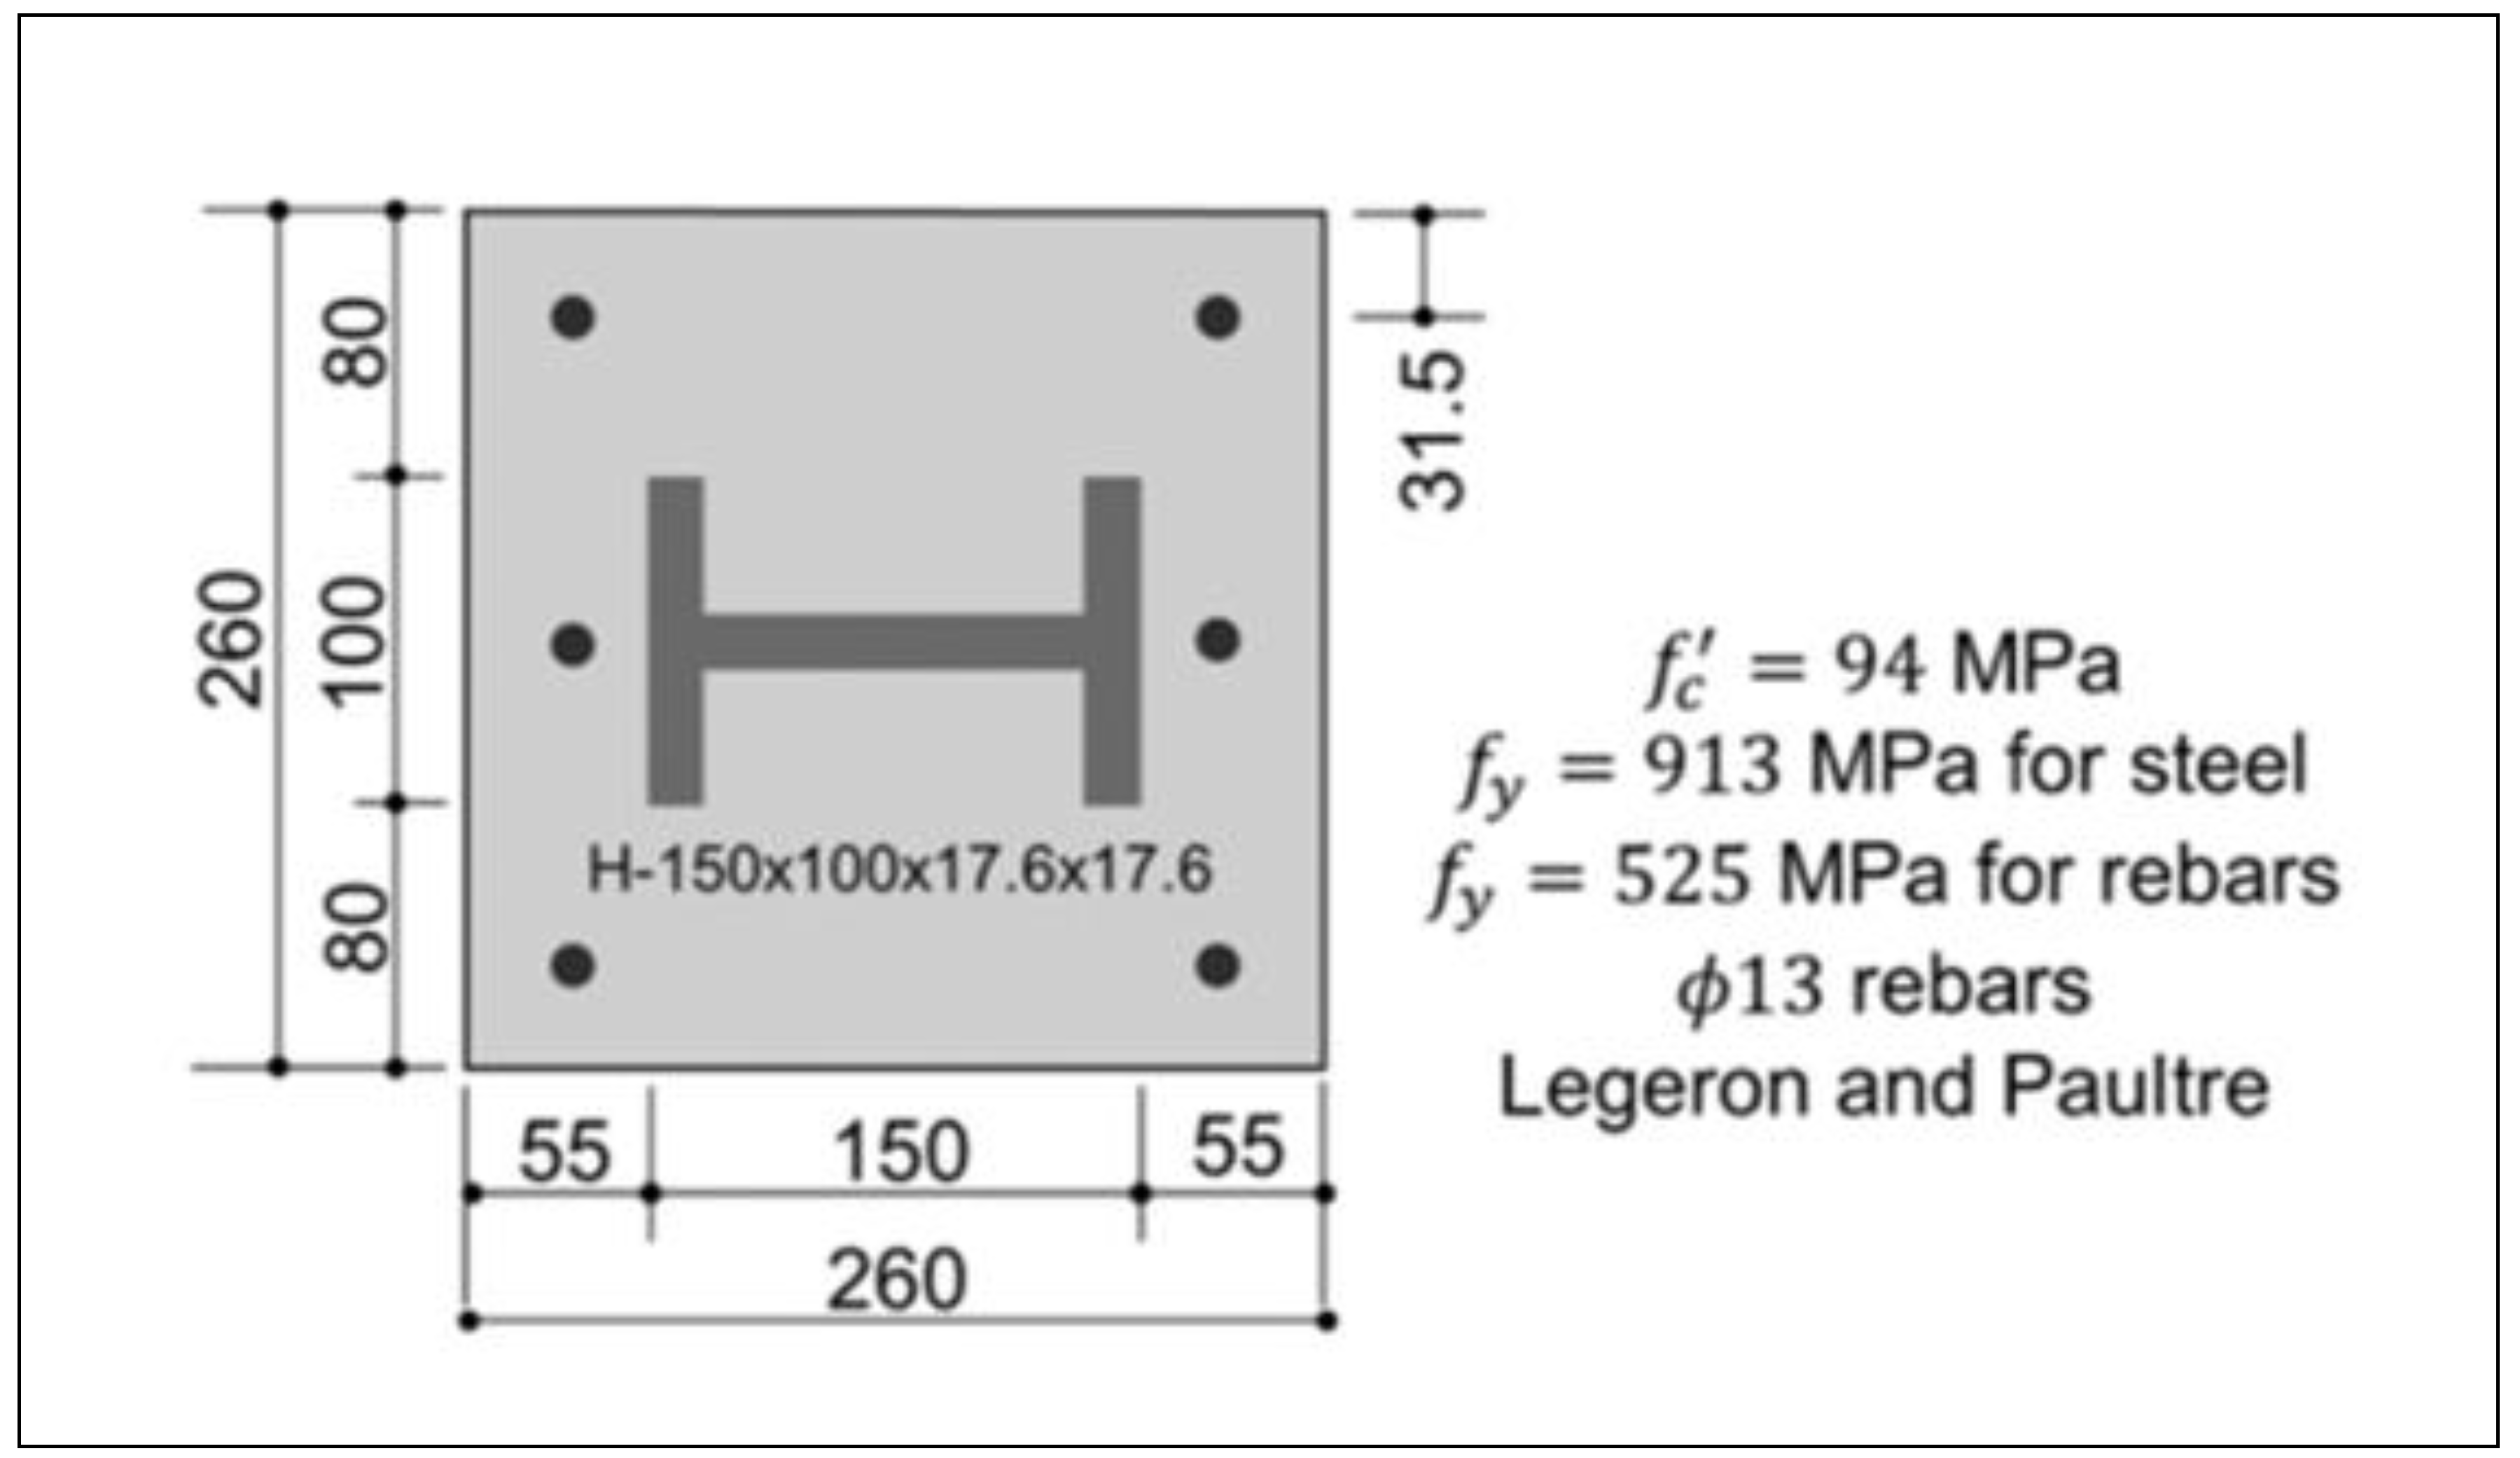
Figure 6.
Composite section interaction diagram.
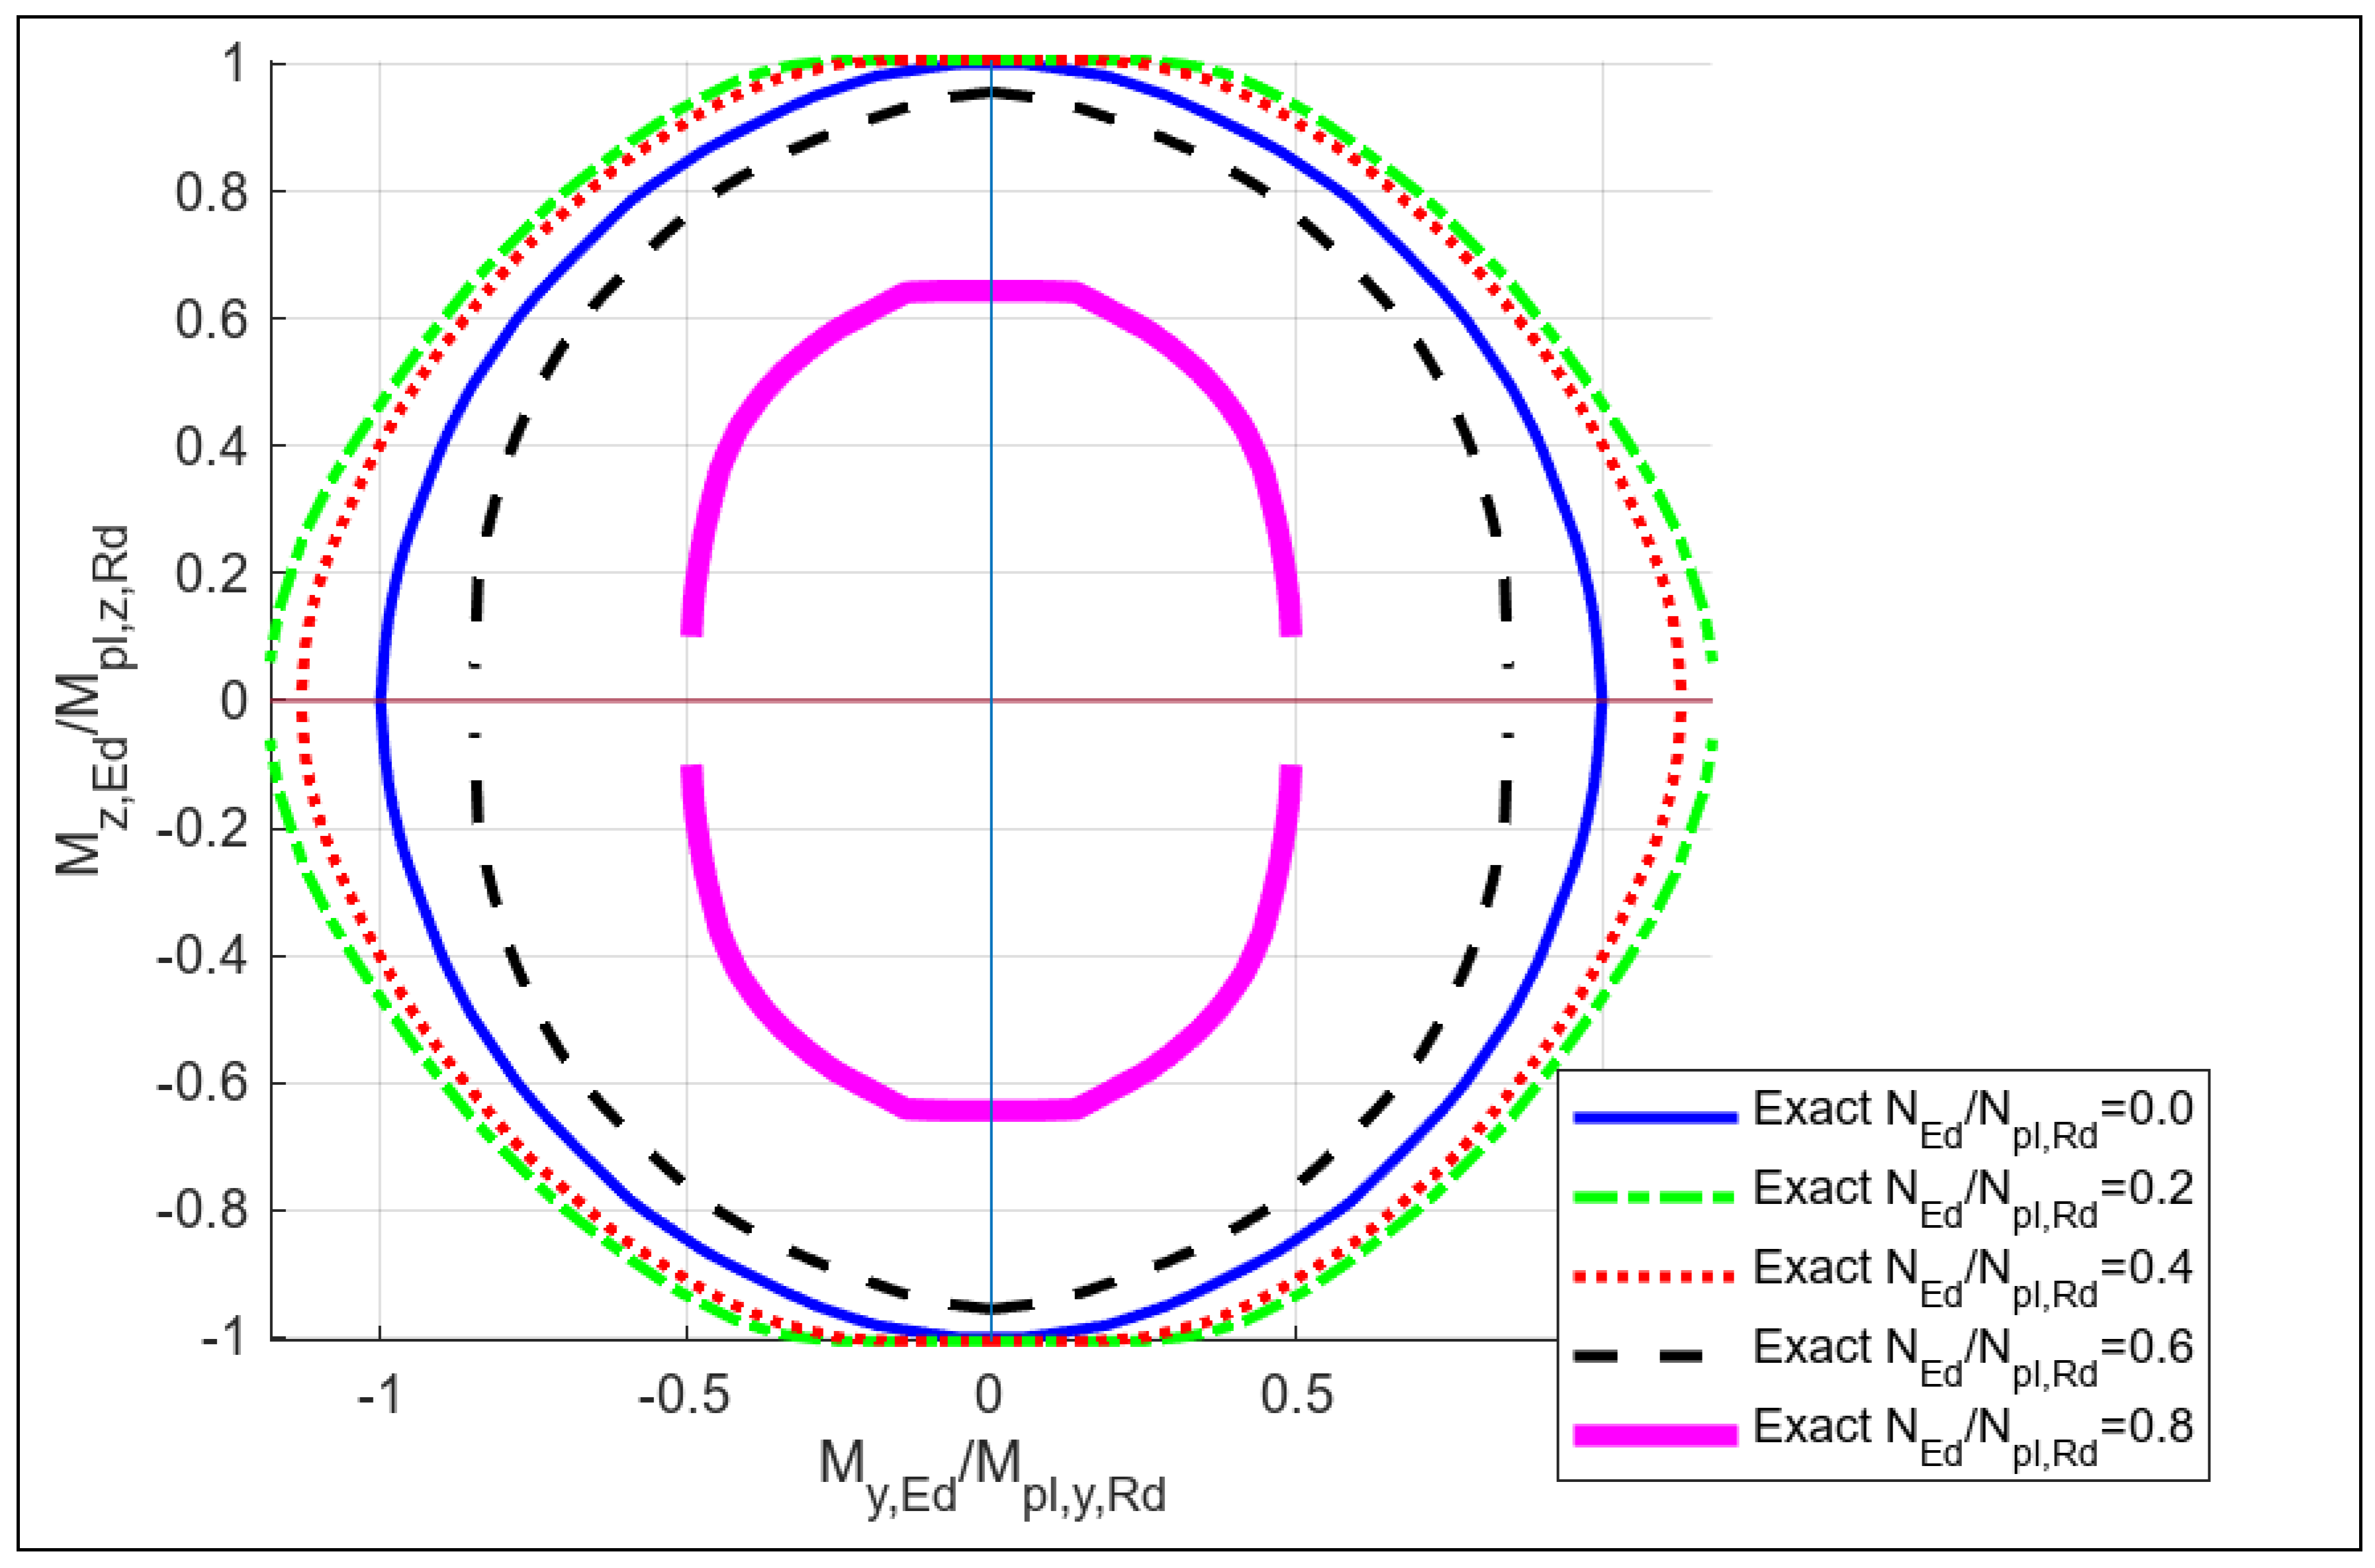
Composite 1
Units kN,cm
Mypl = -41746.732 Mzpl = -29347.220 Npl = -11195.526
Myplmax = -49862.610 Nc = -2859.480Mzc = 0.000
Mzplmax = -29515.840 Nc = -5415.443 Myc = 0.000
Nplmax = -11195.526 Mzc = 0.000Myc = -0.000
5. Conclusions
In this paper, we propose a novel algorithm based on the simplex method to calculate the ultimate strength of reinforced concrete and steel concrete composite sections under biaxial bending and axial force. The proposed algorithm is validated by comparing its analytical results with methods suggested by other authors and with experimental results available in the literature.
Further research: To take into account the fire effects at each fiber there Will be a Temperature related to new tensión and compression resistance at Steel fy(i,T) and a new compression resistance in concrete fc(i,T). So the input needed to solve this problema is Temperature map along the cross section, the software by Agüero [12] can be updated.
Nomenclature
according to Eurocodes.
References
- Bentz, EC. Sectional analysis of reinforced concrete members [PhD thesis]. University of Toronto; 2000.
- Papanikolaou, V.K. Analysis of arbitrary composite sections in biaxial bending and axial load. Comput Struct 2012, 98, 33–54. [Google Scholar] [CrossRef]
- Rosati, L.; Marno, F.; Serpieri, R. Enhanced solution strategies for the ultimate strength analysis of composite steel–concrete sections subject to axial force and biaxial bending. Comput Methods Appl Mech Eng 2008, 197, 1033–1055. [Google Scholar] [CrossRef]
- Charalampakis, A.E.; Koumousis, V.K. Ultimate strength analysis of composite sections under biaxial bending and axial load. Eng Struct 2008, 39, 923–936. [Google Scholar] [CrossRef]
- Sfakianakis, M.G. Biaxial bending with axial force of reinforced, composite and repaired concrete sections of arbitrary shape by fiber model and computer graphics. Adv Eng Softw 2002, 33, 227–242. [Google Scholar] [CrossRef]
- Dias da Silva, V.; Barros, M.H.F.M.; Júlio, E.N.B.S.; Ferreira, C.C. Closed form ultimate strength of multi-rectangle reinforced concrete sections under axial load and biaxial bending. Comput Concr 2009, 6, 505–521. [Google Scholar] [CrossRef]
- Rodriguez, J.A.; Aristizabal-Ochoa, J.D. Biaxial interaction diagrams for short RC columns of any cross section. J Struct Eng 1999, 125, 672–683. [Google Scholar] [CrossRef]
- Pallarès, L.; Miguel, P.F.; Fernández-Prada, M.A. A numerical method to design reinforced concrete sections subjected to axial forces and biaxial bending based on ultimate strain limits. Eng Struct 2009, 31, 3065–3071. [Google Scholar] [CrossRef]
- De Vivo, L.; Rosati, L. Ultimate strength analysis of reinforced concrete sections subject to axial force and biaxial bending. Comput Methods Appl Mech Eng 1980, 166, 261–287. [Google Scholar] [CrossRef]
- Pallarès, L.; Bonet, J.L.; Miguel, P.F.; Fernández Prada, M.A. Experimental research on high strength concrete slender columns subjected to compression and biaxial bending forces. Eng Struct 2008, 30, 1879–1894. [Google Scholar] [CrossRef]
- Ramamurthy, LN. Investigation of the ultimate strength of square and rectangular columns under biaxial eccentric loads. American Concrete Institute; 1966. p. 263–98 [Publ. 13].
- Agüero, A. “Section with fibers NMyMz” Software, Online available from https://laboratoriosvirtuales.upv.es/webapps/sectionfibersNMyMz.html, 2024.
Disclaimer/Publisher’s Note: The statements, opinions and data contained in all publications are solely those of the individual author(s) and contributor(s) and not of MDPI and/or the editor(s). MDPI and/or the editor(s) disclaim responsibility for any injury to people or property resulting from any ideas, methods, instructions or products referred to in the content. |
© 2025 by the authors. Licensee MDPI, Basel, Switzerland. This article is an open access article distributed under the terms and conditions of the Creative Commons Attribution (CC BY) license (http://creativecommons.org/licenses/by/4.0/).
Copyright: This open access article is published under a Creative Commons CC BY 4.0 license, which permit the free download, distribution, and reuse, provided that the author and preprint are cited in any reuse.


