Submitted:
11 February 2025
Posted:
13 February 2025
You are already at the latest version
Abstract
Bottom trawling is not selective fishing method, resulting in the capture of many bycatch species. This study aimed to examine the distribution of bycatch species in the hake-directed bottom fishery and to determine their potential for bycatch management and mitigation. Observer data from a hake-directed bottom trawl fishery in Namibia from 1997 to 2014 was analysed. About 23 bycatch species, weighing 9,031,480 tonnes, were recorded. Trachurus capensis, Trachipterus trachypterus, Helicolenus dactylopterus, Lophius vomerinus, and Genypterus capensis were the dominant species, comprising 63.09% of the total catch by weight. Analysis of Similarities (ANOSIM) (R = 0.88, P< 0.05) revealed significant differences in catch composition based on sampling site. The Similarity Percentage (SIMPER) showed that three bycatch species contributed the most to the dissimilarity in groups for spatial distribution. Widespread distribution of bycatch species, with high densities in the central and southern regions, suggests that hake-directed bottom trawling could have negative effects on these species. Species with a higher proportion of their population removed as bycatch, are considered the most vulnerable and may be nearly exterminated. To avoid the risk of species extinction, the fishery must be managed through spatial exclusion and fishing seasons.
Keywords:
1. Introduction
2. Materials and Methods
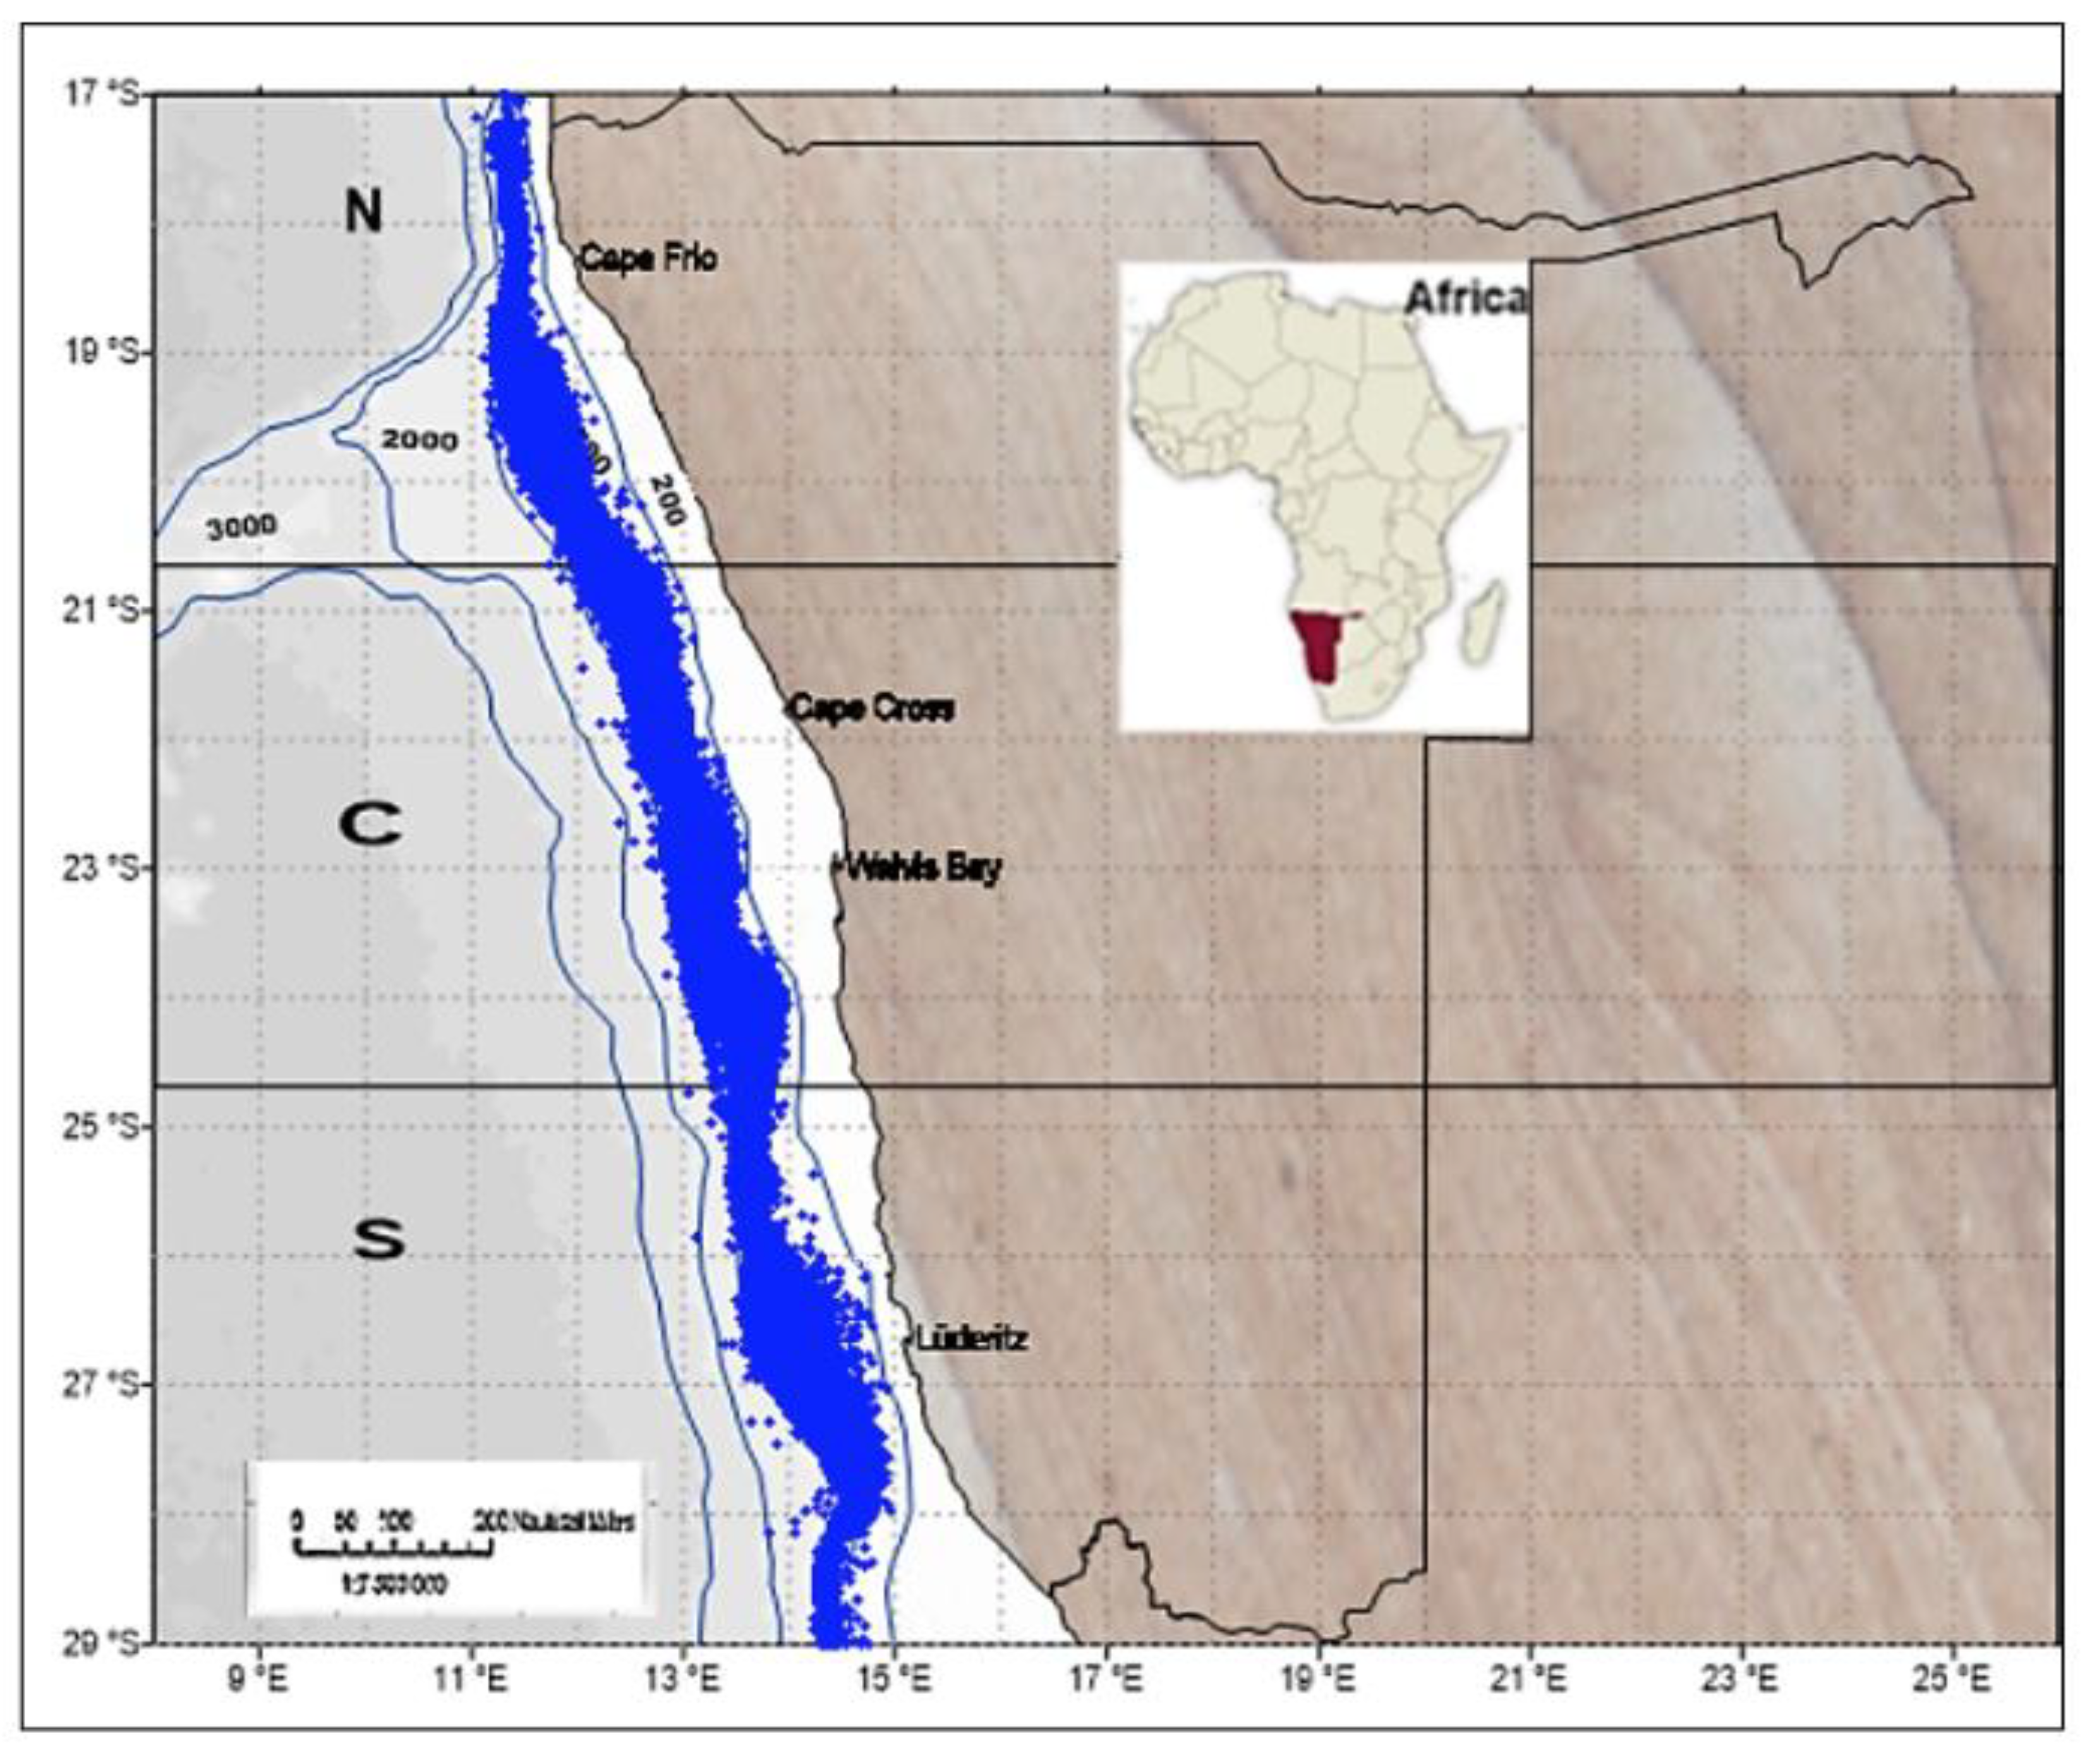
Study Area
Data Collection
Data Analysis
Catch per Unit Effort (CPUE)
Multivariate Analysis
3. Results
Bycatch Composition by Sampling Stations
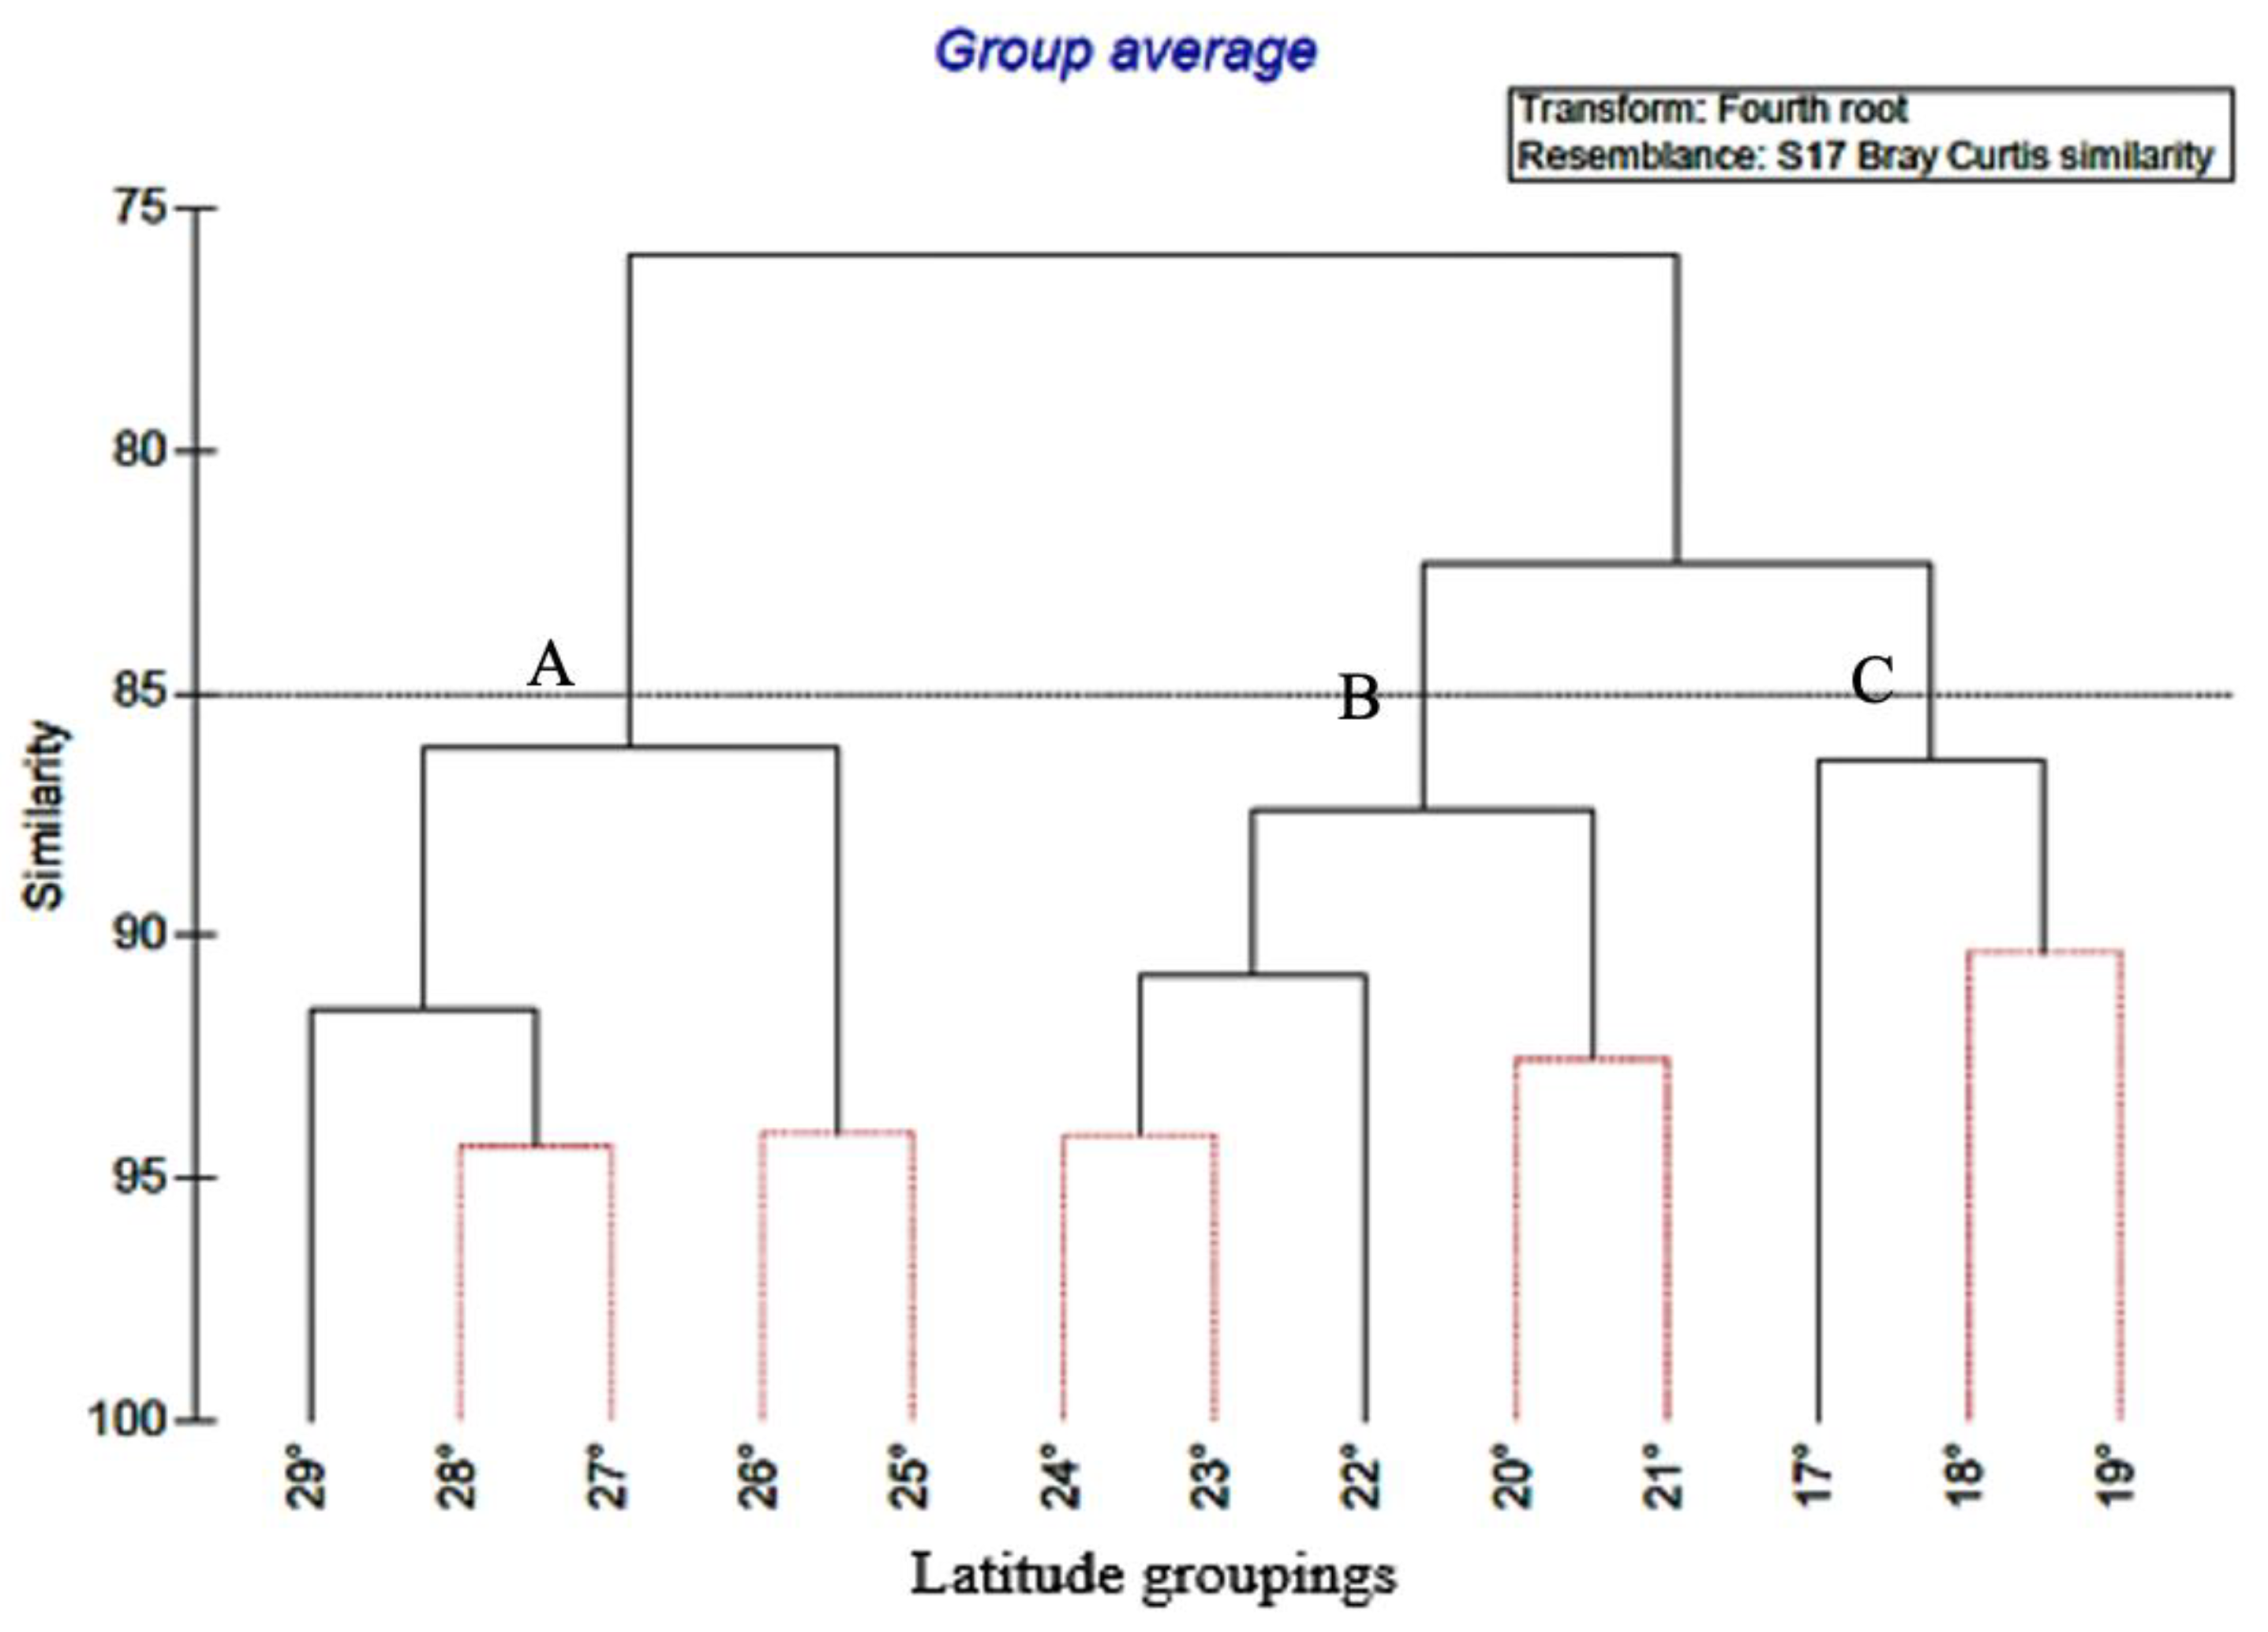
Bycatch Community Assemblages
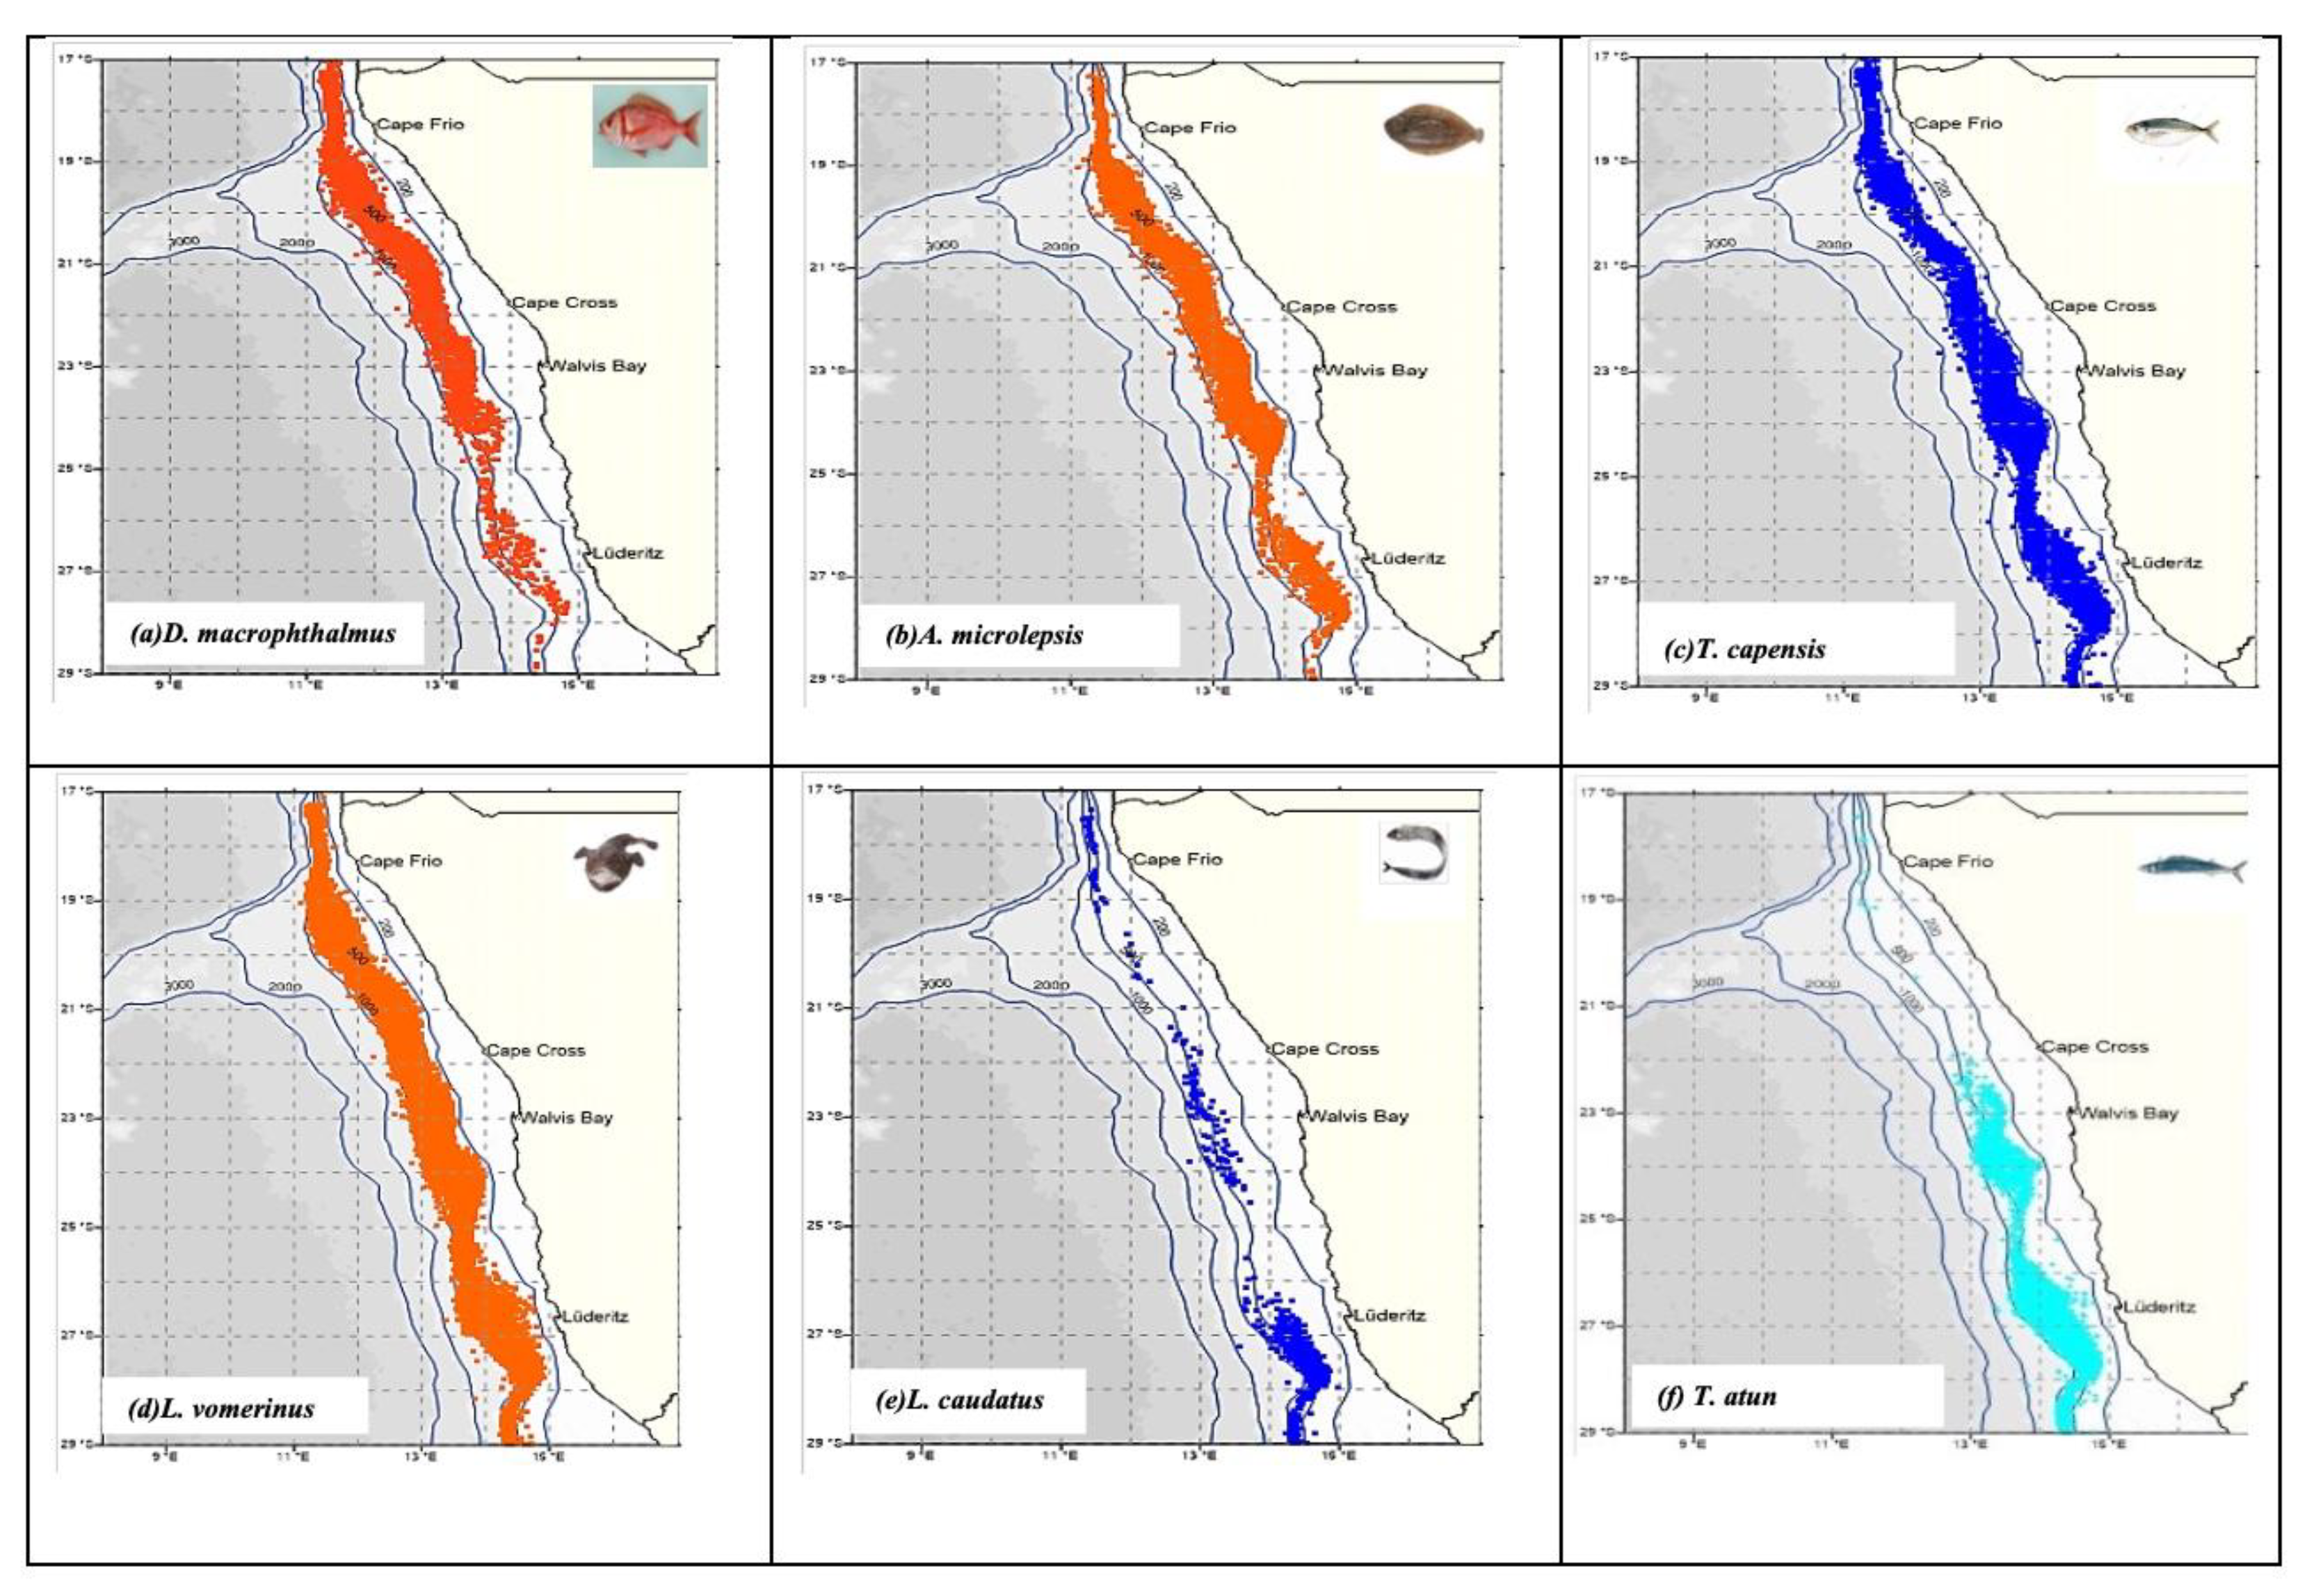
Spatial Distribution of Catch Rates (CPUE) of Selected Bycatch Species.
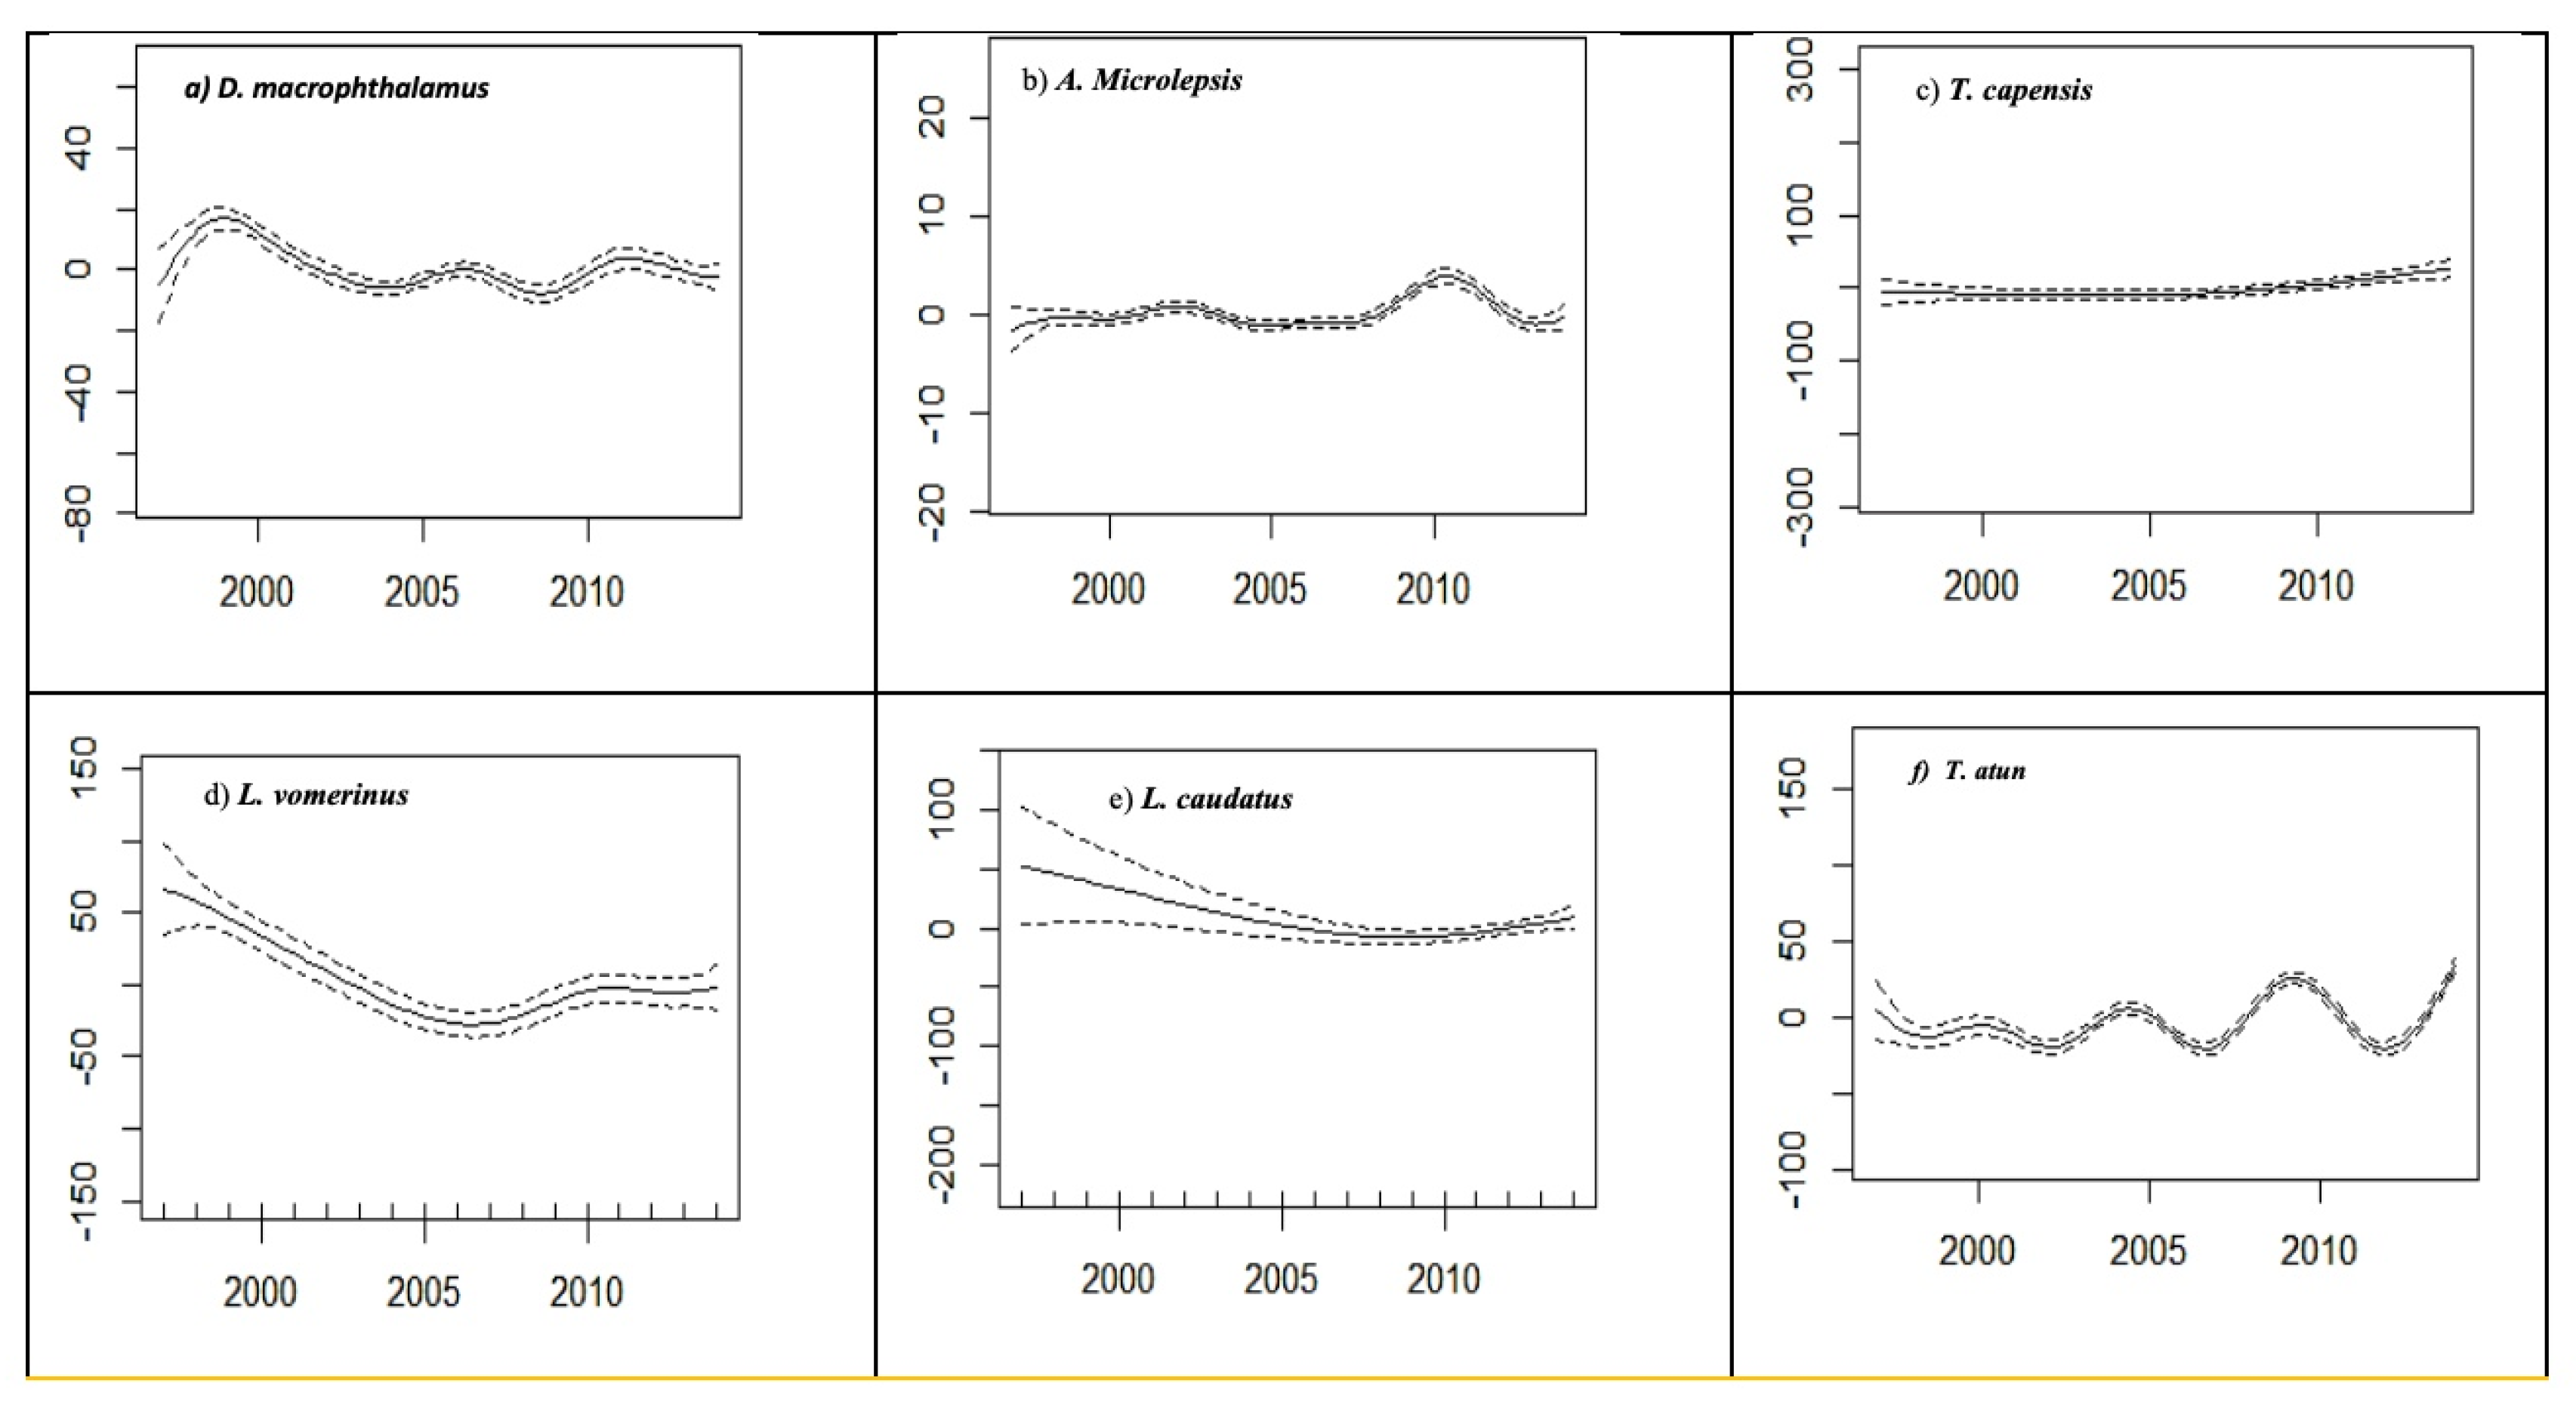
Annual Distribution of Catch Rate (CPUE) of the Selected Species
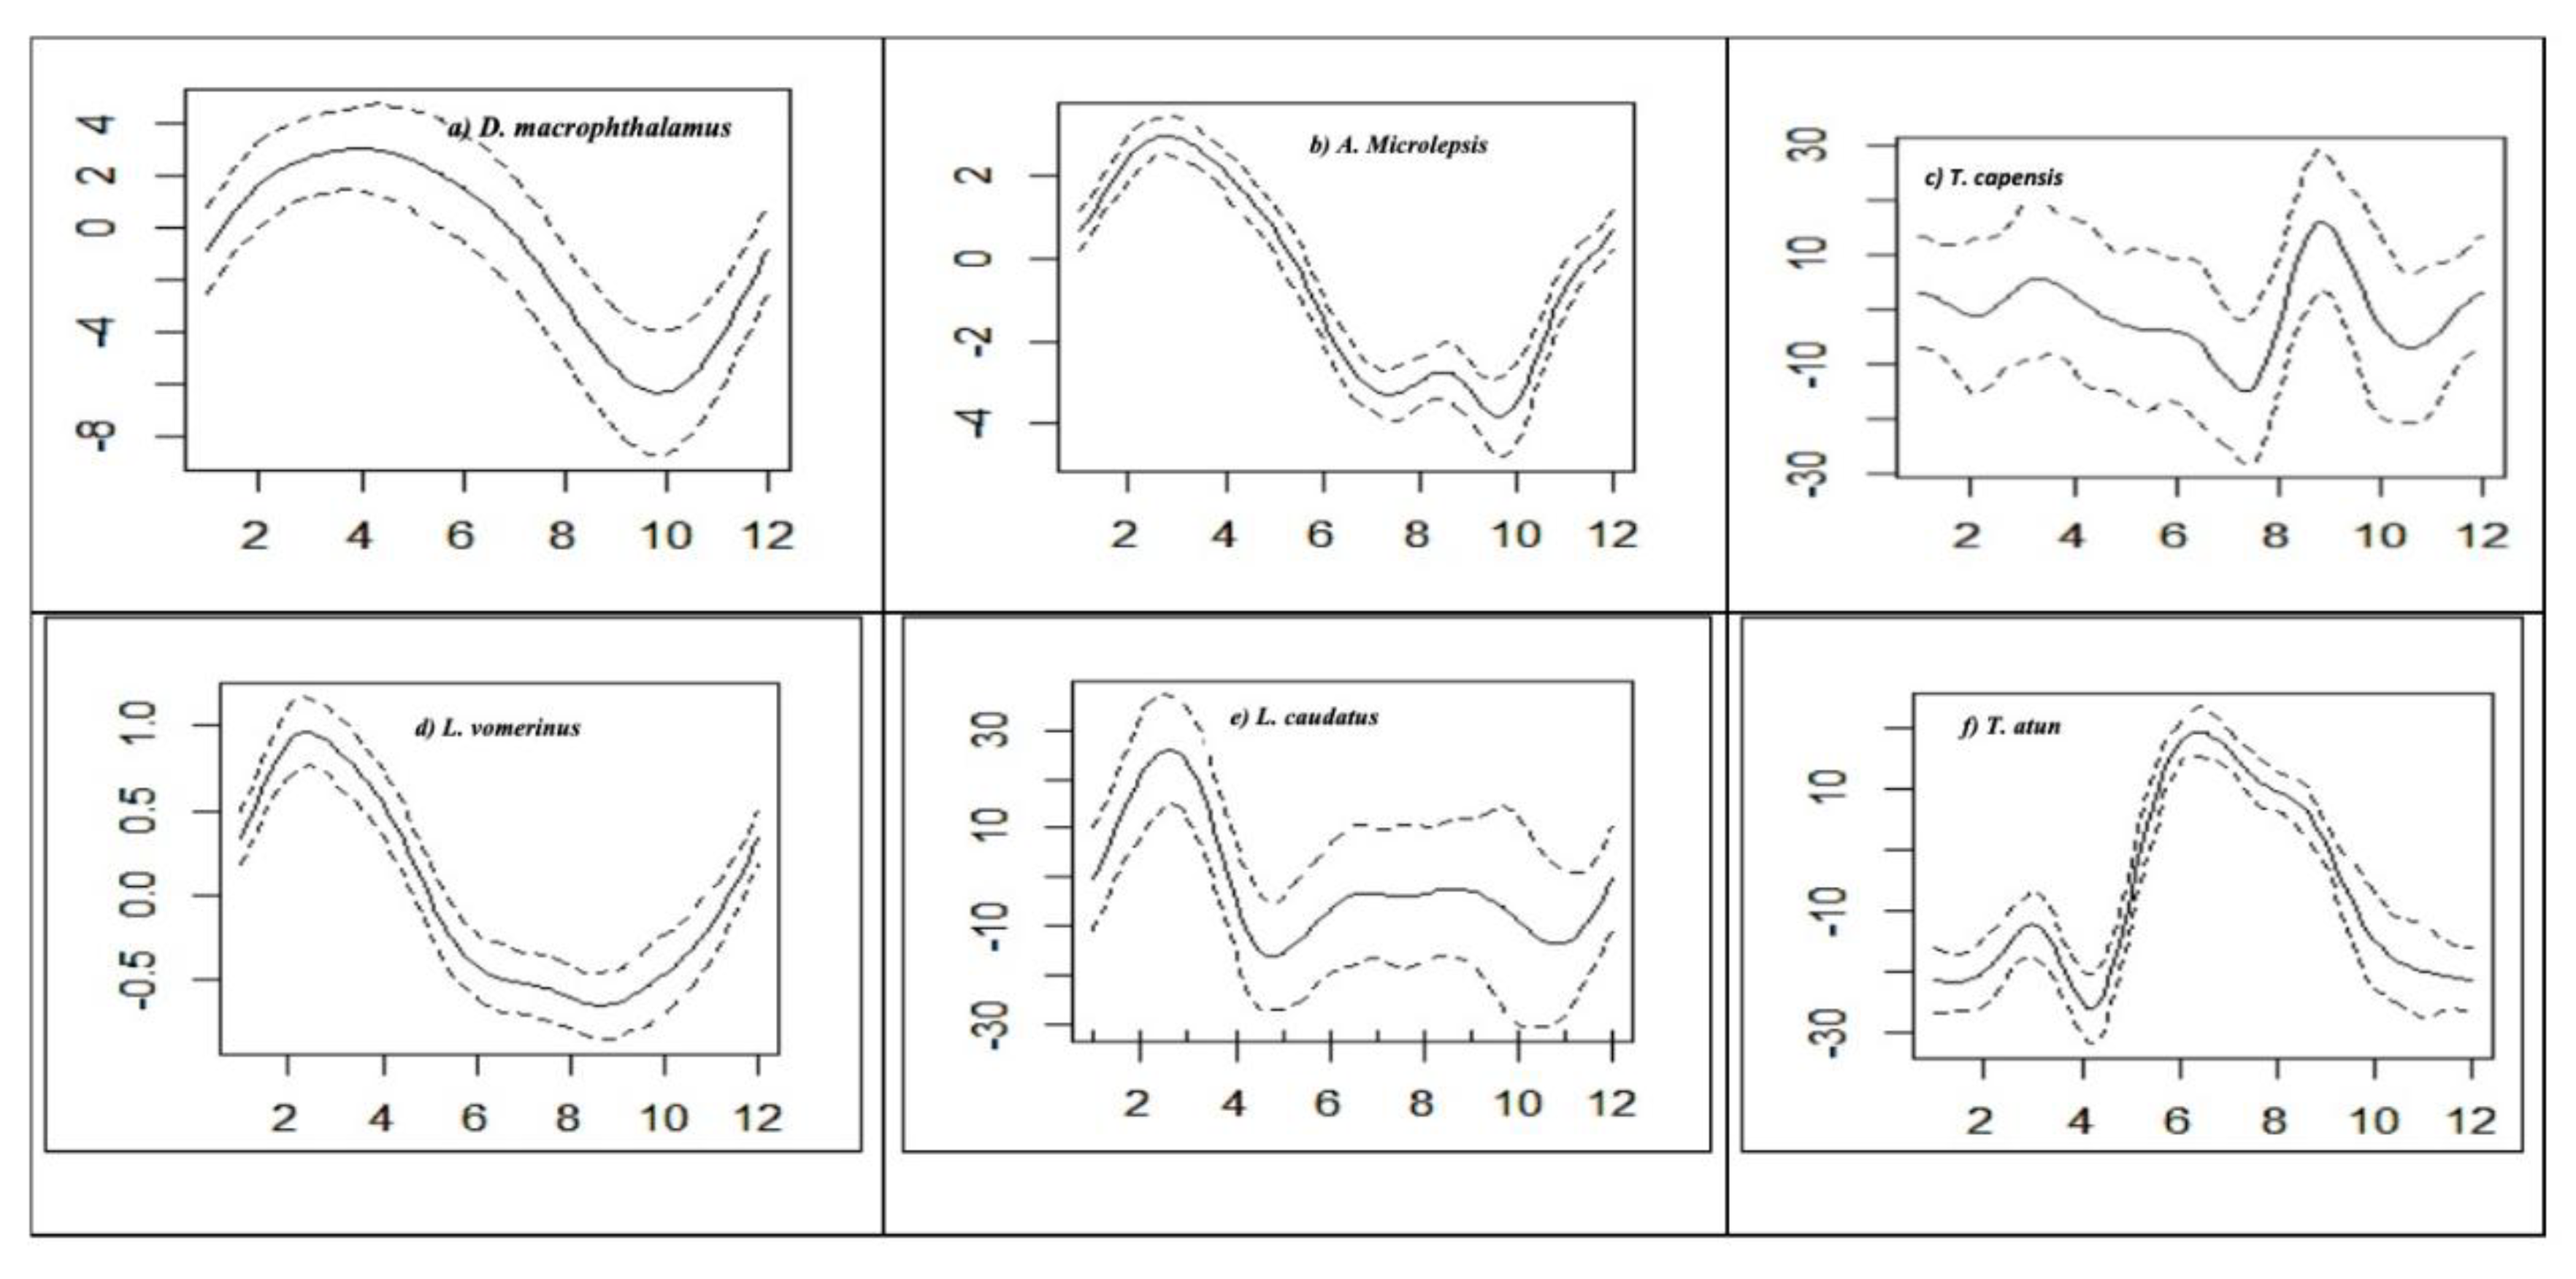
Seasonal Distribution of Catch Rate (CPUE) of Selected Species
4. Discussion
Bycatch Species Composition
Bycatch Community Assemblages
Spatial Distribution of the Key Selected Bycatch Species
Annual Catch Rates of the Key Selected Species
Seasonal Catch Rates of the Key Selected Species
Vulnerable Taxa
Management Implications
5. Conclusions
Author Contributions
Funding
Institutional Review Board Statement
Informed Consent Statement
Data Availability Statement
Acknowledgments
Conflicts of Interest
References
- Alverson, D.L., Freeberg, M.H., Murawski , S.A., & Pope, J.G. (1994). A global assessment of fisheries bycatch and discards. FAO Fisheries and Aquaculture Technical Papers. 339: 233.
- Blaber, S. J. M., & Wassenberg, T. J. (1989). The feeding ecology of the piscivorous birds Phalacrocorax varius, P. melanoleucos and Sterna bergii in Moreton Bay, Australia: diets and dependence on trawler discards. Marine Biology, 101: 1–10.
- Bianchi, G., Carpenter, K. E., Roux, J. P., Molloy, F. J., Boyer, D., & Boyer, H. J. (1993). The living marine resources of Namibia. Curso de análisis sociocultural y demográfico:. FAO, Roma (Italia) Norwegian Agency for International Development, Rome (Italy).
- Bianchi, G., Hamukuaya, H., & Alvheim, O. (2001). On the dynamics of demersalfish assemblages off Namibia in the 1990s, South African Journal of Marine Science.23:419-428.
- Boyer, D. C., & Hampton, I. (2001). An overview of the living marine resources of Namibia. African Journal of Marine Science, 23, 5–35. [CrossRef]
- Bradshaw, C., Brand, A.R., Hill, A.S., Veale, L.O. (2000). The effects of scallop dredging on gravelly seabed communities. In: Kaiser MJ, De Groot SJ (eds), Effects of fishing on non-target species and habitats. Gray Publishing, Tunbridge Wells. pp 83-104.
- Brander, K. (1981). Disappearance of common skate Raia batis from Irish Sea. Nature 290, 48–49. [CrossRef]
- Pillar, S.C. & Barange, M. (1998). Feeding habits, daily ration and vertical migration of the cape horse mackerel off South Africa. In: Pillar, S. c., Moloney, C. L., Payne, A. I. L. and F. A. Shillington (Eds). South African Journal of Marine Science, 19:1, 263-274, . [CrossRef]
- Catchpole, T.L., & Gray, T.S,. (2010). Reducing discards of fish at sea: A review of European pilot projects. Journal of Environmental Management 91: 717-723. [CrossRef]
- Clarke, K.R., & Gorley, R.N. (2006). PRIMER v6: User Manual/Tutorial. Plymouth Marine Laboratory, Plymouth. pp 75.
- Clarke, K.R., & Warwick,R.M. (2001). Change in Marine Communities: An Approach to Statistical Analysis and Interpretation (2nd eds). Plymouth Marine Laboratory, Plymouth. pp 144.
- Crawford, R.M., & De-Villiers, G. (1985). Snoek and their prey: interrelationships in the Benguela upwelling system. South African Journal of Science 81: 91-97.
- Davies, A. J., Roberts, J. M., & Hall-Spencer, J. (2007). Preserving deep-sea natural heritage: emerging issues in offshore conservation and management. Biological Conservation, 138(3–4), 299–312. [CrossRef]
- Diaz de Astarloa, J.M .(2002). A review of the flatfish of the South Atlantic Ocean. Revista de Biologia Marina y Oceanografia 37: 113-125.
- Gabriel, O., Lange, K., Dahm ,E., & Wendt ,T .(2005). Fish catch methods of the world. Fourth edition. Blackwell Publishing , Oxford, United Kingdom.
- Griffiths, M.H,. (2002). Life History of South African snoek, Thyristes atun (Pisces: Gempylidae): a pelagic predator of the Benguela ecosystem. Fisheries Bulletin 100: 690-710.
- Hall, M. A., Alverson, D. L., & Metuzals, K. I. (2000). By-catch: problems and solutions. Marine Pollution Bulletin, 41(1–6), 204–219. [CrossRef]
- Iitembu, J. A., Erasmus, V. N., Uanivi, U., Nakwaya, D., Horaeb, R. R., Nangolo, E., Nashima, F. P., Iita, T. K., & Mwandemele, O. (2021). The hits and misses of Namibia’s attempt to implement the Ecosystem Approach to Fisheries (EAF) Management. Ecosystem Health and Sustainability, 7(1), 1920340. [CrossRef]
- Iitembu, J. A., Miller, T. W., Ohmori, K., Kanime, A., & Wells, S. (2012). Comparison of ontogenetic trophic shift in two hake species, Merluccius capensis and Merluccius paradoxus, from the Northern Benguela Current ecosystem (Namibia) using stable isotope analysis. Fisheries Oceanography, 21(2-3), 215–225.
- Maartens, L., Booth, A. J., & Hecht, T. (1999). The growth of monkfish Lophius vomerinus in Namibian waters, with a comparison of otolith and illicia methods of ageing. Fisheries Research, 44(2), 139–148. [CrossRef]
- Maartens, L., & Booth, A.J. (2005). Aspects of the reproductive biology of monkfish Lophius vomerinus off Namibia. South African Journal of Marine Science 27: 325–329.
- Mafwila, S. K. (2011). Ecosystem effects of bottom trawling in the Benguela current system: experimental and retrospective data analyses. PhD thesis, University of Cape Town.
- Macpherson, E., & Gordoa, A. (1992). Trends in the demersal fish community off Namibia from 1983 to 1990. Benguela Trophic Functioning. In: Payne AIL, Brink KH, Mann KH, Hilborn R (Eds), South African Journal of Marine Science 12: 635–649.
- Ministry of Fisheries and Marine Resources. (2006). Annual report 2006. Windhoek, Namibia. Unpublished.
- Ministry of Fisheries and Marine Resources. (2018). Cruise Report No 1/2018 RV Mirabilis. Windhoek, Namibia. Unpublished.
- Nakamura, I. (1993). Snake mackerels and cutlassfishes of the world (Families Gempylidae and Trichiuridae). FAO Fish. Syno., 125, 30–32.
- Nashima, F.P. (2009). Effects of environmental variability on fish diversity and composition along the southern Namibian coastline during summer. Master’s thesis, University of Namibia and the Humboldt-Universität zu Berlin.
- Nuñez, M. A., Kuebbing,S., Dimarco, R.,& Simberloff, D. (2012). Invasive species: to eat or not to eat, that is the question. Conservation Letters 5:334–341. [CrossRef]
- O’Toole, M. J. P. (1977). Investigations into some important fish larvae in the South East Atlantic in relation to the hydrological environment.
- Perez, J. A. A., & Wahrlich, R. (2005). A bycatch assessment of the gillnet monkfish Lophius gastrophysus fishery off southern Brazil. Fisheries Research 72: 81-95. [CrossRef]
- Pinedo, M. C., & Polacheck, T. (2004). Sea turtle by-catch in pelagic longline sets off southern Brazil. Biological Conservation, 119(3): 335–339. [CrossRef]
- Pollock, K. H., Jones, C. M. & Brown,T.L.(1994) .Angler survey methods and their applications in fisheries management. Special Publication. NO.25.Bethesda, Maryland: American Fisheries Society.
- Rochet, M.J., Péronnet ,I., & Trenkel, V.M .(2002). An analysis of discards from the French trawler fleet in the Celtic Sea. ICES Journal of Marine Science: Journal Du Conseil, 59:538-552. [CrossRef]
- Ronholt, L.L., Shippen,H.H., & Brown,E.S.( 1978). Demersal fish and shellfish resources of the Gulf of Alaska from Cape Spencer to Unimak Pass, 1948-1976 (a historical review), Volumes l-4. Processed Rep., various pagination. Northwest and Alaska Fish. Centeral., National. Marine. Fish. Servey., NOAA, 2725 Montlake Blvd. E., Seattle, WA 98112.
- Sakko, A.L. 1(998). Biodiversity of marine habitats. In: Barnard P, Biological diversity in Namibia – A country study. Windhoek. Namibian National Biodiversity Task Force.

| Species | Station A (North) | Station B (Central) | Station C (South) | Total | ||||
|---|---|---|---|---|---|---|---|---|
| W | %W | W | %W | W | %W | W | %W | |
| Allocyttus verrucosus | 536.83 | 0.04 | 680.79 | 0.03 | 2018.36 | 0.04 | 3236.05 | 0.04 |
| Diplodus capensis | 227.08 | 0.02 | - | - | - | - | 227.10 | 0.00 |
| Epigonus spp | 300.01 | 0.02 | 1169.04 | 0.06 | 19132.32 | 0.34 | 20601.45 | 0.23 |
| Lepidotus caudatus | 500.91 | 0.03 | 1158.85 | 0.06 | 275536.06 | 4.96 | 277195.92 | 3.07 |
| Macrouridae spp) | 125.69 | 0.01 | 42.58 | 0.00 | - | - | 168.28 | 0.00 |
| Isurus oxyrinchus | 5254.94 | 0.36 | 31777.75 | 1.56 | 66132.95 | 1.19 | 103167.57 | 1.14 |
| Argyrosomus inodorus | 8820.81 | 0.61 | 1.44 | 0.00 | - | - | 8822.86 | 0.10 |
| Brama brama | 13774.57 | 0.95 | 132906.70 | 6.53 | 214866.74 | 3.87 | 361555.49 | 4.00 |
| Taractichthys logipinnis | 6392.39 | 0.44 | 52580.55 | 2.58 | 554515.56 | 9.99 | 613491.53 | 6.79 |
| Cheilidonicthys capensis | 60998.17 | 4.23 | 27783.48 | 1.37 | 2987.83 | 0.05 | 91775.07 | 1.02 |
| Dentex macrophthalmus | 474168.17 | 32.85 | 22312.40 | 1.10 | 7359.92 | 0.13 | 503874.44 | 5.58 |
| Trachurus capensis | 214469.55 | 14.86 | 832024.50 | 40.88 | 254748.45 | 4.59 | 1301298.24 | 14.41 |
| Helicolenus dactylopterus | 205521.73 | 14.24 | 264626.17 | 13.00 | 709196.45 | 12.77 | 1179371.60 | 13.06 |
| Zeus faber | 73660.21 | 5.10 | 15520.68 | 0.76 | 169334.35 | 3.05 | 258521.10 | 2.86 |
| Genypterus capensis | 273.26 | 0.02 | 9287.85 | 0.46 | 833358.76 | 15.01 | 842920.34 | 9.33 |
| Lophius vomerinus | 205926.64 | 14.27 | 367924.82 | 18.08 | 448784.37 | 8.08 | 1022668.17 | 11.32 |
| Thyrsites atun | 132.26 | 0.01 | 12564.01 | 0.62 | 448548.18 | 8.08 | 461245.08 | 5.11 |
| Austroglosus microlepsis | 98069.53 | 6.80 | 87933.89 | 4.32 | 16424.09 | 0.30 | 202438.63 | 2.24 |
| Thunus spp | 294.97 | 0.02 | - | - | 375.23 | 0.01 | 670.22 | 0.01 |
| Trachipterus trachypterus | 678.10 | 0.05 | 34440.76 | 1.69 | 1317225.68 | 23.72 | 1352346.28 | 14.97 |
| Thunnus albacores | 620.14 | 0.04 | 3.35 | 0.00 | - | - | 623.54 | 0.01 |
| Todarodes sagittatus | 72136.56 | 5.00 | 139988.22 | 6.88 | 198271.80 | 3.57 | 410408.46 | 4.54 |
| Raja species | 360.00 | 0.02 | 345.32 | 0.02 | 14347.19 | 0.26 | 15052.55 | 0.17 |
| Total | 1443242.5 | 2035073.2 | 5553164.3 | 9031480.0 | ||||
| Average Dissimilarity = 21.25 | ||||||
|---|---|---|---|---|---|---|
| Species | Cluster: A | Cluster: C | Av.Diss | Diss/SD | Contrib% | Cum.% |
| R. species | 7.81 | 3.47 | 2.12 | 3.81 | 9.97 | 9.97 |
| A. microlepsis | 3.32 | 7.09 | 1.85 | 3.25 | 8.71 | 18.68 |
| G. capensis | 9.15 | 5.45 | 1.82 | 2.06 | 8.58 | 27.27 |
| T. atun | 6.71 | 3.19 | 1.72 | 2.31 | 8.11 | 35.38 |
| T. trachypterus | 5.61 | 3.03 | 1.32 | 1.63 | 6.21 | 41.59 |
| Average Dissimilarity = 28.88 | ||||||
|---|---|---|---|---|---|---|
| Species | Cluster: A | Cluster: B | Av.Diss | Diss/SD | Contrib% | Cum.% |
| D. macrophthalmus | 2.7 | 10.44 | 3.52 | 14.21 | 12.19 | 12.19 |
| G. capensis | 9.15 | 2.73 | 2.93 | 5.54 | 10.15 | 22.34 |
| C. capensis | 1.98 | 7.7 | 2.6 | 6.76 | 9 | 31.34 |
| T. atun | 6.71 | 1.83 | 2.22 | 5.55 | 7.69 | 39.02 |
| R. species | 7.81 | 3.43 | 1.99 | 4.89 | 6.89 | 45.91 |
| Average Dissimilarity = 17.70 | ||||||
|---|---|---|---|---|---|---|
| Species | Cluster C | Cluster B | Av.Diss | Diss/SD | Contrib% | Cum.% |
| D. macrophthalmus | 5.26 | 10.44 | 2.49 | 2.56 | 14.06 | 14.06 |
| C. capensis | 4.51 | 7.7 | 1.55 | 2.8 | 8.73 | 22.79 |
| Z. faber | 4.34 | 7.23 | 1.39 | 3.24 | 7.86 | 30.65 |
| A. inodorus | 0.33 | 3.03 | 1.32 | 1.39 | 7.44 | 38.09 |
| G. capensis | 5.45 | 2.73 | 1.3 | 2 | 7.37 | 45.46 |
| Clusters | R Statistic | Significance Level % | Possible Permutations | Actual Permutations | Number >=Observed |
| a, b | 0.908 | 0.8 | 126 | 126 | 1 |
| a, c | 1 | 1.8 | 56 | 56 | 1 |
| b, c | 0.754 | 1.8 | 56 | 56 | 1 |
Disclaimer/Publisher’s Note: The statements, opinions and data contained in all publications are solely those of the individual author(s) and contributor(s) and not of MDPI and/or the editor(s). MDPI and/or the editor(s) disclaim responsibility for any injury to people or property resulting from any ideas, methods, instructions or products referred to in the content. |
© 2025 by the authors. Licensee MDPI, Basel, Switzerland. This article is an open access article distributed under the terms and conditions of the Creative Commons Attribution (CC BY) license (http://creativecommons.org/licenses/by/4.0/).


