Submitted:
11 February 2025
Posted:
13 February 2025
You are already at the latest version
Abstract
The ability to respond swiftly and accurately to visual stimuli is critical for safe driving. Traditional Psychomotor Vigilance Test (PVT) primarily assess response time (RT) using finger inputs, but these do not directly evaluate foot responses essential for vehicle control. This study introduces a novel Foot Psychomotor Vigilance Test (Foot PVT) designed to measure RTs of the foot in response to simulated traffic lights. The Foot PVT integrates a traffic light display interface with a three-pedal system, simulating basic driving condi-tions. RTs are recorded for three colors (blue, yellow, red) displayed in a randomized order, and response accuracy is evaluated based on pedal input. The system also measures cor-rection times for errors, offering insights into a driver's ability to recover from mistakes. In-itial validation with six participants (25±3 years old) demonstrated consistent and com-parable RTs with existing studies. By addressing the gap between visual stimuli and foot responses, the Foot PVT provides a unique tool for assessing psychomotor performance in the context of driving. This application holds potential for screening driver capabilities, particularly among elderly individuals and novice drivers, and for contributing to the development of more comprehensive traffic safety systems.
Keywords:
Foot PVT
; response time
; traffic lights
; human machine interface
1. Introduction
The Psychomotor Vigilance Test (PVT) was developed by David F. Dinges in 1985 and involves measuring the response time(RT) of the fingers by clicking a mouse at the moment when the elapsed time is suddenly displayed on the screen [1]. It is known that performance on the PVT declines when the subject is sleep-deprived, making it a common evaluation method to objectively observe drowsiness, attention, and alertness [2,3,4,5,6].
Human RT refers to the amount of time it takes for a response to begin after a stimulus—such as a visual, auditory, or tactile stimulus—is presented. It is an important indicator of how efficiently the human sensory system, neural transmission, brain processing, and motor system work together [7,8,9]. Particularly in activities that require quick reflexes, such as driving. In the context of vehicle operation, RT is essential for avoiding accidents, especially when responding to traffic lights, sudden obstacles, or changes in road conditions. Previous studies have demonstrated that slower RTs are associated with poor driving performance and are influenced by factors such as fatigue, distraction, and age-related declines in cognitive and motor function[10,11,12,13].
In recent years, Japan has emphasized the increasing importance of monitoring and improving drivers' RTs. The rising number of traffic accidents caused by pedal misapplication, particularly among young drivers (under 24 years old) and older drivers (over 65 years old), has become a significant concern [14]. In response, car manufacturers have integrated advanced driver assistance systems (ADAS), such as automatic emergency braking and acceleration suppression mechanisms [14,15,16,17]. However, while these technologies improve vehicle safety, they do not address the fundamental issue of individual reaction ability. Therefore, there is an urgent need for tools that enable drivers to objectively evaluate their own RTs and identify potential deficiencies.
To address this gap, we propose a new application: the Foot Psychomotor Vigilance Test (Foot PVT). This application allows drivers to easily examine their foot RTs by measuring their responses to visual traffic light. The Foot PVT is a human machine interface that integrates signal display, vision, foot response, and a foot pedal system. It provides a comprehensive assessment of psychomotor responses essential for safe driving. Unlike traditional hand-based PVT systems, this application focuses on the foot, which plays a pivotal role in vehicle control.
By addressing both the technical and psychological aspects of RT, this work aims to contribute to road safety by improving driver assessment tools. The design and testing of the Foot PVT application, including its interface, operation logic, algorithms, and initial validation results, are described in the next section.
2. Design
2.1. Traffic Light Display Interface
This application was developed using Microsoft Visual Studio Community 2015 (Microsoft Corporation, USA) and features a simple user interface with the following components:
- (i)
- Input Fields: The home screen allows users to enter a file name for saving data and specify the desired test duration.
- (ii)
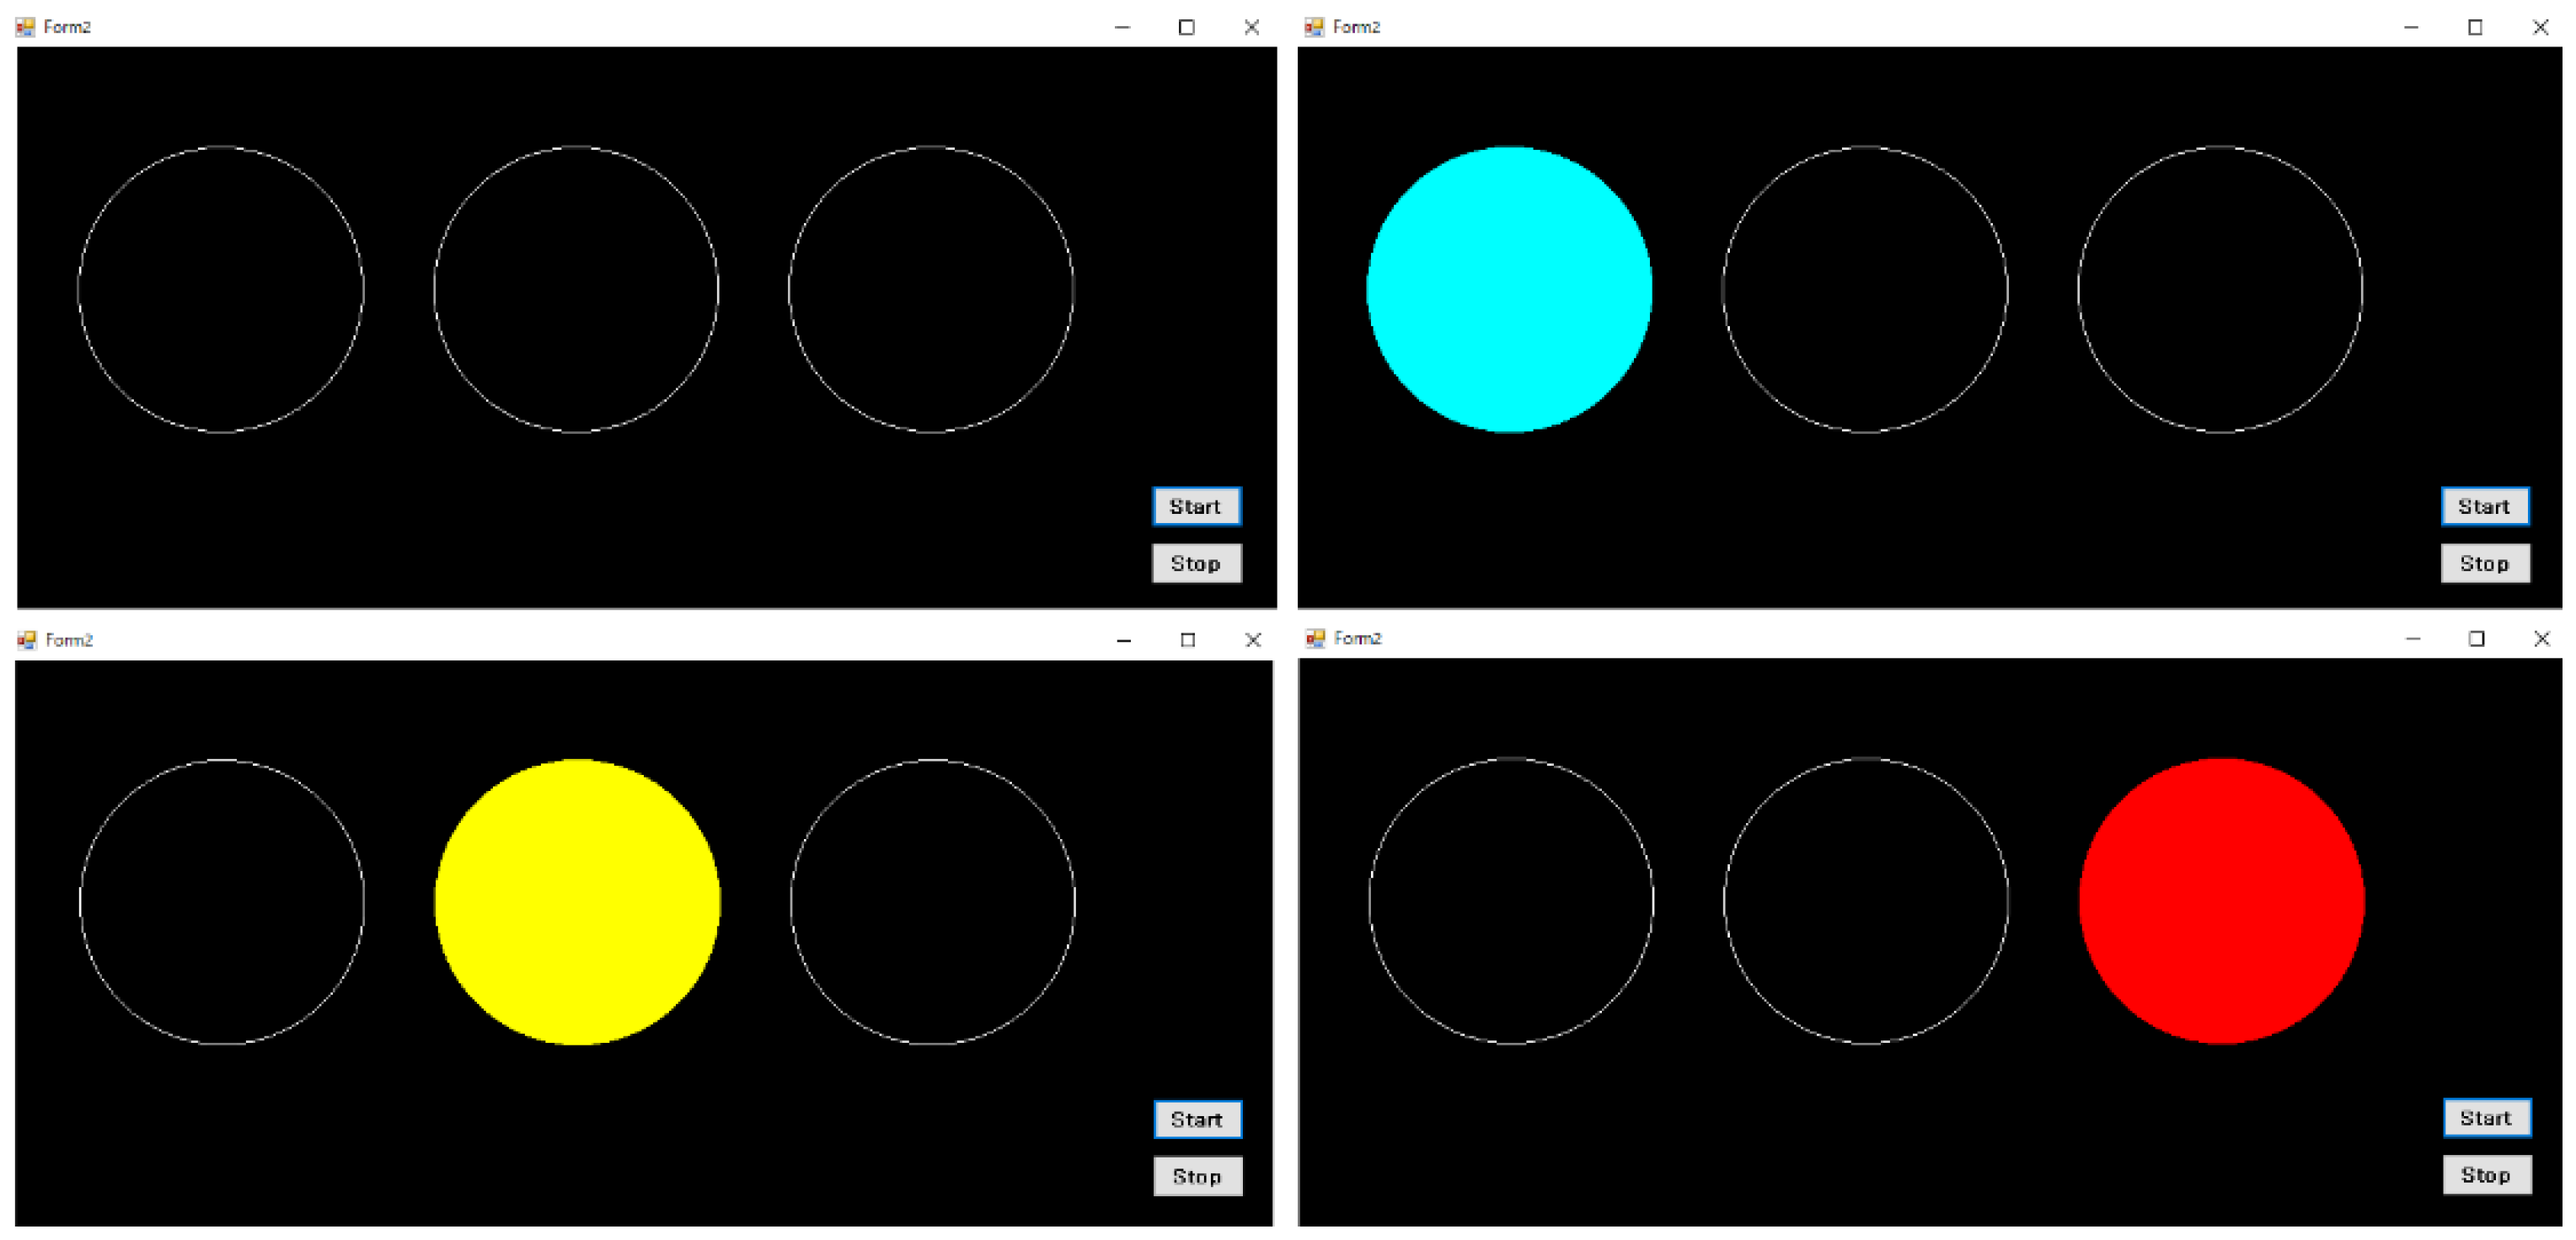
- Traffic Light Display: The colors are arranged from left to right in the same order as Japanese traffic lights: blue, yellow, and red. Before the test begins, the background color is black, and three white circles are aligned in the center of the screen. Once the test starts, a color is randomly displayed in one of the circles. Although traffic lights typically change in the order of blue, yellow, and red, the order is randomized to create mental strain for the user. The interval before the colors appear is set between 2 and 10 seconds.
Figure 1.
Home Screen.
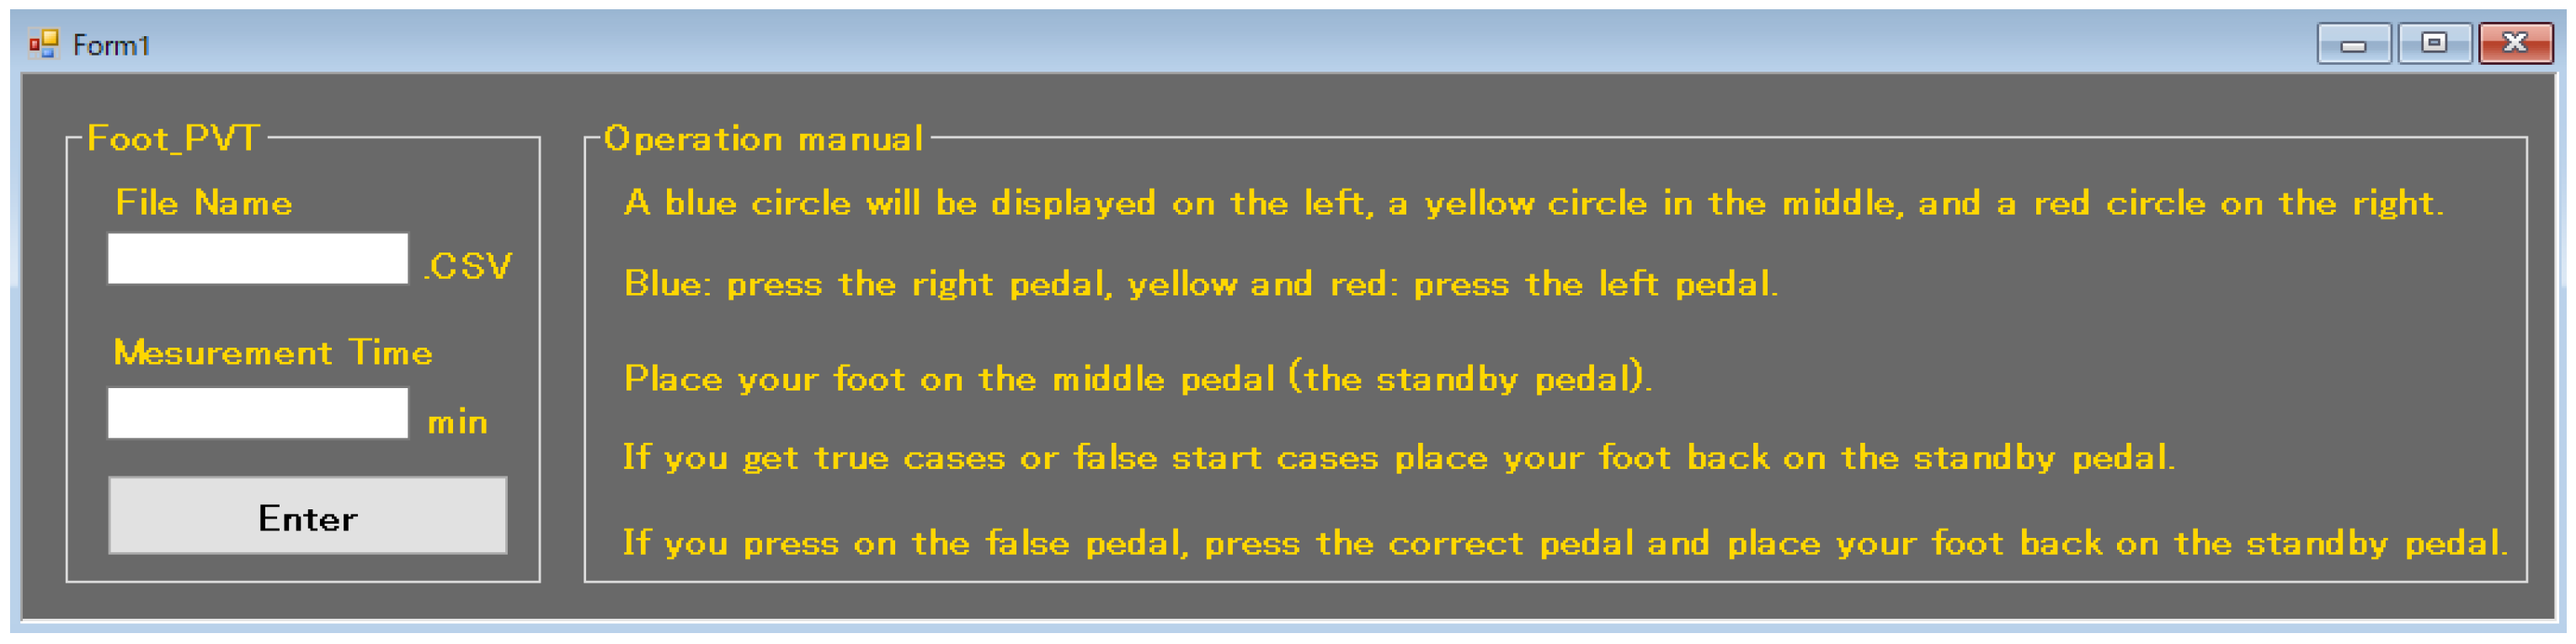
Figure 2.
Test Screen.
2.2. Foot Pedal System
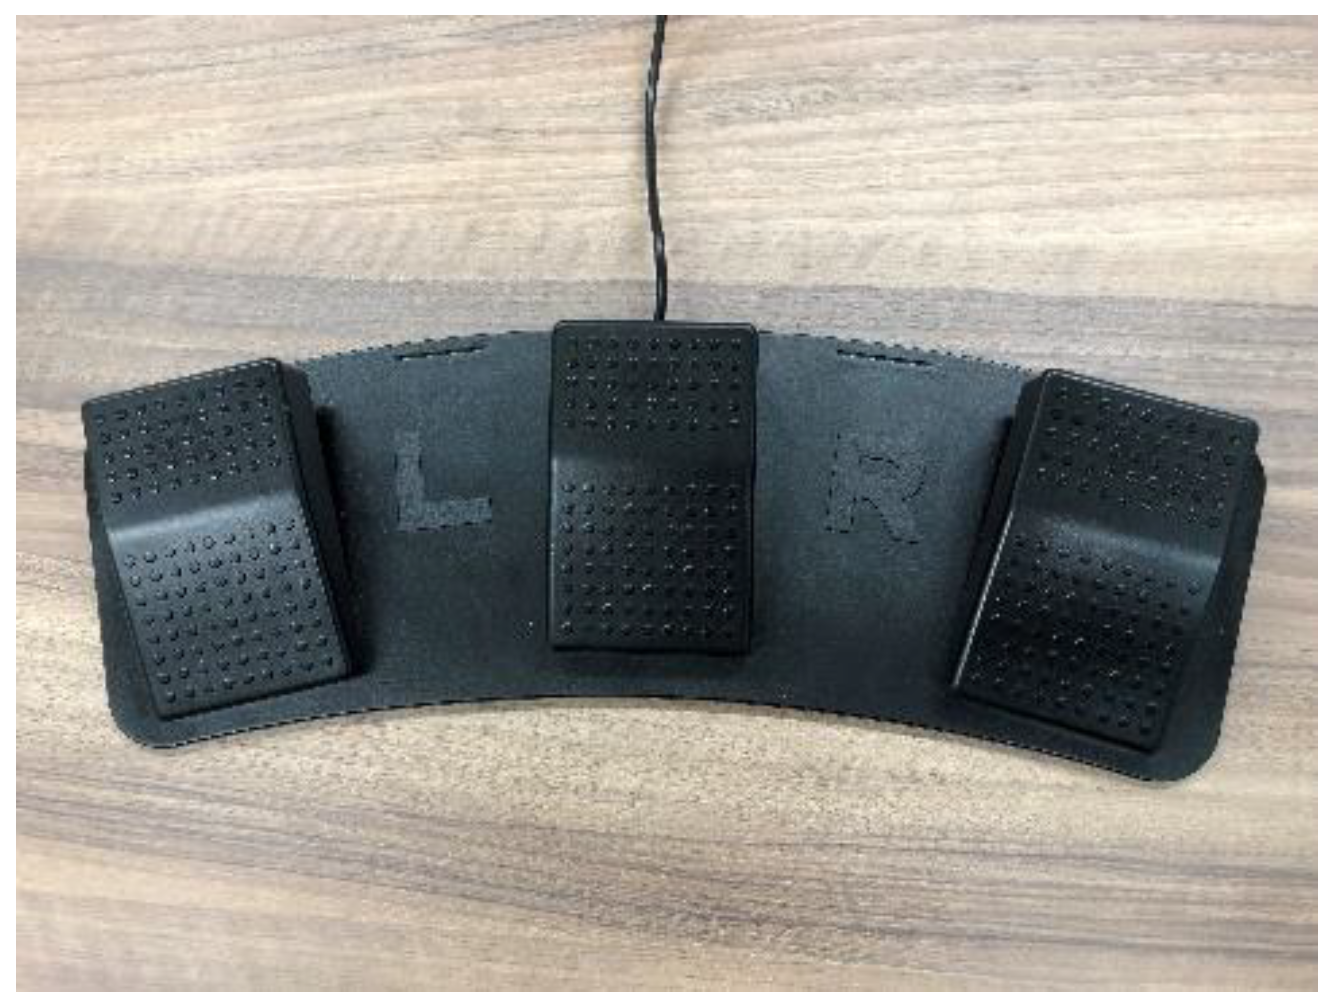
Automobile pedals can be classified into two types: a two-pedal system (accelerator and brake) and a three-pedal system (including a clutch). For this study, we adopted a three-pedal foot switch (USB Foot Switch, S23-P, Shenzhen Winsun Technology Co., Ltd., China). However, to improve the operability of the Foot PVT, we did not fully replicate the three-pedal configuration of an automobile. Instead, the center pedal is used as a standby pedal when no color is displayed. The right pedal corresponds to blue, while the left pedal corresponds to both red and yellow. The standby pedal does not correspond to any key on the keyboard.
Figure 3.
Foot switch of 3-pedal type. Size: 365 mm (W) × 143mm (D) × 41 mm (H), Weight:382g, Switch:Photoelectric switch, Interface:USB, Cable length:2m, Rating:5V/60mA, Service life:>2 million times.
Figure 3.
Foot switch of 3-pedal type. Size: 365 mm (W) × 143mm (D) × 41 mm (H), Weight:382g, Switch:Photoelectric switch, Interface:USB, Cable length:2m, Rating:5V/60mA, Service life:>2 million times.
2.3. Strict Application Validation Rules
Before starting, press the center pedal and wait. When blue appears, press the right pedal. When red or yellow appears, press the left pedal. If the color and pedal are correct, the screen will turn black, and you will press the center pedal again and wait. If you press the wrong pedal, the screen will not change until you press the correct one. In the case of a false start, the screen will display "false start," turn black again, and you will need to press the center pedal and wait for the next display. The time from when the color appears to when you press the pedal is recorded.
3. Build Instructions
3.1. Application Algorithm
Figure 4 shows the application flowchart. First, the CSV file name for saving data and the test time are entered, and Timer1 runs until the end of the test. The time until the color is displayed (interval) is determined by a uniform random number. The range of the uniform random number is set between 2000 and 10000 ms. Additionally, blue: 0, yellow: 1, and red: 2 are predefined, and the display color is determined by the remainder when the interval value is divided by 3. Once these values are set, Timer2 starts and stops during the interval (no color is displayed). Afterward, Stopwatch (SW) starts the moment one of the blue, yellow, or red circles appears on the screen and begins measuring the RT. SW stops when the user presses the pedal or makes a false start. After recording the event results in a CSV file, the event is classified based on the user's reaction (true, false, or false start). For true cases and false start cases, the interval setting loops back. If the pedal pressed is incorrect, the color remains dis-played, and SW restarts, preventing the user from progressing to the next phase until the correct pedal is pressed. Timer3 is used to show and clear "True", "False" and "False Start" on the display. Timer1 monitors the elapsed time and ends the test once the set time is reached.
3.3. Output Data
The application is configured to export data in CSV format. The CSV file records the event number, the color displayed, the evaluation, the interval, the RT, and the elapsed time for each pedal press. From this information, the correction time from the false pedal press to the true pedal press can also be calculated.
To confirm the operation of this algorithm, a PC with the following specifications was used:
Operating System: Windows 10
Processor: Intel(R) Core(TM) i3-4100M CPU @ 2.50GHz
RAM: 12.0 GB
System Type: 64-bit operating system
Display: 22.4-inch
Table 1 shows an example of the output file. The event number for a false pedal press is displayed as "_Retry". In the Evaluation column, "T" represents True, and "F" represents False. In this example, the third pedal press is a false start, and the RT is -915 ms. This indicates that the pedal press occurred 915 ms earlier than the interval value. Additionally, when the red light was displayed on the sixth attempt, the false pedal was pressed. The user corrected the mistake by pressing the true pedal. The correction time in this case is recorded as 2125 ms in the RT column of 6_Retry. A one-minute video of the demonstration and the corresponding results are provided in the Supplementary Materials. The results differ from those in Table 1.
Figure 4.
Flowchart of Foot PVT application.

3.4. Processing Time
Table 2 shows the time taken, excluding the interval and RT, for each event calculated from Table 1. The time taken for one event is determined as the difference in elapsed time for each event. ΔT is the difference between the time taken for one event and (interval + response), indicating the processing time excluding the interval and RT. For the third false start, the result is written to the CSV file the moment the pedal is pressed, so ΔT is 0. For the sixth retry, feedback processing occurs after Timer3 begins to run; however, because this time is very short, ΔT is also 0. For all other events, feedback processing is performed to transition to the next event after pressing the true pedal. The processing time for these events ranges from approximately 11 to 37 ms.
3.5. Software Specifications
The software source code can be downloaded from the Supplementary Materials.
(a) Foot mouse pedal settings. The right pedal corresponds to the right click and left click of the mouse. The center pedal does not correspond to anything.
(b) Install Microsoft Visual Studio Community 2022.
(c) Put the solution file(Foot_PVT.lsn) and project folder(Foot_PVT) in the same folder and open the solution file with Visual Studio Community 2022.
(d) Form1.vb in the solution screen is the home screen, Form2.vb is the test screen, and Module1.vb is a global variable.
(d) Press the start button on the toolbar to start the build and display the FOOT_PVT home screen. At the same time, "bin" and "obj" folders are generated in the project folder.
(e) Enter the output file name and test time on the home screen and press the Enter button.
(f) The test screen is displayed, and pressing the Start button at the bottom right of the screen will start the test.
(g) When the test is finished, an output file is generated in the debug folder in the bin folder. The output file name will be filled in with the time when the Enter button is pressed on the home screen.
4. Validation
Six participants (25 ± 3 years old, 3 females) were asked to use the Foot PVT app to verify their RTs. First, participants performed a 3 minutes pre-test to familiarize themselves with the operation, and then performed a 10 minutes measurement. Participants operated the pedals with their right feet after removing their shoes. The distance between the PC monitor and the participants was 1.5 m. Table 3 shows the interval, RT, ΔT, correction time, number of false presses, and number of false starts for all participants. Interval, RT, and ΔT values are show as mean ± standard deviation. Among the six participants, Participant 1 had the fastest RT. Participant 1 had two false starts, and Participant 3 had one. Participant 1’s first correction time was 1534 ms, the second correction time was 735 ms, and Participant 3’s correction time was 1722 ms. The number of false starts ranged from 0 to 5. The mean of interval was stable for all participants, ranging from 5700 to 6000 ms, with a standard deviation of 2000 to 2300 ms. ΔT was also stable at around 20 to 30 ms, with no significant delay. Table 4 shows the ratio of colors displayed for each participant. Approximately 90 colors were displayed in 10 minutes, and a chi-square test was performed using the data from the six participants to confirm whether there were differences in the ratio of colors displayed. The results showed no significant difference (P = 0.847), confirming that there was no bias in the number of times the colors were displayed.
Hiroki Akiyama et al. (2017) used two multicolored stimulus presenters and a small sensor mat to investigate the selective RT of 16 young people to six colors of light [18]. The RTs to the left and right directions were in the range of 615.9 ± 163.9 ms. Droździel et al. (2020) used Lightworks to measure RTs of 15 active drivers of different ages and genders while driving [10]. When the driver kept his foot on the accelerator pedal while the traffic light was on, and then pressed the accelerator pedal and the brake pedal, the average RT was recorded as 0.680 ± 0.145 ms. Maximilian et al. (2024) measured RTs using a driving simulator in 32 participants (29.3 ± 4.91 years old, 16 females) and found that the mean braking RT was 690 ± 280 ms [19]. The authors’ results showed a certain degree of individual variation in the RT of the subjects. However, the average RT of the six participants was 743 ± 68 ms, which is roughly consistent with the previous study, despite the different experimental protocol. It has been reported that RT measurements using a driving simulator can result in a learning effect [20]. Since this test also involves repeating the same operations many times in a short period of time, it is possible that a learning effect occurs and RTs become faster.
In Japan, the relationship between the colors of traffic lights and the position of car pedals is crossed, with the right pedal (accelerator) being pressed when the blue light appears on the left side of the traffic light, and the left pedal (brake) being pressed when the red light appears on the right side. When actually driving, the visual field and the traffic light are several tens to a hundred meters apart, so the relationship between the colors and the position of the pedals is not a problem. However, in this application, the distance between the traffic lights and the vision is close, which increases the mental load of associating the color with the pedal position, potentially leading to longer cognitive judgments. Therefore, when comparing multiple RTs using this application, it is important to maintain a constant distance between the vision and the display. This mental load can increase RTs in some cases.
Future studies should optimize the user-display distance to minimize such effects and ensure more consistent and comparable results across participants. Furthermore, the application’s ability to measure and record correction times (e.g., when a participant makes a mistake and corrects it) adds an additional layer of information not typically available from traditional RT tests. This feature is particularly useful for assessing a driver’s ability to recover from mistakes, which is a crucial aspect of safe driving. The application can be refined by considering additional metrics such as fatigue levels, which could further enhance its effectiveness in assessing real-world driving performance.
It is important to acknowledge that this test focuses on a specific aspect of driving ability— RT in response to traffic lights—while other critical factors such as decision-making, judgment under pressure, and situational awareness are not assessed. As such, this tool should be used in conjunction with other driving assessments to provide a more comprehensive evaluation of a driver's ability.
Overall, the Foot PVT application shows promise as an cheap, simple, and effective tool for screening driving ability. However, further studies involving larger and more diverse sample sizes are necessary to validate the reliability of the tool and explore its potential application in various driver screening programs.
5. Conclusions
In this study, we developed a new Foot PVT application as a driving ability evaluation tool. By combining random traffic light displays and pedal operation, this application can efficiently measure the reactivity of the foot, which is difficult to evaluate with conventional PVTs that use fingers. In addition, it is possible to record not only the RT of the pedal press, but also the false correction time, which is a feature that can evaluate the ability to recover from errors, an important aspect of driving safety.
Since the Foot PVT operates with a simple hardware configuration, it is expected to be used in a wide range of environments. It is considered to be particularly useful in evaluating the ability of elderly people who are easily affected by aging and fatigue, and novice drivers. In the future, we hope that the Foot PVT will be widely used as a tool to objectively evaluate driver ability and contribute to preventing traffic accidents and supporting safe driving.
Supplementary Materials
The following supporting information can be downloaded at the website of this paper posted on Preprints.org.
| Name | Type | Description |
| S1 | Video (.mp4) | Video demonstrating the software in use (1minute) |
| S2 | File(.csv) | Output result for S1 |
| S3 | Folder | Software source code(Solution files, Project files) |
Author Contributions
Conceptualization, Software, Data Curation,Validation,Writing – Original Draft Preparation,Y.Y; Validation, Investigation,Y.E.; Supervision, Project Administration; K.Y.
Funding
This research received no external funding.
Institutional Review Board Statement
The studies involving human subjects were reviewed and approved by School of Design & Architecture, Nagoya City University Institutional Review Board (No. 6 Geirin-No. 1, approved 23 April 2024).
Informed Consent Statement
Informed consent was obtained from all subjects involved in this study.
Data Availability Statement
Please contact corresponding author for further details.
Conflicts of Interest
The authors declare that they have no competing interests.
Abbreviations
The following abbreviations are used in this manuscript:
| PVT | Psychomotor Vigilance Test |
| RT | Response time |
| SW | Stopwatch |
References
- Dinges, D.F.; Powell, J.W. Microcomputer analysis of performance on a portable, simple visual RT task during sustained opera tions. Behav. Res. Methods Instrum. Comput. 1985, 17, 652–655. [Google Scholar] [CrossRef]
- Dinges, D.F.; Pack, F.; Williams, K.; Gillen, K.A.; Powell, J.W.; Ott, G.E.; Aptowicz, C.; Pack, A.I. Cumulative sleepiness, mood disturbance, and psychomotor vigilance performance decrements during a week of sleep restricted to 4–5 hours per night. Sleep. 1997, 20, 267–277. [Google Scholar] [PubMed]
- Al-Baraa, A.A.; Ahmad, S.N.I.; Maged, S.A.; Noreen, K. Implementation of a psychomotor vigilance test to investigate the effects of driving fatigue on oil and gas truck drivers’ performance. Front. Public Health 2023, 11, 1160317. [Google Scholar]
- Thitaporn, C.; Emily, K.S.; Connie, L.T.; Margaux, E.B.; John, D.H.; Thomas, J.B.; Tracy, J.D. Quantifying the effects of sleep loss: Relative effect sizes of the psychomotor vigilance test, multiple sleep latency test, and maintenance of wakefulness test. Sleep Adv. 2022, 3, zpac034. [Google Scholar]
- Yoshida, Y.; Kowata, K.; Abe, R.; Yuda, E. Evaluation of Fatigue in Older Drivers Using a Multimodal Medical Sensor and Driving Simulator. Electronics 2024, 13, 1126. [Google Scholar] [CrossRef]
- Yuda, E.; Otani, A.; Yamada, A.; Yoshida, Y. An Evaluation of the Autonomic Nervous Activity and Psychomotor Vigilance Level for Smells in the Work Booth. Electronics 2024, 13, 3576. [Google Scholar] [CrossRef]
- Luce, R.D. Response Times: Their Role in Inferring Elementary Mental Organization; Oxford Psychology Series (New York, 1991; online edn, Oxford Academic, 1 Jan. 2008). [CrossRef]
- Arthur, R. J. Clocking the Mind: Mental Chronometry and Individual Differences, 1st ed.; Elsevier: Amsterdam, 2006. [Google Scholar]
- Miller, J. O.; Ulrich, R. Mental chronometry and individual differences: Modeling reliabilities and correlations of reaction time means and effect sizes. Psychonomic Bulletin & Review 2013, 20, 819–858. [Google Scholar] [CrossRef]
- Droździel, P.; Tarkowski, S.; Rybicka, I.; Wrona, R. Drivers ’reaction time research in the conditions in the real traffic. Open Engineering 2020, 10, 35–47. [Google Scholar] [CrossRef]
- Poliak, M.; Svabova, L.; Benus, J.; Demirci, E. Driver Response Time and Age Impact on the Reaction Time of Drivers: A Driving Simulator Study among Professional-Truck Drivers. Mathematics 2022, 10, 1489. [Google Scholar] [CrossRef]
- Tawfeek, M.H. Inter- and Intra-Driver Reaction Time Heterogeneity in Car-Following Situations. Sustainability 2024, 16, 6182. [Google Scholar] [CrossRef]
- Pouliou, A.; Kehagia, F.; Poulios, G.; Pitsiava-Latinopoulou, M.; Bekiaris, E. Drivers' Reaction Time and Mental Workload: A Driving Simulation Study. Transport and Telecommunication Journal 2023, 24, 397–408. [Google Scholar] [CrossRef]
- Institute for Traffic Accident Research and Data Analysis. Pedal Misapplication Accident Driver Age Distribution. 2022. Available online: https://www.itarda.or.jp/contents/9350/info139.pdf (accessed on 25 January 2025).
- Neumann, T. Analysis of Advanced Driver-Assistance Systems for Safe and Comfortable Driving of Motor Vehicles. Sensors 2024, 24, 6223. [Google Scholar] [CrossRef] [PubMed]
- More, S.; Mulla, A.C.; Argade, S.G.; Raskar, M.; Sakhare, P.; Jadhav, S.P. Advanced Driver Assistance Systems (ADAS) Feature in Modern Autonomous Vehicle. In Proceedings of the 2024 3rd International Conference for Innovation in Technology (INOCON), Bangalore, India; 1–5. [Google Scholar] [CrossRef]
- Ministry of Land, Infrastructure, Transport and Tourism(MLIT). Report on the Results of the 194th Session of the World Forum for Harmonization of Vehicle Regulations (WP.29) of the United Nations. Available online: https://www.mlit.go.jp/report/press/jidosha10_hh_000315.html (accessed on 29 January 2025).
- Akiyama,H. ; Asakura,T.;Usuda,S. An Analysis of Simple and Choice Reaction Times during Stepping Movements. Rigakuryoho Kagaku 2017, 32, 783–786. [Google Scholar] [CrossRef]
- Bauder, M.; Paula, D.; Pfeilschifter, C.; Petermeier, F.; Kubjatko, T.; Riener, A.; Schweiger, H.-G. Influences of Vehicle Communication on Human Driving Reactions: A Simulator Study on Reaction Times and Behavior for Forensic Accident Analysis. Sensors 2024, 24, 4481. [Google Scholar] [CrossRef] [PubMed]
- Bundesanstalt für Straßenwesen. Verhaltensbezogene Kennwerte zeitkritischer Fahrmanöver: Bericht zum Forschungsprojekt FE 82.0536/2011; Berichte der Bundesanstalt für Straßenwesen Fahrzeugtechnik: Bremen, Germany, 2015; Volume 100. [Google Scholar]

Table 1.
An example of an output file.
| Event No. | Color | Evaluation | Interval [ms] | RT [ms] | Elapsed Time [ms] |
|---|---|---|---|---|---|
| 1 | Yellow | T | 9598 | 691 | 10300 |
| 2 | Red | T | 9755 | 855 | 20930 |
| 3 | False start | F | 3880 | -915 | 23895 |
| 4 | Yellow | T | 6058 | 820 | 30807 |
| 5 | Blue | T | 3210 | 783 | 34837 |
| 6 | Red | F | 7601 | 1086 | 43551 |
| 6_Retry | Red | T | 0 | 2125 | 45676 |
| 7 | Yellow | T | 3319 | 1004 | 50015 |
Table 2.
The time taken other than interval and RT for each event.
| Event No. | Interval+ RT (ms) | Time Taken for One Event (ms) | ΔT (ms) |
|---|---|---|---|
| 1 | 10289 | 10300 | 11 |
| 2 | 10610 | 10630 | 20 |
| 3 | 2965 | 2965 | 0 |
| 4 | 6878 | 6912 | 34 |
| 5 | 3993 | 4030 | 37 |
| 6 | 8687 | 8714 | 27 |
| 6_Retry | 2125 | 2125 | 0 |
| 7 | 4323 | 4339 | 16 |
Table 3.
Participants' Foot PVT App performance.
| Participants | Interval [ms] | RT [ms] | ΔT [ms] | Correction Time [ms] | Number of False | Number of False Start |
|---|---|---|---|---|---|---|
| 1 | 5719±2048 | 607±104 | 31±7 | 1534, 735 | 2 | 2 |
| 2 | 5917±2264 | 712±105 | 27±8 | 0 | 0 | 0 |
| 3 | 5846±2262 | 788±136 | 29±7 | 1722 | 1 | 2 |
| 4 | 6015±2318 | 779±178 | 30±7 | 0 | 0 | 1 |
| 5 | 5943±2324 | 817±107 | 30±6 | 0 | 0 | 0 |
| 6 | 5958±2343 | 758±137 | 22±10 | 0 | 0 | 4 |
Table 4.
The ratio of colors displayed for each participant.
| Participants | Color | Participants by Ratio | ||
|---|---|---|---|---|
| Blue | Yellow | Red | ||
| 1 | 27 | 32 | 36 | 95 (17.5%) |
| 2 | 33 | 23 | 33 | 89 (16.4%) |
| 3 | 35 | 30 | 28 | 93 (17.2%) |
| 4 | 27 | 33 | 27 | 87 (16.1%) |
| 5 | 30 | 27 | 31 | 88 (16.2%) |
| 6 | 28 | 28 | 34 | 90 (16.6%) |
| Color by ratio | 180 (33.2%) | 173 (31.9%) | 189 (34.9%) | 542 |
Disclaimer/Publisher’s Note: The statements, opinions and data contained in all publications are solely those of the individual author(s) and contributor(s) and not of MDPI and/or the editor(s). MDPI and/or the editor(s) disclaim responsibility for any injury to people or property resulting from any ideas, methods, instructions or products referred to in the content. |
© 2025 by the authors. Licensee MDPI, Basel, Switzerland. This article is an open access article distributed under the terms and conditions of the Creative Commons Attribution (CC BY) license (http://creativecommons.org/licenses/by/4.0/).
Copyright: This open access article is published under a Creative Commons CC BY 4.0 license, which permit the free download, distribution, and reuse, provided that the author and preprint are cited in any reuse.


