Submitted:
11 February 2025
Posted:
11 February 2025
You are already at the latest version
Abstract
Fractal signals are defined as observation over time points or spatial coordinates with self-similar patterns. However, when a signal is present as quantified observations on nodes of a graph, its fractality needs to be understood comprehensively. Here we describe graph signal fractality which can be used to study the fractal behavior of signals on a network. It is a generalised representation which can also be used for regular multidimensional signals. We explain here different approaches for estimating fractality in graph signals, including a method based on wavelet transform. Graph signal fractality estimation could help in multiple applications like graph segmentation, classification and imputation and understanding the flow of information on a network.
Keywords:
graph signal
; signal fractals
; graph signal fractality
; graph wavelet
1. Introduction
Naturally occurring patterns often show fractality. In layman's approach, a fractal is described as a geometric shape containing a self-repeating structure at arbitrarily small scales. Often occurrence of similar patterns at increasingly smaller scales is termed self-similarity or fractality. In the real world, often patterns of structures and natural topology follow approximate self-similarity. Such as the structure of the branching of trees or river distributaries tends to have fractal patterns. In the field of genomics, the chromatin interaction and its folding have been reported to have a fractal pattern (Almassalha et al. 2017). Knowledge of fractals can be utilised in medical diagnoses for diseases like cancer. Since healthy human blood vessel cells have a fractal pattern of growth, the cancerous cells with abnormal fashion, can be detected based on this approach.
Fractal patterns have also been used in different computational approaches like machine learning, image compression and resolution improvement. Fractal interpolation has been used to improve the prediction of time series by increasing the fine-graininess of the predicted signal. Estimation of fractality as a feature has been used in signal pattern recognition (Shi 2018). In order to measure the magnitude of repetition or self-similarity the fractal dimension is used. In many cases, the dimension of fractality may be more or less than the Euclidean and topological dimension. Nevertheless, the estimate of the fractality dimension provides hint patterns of the internal repetitions which can help in many ways.
The concept of fractality has also been exploited for feature selection to avoid over-fitting (Alsaeedi et al. 2024) for the prediction of biological signals. For Image compression fractals allow us to represent seemingly random patterns with little data (Fisher, n.d.). It has been used for improving image resolution and even 3D model creation using fractal image coding (FIC).
Even though the fractal nature of graph structure is well studied, for graph-signals there is still a need for elaboration of calculation and application of fractality. There are multiple examples of graph signals such as the traffic-load on the airports connected by the air-routes, traffic load at railway junctions or cities connected by roads, sentiment and quantified opinion on social networks. There are many examples of multi-dimensional graph signals such as survey data of individuals connected through friendship networks or quantified physical properties of the amino-acids in residue interaction networks of proteins. Understanding the fractality of such signals could lead towards novel insights. Here we elaborate and explain methods to calculate fractality in graph signals and provide some examples.
2. Understanding Fractal Structures and Fractal Signals
There is a high similarity between the terms fractal structures and fractal signals. It is often the context in which it is mentioned such as, the branches of a tree or fractal graphs can be described as fractal structures. However, their image in 2D or 3D dimension can also be called a fractal signal or image. The pattern of the fractality in the velocity and movement can be described as a fractal signal. While fractal geometry can be used to describe both structures and signals, some patterns are more convincing when they are described as signals. Such as the velocity in hydrodynamic turbulent flow (Scotti, Meneveau, and Saddoughi 1995) which can be better described as a one-dimensional signal. In the field of graph-theory the topic of fractal structure of graphs and networks has been studied previously described thoroughly ((Skums and Bunimovich 2020).
The chromatin interaction pattern can be said to form fractal shapes. However, it is not necessary that activation of different loops and domains in chromatin follow a fractal pattern. In other words it can be described that graph of chromatin interaction and network representing the hierarchy of topologically associated domain (TAD) have a fractal-pattern however the signal of their activity does not necessarily have self-similarity. There are many such examples where the underlying graph may have fractal structure whereas the signal on it might not have fractality. Such as, a tree could have a fractal branching pattern which can be represented as a fractal graph, but the pattern of location of flowers on the branches may not have fractal geometry.
3. Fractal Signals on Graph
There is also another category of data-sets where the underlying graph may not have fractality but the signal on its nodes or edges could have a fractal pattern. Such as the topology of social-network may not have fractal geometry, however, the spread of a sentiment on social-network could have a fractal pattern (Figure 1A-B). Another example is traffic passing through junctions on the road network (Figure 1C). Often large cities tend to have more traffic load on roads which further gets divided to other connected cities in a partially fractal manner in spite of the non-fractal nature of the road network. Another example is the fractal nature of the excitation of neurons observed by fMRI during different activities like watching movies or dreaming. Though temporal fractality of activation of neurons has been described by a few researchers (Campbell, Vanderwal, and Weber 2022), the underlying factor is controlled by the connection between neurons. Thus at a single time-point the activity of neurons connected in a network could show graph-signal fractality. Thus during the flow of information on a graph, it is not necessary that it would follow the pattern of the graph. Certain nodes or parts of the graph may not allow flow for particular kinds of information. Such as, in a social network individuals of different faiths and religions are connected through friendship or acquaintance. However, when individuals forward the content of a faith or opinion, they forward it to like-minded friends. Even if an individual forwards a content to a friend with a different opinion, it is not forwarded further. The topology of sentiments, signal or information flow on graphs could be completely different from the underlying graph. The graph signal approach provides additional benefits of estimating and modeling fractality over non-regular and non-fractal graphs. Another such example of the fractal signal on a non-regular and non-fractal graph could be obtained by observing the presence of hydrophobicity on the amino-acids in the residue interaction network of protein structure (Banerji and Ghosh 2009).
3.1. Signal and Images as Special Cases of Graph Signal Fractal
In order to understand in a Layman approach, if we have an image of a fractal pattern, we can consider it as a signal on a regular graph. The regular graph representing an image consists of nodes (pixels) with 4 neighbors and the pixel color would be the signal on the regular graph (Figure 2). Linear time series data can also be represented as a signal on a graph; its fractality can also be modelled with a graph signal processing approach. Even a multi-dimensional signal can be interpreted as a regular graph where the number of neighbours of nodes is dependent on dimensions. For three dimensions, we can have a regular graph where every node is connected to 6 neighbouring nodes.
4. Methods to Estimate Fractality of Graph Signals
Here, we describe how the available methods for estimating fractality can be modified for graph-signal. For signals on regular graphs like 1D, 2D or 3D fractal signals, boxing-based approach can help to estimate fractality. Hausdorff dimension (Fernández-Martínez, García Guirao, and Sánchez-Granero 2019) is regularly used to describe the dimension of fractality, it is a successor to the box-counting or Minkowski-Bouligand approach to estimate self-similarity. In simple mathematical terms, it is defined for self-similarity with parameters N and s, described by a power law such as
N = sd
Where d= ln(N)/ln(S). The d dimensional Housdorff measure of the set is often defined as 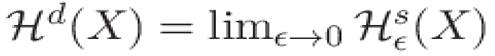 where
where 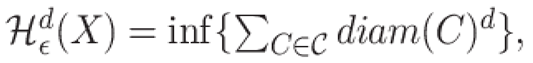 and the infimum is over all the (Skums and Bunimovich 2020). Here represent countable covers of . Another measure to describe self-similarity Lebesgue is linearly proportional to Housdorff measure for Borel sets. Where Borel sets are defined as sets that can be made from open and closed sets by repeatedly taking countable unions and intersections. For graph structures, Skums and Bunimovich (Skums and Bunimovich 2020) have described fractality using isomorphism and Housdorff and Lebesgue measures. However for graph signals the measure of fractality is described in a slightly different manner, although with a similar notion.
where and the infimum is over all the (Skums and Bunimovich 2020). Here represent countable covers of . Another measure to describe self-similarity Lebesgue is linearly proportional to Housdorff measure for Borel sets. Where Borel sets are defined as sets that can be made from open and closed sets by repeatedly taking countable unions and intersections. For graph structures, Skums and Bunimovich (Skums and Bunimovich 2020) have described fractality using isomorphism and Housdorff and Lebesgue measures. However for graph signals the measure of fractality is described in a slightly different manner, although with a similar notion. 4.1. Higuchi’s Method for Estimating Fractal Dimension
Higuchi’s method(Wanliss and Wanliss 2022) is particularly useful for irregular or self-similar signals over time. It is applied as follows:
I. Consider a signal represented as x(1), x(2), x(3) .... x(N), the time sequence of points for which FD has to be estimated, where N is the total number of sample points in the sequence. Construct k new time series as,
where m is the initial time value, k is the discrete time interval between points (delay) and ⌊a⌋ denotes the integer part of a .
{x(m), x(m+k), x(m+ 2k), . . . , x(m+⌊(N − m)/k⌋k)}, for m= 1,2,...,k
II. For each of the time series constructed, the average length is computed as:
where ⌊(N − m)/k⌋k is a normalization factor.
Thus the average of this length is obtained over all m to obtain L(k).
III. The fractal dimension is then given as,
4.2. Hop-Counting Method
The hop-counting method is an analogue of box-counting method (“An Effective Method to Compute the Box-Counting Dimension Based on the Mathematical Definition and Intervals” 2020) which is particularly effective for geometric structures such as an image or spatial data. It identifies the self-similarity at different scales for such data. This method overlays a grid of boxes over the pattern completely. The size of the boxes, say is varied from a bigger length to a smaller length. The count of the number of boxes that contain a part of the pattern, say N() is the recorder for each .
The fractal dimension is defined as,
In order to extend such fractality measures for graph signals, one can modify the coordinates to hops. Such a box is represented by a window containing a given number of hops. It can be understood easily when a graph is regular like an image. However, a similar pattern can be observed on a non-regular graph.
4.3. Wavelet-Based Multi-Fractal Analysis
Wavelets and fractal signals are closely related concepts in the field of signal processing and mathematical analysis, particularly in understanding and characterizing complex and self-similar signals (Akujuobi and Barniecki, n.d.). Wavelets are mathematical functions that are used to decompose signals into different scales or resolutions. Thus, it is quite helpful for the signals that demonstrate a varying fractal behavior over scales. When the fractal dimension is defined as the Hausdorff dimension of the singularity spectrum, it can be calculated with the partition function using the WTMM (Wavelet Transform Modulus Maxima) coefficients(Akujuobi and Barniecki, n.d.; Lin and Sharif 2007).
The WTMM method is focused on the modulus maxima of the wavelet coefficients. It helps to identify the local maxima of the modulus over scales that are important for recognizing the structure’s local and global irregularities. The wavelet transform of a real-valued function f is defined as:
where is the space parameter and s(> 0) is the scale parameter for analyzing wavelets. Instead of averaging over wave coefficients, only the local maxima of is used. For a given scale s the position of local maxima is determined such that . All such local maxima at a scale are found and sum of their qth power is taken, such that
Often scaling behavior of can be described with scaling exponents such that
Here shows the fractal property of the signal. For mono-fractal signal the exponents follow a straight line. If is not linearly related to then signal has different fractality at different locations or in other words, it is multi-fractal. One can apply the Legendre transform to to know the multifractal spectrum. Thus wavelets can capture multifractality with different long-range correlations due to small and large fluctuations. The shuffled series from this type of multifractals will exhibit randomness, hshuf(q) = 0.5, i. e. non-multifractal behavior.
4.3.1. Graph Wavelet and Graph Signal Fractality
Wavelet transform of signal on graph nodes can be performed to get an estimate of fractality (“Wavelets on Graphs via Spectral Graph Theory” 2011) (see supplementary material and Figure 3). To apply WTMM method one can find maxima at each level such that at a scale , where node could be any direct neighbor of node . Further, the qth power of maxima of graph-signal wavelet at a level would be added, such as
Here, again the scaling behavior of can be described as
where is a scaling exponent.
5. Discussion
Fractality for one, two or multi-dimensional signals has been studied previously and proven to be useful. Graph signal fractality described here generalises self-similarity patterns of all such signals including quantified information on nodes of a graph. The fractality estimation method for graph signals can also be applied to nearly all kinds of signals. Here we have explained the approach of extension two fractality estimation methods for graph signals. However, there are multiple other methods to estimate signal fractality such as Katz (“A Note on Fractal Dimensions of Biomedical Waveforms” 2009), Petrosian(Fu, Li, and Ye, n.d.) and Sevcik fractality(“On Fractal Dimension of Waveforms” 2006). One can also explore extensions of such methods for graph signals.
Fractality of graph-signal could prove to be useful for analysing a variety of data-sets. The concept of using fractality to increase resolution and fine-granularity can be easily used in the prediction of signals on graphs as well multi-dimensional. However, in addition to signals and multi-dimensional structures, many data-sets can not be directly mapped as graph signals. In such cases, one can infer a graph among data-points using the K-nearest neighbor approach. Previously a few studies have used such an approach to impute missing signals(Mishra, Srivastava, and Kumar 2020), however, the exploitation of fractality on KNN-based graphs between data-points needs more a comprehensive study.
Here, we have explained fractality estimation using a single signal on a graph. However, there could be more complex signals on graphs such as temporal or multidimensional signals on nodes. The temporal signals on graphs can be used to study the evolving fractality of graph-signal with time. However, the inclusion of multidimensional signal patterns at every node of the graph needs further generalisation in future.
References
- Akujuobi, C. M., and A. Z. Barniecki. n.d. “Wavelets and Fractals: Overview of Their Similarities Based on Different Application Areas.” Accessed February 11, 2025. https://ieeexplore.ieee.org/document/274203.
- Almassalha, L.M.; Tiwari, A.; Ruhoff, P.T.; Stypula-Cyrus, Y.; Cherkezyan, L.; Matsuda, H.; Cruz, M.A.D.; et al. The Global Relationship between Chromatin Physical Topology, Fractal Structure, and Gene Expression. Scientific Reports 2017, 7, 41061. [Google Scholar] [CrossRef] [PubMed]
- Alsaeedi, A.H.; Al-Mahmood, H.H.R.; Alnaseri, Z.F.; Aziz, M.R.; Al-Shammary, D.; Ibaida, A.; Ahmed, K. Fractal feature selection model for enhancing high-dimensional biological problems. BMC Bioinform. 2024, 25, 1–23. [Google Scholar] [CrossRef] [PubMed]
- An Effective Method to Compute the Box-Counting Dimension Based on the Mathematical Definition and Intervals. Results Eng. 2020, 6, 100106. [CrossRef]
- A Note on Fractal Dimensions of Biomedical Waveforms. Comput. Biol. Med. 2009, 39, 1006–12. [CrossRef] [PubMed]
- Banerji, A.; Ghosh, I. Revisiting the Myths of Protein Interior: Studying Proteins with Mass-Fractal Hydrophobicity-Fractal and Polarizability-Fractal Dimensions. PLOS ONE 2009, 4, e7361–e7361. [Google Scholar] [CrossRef]
- Campbell, O.; Vanderwal, T.; Weber, A.M. Fractal-Based Analysis of fMRI BOLD Signal During Naturalistic Viewing Conditions. Front. Physiol. 2022, 12, 809943. [Google Scholar] [CrossRef]
- Fernández-Martínez, M.; Guirao, J.L.G.; Sánchez-Granero, M.Á. Calculating Hausdorff Dimension in Higher Dimensional Spaces. Symmetry 2019, 11, 564. [Google Scholar] [CrossRef]
- Fisher, Yuval. n.d. Fractal Image Compression; Springer New York, 3 September 2024. [Google Scholar]
- Fu, Shuang, Yibing Li, and Fang Ye. n.d. “Blind Spectrum Sensing Based on Petrosian’s Algorithm in Frequency Domain.” Accessed January 29, 2025. https://ieeexplore.ieee.org/stamp/stamp.jsp?arnumber=6429083.
- Lin, D.C.; Sharif, A. Wavelet transform modulus maxima based fractal correlation analysis. Eur. Phys. J. B 2007, 60, 483–491. [Google Scholar] [CrossRef]
- Mishra, S.; Srivastava, D.; Kumar, V. Improving gene network inference with graph wavelets and making insights about ageing-associated regulatory changes in lungs. Briefings Bioinform. 2020, 22. [Google Scholar] [CrossRef]
- On Fractal Dimension of Waveforms. Chaos Solitons Fractals 2006, 28, 579–80. [CrossRef]
- Perraudin, Nathanaël, Johan Paratte, David Shuman, Lionel Martin, Vassilis Kalofolias, Pierre Vandergheynst, and David K. Hammond. 2014. “GSPBOX: A Toolbox for Signal Processing on Graphs.” http://arxiv.org/abs/1408.5781.
- Scotti, A.; Meneveau, C.; Saddoughi, S.G. Fractal dimension of velocity signals in high-Reynolds-number hydrodynamic turbulence. Phys. Rev. E 1995, 51, 5594–5608. [Google Scholar] [CrossRef] [PubMed]
- Shi, C.-T. Signal Pattern Recognition Based on Fractal Features and Machine Learning. Appl. Sci. 2018, 8, 1327. [Google Scholar] [CrossRef]
- Skums, P.; Bunimovich, L. Graph fractal dimension and the structure of fractal networks. J. Complex Networks 2020, 8, cnaa037. [Google Scholar] [CrossRef] [PubMed]
- Wanliss, J.A.; Wanliss, G.E. Efficient calculation of fractal properties via the Higuchi method. Nonlinear Dyn. 2022, 109, 2893–2904. [Google Scholar] [CrossRef] [PubMed]
- Wavelets on Graphs via Spectral Graph Theory. Appl. Comput. Harmon. Anal. 2011, 30, 129–50. [CrossRef]
Figure 1.
Examples of possible fractal signals on graph A) A simple graph where the flow of signal has been shown by dark color edges. The presence of signal at nodes has also been shown in red color. B) The pictorial representation of a larger network where signal at nodes and signal-flow is shown at edges with bright color. C) The road network map of the city is shown. Here nodes of road network are junctions. The traffic on each junction would be the signal intensity on nodes of the road network. The pattern of load on nodes is different from the structure of the underlying road network.
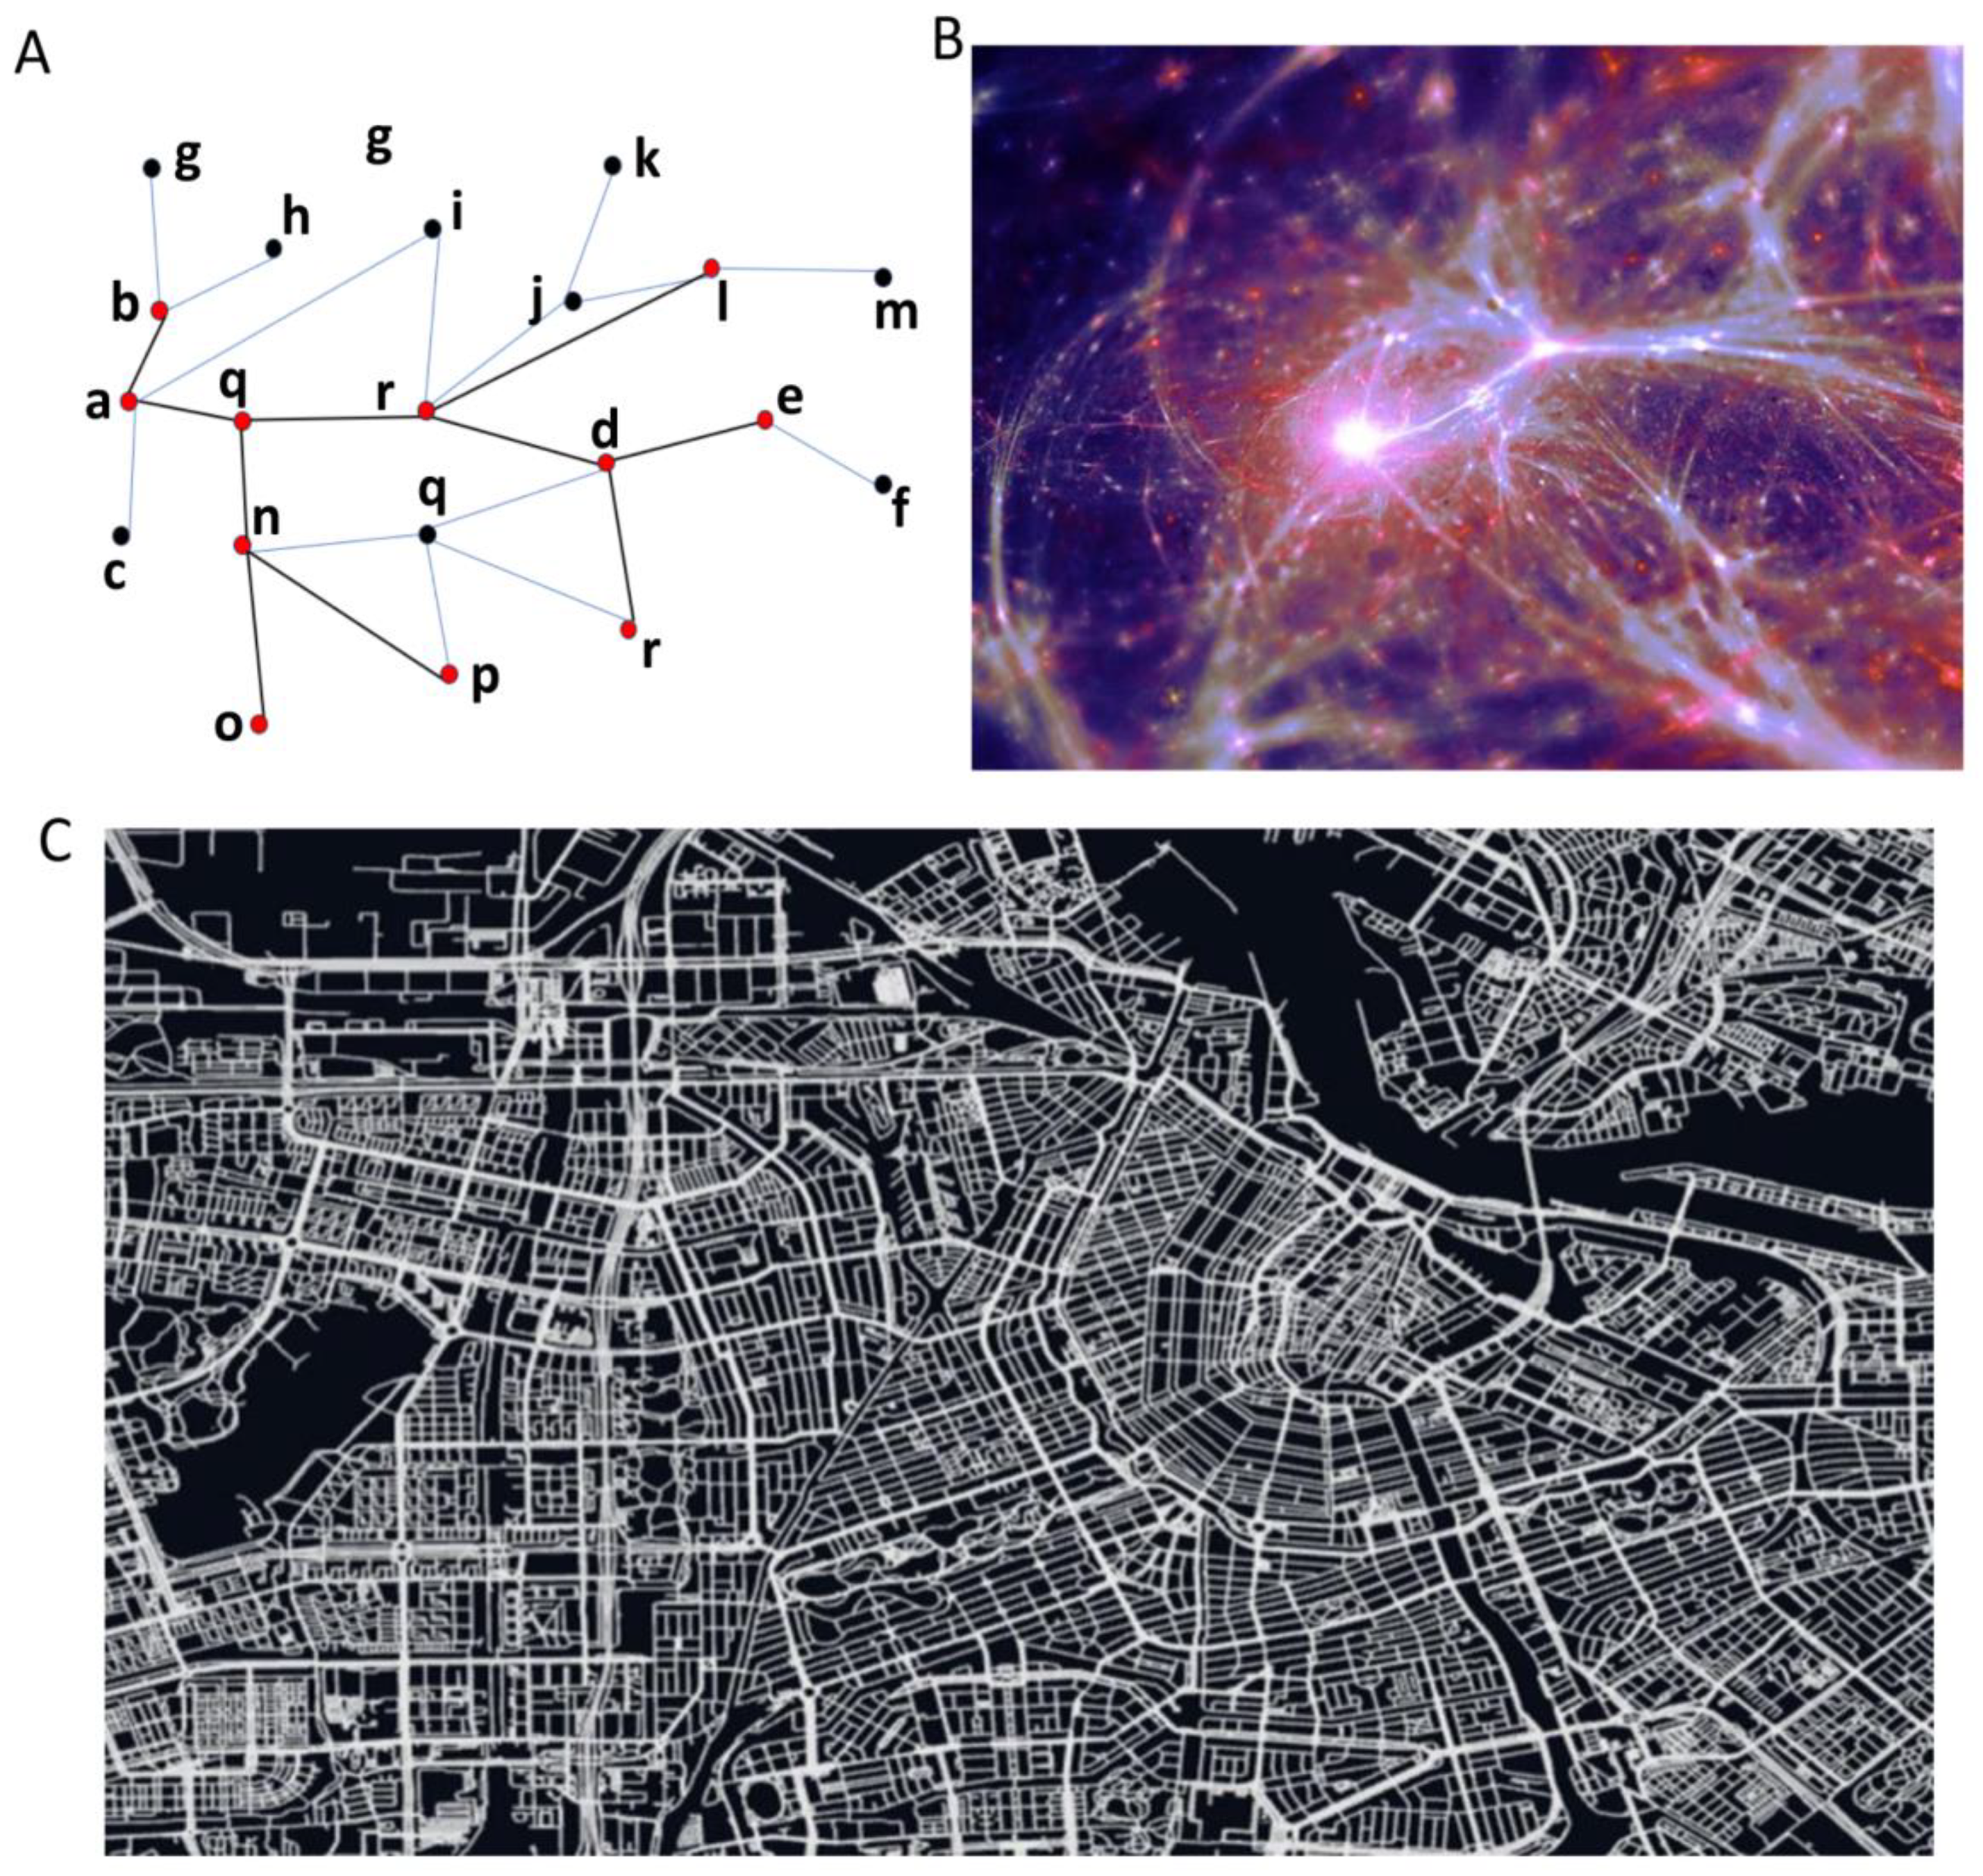
Figure 2.
Examples of fractal signals on regular graphs. A) The branching fractal signal on a regular graph, its visualisation using a circular style of plotting for the same graph. Similarly, randomised node-locations have also been used to plot the same graph-signal. B) The Sierpinski square signal on a regular graph is another example where the underlying graph has a different fractality than the signal on its nodes.
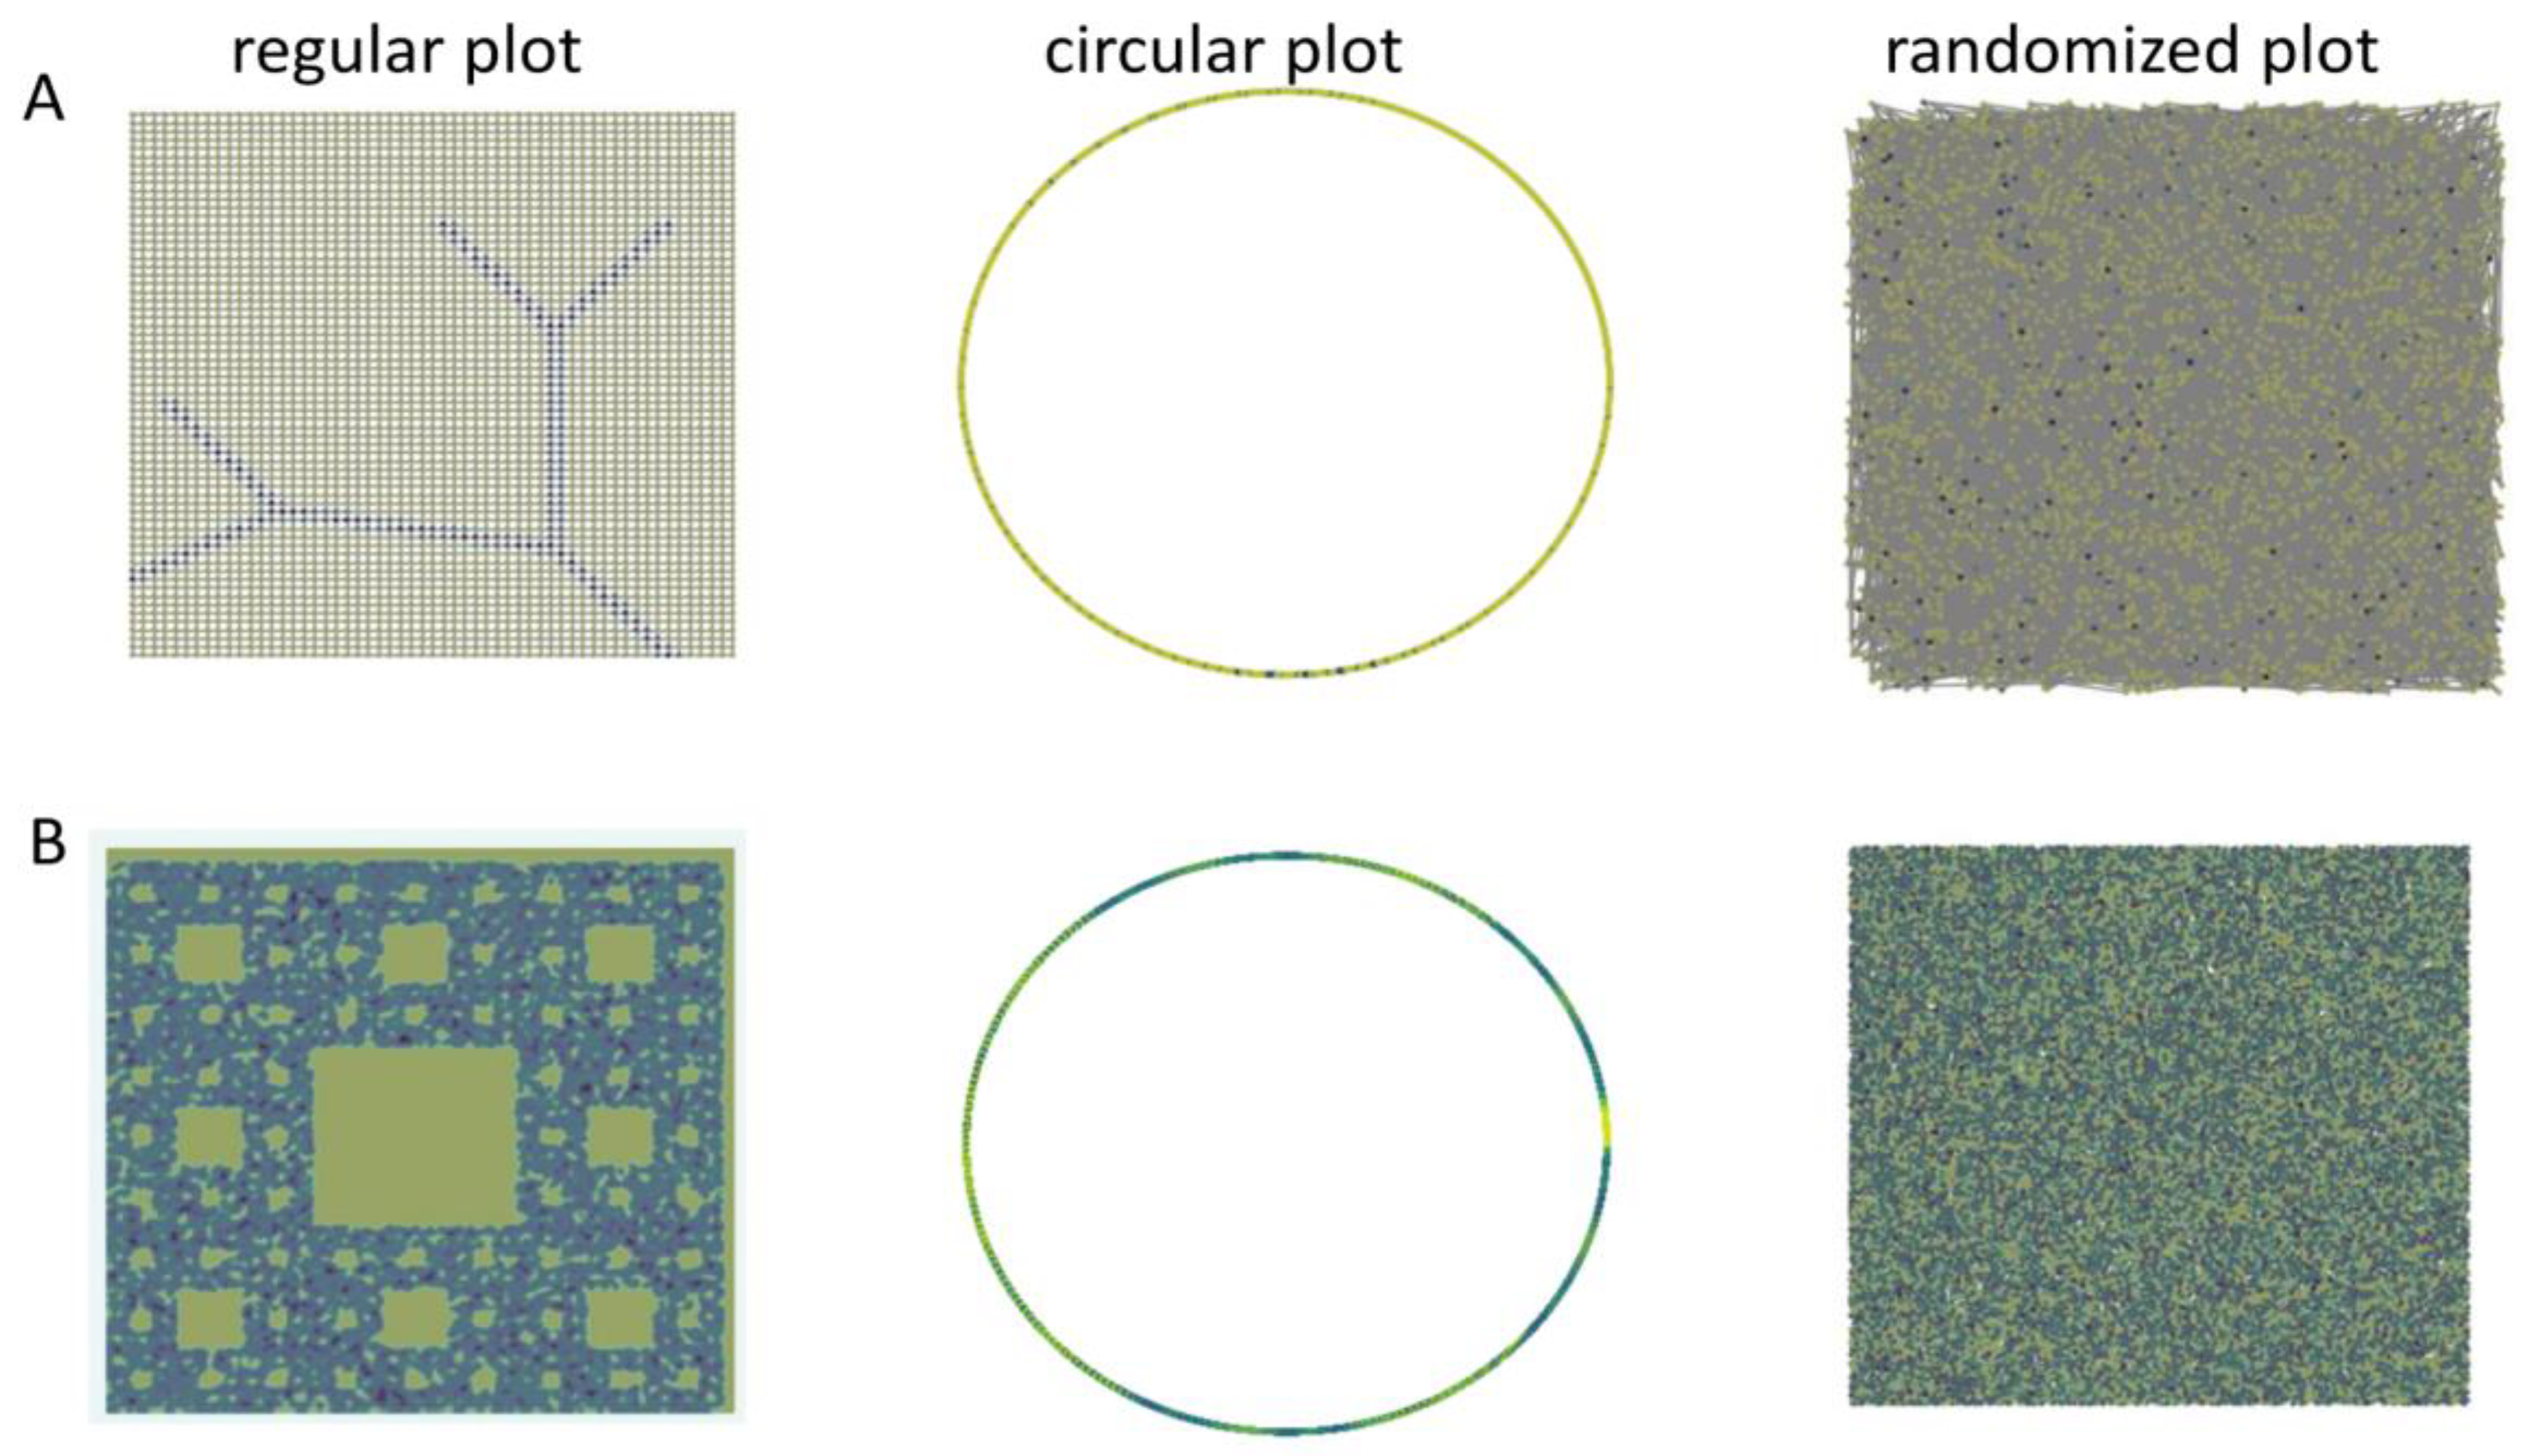
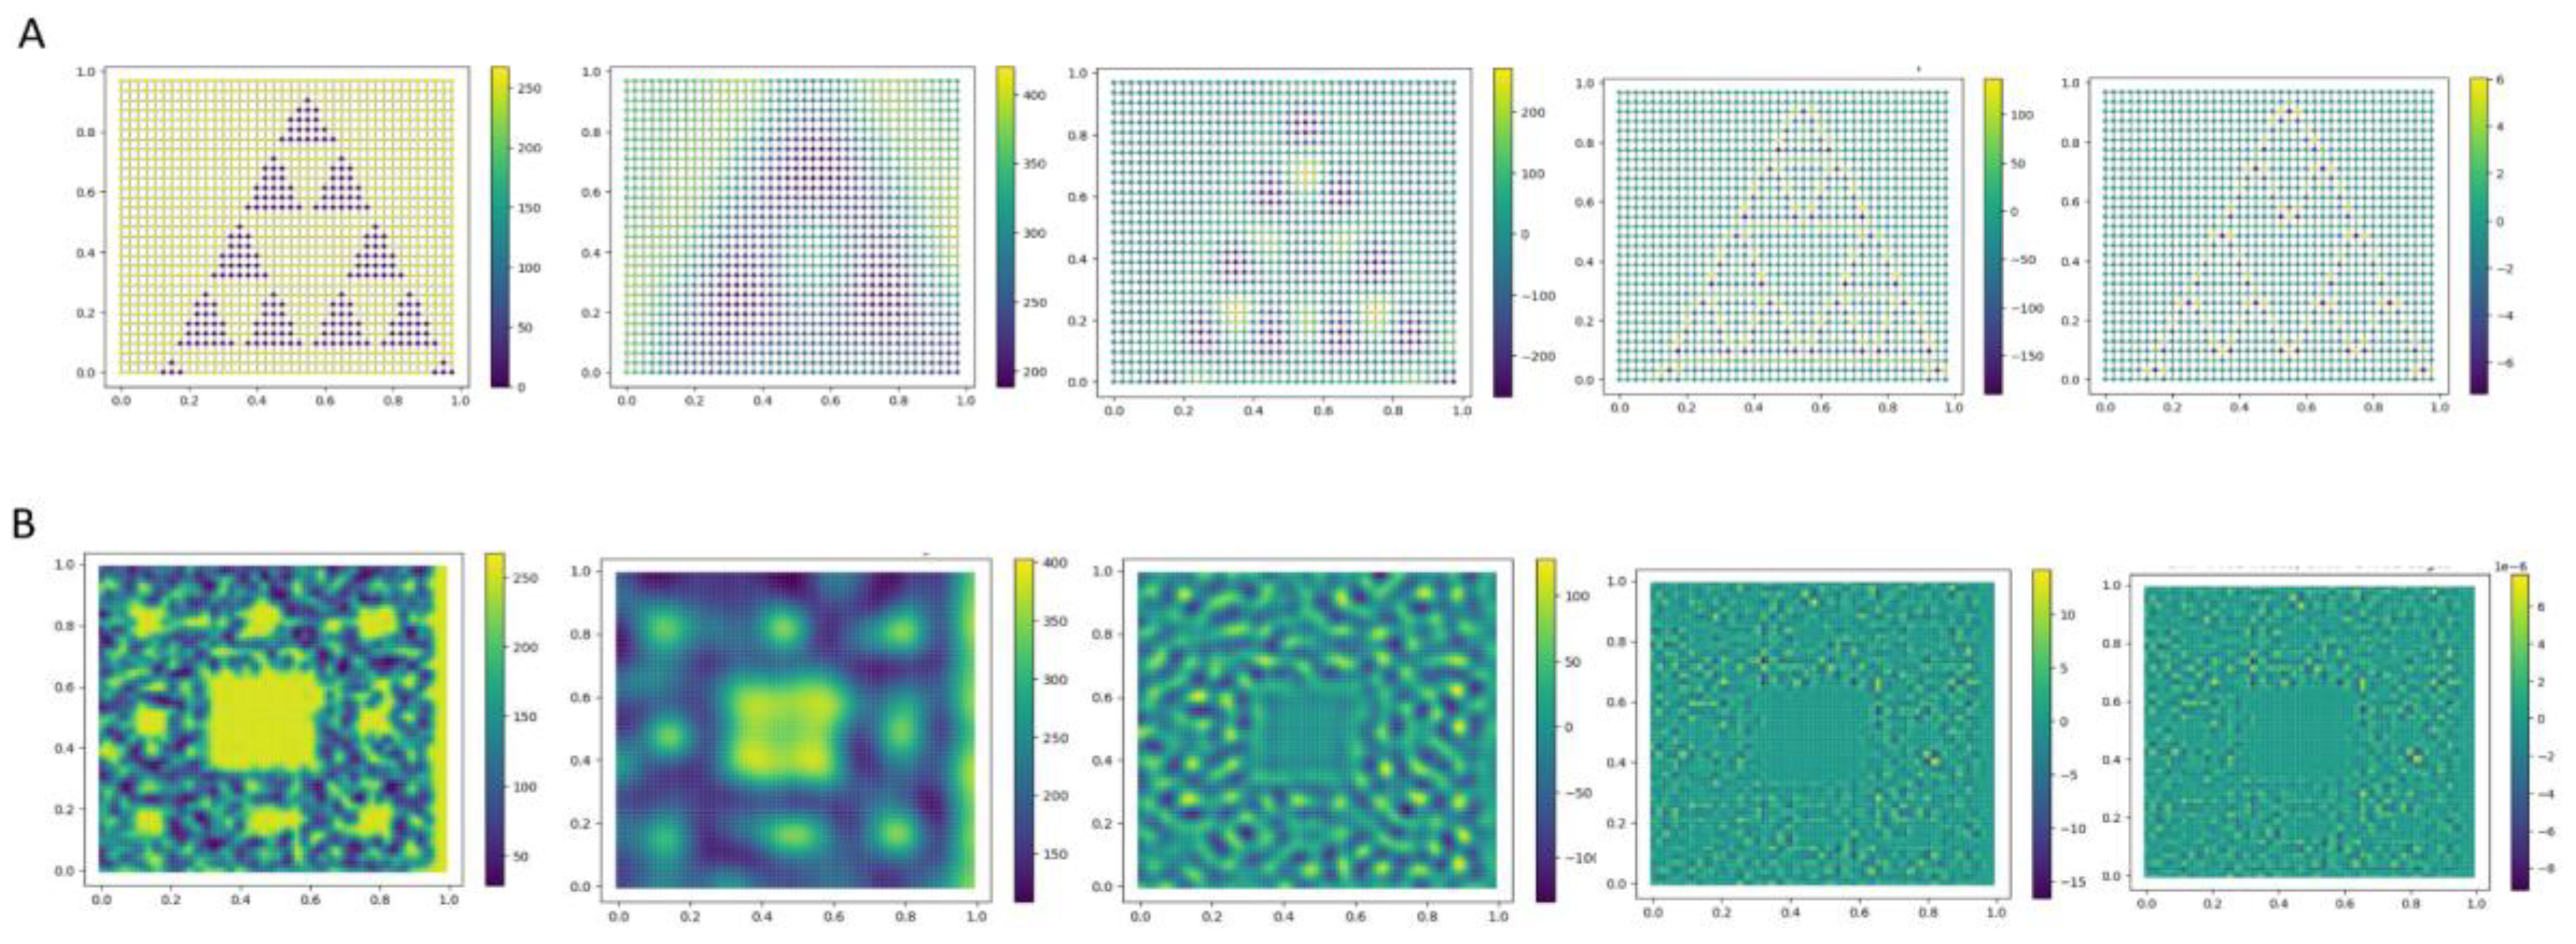
Figure 3.
The graph wavelet transform of fractal signal on regular graph. A) original graph signal which follows the structure of Sierpinski triangle and its wavelet coefficients at different levels. GSP toolbox (Perraudin et al. 2014) was used to make the plots to explain our concept. B) The Sierpinski square-shaped graph signal and its graph wavelet coefficient at different levels.
Disclaimer/Publisher’s Note: The statements, opinions and data contained in all publications are solely those of the individual author(s) and contributor(s) and not of MDPI and/or the editor(s). MDPI and/or the editor(s) disclaim responsibility for any injury to people or property resulting from any ideas, methods, instructions or products referred to in the content. |
© 2025 by the authors. Licensee MDPI, Basel, Switzerland. This article is an open access article distributed under the terms and conditions of the Creative Commons Attribution (CC BY) license (http://creativecommons.org/licenses/by/4.0/).
Copyright: This open access article is published under a Creative Commons CC BY 4.0 license, which permit the free download, distribution, and reuse, provided that the author and preprint are cited in any reuse.


