
Submitted:
10 February 2025
Posted:
11 February 2025
You are already at the latest version
Abstract
The problem of tax non-compliance remains a significant challenge for governments worldwide, with persistent economic and financial implications. However, the synergistic potential of gender differences, legal status, and entity size disparities in tax compliance behavior highlight areas not fully covered in the existing literature. This study presents data from a field tax compliance experiment involving business executives responsible for their companies’ tax decisions. Our findings suggest that changes in tax levels or information about controllability may not significantly impact compliance behavior. However, higher fines and increased audit probabilities appear to improve compliance among participants. Notably, there are statistically significant gender differences in compliance, with female entrepreneurs generally showing higher levels of compliance than male 10 entrepreneurs, particularly under increased audit conditions. Additionally, legal status and entity size seem to significantly affect tax compliance. Smaller companies with fewer assets tend to demonstrate lower compliance rates, likely due to limited resources and expertise. Different legal statuses, which come with varying tax duties and compliance requirements, also influence compliance behavior. The findings suggest that policy decision-makers could enhance overall tax compliance by considering strategies such as raising audit frequency and penalties, implementing supportive policies for small businesses, and rewarding accurate reporting.
Keywords:
Tax compliance
; Randomized field experiment
; Audits
; Real effort task
1. Introduction
Tax avoidance remains a persistent economic and financial challenge in modern economies and is prevalent in many countries. In particular, tax avoidance represents a significant challenge for economies worldwide, undermining the equitable distribution of fiscal burdens and eroding the financial foundations necessary for public goods and services. Taxes serve as the primary means for governments to fund public administration and provide public services. However, due to the substantial cost involved in monitoring tax compliance, tax avoidance has been a concept as old as taxation itself [97]. Understanding the factors that influence an individual’s decision to pay taxes is a complex task. Various research methodologies have been employed to uncover unique insights, including field experiments, lab experiments, observational studies, surveys and questionnaires, case studies, comparative and cross-country studies, as well as econometric and statistical analyses [8,63,91,106]. The foundations of understanding tax compliance can be traced back to a model developed by [9]. The authors suggest that taxpayers make a deliberate choice between the financial gain obtained through tax avoidance and the potential consequences of getting caught and having to pay the unpaid taxes along with a penalty. According to this perspective, tax avoidance theoretically decreases as the expected penalty increases. This is influenced by both the severity of the penalty and the likelihood of getting caught. Individuals are more inclined to comply with tax regulations when the potential costs of noncompliance, in terms of penalties and the probability of detection, are higher. According to [36]’s model, individuals are more inclined to comply with tax regulations since in most countries the fines and the probability of audit are rather low. This indicates that additional factors beyond the potential monetary gains and risks associated with non-compliance play an important role in shaping taxpayer behavior ([15,24,25,27,28]).
Field experiments have significantly advanced our understanding of tax compliance, showcasing how tactics like assistance, prompts, feedback, social norms, deterrents, and alerts boost compliance rates [29,103]. Studies specifically targeting small businesses and entrepreneurs reveal the complex dynamics of tax compliance, highlighting the roles of trust, education, and customized deterrence in promoting adherence [102,104]. Field studies predominantly assess real-world decisions impacting actual tax payments, offering valuable insights into the behaviors of small businesses, owners, and entrepreneurs [73,105,106]. These findings underscore the importance of tailoring interventions to specific groups, contexts, and individual characteristics that influence compliance behaviors.
While the previously mentioned studies provide invaluable insights into tax compliance across various international contexts, they overlook the synergistic influence of gender, entity size, and legal status on tax compliance behavior—factors that could yield significant implications for business owners. Gender dynamics, potentially influencing risk tolerance, trust in government, and compliance motivations, present an underexplored area in tax compliance research, especially in economies facing unique fiscal challenges. In addition, unique socioeconomic challenges and cultural nuances of a specific country might also affect reported income. Larger entities typically have more resources, greater visibility to tax authorities, and economies of scale that facilitate compliance, while smaller businesses often struggle with limited resources and higher relative compliance costs. Legal status also plays a crucial role since company owners are faced with varying regulatory requirements, tax obligations, and incentives. These factors create a complex landscape for tax compliance, influencing how entrepreneurs adhere to tax regulations.
Our study contributes to this field by examining the relatively unexplored behavioral differences in tax compliance among entrepreneurs (business owners). Specifically, we focus on Greek enterprises and consider the combined effects of gender, entity size, and legal status on tax compliance. By shifting the focus from the general population and corporations to actual business decision-makers, our research seeks to address a significant gap in the literature, highlighting the diversity in compliance behavior and underscoring the importance of considering a broader spectrum of decision-makers and tax determinants in tax compliance research. In addition, our study focuses on Greece, where the economic landscape is marked by severe financial turmoil, austerity measures, a slow recovery process, and a substantial informal economy. These context-specific aspects provide a unique backdrop that could influence tax compliance behaviors among Greek company owners, particularly when considering determinants such as gender, entity size, and legal status. Furthermore, the Greek context is enriched by high rates of entrepreneurship and the prevalence of small and midsize enterprises (SMEs), which, despite the economic turmoil, continue to be a vital component of the economy. To capture these dynamics, the following research questions have been identified as relevant, along with the corresponding objectives of this study, as detailed in Table 1.
The rest of the paper is organized as follows: Section 2.1 offers a comprehensive review of existing literature on tax compliance experiments. The methodology and the overall experimental design are presented in Section 2.2. Section 3 presents the results of our field experiment. Section 4 discusses the various policy-relevant implications of our study as well as its main limitations along with fruitful areas for future research directions. Finally, the paper ends with some concluding remarks.
2. Materials and Methods
2.1. Relevant literature
Tax compliance has been thoroughly investigated through several methodologies such as field experiments, surveys, and online interaction analyses, bringing to light diverse factors that affect taxpayer behavior ([32,57]). This domain could benefit from open government data initiatives and collaborative efforts between scientists and the government or tax administration ([58]). Taxpayer empowerment has a major impact on tax compliance, according to [93] and other studies on compliance tactics. According to [93], letting taxpayers decide how taxes are distributed and providing tax information in a context that isn’t tax-specific can significantly increase compliance rates. This highlights the necessity of reducing the social gap that exists between taxpayers and tax authorities. Meanwhile, research by [92] on Greek small businesses shows that tax burden and corruption are important contributors to non-compliance, suggesting that non-compliance should not be interpreted as merely a survival strategy in the face of economic difficulties.
Tax avoidance is a widespread issue in many countries, particularly in developing nations where tax collection falls significantly short of what could be achieved through strict compliance. Understanding the reasons behind tax compliance or non-compliance has been a subject of academic inquiry, although consensus has not yet been reached in the empirical literature. To address this knowledge gap, field experiments have been conducted to examine the impact of various interventions on tax compliance, bot for individual taxpayers and corporations. For instance, a field experiment in Argentina aimed to influence property tax compliance by manipulating taxpayers’ beliefs about enforcement, equity, and fairness of the tax system. The study found that conveying information about actual fines and potential legal consequences significantly increased tax compliance ([6]). Further, [62] studied the impact of deterrence, tax morale, and simplifying information on tax compliance, running five experiments that varied the communication of the tax administration with Belgian taxpayers. Simplifying communication significantly increased compliance, and deterrence messages had an additional positive effect. The effectiveness of deterrence messages on tax compliance was examined in a field experiment in the Dominican Republic. The experiment involved sending messages to firms and the results showed that sharing information about prison sentences and public disclosure of tax avoidance significantly increased tax revenue ([69]). Another field experiment conducted in Texas focused on remote firms’ compliance with sales tax obligations. The study found that tax authority correspondence increased reported sales tax base and tax payments, primarily due to increased salience of tax obligations ([70]).
Field experiments have also examined the effects of different interventions on tax compliance in specific populations. A study conducted in Norway investigated the role of moral suasion and perceived detection probability in shaping taxpayer behavior. The findings showed that moral appeals influenced intensive compliance, while detection messages had a strong effect on extensive compliance ([74]). Furthermore, experiments in New Zealand explored the effects of penalties on tax compliance. The findings suggested that penalty information and rates influenced taxpayers’ stated intentions to comply but had limited effects on actual compliance behavior ([76]).
Studies consistently indicate that self-reported income is more prone to under reporting and manipulation compared to income that is automatically reported by third parties. This is primarily due to the increased opportunity for individuals to conceal or misrepresent their income when they are solely responsible for reporting it. The evidence suggests that focusing on improving compliance among self-reporting taxpayers is crucial for effectively reducing non-compliance rates and promoting a more equitable and efficient tax system ([5,37]). For example, [44] argues that small firms tend to exhibit behavior more akin to individual taxpayers rather than larger firms. This distinction arises from the fact that small business owners can directly make decisions regarding tax reporting. In contrast, in large firms, tax planning and reporting decisions are typically delegated to tax managers. According to [46], the pattern of tax non-compliance among firms, relative to their total income or assets, exhibits a U-shaped curve. Specifically, tax avoidance is more common in small firms, diminishes in medium-sized firms, and subsequently escalates in large firms.
Several studies of tax compliance take into account a number of factors that influence how SMEs and independent contractors behave. A study from the Netherlands shows that tax training programs help new business owners follow tax rules more effectively, without shortening the lifespan of their businesses. Instead, these programs boost profits by reducing operational costs, highlighting the benefits of targeted training in increasing entrepreneurs’ understanding of and compliance with tax regulations [102]. The study of [103] explores the dynamics of power and trust in relation to tax compliance among independent contractors in eleven different nations. This study shows that people’s compliance behaviors are greatly influenced by their cultural and historical backgrounds, especially in post-communist nations. This emphasizes the significance of trusting authorities and exercising power carefully in order to achieve high compliance levels. When the Theory of Reasoned Action (TRA) is applied to Ugandan small business enterprises’ tax compliance behavior, it becomes evident that social norms and individual attitudes are significant factors in compliance decisions. The application of TRA to tax compliance within the framework of developing nations contributes to our comprehension of the social and psychological foundations of tax behavior [104]. Additionally, a randomized field experiment involving small businesses in Bulgaria shows that moral appeals and deterrent strategies such as changing audit probabilities can both increase payroll tax compliance. The study highlights the effectiveness of strategies that combine moral persuasion with enforcement, particularly in larger and riskier firms. This provides insights into strategies for improving compliance that are both cost-effective and effective [105]. The relationship between emotions and tax compliance is investigated in an experimental survey of Turkish small business owners. The results show that emotional responses have a significant impact on compliance intentions through the enforcement capacity and trust in tax authorities. According to this research, a well-rounded strategy that incorporates both enforcement and trust-building initiatives can lessen unfavorable feelings and encourage a base of compliant taxpayers [106]. Lastly, an in-field study in Rio de Janeiro targeting informal entrepreneurs demonstrated that direct training and support enhanced their knowledge, intentions to formalize their businesses, actual formalization rates, and subsequent adherence to tax obligations ([73]).
2.2. Methodology
2.2.1. Experimental Design
In this section, we describe the experimental setup, the participant recruitment methods, and the protocol used for the field experiment. Our approach is consistent with previous research efforts in this field [80,120]. The experiment involved 100 individuals who were invited to take part in the experimental procedure. The eligibility of participants was assessed based on two criteria: firstly, they had to be residents of Greece, and secondly, they had to engage in a primary business activity within country or serve as members of a company’s board of directors. We will consider each participant’s involvement in each round as an independent entity in our three-round experimental design. We can carefully examine responses and behaviors at various phases of the experiment thanks to this approach. As a result, our dataset consists of 300 observations, which represent the total number of participation cases throughout all rounds. This methodological choice gives us a more detailed understanding of participant dynamics inside our experimental framework by making it easier to identify patterns, trends, and behavioral changes that could happen from one round to the next. Treating each experiment round as a discrete event is valid because participants may make different choices based on evolving conditions or new information. Each individual’s unique experiences, convictions, and values can lead to varied responses, even under similar conditions. Recognizing this individuality enhances the understanding of behavior and decision-making. Factors such as fatigue, strategy changes, learning effects, or new experimental settings contribute to this variability. In a 3x3 factorial design, examining the effects and interactions of independent factors (tax rates and audit probabilities) on compliance behavior requires analyzing each round independently. This approach captures behavioral changes across different contexts ([118,119]). All participants attended the annual entrepreneur festival and it is important to note that their decisions during the experiment were driven by genuine motivations, with no deception or manipulation.
A replicated measurement design was implemented, with tax compliance serving as the dependent variable. The experimental design consisted of two distinct parts. The first part focused on addressing the primary research question and involved economic decisions that carried implications for the payment of participants. Our research funded by Hellenic Open University (HOU). The second part comprised of a series of questionnaires aimed at gathering information on business characteristics, personality traits, and the risk preferences of the owners. By employing this two-part approach, we aimed to investigate the relationship between the experimental treatments and tax compliance while also gathering supplementary data on relevant factors that could potentially influence tax behavior. We employ the non-parametric Kolmogorov-Smirnov (KS) test in our research, offering us enhanced flexibility by not requiring the data to conform to a specific distribution, such as the normal distribution. This test also makes it easier to compare two empirical distributions and determine whether or not they come from the same distributional framework. We employ an approach in our experiment whereby several treatment groups receive different treatments with varied parameters (e.g., tax rates and hypothetical audit probability). We may examine how these variables affect tax compliance behavior and how they interact with each other in the experimental scenario by varying both the tax rates and the audit probabilities. These are the following combinations:
- T5: Represents a tax rate of 5% and is combined with an audit probability of 10% (P10).
- T47: Corresponds to a tax rate of 47% and is associated with an audit probability of 5% (P5).
- T25: Signifies a tax rate of 25% and is coupled with an unknown audit probability (UP).
Using a 3x3 factorial design, we present a dynamic experimental technique where various treatment scenarios are subjected to changing tax rates and audit probabilities. Understanding how these factors interact in an experimental setting and affect tax compliance behavior is the aim of this study. We want to uncover the complex influences that tax rates (Low, Medium, High) and audit probability (Low, High, Unspecified) have on how individuals make compliance decisions by systematically changing these variables. An efficient method for analyzing the effects of two independent variables and their interactions on a dependent variable is the 3x3 factorial design. The primary independent factors in our analysis are the likelihood of an audit and tax rates. We may look into how these characteristics affect the behavior of company owners using this technique, especially with regard to compliance rates, reported revenue, and tax payments. The comprehensive design has yielded useful insights that will guide policy decisions about tax rates and audit probability. These insights will also help to optimize tax compliance techniques.
In addition, we use Ordinary Least Squares (OLS) regression to model the link between a collection of independent variables, such as gender, total assets, legal status, sector, and perceived risk (danger), and the dependent variable, the compliance rate. To create a thorough analytical framework, this regression analysis is supplemented with the application of Analysis of Variance (ANOVA). We are able to thoroughly evaluate the relevance of the complex interactions that exist between tax compliance rates and numerous influencing factors under a variety of experimental situations thanks to this dual-method approach. In considering the fine level of non-compliant behavior, we propose measuring it as the difference between the expected declared income and the actual declared income (A - D). This approach allows us to assess the extent to which individuals deviate from their expected income reporting and provides an indicator of non-compliant behavior in our experiment. By comparing the expected and actual declared income, we can evaluate the degree of tax avoidance or under-reporting among participants. The experiment comprised three distinct stages: income declaration, audit and payment generation, each of which involved specific tasks and procedures and are explained in more detail below. By dividing the experiment into these three stages, we sought to examine the impact of different factors on participants’ behavior and the resulting payment outcomes. Finally, by analyzing participants’ compliance decisions and subsequent payment outcomes, we aimed to gain a deeper understanding of how three treatment variables interacted and influenced participants’ behavior in the experiment as depicted in Table 2. This approach enabled us to investigate the complex dynamics of tax compliance and shed light on the factors that shape individuals’ decision-making in tax-related contexts.
2.2.2. Subject recruitment & research questions analysis
For this field experiment, entrepreneurs were recruited by random selection during a specific two-hour period each day, coinciding with the attendance of fair visitors. To minimize self-selection bias, the initial instructions provided to participants did not explicitly disclose that the experiment pertained to taxes. Once the experiment was completed, individuals received an informational message reiterating that their choices would remain completely anonymous, and the funding source, was clarified. None of the participants utilized the option to drop out of the survey.
During the decision-making process, where choices were immediately influenced by the avoidance decision, subjects were not actively monitored. We made it clear to potential participants during the recruitment phase that they would not be meeting the experimenter in person for payment. Instead, they would contact an intermediary to facilitate individual payments. This approach was designed to eliminate the possibility of potential humiliation from facing the experimenter if they violated the honesty rule. Consequently, if altering the form of participation led to any bias in compliance, it was expected to result in reduced compliance due to increased social distance.
According to the existing research on taxpayer compliance, this section presents predictions and hypotheses regarding the anticipated behavior of the subjects that form the basis of our experiment. The widely accepted examination of tax compliance is based on the models proposed by [9] as well as[36]. These models depict a taxpayer who must decide on the amount of income to report to the tax authority. It is commonly assumed that an increase in the audit probability will result in greater compliance, thus establishing our initial premise. Consequently, we proceed by formulating five assumptions concerning the behavior of the subjects:
RQ 1: How do high tax rates, audit probabilities, and higher fines influence tax compliance?
The presence of a high tax threshold provides greater opportunities for participants to modify their behavior compared to a low tax threshold. Furthermore, aside from undisclosed variations within the absolute range, relative tax levels can also influence tax compliance. We make the assumption that taxpayers tend to move towards higher tax rates, resulting in lower levels of tax compliance. Within this context, taxpayers are usually unaware of the true likelihood of an audit, and tax administrations generally do not disclose their planned audits to the public. Consequently, taxpayers make decisions regarding tax avoidance under conditions of uncertainty rather than clear risk. According to the ambiguity aversion model proposed by [23], ambiguity leads taxpayers to consider both the best and worst possible outcomes, such as being audited with a probability of zero or one, respectively. Current research and experimental evidence from [24]; [25] suggests that increasing the penalty for non-compliance will likely lead to higher levels of compliance. The uncertainty of audits and the deterrent effect of increased fines are highlighted by recent research. When taxpayers believe there is a greater chance they will be audited and subject to large financial penalties, they are more likely to cooperate. Behavioral economics studies, such those by [83], have demonstrated that people are aware of the possible costs and hazards of non-compliance.
RQ 2: How do gender differences and the size of an entity affect tax compliance behavior?
Research evidence has explored the influence of gender on tax compliance behavior among individuals. According to [15], women tend to exhibit significantly higher levels of tax compliance compared to men. This finding is supported by related evidence derived from both field studies and laboratory experiments conducted by [16,17,18,19,20,21]. Comprehending tax compliance is further complicated by the correlation between an individual’s total assets and their tax behavior. One’s asset size can affect their tax behavior in a number of ways. Higher asset levels confer a greater ability for individuals and legal entities to engage in complex tax planning strategies. A larger level of total assets in some situations may signify a stronger capacity to engage in tax planning tactics or to benefit from tax advantages and deductions, perhaps leading to lower tax liabilities. Large assets may give legal organizations greater options for tax planning and financial management.
RQ 3: How does the legal status influence the tax compliance and behavior of a company?
Analysing compliance rates for different corporate legal regimes can be challenging, as it requires access to comprehensive and up-to-date data on compliance across different entities. In addition, compliance rates can vary significantly based on factors such as industry, jurisdiction, company size and specific regulatory requirements.
2.2.3. Content analysis
In the experiment, participants were provided with a hypothetical annual turnover and were tasked with completing a tax return based on this given turnover. They were required to consider a specific tax rate and the probability of an audit for the corresponding tax year when filling out the tax return. To streamline the process and minimize potential biases, an Access database was utilized. This database automatically calculated the participants’ payments without any human intervention. This approach ensured that the payment calculations were objective and consistent across all participants. Throughout the experiment, the currency used for calculations and payments was the Euro (€), which is the official currency of the European Union and Greece. By employing this standardized and automated process, we aimed to eliminate any potential biases that could arise from manual calculations and ensure the accuracy and fairness of the payment calculations for all participants.
A period in the experiment consisted of three following rounds below and there were 3 periods in total. The individual stages are as follows:
Stage 1: Income declaration
During this stage of the experiment, participants were provided with information about their income, which remained constant throughout all rounds. They were then tasked with reporting their income based on different combinations of tax rate and audit probability for that round. The purpose of this stage was to examine how participants’ income reporting behavior was influenced by different combinations of tax rates and audit probabilities. By manipulating these factors, we aimed to gain insights into the impact of tax policy and enforcement measures on individuals’ compliance decisions.
Stage 2: Audit Probability
In this stage of the experiment, participants were subjected to audits with probability, denoted as P, which varied in each round. If a participant’s tax return was selected for an audit and they had declared their taxable income honestly, no penalty was imposed on them. However, if they were audited and found to have misrepresented their income, a penalty was applied. The penalty amount was determined as the difference between the participant’s actual income and the income they had declared on their tax return. By incorporating the auditing stage into the experiment, we aimed to examine the impact of audits on participants’ compliance behavior and their willingness to accurately report their income. The potential penalties served as a deterrent to tax avoidance and provided an additional incentive for participants to declare their taxable income honestly.
Stage 3: Payments
During this stage of the experiment, participants were informed about their payment, which varied from person to person. The payment amount was determined based on the tax morale demonstrated by each participant throughout the previous stages of the experiment. Specifically, the payment was calculated based on their declared income, tax rates, audit outcomes, and overall compliance behavior. Participants who adhered to tax regulations and displayed a higher tax morale were rewarded with a payment reflecting their compliance. Conversely, participants who engaged in non-compliant behavior or tax avoidance faced potential penalties and, consequently, received a lower payment. By linking participants’ payments to their tax morale, we aimed to study the impact of individual compliance behavior on financial outcomes. The overall experimental procedure is depicted in Figure 1.
3. Results
The compliance rate of entrepreneurs, which is defined as the ratio of the declared income to the income earned during a specific experiment period, will be the primary focus of the analysis. In subsection below, we analyze the intricacies of this subject, providing a more detailed explanation and examination of the compliance rate.
3.1. Average compliance
We begin by offering a broad overview of the summary statistics. We then present findings from non-parametric tests conducted on personal data to examine the effect of familiarity with firm characteristics on tax compliance. To achieve this goal, we analyze the average compliance rate, represented by the fraction of income disclosed in the tax filing phase compared to actual income earned in the employment phase, across treatments in each round. To strengthen these findings, regression analysis is then applied. Table 3 presents the average compliance rates for participants across various treatments, using the average behavior of each subject throughout the experiment as the unit of observation. Further, Figure 2 reflects the medium compliance rate per round and gender. Continuing the following charts (Figure 3, Figure 4 and Figure 5) depict the average compliance rate by firm size, legal status, and industry at each stage. The correlation coefficients between variables of interest are displayed in Table 4. Moreover, in this subsection, we examine the impact of increasing the probability of audit. Specifically, we compare the mean compliance rates between different samples and treatments using the non-parametric Mann-Whitney test (MW). First, we focus on the effect of doubling the audit probability when it is known, comparing treatments P5 and P10. The results reveal a statistically significant effect on the average compliance rate of the subjects (z=-6.827, p=0.000). This suggests that increasing the probability of audit leads to a notable change in the compliance behavior of the participants.
Next, we explore the effect of an unknown audit probability on behavior. We compare the treatment with an unknown control rate (UP) with the corresponding treatment where the control rate is known (P5). The analysis demonstrates a statistically significant difference in the mean compliance levels of the entrepreneurs (z = 8.067, p = 0.000). This indicates that the presence of uncertainty regarding the audit probability has a substantial impact on compliance behavior. The statistical significance of the findings underscores the significance of audit probability in shaping tax compliance behavior.
3.2. Distribution of compliance
When analyzing the compliance data, focusing solely on treatment averages may overlook the considerable heterogeneity present in the data. Figure 3, Figure 4 and Figure 5display the compliance level two-way plots, where the average compliance of each subject is considered as the unit of observation. This visualization demonstrates that despite the continuous nature of the compliance measure, two distinct types of behavior emerge: individuals who consistently report their income honestly throughout the experiment and those who do not. To assess the significance of these differences in behavior, we conducted the KS test for equality of distributions. The results indicate that changing the audit probability from 5% (P5) to 10% (P10) resulted in significant differences in the compliance distribution, specifically among female participants in the two rounds (Male: D = 0.460, p = 0.000; Female: D = 0.591, p = 0.000). Similarly, the change in audit probability from 5% (P5) to unknown (UP) showed statistically significant differences for both genders (Male: D = 0.600, p = 0.000; Female: D = 0.632, p = 0.000).
Result 1: A higher absolute tax range causes a lower degree of tax compliance, and when the audit probability is ambiguous, it leads to a significant change in mean compliance compared to when the audit probability is known; moreover, doubling the fine rate for non-compliance under ambiguous audit possibilities results in significantly higher mean compliance between the genders.
Our analysis reveals an interesting finding regarding the compliance rate in the second stage of the experiment. Contrary to expectations, we observed a decrease in the compliance rate when the tax rate increased. This suggests that participants were less inclined to report their income honestly when faced with a higher tax rate. To support this observation, we conducted a statistical analysis using the KS test. The results indicate a significant difference in the distribution of compliance between the first and second stages of the experiment, with p-values of 0.000 for both stage 1 vs. stage 2 and stage 2 vs. stage 3 comparisons (stage 1,2:D = 0.484, p = 0.000; stage 2,3:D = 0.621, p = 0.000, KS test). When comparing groups of subjects under the same experimental conditions, we observe that the percentage of fully compliant males is significantly lower in all treatments, with all comparisons being significant at the 1% level. The distribution of compliance also shows a significant difference between males and females (D = 0.209, p = 0.002, KS test).
Males exhibit lower rates of full compliance compared to females, as evidenced by the lower percentage of fully compliant males and the significant differences in compliance distributions. Once the possibility of audit was uncertain, we observed that doubling the fine rate for non-compliance led to a significantly higher mean compliance rate among both genders. This suggests that raising the penalty for not following rules positively influenced behavior towards compliance, regardless of gender. The impact of the penalty on compliance behavior was particularly evident in the context of ambiguity, where subjects were uncertain about the probability of an audit. According to the results, the threat of higher penalties can act as a deterrent and motivate individuals to comply with tax regulations.
Result 2: The likelihood of tax compliance is higher among women compared to men, and this compliance is further influenced when the probability of an audit is doubled; moreover, there is a causal relationship between tax avoidance and the size of a company.
Our findings are consistent with previous research conducted by [15,16,17,18,19,20,21]. These studies also reported significant differences in tax compliance behavior between men and women. In our specific analysis, we found a statistically significant difference between the mean compliance rates of men and women (D = 0.209, p = 0.002, KS). Further examining the effect of ambiguity on control probability leads to significant changes in the distribution of compliance for both sexes. The (KS) test shows statistically significant differences in the adherence distributions for males (D = 0.600, p = 0.000) and females (D = 0.632, p = 0.000) when comparing the unknown control probability (UP) treatment with known control probability condition (P5). Concluding, when control probabilities are unclear, individuals may exhibit different compliance patterns compared to when control probabilities are known. The findings are consistent with the outcomes of earlier research conducted by [78,89,90,91]. These studies also revealed significant differences in how firms with smaller annual total assets dealt with tax compliance. Based on our findings, there appears to be a comparable correlation between asset size and compliance rates, and firms with smaller assets are more likely to have lower levels of tax compliance. Statistical analysis using the KS test confirmed a significant difference in compliance rates (D=0.950, p=0.000).
Result 3: Self-employed tend to be less compliant.
The results of our study indicate a statistically significant difference in compliance rates depending on the legal status of the firm, with self-employed people having the highest concentration and general partnerships having the lowest. This finding raises the possibility that different compliance behaviors may exist for these various legal structures. According to the KS test, there is a significant statistical difference in the compliance rates between these categories (D=0.967, p=0.000). The statistically substantial discrepancy shows that the compliance rates among the various legal regimes differ noticeably. Our results are consistent with [100,108,109,110].
3.3. Regression analysis
Our primary analysis begins by examining the results of the ANOVA method (Table 5). The goal is to achieve a simpler and more easily understood set of results from the tests, specifically to determine if there are significant differences in the average values among the groups. These results closely resemble those obtained through OLS regression (Table 8). However, we want to emphasize the importance of the Contrast Test results in Table 6, Table 7, which provide a convenient way to assess the main effects and interactions among our key variables. Essentially, these results help us understand how changes in tax rates and audit probabilities affect compliance rates in relation to gender. Since the overall impact of the stages is statistically significant, we can further investigate how they affect gender. We compare the responses of men and women at each stage to examine the direct effects of gender (Figure 6).
Focusing on the row labeled (2 vs 1), it signifies an evaluation comparing whether the mean compliance rate in the first stage is equivalent to that in the second stage. The subsequent three rows follow the same approach, scrutinizing whether there exist noteworthy distinctions in the mean compliance rates across various stages. It is noteworthy that, in the case of women, the transition from the third stage to the first stage did not have a statistically significant impact on their compliance.
As depicted in Table 7 the men’s compliance noticeably decreases from stage 1 to stage 2 by about 0.22 points, and this difference is statistically significant. Similar trends are shown in women, whose compliance falls significantly by 0.24 points, exceeding the reduction in compliance observed in men following the change from stage 1 to stage 2. On the other hand, stage 3 male entrepreneurs show an expected to 0.08 unit increase in compliance, perhaps as a result of the higher fines associated with random tax audits. However, it doesn’t seem like this condition affects female business owners.

Table 5.
Anova Regression Results.
| Compliance rate | |
| Assets = 2 | 0.087*** |
| (0.030) | |
| Assets = 3 | 0.100* |
| (0.059) | |
| Assets = 4 | 0.001 |
| (0.123) | |
| Assets = 5 | 0.121* |
| (0.063) | |
| Gender = 1 | 0.100** |
| (0.041) | |
| Stage = 2 | -0.224*** |
| (0.040) | |
| Stage = 3 | 0.086** |
| (0.040) | |
| Investment = 1 | -0.041 |
| (0.025) | |
| Legal Status = 2 | 0.087* |
| (0.044) | |
| Legal Status = 3 | 0.140*** |
| (0.052) | |
| Legal Status = 4 | 0.195** |
| (0.089) | |
| Legal Status = 5 | 0.057* |
| (0.034) | |
| Danger = 2 | -0.049 |
| (0.033) | |
| Observations | 300 |
| R-squared | 0.417 |
| F-test | 13.566 |
| Prob > F | 0.000 |
Standard errors in parentheses. *** p<0.01, ** p<0.05, * p<0.1.
Table 6.
ANOVA and Contrast Test Results.
| df | F | P > t | |
| Stage@Gender | |||
| (2 vs 1) Male | 1 | 30.32 | 0.000 |
| (2 vs 1) Female | 1 | 38.77 | 0.000 |
| (3 vs 1) Male | 1 | 4.44 | 0.035 |
| (3 vs 1) Female | 1 | 0.60 | 0.337 |
| Joint | 4 | 30.18 | 0.000 |
| Denominator | 284 |
Table 7.
Contrast Test Results.
| Stage@Gender | Contrast | Std. err. | t | P > t | 95% conf. interval | |
| Lower | Upper | |||||
| (2 vs 1) Male | -0.224 | 0.04 | 0.000 | -0.305 | -0.144 | |
| (2 vs 1) Female | -0.256 | 0.041 | 0.000 | -0.337 | -0.175 | |
| (3 vs 1) Male | 0.086 | 0.40 | 0.036 | 0.005 | 0.166 | |
| (3 vs 1) Female | 0.031 | 0.041 | 0.337 | -0.043 | 0.113 | |
First, we employ a standard OLS model as a benchmark, with the average compliance rate serving as the dependent variable. So, Table 8 displays the outcomes of OLS regressions to further explore the relationship and understand which specific groups differ from each other. Across all regression models, we employed the corresponding compliance rate as the dependent variable. The results are robust across specifications and consistent with the previous analysis. Our dataset comprises 300 observations, drawn from 100 participants across three different stages.
Regressions encompasses the compliance rate alongside several control variables as independent predictors. Additionally, we included categorical variables related to the company’s assets, as well as a binary variable reflecting investment choices—specifically, whether entrepreneurs opted for investments in the stock market or in a bank. The "sector" variable encompasses various specific sectors, including Tourism, Manufacturing, Trade, and Construction, Other Services. Furthermore, our model incorporates a "legal status" variable, indicating the legal form of the company, encompassing options such as Freelancer, Limited Liability Company, General Partnership, Limited Partnership, Société Anonyme, and others. Lastly, the "danger" variable signifies the business owner’s risk aversion. When applicable, this variable assumes a value of 1 to indicate risk aversion.
The regression results indicate that gender plays a significant role in compliance behavior. Specifically, the coefficient for gender is positive (0.07) and statistically significant at the 1% level. This suggests that women tend to be more compliant, a result that is consistent with previous studies in experimental literature, including [15,16,17,18,19,20,21]. Compliance decreases significantly at the second stage compared to the first stage. This decline in compliance can be attributed to the increase in the tax rate and the simultaneous decrease in the probability of being audited. This finding suggests that entrepreneurs are more likely to comply with tax obligations when audit probabilities are higher. Further, the size of the company appears to have an impact on compliance behavior. Larger firms tend to be more compliant than smaller ones. This finding implies that the size of a business may influence its willingness to adhere to tax regulations. In addition, General Partnership (GP) and Limited Partnership (LP) companies demonstrate higher levels of compliance compared to freelancers. This result suggests that the legal structure of a business may also be a significant factor influencing compliance. The decision to invest and the sensation of risk appear to have no significant impact on the compliance rate. Together, these data offer insightful information on the variables impacting tax compliance in the study, with legal framework emerging as important factor.
Table 8.
Compliance Rate (OLS Model).
| (1) | (2) | (3) | (4) | |
| Compliance Rate | FE | RE | BE | PA |
| Independent Variables | ||||
| Gender = 1, Female | 0.071** | 0.071** | 0.071** | 0.071** |
| (0.028) | (0.032) | (0.029) | (0.029) | |
| Stage = 2 | -0.240*** | -0.240*** | -0.240*** | -0.240*** |
| (0.028) | (0.027) | (0.025) | (0.025) | |
| Stage = 3 | 0.059** | 0.059** | 0.059** | 0.059** |
| (0.026) | (0.025) | (0.025) | (0.025) | |
| Assets = 2, 500K-1M€ | 0.093*** | 0.093** | 0.093*** | 0.093*** |
| (0.032) | (0.038) | (0.035) | (0.035) | |
| Assets = 3, 1M-5M€ | 0.104** | 0.104 | 0.104 | 0.104 |
| (0.041) | (0.075) | (0.069) | (0.069) | |
| Assets = 4, 5M-10M€ | -0.017 | -0.017 | -0.017 | -0.017 |
| (0.056) | (0.159) | (0.146) | (0.146) | |
| Assets = 5, >10M€ | 0.127 | 0.127 | 0.127* | 0.127* |
| (0.119) | (0.081) | (0.074) | (0.074) | |
| Sector = 2, Tourism | 0.034 | 0.034 | 0.034 | 0.034 |
| (0.054) | (0.056) | (0.051) | (0.051) | |
| Sector = 3, Manufacturing | 0.007 | 0.007 | 0.007 | 0.007 |
| (0.047) | (0.068) | (0.062) | (0.062) | |
| Sector = 4, Trade | 0.013 | 0.013 | 0.013 | 0.013 |
| (0.035) | (0.035) | (0.032) | (0.032) | |
| Sector = 5, Construction | -0.001 | -0.001 | -0.001 | -0.001 |
| (0.062) | (0.066) | (0.060) | (0.060) | |
| Investment = 1, Stock Market | -0.041 | -0.041 | -0.041 | -0.041 |
| (0.027) | (0.032) | (0.029) | (0.029) | |
| Legal Status = 2, LLC | 0.090 | 0.090 | 0.090* | 0.090* |
| (0.055) | (0.055) | (0.051) | (0.051) | |
| Legal Status = 3, GP | 0.140*** | 0.140** | 0.140** | 0.140** |
| (0.045) | (0.065) | (0.060) | (0.060) | |
| Legal Status = 4, LP | 0.188*** | 0.188 | 0.188* | 0.188* |
| (0.049) | (0.115) | (0.105) | (0.105) | |
| Legal Status = 5, SA | 0.056 | 0.056 | 0.056 | 0.056 |
| (0.040) | (0.042) | (0.039) | (0.039) | |
| Danger = 2, Risk Lover | -0.045 | -0.045 | -0.045 | -0.045 |
| (0.044) | (0.043) | (0.039) | (0.039) | |
| Constant | 0.656*** | 0.750*** | 0.596*** | 0.656*** |
| (0.057) | (0.016) | (0.052) | (0.050) | |
| Observations | 297 | 297 | 297 | 297 |
| R-squared | 0.442 | 0.390 | ||
| Number of ID | 99 | 99 | 99 | 99 |
Note: Dependent variable is the average compliance rate. Robust standard errors are in parentheses. *** p<0.01, ** p<0.05, * p<0.1
4. Discussion
This study investigates various factors influencing tax compliance among Greek company owners, with a focus on gender, company size, and legal status. It takes into account the unique economic and cultural environment of Greece, addressing identified gaps in the literature. In this challenging national context, marked by economic crisis and recovery, our research aims to contribute to both academic discussions on tax compliance and the formulation of policies that are sensitively aligned with the nuances of gender and socioeconomic factors. By conducting a comprehensive field experiment focused on exploring the dynamics of tax avoidance among entrepreneurs, especially within the unique setting of Greece, we try to understand the interplay between tax rate levels and audit probabilities and their collective impact on tax compliance among Greek entrepreneurs. In particular, our study offers an empirical analysis of the thought processes Greek business owners use to support tax compliance. This research provides important insights into the intricacies of tax compliance by thoroughly exploring how gender differences and risk perceptions, together with the legal status and cultural-economic elements unique to Greece, impact tax compliance behaviors. The results not only support earlier research that found gender to be a key determinant in tax compliance, but they also broaden our knowledge by emphasizing the particular difficulties small company owners have while negotiating tax laws.
In particular, our research revealed that the average compliance rates varied across different rounds and genders, with female participants generally showing higher compliance. Women demonstrated higher tax compliance rates than men, and this difference was further pronounced under conditions of increased audit probability. The gender disparities in self-employed tax compliance habits among Greek business owners as examined in this study, have revealed that males have lower compliance rates than females. This is consistent with other research that found substantial gender differences in tax compliance behaviors ([15,16,17,18,19,20,21]). One potential explanation could be that female entrepreneurs tend to exhibit higher levels of risk aversion compared to their male counterparts who may lean more towards risk-loving behavior.
Moreover, the correlation analysis revealed significant relationships between compliance rate and variables such as legal status, assets, and danger (risk aversion). In particular, the legal status of business is significant because various legal entities have distinct tax duties and compliance requirements. We also find significant differences between a company’s size and its tax behaviour. That is, the fewer assets a company has, the lower its degree of tax compliance. As suggested in [89], small firms encounter difficulties in comprehending and complying with tax regulations because of their low resources and lack of expertise. Furthermore, as suggested by [78], small business owners have a different perspective on tax compliance than do workers. This is mostly because they are better at spotting non-compliance chances, are less concerned about taxes, and see taxes as possible losses. In a time of economic challenges within the Greek context, similar findings were reported in the study by [111], which investigated tax compliance characteristics of the general public in Greece. The study found low compliance levels, linked to specific national traits and the perceived insufficiency of returns from state taxation.
This study also examined the relationship between audit fines and the uncertain probability of regulatory inspection, emphasizing how it affects entrepreneurs’ compliance practices. Increasing the known audit probability significantly improved compliance rates. The uncertainty about audit probability also significantly affected compliance behavior, indicating the importance of perceived audit risks on tax compliance. Contrary to expectations, an increase in tax rates led to a decrease in compliance, indicating that higher taxes might discourage honest income reporting. Doubling the fine for non-compliance under ambiguous audit conditions led to a significant increase in mean compliance. Our results are consistent with those of [112,113], suggesting that increased fines for non-compliance might encourage compliance. [115] cautions that this could not be true for all taxpayers, as some may see a decrease in compliance and an increase in uncertainty. Furthermore, as noted by [114], there is a complex relationship between compliance and higher fines. Consistent with the findings of [116], compliance behavior is shaped by the authority of tax officials and the perceived risks of audits. Trust in authorities enhances voluntary compliance, whereas increased fines and higher audit probabilities boost enforced compliance.
All these findings could inform public policy decision-making and the development of customized tax policies. In fact, the literature provides a variety of policy suggestions that might be applied to reduce tax noncompliance. Specifically, the objective should be to establish a psychological contract between taxpayers and tax authorities so that compliance is viewed as equitable and mutually advantageous. Combining incentives and penalties is one way to do this [98]. For example, prizes may be given for adhering to tax regulations, and fines can be applied for breaching them. In addition, it is suggested that legislators enact progressive tax legislation that fairly distributes taxes according to individuals’ income levels [99,100] stress the need of considering psychological issues such as social norms, trust in authority, and feelings of justice when developing tax legislation and enforcement strategies. Essentially, by addressing these aspects comprehensively, legislators can successfully promote increased tax adherence while fostering equity and trust in the tax system. According to [117], regulatory factors and transparency significantly impact compliance behavior. Firms are influenced by the perception of risks and social costs, which plays a crucial role in driving proactive decisions to comply with tax regulations.
Combining the proposed policies from the literature with the results of this study, our research opens the door to the creation of more focused, efficient tax compliance plans and regulations by providing insight into these complex behaviors. This approach is necessary to enhance tax compliance among Greek businesses, ultimately supporting the broader goals of tax justice and effective tax administration. Based on our findings, we recommend additional policies aimed at enhancing tax compliance. Such policies should support personalizing education and awareness campaigns to emphasize gender-specific attitudes and compliance practices. It is advised to increase audit frequency transparency and modify non-compliance fines in order to deter tax avoidance and maintain public confidence in the auditing process. Streamlining self-employed taxpayer tax processes and providing clear assistance to companies with different legal statuses are priorities. It is recommended that small businesses implement policies like tax education, simpler filing procedures, or rewards for continued compliance. In order to effectively reduce tax avoidance, the research also recommends rewarding accurate reporting through tax discounts, credits, or public recognition of conforming firms.
4.1. Limitations and future research
Although this study effectively achieved its goals, it is important to recognize the inherent limitations of its methodology, particularly the use of a sample of entrepreneurs who responded to a hypothetical tax scenario. Due to our research objectives and the imperative need for maintaining experimental rigor, we found it necessary to introduce certain assumptions that may not universally align with real-world decision-making scenarios. In the future research will aim to include scenarios that better reflect the settings and conditions that prevailed during the pertinent period of time.
Moreover, one potential limitation is the uncertainty regarding whether hypothetical scenarios accurately reflect real-life tax behavior. In this study, participants were given instructions on how to approach a hypothetical tax situation and were subsequently queried about their compliance. This process may have made the intervention transparent to participants, potentially introducing response bias due to demand characteristics. Additionally, the compliance measure focused solely on hypothetical scenarios and captured only basic intentions. It is crucial to acknowledge the limitations in terms of external validity and generalizability. Furthermore, we purposefully included some ambiguity in our experimental design. Participants were given the chance to act dishonestly while being expressly told to declare their whole income. This purposeful ambiguity was introduced to create a conflict between the desire to maximize financial gain and the preference for following tax laws. Noting that governments frequently stress the need of compliance even in the lack of clear financial incentives to do so, it is important to note that such ambiguity is not wholly unfamiliar to real-world tax systems. As acknowledged by other studies, using laboratory samples poses challenges in generalizing the findings to real-world contexts. The main concern is the lack of evidence demonstrating a direct correlation between tax attitudes, and actual tax reporting behavior ([77]).
Considering the limitations this study experienced, we acknowledge the significance of improving our methods and addressing these issues in future investigations. Future research includes a thorough analysis of potential modifications and enhancements to our approaches. In addition, future research should replicate the experimental design while also examining the behavior of entrepreneurs after randomized audits, similar to the evaluative surveys conducted by [5,81], but using a different sample. This exploration would provide valuable insights and is an area left for future investigation.
5. Conclusions
The field of tax compliance experiments has provided valuable insights into various aspects of tax behavior, such as audits, penalties, and tax rates. While these traditional issues have received much attention, there are still many other areas that could benefit from further exploration and development. In our study, we have directly contributed to the existing literature by conducting a randomized field experiment focusing on the role of the tax rate combined with controllability in the tax compliance of SMEs in the Greek economy. By conducting this experiment in a real-world setting, we have provided empirical evidence and established a direct relationship between tax rates and the likelihood of audit. The findings indicate that a broader absolute tax range correlates with lower tax compliance levels. When the probability of an audit is uncertain, there’s a notable shift in average compliance, contrasting with situations where the audit probability is clear. Additionally, doubling the fines for non-compliance under uncertain audit conditions leads to a significant increase in average compliance across genders. The analysis further reveals that women are more likely to comply with tax regulations than men, with their compliance rate increasing when the audit probability is doubled. A discernible cause-and-effect relationship between tax avoidance and company size is identified, with smaller firms more inclined towards tax avoidance. It’s also observed that self-employed individuals exhibit lower compliance levels, underscoring the varied influences on tax compliance across different professional groups.
Recognizing the paramount importance of transparency in audit frequencies and the strategic adjustment of fines for non-compliance, our findings advocate for a dual approach that not only deters tax evasion but also fortifies public trust in the tax administration system. Furthermore, the study accentuates the urgency of streamlining tax processes for the self-employed and offering unambiguous support to businesses across various legal frameworks, thereby easing the compliance burden. For small businesses, which face their own set of challenges, we suggest a suite of policies including simplified filing procedures, tax education, and incentives for maintaining compliance. Additionally, our recommendations extend to rewarding honest income reporting through tangible benefits such as tax discounts, credits, or public accolades, thereby fostering a culture of integrity within the business community. This holistic approach not only aims to curtail tax avoidance but also aligns with the broader objectives of ensuring tax justice and enhancing the efficacy of tax administration in Greece.
Appendix A. Guides of Participants
Dear Participant,
Thank you for participating. Furthermore, we would like to briefly describe the objective of this research. The purpose of the study was to understand the factors that influence taxpayers’ decisions about how much to pay in taxes. This was achieved by having the participants calculate their pre-tax income. We then determined the percentage of pre-tax income reported by participants to assess tax compliance. This study aimed to improve understanding of taxpayer behavior by examining the impact of various audit rates on tax compliance. We wish to inform you that all of your data is completely anonymous and that there is no way for your identity to be associated with any of your experiment responses. Hellenic Open University researchers follow rigorous moral standards, which include protecting participants’ privacy. The organizers will only receive anonymized data from the experiment, meaning that no names or other identifying information will be offered. They do not have access to any personal data related to this study. We are going to publish the study findings in journal articles and reports. These publications will contain aggregated information such as the average compliance rate for each study participant. The results of individual participants will never be made public. We will immediately remove your information from the project if you decide not to participate in the study.
Informed Consent Statement
Informed consent was obtained from all subjects involved in the study.
Data Availability Statement
Data available in a publicly accessible repository; The original data presented in the study are openly available in Mendeley Data at https://data.mendeley.com/datasets/b5knyp45b9/1.
Acknowledgments
The authors express their sincere gratitude to the Hellenic Open University for its financial support, which made this research possible. Additionally, we appreciate the institution’s commitment to fostering academic excellence and providing a supportive research environment.
Conflicts of Interest
The funders had no role in the design of the study; in the collection, analyses, or interpretation of data; in the writing of the manuscript; or in the decision to publish the results.
Appendix B. Guidelines and Procedures
Appendix B.1. Verbal Guidelines (Interpreted from Greek)
Welcome to the experiment!
I will now present the following general guidelines before commencing the experiment. Please carefully attend to these instructions and refrain from clicking the "Start Experiment" button until they have been fully explained. The aim of this experiment is to gain a better understanding of human behavior. This experiment provides an opportunity to earn money, with the amount ranging from 0 to 10 euros, contingent on your choices. All participants in this experiment will remain anonymous. Furthermore, the payments will be transmitted securely, ensuring that no other participants in the group will have access to this information. The specific amount of money you will receive is only known to the experimenters. Subsequent instructions will provide a comprehensive overview of the experiment. Please thoroughly review all the details before proceeding to the next screen with a mouse click, as once you leave these instructions, you will not be able to return to them. If you have any questions or concerns, please do not hesitate to raise your hand.
You may now proceed by clicking the "Start Experiment" button.
Appendix B.2. Instructions on the First Screen (All Treatments)
We thank you for your participation in this study. Please take a moment to carefully read and understand the provided instructions. At the end of these instructions, there will be some comprehension questions, and if you can answer them correctly, you will have the opportunity to earn money. The experiment consists of three rounds, and in each round, you will engage with an imaginary scenario and receive payment accordingly. Your objective in every round is to immerse yourself in different situations and respond truthfully. Each round will last between thirty and sixty seconds, and you will be notified of the specific time limit just before the start of each round. While you are actively participating, the remaining time will always be displayed in the upper right corner of the screen. If you have comprehended these instructions, please press "continue" button. Taxes must be paid on the money won on each round. You will need to complete a tax return for each job after completion. The tax rate you will pay on your income in each round will be shown. Your income for the respective round will be reduced by the applicable tax charge. "After the tax deduction, your income will be X euros here." X depends on the rate of import taxes. For each round in which your supposed income is completed, you will receive five euros.
Click the button "continue" if you think you understand these instructions.
Finally, at the conclusion of the experiment, you will receive paid.
Your payout amount is computed as follows:
Appendix C. Profile questions
We appreciate your willingness to take part. We just have to verify a few things with you in advance.
Q1. Gender:
Q2. Does your company pay income taxes in Greece? SINGLE CODE
• Yes*
• No
• Don’t know
Note: Participants who select the options highlighted with an asterisk (*) were then invited to participate in the experiment.
Q3. What is your business sector?
a. Construction
b. Tourism
c. Manufacturing
d. Trade
e. Other services
Q4. What is the legal form of your business??
a. Freelancer / Self-employed
b. LLC
c. GP
d. LP
e. SA
Q5. Annual turnover of your business:
a.> 500.000€
b. 500.000€ - 1.000.000€
c. 1.000.001€ - 5.000.000€
d. 5.000.001€ - 10.000.000€
e.>10.000.000€
Q6. Judging from the other companies in your industry, you would say that:
a. Greek companies avoid taxes.
b. Greek companies do not avoid taxes.
Q7. If you had to choose between a secure investment with a) a low but certain return (Bank) or b) an investment with a potentially high but uncertain return (Stock Exchange) you would :
a. Deposit your money with the Bank to ensure that you receive a fixed amount (interest) without risking the initial capital.
b. Buy shares on the stock exchange (so that you have the possibility of earning much larger amounts even if you risk losing the initial capital).
Q8. On what category would you rate yourself in terms of your relationship with risk?
a. I love taking risks.
b. I always want to feel safe and try not to take any risks.
Start of the experimental procedure:
Stage 1
Let’s assume…
Your company has a profit of 50.000€, the tax rate is 5% and the probability of an audit by the tax authorities is 10%.
1. What amount of profit would you declare to the tax authorities considering the tax rate and the possibility of an audit:
You can enter values from 0 - 50.000 (x).
2. Based on the reduction of the tax rate (5%) your available profits are:
3. Assuming that there is no chance of an audit by the tax authorities, would you choose to be audited on your own initiative?
a. Yes
b. No
4. Fine:
Hidden to the User
5. Display a fine to the user (if any):
6. The payment of Stage 1 is equal to:
Tax compliance level of participant in Stage 1 is equal to the ratio of: (Hidden to user)
End of Stage 1
Stage 2
Let’s assume…
Your company has a profit of 50.000€, the tax rate is 47% and the probability of an audit by the tax authorities is 5%.
1. What amount of profit would you declare to the tax authorities considering the tax rate and the possibility of an audit:
You can enter values from 0 - 50.000 (x).
2. Based on the reduction of the tax rate (47%) your available profits are:
3. Assuming that there is no chance of an audit by the tax authorities, would you choose to be audited on your own initiative?
a. Yes
b. No
4. Fine:
Hidden to the User
5. Display a fine to the user (if any):
6. The payment of Stage 2 is equal to:
Tax compliance level of participant in Stage 2 is equal to the ratio of: (Hidden to user)
End of Stage 2
Stage 3
Let’s assume…
Your company has a profit of 50.000€, the tax rate is 25% and the probability of an audit by the tax authorities is unknown.
1. What amount of profit would you declare to the tax authorities considering the tax rate and the possibility of an audit:
You can enter values from 0 - 50.000 (x).
2. Based on the reduction of the tax rate (25%) your available profits are:
3. Assuming that there is no chance of an audit by the tax authorities, would you choose to be audited on your own initiative?
a. Yes
b. No
4. Fine:
Hidden to the User
5. Display a fine to the user (if any):
6. The payment of Stage 3 is equal to:
Tax compliance level of participant in Stage 3 is equal to the ratio of: (Hidden to user)
End of Stage 3
References
- Alm, J.; Cherry, T.; Jones, M.; McKee, M. Taxpayer information assistance services and tax compliance behavior. Journal of Economic Psychology 2010, 31, 577–586. [Google Scholar] [CrossRef]
- Alm, J.; Cherry, T.; Jones, M.; McKee, M. Encouraging filing via tax credits and social safety nets. The IRS Research Bulletin: Proceedings of the 2008 IRS Research Conference 2008, 43–57. [Google Scholar]
- Friedland, N.; Maital, S.; Rutenberg, A. A simulation study of income tax evasion. Journal of Public Economics 1978, 10, 107–116. [Google Scholar] [CrossRef]
- Torgler, B. Speaking to theorists and searching for facts: Tax morale and tax compliance in experiments. Journal of Economic Surveys 2002, 16, 657–683. [Google Scholar] [CrossRef]
- Kleven, H.J.; Knudsen, M.B.; Kreiner, C.T.; Pedersen, S.; Saez, E. Unwilling or unable to cheat? Evidence from a tax audit experiment in Denmark. Econometrica 2011, 79, 651–692. [Google Scholar]
- Castro, L.; Scartascini, C. Tax Compliance and Enforcement in the Pampas. Evidence from a Field Experiment. Inter-American Development Bank Working Paper Series, Washington, DC, Inter-American Development Bank, 2013. [Google Scholar]
- Doerrenberg, P.; Schmitz, J. Tax compliance and information provision—A field experiment with small firms. ZEW-Centre for European Economic Research Discussion Paper 2015, 15-028. [Google Scholar] [CrossRef]
- Mascagni, G. From the lab to the field: A review of tax experiments. Journal of Economic Surveys 2018, 32, 273–301. [Google Scholar] [CrossRef]
- Allingham, M.G.; Sandmo, A. Income tax evasion: A theoretical analysis. Journal of Public Economics 1972, 1, 323–338. [Google Scholar] [CrossRef]
- Slemrod, J.; Blumenthal, M.; Christian, C. Taxpayer response to an increased probability of audit: Evidence from a controlled experiment in Minnesota. Journal of Public Economics 2001, 79, 455–483. [Google Scholar] [CrossRef]
- Gangl, K.; Torgler, B.; Kirchler, E.; Hofmann, E. Effects of supervision on tax compliance: Evidence from a field experiment in Austria. Economics Letters 2014, 123, 378–382. [Google Scholar] [CrossRef]
- Choo, L.; Fonseca, M.A.; Myles, G. Lab experiment to investigate tax compliance: Audit strategies and messaging. HM Revenue and Customs Research 2013, 308. [Google Scholar]
- Alm, J.; Sanchez, I.; De Juan, A. Economic and noneconomic factors in tax compliance. KYKLOS-BERNE 1995, 48, 3–3. [Google Scholar] [CrossRef]
- De Juan, A.; Lasheras, M.A.; Mayo, R. Voluntary compliance and behavior of Spanish taxpayers. Instituto de Estudios Fiscales, Madrid, Spain, 1993. [Google Scholar]
- Frey, B.S.; Torgler, B. Tax morale and conditional cooperation. Journal of Comparative Economics 2007, 35, 136–159. [Google Scholar] [CrossRef]
- Blaufus, K.; Bob, J.; Otto, P.E.; Wolf, N. The effect of tax privacy on tax compliance—An experimental investigation. European Accounting Review 2017, 26, 561–580. [Google Scholar] [CrossRef]
- Bühren, C.; Kundt, T.C. Does the level of work effort influence tax evasion? Experimental evidence. Review of Economics 2014, 65, 137–158. [Google Scholar] [CrossRef]
- Coricelli, G.; Joffily, M.; Montmarquette, C.; Villeval, M.C. Cheating, emotions, and rationality: an experiment on tax evasion. Experimental Economics 2010, 13, 226–247. [Google Scholar] [CrossRef]
- Fortin, B.; Lacroix, G.; Villeval, M.C. Tax evasion and social interactions. Journal of Public Economics 2007, 91, 2089–2112. [Google Scholar] [CrossRef]
- Giese, S.; Hoffmann, A. Tax evasion and risky investments in an intertemporal context: An experimental study. SFB 373 Discussion Paper 2000. [Google Scholar]
- Pántya, J.; Kovács, J.; Kogler, C.; Kirchler, E. Work performance and tax compliance in flat and progressive tax systems. Journal of Economic Psychology 2016, 56, 262–273. [Google Scholar] [CrossRef]
- Bloomquist, K.M. A comparative analysis of reporting compliance behavior in laboratory experiments and random taxpayer audits. Proceedings. Annual Conference on Taxation and Minutes of the Annual Meeting of the National Tax Association 2009, 102, 113–122. [Google Scholar]
- Chateauneuf, A.; Eichberger, J.; Grant, S. Choice under uncertainty with the best and worst in mind: Neo-additive capacities. Journal of Economic Theory 2007, 137, 538–567. [Google Scholar] [CrossRef]
- Andreoni, J.; Erard, B.; Feinstein, J. Tax compliance. Journal of Economic Literature 1998, 36, 818–860. [Google Scholar]
- Alm, J.; McClelland, G.H.; Schulze, W.D. Why do people pay taxes? Journal of Public Economics 1992, 48, 21–38. [Google Scholar] [CrossRef]
- Myles, G.D.; Naylor, R.A. A model of tax evasion with group conformity and social customs. European Journal of Political Economy 1996, 12, 49–66. [Google Scholar] [CrossRef]
- Alm, J.; Jackson, B.; McKee, M. Institutional uncertainty and taxpayer compliance. The American Economic Review 1992, 82, 1018–1026. [Google Scholar]
- Dhami, S.; Al-Nowaihi, A. Why do people pay taxes? Prospect theory versus expected utility theory. Journal of Economic Behavior & Organization 2007, 64, 171–192. [Google Scholar]
- Hallsworth, M. The use of field experiments to increase tax compliance. Oxford Review of Economic Policy 2014, 30, 658–679. [Google Scholar] [CrossRef]
- Dell’Anno, R. Tax evasion, tax morale and policy maker’s effectiveness. The Journal of Socio-Economics 2009, 38, 988–997. [Google Scholar] [CrossRef]
- Blumenthal, M.; Christian, C.; Slemrod, J. Do normative appeals affect tax compliance? Evidence from a controlled experiment in Minnesota. National Tax Journal 2001, 54, 125–138. [Google Scholar] [CrossRef]
- Torgler, B. A field experiment in moral suasion and tax compliance focusing on underdeclaration and overdeduction. FinanzArchiv/Public Finance Analysis 2013, 393–411. [Google Scholar] [CrossRef]
- Fellner, G.; Sausgruber, R.; Traxler, C. Testing enforcement strategies in the field: Threat, moral appeal and social information. Journal of the European Economic Association 2013, 11, 634–660. [Google Scholar] [CrossRef]
- Simpson, S.S.; Koper, C.S. Deterring corporate crime. Criminology 1992, 30, 347–376. [Google Scholar] [CrossRef]
- Braithwaite, V.; Braithwaite, J.; et al. An evolving compliance model for tax enforcement. In Crimes of Privilege: Readings in White-Collar Crime; Oxford University Press: 2001.
- Yitzhaki, S. A note on income tax evasion: A theoretical approach. Journal of Public Economics 1974, 3, 201–202. [Google Scholar] [CrossRef]
- Slemrod, J. Cheating ourselves: The economics of tax evasion. Journal of Economic Perspectives 2007, 21, 25–48. [Google Scholar] [CrossRef]
- DeBacker, J.; Heim, B.T.; Tran, A. Importing corruption culture from overseas: Evidence from corporate tax evasion in the United States. Journal of Financial Economics 2015, 117, 122–138. [Google Scholar] [CrossRef]
- Kosonen, T.; Ropponen, O. The role of information in tax compliance: Evidence from a natural field experiment. Economics Letters 2015, 129, 18–21. [Google Scholar] [CrossRef]
- Singhal, M.; Pomeranz, D.D.; Carrillo, P. Dodging the Taxman: Firm Misreporting and Limits to Tax Enforcement. 2015.
- Slemrod, J.; Collins, B.; Hoopes, J.L.; Reck, D.; Sebastiani, M. Does credit-card information reporting improve small-business tax compliance? Journal of Public Economics 2017, 149, 1–19. [Google Scholar] [CrossRef]
- Pomeranz, D. No taxation without information: Deterrence and self-enforcement in the value-added tax. American Economic Review 2015, 105, 2539–2569. [Google Scholar] [CrossRef]
- Becker, G.S. Crime and punishment: An economic approach. In The Economic Dimensions of Crime; Springer: 1968, pp. 13–68.
- Slemrod, J. The economics of corporate tax selfishness. National Tax Journal 2004, 57, 877–899. [Google Scholar] [CrossRef]
- Crocker, K.J.; Slemrod, J. Corporate tax evasion with agency costs. Journal of Public Economics 2005, 89, 1593–1610. [Google Scholar] [CrossRef]
- Hanlon, M.; Mills, L.F.; Slemrod, J.B. An empirical examination of corporate tax noncompliance. Ross School of Business Paper 2005, 1025. [Google Scholar] [CrossRef]
- Spicer, M.W.; Thomas, J.E. Audit probabilities and the tax evasion decision: An experimental approach. Journal of Economic Psychology 1982. [Google Scholar] [CrossRef]
- Roth, A.E. Introduction to experimental economics. The Handbook of Experimental Economics 1995, 1, 3–109. [Google Scholar]
- Spicer, M.W.; Hero, R.E. Tax evasion and heuristics: A research note. Journal of Public Economics 1985, 26, 263–267. [Google Scholar] [CrossRef]
- Beck, P.J.; Davis, J.S.; Jung, W.O. Experimental evidence on taxpayer reporting under uncertainty. Accounting Review 1991, 535–558. [Google Scholar]
- Slemrod, J.; Weber, C. Evidence of the invisible: Toward a credibility revolution in the empirical analysis of tax evasion and the informal economy. International Tax and Public Finance 2012, 19, 25–53. [Google Scholar] [CrossRef]
- Ortega, D.; Scartascini, C. Don’t blame the messenger: A field experiment on delivery methods for increasing tax compliance. IDB Working Paper No. IDB-WP-627 2015.
- Mogollon, M.; Ortega, D.; Scartascini, C. Who’s calling? The effect of phone calls and personal interaction on tax compliance. International Tax and Public Finance 2021, 28, 1302–1328. [Google Scholar] [CrossRef]
- Del Carpio, L. Are the Neighbors Cheating? Evidence from a Social Norm Experiment on Property Taxes in Peru. Job Market Paper 2013. [Google Scholar]
- Dunning, T.; Monestier, F.; Pineiro, R.; Rosenblatt, F.; Tunón, G. Is paying taxes habit forming? Experimental evidence from Uruguay. Unpublished paper 2016. [Google Scholar]
- Vogel, J. Taxation and public opinion in Sweden: An interpretation of recent survey data. National Tax Journal 1974, 27, 499–513. [Google Scholar] [CrossRef]
- Onu, D.; Oats, L. “Paying tax is part of life”: Social norms and social influence in tax communications. Journal of Economic Behavior & Organization 2016, 124, 29–42. [Google Scholar]
- Torgler, B. Behavioral taxation: Opportunities and challenges. CREMA Working Paper 2021. [Google Scholar] [CrossRef]
- Torgler, B. Moral suasion: An alternative tax policy strategy? Evidence from a controlled field experiment in Switzerland. Economics of Governance 2004, 5, 235–253. [Google Scholar] [CrossRef]
- Koessler, A.K.; Torgler, B.; Feld, L.P.; Frey, B.S. Commitment to pay taxes: Results from field and laboratory experiments. European Economic Review 2019, 115, 78–98. [Google Scholar] [CrossRef]
- Dwenger, N.; Kleven, H.; Rasul, I.; Rincke, J. Extrinsic and intrinsic motivations for tax compliance: Evidence from a field experiment in Germany. American Economic Journal: Economic Policy 2016, 8, 203–232. [Google Scholar] [CrossRef]
- De Neve, J.E.; Imbert, C.; Spinnewijn, J.; Tsankova, T.; Luts, M. How to improve tax compliance? Evidence from population-wide experiments in Belgium. Journal of Political Economy 2021, 129, 1425–1463. [Google Scholar] [CrossRef]
- Cummings, R.G.; Martinez-Vazquez, J.; McKee, M.; Torgler, B. Tax morale affects tax compliance: Evidence from surveys and an artefactual field experiment. Journal of Economic Behavior & Organization 2009, 70, 447–457. [Google Scholar]
- Hallsworth, M.; List, J.A.; Metcalfe, R.D.; Vlaev, I. The behavioralist as tax collector: Using natural field experiments to enhance tax compliance. Journal of Public Economics 2017, 148, 14–31. [Google Scholar] [CrossRef]
- Battiston, P.; Gamba, S. The impact of social pressure on tax compliance: A field experiment. International Review of Law and Economics 2016, 46, 78–85. [Google Scholar] [CrossRef]
- Dong, S.X.; Sinning, M. Trying to make a good first impression: A natural field experiment to engage new entrants to the tax system. Journal of Behavioral and Experimental Economics 2022, 100, 101900. [Google Scholar] [CrossRef]
- Djawadi, B.M.; Fahr, R. The impact of tax knowledge and budget spending influence on tax compliance. IZA Discussion Papers 2013. [Google Scholar] [CrossRef]
- Torgler, B. Beyond punishment: A tax compliance experiment with taxpayers in Costa Rica. Revista de Análisis Económico 2003, 18. [Google Scholar]
- Holz, J.E.; List, J.A.; Zentner, A.; Cardoza, M.; Zentner, J.E. The $100 million nudge: Increasing tax compliance of firms using a natural field experiment. Journal of Public Economics 2023, 218, 104779. [Google Scholar] [CrossRef]
- Belnap, A.; Welsch, A.; Williams, B. Remote tax authority. Journal of Accounting and Economics 2023, 75, 101570. [Google Scholar] [CrossRef]
- Wenzel, M. Misperceptions of social norms about tax compliance: From theory to intervention. Journal of Economic Psychology 2005, 26, 862–883. [Google Scholar] [CrossRef]
- Chirico, M.; Inman, R.P.; Loeffler, C.; MacDonald, J.; Sieg, H. An experimental evaluation of notification strategies to increase property tax compliance: Free-riding in the city of brotherly love. Tax Policy and the Economy 2016, 30, 129–161. [Google Scholar] [CrossRef]
- Zucco, C.; Lenz, A.K.; Goldszmidt, R.; Valdivia, M. Face-to-face vs. virtual assistance to entrepreneurs: Evidence from a field experiment in Brazil. Economics Letters 2020, 188, 108922. [Google Scholar] [CrossRef]
- Bott, K.M.; Cappelen, A.W.; Sørensen, E.Ø.; Tungodden, B. You’ve got mail: A randomized field experiment on tax evasion. Management Science 2020, 66, 2801–2819. [Google Scholar] [CrossRef]
- Robitaille, N.; House, J.; Mazar, N. Effectiveness of planning prompts on organizations’ likelihood to file their overdue taxes: A multi-wave field experiment. Management Science 2021, 67, 4327–4340. [Google Scholar] [CrossRef]
- Gemmell, N.; Ratto, M. The effects of penalty information on tax compliance: Evidence from a New Zealand field experiment. National Tax Journal 2018, 71, 547–588. [Google Scholar] [CrossRef]
- Hessing, D.J.; Elffers, H.; Robben, H.S.J.; Webley, P. Needy or greedy? The social psychology of individuals who fraudulently claim unemployment benefits. Journal of Applied Social Psychology 1993, 23, 226–243. [Google Scholar] [CrossRef]
- Kamleitner, B.; Korunka, C.; Kirchler, E. Tax compliance of small business owners: A review. International Journal of Entrepreneurial Behavior & Research, 2012. [Google Scholar]
- Ostapenko, N.; Williams, C.C. Determinants of entrepreneurs’ views on the acceptability of tax evasion and the informal economy in Slovakia and Ukraine: An institutional asymmetry approach. International Journal of Entrepreneurship and Small Business 2016, 28, 275–289. [Google Scholar] [CrossRef]
- Choo, C.Y.L.; Fonseca, M.A.; Myles, G.D. Do students behave like real taxpayers in the lab? Evidence from a real effort tax compliance experiment. Journal of Economic Behavior & Organization 2016, 124, 102–114. [Google Scholar]
- Slemrod, J. A general model of the behavioral response to taxation. International Tax and Public Finance 2001, 8, 119–128. [Google Scholar] [CrossRef]
- Maslow, A.H. Motivation and personality. New York: Harp and Row 1970.
- Chetty, R.; Finkelstein, A. Public economics. NBER Reporter 2020, 1, 1–6. [Google Scholar]
- Slemrod, J. Tax compliance and enforcement. Journal of Economic Literature 2019, 57, 904–954. [Google Scholar] [CrossRef]
- Scott, W.R. Institutions and organizations: Ideas, interests, and identities. Sage Publications 2013. [Google Scholar]
- Cooney, M.T.; Selmer, R.; Lindman, A.; Tverdal, A.; Menotti, A.; Thomsen, T.; DeBacker, G.; De Bacquer, D.; Tell, G.S.; Njolstad, I.; et al. Cardiovascular risk estimation in older persons: SCORE OP. European Journal of Preventive Cardiology 2016, 23, 1093–1103. [Google Scholar] [CrossRef]
- Antinyan, A.; Asatryan, Z. Nudging for tax compliance: A meta-analysis. ZEW-Centre for European Economic Research Discussion Paper 2019, 19-055. [Google Scholar] [CrossRef]
- Alm, J.; Malézieux, A. 40 years of tax evasion games: A meta-analysis. Experimental Economics 2021, 24, 699–750. [Google Scholar] [CrossRef]
- Thatcher, J.; Alao, H.; Brown, C.J.; Choudhary, S. Enriching the values of micro and small business research projects: Co-creation service provision as perceived by academic, business, and student. Studies in Higher Education 2016, 41, 560–581. [Google Scholar] [CrossRef]
- Thornton, J.C.; Byrd, J.T. Social responsibility and the small business. Academy of Entrepreneurship Journal 2013, 19, 41. [Google Scholar]
- Habib, A.; Jiang, H. Corporate governance and financial reporting quality in China: A survey of recent evidence. Journal of International Accounting, Auditing and Taxation 2015, 24, 29–45. [Google Scholar] [CrossRef]
- Vlachos, V.A.; Bitzenis, A. Tax compliance of small enterprises in Greece. International Journal of Entrepreneurship and Small Business 2016, 28, 380–389. [Google Scholar] [CrossRef]
- Casal, S.; Kogler, C.; Mittone, L.; Kirchler, E. Tax compliance depends on the voice of taxpayers. Journal of Economic Psychology 2016, 56, 141–150. [Google Scholar] [CrossRef]
- Bazart, C.; Bonein, A. Reciprocal relationships in tax compliance decisions. Journal of Economic Psychology 2014, 40, 83–102. [Google Scholar] [CrossRef]
- Engel, C.; Mittone, L.; Morreale, A. Tax morale and fairness in conflict: An experiment. Journal of Economic Psychology 2020, 81, 102314. [Google Scholar] [CrossRef]
- Fochmann, M.; Müller, N.; Overesch, M. Less cheating? The effects of prefilled forms on compliance behavior. Journal of Economic Psychology 2021, 83, 102365. [Google Scholar] [CrossRef]
- Smith, J.T. The broken bridge of public finance: Majority rule, earmarked taxes, and social engineering. Public Choice 2020, 183, 315–338. [Google Scholar]
- Feld, L.P., & Frey, B.S. (2007). Tax compliance as the result of a psychological tax contract: The role of incentives and responsive regulation. *Law & Policy, 29*(1), 102–120. [CrossRef]
- Bargain, O.; Dolls, M.; Immervoll, H.; Neumann, D.; Peichl, A.; Pestel, N.; Siegloch, S. Tax policy and income inequality in the United States, 1979–2007. Economic Inquiry 2015, 53, 1061–1085. [Google Scholar] [CrossRef]
- Kirchler, E.; Hoelzl, E.; Wahl, I. Enforced versus voluntary tax compliance: The “slippery slope” framework. Journal of Economic Psychology 2008, 29, 210–225. [Google Scholar] [CrossRef]
- Kassa, E.T. Factors influencing taxpayers to engage in tax evasion: Evidence from Woldia City administration micro, small, and large enterprise taxpayers. Journal of Innovation and Entrepreneurship 2021, 10, 8. [Google Scholar] [CrossRef]
- Nagel, H.; Huber, L.R.; Van Praag, M.; Goslinga, S. The effect of a tax training program on tax compliance and business outcomes of starting entrepreneurs: Evidence from a field experiment. Journal of Business Venturing 2019, 34, 261–283. [Google Scholar] [CrossRef]
- Batrancea, L.M.; Nichita, A.; De Agostini, R.; Batista Narcizo, F.; Forte, D.; de Paiva Neves Mamede, S.; Roux-Cesar, A.M.; Nedev, B.; Vitek, L.; Pántya, J.; et al. A self-employed taxpayer experimental study on trust, power, and tax compliance in eleven countries. Financial Innovation 2022, 8, 96. [Google Scholar] [CrossRef]
- Kiconco, R.I.; Gwokyalya, W.; Sserwanga, A.; Balunywa, W. Tax compliance behaviour of small business enterprises in Uganda. Journal of Financial Crime 2019, 26, 1117–1132. [Google Scholar] [CrossRef]
- Dörrenberg, P.; Pfrang, A.; Schmitz, J. How to improve small firms’ payroll tax compliance? Evidence from a randomized field experiment. Evidence from a Randomized Field Experiment 2022. [Google Scholar] [CrossRef]
- Olsen, J.; Kasper, M.; Enachescu, J.; Benk, S.; Budak, T.; Kirchler, E. Emotions and tax compliance among small business owners: An experimental survey. International Review of Law and Economics 2018, 56, 42–52. [Google Scholar] [CrossRef]
- Schneider, F. The shadow economy and work in the shadow: What do we (not) know? IZA Discussion Paper 2012. [Google Scholar] [CrossRef]
- Halla, M. Tax morale and compliance behavior: First evidence on a causal link. The BE Journal of Economic Analysis & Policy 2012, 12. [Google Scholar]
- Plumley, A.H. The determinants of individual income tax compliance: Estimating the impacts of tax policy, enforcement, and IRS responsiveness. Harvard University 1996. [Google Scholar]
- Fiorio, C.V.; D’Amuri, F. Workers’ tax evasion in Italy. Giornale degli economisti e Annali di economia 2005, 247–270. [Google Scholar]
- Lois, P.; Drogalas, G.; Karagiorgos, A.; Chlorou, A. Tax compliance during fiscal depression periods: The case of Greece. EuroMed Journal of Business 2019, 14, 274–291. [Google Scholar] [CrossRef]
- Dubin, J.A. Criminal investigation enforcement activities and taxpayer noncompliance. Public Finance Review 2007, 35, 500–529. [Google Scholar] [CrossRef]
- Yoon, S.S.; Yoo, S.W.; Kim, J. Ambiguity, audit errors, and tax compliance. Asia-Pacific Journal of Accounting & Economics 2011, 18, 11–26. [Google Scholar]
- Livernois, J.; McKenna, C.J. Truth or consequences: Enforcing pollution standards with self-reporting. Journal of Public Economics 1999, 71, 415–440. [Google Scholar] [CrossRef]
- Snow, A.; Warren, R.S. Ambiguity about audit probability, tax compliance, and taxpayer welfare. Economic Inquiry 2005, 43, 865–871. [Google Scholar] [CrossRef]
- Kaplanoglou, G.; Rapanos, V.T. Why do people evade taxes? New experimental evidence from Greece. Journal of Behavioral and Experimental Economics 2015, 56, 21–32. [Google Scholar] [CrossRef]
- Razen, M.; Kupfer, A. The effect of tax transparency on consumer and firm behavior: Experimental evidence. Journal of Behavioral and Experimental Economics 2023, 104, 101990. [Google Scholar] [CrossRef]
- Alm, J.; Kasper, M. Using behavioural economics to understand tax compliance. Economic and Political Studies 2023, 11, 279–294. [Google Scholar] [CrossRef]
- Torres, L.B.; da Silveira, J.J.; Lima, G.T. To Comply or not to Comply: Persistent Heterogeneity in Tax Compliance and Macroeconomic Dynamics. FEA/USP 2022. [Google Scholar]
- Grundmann, S.; Lambsdorff, J.G. How income and tax rates provoke cheating—An experimental investigation of tax morale. Journal of Economic Psychology 2017, 63, 27–42. [Google Scholar] [CrossRef]
Figure 1.
Experimental procedure.
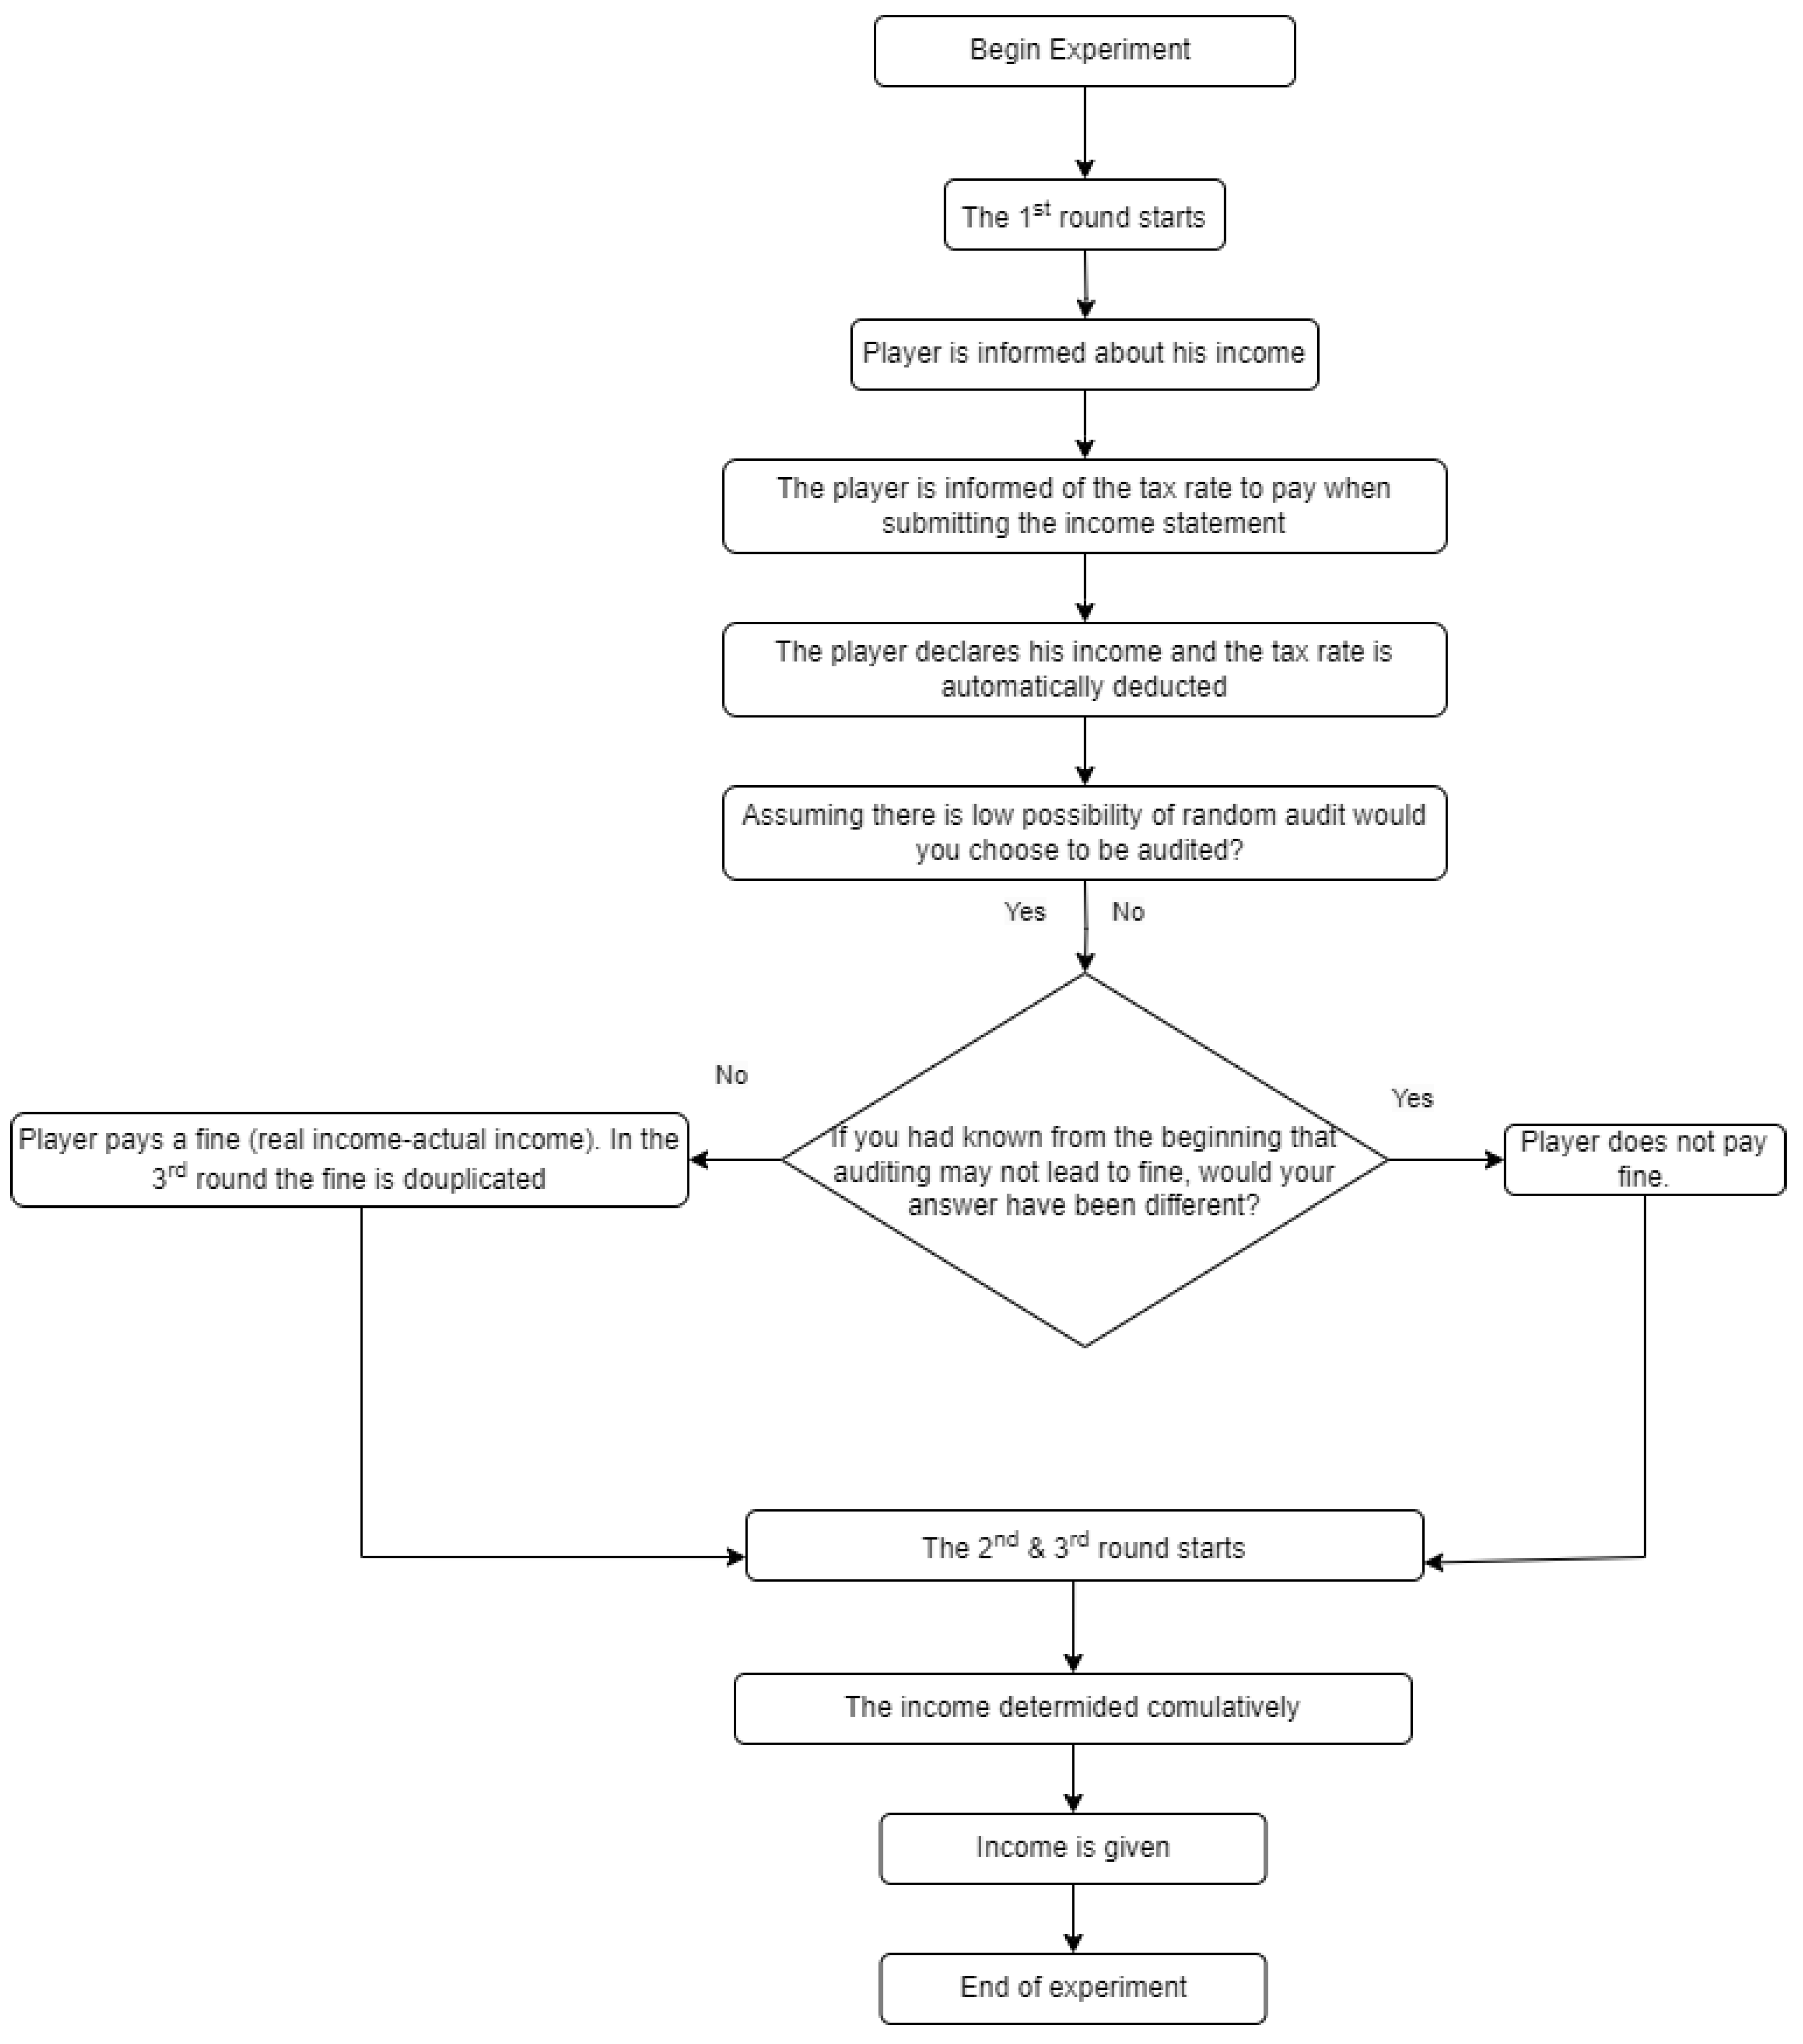
Figure 2.
Compliance rate by gender of business owner across stages.
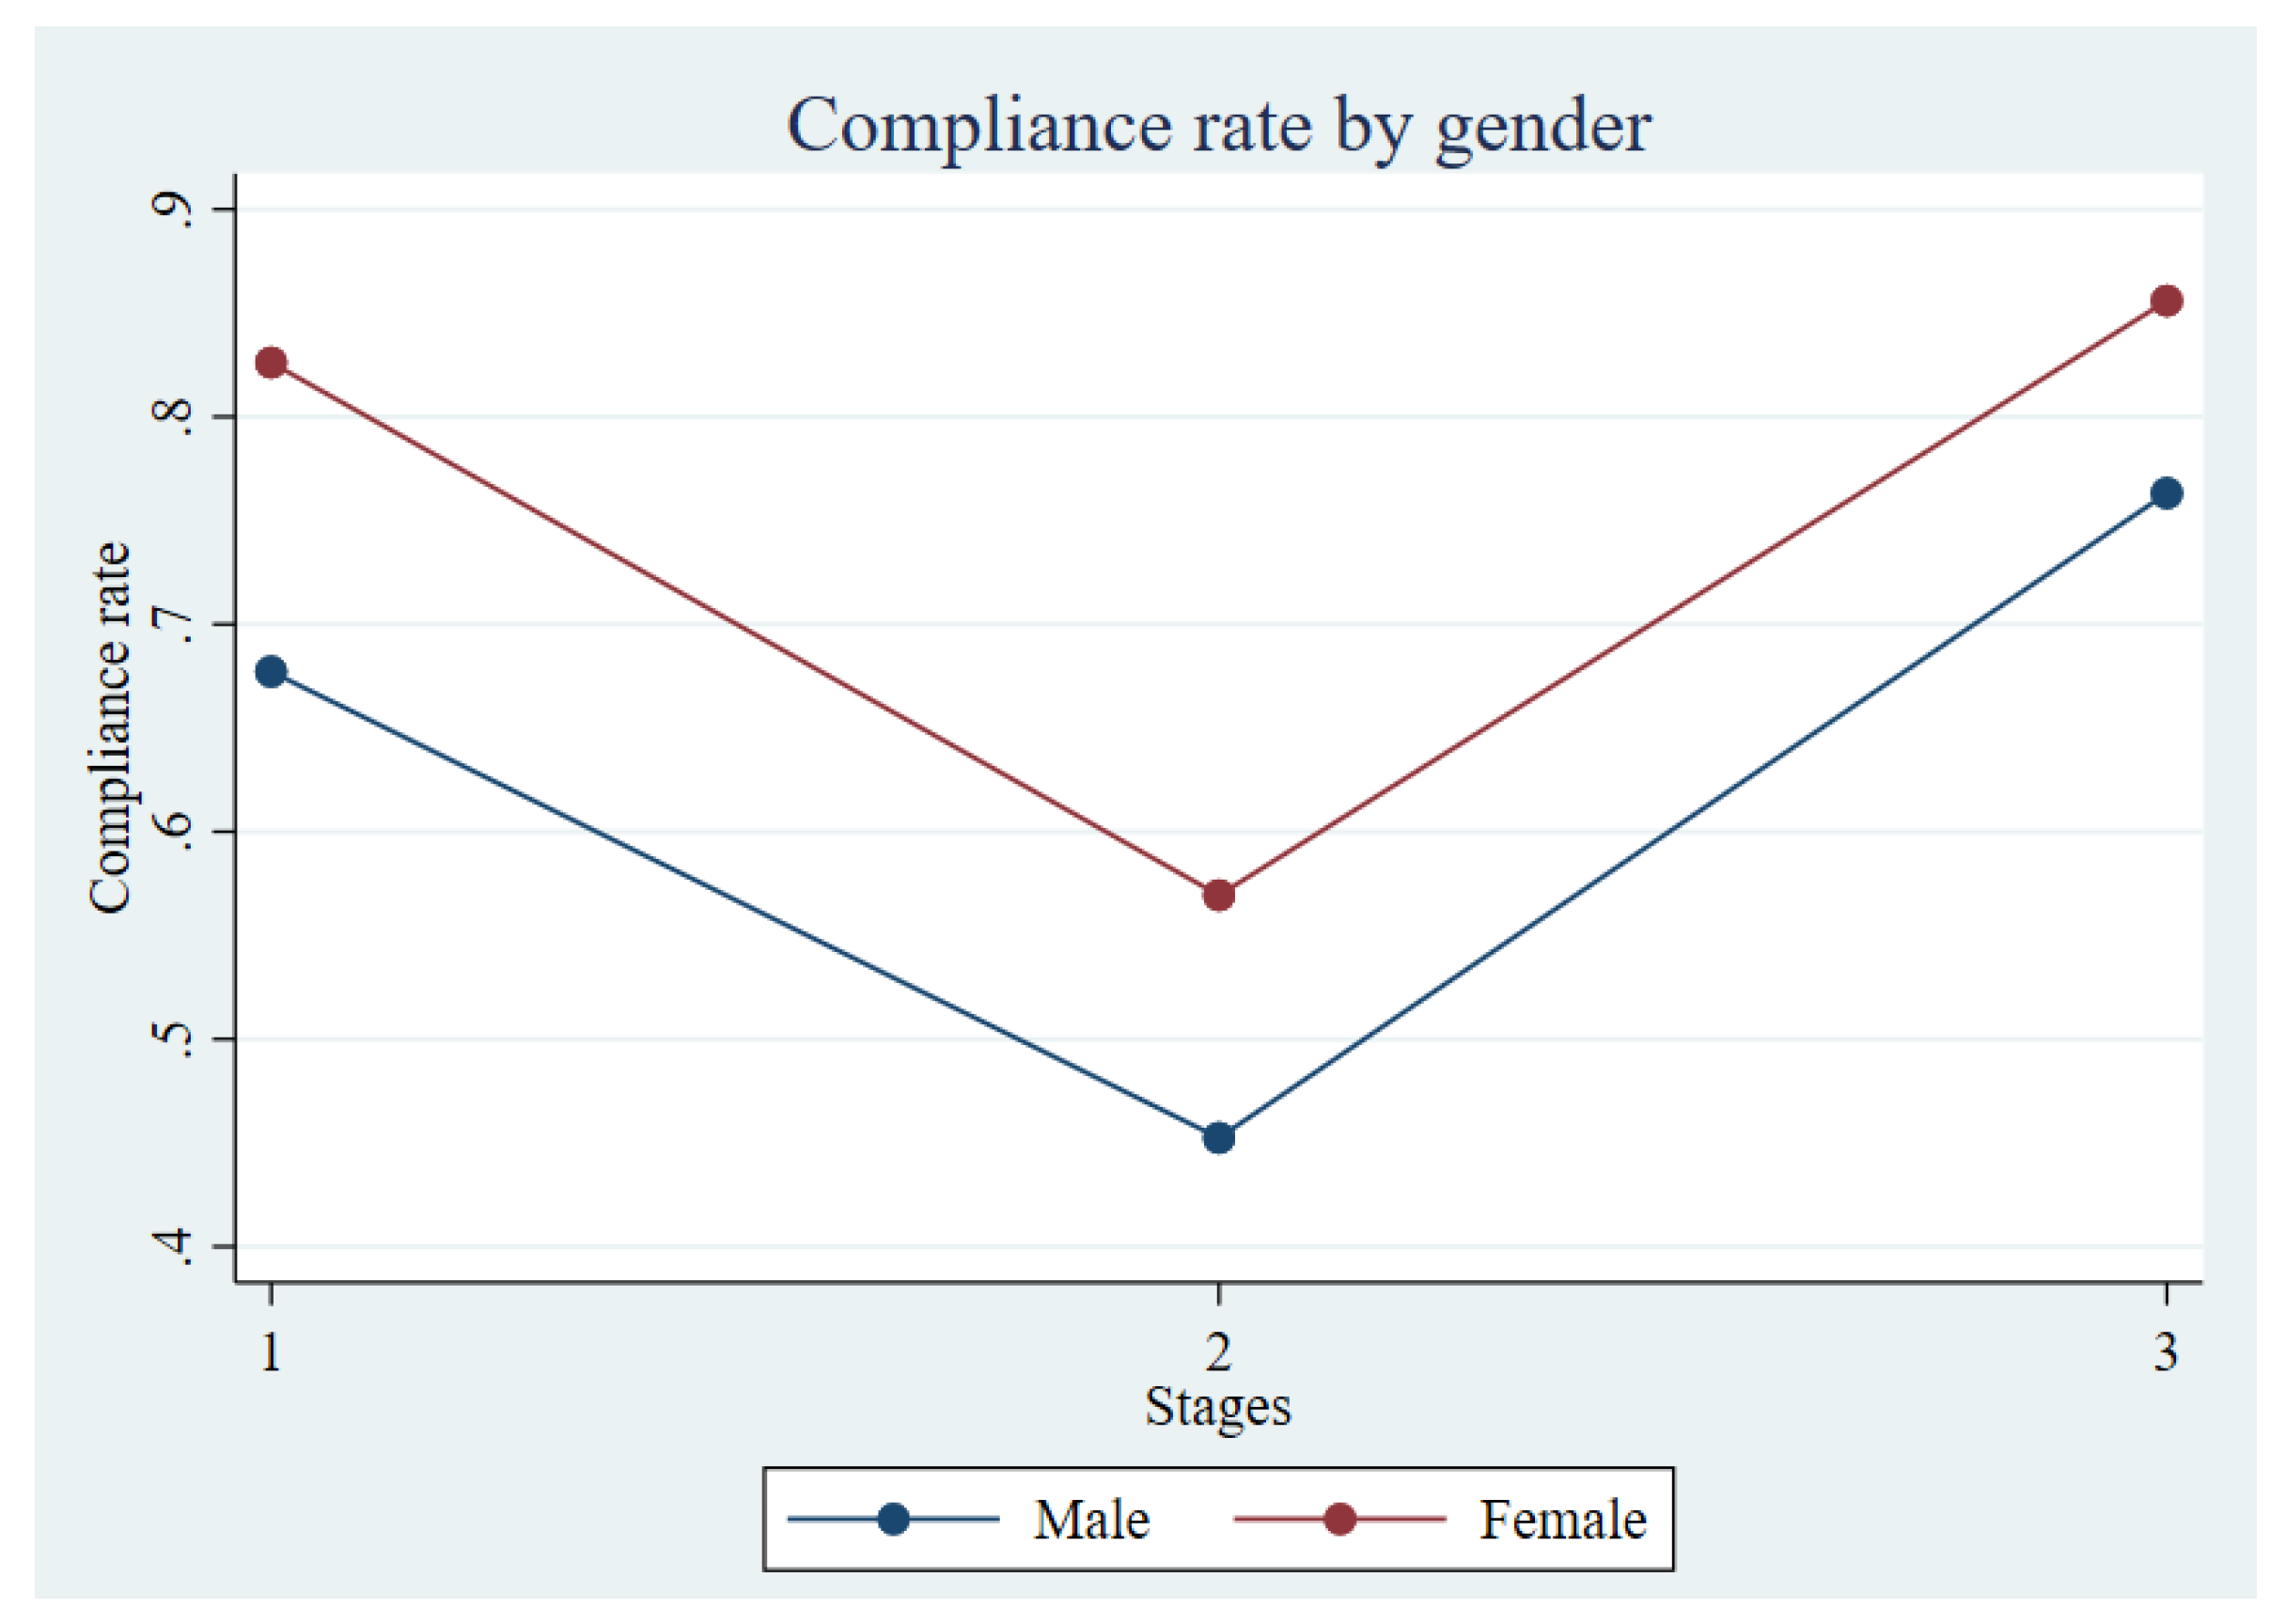
Figure 3.
Compliance rate per firms’ size across stages.
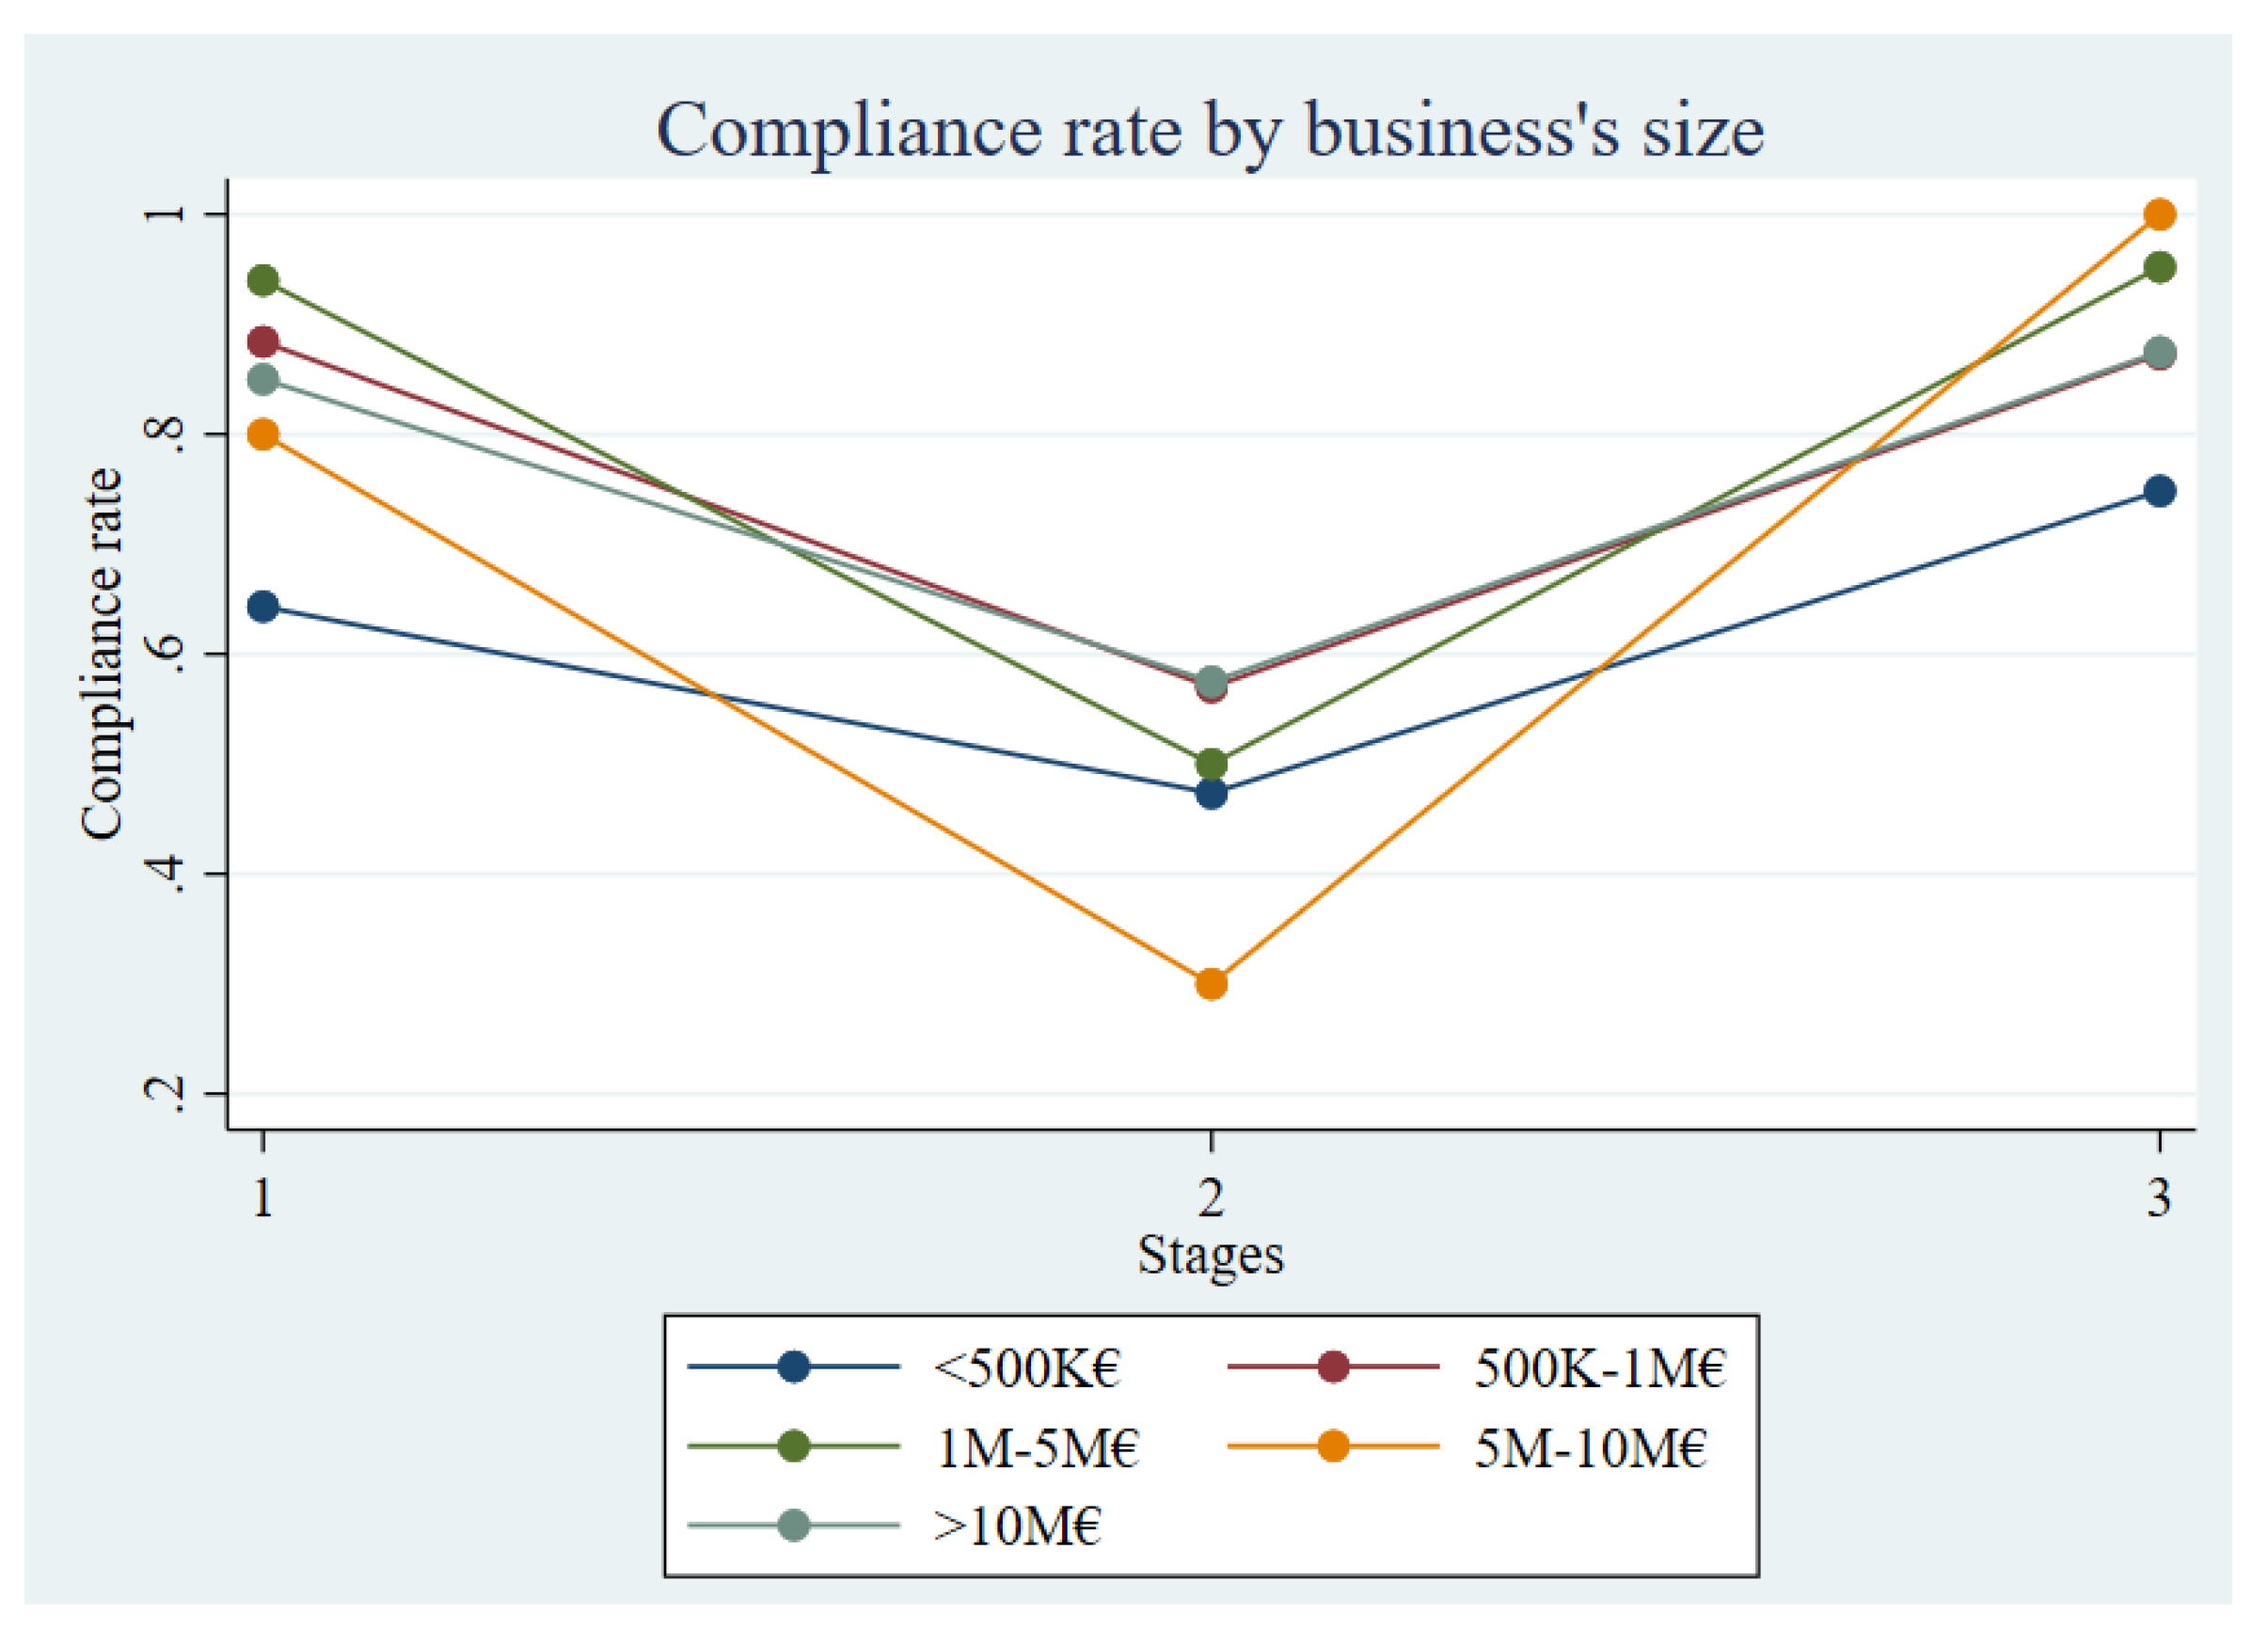
Figure 4.
Compliance rate by legal regime across stages.
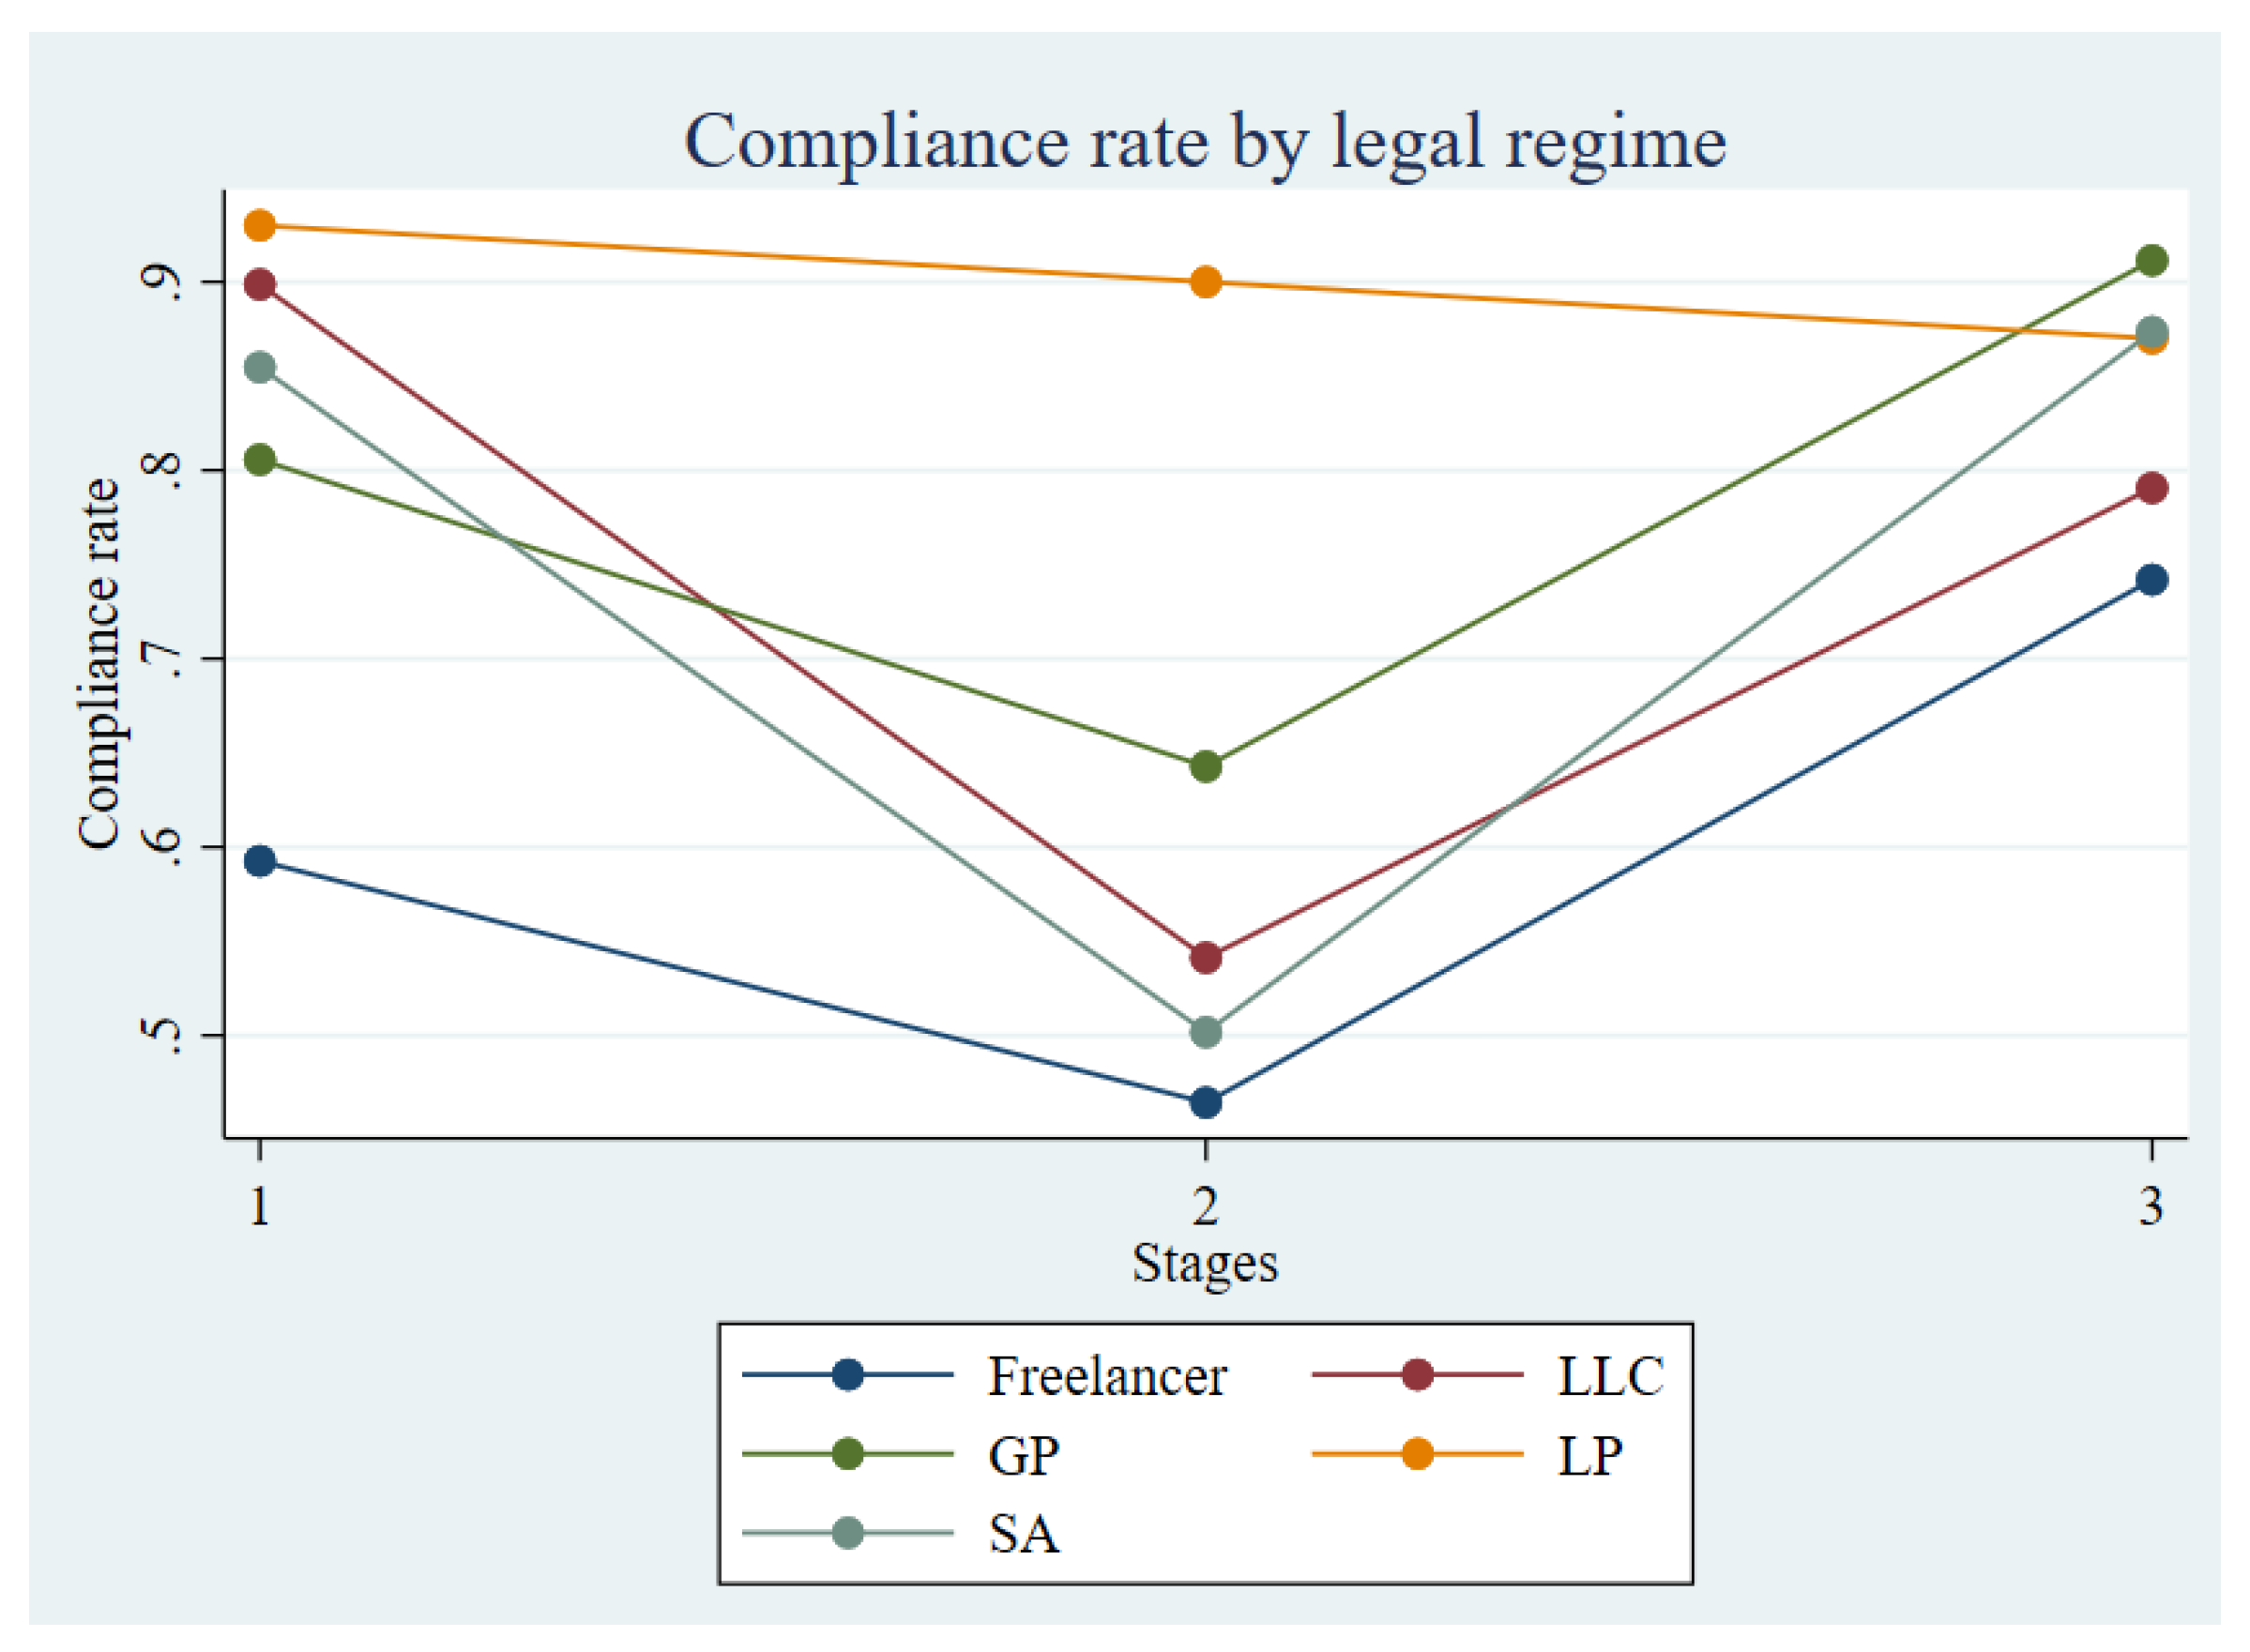
Figure 5.
Compliance rate per sector across stages.
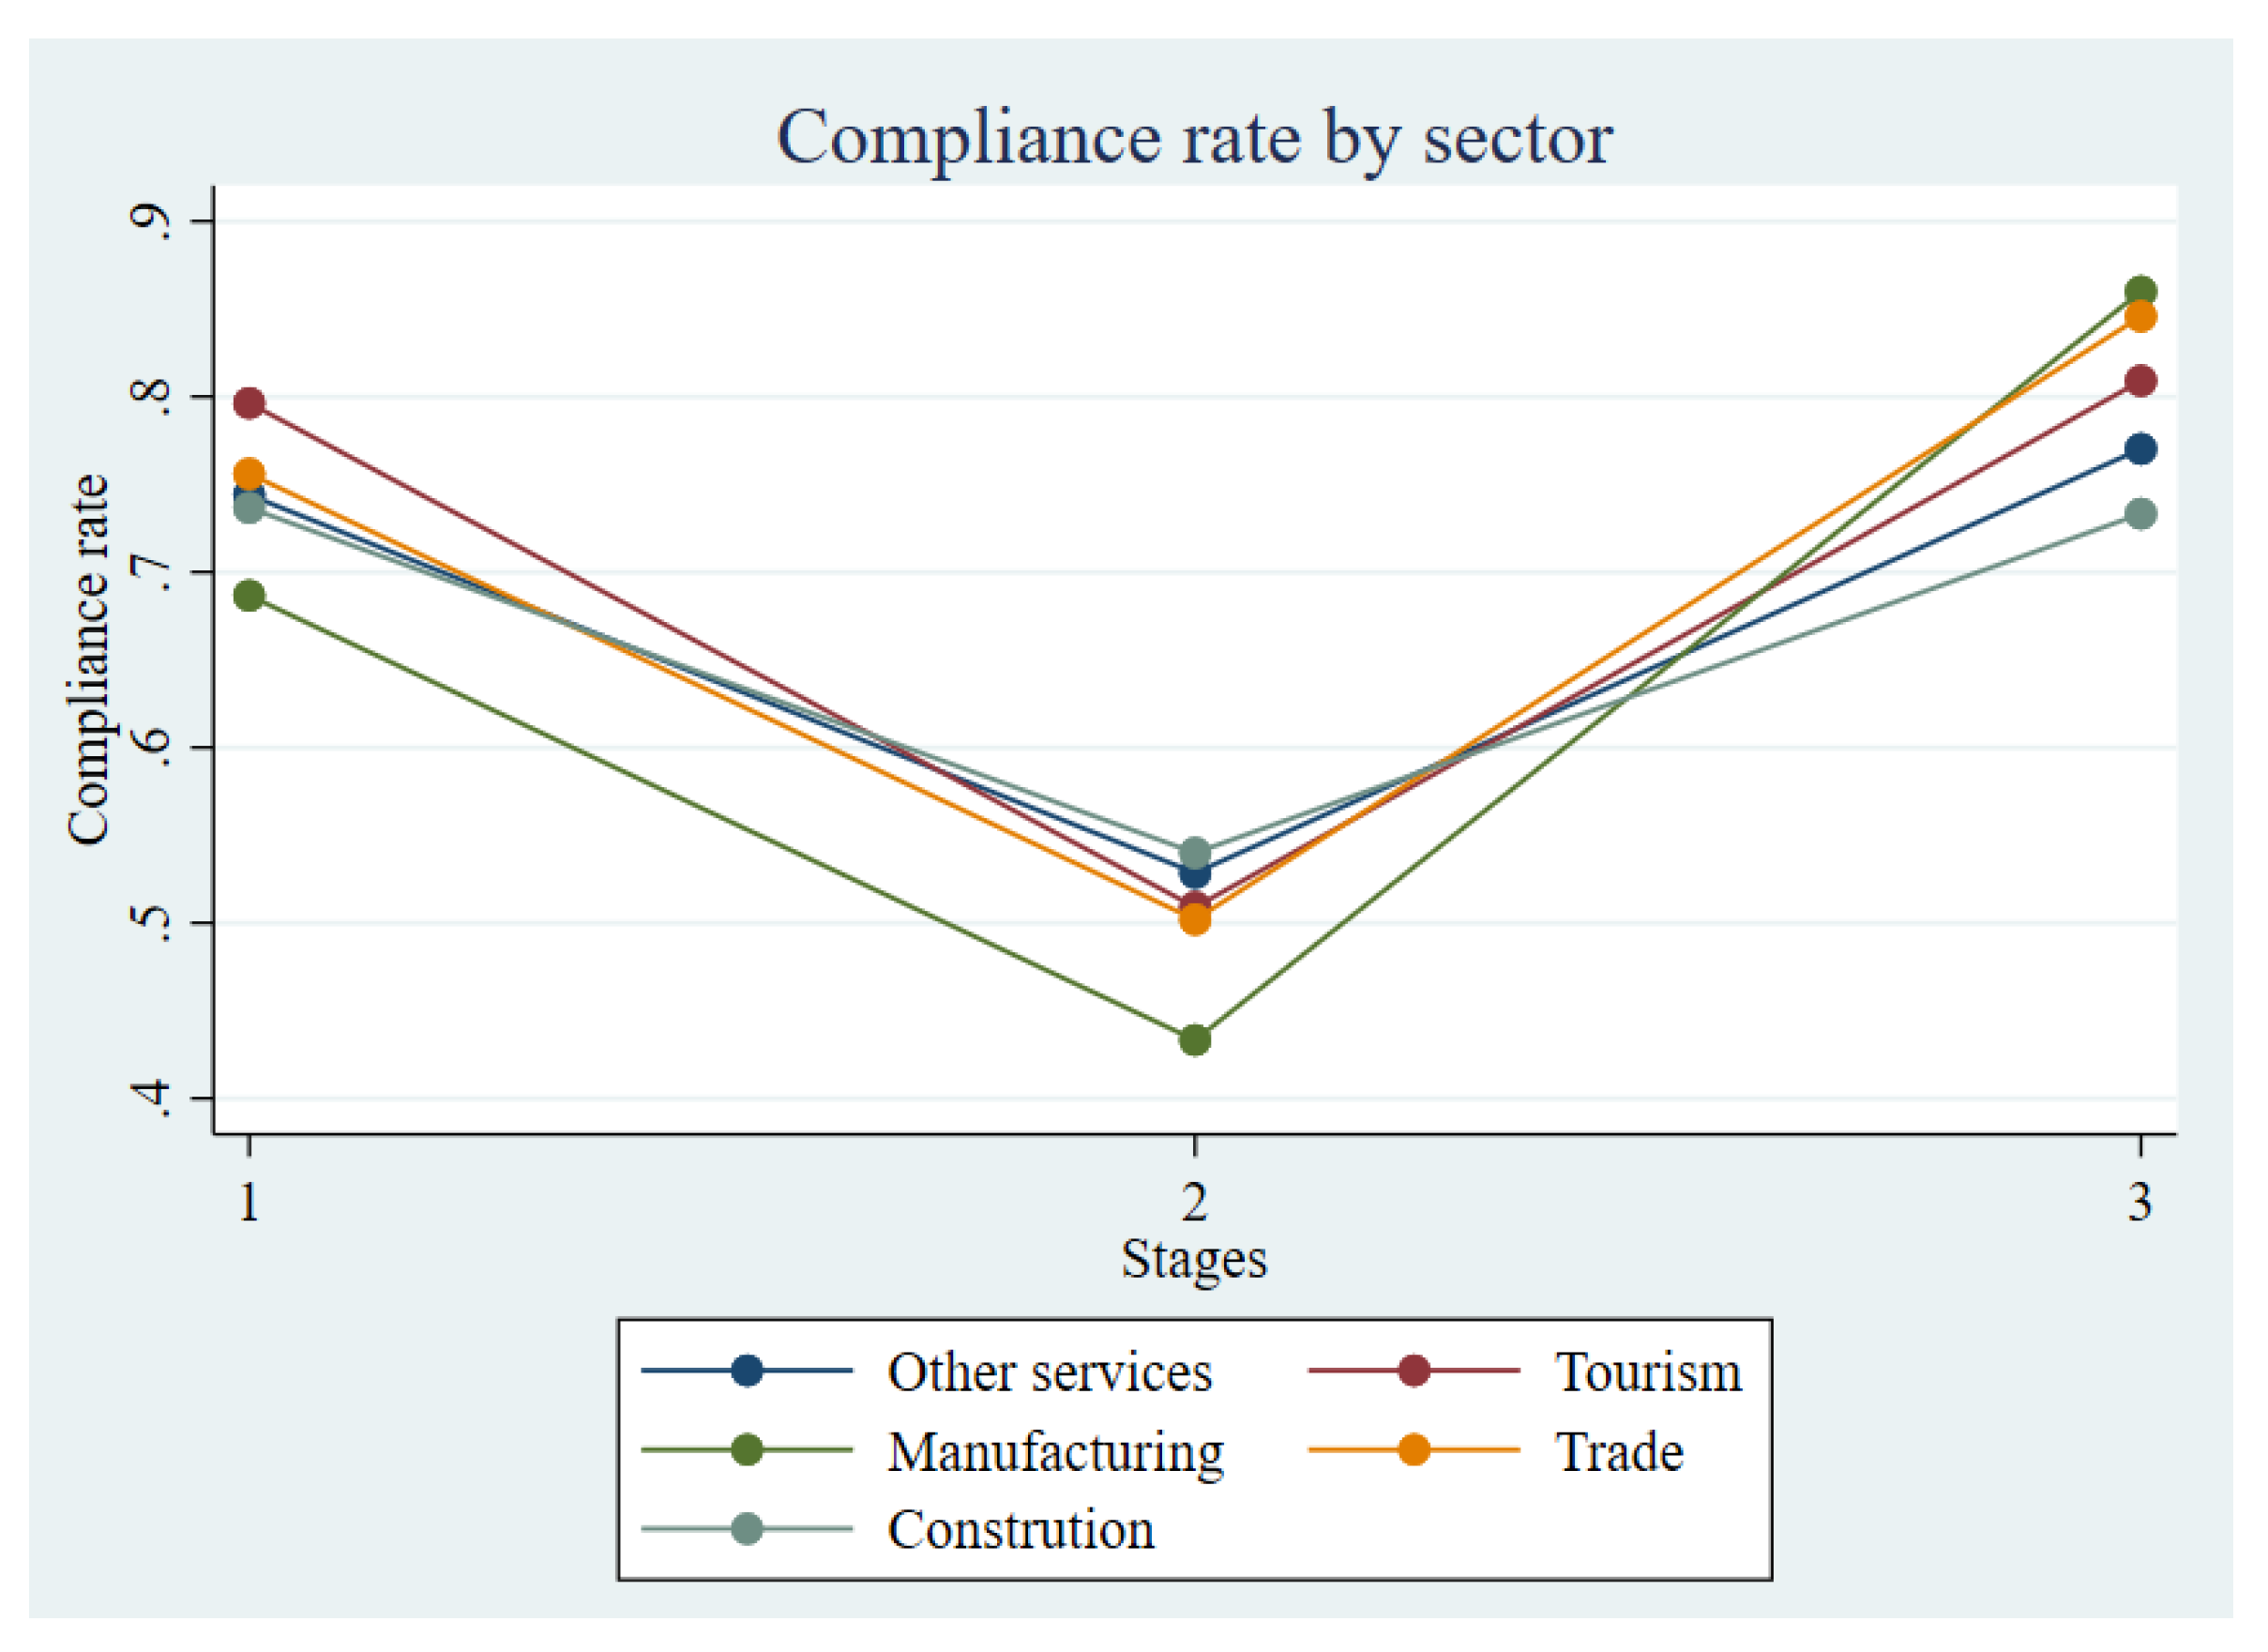
Figure 6.
Compliance rate by gender of business owner across stages
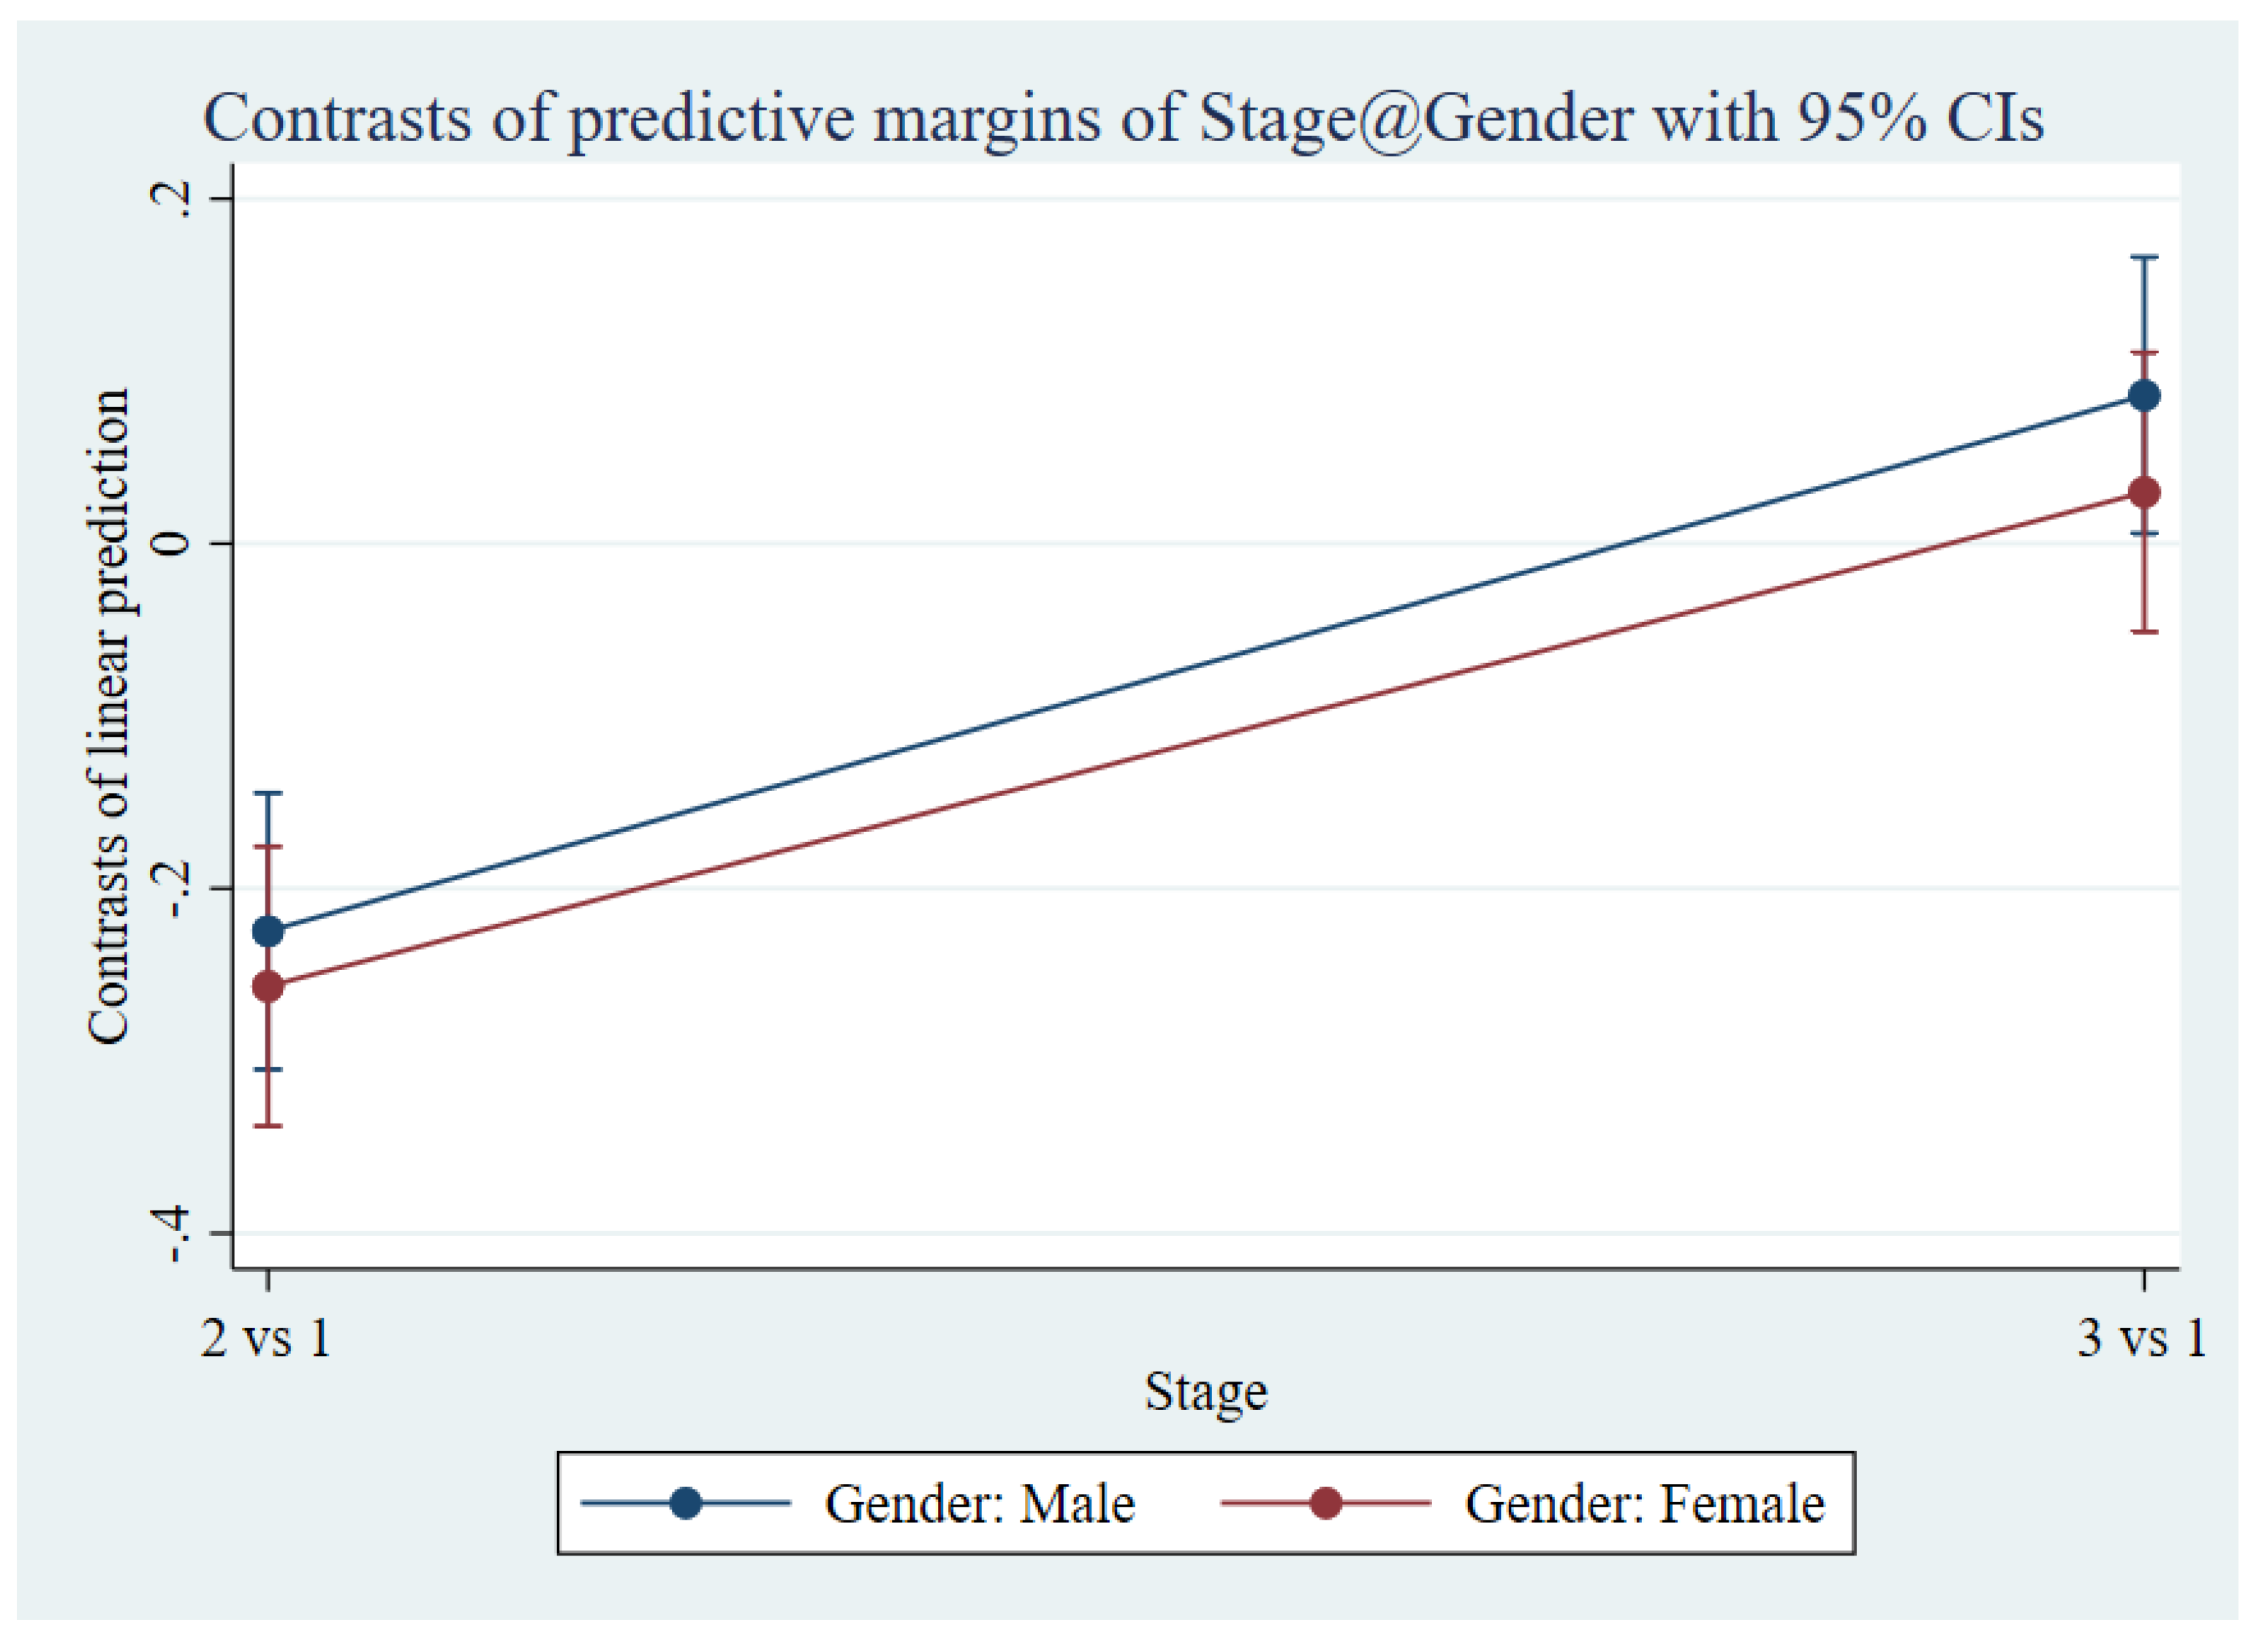
Table 1.
Research questions and objectives of the field experiment study.
| Research Questions | Objectives |
|---|---|
| RQ1: How do high tax rates, audit probabilities, and higher fines influence tax compliance? | Explore the effects of tax rates and the interplay between audit probabilities and fines on compliance levels, providing comprehensive mapping and categorization. |
| RQ2: How do gender differences and the size of an entity affect tax compliance behavior? | Investigate gender-specific compliance behaviors and the impact of a company’s size on its tax behavior, aiming to quantify differences and ascertain cause-and-effect relationships. |
| RQ3: What role does the legal status of a company play in its tax compliance and behavior? | Examine how different corporate legal statuses influence tax compliance rates, seeking to identify patterns that suggest lower or higher compliance levels among varying statuses. |
Table 2.
Experimental Design.
| Round | Tax Rate (%) | Probability of Audit (%) | Fine Multiplier |
|---|---|---|---|
| Round 1 | 5% | 10% | 1× Penalty |
| Round 2 | 47% | 5% | 1× Penalty |
| Round 3 | 25% | Unspecified | 2× Penalty |
Table 3.
Mean of Compliance Rate.
| Compliance Rate | Male | Female | |
|---|---|---|---|
| Round 1 | 0.74 | 0.67 | 0.81 |
| Round 2 | 0.50 | 0.44 | 0.57 |
| Round 3 | 0.81 | 0.76 | 0.85 |
Note: All variables data.
Table 4.
Correlation Matrix.
| Compliance rate | Gender | Sector | Legal Status | Assets | Danger | |
|---|---|---|---|---|---|---|
| Compliance rate | 1.0000 | |||||
| Gender | 0.2296* | 1.0000 | ||||
| (0.0001) | ||||||
| Sector | 0.0187 | 0.1792* | 1.0000 | |||
| (0.7488) | (0.0019) | |||||
| Legal Status | 0.2337* | 0.1412* | 0.0014 | 1.0000 | ||
| (0.0000) | (0.0148) | (0.9804) | ||||
| Assets | 0.2169* | 0.1901* | 0.0135 | 0.3852* | 1.0000 | |
| (0.0002) | (0.0010) | (0.8165) | (0.0000) | |||
| Danger | -0.2944* | -0.2193* | 0.0147 | -0.4367* | -0.3049* | 1.0000 |
| (0.0000) | (0.0001) | (0.8009) | (0.0000) | (0.0000) |
Note: Robust standard errors in parentheses. Significance levels: *** , ** , * .
Disclaimer/Publisher’s Note: The statements, opinions and data contained in all publications are solely those of the individual author(s) and contributor(s) and not of MDPI and/or the editor(s). MDPI and/or the editor(s) disclaim responsibility for any injury to people or property resulting from any ideas, methods, instructions or products referred to in the content. |
© 2025 by the authors. Licensee MDPI, Basel, Switzerland. This article is an open access article distributed under the terms and conditions of the Creative Commons Attribution (CC BY) license (http://creativecommons.org/licenses/by/4.0/).
Copyright: This open access article is published under a Creative Commons CC BY 4.0 license, which permit the free download, distribution, and reuse, provided that the author and preprint are cited in any reuse.


