
Submitted:
10 February 2025
Posted:
11 February 2025
You are already at the latest version
Abstract
Purpose: The present study aims to investigate superiority of TARE-Y90 in the treatment of liver metastases from colorectal cancer in comparison to DEBIRI and perform a parallel resource consumption study to demonstrate a possible favorable cost-effectiveness balance.
Material and Methods:
The number of included subjects in the study was 46 for TARE-Y90 and 56 in the DEBIRI group. Variables of interest in the study were collected for all selected subjects.
Time-to-endpoint outcomes (overall survival, time to progression and time to extra-hepatic progression) was calculated by Kaplan-Meier analysis and reported as a median with 95% confidence interval and compared between groups by log-rank testing. Survival analyses were performed using R package “survival” 3.5-7. Values for median time-to-event and 95% confidence intervals were calculated using bootstrapping.
Results:
The categorization into overall response (OR) and no overall response (NOR) revealed a higher percentage of overall responses in the DEBIRI group (52%) compared to TARE-Y90 (24%). The numerical differences observed in certain response categories did not reach statistical significance, indicating a comparable overall response to treatment between the two cohorts based on the m-RECIST criteria.
Median overall survival for the TARE-Y90 cohort is 11.3 (95% CI 10.9 – 18.6) months, and 15.8 (95% CI 14.8 – 22.7) months for the DEBIRI cohort. Log-rank testing shows no statistically significant differences (p = 0.53).
Median time to hepatic disease progression for the TARE-Y90 cohort is 3.5 (95% CI 3.4 – 8.1) months, and 3.8 (95% CI 3.7 – 11.1) months for the DEBIRI cohort. Log-rank testing shows no statistically significant differences (p = 0.82).
An important result of the resource utilization analysis is that TARE-Y90 patients have 1.33 treatments on average by patient, while DEBIRI patients have 3.16 treatments per patient.DEBIRI patients require more than 2 days in the intensive care unit on average, while it is not necessary for TARE-Y90. TARE-Y90 patients also need less days of hospitalization than those of DEBIRI. The consequence is that the overall use of resources is higher for DEBIRI in comparison to TARE-Y90.
Conclusion: TARE-Y90 and DEBIRI treatments for CRC liver metastases contributes valuable insights into their comparative effectiveness, revealing no significant, differences in radiological responses and overall survival. TARE-Y90 showed higher resource utilization, its potential advantages in patient comfort and average resource consumption per patient warrant consideration.
Keywords:
Transarterial radioembolization
; transarterial chemoembolization
; colon cancer liver metastasis
1. Introduction
Liver metastases from colorectal cancer (CRC) pose a substantial clinical challenge in the field of oncology. Globally, CRC ranks as the third most prevalent cancer [1], with 1.8 million new cases reported in 2017. CRC accounts for 10% of all cancer-related deaths, claiming approximately 244,824 lives annually in Europe [2] and 150,000 in the United States [3].
The incidence of CRC is strongly linked to advancing age and higher socio-demographic status [4]. Lifestyle factors and variation in diet, including the consumption of red or processed meats, sedentary behavior, alcohol intake, and smoking, play a pivotal role in its development [5,6]. Furthermore, specific individuals carry inherent predispositions to CRC, while identifiable risk factors include conditions such as inflammatory bowel diseases, papillomavirus infection, and acquired immunodeficiency syndrome (AIDS). Remarkably, one in four CRC patients receives the diagnosis of stage IV metastatic disease from the outset [7], with a significant majority (70-80%) involving liver metastases [8,9]. Prognosis for CRC patients is profoundly influenced by the disease's extent at the time of diagnosis, with a striking contrast in five-year survival rates, ranging from 90% for localized cases to a grim 14% for those grappling with liver or other distant metastases.
The liver stands as the primary target for CRC metastasis [10,11], and liver metastases constitute the leading cause of death associated with CRC [12]. A comprehensive and multidisciplinary approach involving surgery, chemotherapy, and targeted therapies is vital for enhancing outcomes in patients grappling with this complex condition.
Non-surgical approaches for managing metastases localized to a single organ, most often the liver, offer significant survival benefits beyond systemic therapy alone. When surgical resection is not an option, strategies like image-guided ablation, embolization, or stereotactic body radiation therapy (SBRT) become reasonable choices. These decisions should be made in consultation with a multidisciplinary team [13].
One notable non-surgical approach is transarterial radioembolization (TARE), employing Yttrium-90 (Y90) glass microspheres (TheraSphere). This method utilizes brachytherapy to deliver localized beta radiation via tiny glass microspheres containing radioactive Y90. These microspheres are carefully delivered to the liver tumor's vasculature through hepatic artery catheterization, ensuring precise radiation delivery to the tumor site. TheraSphere effectively penetrates deep into the tumor, delivering therapeutic radiation while minimizing harm to surrounding healthy tissue [14]. This approach offers hope to patients with unresectable, chemo-refractory colorectal liver metastases (CRCLM), potentially delaying disease progression and extending life. It is well-tolerated, with mild to moderate, transient adverse events, allowing patients to maintain their daily routines [15]. A pivotal phase III trial has demonstrated its potential to delay disease progression when combined with systemic therapy in patients who have advanced beyond first-line treatment [16,18].
Another approach involves DEBIRI, whose microspheres enable controlled drug delivery to tumors, reducing systemic side effects and enhancing the consistency of transarterial chemoembolization in the liver. Irinotecan, highly effective for treating colorectal liver metastases, is particularly well-suited for transarterial liver therapies due to its efficient extraction by the liver [17]. DEBIRI therapy combines localized chemotherapy with tumor ischemia, precisely delivering cytostatic agents to the arteries supplying the tumor while avoiding dispersion into non-tumor liver tissue and extra-hepatic organs. DEBIRI has demonstrated an acceptable toxicity profile in several prospective studies, with some trials revealing longer overall survival compared to standard treatments. Simultaneous administration of modified FOLFOX and DEBIRI has also shown increased objective responses compared to FOLFOX alone. Chemoembolization is a viable option for select non-resectable patients, especially when systemic chemotherapy has not yielded the desired results. DEBIRI's selective intraarterial delivery of irinotecan within tumor arteries, while minimizing drug washout, enables a higher and prolonged intratumoral dose of irinotecan with significantly lower plasma levels. Presently, evidence for DEBIRI is primarily in the salvage setting, but it may hold potential for patients requiring downstaging before surgery [17,18].
2. Materials and Methods
The present study aims to investigate superiority of TARE-Y90 in the treatment of liver metastases from colorectal cancer in comparison to DEBIRI and perform a parallel resource consumption study to demonstrate a possible favorable cost-effectiveness balance. This dual approach seeks to improve health outcomes, specifically in terms of overall survival and time to progression, for patients undergoing these procedures, while also conducting a comparative cost analysis to enhance resource allocation efficiency for this patient population.
3. Study Design
This is a retrospective observational and multi-center study based on patient data analysis. A clinical data base was created to collect all information of interest (including clinical variables and resource consumption data) from all patients and procedures which meet the study’s inclusion criteria. All interventional radiologist involved in performing these procedures have more tan 14 years of experience. Data were collected in a dedicated electronic case report form (eCRF) and were dissociated from any patient personal data by means of pseudonymization, following Data Management Policies. Table 1.
4. Variables
Socio demographic variables:
- Age
- Sex
Clinical variables:
- Comorbidities: High blood pressure (HBP), Diabetes mellitus (DM), Dyslipidemia (DL)
- Carcinoembryonic antigen (CEA)
- Tumor size/volume
- Extra hepatic involvement
- Previous treatments (surgery, systemic therapy)
Response variables:
- Best Overall Response by image according to RECIST 1.1
- Tumor response according to RECIST 1.1 criteria every 1-2 months up to a minimum of 6 months of follow-up or death
- Progression-free survival up to a minimum of 6 months of follow-up or death
- Hepatic progression-free survival up to a minimum of 6 months of follow-up or death
- Overall survival up to a minimum of 6 months of follow-up or death
- Major and minor complications up to 90 days after the procedure
Variables related to the resource consumption:
- Previous chemotherapy treatments
- Number of procedures (number of TARE-Y90 /DEBIRI treatments) per patient
- Performances and material related to the procedure per patient
- Treatment dose (TARE Y90: target site dose in Gy; DEBIRI: mg irinotecan)
- Hospital stays per patient (days)
- Length of stay in ICU per patient (hours), if applicable
- Complications per patient
- Follow-up visits

Table 2.
Study variables.
|
Socio demographic variables: Age Sex |
Clinical variables: Comorbidities: High blood pressure (HBP), Diabetes mellitus (DM), Dyslipidemia (DL) Carcinoembryonic antigen (CEA) Tumor size/volume Extra hepatic involvement Previous treatments (surgery, systemic therapy) |
|
Response variables: Best Overall Response by image according to RECIST 1.1 Tumor response according to RECIST 1.1 criteria every 1-2 months up to a minimum of 6 months of follow-up or death Progression-free survival up to a minimum of 6 months of follow-up or death Hepatic progression-free survival up to a minimum of 6 months of follow-up or death Overall survival up to a minimum of 6 months of follow-up or death Major and minor complications up to 90 days after the procedure |
Variables related to the resource consumption: Previous chemotherapy treatments Number of procedures (number of TARE-Y90 /DEBIRI treatments) per patient Performances and material related to the procedure per patient Treatment dose (TARE Y90: target site dose in Gy; DEBIRI: mg irinotecan) Hospital stays per patient (days) Length of stay in ICU per patient (hours), if applicable Complications per patient Follow-up visits |
5. Health Resource Consumption Analysis
To perform the resource consumption analysis, an average of the utilized hospital materials and resources was computed for each patient in the study. This was calculated by accounting for all resources used during a procedure, which were divided into three distinct categories according to the treatment phases:
1) Pre-procedural resource consumption (which accounts for the preparation of the patient before the intervention),
2) Treatment resource consumption (that includes the treatment itself, surgery room time, staff involved, and specific material used in the procedure including prophylactic drugs administered to the patient) and
3) Post-procedure resource consumption (ICU stay and hospitalization length of stay).
We also calculated the number of procedures per patient to account for re-treatments and therefore the possibility of incurring in the same resource usage more than once. All calculations followed the standards of the Spanish Medical Radiology Society (SERAM).
6. Statistical Analysis
First, a descriptive statistical analysis was conducted, differentiating between both treatment groups, for data quality control and outlier detection. The descriptive statistics were obtained using Python 3.10 packages “pandas” 1.4.3 and SciPy 1.7.3.
Then, group analyses were carried out to verify the homogeneity of the populations, i.e., lack of previous significant clinical differences between both study groups, using appropriate hypothesis testing tests: chi-square or Fisher exact test for categorical variables using R 4.0.5 base package “stats” implementation; Student’s t-test or Mann-Whitney’s U for independent continuous variables, and paired t-test or sign-rank Wilcoxon test for dependent continuous variables using SciPy 1.7.3 implementations.
Time-to-endpoint outcomes (overall survival, time to progression and time to extra-hepatic progression) was calculated by Kaplan-Meier analysis and reported as a median with 95% confidence interval and compared between groups by log-rank testing. Survival analyses were performed using R package “survival” 3.5-7. Values for median time-to-event and 95% confidence intervals were calculated using bootstrapping. Subjects were censored at the time of loss of follow-up or in the event of undergoing curative treatment (surgical resection or transplant) during follow-up.
7. Results
7.1. Retrospective Data Search: Subject Inclusion and Exclusion
Health information systems of the hospitals involved in the study were checked for searching TARE-Y90 and DEBIRI procedures doing during the period 2010-2021. (Figure 1).
Firstly, all the subjects underwent to found TARE-Y90 and DEBIRI procedures were accurately selected for the study following the settled inclusion and exclusion criteria. This fundamental initial step allowed us to select 50 subjects treated with TARE-Y90 and 60 subjects treated with DEBIRI, for a total number of 110 treatment included in the study.
In agreement with the research team, the 6-months follow-up was considering the minimum time to verify the subject status after the treatment and the result of it. So, loss of follow-up in the 6 months after treatment (if the subject was not death) was verified as the second step of the inclusion/exclusion diagram. A total of 2 subject in TARE-Y90 group and 1 in DEBIRI group were excluded. These subjects were probably referred to one of the institutions involved in the project for treatment and are subsequently followed up elsewhere.
Finally, subjects were checked for the exclusion criteria related to "missing data”. Concerning to it, most cases involve individuals referred to our hospital for treatment following multiple procedures. Unfortunately, these procedures are not reported in detail, and there is no pre-treatment radiological report specifying lesion number and diameter. Additionally, these cases lack a comprehensive health record that includes essential baseline covariates.
Overall, the number of included subjects in the study was 46 for TARE-Y90 and 56 in the DEBIRI group. Variables of interest in the study were collected for all selected subjects (46 in the TARE-Y90 group and 56 in the DEBIRI group).
Moreover, we noted that the TARE-Y90 group was significantly more likely to have undergone PET-CT pre-treatment than DEBIRI group. Nevertheless, this data lack for 51 % of the subjects, so it was not possible to use the SUV-related variables to assess their prognostic and descriptive effectiveness for the characteristics of the study subjects. However, all other variables included in the calculation of these risk stratification scores are detailed in the study population description tables and used for descriptive statistical analysis.
Summary statistics for the study population are shown in Table 3. No statistically significant differences could be observed between patients treated with TARE-Y90 and with DEBIRI, either in socio-demographic and clinical variables or in related variables at the imaging study.
Table 3.
Description of study population. Numerical variables are shown as mean ± standard deviation (range). Categorical variables are shown as relative frequency (absolute frequency). P-value calculation: a = Student’s t-test; b = Mann-Whitney’s U test; c = Fisher's exact test.
Table 3.
Description of study population. Numerical variables are shown as mean ± standard deviation (range). Categorical variables are shown as relative frequency (absolute frequency). P-value calculation: a = Student’s t-test; b = Mann-Whitney’s U test; c = Fisher's exact test.
| TARE-Y90 (N=46) | DEBIRI (N=56) | P | ||
| Age (years) | 62 ± 10 (34-77) | 62 ± 9 (45-79) | 0.89 (a) | |
| Sex | Men | 67 % (31) | 70 % (39) | 0.83 (c) |
| Women | 33 % (15) | 30 % (17) | ||
| ECOG | PS 0 | 72 % (33) | 66 % (38) | 0.56 (c) |
| PS 1 | 26 % (12) | 25 % (14) | ||
| PS 2 | 2 % (1) | 7 % (4) | ||
| HTA | 46 % (21) | 41 % (23) | 0.69 (c) | |
| DM | 13 % (6) | 16 % (9) | 0.78 (c) | |
| DL | 22 % (10) | 30 % (17) | 0.37 (c) | |
| PT localization | DX | 28 % (13) | 23 % (13) | 0.81 (c) |
| SX | 72 % (33) | 75 % (42) | ||
| DX; SX | 0 % (0) | 2 % (1) | ||
| PT vascular invasion | 50 % (23) | 28 % (16) | 0.30 (c) | |
| RAS mutation | 28 % (13) | 27 % (15) | 1.00 (c) | |
| BRAf | 2 % (1) | 4 % (2) | 1.00 (c) | |
| LM at PT diagnosis | 72 % (33) | 70 % (39) | 0.83 (c) | |
| Other M meanwhile the treatment | Lymph node | 12 % (6) | 12 % (7) | 1.00 (c) |
| Lung | 11 % (5) | 12 % (7) | ||
| Other location | 5 % (2) | 4 % (2) | ||
| No | 72 % (33) | 72% (40) | ||
| Ascites | 4 % (2) | 0 % (0) | 0.20 (c) | |
| Peritoneal carcinomatosis | 7 % (3) | 2 % (1) | 0.32 (c) | |
| Image test mode | TC | 80 % (37) | 84 % (47) | 0.78 (c) |
| PET-TC | 9 % (4) | 5 % (3) | ||
| RM | 7 % (3) | 9 % (5) | ||
| Echography | 4 % (2) | 2 % (1) | ||
| Nº LM | 4 ± 2 | 4 ± 4 | 0.61 (b) | |
| Size of target lesion | 45.7 ± 33.8 | 53.1 ± 35.1 | 0.30 (a) | |
| PET-CT pre-treatment | 61 % (28) | 39 % (22) | 0.05 (c)* | |
| LM localization | LHD | 50 % (23) | 34 % (19) | 0.14 (c) |
| LHI | 2 % (1) | 9 % (5) | ||
| Bi-lobar extension | 48 % (22) | 56 % (32) | ||
| Tumor burden | < 25 | 58 % (27) | 68 % (38) | 0.58 (c) |
| from 25 to 50 | 33 % (15) | 23 % (13) | ||
| > 50 | 9 % (4) | 9 % (5) | ||
| Pre-treatment CEA value | 286 ± 958 | 179 ± 557 | 0.61 (a) | |
| Previous treatments on PT | Primary tumor surgery | 78 % (36) | 96 % (54) | 0.006 (c)** |
| Systemic therapy | 96 % (44) | 100 % (56) | 0.20 (c) | |
| Surgery and/or Systemic therapy | 100 % (46) | 100 % (56) | 1.00 (c) | |
| Nº lines of systemic therapy | 1.9 ± 0.7 | 2.1 ± 1.4 | 0.57 (a) | |
| Kind of first-line therapy | FOLFOX | 65 % (30) | 66 % (37) | 0.92 (c) |
| FOLFIRI | 15 % (7) | 18 % (10) | ||
| FOLFOX; FOLFIRI | 20 % (9) | 16 % (9) | ||
| Kind of previous treatments on LM | Surgery | 30 % (14) | 50 % (28) | 0.07 (c) |
| TACE | 2 % (1) | 9 % (5) | 1.00 (c) | |
| Ablation | 20 % (9) | 21 % (12) | 1.00 (c) | |
To note, carcinoembryonic antigen (CEA) values data registered in the blood analysis pre-treatment showed a very large range and high variability among patients in both treatmentj groups. Therefore, even if this variable did not reach statistical significance, the results should be interpreted with caution due to the substantial individual variations observed.
DEBIRI group was found to have significantly more undergone primary tumor surgery than TARE-Y90 group, but this data was not considered so relevant or prognostic of a relevant difference between the two groups in terms of previous treatments on the primary tumor to which patients underwent, as in almost all of them in both groups the use of systemic therapy was found, and 100% of them had recurred at least one of the two types of previous treatment.
After conducting the descriptive statistics analysis and standardized mean differences the groups were considered reasonably comparable, with no evidence of substantial covariate imbalance between TARE-Y90 and DEBIRI treatments groups without the need for additional adjustment. This result confirmed the accurate selection of the subjects suitable for the study done following the settled inclusion and exclusion criteria. As a drawback, the total number of the treatments included in the study was small. The small sample sizes may lead to imprecise estimates when additional adjustment is performed, limiting their reliability, and reducing the statistical power of the analysis.
7.2. Response to Treatment
The primary objective of the study was to compare radiological response to TARE-Y90 and DEBIRI treatment between the two cohorts. Radiological response was assessed according to mRECIST criteria, as indicated for loco-regional treatment of colorectal liver metastasis by the EASL. Given that timing of response assessment is not standardized by international guidelines and is different in the institutions involved in the study after TARE-Y90 and DEBIRI treatments, analyses were performed according to Best Overall Response criteria.
Radiological response rates were reported and analyzed both in 4-class mRECIST categories complete response (CR), partial response (PR), stable disease (SD) and progressive disease (PD), as well as classified into overall disease (OR) including CR and PR or not overall disease (NOR) including SD and PD. Results are shown in Table 4 and Table 5.
Statistical analyses using Fisher’s exact test did not reveal significant differences in the rate of response to treatment between the TARE-Y90 and DEBIRI groups. Examining the response categories individually, we observed numerical variations between the TARE-Y90 and DEBIRI groups. Specifically, the DEBIRI group demonstrated a higher percentage of complete responses (CR) at 12%, compared to TARE-Y90 at 4%. However, it is important to note that this difference did not reach statistical significance (p = 0.06). The percentages of partial response (PR), stable disease (SD), and progressive disease (PD) showed no substantial differences between the two treatment cohorts. The categorization into overall response (OR) and no overall response (NOR) revealed a higher percentage of overall responses in the DEBIRI group (52%) compared to TARE-Y90 (24%). Yet, like the CR category, this difference did not achieve statistical significance (p = 0.19).
In summary, the study did not find significant differences in the radiological response rates between the TARE-Y90 and DEBIRI groups. The numerical differences observed in certain response categories did not reach statistical significance, indicating a comparable overall response to treatment between the two cohorts based on the m-RECIST criteria.
7.3. Time-to-Event Analyses
In addition to evaluating the Best Overall Response, the second objective of this study was to compare time-to-event analysis results, including Overall Survival (OS), Hepatic Progression-Free Survival (hPFS), Progression-Free Survival (PFS), and Tumor Response, between TARE-Y90 and DEBIRI in patients with liver metastases from CRC.
OS was calculated from the initiation of the primary treatment until the date of death or the last follow-up. hPFS and PFS were determined retrospectively, starting from the initial regional treatment until the first documented evidence of liver progression (hPFS) or progression anywhere in the body (PFS). Global PFS included disease progression at any anatomical site, such as the brain, liver, lung, and lymph nodes, not limited to the liver.
- a)
- Overall survival (OS)
Kaplan-Meier curve for overall survival is shown in Figure 2. Os corresponds to the time from the initial regional treatment until the date of death or the last follow-up.
Median overall survival for the TARE-Y90 cohort is 11.3 (95% CI 10.9 – 18.6) months, and 15.8 (95% CI 14.8 – 22.7) months for the DEBIRI cohort. Log-rank testing shows no statistically significant differences (p = 0.53).
In conclusion, no significant differences in terms of overall survival (the primary endpoint in this retrospective observational study) were found between the two cohorts in our study.
- b)
- Hepatic progression-free survival (hPFS)
Kaplan-Meier curve for time to hepatic disease progression (by mRECIST criteria) is shown in Figure 3. hPFS corresponds to the time from the initial regional treatment until the first documented evidence of liver progression.
Median time to hepatic disease progression for the TARE-Y90 cohort is 3.5 (95% CI 3.4 – 8.1) months, and 3.8 (95% CI 3.7 – 11.1) months for the DEBIRI cohort. Log-rank testing shows no statistically significant differences (p = 0.82).
In conclusion, no significant differences in terms of time to hepatic disease progression were found between the two cohorts in our study.
- c)
- Progression-free survival (PFS)
Kaplan-Meier curve for time to disease progression (by mRECIST criteria) is shown in Figure 4. PFS corresponds to the time from the initial regional treatment until the first documented evidence of progression anywhere in the body.
Median time to progression for the TARE-Y90 cohort is 3.4 (95% CI 3.3 – 7.7) months, and 3.8 (95% CI 3.6 – 9) months for the DEBIRI cohort. Log-rank testing shows no statistically significant differences (p = 0.86).
As demonstrated in this section, the populations exhibit comparability across all time-to-event endpoint analyses as no significant differences were demonstrated by log-rank testing. In essence, both treatment cohorts display similar outcomes across a range of time-to-event endpoint.
7.4. Health Resource Consumption Analysis
This part of the analysis accounted for all resources used in an intervention: pre-procedure (Table 6), procedure (Table 7) and post-procedure (Table 8). Finally, we also include an analysis of the re-treatments needed by patients (Table 9).
As seen in Table 6, the results indicate that TARE-Y90 treatment requires a pre-procedural phase, which DEBIRI does not. However, this phase is critical for TARE-Y90 treatment to be effective and ensures a significantly greater technical outcome of the procedure.
This can be seen in the post-procedure phase (Table 8), in which it is observed that patients undergoing DEBIRI require more than 2 days in the intensive care unit on average, while it is not necessary for TARE-Y90. In addition, when analyzing length of stay, TARE-Y90 patients also need less days of hospitalisation than those of DEBIRI.
An important result of the resource utilization analysis is that TARE-Y90 patients have 1.33 treatments on average by patient, while DEBIRI patients have 3.16 treatments per patient (Table 9). This is a significant difference in favor of TARE-Y90, since DEBIRI patients need to undergo treatment nearly three times more often. The consequence is that the overall use of resources is higher for DEBIRI in comparison to TARE-Y90. This affects the organization of hospitals (number of available beds, waiting lists), and patients’ quality of life.
8. Discussion
Our study aimed to compare health outcomes and resource consumption between TARE-Y90 and DEBIRI cohorts of patients with liver metastases from colorectal cancer (CRC). We employed a robust retrospective data search methodology within the framework of a multicentric project.
The initial steps involved a meticulous descriptive statistics analysis and standardized mean differences assessment, crucial for establishing the comparability of the treatment groups. The results reassuringly indicated reasonable comparability, affirming the precise selection of subjects based on predefined inclusion and exclusion criteria.
No statistically significant differences could be observed between patients treated with TARE-Y90 and with DEBIRI, either in socio-demographic and clinical variables or in related variables at the imaging study. To note, carcinoembryonic antigen (CEA) values data registered in the blood analysis pretreatment showed a very large range and high variability among patients in both treatment groups. Therefore, even if this variable did not reach statistical significance, the results should be interpreted with caution due to the substantial individual variations observed. (Table 3). In summary, the study did not find significant differences in the radiological response rates between the TARE-Y90 and DEBIRI groups. The numerical differences observed in certain response categories did not reach statistical significance, indicating a comparable overall response to treatment between the two cohorts based on mRECIST criteria.
The primary objective of this study was to investigate the radiological response rate, categorized according to mRECIST criteria, and to compare the effectiveness of TARE-Y90 and DEBIRI treatments. However, the results do not demonstrate significant differences. Notably, while there was a numerical difference in the CR category favoring DEBIRI, this did not reach statistical significance (p = 0.06). Similarly, the overall response rates did not show a significant difference (p = 0.19), despite a higher percentage in the DEBIRI group. Therefore, despite variations in specific response categories, the global treatment responses were comparable.
The observed numerical differences may prompt further exploration, especially given the potential implications for patient outcomes. However, the lack of statistical significance highlights the need for cautious interpretation, and the possibility that these differences may be due to chance or other factors not captured in our analysis, as genetic mutations (KRAS).
Another important outcome was the comparative analysis of resource consumption between TARE-Y90 and DEBIRI in patients with liver metastases from CRC. Our findings indicate that DEBIRI necessitates more procedures per patient and therefore entails a higher total health resource consumption.
Consequently, we assert that, despite TARE-Y90 may offer advantages over DEBIRI for both the patient and the healthcare facility. This advantage is evident for the patient in terms of reduced discomfort due to a lower number of treatments, and for the hospital in consideration of the average total consumption of healthcare resources per patient. Radiation dosimetry has evolved to become more tailored to patients and target lesion, (being a trend in recently included patients) with treatment dose and distributions adapted for palliation, bridging or downstaging to liver transplantation, converting to surgical resection candidacy, etc). The data recently published thus far reinforce that "personalizing" dosimetry yields real-world improvements in tumor response and overall survival while maintaining a favorable adverse event profile [19,20,21,22].
Re-treatments have a significant impact in patients’ Quality of Life (QoL), that have been observed to undergo several additional lines of chemoembolization with DEBIRI, as well as in hospital resource consumption metrics. Given that DEBIRI patients come back for re-treatments, it may also impact waiting lists.
Literature regarding economic evaluations of TARE-Y90, it was noted that the inclusion of Y-90 TARE therapy was associated with additional cost [23,24,25,26,27,28,29], mainly because it was compared with well-known and low-cost chemotherapy drugs such as HAI (Hepatic artery infusion) [31,33] and FOLFOX (Folinic acid, fluorouracil and oxaliplatin) [32] or BSC (´´best supportive care´´) [23,24,25,26], therapy aimed at treating symptoms.
Despite additional cost (range 16,824[29] to 25,320 [24] $US PPP), Y-90 TARE therapy has demonstrated advantages in improving efficiency, such as reducing hospital stay 2 days for Y-90 TARE vs. 9 days for HAI) [29], would improve health outcomes (Y-90 TARE vs. BSC [23,24,25,26] or HAI [27]), would improve ´´years of life gained´´(LYG) (Y-90 TARE versus BSC: 1.12 [19,21] to 1.35 [24], and Y-90 TARE versus HAI 0.37), and quality-adjusted life years (QALY)(Y-90 TARE versus BSC: 0.81 [23,25,26] to 0.83 [24] and Y-90 TARE + HAI versus HAI: 0.35 [27]). Although a retrospective study of Y-90 TARE versus HAI [29] showed longer overall survival for HAI (16.3 vs. 31.2 months), the study reported a lower probability of survival as there were more patients in the TARE group with previous liver resection at the time of diagnosis.
Fusco et al. [27] evaluated the use of Y-90 TARE in first-line treatment for chemotherapy-naïve patients and identified restricted information on primary care resource costs as a limitation. The remaining economic studies [23,24,25,26,27,29] evaluated the use of Y-90 TARE in successive lines of treatment for chemotherapy-refractory patients, drawing clinical data from two retrospective studies [29,30] and one clinical trial [31]. The firsr retrospective study by Bester et al. [30], had a representative population (n: 339) for Y-90 TARE and was used in four [23,24,25,26] full economic evaluations. The second retrospective study, Dhir et al. [29] was used to estimate the cost of HAI and Y-90 TARE treatment in the same reference and evaluated a smaller population (n:49). Futhermore, the clinical trial by Gray et al. [31] evaluated a population of 35 patients and was used to compare Y-90 TARE + HAI versus HAI [27].
Given indications for treatment with Y-90 TARE in the American Society of Interventional Radiology [32], which focuses on including patients with surgically unresectable liver and hepatic neoplasms, appropriate patient selection is relevant for optimal outcome. As such, the combination of Y-90 TARE with systemic chemotherapy treatment is not recommended as first-line treatment of patients with unresectable mCRC [33]. However, the addition of Y-90 TARE to standard second-line chemotherapy (as demonstrated in the phase III EPOCH clinical trial) [34] has demonstrated improved progression-free survival (PFS) and liver disease-free survival (hepatic PFS), further supporting the cost-effectiveness advantage of Y-90 TARE therapy in patients with unresectable mCRC.
Studies reported costs in different currencies and reference years [24,25,29], limiting the comparability of the results, which were converted to 2020 (US $ PPP cost) to address this issue, although this is a global review system, most economic evaluations were conducted from European perspective, which may limit the external validity of our review for other countries.
Moving to the second objective of the study, our meticulous examination of the time-to-event analyses provides valuable insights into the comparative effectiveness of TARE-Y90 and DEBIRI in patients with CRC liver metastases. The observed comparability between TARE-Y90 and DEBIRI in overall survival, hepatic progression-free survival, and progression-free survival implies that the choice between these treatments may not significantly impact these outcomes in CRC patients with liver metastases.
Despite the study's methodological rigor, it is essential to acknowledge a limitation due to the relatively small sample size of included treatments. The inherent challenges associated with small sample sizes, particularly in terms of precision and statistical power when making additional adjustments, are recognized, and considered in the interpretation of our findings.
In conclusion, our study comparing TARE-Y90 and DEBIRI treatments for CRC liver metastases contributes valuable insights into their comparative effectiveness, revealing no significant, differences in radiological responses and overall survival. Despite numerical variations, the overall treatment responses were comparable, emphasizing caution in interpretation due to sample size limitations. While TARE-Y90 showed higher resource utilization, its potential advantages in patient comfort and average resource consumption per patient warrant consideration. Our findings offer insights for Clinical decision-making, acknowledging the study’s retrospective nature and the need for prospective validation, emphasizing the importance of continued research and potentially larger cohorts to elucidate the nuanced aspects of treatment responses in patients with liver metastases from CRC and opens avenues for future research that can build.
Abbreviations
| ACs: | Autonomous Communities |
| CEA: | Carcinoembryonic antigen |
| CGP: | Clinical Good Practice |
| CR: | Complete response |
| DEBIRI: | Transarterial chemoembolization (TACE) with irinotecan-preloaded particles |
| DL: | Dyslipidemia |
| DM: | Diabetes Mellitus |
| DP: | Disease progression |
| ECOG-PS: | Eastern Cooperative Oncology Group Performance Status |
| eCRF: | Electronic Case Report Form |
| HBP: | High blood pressure |
| HBV: | Hepatitis B Virus |
| HCV: | Hepatitis C Virus |
| HIV: | Human Immunodeficiency Virus |
| hPFS: | Hepatic progression-free survival |
| mCRC: | metastatic colorectal cancer |
| MSI: | microsatellite instability |
| NOR: | No overall response |
| LM: | Liver metastasis |
| OR: | Overall response |
| OS: | Overall survival |
| PFS: | Progression-free survival |
| PR: | Partial response |
| PPP: | Purchasing power parity. |
| PT: | Primary tumor |
| QoL: | Quality of Life |
| QALY: | Calidad ajustada a años de vida |
| RECIST: | Response Evaluation Criteria in Solid Tumors |
| SD: | Stable disease |
| TACE: | transarterial chemoembolization |
| TARE: | transarterial radioembolization |
| TARE-Y90: | transarterial radioembolization with Y90 glass microspheres |
| Y90: | Yttrium-90 radioactive |
References
- Cancer Research 2019. Cancer Research UK. Bowel Cancer Statistics. 2020. https://www.cancerresearchuk.org/health-professional/cancer-statistics/statistics-by-cancer-type/bowel-cancer#heading-Zero (accessed September 2020).
- IACR 2020. Cancer Today: International Association of Cancer Registries. Estimated number of deaths in 2020, worldwide, both sexes, all ages. 2021. https://gco.iarc.fr/today/online-analysis-table?v=2020&mode=cancer&mode_population=continents&population=900&populations=908&key=asr&sex=0&cancer=39&type=1&statistic=5&prevalence=0&population_group=0&ages_group%5B%5D=0&ages_group%5B%5D=17&group_cancer=1&include_nmsc=1&include_nmsc_other=1#collapse-others (accessed 18th March 2021).
- ACS 2020. American Cancer Society. 2020. https://www.cancer.org/cancer/colon-rectal-cancer/about/key-statistics.html#:~:text=In%20the%20United%20States%2C%20colorectal,about%2053%2C200%20deaths%20during%202020.
- Safiri 2019. Safiri S, Sepanlou SG, Ikuta KS, et al. The global, regional, and national burden of colorectal cancer and its attributable risk factors in 195 countries and territories, 1990–2017: a systematic analysis for the Global Burden of Disease Study 2017. The Lancet Gastroenterology & Hepatology 2019; 4(12): 913-33.
- Ponz de Leon 2004. Ponz de Leon M, Benatti P, Borghi F, et al. Aetiology of colorectal cancer and relevance of monogenic inheritance. Gut 2004; 53(1): 115.
- Macrae 2022. Macrae F. Colorectal cancer: Epidemiology, risk factors, and protective factors. Accessed at: https://www.uptodate.com/contents/colorectal-cancer-epidemiology-risk-factors-and-protective-factors.
- Lykoudis 2014. Lykoudis PM, O'Reilly D, Nastos K, Fusai G. Systematic review of surgical management of synchronous colorectal liver metastases. BJS (British Journal of Surgery) 2014; 101(6): 605-12.
- Manfredi 2006. Manfredi S, Lepage C, Hatem C, Coatmeur O, Faivre J, Bouvier A-M. Epidemiology and management of liver metastases from colorectal cancer. Ann Surg 2006; 244(2): 254-9.
- Levy 2018. Levy J, Zuckerman J, Garfinkle R, et al. Intra-arterial therapies for unresectable and chemorefractory colorectal cancer liver metastases: a systematic review and meta-analysis. HPB 2018; 20(10): 905-15.
- Wang 2020. Wang J, Li S, Liu Y, Zhang C, Li H, Lai B. Metastatic patterns and survival outcomes in patients with stage IV colon cancer: A population-based analysis. Cancer Medicine 2020; 9(1): 361-73.
- Riihimäki 2016. Riihimäki M, Hemminki A, Sundquist J, Hemminki K. Patterns of metastasis in colon and rectal cancer. Sci Rep 2016; 6: 29765-.
- Helling 2014. Helling TS, Martin M. Cause of death from liver metastases in colorectal cancer. Ann Surg Oncol. 2014;21(2):501-6.
- SEOM 2018. Gómez-España MA, Gallego J, González-Flores E, Maurel J, Páez D, Sastre J, Aparicio J, Benavides M, Feliu J, Vera R. SEOM clinical guidelines for diagnosis and treatment of metastatic colorectal cancer (2018). Clin Transl Oncol. 2019;21(1):46-54.
- Rodriguez-Fraile 2015. Rodríguez-Fraile M, Iñarrairaegui M. Radioembolización de tumores hepáticos con (90)Y-microesferas [Radioembolization with (90)Y-microspheres for liver tumors]. Rev Esp Med Nucl Imagen Mol. 2015;34(4):244-57.
- Salem 2010. Salem R, Lewandowski RJ, Mulcahy MF, et al. Radioembolization for hepatocellular carcinoma using Yttrium-90 microspheres: a comprehensive report of long-term outcomes. Gastroenterology 2010; 138(1): 52-64. [CrossRef]
- Mulcahy 2021. Mulcahy MF, Mahvash A, Pracht M, Montazeri AH, Bandula S, Martin RCG 2nd, Salem R; EPOCH Investigators. Radioembolization With Chemotherapy for Colorectal Liver Metastases: A Randomized, Open-Label, International, Multicenter, Phase III Trial. J Clin Oncol. 2021 ;39(35):3897-07.
- Fiorentini 2012: Hepatic arterial chemoembolization adopting DC Bead drug eluting bead loaded with irinotecan versus systemic therapy for colorectal cancer: a randomized study of efficacy and quality of life. AGH 2012; 3(1). March 2012.
- Vera R, Gonzalez-Flores E, Rubio C, Urbano J, Valero Camps M, Ciampi- Dopazo JJ, et al. Multidisciplinary management of liver metastases in patients with colorectal cancer: a consensus of SEOM, AEC, SEOR, SERVEI, and SEMNIM. Clin Transl Oncol 2020;22:647-62. [CrossRef]
- Kao YH, Tan EH, Ng CE, Goh SW. Clinical implications of the body surface area method versus partition model dosimetry for yttrium-90 radioembolization using resin microspheres: a technical review. Ann Nucl Med 2011; 25:455–461. [CrossRef]
- Mikell JK, Mahvash A, Siman W, Baladandayuthapani V, Mourtada F, Kappadath SC. Selective internal radiation therapy with yttrium-90 glass microspheres: biases and uncertainties in absorbed dose calculations between clinical dosimetry models. Int J Radiat Oncol Biol Phys 2016; 96:888–896. [CrossRef]
- Morán V, Prieto E, Sancho L, et al. Impact of the dosimetry approach onthe resulting 90Y radioembolization planned absorbed doses based on99mTc-MAA SPECT-CT: ¿is there agreement between dosimetry methods? EJNMMI Phys 2020; 7:1–22.
- Knight GM, Gordon AC, Gates V, et al. Evolution of Personalized Dosimetry for Radioembolization of Hepatocellular Carcinoma. J Vasc Interv Radiol. 2023;34:1214–1225. [CrossRef]
- Bester L, Wasan H, Sangro B, Kennedy A, Pennington B, Sennfält K. Selec tive internal Radiotherapy (SIRT) using Resin Yttrium-90 Microspheres for Chemotherapy-Refractory metastatic colorectal Cancer: a UK cost-effec tiveness analysis. Value Health. 2013;16:A413. [CrossRef]
- Cosimelli M, Golfieri R, Pennington B, Sennfält K. Selective internal Radiotherapy (SIRT) using Resin Yttrium-90 Microspheres for Chemo therapy-Refractory metastatic colorectal Cancer: an italian cost-effec tiveness analysis. Value Health. 2013;16:A409. [CrossRef]
- Pennington B, Akehurst R, Wasan H, Sangro B, Kennedy AS, Sennfält K, et al. Cost-effectiveness of selective internal radiation therapy using yttrium-90 resin microspheres in treating patients with inoperable colorectal liver metastases in the UK. J Med Econ. 2015;18:797–804. [CrossRef]
- Brennan VK, Colaone F, Shergill S, Pollock RF. A cost-utility analysis of SIR-Spheres Y-90 resin microspheres versus best supportive care in the treatment of unresectable metastatic colorectal cancer refractory to chemotherapy in the UK. J Med Econ. 2020;23:1588–97. [CrossRef]
- Loveman E, Jones J, Clegg AJ, Picot J, Colquitt JL, Mendes D, et al. The clinical effectiveness and cost-effectiveness of ablative therapies in the management of liver metastases: systematic review and economic evalu ation. Health Technol Assess. 2014;18. [CrossRef]
- Fusco F, Wolstenholme J, Gray A, Chau I, Dunham L, Love S, et al. Selective internal Radiotherapy (SIRT) in metastatic colorectal Cancer patients with liver metastases: preliminary primary Care Resource Use and Util ity results from the Foxfire Randomised Controlled Trial. Value Health. 2017;20:A445–6. [CrossRef]
- Dhir M, Zenati MS, Jones HL, Bartlett DL, Choudry MHA, Pingpank JF, et al. Effectiveness of hepatic artery infusion (HAI) Versus Selective Internal Radiation Therapy (Y90) for pretreated isolated unresectable colorectal liver metastases (IU-CRCLM). Ann Surg Oncol. 2018;25:550–7. [CrossRef]
- Bester L, Meteling B, Pocock N, Pavlakis N, Chua TC, Saxena A, et al. Radio embolization versus standard care of hepatic metastases: comparative retrospective cohort study of survival outcomes and adverse events in salvage patients. J Vasc Interv Radiol JVIR. 2012;23:96–105. [CrossRef]
- Gray B, Van Hazel G, Hope M, Burton M, Moroz P, Anderson J, et al. Randomised trial of SIR-Spheres plus chemotherapy vs. chemotherapy alone for treating patients with liver metastases from primary large bowel cancer. Ann Oncol Off J Eur Soc Med Oncol. 2001;12:1711–20. https://doi. org/10.1023/a:1013569329846. [CrossRef]
- Salem R, Lewandowski RJ, Gates VL, Nutting CW, Murthy R, Rose SC, et al. Research Reporting Standards for Radioembolization of hepatic malig nancies. J Vasc Interv Radiol. 2011;22:265–78. [CrossRef]
- Karanicolas P, Beecroft JR, Cosby R, David E, Kalyvas M, Kennedy E, et al. Regional Therapies for Colorectal Liver Metastases: systematic review and clinical practice Guideline. Clin Colorectal Cancer. 2021;20:20–8. [CrossRef]
- Mulcahy MF, Mahvash A, Pracht M, Montazeri AH, Bandula S, Martin RCG, et al. Radioembolization with Chemotherapy for Colorectal Liver Metastases: a randomized, Open-Label, International, Multicenter, Phase III Trial. J Clin Oncol Off J Am Soc Clin Oncol. 2021;JCO2101839. https:// doi.org/10.1200/JCO.21.01839. [CrossRef]
Figure 1.
Flow diagram in this study.
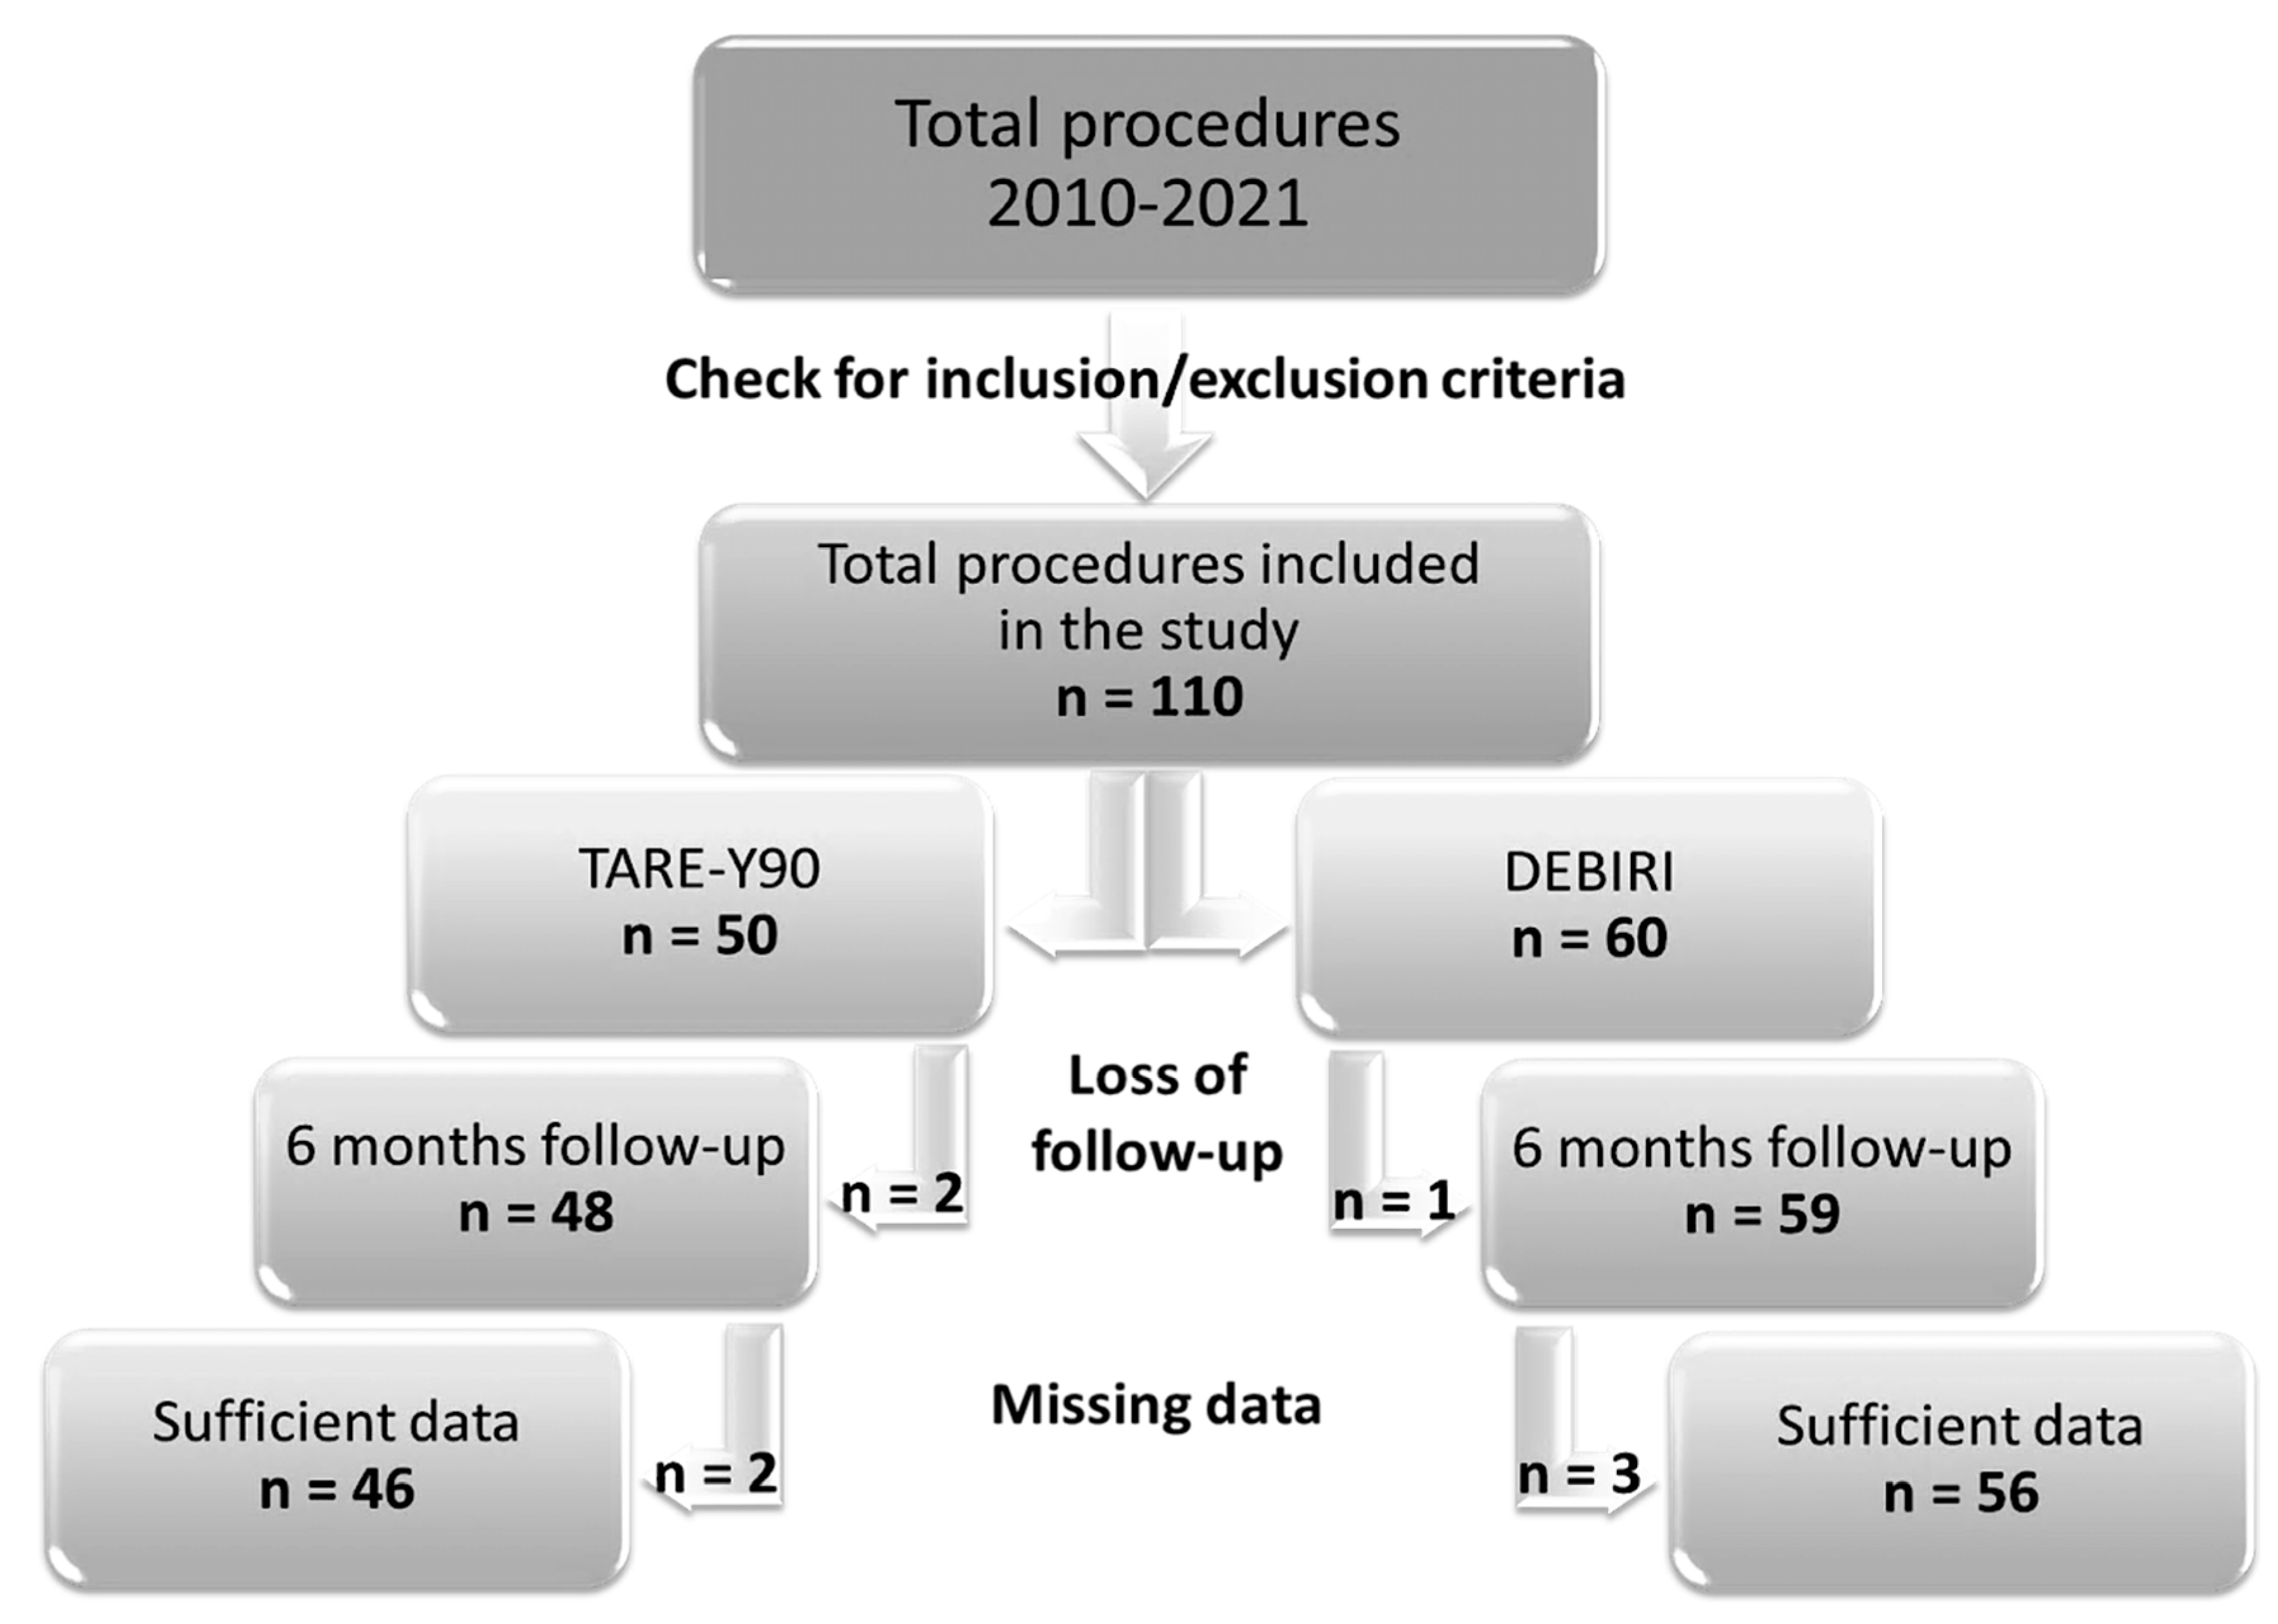
Figure 2.
Kaplan-Meier curve illustrating overall survival. The shaded areas depict 95% confidence intervals. The symbol ⧫ denotes censored data.
Figure 2.
Kaplan-Meier curve illustrating overall survival. The shaded areas depict 95% confidence intervals. The symbol ⧫ denotes censored data.
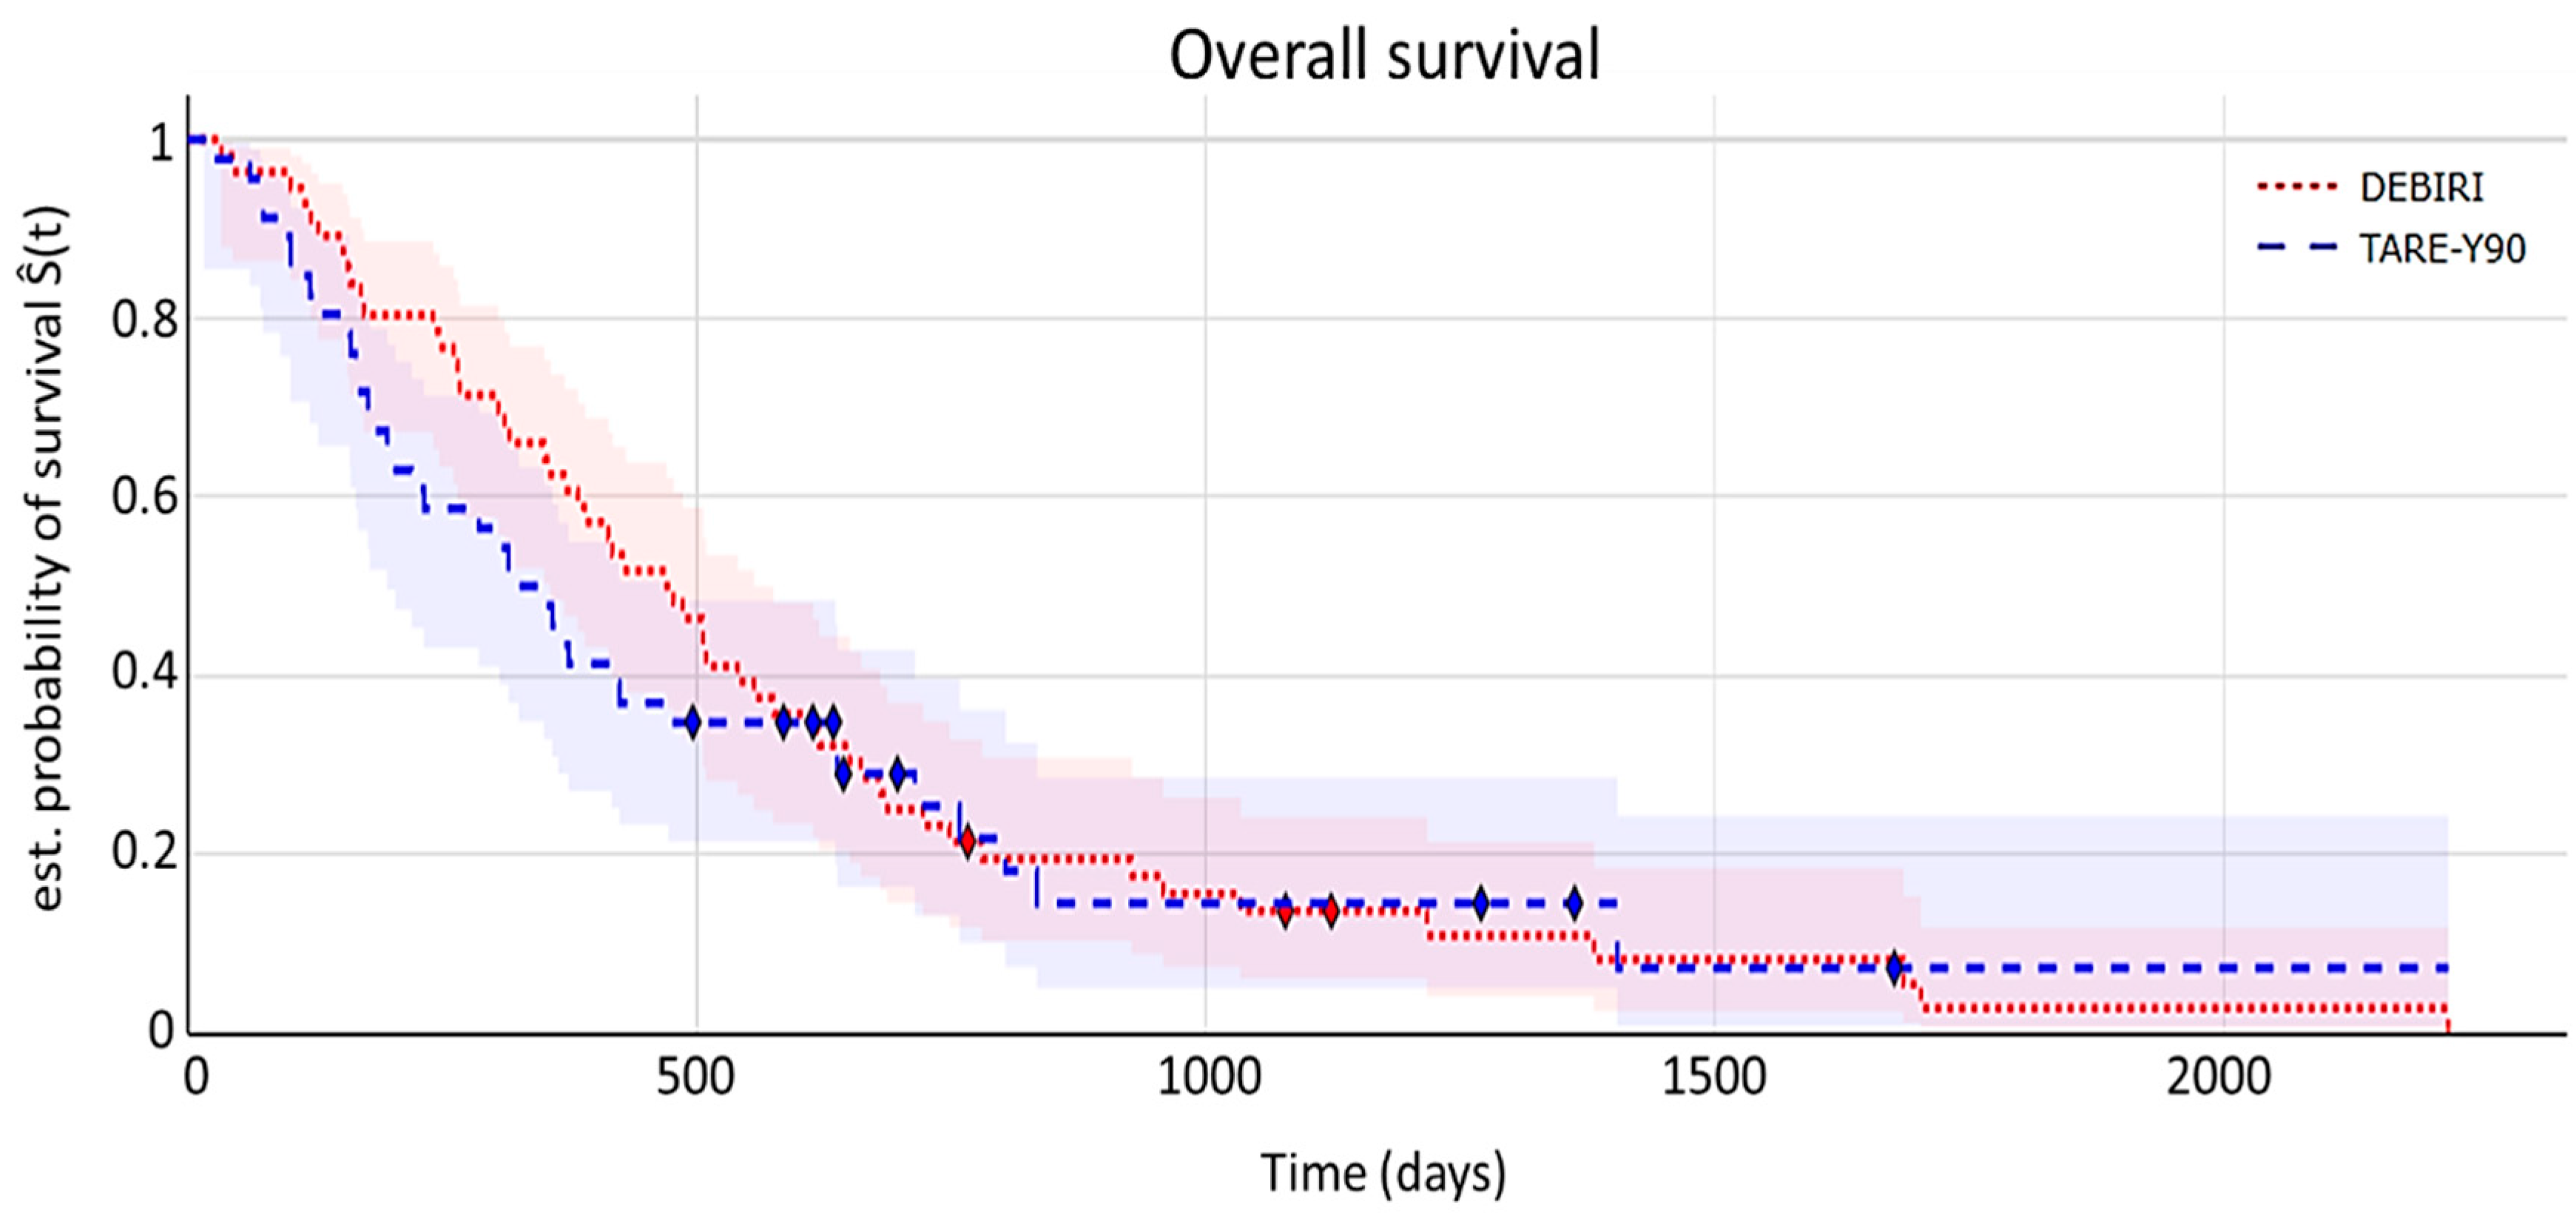
Figure 3.
Kaplan-Meier curve illustrating hepatic progression-free survival time. The shaded areas depict 95% confidence intervals. The symbol ⧫ denotes censored data.
Figure 3.
Kaplan-Meier curve illustrating hepatic progression-free survival time. The shaded areas depict 95% confidence intervals. The symbol ⧫ denotes censored data.
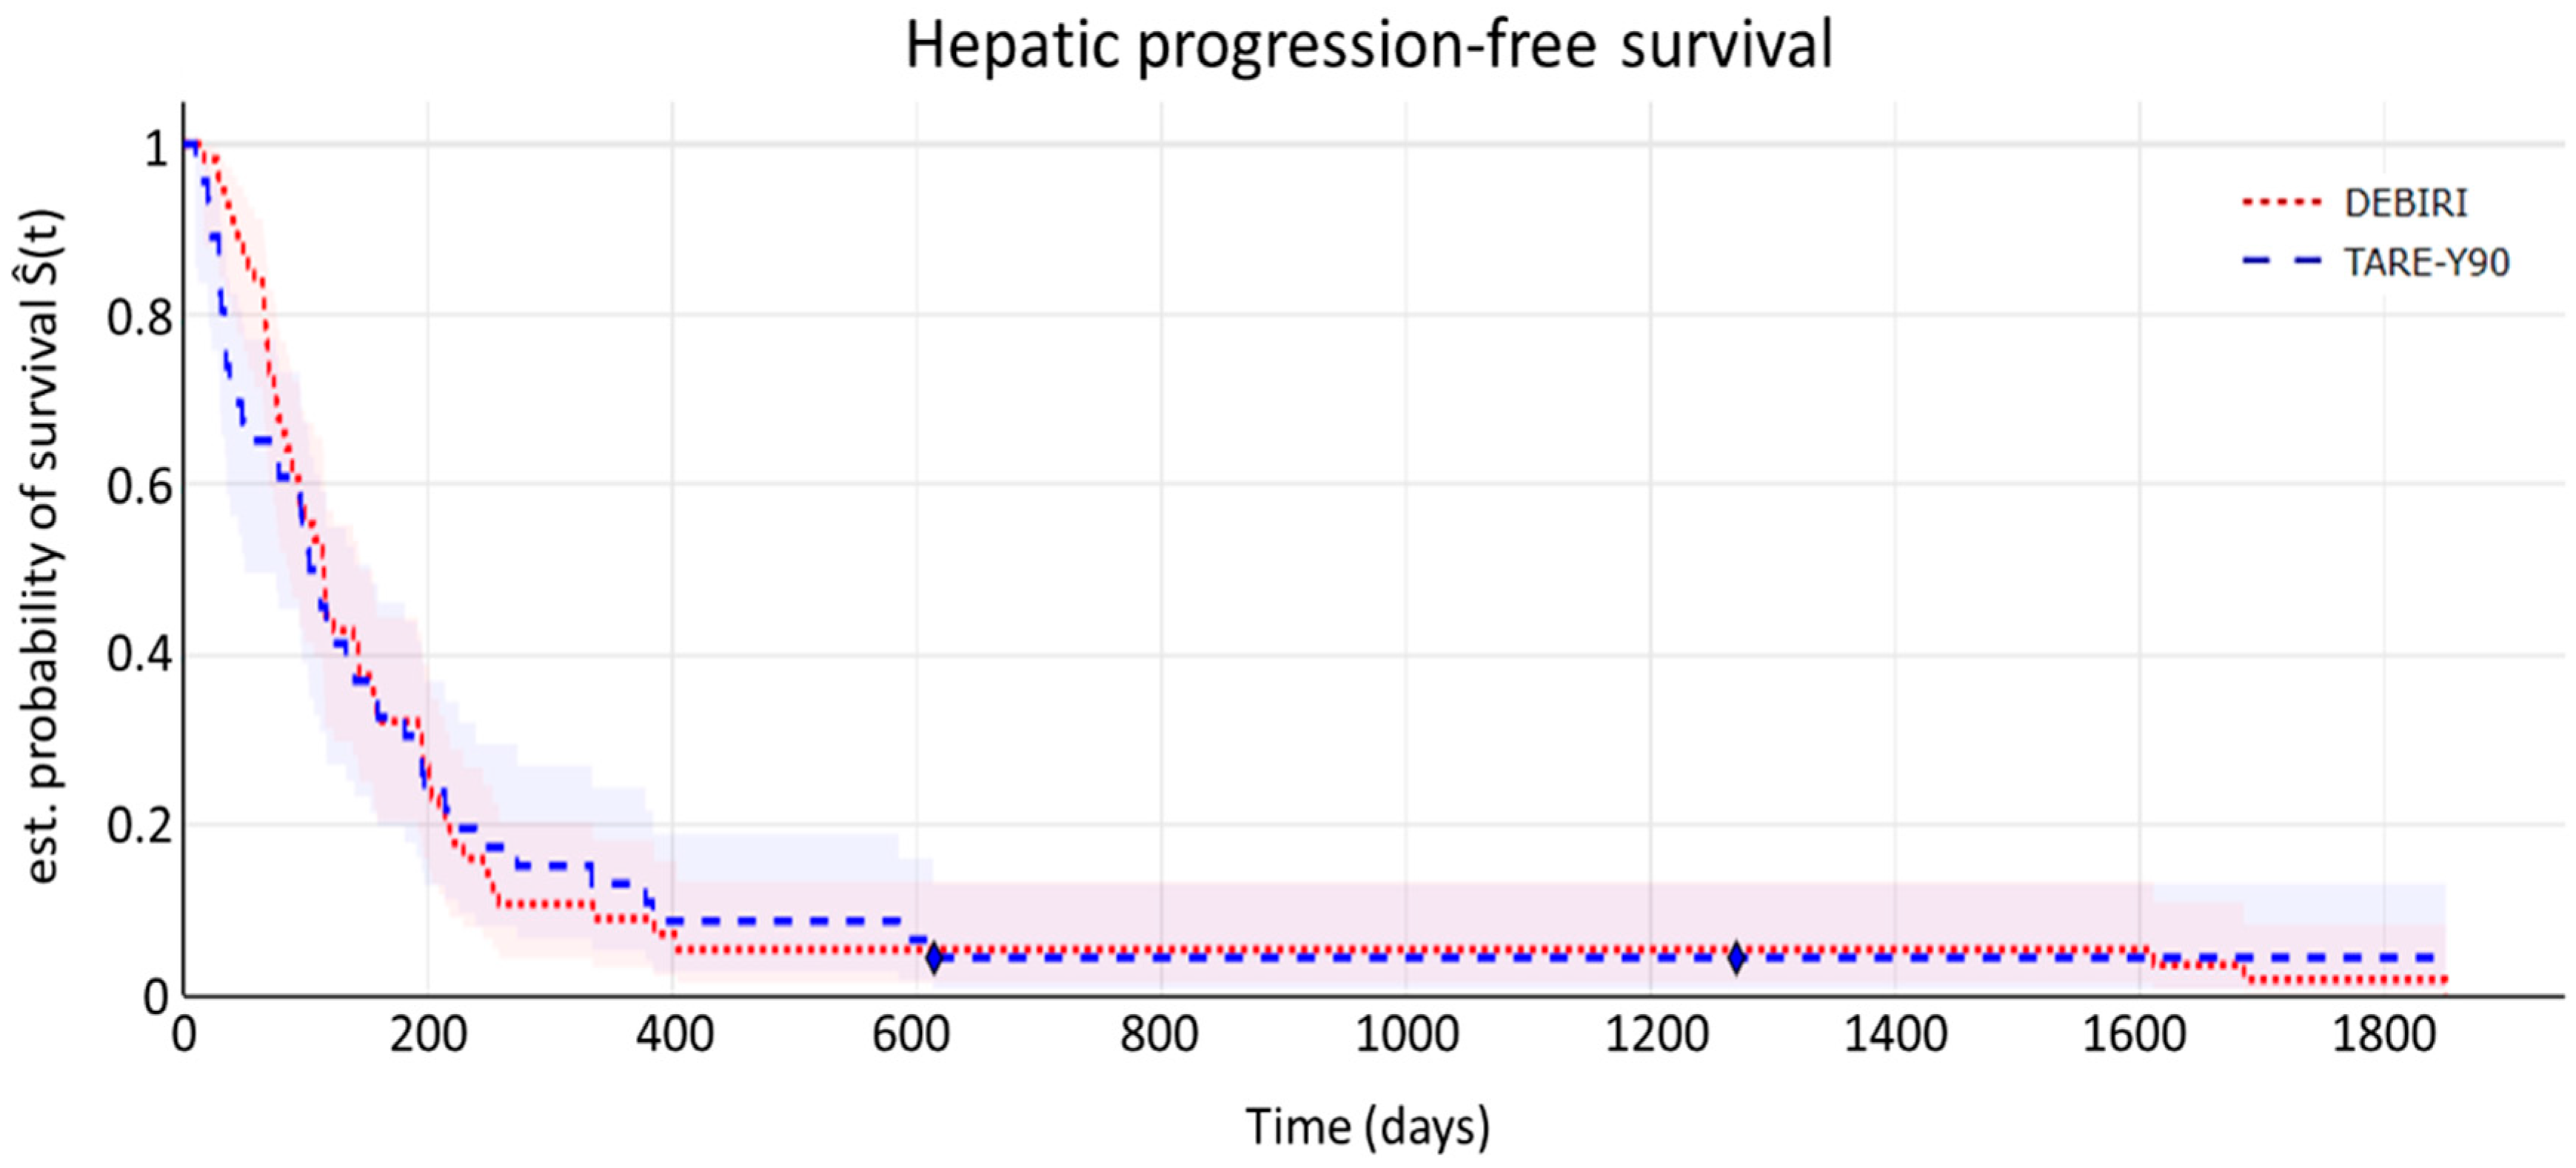
Figure 4.
Kaplan-Meier curve illustrating progression-free survival time. The shaded areas depict 95% confidence intervals. The symbol ⧫ denotes censored data.
Figure 4.
Kaplan-Meier curve illustrating progression-free survival time. The shaded areas depict 95% confidence intervals. The symbol ⧫ denotes censored data.
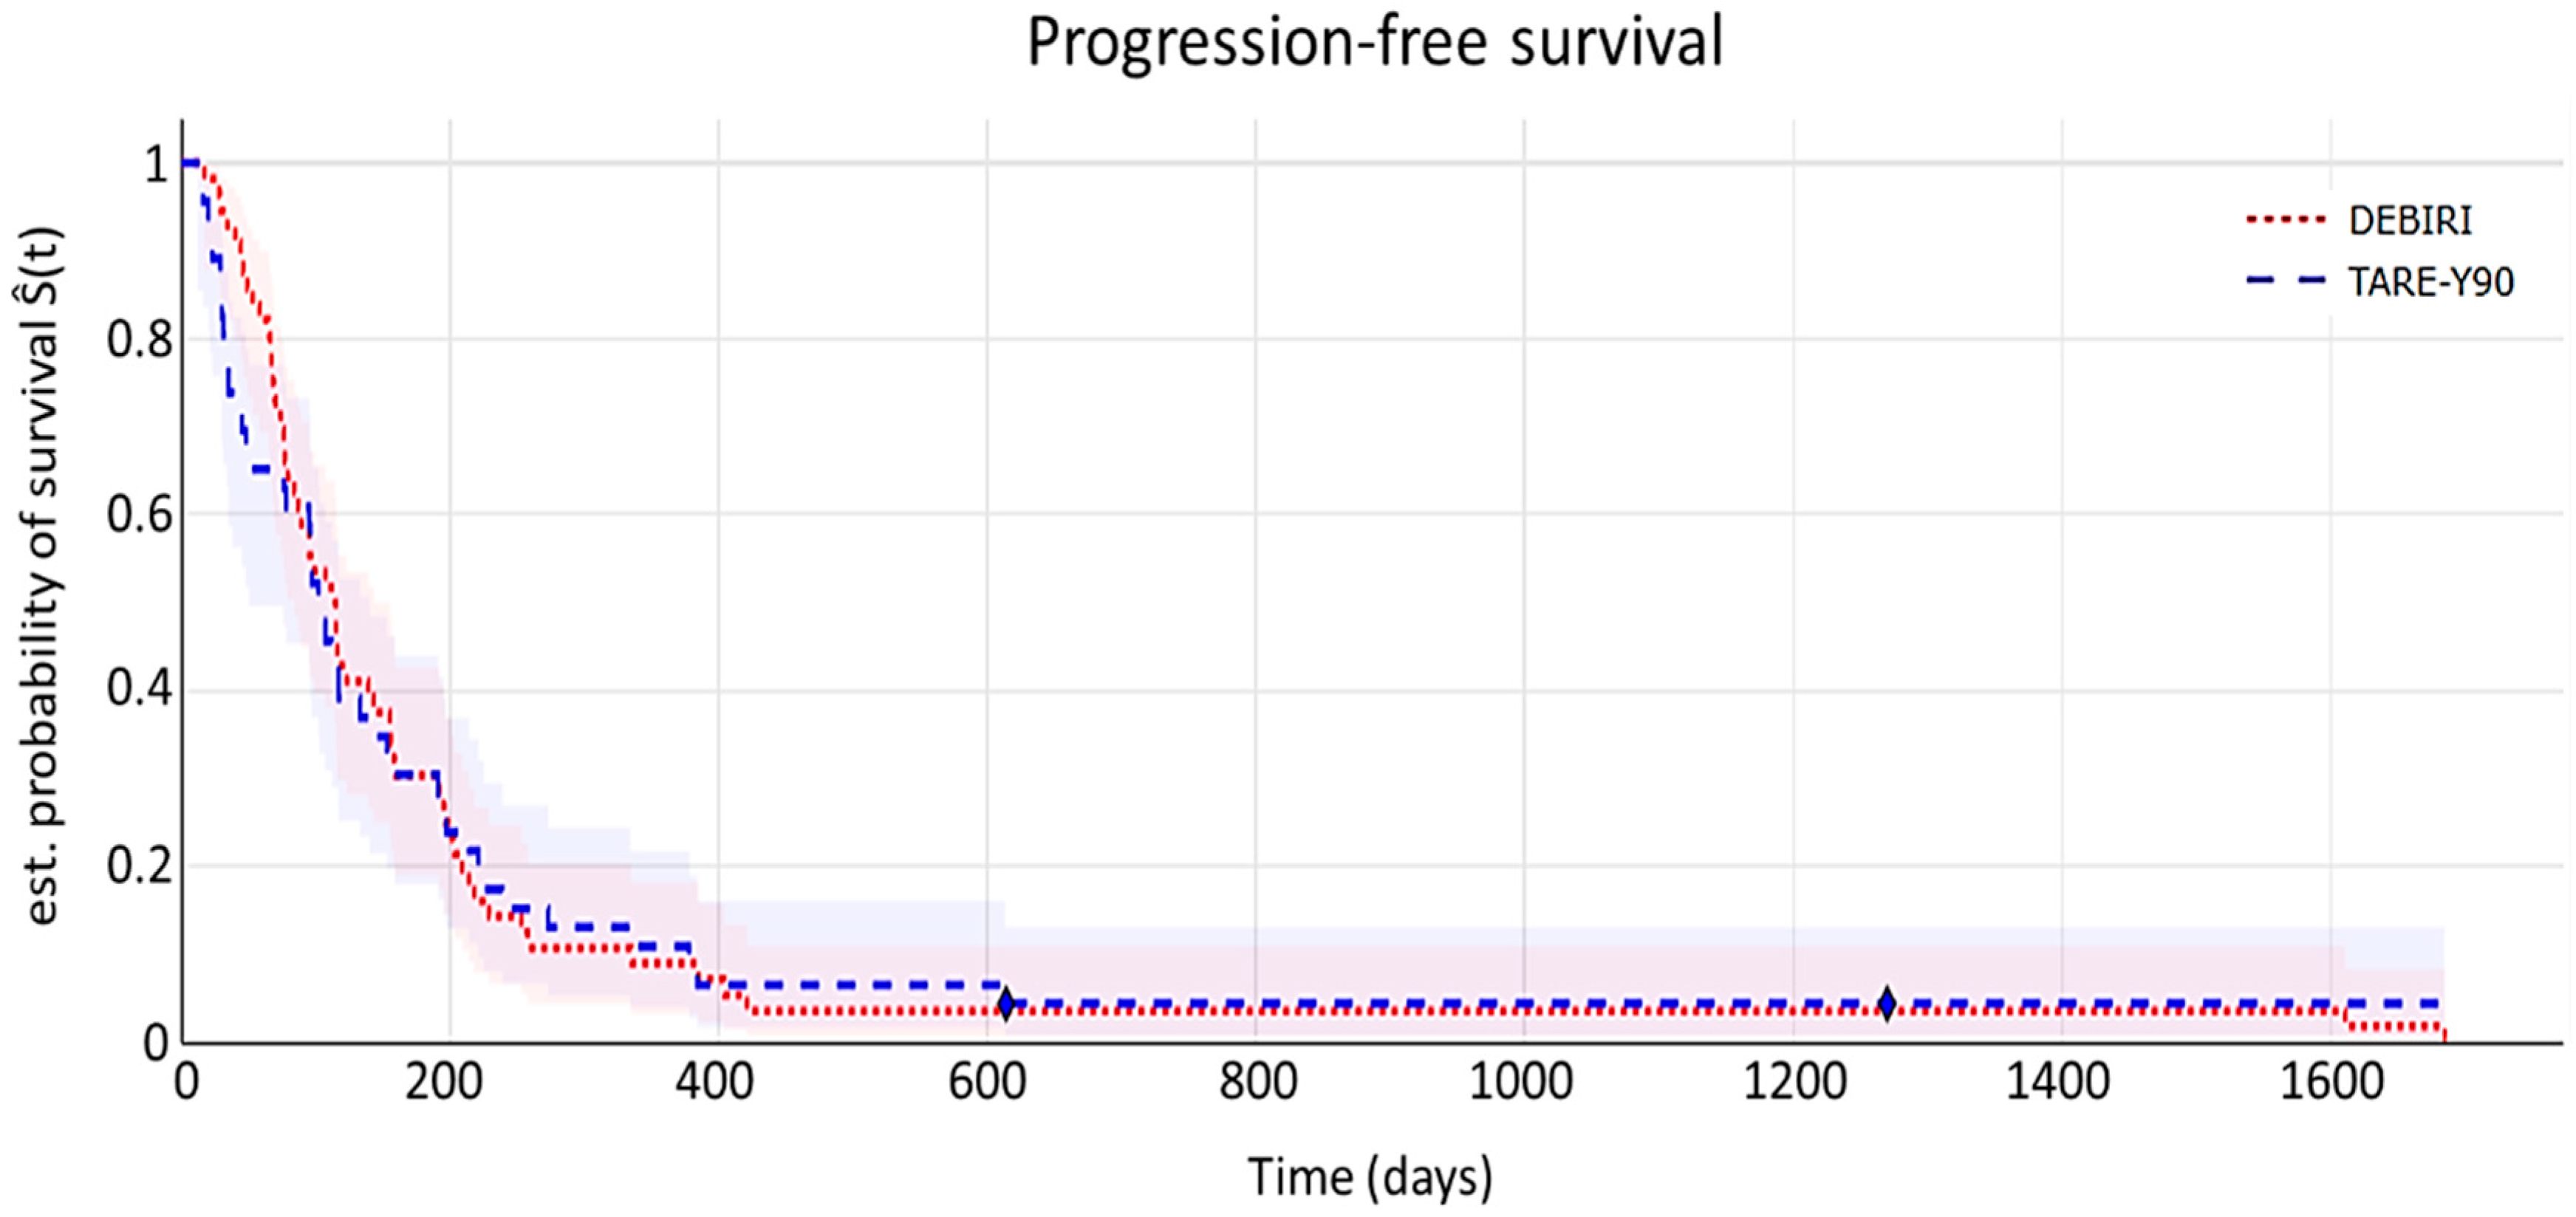
Table 1.
Inclusion and exclusion criteria.
| Inclusion criteria | Exclusion criteria |
|---|---|
| Colorectal cancer with unilobar or bilobar metastatic liver disease (stage IV), unresectable and disease progression in the liver after several lines of chemotherapy (at least one). | Background of hepatic encephalopathy. |
| Clinically stable or resected primary tumor. | Pulmonary insufficiency or clinically evident chronic obstructive pulmonary disease. |
| Tumor replacement below 50% of the total volume of the liver. | Cirrhosis and portal hypertension. |
| Patients treated with TARE-Y90 (TheraSphere® Y-90 Glass Microspheres- Boston Scientific, Malborough, MA, US) | History of severe allergy or intolerance to contrast agents, narcotics, sedatives, or atropine that cannot be treated medically. |
| Patients treated with DEBIRI (DC Beads M1 70-150µ- Boston Scientific, Malborough, MA, US) | Contraindications to angiography or selective visceral catheterization such as bleeding or coagulopathy not controllable with common hemostatic agents (e.g.: device closure) |
| Life expectancy greater than 6 months at the start of locoregional therapy (minimum post-procedure follow-up time: 6 months or until death) | Intervention or compromise of the Ampulla of Vater. |
| ECOG 0-1 until the first treatment under scope. | Clinically obvious ascites (traces of ascites on imaging are acceptable) |
| Creatinine serum <2.0 mg/dL. | Hepatic toxicity due to previous cancer therapy that has not been resolved before the start of study treatment, if the researcher determines that the continuing complication will compromise the patient’s safe treatment. |
| Serum bilirubin up to 1.2 x upper limit. | Significant life-threatening extra-hepatic disease, including patients who are on dialysis, have unresolved diarrhea, have severe unresolved infections, including patients known to be HIV positive or to have acute HBV or HCV. |
| Albumin > 3.0 g/dL. | Confirmed extra-hepatic metastases. Limited and indeterminate extra-hepatic lesions are allowed in the lung and/or lymph nodes (up to 5 lesions in the lung, with each individual lesion <1 cm; any number of lymph nodes with each individual node <1.5 cm) |
| Neutrophil count > 1200/mm3 (1.2x10⁹/L) | Previous treatment with liver radiotherapy. |
| Previous intra-arterial therapy directed at the liver, including transarterial chemoembolization (TACE) using irinotecan-loaded beads or TARE-Y90 therapy. |
|
| Treatment with biological agents within 28 days of receiving TARE-Y90 therapy. |
Table 4.
Response to treatment in both treatment cohorts, classified into CR/PR/SD/PD according to mRECIST. Statistical differences were evaluated with Fisher’s exact test. CR = complete response, PR = partial response, SD = stable disease, PD = progressive disease.
Table 4.
Response to treatment in both treatment cohorts, classified into CR/PR/SD/PD according to mRECIST. Statistical differences were evaluated with Fisher’s exact test. CR = complete response, PR = partial response, SD = stable disease, PD = progressive disease.
| TARE-Y90 (n = 46) |
DEBIRI (n = 56) |
p | |
|---|---|---|---|
| CR | 4 % (1) | 12 % (9) | 0.06 |
| PR | 20 % (9) | 20 % (10) | |
| SD | 30 % (15) | 20 % (10) | |
| PD | 46 % (21) | 48 % (27) |
Table 5.
Response to treatment in both treatment cohorts, classified into OR/NOR according to mRECIST. Statistical differences were evaluated with Fisher’s exact test. OR = overall response rate, NOR = no overall response rate.
Table 5.
Response to treatment in both treatment cohorts, classified into OR/NOR according to mRECIST. Statistical differences were evaluated with Fisher’s exact test. OR = overall response rate, NOR = no overall response rate.
| TARE-Y90 (n = 46) |
DEBIRI (n = 56) |
p | |
|---|---|---|---|
| OR | 24 % (10) | 52% (19) | 0.19 |
| NOR | 18% (36) | 48% (37) |
Table 6.
Average pre-procedure resource consumption.
| Device/procedure/ health provider/time | Units per TARE-Y90 procedure | Units per DEBIRI procedure |
| Selective angiographic catheter | 1 | 0 |
| Simmons catheter | 1 | 0 |
| Guide | 1 | 0 |
| Introducer | 1 | 0 |
| Vascular puncture needle | 1 | 0 |
| Micro catheter | 1 | 0 |
| Vascular closure device | 1 | 0 |
| Coils | 1 | 0 |
| 99Tc-MAA | 1 | 0 |
| Pretreatment assessment with MAA | 1 | 0 |
| Dosimetry of patients treated with radioactive isotopes | 1 | 0 |
| Physician / specialist | 3 | 0 |
| Specialist technician | 1 | 0 |
| Nurse | 2 | 0 |
| Hospitalization (days) | 1 | 0 |
Table 7.
Average procedure resource consumption.
| Device/drug/health provider/time | Units per TARE-Y90 procedure | Units per DEBIRI procedure |
|---|---|---|
| Selective angiographic catheter | 1 | 1 |
| Simmons catheter | 1 | 1 |
| Guide | 1 | 1 |
| Introducer | 1 | 1 |
| Vascular puncture needle | 1 | 1 |
| Micro catheter | 1 | 1 |
| Vascular closure device | 1 | 1 |
| 90Y particles | 1 | 0 |
| DEBIRI particles | 0 | 2 |
| Irinotecan | 0 | 2 |
| - Gastroduodenal ulcer prophylaxis | 1 | 1 |
| - Anti-nausea prophylaxis | 0 | 1 |
| - Post-embolization syndrome prophylaxis | 1 | 1 |
| - Intravenous corticosteroid before treatment | 1 | 1 |
| - Cefuroxime | 1 | 1 |
| Physician / specialist | 3 | 1 |
| Specialist technician | 1 | 1 |
| Nurse | 2 | 2 |
Table 8.
Average post-procedure resource consumption.
| Procedure/hospitalization | Units per TARE-Y90 procedure | Units per DEBIRI procedure |
|---|---|---|
| Whole body positron tomography (PET-CT) | 1 | 0 |
| Dosimetry of patients treated with radioactive isotopes | 1 | 0 |
| Stay in intensive care unit (hours) | 0 | 2.20 |
| Hospitalization (days) | 1 | 2.56 |
Table 9.
Average treatments per patient.
| Concept | TARE-Y90 | DEBIRI |
| Average treatments per patient | 1.33 | 3.16 |
Disclaimer/Publisher’s Note: The statements, opinions and data contained in all publications are solely those of the individual author(s) and contributor(s) and not of MDPI and/or the editor(s). MDPI and/or the editor(s) disclaim responsibility for any injury to people or property resulting from any ideas, methods, instructions or products referred to in the content. |
© 2025 by the authors. Licensee MDPI, Basel, Switzerland. This article is an open access article distributed under the terms and conditions of the Creative Commons Attribution (CC BY) license (http://creativecommons.org/licenses/by/4.0/).
Copyright: This open access article is published under a Creative Commons CC BY 4.0 license, which permit the free download, distribution, and reuse, provided that the author and preprint are cited in any reuse.


