Preprint
Article

This version is not peer-reviewed.

Lifestyle & Biochemical Parameters that May Hamper Immune Responses in Pediatric Patients After Immunization with the BNT162b2 mRNA COVID-19 Vaccine

A peer-reviewed article of this preprint also exists.

Submitted:

10 February 2025

Posted:

11 February 2025

You are already at the latest version

Abstract

Background: The aim of the study is to evaluate whether increased Body Mass Index (BMI), biochemical and lifestyle parameters linked to obesity and smoke exposure disrupt immune responses of children and adolescents following vaccination with the mRNA BNT162b2 vaccine. Methods: Participants were assigned to receive two doses of the mRNA vaccine. Anti-SARS-CoV-2 IgG and neutralizing antibodies (abs) were measured before vaccination (T0) and 14 days after the second dose (T1). BMI and biochemical parameters were evaluated at T0. A questionnaire on lifestyle characteristics was filled in. Results: IgG Optical Density (OD) ratio at T1 was lower in the overweight-obese group regardless of COVID-19 disease positive history [p=0.028 for the seronegative group, p=0.032 for the seropositive group]. Neutralizing abs were lower in overweightobese participants in the seronegative group at T1 [p=0.008]. HDL, Fasting Glucose/insulin Ratio (FGIR), C-Reactive Protein (CRP), HBA1c, uric acid and smoke exposure were significantly correlated with BMI [p=0.006, p<0.001, p<0.001, p=0.006, p=0.009, p<0.001, respectively]. The main biochemical parameters that were inversely correlated with IgG and neutralizing titers at T1 were uric acid [p=0.018, p=0.002], FGIR [p=0.001, p=0.008] and HBA1C [p=0.027, p=0.038], while smoke exposure negatively affected the humoral immune responses at T0 in the convalescent group [p=0.004, p=0.005]. Conclusions: Current data suggests that uric acid, Insulin Resistance (IR) and smoke exposure could adversely affect the immune responses in overweight-obese vaccinated children highlighting the need for actions needed for better protection of this specific subgroup.

Keywords: 
;  ;  ;  ;  ;  

1. Introduction

Severe acute respiratory syndrome coronavirus-2 (SARS-CoV-2) emerged in Wuhan in December 2019 and rapidly escalated into a global health emergency, causing significant social and economic disruptions worldwide. Active immunization appeared to be the cornerstone of health-care policies globally in order to reach herd immunity for long-term control of the SARS-CoV-2 pandemic [1]. Obesity has been identified as a major risk factor for severe illness, hospitalization, and mortality during the COVID-19 pandemic in both adult and pediatric populations. It is associated with a state of chronic, low-grade inflammation that leads to impaired innate and adaptive immunity and to defective humoral responses after vaccination rendering obese people more susceptible to infections [2,3]. The aim of the current study is to analyse COVID-19 vaccine response in correlation to BMI and how biochemical parameters such as inflammation markers, lipidemic profile, IR and lifestyle parameters, such as smoke exposure accompanying obesity, can play a major role in immunogenicity of children and adolescents.

2. Materials and Methods

2.1. Study Population

A prospective, single-center, cohort study of Greek children and adolescents, who received the COVID-19 Vaccine (mRNA BNT162b2) from October 2021 to October 2022 at “P.& A. Kyriakou” Athens Children’s Hospital, was conducted. The study’s population’s epidemiological data, laboratory and immunological indices were examined.
A questionnaire was implemented to retrieve data on the participants’ socio-demographic and healthcare characteristics. Past COVID-19 disease history was confirmed by positive Polymerase Chain Reaction (PCR) and/or Rapid Diagnostic Test (RDT). Lifestyle parameters including dietary and sleep habits, physical activity, smoke exposure and/or smoking and alcohol use were recorded. Smoking was defined by active tobacco use by the participants, while smoke exposure was considered significant when their guardians were active indoor smokers. Dietary lifestyle was assessed by KIDMED Score reflecting the grade of adherence to the Mediterranean diet (poor: 0-3, moderate: 4-7, good: 8) [4].
A binary score was used for smoke exposure and/or smoking, alcohol use, exercise and sleep habits to produce an adequate sample size for the pattern analysis. The participants received 1 point for each factor if they were nonsmokers or not exposed to secondhand smoke by their guardians, did not consume alcohol, performed regular physical activity (>3 or 4 times per week) and had a normal bedtime sleep schedule according to age (>9 hours for the participants aged from 5 to 11 years and >8hrs for those aged from 12 to 18 years); otherwise they received 0 points for each corresponding factor [5,6].
BMI defined as Weight (kg) / Height2 (m2), was measured in each participant at T0 and the participants were categorized as overweight or obese when weight was above the 85th or the 95thpercentile for age and gender according to the CDC (Center of Disease Control) curves [7]. Blood Pressure (BP) was also measured with the appropriate cuff.
All eligible participants were assigned to receive two doses of the mRNA Vaccine BNT162b2 during the National Immunization Program against SARS-CoV-2.
The manufacturer’s (BioNTech/Pfizer) directives for storage and administration were ensured. In accordance with the CDC and local guidelines, all participants aged 12 years and above received two doses of 30μg (0.3 ml each) and all children aged 5 to 11 years received two doses of 10μg (0.2ml each), three to four weeks apart given intramuscularly into the deltoid muscle.

2.2. Study Design and Criteria

The enrolled vaccinated subjects met the following inclusion criteria: 1) age between 5 and 18 years old, 2) already assigned to receive the mRNA BNT162b2 vaccine during the National Immunization Program against SARS-CoV-2, 3) provided written informed consent by their legal guardians, 4) obliged to two blood samplings at T0 and T1.
Subjects with a history of current or recent febrile illness, history of recent vaccination, immunosuppression-associated underlying disease or under treatment with immunosuppressive drugs were excluded from the study.
Participants were stratified according to BMI and COVID-19 disease history prior to immunization.

2.3. Assessment of SARS-CoV-2 Binding Antibody and Biochemical Parameters

The protocol included anti-SARS-CoV-2 anti-spike IgG and neutralizing antibody (ab) measurement prior to vaccination (T0) and 14 days after the second dose (T1).
SARS-CoV-2 neutralizing abs were assessed using the cPass SARS-CoV-2 Neutralization Antibody Detection Kit (GenScript Biotech Corp., Piscataway, NJ, USA), employing a blocking Enzyme-Linked Immunosorbent Assay (ELISA) approach. The assay exhibits intra-assay and inter-assay variabilities of 8% and 10% respectively, with a detection limit of 2%. For SARS-CoV-2 anti-spike IgG measurement, we used the SERION ELISA agile SARS-CoV-2 IgG kit (Institut Virion\Serion GmbH, Wurzburg, Germany) based on the standard ELISA principle. The assay demonstrates intra-assay and inter-assay variabilities of 2.3% and 3.5% respectively, with a detection limit of 1 U/ml.
Due to enormously high values of anti-spike IgG abs impeding a quantitative measurement according to the standard care of the kit (maximum quantitative measurement 5000 U/l), we evaluated the immunogenicity of the cases using the OD values based on the following cut-offs: <0.25, negative; ≥ 0.25 to <0.4, borderline; and ≥0.4 positive. OD values were measured at 405 nm using the Tecan Infinite M200 reader (Tecan Group Ltd., Zürich, Switzerland).
The blood samples were centrifuged at 1600g, at 4oC for 14 min and the serum supernatant was stored at -80 oC. All serum samples were analyzed in the same batch at an ambient temperature of 24oC by experienced personnel who was blinded to the individual’s group (overweight-obese or normal-weight).
Βiochemical parameters including CRP, uric acid, lipidemic profile [Total Cholesterol (TCHOL), Low-Density Lipoprotein Cholesterol (LDL-C), High-Density Lipoprotein Cholesterol (HDL-C), triglycerides (TGs), Lipoprotein a: Lp(a)] and IR parameters such as insulin, glucose and HBA1c, were also surveyed from morning fasting blood samples at T0.
Concerning lipidemic profile, CRP and uric acid, blood samples were spun at 1600g, at 20oC for 7 min. Photometric method was used to analyze the serum samples via Cobas c501 analyzer (Roche diagnostics) and Immunoluminometric assay (ILMA) was used for measuring insulin via Cobas e601 analyzer (Roche diagnostics); spanning at 1600g, at 20oC for 10 min was preceded for the latter.
HbA1c levels in whole blood were measured using Hb NEXT (Menarini diagnostics), an automated HPLC (High-performance liquid chromatography) analyzer.
Fasting serum Glucose (mg/dl) to plasma Insulin (microU/ml) Ratio (FGIR) was used as the main surrogate index of IR with a cut-off of 6.5 [8]. Lower levels of FGIR are interpreted as greater IR.

2.4. Statistical Analysis

Qualitative variables were expressed as numbers with frequencies and percentages. Continuous variables were expressed as a median (Interquartile Range: IQR) οr mean ranks when the data did not follow a normal distribution and as a mean (95% CI: 95% Confidence Interval) for the normally distributed variables. Student's t-test was used for paired comparisons and the Mann-Whitney test was used for unpaired comparisons. Kruskal-Wallis was used when comparing multiple groups. Categorical variables were compared using the Chi-Square (χ2) test and Spearman’s rank correlation coefficient was used to assess correlations between continuous quantitative variables. The association between humoral ab titers and biochemical/lifestyle parameters was estimated via a stepwise method of multivariate linear regression both in seropositive and seronegative subgroups. All statistical analyses were conducted using IBM SPSS Statistics version 25.0 for Windows. Statistical significance was defined as p-value < 0.05.

3. Results

3.1. Demographic and Lifestyle Characteristics of Study Population

One hundred and eight (n=108) subjects were enrolled in the study. Twenty nine (n=29) participants were excluded due to drop out. Among the 79 participants, 5 reported an underlying disease in their medical history; three mentioned hypothyroidism, one had type 1 diabetes (insulin-dependent) and one reported epilepsy. They were all under treatment and their underlying disease was under control. All had a normal thyroid profile. Insulin resistance parameters (glucose, insulin, HBA1c) of the individual with type 1 diabetes were ruled out. The lipidemic parameters of one participant were also excluded from the study due to probably undiagnosed dyslipidemia (TCHOL: 62 mg/dl, LDL: 15mg/dl).
None of the participants in any age group reported sleep disorders, irregular bedtime schedules, or alcohol use. Regarding blood pressure (BP) measurements, only 7 out of 79 participants (5 with BMI >85th percentile and 2 with BMI <85th percentile) showed BP values between the 90th and 95th percentiles. However, after being referred to their physicians, twice-daily BP measurements over a two-week period revealed normal BP values, indicating a White Coat phenomenon. Consequently, sleep habits, alcohol consumption, and BP values were excluded from the analysis. All participants were of Greek origin, with 50.6% (40/79) being female and 63.3% (50/79) classified as adolescents (ages 12–18). The study population was initially divided into two subgroups based on BMI (Table 1). Forty-five percent (36/79) were categorized as overweight or obese, with an equal distribution of female and male participants. Of the overweight-obese group, 14 out of 36 were aged 5–11 years. Overweight-obese patients were 1.64 times more likely to have been exposed to smoke compared to those with normal weight [Χ2(1)=10.67, p<0.001, Cramer’s V= 0.4, p<0.001, Table 1].
During the 6 months prior to enrollment 33/79 participants reported positive history of mild COVID-19 disease. Mild disease history included afebrile status or low-grade fever (<38.5ο C), nasal congestion and/or sore throat and was verified by detection of abs at T0. RDT for SARS-CoV-2 was negative at T0. Almost half of the seropositive individuals (16/33) were overweight-obese and 54,5% (18/33) belonged to the younger age group. Younger participants were 2.8 times more likely to have a positive history for Covid-19 disease prior to vaccination [X2(1)=7.76, p 0.01, Cramer’s V= 0.31, p 0.01].

3.2. Results of Biochemical Profile of Study Population

Lower levels of HDL and FGIR and higher levels of CRP, HBA1c and uric acid were documented in the overweight-obese group with statistical significance regardless pre-vaccination disease history (p=0.006, p<0.001, p<0.001, p=0.006, p=0.009, respectively, Table 1).
When the population was divided according to COVID-19 disease history, CRP and FGIR were significantly higher in the overweight-obese group in both subgroups. HDL, uric acid, and HBA1c were statistically correlated with BMI only in the immune-naive group [Appendix A, Table A1]. COVID-19 disease history was not correlated with the latter biochemical parameters via parametric tests.
a)
According to Center of Disease Control (CDC) physical activity key guidelines for children and adolescents, exercise should include vigorous-intensity, muscle- and bone- strengthening physical activity at least three times per week
b)
According to KIDMED index, a score of 0–3 reflects poor adherence to the Mediterranean diet, a score of 4–7 describes average adherence and a score of 8–12 good adherence
c)
National Cholesterol Education Program (NCEP) Definition for Dyslipidemia in Children and Adolescents abnormal values were as followed: TCHOL≥200mg/dl, TGs≥ 100 mg/dL for ≤ 9 years old and ≥130 mg/dL for >10 years old, LDL-C≥130 mg/Dl, HDL-C<40 mg/dL and Lp(a) ≥30
d)
Normal ranges of CRP: 0-5 mg/l, HBA1C : 4.5-6.3% according to the Laboratory Manufacturer design
e)
According to literature abnormal values were considered when FGIR<7 both for prepubertal and pubertal participants & uric acid was >6.5mg/dl

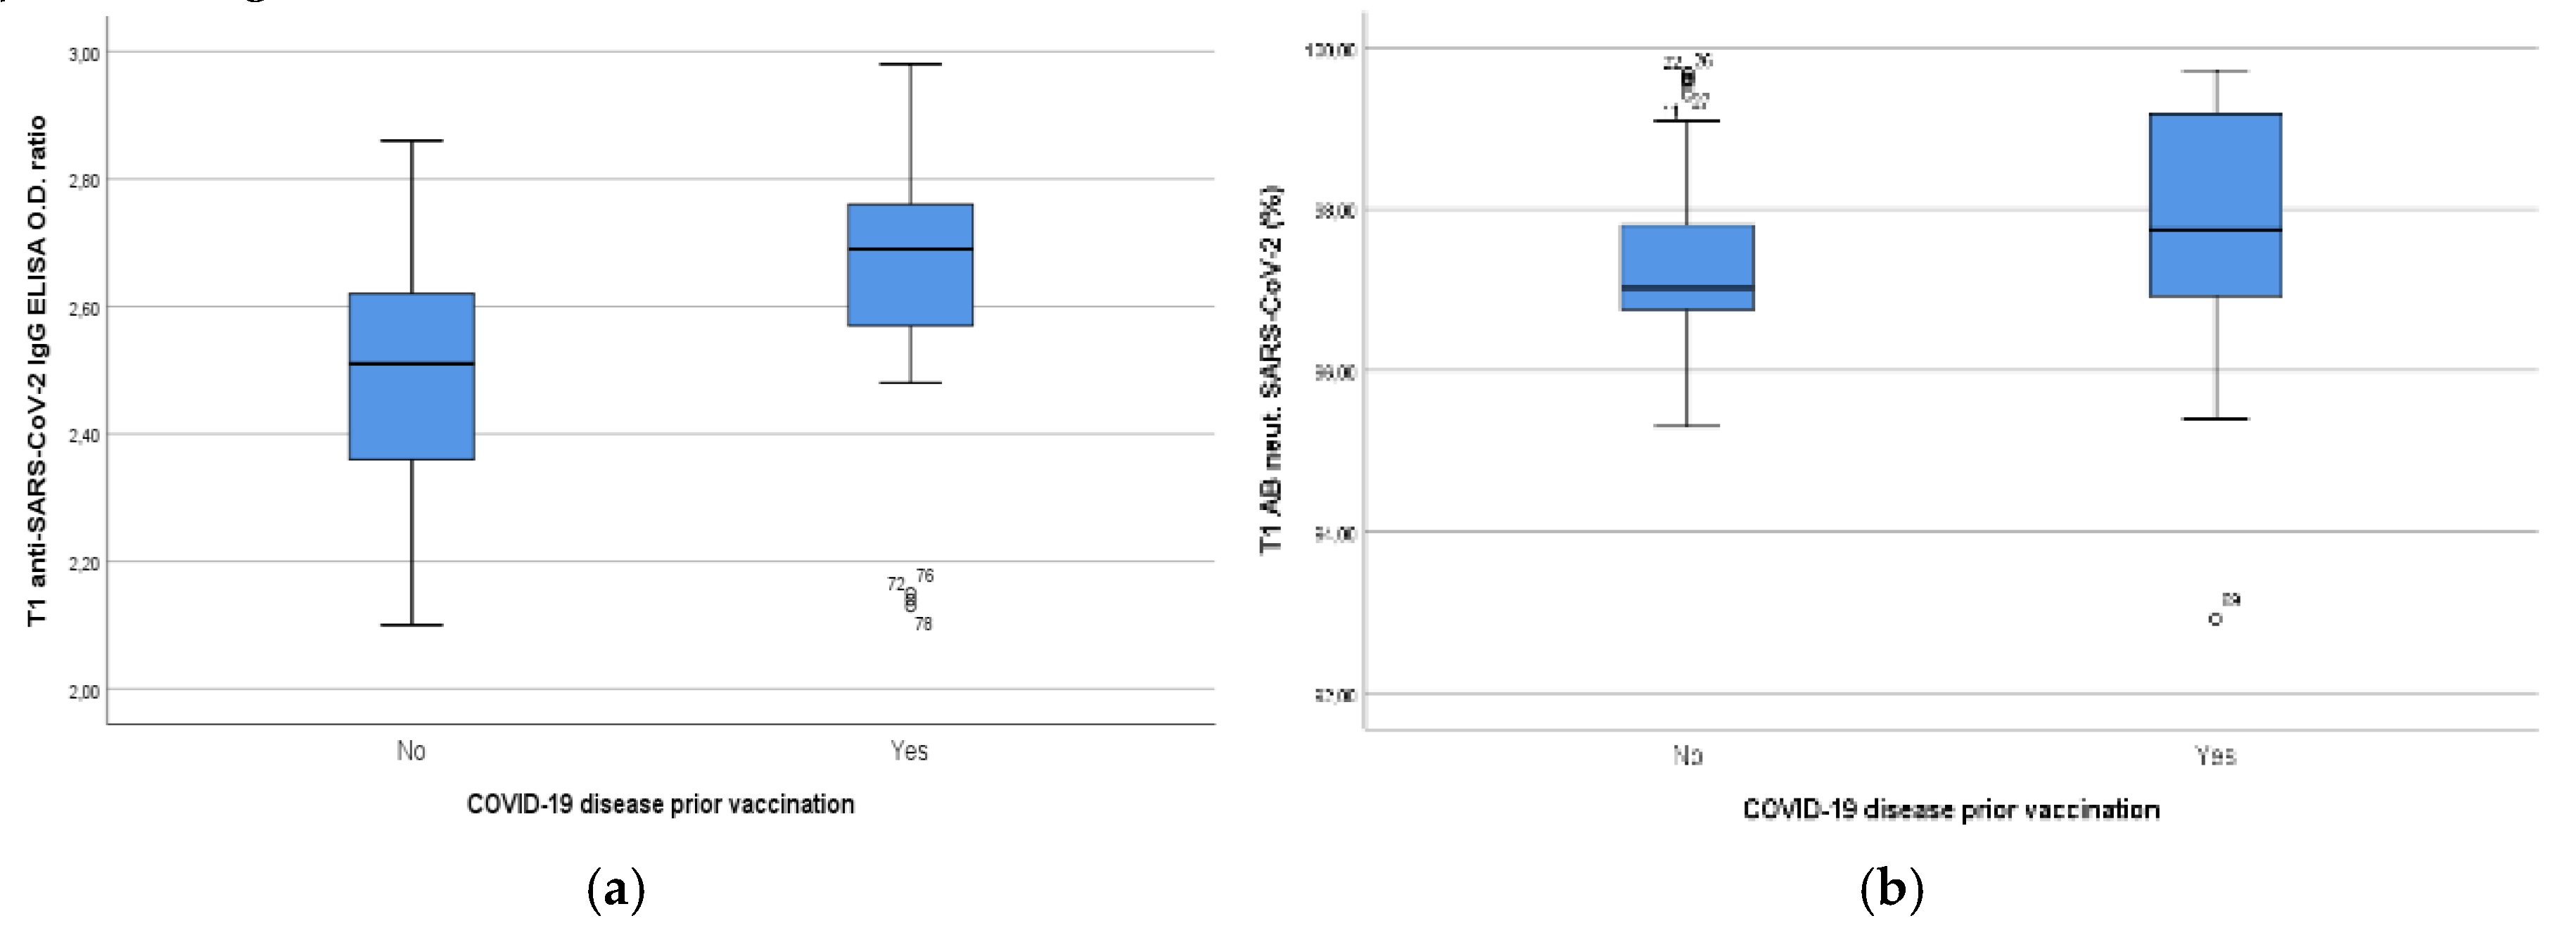
3.3. a Results of Humoral Immune Responses of Study Population Divided by BMI

After the second dose of BNT162b2, all of the vaccinated subjects developed a humoral immune response compared to the baseline (T0) serum level. As depicted in Figure 1, anti-SARS-CoV-2 IgG ELISA OD ratio at T1 was higher in the group with a positive previous Covid -19 disease history (p<0.001, Figure 1a), while SARS-CoV-2 Neutralizing ab levels were almost the same in the two groups (p=0.35, Figure 1b).
Anti-SARS-CoV-2 IgG OD ratio at T1 was significantly lower in the overweight-obese group compared to normal-weight group regardless pre-vaccination COVID-19 disease history [p=0.028; negative history & p=0.032; positive history, Table 2]. Neutralizing ab levels were lower in overweight-obese participants with statistical significance only in the previously seronegative group [p=0.008]. BMI was significantly associated with immune responses in convalescent sera at T0 regarding both IgG and Neutralizing ab titers [p=0.026 & p<0.001].

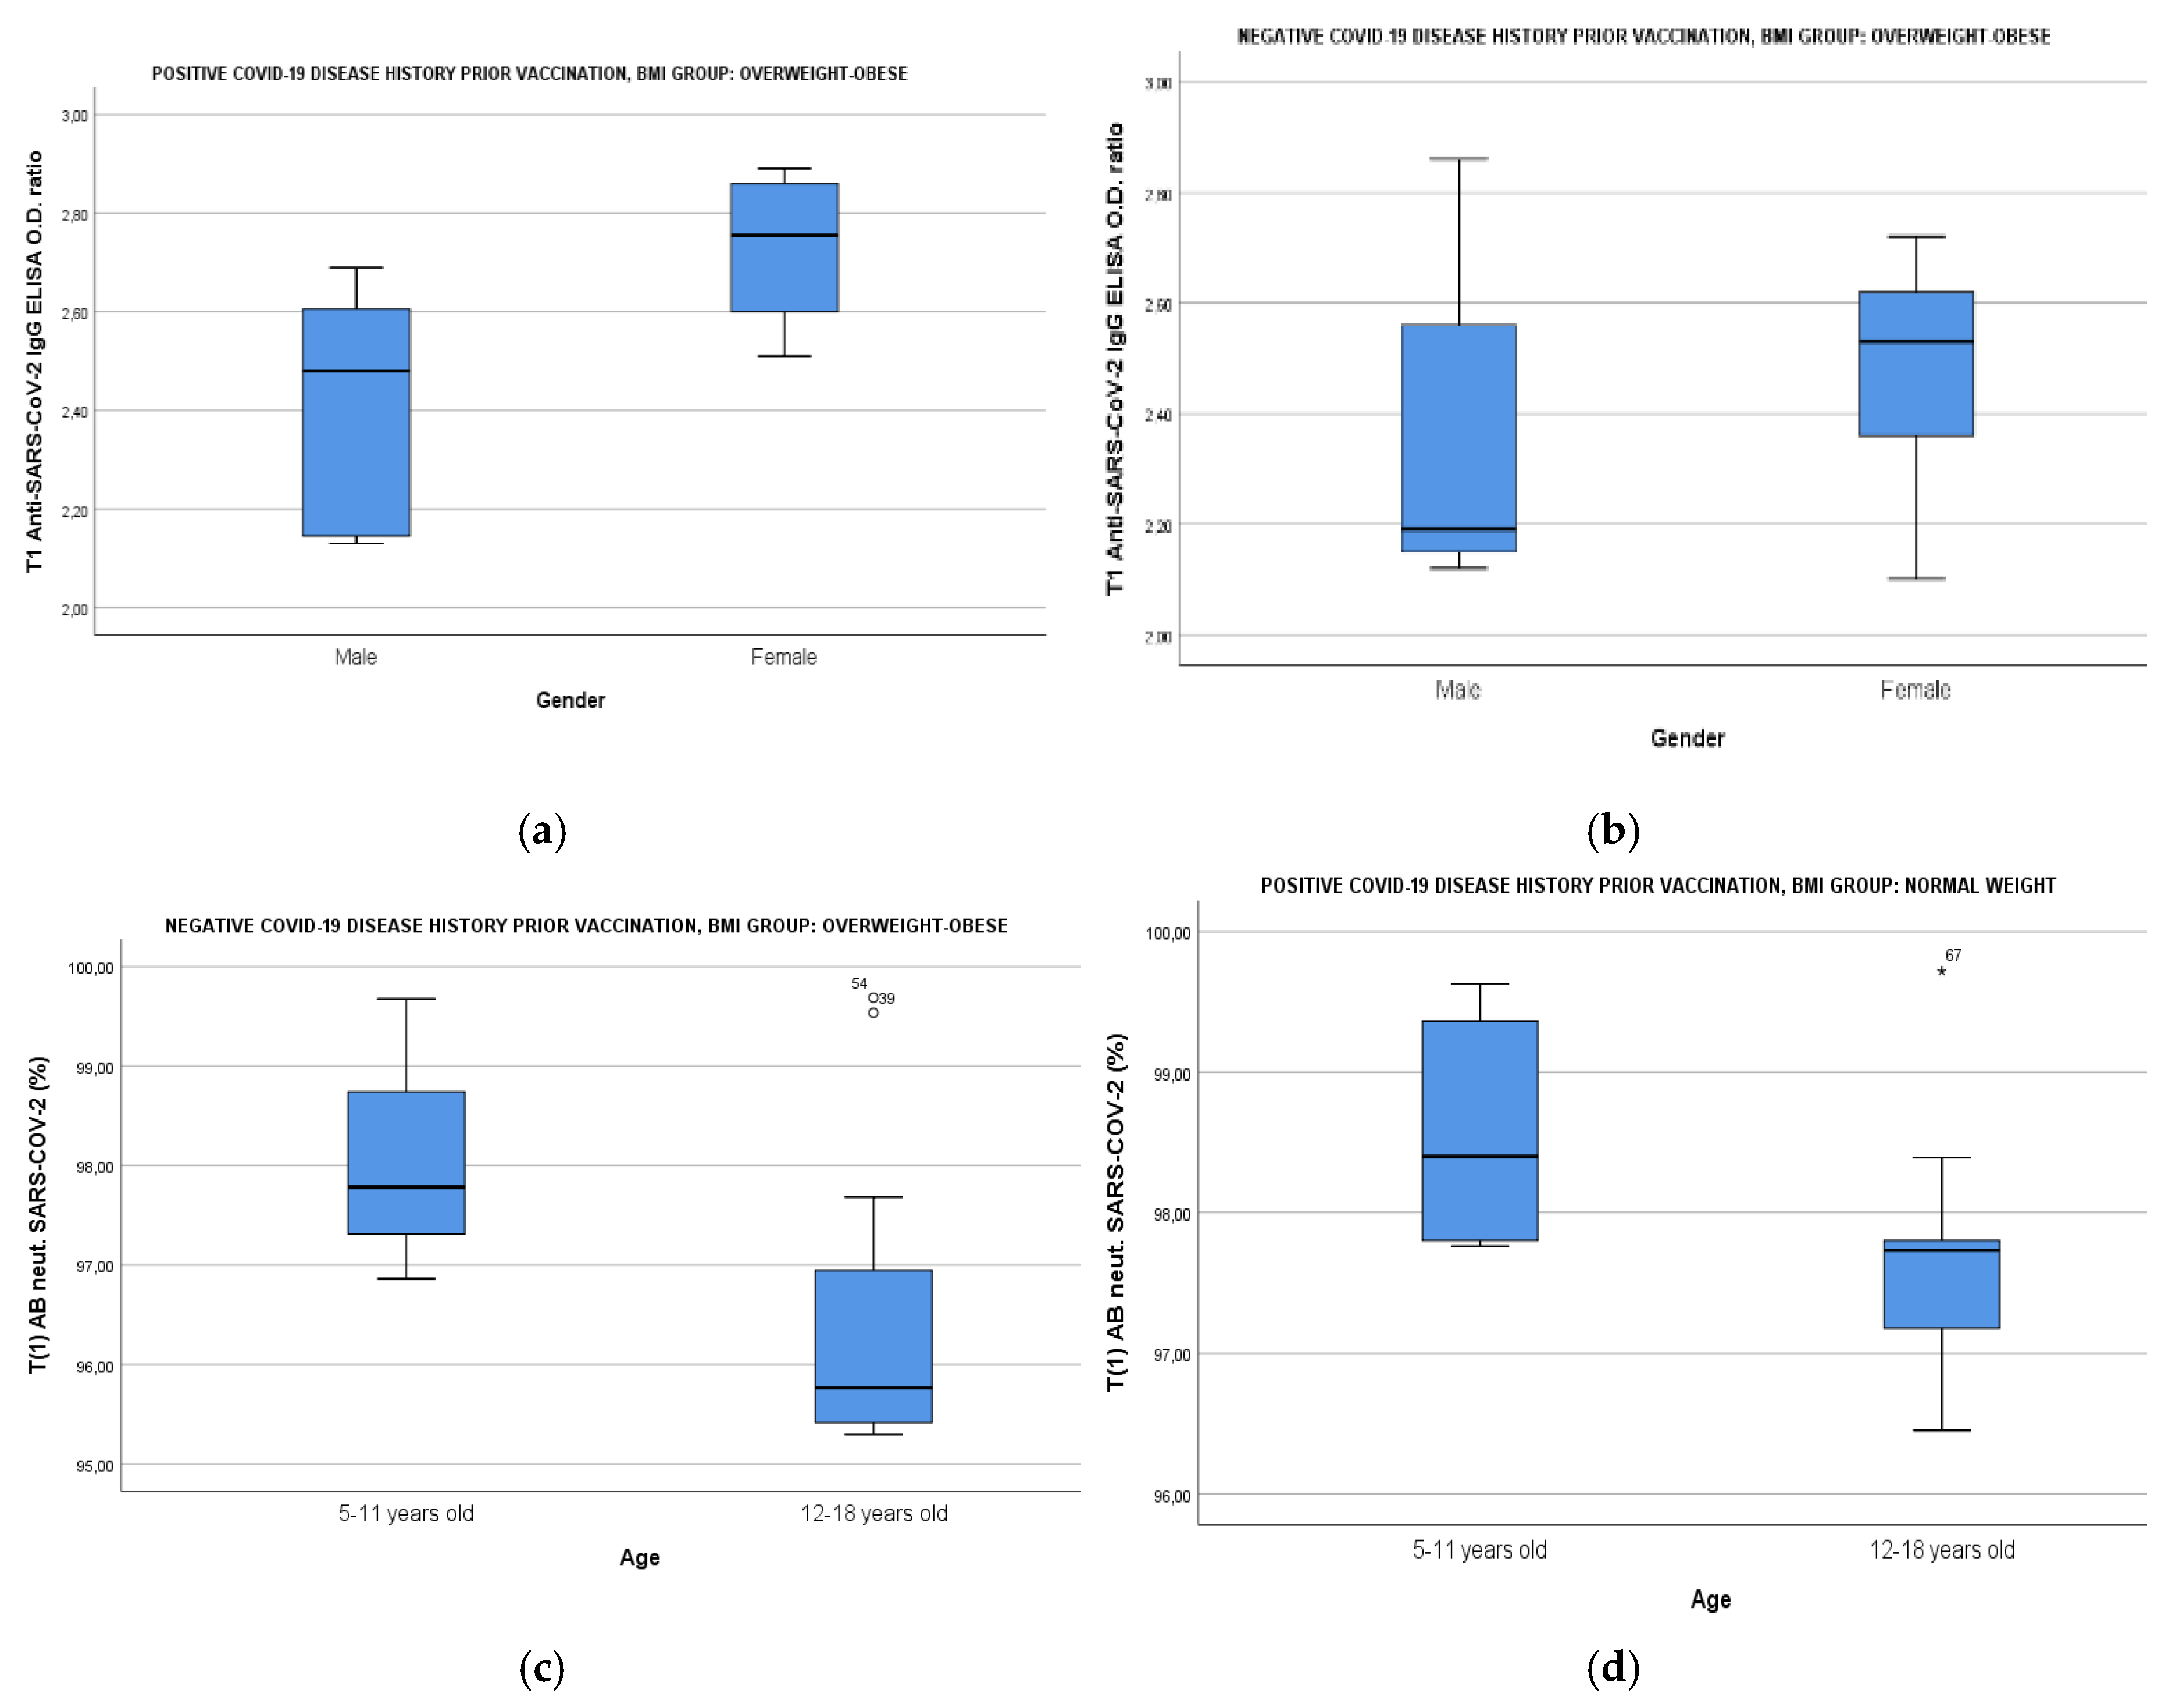
3.4. b Results of Humoral Immune Responses of Study Population According to BMI, Age & Gender

When the population was divided by BMI and disease history prior to immunization and correlated simultaneously with age and gender, the female vaccinees with overweight-obesity demonstrated significantly higher IgG ab responses both in the immune-naïve and the convalescent subgroup than the male vaccinees with overweight-obesity [Figure 2a: female IgG OD(CI 95%): 2.54(2.36-2.62) vs male IgG OD(CI 95%): 2.19(2.15-2.53), t(18)= -1.43, p 0.018 and Figure 2b: IgG OD(CI 95%): 2.79(2.60-2.85) vs male IgG OD(CI 95%): 2.41(2.21-2.61), t(14)= -3.24, p 0.009]. Finally, participants aged 5 to 11 years showed also higher Neutralizing ab levels in overweight-obese and seronegative subgroup [Figure 2c: 5-11 years old median neutralizing ab(IQR): 97.78(2.13) vs 12-18 years old median neutralizing ab(IQR): 95.76(1.54), U= 10, p 0.037] and in normal-weight and seronegative subgroup [Figure 2d: 5-11 years old median neutralizing ab(IQR): 98.40(1.54) vs 12-18 years old median neutralizing ab(IQR): 97.73(0.95),U=14, p 0.036].

3.5. c Impact of Smoke Exposure, BMI, FGIR, HBA1c and Uric Acid on Humoral Immune Responses of Study Population

A stepwise method of multivariate linear regression for potential confounding was performed by the inclusion of covariates. Data on multivariate analysis of humoral responses at T1 and at T0 for the convalescent group is documented in Table 3. Immune responses for the convalescent group before immunization who were exposed to smoke were by 0.55 lower regarding anti-SARS-CoV-2 IgG responses (b=-0.655, t=-3.14, p=0.004) and by 25.61% lower regarding SARS-CoV-2 Neutralizing abs (b=-25.61, t=-3.04, p=0.005) compared to those who were recovered from COVID-19 disease prior to vaccination but not exposed to smoke. An increase of BMI by 1Kg/m2 has led to a decrease of IgG ratio by 0.02 (b=-0.02, t=-3.36, p=0.002) and of neutralizing abs by 0.17% (b=-0.17, t=-4.47, p<0.001) in the immune-naïve group, while an increase of BMI by 1kg/m2 has led to a decrease of IgG ratio by 0.03 (b=-0.03, t=-5.17, p<0.001) and a decrease of neutralizing abs by 0.15% (b=-0.15, t=-2.80, p=0.009) in the convalescent group. Finally, concerning the latter group, an increase of HBA1c by 1% has led to a decrease of neutralizing abs by 1.36% (b=-1.36, t=-2.20, p=0.038) and to a decrease of IgG ratio by 0.17 (b=-0.17, t=-2.30, p=0.027). If the participants had IR the percentage of the neutralizing abs and the IgG ratio was lower by 1.52% (b=-1.52, t=-2.83, p=0.008) and 0.24 (b=-0.24, t=-3.64, p=0.001), respectively, compared to those who did not have IR. On the contrary, uric acid seemed to play a role in the immune-naïve group; an increase of uric acid by 1mg/dl led to a decrease of IgG ratio by 0.06 (b=-0.06, t=-2.47, p=0.018) and to a decrease of neutralizing abs by 0.59% (b=-0.59, t=-3.28, p=0.002).
Implementing Chi-square tests, FGIR was statistically correlated with smoke exposure with the possibility of demonstrating IR while exposed to smoke to be 2.32 higher than those not exposed to smoke [Χ2(1)=5.77, p=0.016, Cramer’s V= 0.27, p=0.017], but not statistically associated with age, gender and Covid-19 history before vaccination albeit there was a tension of the older subgroup to display 1.64 times lower FGIR than the younger ones [Χ2(1)=3.32, p=0.061]. BMI was only correlated with IR via a logistic linear regression; specifically the increase of BMI by 1kg/m2 seems to augment the possibility of IR by 61% [exp(B)=1.61, B= 0.49, p<0.001, Appendix B, Table A2].

4. Discussion

The COVID-19 pandemic has prompted to the development of a plethora of vaccines using various platforms. BNT162b2 COVID-19 vaccine is a mRNA–lipid nanoparticle vaccine encoding the SARS-CoV-2 spike protein (S) stabilized in the prefusion conformation [9,10]. Many studies have shown that this vaccine contributes to a robust protection from severe disease in children and adolescents [11,12]. In our study we tried to assess how increased BMI and deranged biochemical profile as well as lifestyle parameters linked to obesity such as smoke exposure, could have a negative impact on immune responses of children and adolescents following vaccination with the mRNA BNT162b2 vaccine.
Herein, humoral immune responses were compared between the seropositive and the seronegative groups at enrollement since about 40% of participants had a history of COVID-19 disease prior to immunization. The immune responses, especially the anti-SARS-CoV-2 anti-spike IgG levels, elicited in the convalescent group 14 days after the booster dose of BNT162b2 COVID-19 vaccine, were significantly higher than in the immune-naive group. This aligns with previous studies indicating that mRNA vaccines trigger rapid humoral responses in seropositive individuals with post-vaccine antibody titers [13,14]. On the other hand, virus neutralization is the main surrogate marker of vaccine robust humoral response against COVID-19 and mRNA vaccines are known to protect against severe disease [15]. When infected by the virus, complement activation increases immune responses by enhancing antibody neutralization of SARS-CoV-2; thus seropositive and seronegative vaccinated subjects reaching almost the same neutralizing ab levels at T1 could be expected [16,17].
Obesity is an ongoing global health issue in many countries, including Greece. According to the Organization for Economic Cooperation and Development (OECD) records, the prevalence of obesity in Greece is higher comparing to other countries of OECD, reaching the 17% of the population [18]. It is estimated that 41% of Greek children aged 5 to 9 years are diagnosed with overweight or obesity whereas the average percentage in other OECD countries is 31.4% [19].
Overweight and obesity are major risk factors for COVID-19 disease in all age groups, underlying the necessity for an effective COVID-19 vaccine in individuals with obesity [20]. Several studies have already shown that obesity is associated with impaired immune responses to several immunizations including those against influenza, hepatitis B, tetanus and SARS-CoV-2 [21,22,23,24]. Adipose tissue in obesity is characterized by the infiltration of interferon (INF)-γ-producing CD8+ and Th1 CD4+ T cells which promote the secretion of pro-inflammatory cytokines by macrophages that leads to chronic, ongoing inflammation and contributes to local and systemic IR. By contrast, in the adipose tissue of normal weight individuals the Th2 and T-regulatory (Tregs) CD4+ cells predominate and promote secretion of IL-10 and other anti-inflammatory cytokines from macrophages [25]. Manna et al. describes the dysfunction of the adipose tissue of overweight-obese individuals in biochemical level. Overload of intracellular and plasma glucose and free fatty acids lead to the generation of superoxide anion (O2•−), hydrogen peroxide (H2O2) and hydroxyl radicals (OH•) that constitute the reactive oxygenated species (ROS), by activating Nicotinamide adenine dinucleotide phosphate (NADPH) oxidases. In obesity, these superoxide radicals are in favor compared to antioxidants and are capable of the activation of transcription factors, such as the nuclear factor kB (NF-kB), promoting the production of pro-inflammatory cytokines and chemokines [26,27]. These findings of inflammation accompanying overweight-obese individuals damaging adaptive immunity are compatible with our results described in Table 2 and Table 3. It was shown that increased BMI, elevated HBA1C levels and low FGIR levels are associated with a reduction of COVID-19 vaccine-induced humoral immunity responses two weeks after the booster dose. Although there are studies supporting that COVID-19 infection often leads to glycemic derangement in patients with or without diabetes and that could be assumed in our study where FGIR and HBA1C affect negatively humoral responses only in the seropositive group [Table 3], a logistic linear regression model demonstrated that IR was only linked to increased BMI [Apendix B, Table A2].
Obesity has been associated with elevated uric acid, CRP, IR (low FGIR) and lower HDL levels that go in line with our results [Table 1]. The lower HDL levels could also be explained by the higher percentage of normal-weight participants reaching a good exercise score compared to the overweight-obese group, although these differences did not reach a statistically significant level (29). Uric acid is the end product of purine metabolism in humans. Studies have demonstrated that the mRNA expression and activity of xanthine oxidoreductase is increased in the adipose tissue of individuals with obesity leading to higher production and secretion of uric acid, whereas increased IR has been postulated to also increase serum uric acid by decreasing its renal clearance [30,31,32]. Although uric acid possesses an antioxidant capacity, this can be reversed at higher-than-normal levels. Literature supports that imbalances in micronutrients like uric acid can disrupt defense reactions against diseases or affect immune responses after vaccination [33]. According to Kubota et al., hyperuricemia in children and adolescents is defined as a serum uric acid level exceeding 2 SD above the mean [34,35]; therefore, a threshold of 6.5 mg/dl was set in this study for the abnormal values. Although only 5 participants with obesity had exceeded this threshold, uric acid was inversely correlated with immune responses [Table 3].
Age and gender are two significant demographic factors that play a crucial role in vaccine-induced immunity. Numerous studies have reported that younger individuals tend to exhibit favorable immune responses due to the abundance of switch memory B-cells, less inflammatory cytokines and the capacity to produce rapidly broad neutralizing abs [36]. In our study, which included only children and adolescents, the 5-11 year old participants (29 out of 79) exhibited even higher neutralizing antibody titers than their older counterparts, regardless of disease history or BMI. We might hypothesize that this phenomenon is due to the higher incidence of infection by the virus prior to immunization because of the emergence of SARS-CoV-2 variants with high transmissibility (e.g. Omicron). In addition, considering that the two age groups consisted of the same percentage of participants with overweight-obesity and normal-weight participants, this difference in immune response could be attributed to the lower FGIR displayed by the older ones probably due to the transient insulin sensitivity decrease during puberty, although literature supports that in otherwise healthy adolescents, pubertal IR is accompanied by compensatory insulin secretion (37). Female group demonstrated higher humoral responses at T1 even in the overweight-obese subgroup. Previous studies which examined the impact of gender on vaccine responses have shown that females usually mount more robust humoral and cellular immune responses to vaccination and infection, probably due to estrogen receptors (Era/β) being expressed on plenty of immune cells (38).
Finally, smoke exposure was significantly correlated with increased BMI and IR in our study, which is in agreement with previous studies supporting that pediatric obesity and passive smoking are interconnected [39]. Many reports have indicated the negative effect of smoking on both innate and adaptive immunity. Currently active smoking has been associated with immune cell count remodeling, production of inflammatory cytokines that further activate antibody-producing T cells leading to a cascade of reactions in response to the oxidative stress of smoking and decreased production of Immunoglobulins (IgG, IgA, IgM) [40,41,42]. Vardavas et al, reported that passive or second-hand smoking is capable of altering CD4+CD45RA+/CD4+CD45RO+ T-cell circulating subpopulations in the pediatric population provoking disease predisposition [42]. According to our findings, smoke exposure was negatively correlated with humoral titers of the convalescent group only at T0 [Table 3].
The present study had several limitations that deserve comment. It was a single center study and the number of participants was limited. They were all of Greek (Caucasian) ethnicity, therefore the sample is not representative of the entire population nor of non-Caucasian population. Overweight and obesity was described by BMI which cannot differentiate increased body weight from excessive fat-mass or fat-free mass. T- cell immunity was not analyzed in the study and smoke exposure was evaluated by parent reports of active indoor smoking and not by measuring a metabolite of nicotine (serum cotinine levels), as reported in other studies [43].

5. Conclusions

The presented research aimed to identify the key biochemical and lifestyle parameters that accompany the pediatric population with overweight-obesity and could adversely affect the immune responses to SARS-CoV-2 immunization. Considering that children have a more naϊve immune system that evolves with age, it is important to mitigate factors that may have a negative impact on the immune response. The implementation of healthy life habits and the development of an efficient vaccination program is of paramount importance.

Author Contributions

Conceptualization, A.D. and L.K.; methodology, A.M., M.A., D.G. and L.K.; software, A.D.; validation, L.K., M.C. and M.T.; formal analysis, A.D.; investigation, A.D. and A.M.; resources, A.M., M.A. and D.G; data curation, D.G., A.M., M.A., E.V.; writing—original draft preparation, A.D.; writing—review and editing, A.D., L.K. A.M., M.A., D.G., E.V., M.C., M.T.; visualization, A.D.; supervision, L.K.; project administration, L.K.; funding acquisition, A.D, M.T., L.K., M.C. All authors have read and agreed to the published version of the manuscript.

Funding

This research was funded by the Bank of Greece.

Institutional Review Board Statement

The study was conducted in accordance with the Declaration of Helsinki and was approved by the institutional scientific Ethics Committee of the “P.& A. Kyriakou” Athens Children’s Hospital (protocol code: 484/15.10.2021 and date of approval: 29-09-2021).

Informed Consent Statement

Informed consent was obtained from all parents or legal guardians of the patients.

Data Availability Statement

All data are available from the corresponding author upon reasonable request.

Conflicts of Interest

The authors declare no conflicts of interest. The funders had no role in the design of the study; in the collection, analyses, or interpretation of data; in the writing of the manuscript; or in the decision to publish the results.

Appendix A

Table A1. Laboratory findings of lipidemic profile and insulin resistance of normal-weight and overweight-obese participants both in seropositve and seronegative subgroups. BMI: Body Mass Index, HDL: High-Density Lipoprotein, CRP: C-Reactive Protein, HBA1C: Hemoglobin A1C, CI: Confidential Interval, FGIR: Fasting serum Glucose (mg/dl) to plasma Insulin (microU/ml) Ratio .
GROUP OF CHILDREN DIVIDED BY
BIOCHEMICAL PARAMETERS Negative Disease History Positive Disease History
Normal BMI Overweight-obese P -Value Normal BMI Overweight-obese P-Value
HDL (MG/DL)
MEAN (95% CI)I
62.50(56.81-68.19) 50.89 (45.79-56.00) 0.005 60.24(55.86-64.62) 58.31(51.48-65.15) 0.581
CRP (MG/L) MEAN RANK II 18.25 30.33 0.01 13.12 21.13 0.017
URIC ACID (MG/DL)
MEAN (95% CI) III
4.28 (3.92-4.64) 5.13 (4.61-5.66) 0.002 4.05 (3.57-4.54) 4.54 (3.81-5.28) 0.382
HBA1C (%) MEAN RANK II 18.96 28.05 0.021 15.12 19.00 0.261
FGIR MEAN RANK III 29.94 14.33 <0.001 20.88 12.88 0.017
  • National Cholesterol Education Program (NCEP) Definition for Dyslipidemia in Children and Adolescents abnormal values were as followed: TCHOL≥200mg/dl, TGs≥ 100 mg/dL for ≤ 9 years old and ≥130 mg/dL for >10 years old, LDL-C≥130 mg/Dl, HDL-C<40 mg/dL and Lp(a) ≥30
  • Normal ranges of CRP: 0-5 mg/l, HBA1C : 4.5-6.3% according to the Laboratory Manufacturer design
  • According to literature abnormal values were considered when FGIR4,5<6 both for prepubertal and pubertal participants & uric acid34,35 was >6.5mg/dl

Appendix B

Table A2. Logistic linear regression of FGIR as the dependent categorical variable with BMI, age, gender, smoke exposure and COVID-19 disease history prior to immunization as the independent variables. BMI: Body Mass Index, CI: Confidential Interval, FGIR: Fasting serum Glucose (mg/dl) to plasma Insulin (microU/ml) Ratio.
Variables in the Equation
B p-value Exp(B) 95% CI for EXP(B)
Lower Upper
BMI GROUP 0.48 <0.001 1.61 1.28 2.03
Smoke exposure -0.23 0.74 0.79 0.21 3.07
COVID-19 disease prior to vaccination 0.42 0.56 1.53 0.36 6.43
Gender 0.17 0.81 1.19 0.32 4.47
Age 0.53 0.53 1.71 0.33 8.54
Constant -11,37 <0.001 <0.001

References

  1. SARS-CoV-2 mRNA vaccination elicits robust antibody responses in children. Sci Transl Med. 2022 Nov 23;14(672):eabn9237. [CrossRef]
  2. Pivonello, C.; Negri, M.; Pivonello, R.; et al. How May Obesity-Induced Oxidative Stress Affect the Outcome of COVID-19 Vaccines? Lesson Learned from the Infection. Stresses 2021, 1, 119–122. [Google Scholar] [CrossRef]
  3. Painter, Scott D.; Ovsyannikova, Inna G.; Poland, Gregory A. The weight of obesity on the human immune response to vaccination, Vaccine, Volume 33, Issue 36, 2015, Pages 4422-4429, ISSN 0264-410X. [CrossRef]
  4. Serra-Majem, L.; Ribas, L.; García-Alvarez, A.; et al. “Nutrient adequacy and Mediterranean Diet in Spanish school children and adolescents” European Journal of Clinical Nutrition (2003) 57, Suppl 1, S35–S39. [CrossRef]
  5. Paruthi S, Brooks LJ, D’Ambrosio C et al. Recommended amount of sleep for pediatric populations: a consensus statement of the American Academy of Sleep Medicine. J Clin Sleep Med, 2016; 12, 785–786. [CrossRef]
  6. Piercy, KL.; Troiano, RP.; Ballard, RM.; et al. The Physical Activity Guidelines for Americans. JAMA. 2018 Nov 20;320(19):2020-2028. [CrossRef]
  7. Hampl SE, Hassink SG, Skinner AC et al. Clinical Practice Guideline for the Evaluation and Treatment of Children and Adolescents With Obesity. Pediatrics. 2023 Feb 1;151(2):e2022060640. [CrossRef]
  8. Ballerini, MG.; Bergadá, I.; Rodríguez, ME.; et al. Insulin level and insulin sensitivity indices among healthy children and adolescents. Arch Argent Pediatr. 2016 Aug 1;114(4):329-36. English, Spanish. [CrossRef]
  9. Jeyanathan, M.; Afkhami, S.; Smaill, F.; et al. Immunological considerations for COVID-19 vaccine strategies. Nat Rev Immunol. 2020 Oct;20(10):615-632. [CrossRef]
  10. Sahin, U.; Muik, A.; Vogler, I.; et al. BNT162b2 vaccine induces neutralizing antibodies and poly-specific T cells in humans. Nature 595, 572–577 (2021). [CrossRef]
  11. Frenck, RW Jr.; Klein, NP.; Kitchin N.; et al. Safety, Immunogenicity, and Efficacy of the BNT162b2 Covid-19 Vaccine in Adolescents. N Engl J Med. 2021 Jul 15;385(3):239-250. [CrossRef]
  12. Ali, K.; Berman, G.; Zhou, H.; et al. Evaluation of mRNA-1273 SARS-CoV-2 Vaccine in Adolescents. N Engl J Med. 2021 Dec 9;385(24):2241-2251. [CrossRef]
  13. Padoan, A.; Dall'Olmo, L.; Rocca, FD.; et al. Antibody response to first and second dose of BNT162b2 in a cohort of characterized healthcare workers. Clin Chim Acta. 2021 Aug;519:60-63. [CrossRef]
  14. Krammer, F.; Srivastava, K.; Alshammary, H.; et al. Antibody Responses in Seropositive Persons after a Single Dose of SARS-CoV-2 mRNA Vaccine. N Engl J Med. 2021 Apr 8;384(14):1372-1374. [CrossRef]
  15. Tregoning, JS.; Flight, KE.; Higham; et al. Progress of the COVID-19 vaccine effort: viruses, vaccines and variants versus efficacy, effectiveness and escape. Nat Rev Immunol. 2021 Oct;21(10):626-636. [CrossRef]
  16. Kurtovic, L.; Beeson, JG. Complement Factors in COVID-19 Therapeutics and Vaccines. Trends Immunol. 2021 Feb;42(2):94-103. [CrossRef]
  17. Jay, C.; Adland, E.; Csala, A.; et al. (2023) Age- and sex- specific differences in immune responses to BNT162b2 COVID-19 and live-attenuated influenza vaccines in UK adolescents. Front. Immunol. 14:1248630. [CrossRef]
  18. OECD (2019), Health at a Glance 2019: OECD Indicators, OECD Publishing, Paris. [CrossRef]
  19. OECD (2017), Health at a Glance 2017: OECD Indicators, OECD Publishing, Paris. [CrossRef]
  20. Brambilla, I.; Delle Cave, F.; Guarracino, C.; et al. Obesity and COVID-19 in children and adolescents: a double pandemic. Acta Biomed. 2022 Jun 6;93(S3):e2022195. [CrossRef]
  21. Sheridan, PA.; Paich, HA.; Handy, J.; et al. Obesity is associated with impaired immune response to influenza vaccination in humans. Int J Obes (Lond). 2012 Aug;36(8):1072-7. [CrossRef]
  22. Fan, W.; Chen, XF.; Shen, C.; et al. Hepatitis B vaccine response in obesity: A meta-analysis. Vaccine. 2016 Sep 14;34(40):4835-41. [CrossRef]
  23. Eliakim, A.; Schwindt, C.; Zaldivar, F.; et al. Reduced tetanus antibody titers in overweight children. Autoimmunity. 2006 Mar;39(2):137-41. [CrossRef]
  24. Pellin, R.; Venuti, A.; Pimpinelli, F.; et al. Initial observations on age, gender, BMI and hypertension in antibody responses to SARS-CoV-2 BNT162b2 vaccine. EClinicalMedicine. 2021 Jun;36:100928. [CrossRef]
  25. Lumeng, CN.; Bodzin, JL.; Saltiel, AR.; et al. Obesity induces a phenotypic switch in adipose tissue macrophage polarization. J Clin Invest. 2007 Jan;117(1):175-84. [CrossRef]
  26. Manna, P.; Jain, SK. Obesity, Oxidative Stress, Adipose Tissue Dysfunction, and the Associated Health Risks: Causes and Therapeutic Strategies. Metab Syndr Relat Disord. 2015 Dec;13(10):423-44. [CrossRef]
  27. Bakadia, BM. Boni, BOO.; Ahmed, AAQ.; et al. The impact of oxidative stress damage induced by the environmental stressors on COVID-19. Life Sci. 2021 Jan 1;264:118653. [CrossRef]
  28. Sen, S.; Chakraborty, R.; Kalita, P.; et al. Diabetes mellitus and COVID-19: Understanding the association in light of current evidence. World J Clin Cases. 2021 Oct 6;9(28):8327-8339.
  29. Ruiz-Ramie, JJ.; Barber, JL.; Sarzynski, MA. Effects of exercise on HDL functionality. Curr Opin Lipidol. 2019 Feb;30(1):16-23. [CrossRef]
  30. Tsushima, Y.; Nishizawa, H.; Tochino, Y.; et al. Uric acid secretion from adipose tissue and its increase in obesity. J Biol Chem. 2013 Sep 20;288(38):27138-27149. [CrossRef]
  31. Cheung, KJ.; Tzameli, I.; Pissios, P.; et al. Xanthine oxidoreductase is a regulator of adipogenesis and PPARgamma activity. Cell Metab. 2007 Feb;5(2):115-28. [CrossRef]
  32. Baldwin, W.; McRae, S.; Marek, G.; et al. Hyperuricemia as a mediator of the proinflammatory endocrine imbalance in the adipose tissue in a murine model of the metabolic syndrome. Diabetes. 2011 Apr;60(4):1258-69. [CrossRef]
  33. Morales, F.; Montserrat-de la Paz, S.; Leon, MJ.; et al. Effects of Malnutrition on the Immune System and Infection and the Role of Nutritional Strategies Regarding Improvements in Children's Health Status: A Literature Review. Nutrients. 2023 Dec 19;16(1):1. [CrossRef]
  34. Wilcox, WD. Abnormal serum uric acid levels in children. J Pediatr. 1996 Jun;128(6):731-41. [CrossRef]
  35. Kubota, M. Hyperuricemia in Children and Adolescents: Present Knowledge and Future Directions. J Nutr Metab. 2019 May 2;2019:3480718. [CrossRef]
  36. Carsetti, R.; Quintarelli, C.; Quinti, I.; et al. The immune system of children: the key to understanding SARS-CoV-2 susceptibility? Lancet Child Adolesc Health. 2020 Jun;4(6):414-416. [CrossRef]
  37. Kelsey, MM.; Zeitler, PS. Insulin Resistance of Puberty. Curr Diab Rep. 2016 Jul;16(7):64. [CrossRef]
  38. Klein, SL.; Marriott, I.; Fish, EN. Sex-based differences in immune function and responses to vaccination. Trans R Soc Trop Med Hyg. 2015 Jan;109(1):9-15. [CrossRef]
  39. Srivastava, P.; Trinh, TA.; Hallam, KT.; et al. The links between parental smoking and childhood obesity: data of the longitudinal study of Australian children. BMC Public Health. 2024 Jan 2;24(1):68. [CrossRef]
  40. Ferrara, P.; Ponticelli, D.; Agüero, F.; et al. Does smoking have an impact on the immunological response to COVID-19 vaccines? Evidence from the VASCO study and need for further studies. Public Health. 2022 Feb;203:97-99.
  41. Pedersen, KM.; Çolak, Y.; Ellervik, C.; et al. Smoking and Increased White and Red Blood Cells. Arterioscler Thromb Vasc Biol. 2019 May;39(5):965-977. [CrossRef]
  42. Vardavas, CI.; Plada, M.; Tzatzarakis, M.; et al. Passive smoking alters circulating naïve/memory lymphocyte T-cell subpopulations in children. Pediatr Allergy Immunol. 2010 Dec;21(8):1171-8. [CrossRef]
  43. Qiu, F.; Liang, CL.; Liu, H.; et al. Impacts of cigarette smoking on immune responsiveness: Up and down or upside down? Oncotarget. 2017 Jan 3;8(1):268-284. [CrossRef]
Figure 1. a) Anti-SARS-CoV-2 IgG ELISA O.D. ratio at T1 in participants with negative and positive COVID-19 disease history before immunization, b) SARS-CoV-2 Neutralizing AB levels at T1 in participants with negative and positive COVID-19 disease history before immunization, T1: 14 days after BNT162b2 booster dose, AB: Antibodies, O.D.: Optical Density.
Preprints 148876 g001
Figure 2. a) Anti-SARS-CoV-2 IgG ELISA O.D. ratio at T1 in overweight-obese participants with a positive COVID-19 disease history before immunization divided by gender, b) Anti-SARS-CoV-2 IgG ELISA O.D. ratio at T1 in overweight-obese participants with a negative COVID-19 disease history before immunization divided by gender, c) SARS-CoV-2 Neutralizing AB levels at T1 in normal-weight participants with a positive COVID-19 disease history before immunization divided by age, d) SARS-CoV-2 Neutralizing AB levels at T1 in overweight-obese participants with a negative COVID-19 disease history before immunization divided by age. T1: 14 days after BNT162b2 booster dose, AB: Antibodies, OD: Optical Density.
Preprints 148876 g002
Table 1. Demographic characteristics, lifestyle parameters (smoke exposure, physical activity, KIDMED score) and laboratory findings of normal-weight and overweight-obese participants. BMI: Body Mass Index. TCHOL: Total Cholesterol, TG: Triglycerides, LDL: Low-Density Lipoprotein, HDL: High-Density Lipoprotein, Lp(a): Lipoprotein (a), CRP: C-Reactive Protein, HBA1C: Hemoglobin A1C, CI: Confidential Interval, IQR: Interquartile Range, FGIR: Fasting serum Glucose (mg/dl) to plasma Insulin (microU/ml) Ratio. Body Mass Index (BMI), defined as Weight (kg) / Height2 (m2) according to Center of Disease Control (CDC) curves for age and gender.
BMI GROUPa P-value
Normal-weight Overweight-obese
Gender Female Number (%) 22 (55) 18 (45) 0.921
Age(years) 5-11 Number (%) 15 (51.7) 14 (48.3) 0.713
12-18 Number (%) 28 (56) 22 (44)
Smoking Score 1 Number (%) 29 (72.5) 11 (27.5) <0.001
0 Number (%) 11 (28.2) 28 (71.8)
Exercise Scoreb 0 Number (%) 14 (43.8) 18 (56.3) 0.212
1 Number (%) 29 (61.7) 18 (38.3)
Kidmed Scorec Poor (0-3) Number (%) 6 (50) 6 (50) 0.751
Moderate (4-7) Number (%) 24 (58.5) 41 (41.5)
Good (8) Number (%) 13 (50) 13 (50)
BIOCHEMICAL PARAMETERS TCHOL (mg/dl) MEAN (95% CI)d 150.19(144.65-155.72) 150.23(142.41-158.05) 0.924
TG (mg/dl) MEAN RANKd 33.73 36.59 0.135
LDL (mg/dl) MEAN (95% CI)d 81.82(76.54-87.11) 88.89(81.57-96.20) 0.269
HDL (mg/dl) MEAN (95% CI)d 61.60(57.87-65.34) 54.29(50.13-58.44) 0.006
Lp(A) (mg/dl) MEAN RANKd 38.23 41.06 0.581
CRP (mg/l) MEAN RANKe 30.79 51.00 <0.001
Uric acid (mg/dl) MEAN (95% CI)f 4.19 (3.91-4.47) 4.85 (4.42-5.28) 0.009
HBA1C (%) MEAN RANKe 33.36 46.67 0.006
FGIR MEAN RANKf 50.51 26.65 <0.001
Table 2. Anti-SARS-CoV-2 IgG OD ratio & SARS-CoV-2 Neutralizing AB (%) divided by BMI in immune-naïve and convalescent subgroups. BMI: Body Mass Index, OD: Optical Density, AB: Antibody, IgG: Immunoglobulin G. T0: prior to vaccination, T1: 14 days after BNT162b2 booster dose, T2: 6 months after BNT162b2 booster dose.
Number anti-SARS-CoV-2
IgG ELISA OD ratio
SARS-CoV-2
Neutralizing AB (%)
Sampling T0 ΜΕAΝ (95%CI) T1 ΜΕAΝ (95%CI) T0 MEDIAN (IQR) T1 ΜΕDIAΝ (IQR)
Negative Disease history prior to immunization
BMI
Normal-weight 26 0.09 (0.06-0.12) 2.55 (2.50-2.60) 2.60 (1.67) 97.51 (2.22)
Overweight-obese 20 0.08 (0.45-0.12) 2.42 (2.31-2.52) 2.43 (1.23) 96.34 (2.28)
P-value 0.60 0.028 0.88 0.008
Positive Disease history prior to immunization
BMI
Normal-weight 17 1.50 (1.22-1.78) 2.73 (2.66-2.80) 50.92 (44.16) 97.8 (1.55)
Overweight-obese 16 1.07 (0.79-1.36) 2.57 (2.44-2.70) 15.45 (36.86) 96.93 (3.96)
P-value 0.026 0.032 <0.001 0.07
Table 3. Stepwise method of multivariate linear regression of anti-SARS-CoV-2 IgG ELISA O.D. ratio and SARS-CoV-2 Neutralizing AB levels with BMI, age, gender and life style parameters (Smoke exposure, exercise, KIDMED SCORE) and of anti-SARS-CoV-2 IgG ELISA O.D. ratio and SARS-CoV-2 Neutralizing AB levels with biochemical profile (uric acid, TG, FGIR & HBA1c) and according to their COVID-19 disease history prior to vaccination both at T0 and T1 (T0: before vaccination, T1: 14 days after BNT162b2 booster dose). BMI: Body Mass Index, FGIR: Fasting serum Glucose (mg/dl) to plasma Insulin (microU/ml) Ratio, HBA1C: Hemoglobin A1C, TG: Triglycerides, R2: Adjusted R square.
COVID-19 DISEASE HISTORY PRIOR VACCINATION
Dependent Variables Independent Variables Negative Independent Variables Positive
Beta (95% CI) P-value Beta (95% CI) P-value
T0 anti-SARS-CoV-2 IgG - - - Smoke exposure -0.55 (-0.91;-0.20) 0.004(R2: 0.22)
Τ0SARS-CoV-2 Neutralizing (%) - - - Smoke exposure -25.61 (-42.77; -8.44) 0.005(R2: 0.21)
T1 anti-SARS-CoV-2 IgG BMI -0.02 (-0.03; -0.01) 0.002(R2: 0.19) BMI -0.03 (-0.04; -0.02) <0.001(R2: 0.45)
Uric acid -0.06(-0.114; -0.011) 0.018 (R2: 0.11) FGIR -0.24 (-0.38; -0.11) 0.001
(R2: 0.44)
HBA1c -0.17 (-0.33; -0.02) 0.027(R2: 0.44)
Τ1 SARS-CoV-2 Neutralizing (%) BMI -0.17(-0.25; -0.11) <0.001(R2: 0.30) BMI -0.15 (-0.26; -0.04) 0.009(R2: 0.30)
FGIR -1.52 (-2.62; -0.42) 0.008
(R2: 0.35)
Uric acid -0.59(-0.95; -0.23) 0.002 (R2: 0.19) HBA1c -1.36 (-2.63; -0.10) 0.038(R2: 0.35)
Disclaimer/Publisher’s Note: The statements, opinions and data contained in all publications are solely those of the individual author(s) and contributor(s) and not of MDPI and/or the editor(s). MDPI and/or the editor(s) disclaim responsibility for any injury to people or property resulting from any ideas, methods, instructions or products referred to in the content.
Copyright: This open access article is published under a Creative Commons CC BY 4.0 license, which permit the free download, distribution, and reuse, provided that the author and preprint are cited in any reuse.
Prerpints.org logo

Preprints.org is a free preprint server supported by MDPI in Basel, Switzerland.

Subscribe

Disclaimer

Terms of Use

Privacy Policy

Privacy Settings

© 2025 MDPI (Basel, Switzerland) unless otherwise stated