Submitted:
07 February 2025
Posted:
07 February 2025
You are already at the latest version
Abstract
According to the World Health Organization (WHO), approximately 5% of children and 2.5% of adults suffer from attention deficit hyperactivity disorder (ADHD). This disorder can have significant negative consequences on people’s lives, particularly children. In recent years, methods based on artificial intelligence and neuroimaging techniques, such as MRI, have made significant progress, paving the way for more reliable diagnostic methods than traditional clinical approaches. In this paper, we present our machine learning based analytical approach, more precisely, a novel feature extraction technique, to more accurately and reliably diagnose ADHD using clinically available neuroimaging data. Utilizing the ADHD200 dataset, which encompasses demographic factors and anatomical MRI scans in a diverse ADHD population, our study focuses on leveraging modern machine learning methods. The preprocessing stage employs a pre-trained Visual Geometry Group16 (VGG16) network to extract Two-Dimensional (2D) feature maps from anatomical 3D MRI data, thereby reducing computational complexity and enhancing efficiency. The inclusion of personal attributes, such as age, gender, intelligence quotient, and handedness, strengthens the diagnostic models. Four deep-learning architectures, Convolutional Neural Network 2D (CNN2D), CNN1D, Long Short-Term Memory (LSTM), and Gated Recurrent Units (GRU), were explored for the analysis of the MRI data, with and without inclusion of clinical characteristics. A 10-fold cross-validation revealed that the LSTM model, which incorporated both MRI data and personal attributes, had the best performance, achieving higher accuracy (0.8637) and area under the curve (AUC:0.9025). Our findings demonstrate that the proposed approach, which extracts 2D features from 3D MRI images and integrates these features with clinical characteristics, may be useful in diagnosis of ADHD with high accuracy.
Keywords:
ADHD diagnosis
; 3D MRI to 2D feature maps
; deep learning
; VGG16 model
; neuroimaging
; convolutional neural networks (CNN)
; MRI
Introduction
Attention deficit hyperactivity disorder (ADHD) is a neurodevelopmental condition that manifests as defocusing, restlessness, and excessive reaction [1]. Since ADHD is a major public health problem among children as well as adults across the globe, it’s essential to make the correct and early diagnosis [2]. However, the diagnosis and understanding of ADHD has historically suffered due to its variable manifestations and the subjective nature of its symptoms [3]. Diagnostic and Statistical Manual of Mental Disorders (DSM-5) and other diagnostic instruments use subjective behavior evaluation, which is difficult to standardize among different practitioners and examiners [4]. Recent advancements in neuroimaging have made objective assessments of ADHD possible [5], which previously relied on subjective clinical evaluations alone [6].
To this end, it is important for diagnosis based on the Magnetic Resonance Imaging (MRI) images to be more consistent and reliable which can be made possible by searching the objective biomarkers [7]. Recent MRI developments have resulted in better and detailed imaging of the brain structures and tissues [8]. As part of a quantitative analysis, precision, accuracy and reproducibility are important when measuring volumes and changes[9]. Use of combined MRI images with Artificial Intelligence (AI), such as deep machine learning, for automatic detection and monitoring of disease and therapy response increases precision and efficiency of Health Care system [10,11,12]. However, model performance for ADHD diagnosis has been limited so far [13]. A recent study, integrating the multimodal features of structural and functional MRIs and Diffusion Tensor Images (DTI) for the diagnosis of early adolescent ADHD, achieved an AUC of 0.69 and 0.64 of classification accuracy for ADHD diagnosis [14]. In another study, Sen et al. [15], using the ADHD-200 holdout data, achieved an accuracy of 0.67. In a recent study, Choi et al. [16] achieved an AUC of 0.86 in predicting ADHD. Further, there is a considerable difference in the performance of AI model in diagnosing ADHD compared to other medical conditions [13], suggesting an urgent need and scope for developing an innovative approach to boost the model performance. In addition, the introduction of clinical characteristics, such as, age, sex, handedness, and intellectual quotient further strengthens the performance of the analysis by incorporating previously established risk factors for ADHD [17]. Studies have shown connections of lower Intellectual Quotients (IQ) with ADHD and a connection between ADHD and left-handedness [18]. Incorporation of the clinical characteristics should significantly enhance the accuracy and precision of the models in predicting ADHD.
The ADHD200 dataset (a publicly available dataset), originating from a collaborative effort coordinated by the Neuro Bureau, constitutes a pivotal resource for investigating ADHD through advanced data processing and machine learning methods [20]. This dataset, collected from multiple international research centers, including Peking University, Bradley Hospital (Brown University), Kennedy Krieger Institute, The Donders Institute, New York University Child Study Center, Oregon Health and Science University, University of Pittsburgh, and Washington University in St. Louis, provides a comprehensive repository of MRI scans and demographic information, facilitating a nuanced exploration of ADHD. Originating as part of the ADHD-200 contest in 2011, this dataset encompasses clinical and neuroimaging data from diverse sources, with resting-state functional and structural MRI images from 973 patients. It covers individuals with typical development and those diagnosed with ADHD across three subtypes: Inattentive (ADHD I), Hyperactive-Impulsive (ADHD HI), and a combination of both (ADHD C). The diverse origins and extensive nature of the dataset offer both challenges and opportunities for developing robust diagnostic models.
An important criterion is the pre-processing of the input data. Both demographic data and MRI are crucial to guarantee the quality and integrity of the analyses. The dataset becomes more useful for machine learning purposes by way of quality control measures. This process mitigates the effects of noise and errors, thus ensuring that the derived models are as valid and generalizable as possible. Although 3D Convolutional Neural Networks (CNNs) are implemented to work with volumetric data, they consume much more computational resources and memory [19]. Research has shown that transformation of 3D neuroimaging data into Two-Dimensional (2D) slices is possible, which maintains critical pieces of clinical data, is computationally efficient and requires less memory storage [20]. Furthermore, other neurodevelopmental and neurodegenerative disorders have been diagnosed using 2D models by generating the slices from the regions of interest [21]. In light of the multifaceted and distributed nature of ADHD, 2D slices retain the morphological characteristics relevant for its identification [22]. This approach makes it possible to employ already pretrained models such as the Visual Geometry Group16 (VGG16), which can effectively handle 2D images and reduce the workload [23].
In the current study, we use a pre-trained VGG16 network to extract features from MRI data. This approach allows deep learning models to utilize these extracted features, significantly reducing the computational costs of training of complex, large MRI datasets. Converting 3D MRIs to 2D feature maps decreases computational cost and enables the utilization of existing 2D image processing methods, better scalability and advanced model development. We employed various deep learning architectures, including CNNs, Long Short-Term Memory networks (LSTMs), and Gated Recurrent Units (GRUs), to investigate model effectiveness from different standpoints. Consequently, the models were generated with and without inclusion of the personal attributes, thereby testing the additive value of personal attributes to these models. To ensure the predictive power and the models’ capabilities, we implemented a strict training and evaluation protocol. To ensure the robustness of the findings, we employed 10 folds cross-validation. We created a ground truth benchmark for effective diagnosis of the ADHD using deep learning methodology. To the best of our knowledge, this is the first study to use this methodology in ADHD. The knowledge derived from this study hopefully will lead to the development of a rigorous, reliable, faster and more accurateAI-driven detection tool for this common neurological condition, using readily and widely available clinical and MRI data.
Materials and Methods
Data Sources:
- ADHD200 Dataset
Before participating in the study all participants (or their legal guardians) provided signed written consent after obtaining approval from the relevant research ethics review boards in St. Louis. These participants had no history of neurological or medical illness other than ADHD. The ADHD 200 collection is considered a dataset due to its inclusion of instances from various geographical locations. During data collection, factors such as IQ, the presence of secondary conditions, and other demographic variables were taken into account as they can influence the prevalence and characteristics of ADHD.
The diagnostic criteria for ADHD can be found in the overview of the ADHD dataset (link: https://fcon_1000.projects.nitrc.org/indi/adhd200/index.html). The variability in this dataset arises from using scanners and parameters across sites. This diversity makes it a valuable resource for developing generalizable models.
To preprocess the resting state MRI data, we utilized the Athena pipeline (link: https://neurobureau.projects.nitrc.org/ADHD200/Data.html). For an understanding of this pipeline’s methodology refer to Bellec et al. work [24]. The resting-state MRI information in the ADHD200 dataset also included data about each subject, such as age, gender, dominant hand preference, and intelligence scores. In this study we considered all 592 subjects who had resting state MRI scans and had complete information about their characteristics.
- Demographic Information
The ADHD 200 dataset includes a range of characteristics, such as age, gender, IQ scores, handedness, secondary illnesses, for quality controls and ADHD labeling.
Inclusion of demographic data, such as age and gender, in the analysis is important, as these parameters have been shown to be associated with ADHD and may eventually impact the clinical outcomes. Also, their integration in the final analysis will help in understanding their influence on final outcome.
The other notable dimension for the data set includes IQ. Earlier research has demonstrated some relationship between a lower level of intelligence and increased chances of ADHD manifestation [25]. Therefore, we included IQ scores as an independent variable in our model.
Interestingly, some prior research indicates handedness may be a risk factor for the development of ADHD [3]. The addition of a handedness in our analysis may be a useful variable for further investigation [26].
The dataset adopts a labeling scheme for the diagnosis of ADHD with ‘0’ signifying Typically Developing Children (TDC)/non-ADHD, ‘1’ referring to Combined ADHD, ‘2’ being Hyperactive, and ‘3’ depicting Inattentive ADHD. Diagnostic labeling follows well-known classification providing an opportunity to identify subtypes of ADHD in the data set.
Although our study is sensitive to subtypes of ADHD, our primary focus was to explore ADHD at a group level. By taking a broad view, we will be able to look at the different facets of ADHD that interplay with such demographic characteristics as age, gender, and ethnicity, which could improve the validity and applicability of our study.
Data Preprocessing:
- Demographic Data Preprocessing
The ADHD200 dataset includes two columns devoted to quality control of demographic variables, one for each data collection site. These Quality Control (QC) columns can take on the following values: '0' indicating 'Questionable' data and '1' indicating data that 'Passes' quality control. We excluded entries where both QC_Athena and QC_NIAK were equal to '0,' ensuring that only high-quality data were retained.
Another form of filtering was employed to ensure the accuracy of alignment of the label values. The labels, which represent diagnostic categories, were required to contain only legitimate numbers ranging from 0 to 3 The columns associated with Handedness, Age, Gender, and Full4IQ then underwent scrutiny, and any entries with unacceptable values were filtered out. Finally, a new column named LD_OR_ODD, having a value of '1' if any Learning Disorder (LD) or Oppositional Defiant Disorder (ODD) appeared among the Secondary_DX, was added to the dataset. Afterward, labels were converted into binary. The study has only been aimed for identifying the presence of ADHD without considering subtypes, therefore it is important to categorize anything that appears as all abnormal cases with code '1' and normal cases with code '0.'
In the next step, we extracted age, gender, handedness, full 4 IQ, and LD_or_ODD from the initial file to serve as demographic attributes.
It was converted into a range from 0 to 1 in the last step of preprocessing in preparation for model training phases.
After following these steps, the total number of data points was 758, including 479 non-ADHD and 279 ADHD subjects. The Figure 1 and Figure 2 shows the distributions of the gender and age for the whole dataset and for ADHD population respectively.
- MRI Data Preprocessing:
In this study, we only used the data from 6 databases including the WASHU, OHSU, NYU, Neuroimage, KKI, and Beijing centers. Furthermore, we only included T1 MPREAGE image from the data of each center. Native MRI T1 images are valuable for deep learning in medical imaging due to their superior tissue contrast and accurate anatomical structure identification. In addition, T1-weighted images provide excellent spatial resolution and increase the accuracy of deep learning algorithms in various clinical applications.
The initial step of preprocessing the neuroimaging data involved the MRI data being reshaped into 200 slices each. If the quantity of slices in the image exceeded 200, then the middle 200 were chosen, which included entire brain. However, if an image had fewer slices, we introduced equal numbers of black slices in the front and end portions of the images. Finally, because the image slices were required to be fed one at a time into a pre-trained VGG16 network, we scaled them down to (224 × 224) resolution. Therefore, the next step set the dimensions of each MRI image to (200, 224, 224); after which they were resized in terms of the resolution and then cropped into the final format of (224, 224).
In addition, as VGG16 input requires 3-channel 2D images, it was essential to process all grey-scale MRI image slices to make them 3-channeled before using them to train the model. This is where we copied the same values from the single channel onto other two channels and converted them into a 3-channel images.
Feature Extraction:
- 2D Feature Extraction with VGG16:
The goal was to have an efficient process that would reduce the number of calculations and memory space requirements while producing acceptable outcomes. Therefore, we used an approach for extracting 2D feature maps from 3D MRI scans.
This technique is novel by virtue of transforming the interslice correlations of MRI images’ depth relations into correlations along a lateral direction between the successive aggregated results arising from the concatenation of 1-dimensional (1D) features obtained via assistance from VGG16 network.
To achieve this, proper preprocessing steps are applied to the MRI images and a pre-trained VGG16 model based on ImageNet was employed. To repurpose it purely as a feature extractor, we remove the classification relevant layers of the VGG16 model and add an extra layer containing 20 dense units to use it to obtain extracted features. Then we extract 20 features for each slice. As this is our next step after preprocessing, we changed the number of slices per MRI image to 200. we therefore connect each of these features across all the slices comprising an MRI image to create a feature map in the form of (200, 20) for every 3D MRI image.
To decide the number of features for each MRI slice, empirical evaluations were applied to reduce the model complexity while reducing computational time. This number of features (20) preserves important details of the patient’s anatomy while reducing the data fitting problem. It is well documented that ADHD impacts various parts of the brain, including the prefrontal cortex, basal ganglia, and corpus callosum, which are visually identifiable in the extracted axial slices [27]. VGG16 was used in preference to other models because it was pre-trained on a large and diverse dataset, allowing for efficient feature extraction; this was supported by the results of the Class Activation Mapping (CAM) technique which confirmed that the model was focusing on the appropriate areas of the brain when diagnosing [28]. This approach helps to represent features correctly and ensures calculation efficiency. This process is shown in Figure 3.
In Figure 4, a sample of MRI image from the ADHD200 dataset is presented after undergoing necessary preprocessing steps, resulting in 200 slices. The left side displays the original MRI slices, while the corresponding 2D feature map is shown on the right. The noticeable reduction in data size resembles a one-way compression applied to the original MRI images.
As mentioned earlier, we extracted 20 features for each slice of every MRI image within the ADHD200 dataset. To provide clarity regarding the regions from which these 20 features were extracted, we employed the class activation mapping (CAM) technique. CAM offers a spatial understanding of the CNN's decision-making process, aiding in the interpretation and explanation of model predictions [29]. CAM is a technique utilized to visualize and comprehend which regions of an input image contribute the most to the final prediction of a convolutional neural network (CNN). This is achieved by obtaining an activation map through the average across all channels, indicating the importance of each spatial location. The CAM results led us to identify high-level features, including anatomical structures indicative of ADHD. As shown in Figure 5, the heatmap highlights regions in the original MRI slice that contribute the most to the activation of the last convolutional layer in the VGG16 model. The heatmap is then overlaid onto the original image. In some black slices that extend to the original 3D MRI for the purpose of standardizing sample sizes, random heatmaps may be observed. However, in slices that represent actual brain slices, we generally observe discernible areas of the brain selected for further feature extraction steps. It is important to note that this sample selection was performed entirely randomly within the entire dataset.
The combination of 2D conversion approach with pre-trained models could also be less computationally demanding compared to using 3D MRI images directly with a CNN3D network. Here are a few ways in which our approach may help reduce time complexity:
- 3D to 2D Conversion: Converting 3D MRI scans into 2D images simplifies the data, enabling faster processing while reducing computational load.
- Advantage of Pre-trained Models: Models like VGG16, which are already trained on previously large datasets such as ImageNet, save time and computational resources.
- 2D Convolutional Efficiency: 2D convolutional layers, as used in VGG16, are more computationally efficient than 3D layers, accelerating the feature extraction process.
- Parallel Processing Advantages: Many deep learning tools and hardware better support 2D data parallel processing, enhancing computational efficiency compared to more complex 3D data.
One of the key benefits that arises from our proposed approach is to avoid the loading and processing of whole 3D MRI volumes. Here are some key advantages of our approach in this process:
- Reduced Memory Usage: Instead of using whole 3D volumes, the usage of 2D feature maps leads to lower memory requirement than that of a normal approach. With this option, it becomes easier to handle big MRI datasets since there is always a limitation on the amount of information that memory can hold at one time: especially in dealing with 3D information sets.
- Faster Data Loading: Loading and preprocessing of data also becomes fast as one only loads a single 2D slice of MRI data into the system instead of the whole volume. It results in quicker training and testing times.
- Scalability: This approach requires fewer resources lesser memory and processor capacity, thus making it possible to work with big data sets, large images, or low-powered devices.
- Parallel Processing: Modern hardware may find it easier to process 2D data in a parallel fashion, thus making the computations more efficient.
- Ease of Implementation: Working with 2D feature maps is usually easier to understand and implement, conceptually simpler than 3D CNNs. It will make this approach easier for other researchers.
- Preservation of Important Information: Although it reduces dimensionality, the 2D-conversion preserves important information in most cases, as indicated by our outcome of precision. It thus implies that it could be a good compromise of both computational efficiency and diagnostic accuracy.
- Less Data Handling Complexity: Handling and visualizing 2D data is much easier compared to dealing with 3D one, so developing and debugging of this model becomes quite simple.
It is likely that this approach may make it easier to use deep learning for MRI data, especially in cases with limited computational resources.
Model Architecture:
- Models Tested:
In this step, it appeared possible that models intended to find the spatial correlation between image pixels could detect these connections [30], since the objective is to investigate how well the deep connections between the slices of 3D MRI images can be translated into lateral connections in 2D feature maps. To this end, we conducted four distinct deep learning models including CNN2D, CNN1D, LSTM, and GRU.
These four models were investigated in two scenarios: first, considering only MRI data, and second, combining MRI data with personal attributes (reflecting the positive effects reported in the previous studies that included personal attributes along with MRI data for ADHD diagnosis [31]). The architecture of the four models, which incorporate personal attributes and extracted feature maps as input data, is depicted in Figure 6.
In this study we used 5 personal attributes including Age, Gender, Full4IQ, Handedness, and LD_or_ODD. It can be observed from Figure 6 that the MRI images were fed to 4 models, including GRU, LSTM, CNN2D, and CNN1D, and 2D features were extracted, followed by adding the 5 personal attributes into the dense layers. These personal attributes, along with the 2D features extracted from MRI images were used for the classification of ADHD and non-ADHD subjects.
Training and Evaluation:
- Data Splitting:
Due to the imbalanced dataset between the 2 labels (ADHD vs. non-ADHD), a down-sampling method was implemented to ensure an equal number of data points in each class. To this end, after down-sampling, 172 subjects were selected in each class.
To further investigate the generalization property of the model and more accurate model evaluation, 10-fold cross-validation was applied. Therefore, in each fold, approximately 10% of the data was spilt to the test set and the remaining 90% to the train set.
In each of the eight models (four models with and four without clinical variables), a batch size of 8 was used. Additionally, the Adam optimizer and binary cross-entropy were employed to improve training efficiency and convergence.
To prevent overfitting, L2 regularization has been used as it prevents model overfitting by penalizing large weights during training. A regularization strength of 0.01 was used for all these models.
The number of epochs for the models was set to 100, but due to the use of early stopping with a patience of 10, there may be fewer epochs in each fold. In the tested models, early stopping works by tracking validation-accuracy and at the end of each fold, the model weights with the best performance on this metric among the different epochs are saved.
Performance of the models was examined by calculating metrics such as accuracy, area under the curve (AUC), F1-score (the harmonic mean of precision (positive predictive value) and recall (sensitivity), and the results of each fold was also compared as well for a more precise and general evaluation.
Results
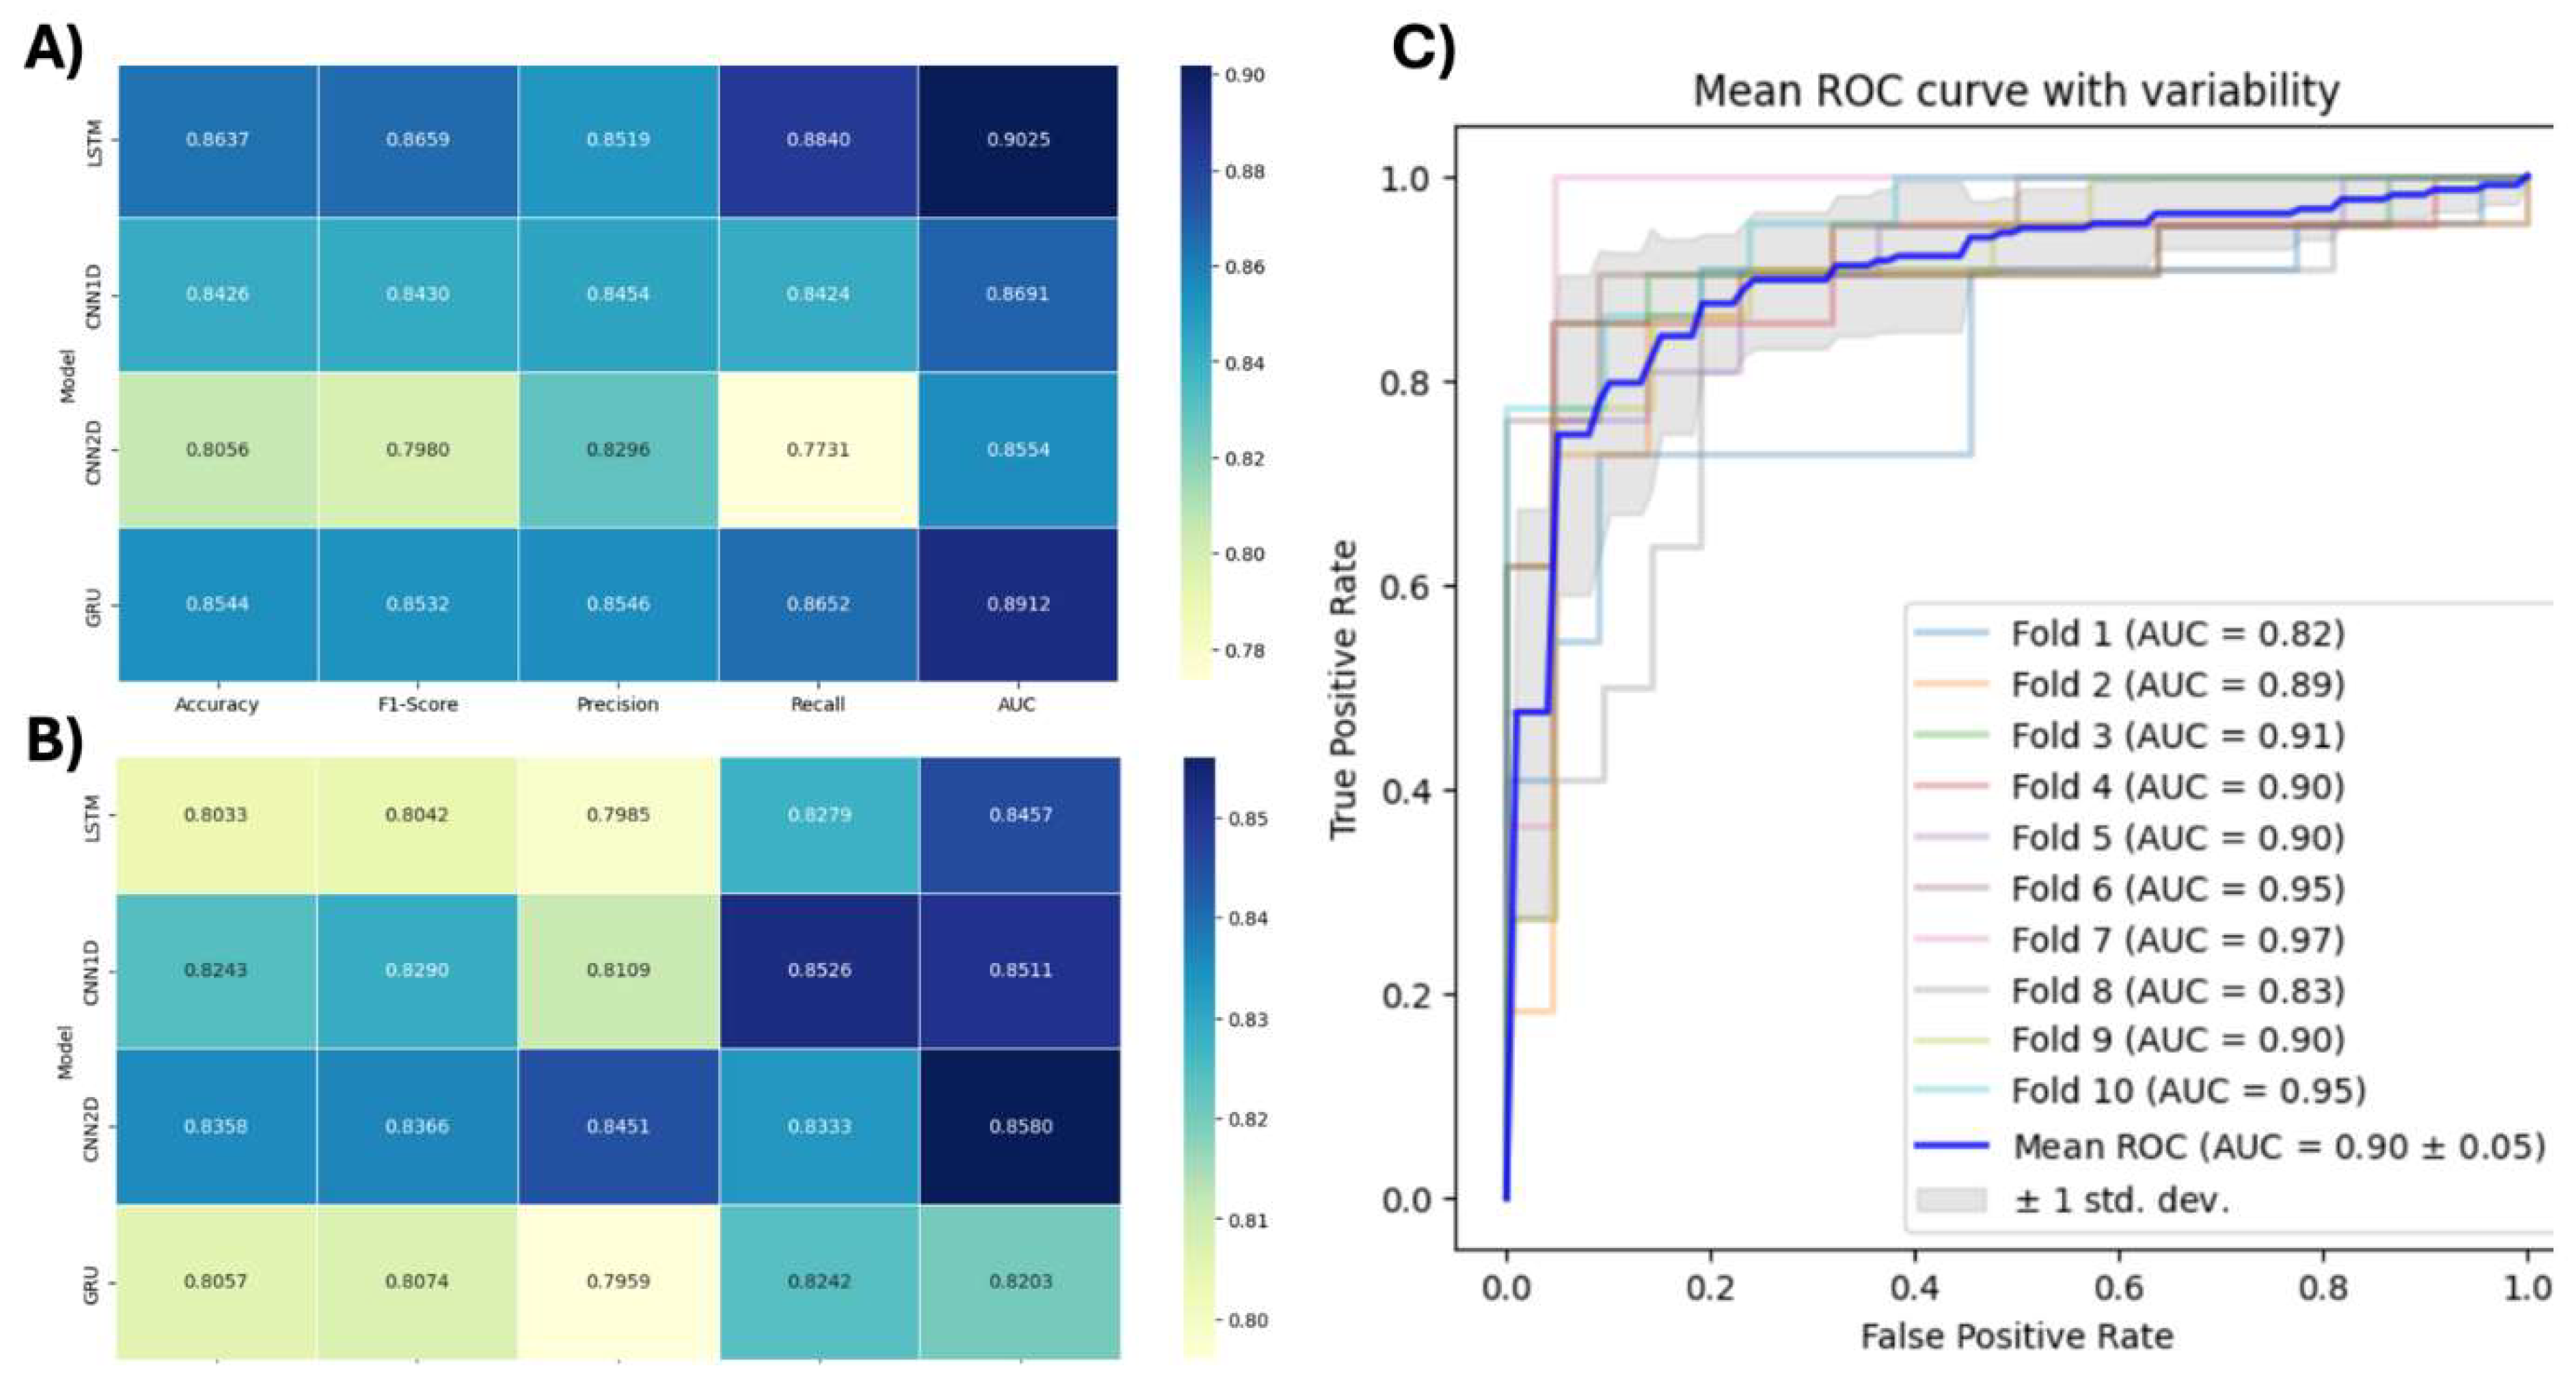
Figure 7A depicts the heatmap of the average results of 10-fold cross-validation using 2D images derived from 3D MRI images plus clinical variables. Based on our results, the LSTM model had the best overall performance. It had the highest scores in accuracy, F1-Score, Recall, and AUC, indicating superior performance compared to the other models. The second-best performing model was the GRU model.
Figure 7B shows the heatmap of the average results of 10-fold cross-validation using only 2D images derived from 3D MRI image without including clinical variables. The CNN2D model showed the highest performance, with increases in Accuracy, F1-Score, and AUC. The second-best model was CNN1D, which had the second-highest Accuracy and AUC, and the highest recall among all models.
Discussion
This study focussed on the improvement of ADHD diagnosis by incorporating modern machine-learning methods utilizing MRI images with or without clinical data. Diagnosis of ADHD can be complicated because it can present as various subtypes, as well as the fact that the diagnosis may be somewhat subjective, that is observer or evaluator-dependent. Further, neuroimaging such as brain MRI can appear grossly unremarkable on visual analysis. However, the use of AI and deep machine learning methods can improve patient diagnosis and clinical decision making by identifying specific imaging biomarkers or signature-patterns.
In a deep learning Resting-State Functional MRI (rsfMRI) study called “DeepFMRI”, using the same data set (ADHD 200), Riaz et al. [32] showed that the deep learning method based on functional connectivity method was able to achieve classification accuracy of only 73.1% (specificity 91.6%, sensitivity 65.5%). In another study, Qureshi et al. [33] applied a Support Vector Machine (SVM) classifier and an extreme learning machine to cortical MRI data from 159 children in the ADHD-200 dataset, which included typically developing (TDC), ADHD-inattentive (ADHD-I), and ADHD-combined (ADHD-C) types. Using SVM-based recursive feature elimination (RFE-SVM) for feature selection, the approach achieved a classification accuracy of 0.61 only. For differentiating ADHD patients from healthy control, Chen et al. [34] employed rsFMRI and a dual subspace classification algorithm. This method provided a classification rate of 0.90 on the ADHD-200 dataset using a binary hypothesis test to determine the projected energy of FCs in two different spaces being representative of ADHD and control. Dey et al. [35] presented a novel framework for classifying ADHD subjects using rsfMRI data by constructing brain functional connectivity networks and applying a Support Vector Machine (SVM) classifier on low-dimensional projections via Multi-Dimensional Scaling (MDS). The approach achieved classification accuracies of 0.70 on the training set and 0.74 on the test set, with higher detection rates when male and female subjects were classified separately.
Our study provides certain important improvements on prior studies in the diagnosis of ADHD using AI and neuroimaging data. In comparison with our findings, previous studies achieved lesser classification accuracies and AUC. A prior benchmark provided a diagnosis AUC of 0.80 and classification accuracy of 0.75 for ADHD diagnosis, mainly using rsfMRI. On the contrary, our approach using clinical variables and anatomical MRI with the LSTM method resulted in considerably high AUC (0.90) and accuracy of 0.86. In addition, with only structural and spatial patterns embedded in the MRI data, the CNN2D model provided an accuracy score of 0.84 and an AUC of 0.86. These results are encouraging as they outperformed previous benchmarks even without any inclusion of clinical or demographic information.
The current study moves beyond state-of-the-art diagnoses for ADHD using AI and lays the groundwork for future studies. Higher diagnostic measures obtained here confirm the possibility of combining clinical variables and deep neural networks-based image analysis. Such an integrative approach offers a good foundation for future development of reliable, generic and widely applicable less invasive ADHD diagnostic approaches. Given that this data was collected from various international research centers using different scanner parameters as well as different population makes our proposed methodology more reliable and widely applicable, although our promising findings require confirmation in future clinical trials or studies. The close range of AUC in Figure 7A also shows the capability of our model to generalize well even without incorporation of clinical data, emphasizing the fact that this approach can be applied in different clinical settings. Also, the preprocessing strategies are of great importance towards model performance. We greatly reduced computational costs by using VGG16 as a feature extractor. Using 2D convolutional layers instead of 3D MRI scan conversion to 2D feature maps significantly increased computational performance and provided support for parallel processing of data that are easier to manage in 2D format.
Several important methodological improvements are responsible for this step in diagnostic performance. Firstly, the inclusion of demographic variables in our LSTM model may seem to have extracted other related contextual information relevant for associating with ADHD symptoms, resulting in adding useful learning information to the model. This is consistent with literature which demonstrates demographic factors like age, gender, IQ and handedness are strongly associated with ADHD. We should point out that the use of personal attributes was helpful enough when LSTM model showed a drop in performance. However, the GRU model performed worse on all metrics except when personal attributes were not considered. This seems to imply that its plain architecture was made more effective due to the supplementing information provided by demographic characteristics.
In summary, inclusion of demographic attributes in deep learning systems, especially LSTM and GRU architectures, appears promising for the detection of ADHD via MRI analysis. Nevertheless, the CNN models showed an ability to compensate for missing elements and, in some cases, even outperformed other models, emphasizing the importance of model selection based on the properties of the data being analyzed. This investigation provides a basis for future studies to investigate AI driven, non-intrusive diagnostic tools for ADHD that will be more accurate, efficient, and accessible than current approaches.
There are multiple possible directions future research might take in building from the current study's results: ADHD subtypes: This study took a classification approach to discriminate between individuals with and without ADHD. It would be useful for future work to check for the effectiveness of the model and to be able to distinguish between various subtypes of ADHD, like Inattentive, Hyperactive-Impulsive, or Combined types. This extra detail should make the model more practical and useful in clinical situations and enable further in-depth understanding of various manifestations of ADHD; furthermore, the dataset used in this study, ADHD200, is sufficiently informative, although dated. To better test the relevance and applicability of the model, its performance on modern and more diverse datasets should be tested in future studies. This will potentially confirm the robustness of the model within diverse subgroups and imaging methods used.
Conclusion
This study provides an important step towards helping in making the diagnosis of ADHD by applying modern machine learning techniques to MRI data and clinical characteristics. The integration of clinical characteristics into deep learning models holds promise for the development of non-invasive, AI-based ADHD diagnosis that offers better accuracy, efficiency, and accessibility compared to existing diagnostic approaches. This work also lays the foundation for future research in the development of more reliable and widely applicable detection tool for other neurodevelopmental disorders.
Acknowledgments
This research did not receive any specific grant from funding agencies in the public, commercial, or not-for-profit sectors.
Conflict of interest
The authors have no conflicts to disclose.
References
- Haroon, M. An Introduction to ADHD and Its Presentation. ABC Neurodev. Disord. 2024, 5. [Google Scholar]
- Dentz, A.; Soelch, C.M.; Fahim, C.; Torsello, A.; Parent, V.; Ponsioen, A.; Guay, M.-C.; Bioulac-Rogier, S.; Clément, C.; Bader, M. Non-pharmacological treatment of Attention Deficit Disorder with or without Hyperactivity (ADHD). Overview and report of the first international symposium on the non-pharmacological management of ADHD. L'encephale 2024. [Google Scholar] [CrossRef] [PubMed]
- Bergey, M. “Pills Don’t Teach Skills”: ADHD Coaching, Identity Work, and the Push toward the Liminal Medicalization of ADHD. J. Health Soc. Behav. 2024, 00221465231220385. [Google Scholar] [CrossRef]
- Chen, I.-C.; Chang, C.-L.; Chang, M.-H.; Ko, L.-W. Developing a reliable and practical multi-domain model to facilitate the diagnosis of ADHD in older preschool children. 2024. [Google Scholar]
- Seiberlich, N.; Gulani, V.; Campbell-Washburn, A.; Sourbron, S.; Doneva, M.I.; Calamante, F.; Hu, H.H. Quantitative Magnetic Resonance Imaging; Academic Press: Cambridge, MA, USA, 2020. [Google Scholar]
- Mellado, A.; Martinez, C.; Tomicic, A.; Krause, M. Dynamic patterns in the voices of a patient diagnosed with borderline personality disorder, and the therapist throughout long-term psychotherapy. J. Constr. Psychol. 2024, 37, 97–120. [Google Scholar] [CrossRef]
- Qian, H.; Ren, X.; Xu, M.; Fang, Z.; Zhang, R.; Bu, Y.; Zhou, C. Magnetic resonance imaging-based radiomics was used to evaluate the level of prognosis-related immune cell infiltration in breast cancer tumor microenvironment. BMC Med. Imaging 2024, 24, 1–13. [Google Scholar] [CrossRef] [PubMed]
- Moorthy, C.G.; Sankar, G.U. Analysis on Electromagnetic Waves of CT Scanners and MRI Scanners for Applications. World Sci. News 2024, 188, 1–14. [Google Scholar]
- Adams, L.C.; Bressem, K.K.; Ziegeler, K.; Vahldiek, J.L.; Poddubnyy, D. Artificial intelligence to analyze magnetic resonance imaging in rheumatology. Jt. Bone Spine 2024, 91, 105651. [Google Scholar] [CrossRef]
- Hosseini, S.A.; Hosseini, E.; Hajianfar, G.; Shiri, I.; Servaes, S.; Rosa-Neto, P.; Godoy, L.; Nasrallah, M.P.; O’Rourke, D.M.; Mohan, S.; et al. MRI-Based Radiomics Combined with Deep Learning for Distinguishing IDH-Mutant WHO Grade 4 Astrocytomas from IDH-Wild-Type Glioblastomas. Cancers 2023, 15, 951. [Google Scholar] [CrossRef]
- Hosseini, S.A.; Servaes, S.; Hall, B.; Bhaduri, S.; Rajan, A.; Rosa-Neto, P.; Brem, S.; Loevner, L.A.; Mohan, S.; Chawla, S. Quantitative Physiologic MRI Combined with Feature Engineering for Developing Machine Learning-Based Prediction Models to Distinguish Glioblastomas from Single Brain Metastases. Diagnostics 2024, 15, 38. [Google Scholar] [CrossRef]
- Hajianfar, G.; Haddadi Avval, A.; Hosseini, S.A.; Nazari, M.; Oveisi, M.; Shiri, I.; Zaidi, H. Time-to-event overall survival prediction in glioblastoma multiforme patients using magnetic resonance imaging radiomics. La Radiol. Medica 2023, 128, 1521–1534. [Google Scholar] [CrossRef]
- Zhang-James, Y.; Razavi, A.S.; Hoogman, M.; Franke, B.; Faraone, S.V. Machine learning and MRI-based diagnostic models for ADHD: Are we there yet? J. Atten. Disord. 2023, 27, 335–353. [Google Scholar] [CrossRef] [PubMed]
- Zhou, X.; Lin, Q.; Gui, Y.; Wang, Z.; Liu, M.; Lu, H. Multimodal MR images-based diagnosis of early adolescent attention-deficit/hyperactivity disorder using multiple kernel learning. Front. Neurosci. 2021, 15, 710133. [Google Scholar] [CrossRef]
- Sen, B.; Borle, N.C.; Greiner, R.; Brown, M.R. A general prediction model for the detection of ADHD and Autism using structural and functional MRI. PloS ONE 2018, 13, e0194856. [Google Scholar] [CrossRef] [PubMed]
- Choi, S.; Jang, Y.; Kim, H. A deep learning approach to imputation of dynamic pupil size data and prediction of ADHD. Int. J. Artif. Intell. Tools 2023, 32, 2350020. [Google Scholar] [CrossRef]
- Loth, E.; Charman, T.; Mason, L.; Tillmann, J.; Jones, E.J.; Wooldridge, C.; Ahmad, J.; Auyeung, B.; Brogna, C.; Ambrosino, S. The EU-AIMS Longitudinal European Autism Project (LEAP): design and methodologies to identify and validate stratification biomarkers for autism spectrum disorders. Mol. Autism 2017, 8, 1–19. [Google Scholar] [CrossRef]
- Faridi, F.; Alvand, A.; Khosrowabadi, R. Brain Structural Correlates of Intelligence in Attention Deficit Hyperactivity Disorder (ADHD) Individuals. Basic Clin. Neurosci. 2022, 13, 551. [Google Scholar] [CrossRef] [PubMed]
- Ma, C.; Guo, Y.; Lei, Y.; An, W. Binary volumetric convolutional neural networks for 3-D object recognition. IEEE Trans. Instrum. Meas. 2018, 68, 38–48. [Google Scholar] [CrossRef]
- Xu, X.; Lin, L.; Sun, S.; Wu, S. A review of the application of three-dimensional convolutional neural networks for the diagnosis of Alzheimer’s disease using neuroimaging. Rev. Neurosci. 2023, 34, 649–670. [Google Scholar] [CrossRef]
- Hosseini, S.A.; Servaes, S.; Rahmouni, N.; Therriault, J.; Tissot, C.; Macedo, A.C.; Wang, Y.-T.; Arias, J.F.; Socualaya, K.M.Q.; Zheng, Y. Leveraging T1 MRI Images for Amyloid Status Prediction in Diverse Cognitive Conditions Using Advanced Deep Learning Models. Alzheimer's Dement. 2024, 20, e094153. [Google Scholar] [CrossRef]
- Mezrioui, N.E.H.; Aloui, K.; Nait-Ali, A.; Naceur, M.S. Automated Characterization of Autism Spectrum Disorder using Combined Functional and Structural MRI Analysis. Int. J. Adv. Comput. Sci. Appl. 2023, 14. [Google Scholar] [CrossRef]
- Salehi, A.W.; Khan, S.; Gupta, G.; Alabduallah, B.I.; Almjally, A.; Alsolai, H.; Siddiqui, T.; Mellit, A. A study of CNN and transfer learning in medical imaging: Advantages, challenges, future scope. Sustainability 2023, 15, 5930. [Google Scholar] [CrossRef]
- Bellec, P.; Chu, C.; Chouinard-Decorte, F.; Benhajali, Y.; Margulies, D.S.; Craddock, R.C. The neuro bureau ADHD-200 preprocessed repository. Neuroimage 2017, 144, 275–286. [Google Scholar] [CrossRef] [PubMed]
- Karpinski, R.I.; Kolb, A.M.K.; Tetreault, N.A.; Borowski, T.B. High intelligence: A risk factor for psychological and physiological overexcitabilities. Intelligence 2018, 66, 8–23. [Google Scholar] [CrossRef]
- Dubois, J.; Galdi, P.; Han, Y.; Paul, L.K.; Adolphs, R. Resting-state functional brain connectivity best predicts the personality dimension of openness to experience. Personal. Neurosci. 2018, 1, e6. [Google Scholar] [CrossRef]
- Gehricke, J.-G.; Kruggel, F.; Thampipop, T.; Alejo, S.D.; Tatos, E.; Fallon, J.; Muftuler, L.T. The brain anatomy of attention-deficit/hyperactivity disorder in young adults–a magnetic resonance imaging study. PloS One 2017, 12, e0175433. [Google Scholar] [CrossRef]
- Shinde, S.; Tupe-Waghmare, P.; Chougule, T.; Saini, J.; Ingalhalikar, M. Predictive and discriminative localization of pathology using high resolution class activation maps with CNNs. PeerJ Comput. Sci. 2021, 7, e622. [Google Scholar] [CrossRef]
- Moujahid, H.; Cherradi, B.; Al-Sarem, M.; Bahatti, L.; Eljialy, A.B.A.M.Y.; Alsaeedi, A.; Saeed, F. Combining CNN and Grad-Cam for COVID-19 Disease Prediction and Visual Explanation. Intell. Autom. Soft Comput. 2022, 32. [Google Scholar] [CrossRef]
- Immonen, R.; Harris, N.G.; Wright, D.; Johnston, L.; Manninen, E.; Smith, G.; Paydar, A.; Branch, C.; Grohn, O. Imaging biomarkers of epileptogenecity after traumatic brain injury–Preclinical frontiers. Neurobiol. Dis. 2019, 123, 75–85. [Google Scholar] [CrossRef]
- Lohani, D.C.; Rana, B. ADHD diagnosis using structural brain MRI and personal characteristic data with machine learning framework. Psychiatry Res. Neuroimaging 2023, 334, 111689. [Google Scholar] [CrossRef]
- Riaz, A.; Asad, M.; Alonso, E.; Slabaugh, G. DeepFMRI: End-to-end deep learning for functional connectivity and classification of ADHD using fMRI. J. Neurosci. Methods 2020, 335, 108506. [Google Scholar] [CrossRef]
- Qureshi, M.N.I.; Min, B.; Jo, H.J.; Lee, B. Multiclass classification for the differential diagnosis on the ADHD subtypes using recursive feature elimination and hierarchical extreme learning machine: structural MRI study. PloS ONE 2016, 11, e0160697. [Google Scholar] [CrossRef] [PubMed]
- Chen, Y.; Tang, Y.; Wang, C.; Liu, X.; Zhao, L.; Wang, Z. ADHD classification by dual subspace learning using resting-state functional connectivity. Artif. Intell. Med. 2020, 103, 101786. [Google Scholar] [CrossRef] [PubMed]
- Dey, S.; Rao, A.R.; Shah, M. Attributed graph distance measure for automatic detection of attention deficit hyperactive disordered subjects. Front. Neural Circuits 2014, 8, 64. [Google Scholar] [CrossRef] [PubMed]
Figure 1.
Age distribution within whole dataset and ADHD cases.
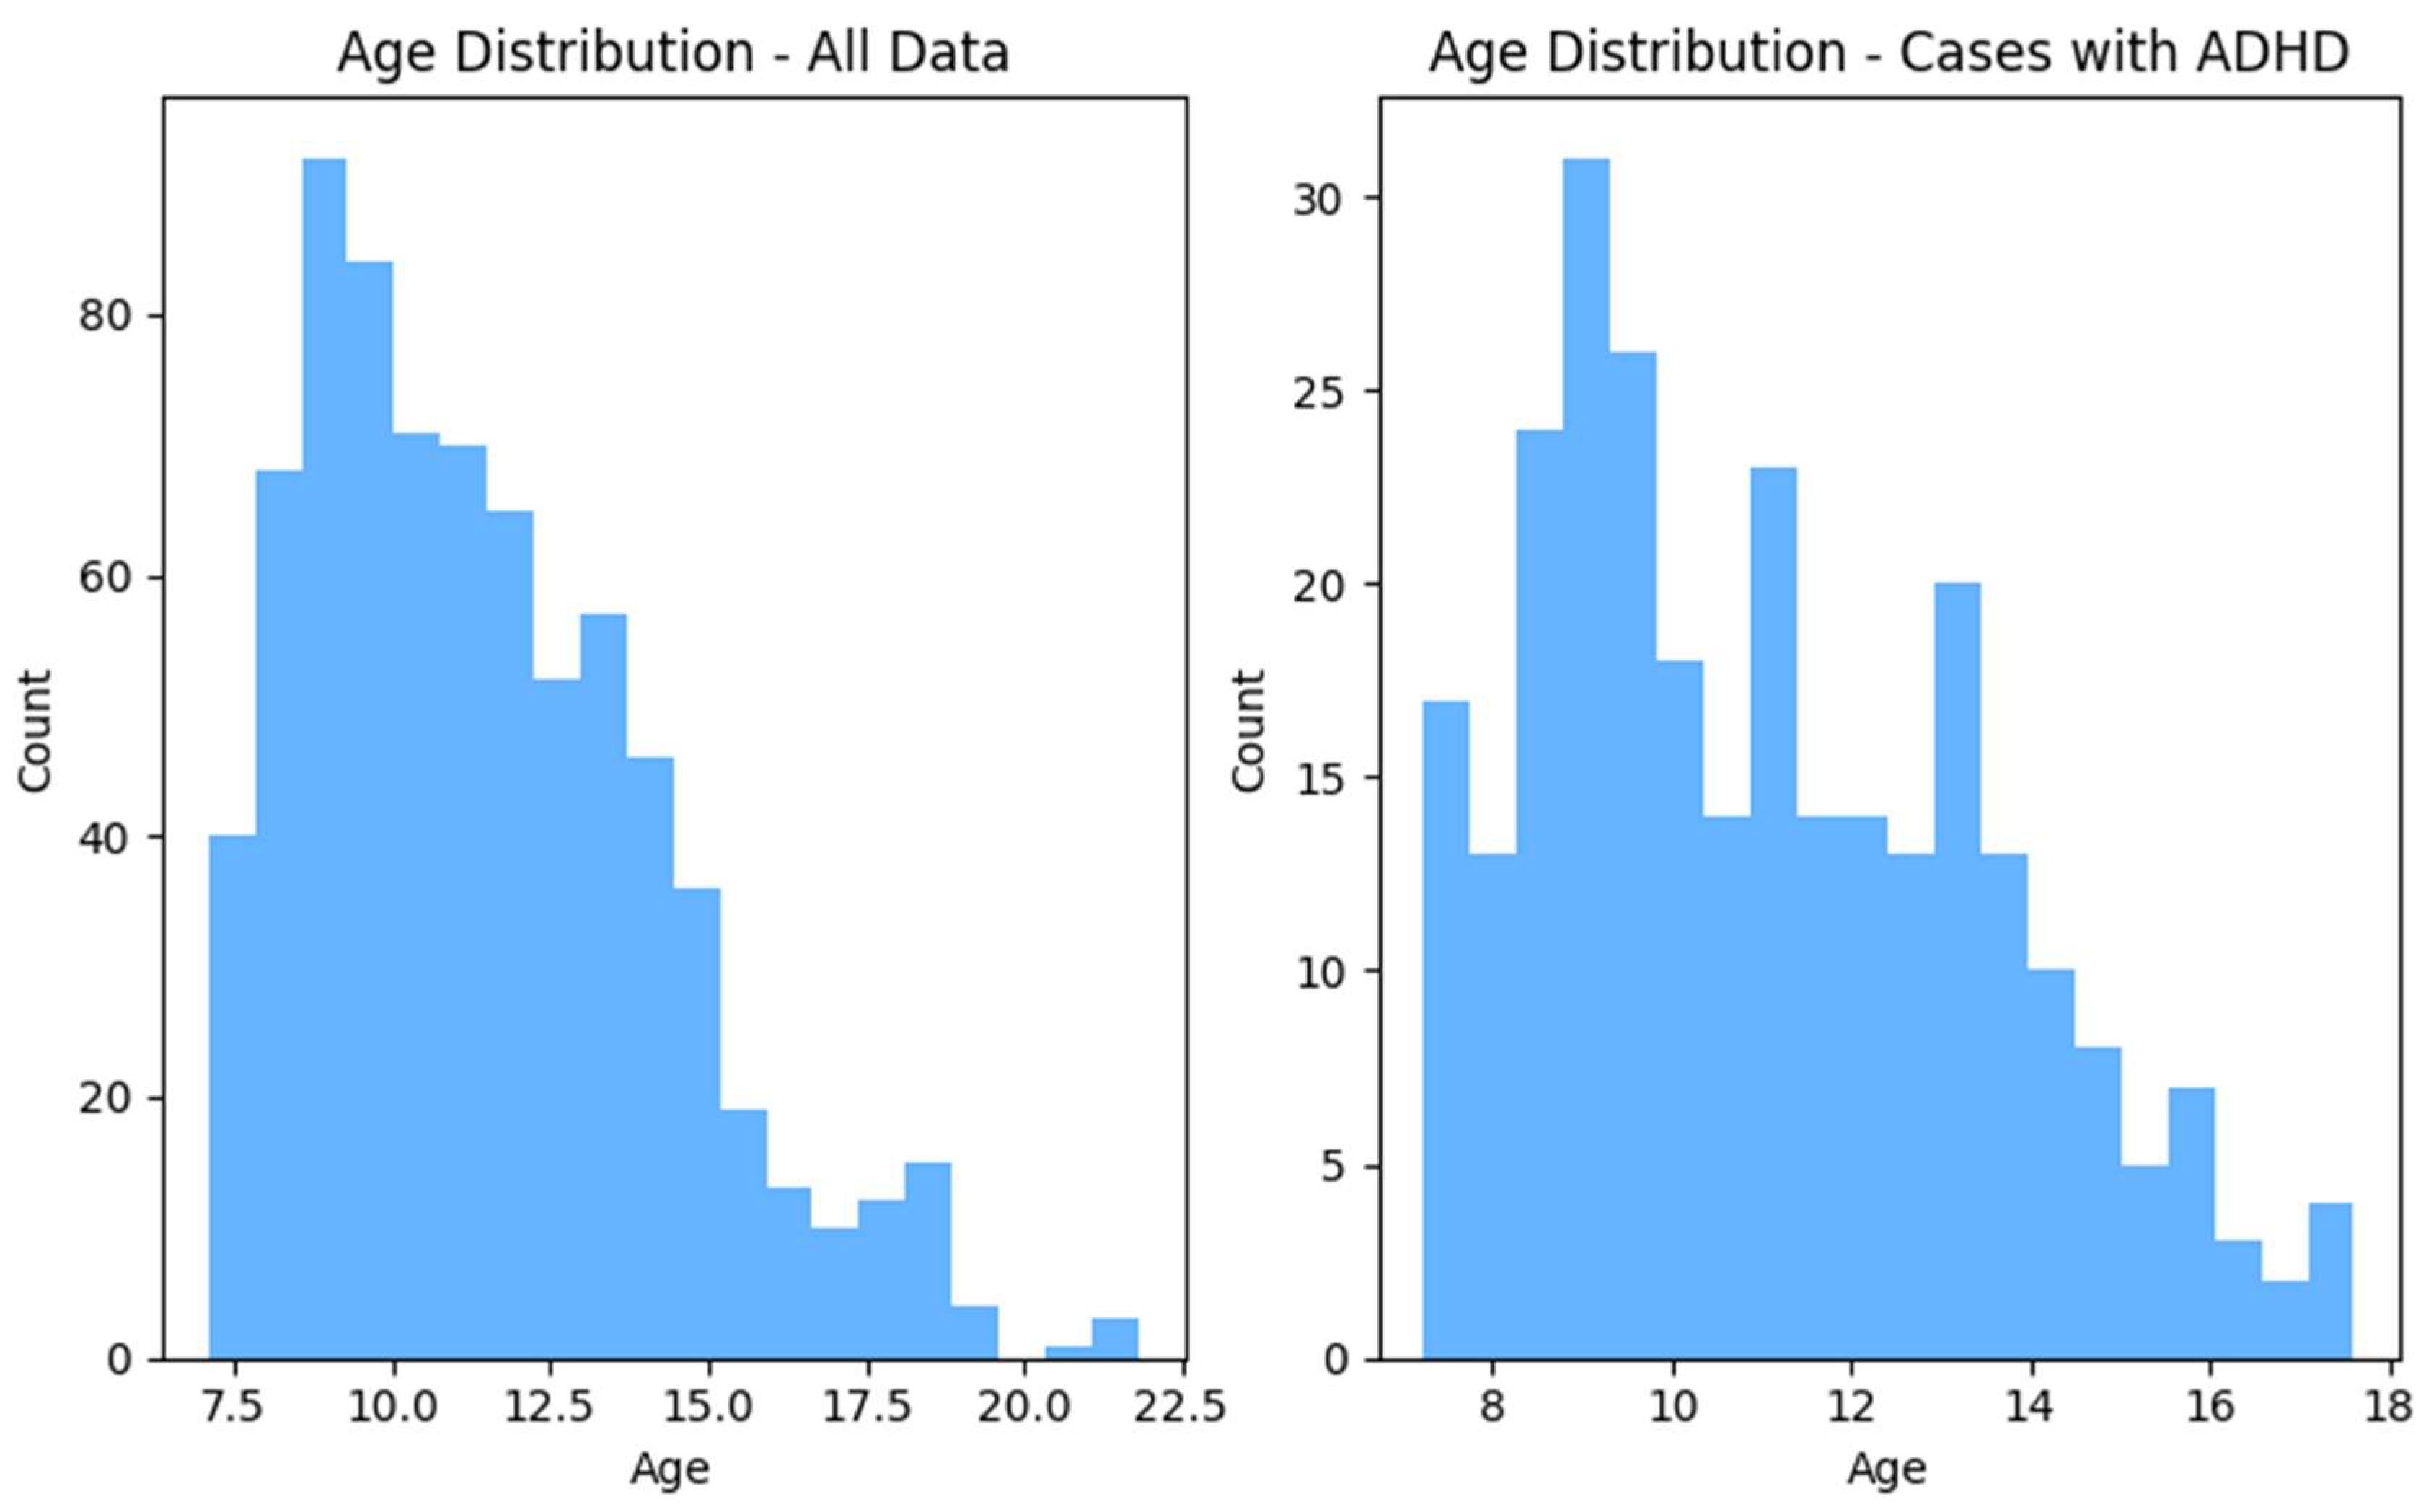
Figure 2.
Gender distribution within whole dataset and ADHD cases.
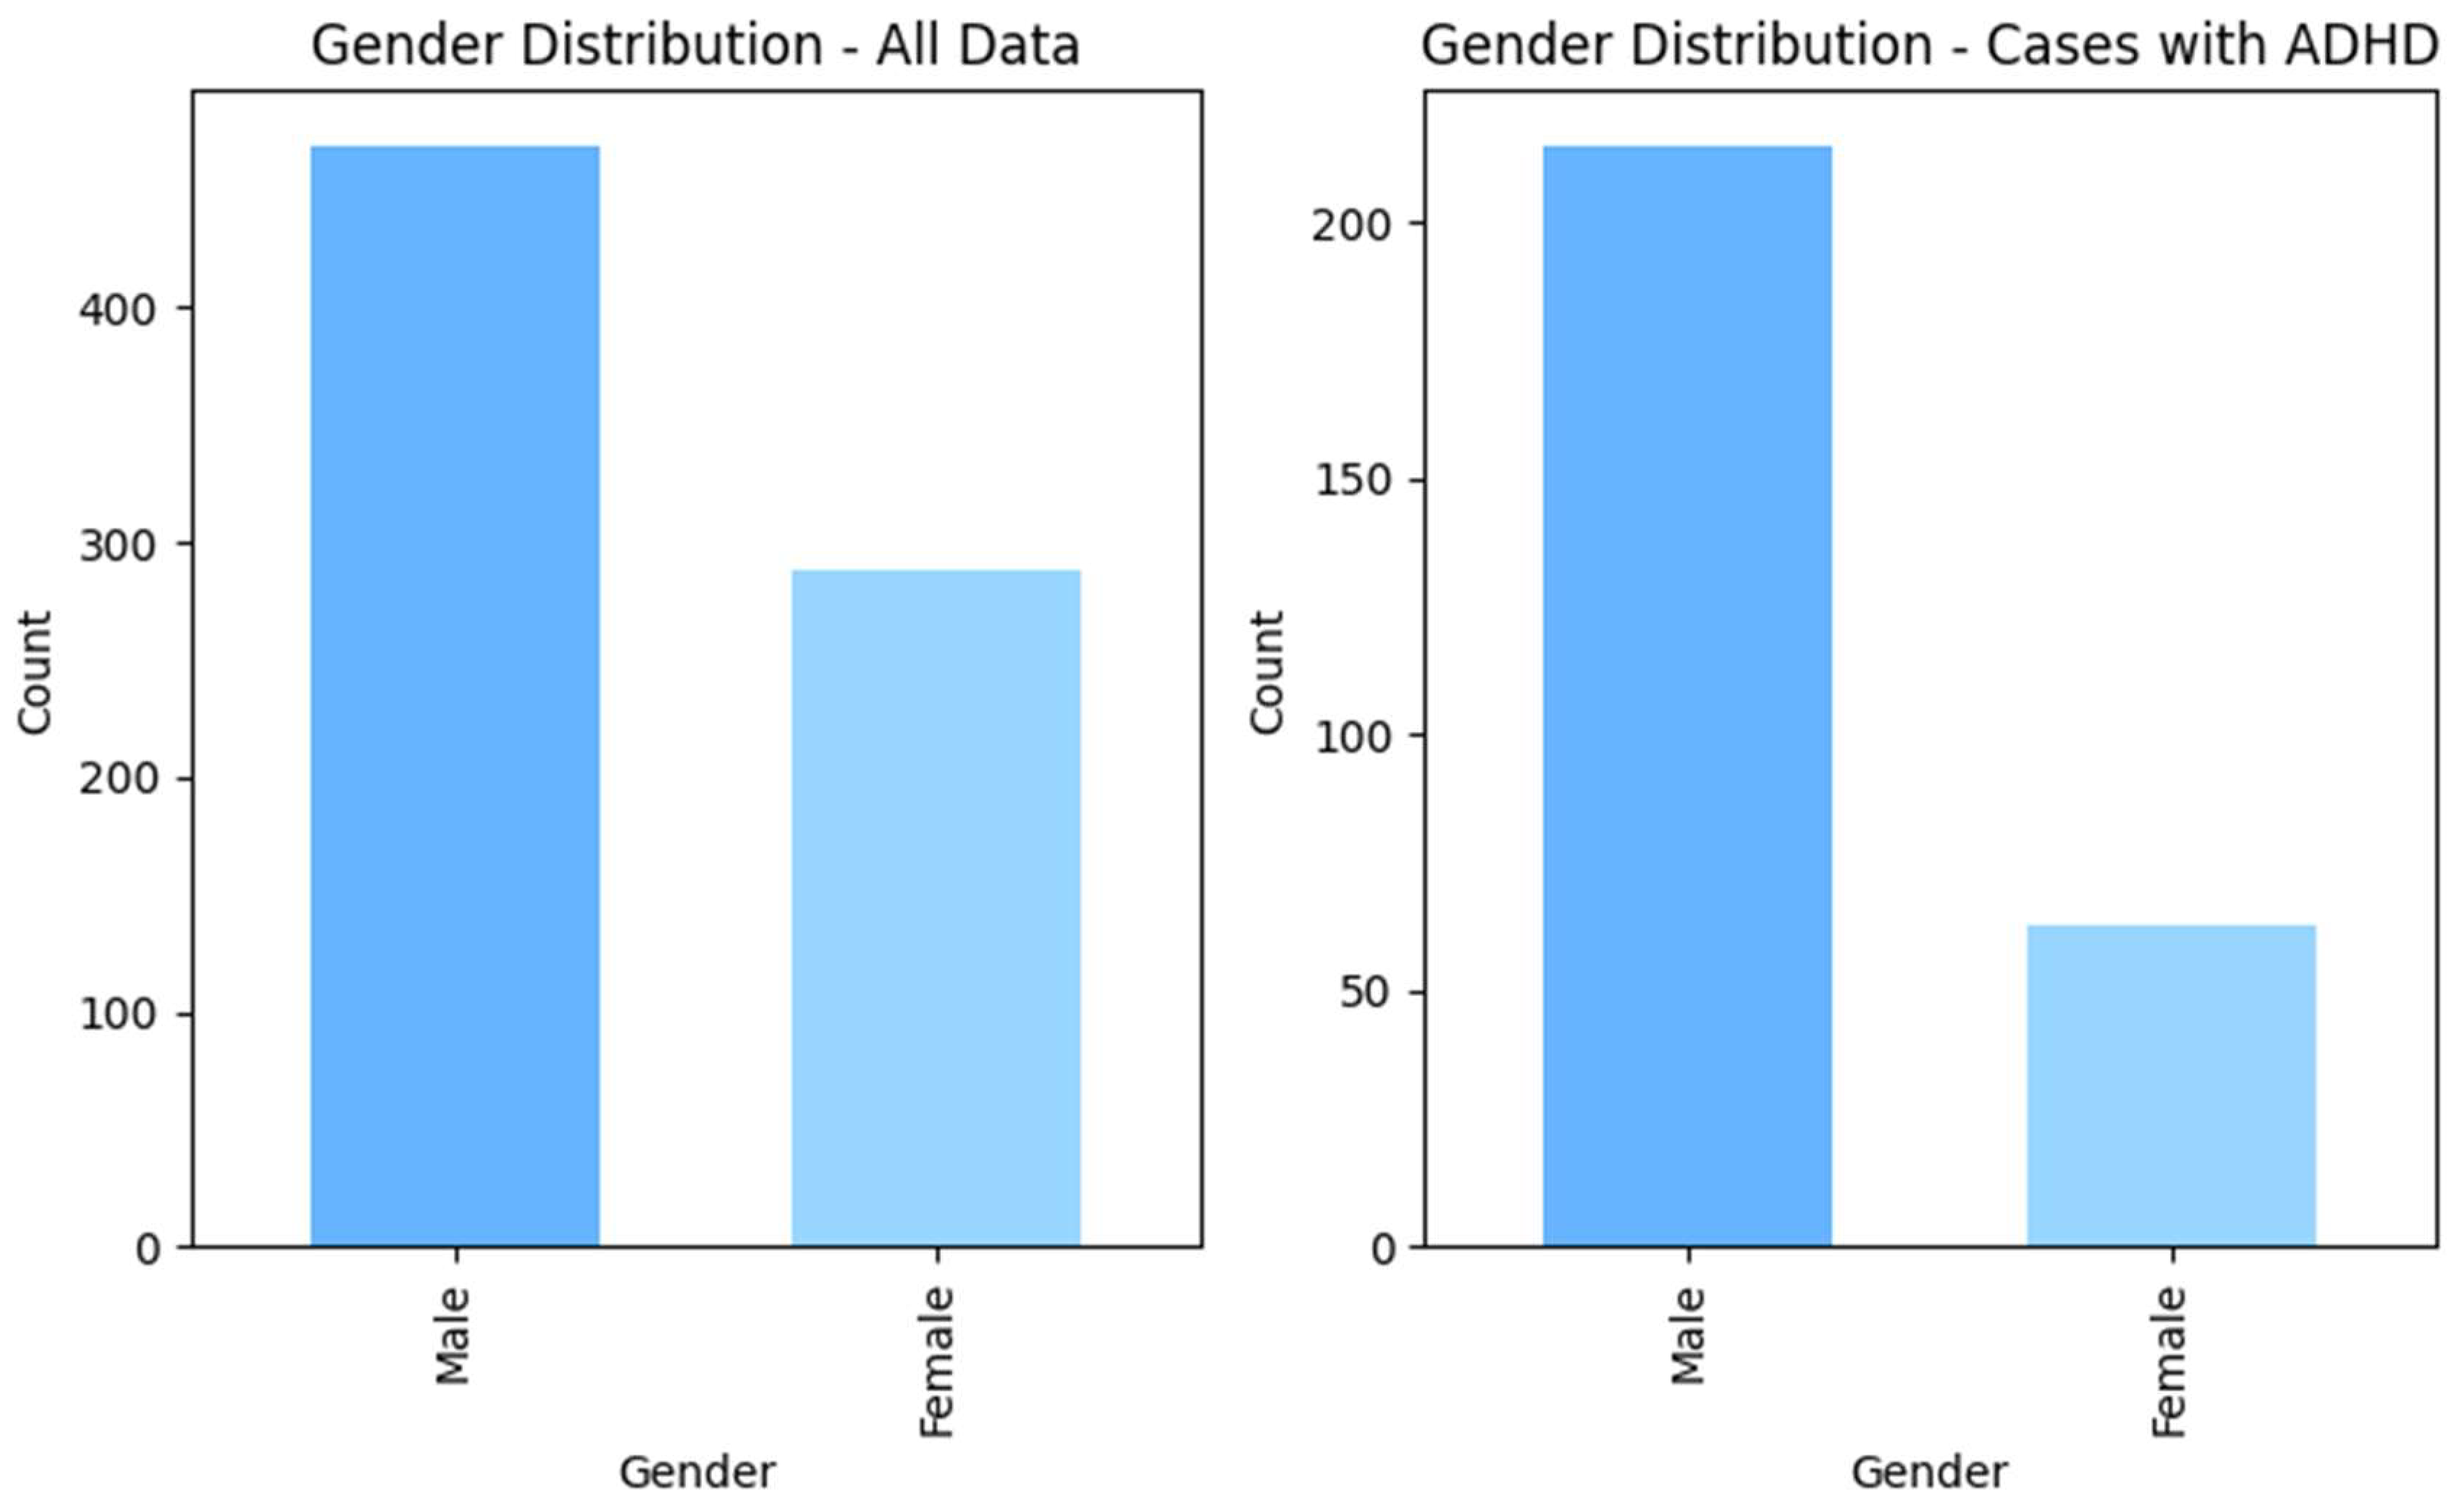
Figure 3.
Feature extraction process of a single MRI image using VGG16 model.
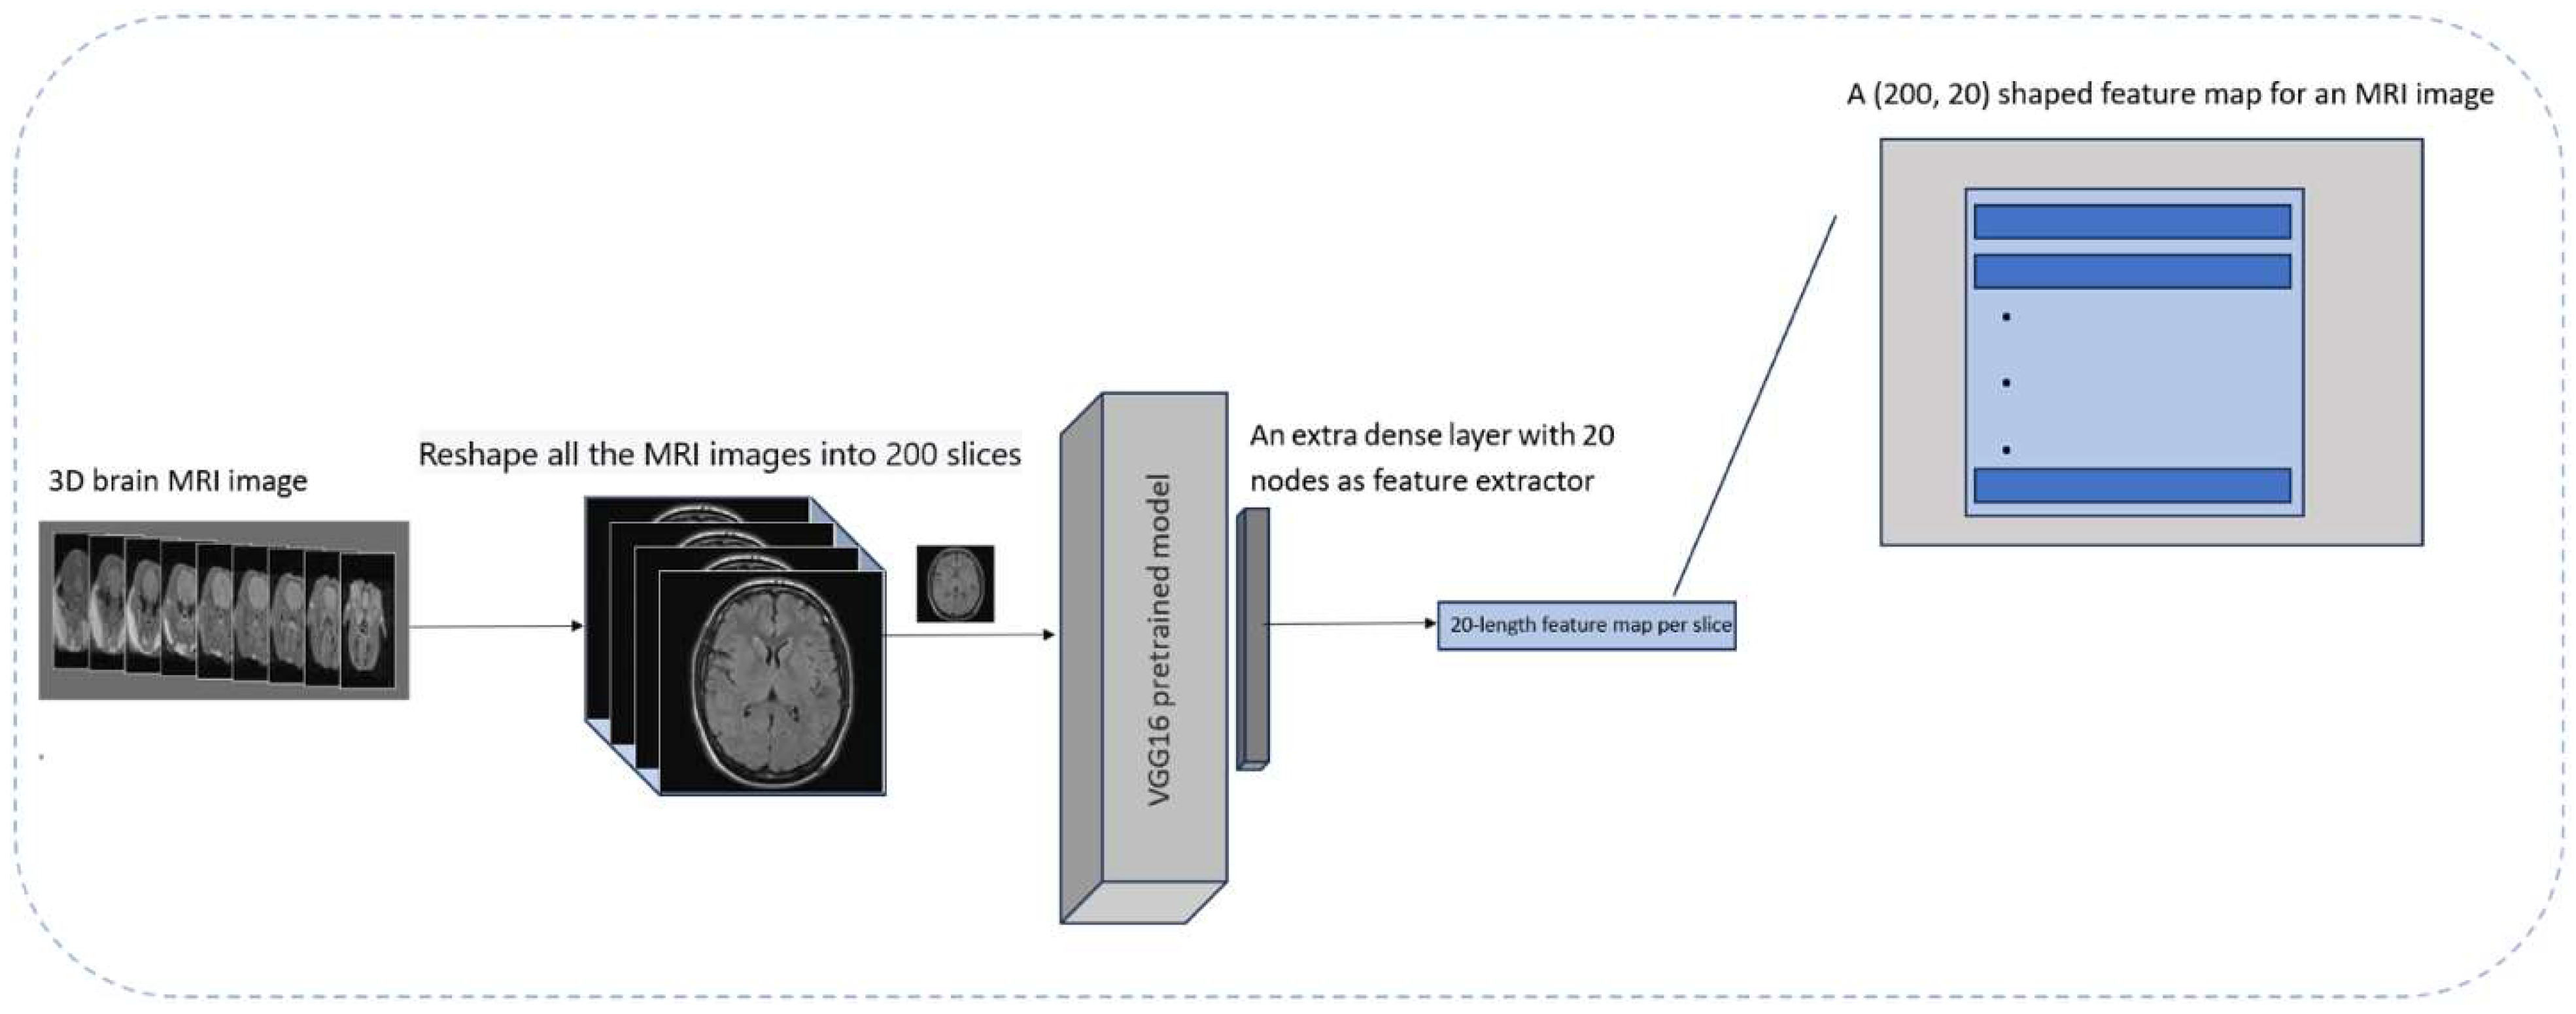
Figure 4.
2D extracted feature map from a single MRI with 200-slices.
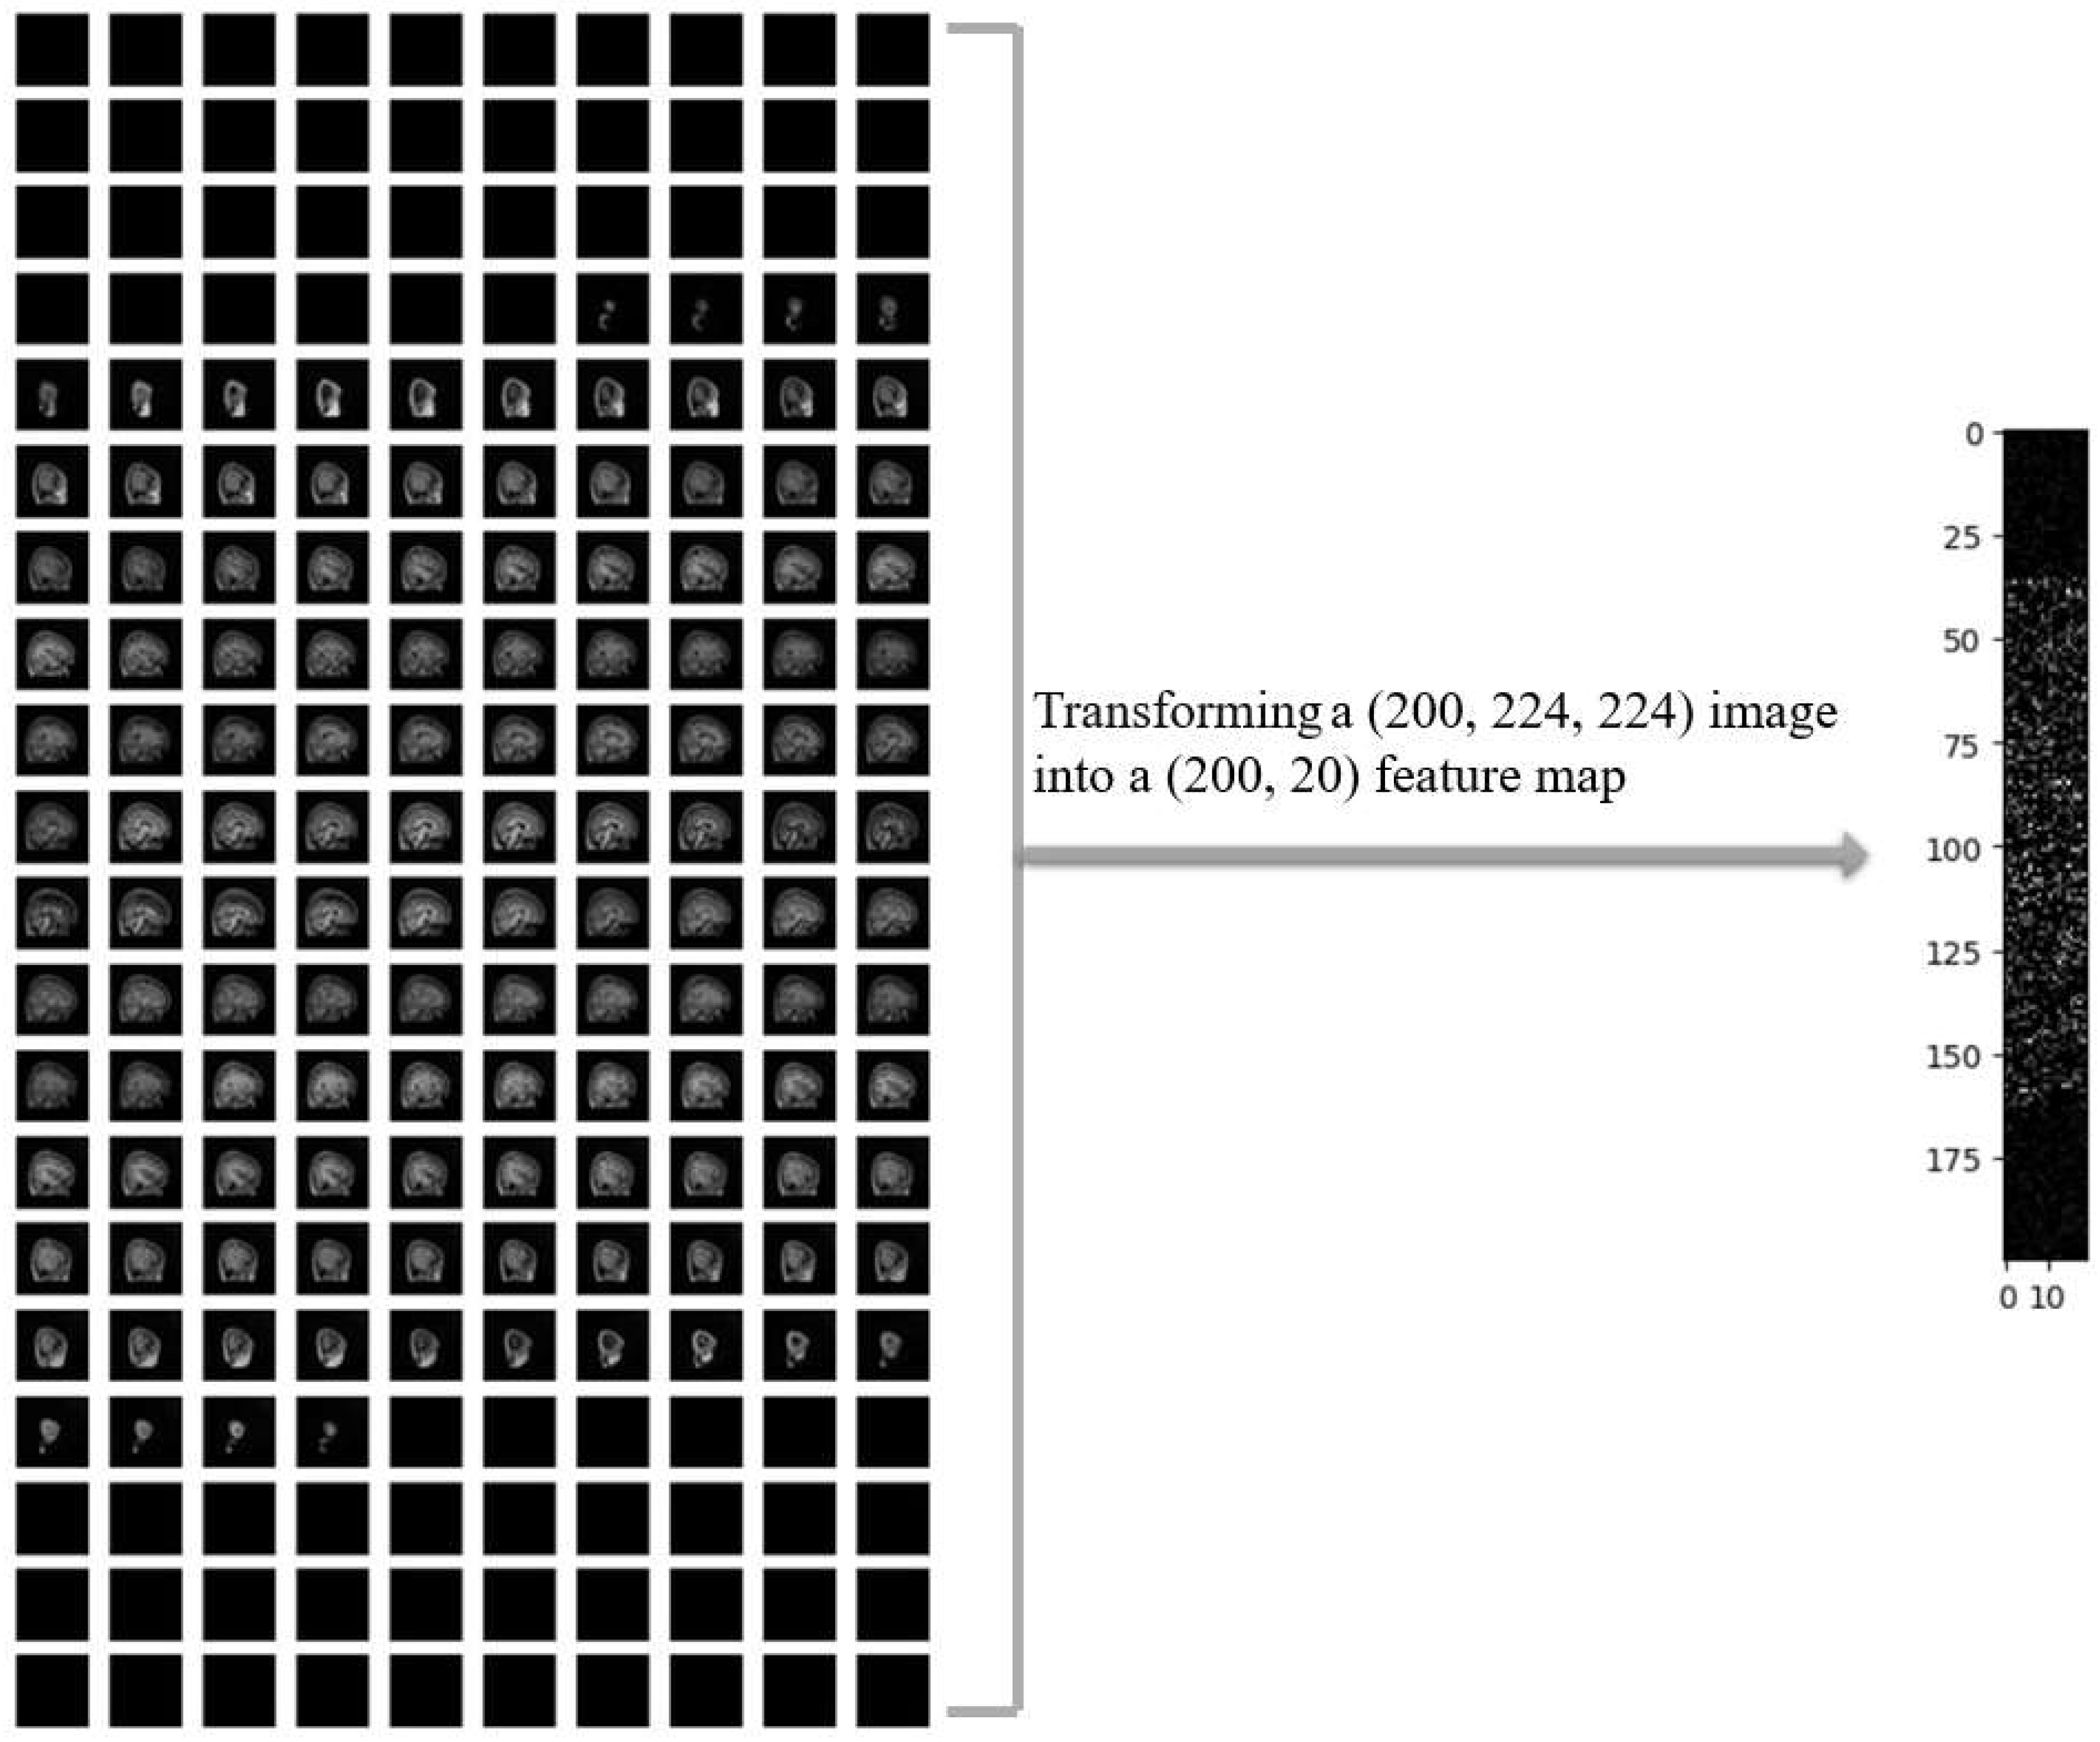
Figure 5.
Visualization of Feature Activation using VGG 16-based Class Activation Mapping (CAM) on MRI Slices: The overlaid heatmap highlights regions of high significance, revealing key structures contributing to the neural network's feature extraction.
Figure 5.
Visualization of Feature Activation using VGG 16-based Class Activation Mapping (CAM) on MRI Slices: The overlaid heatmap highlights regions of high significance, revealing key structures contributing to the neural network's feature extraction.
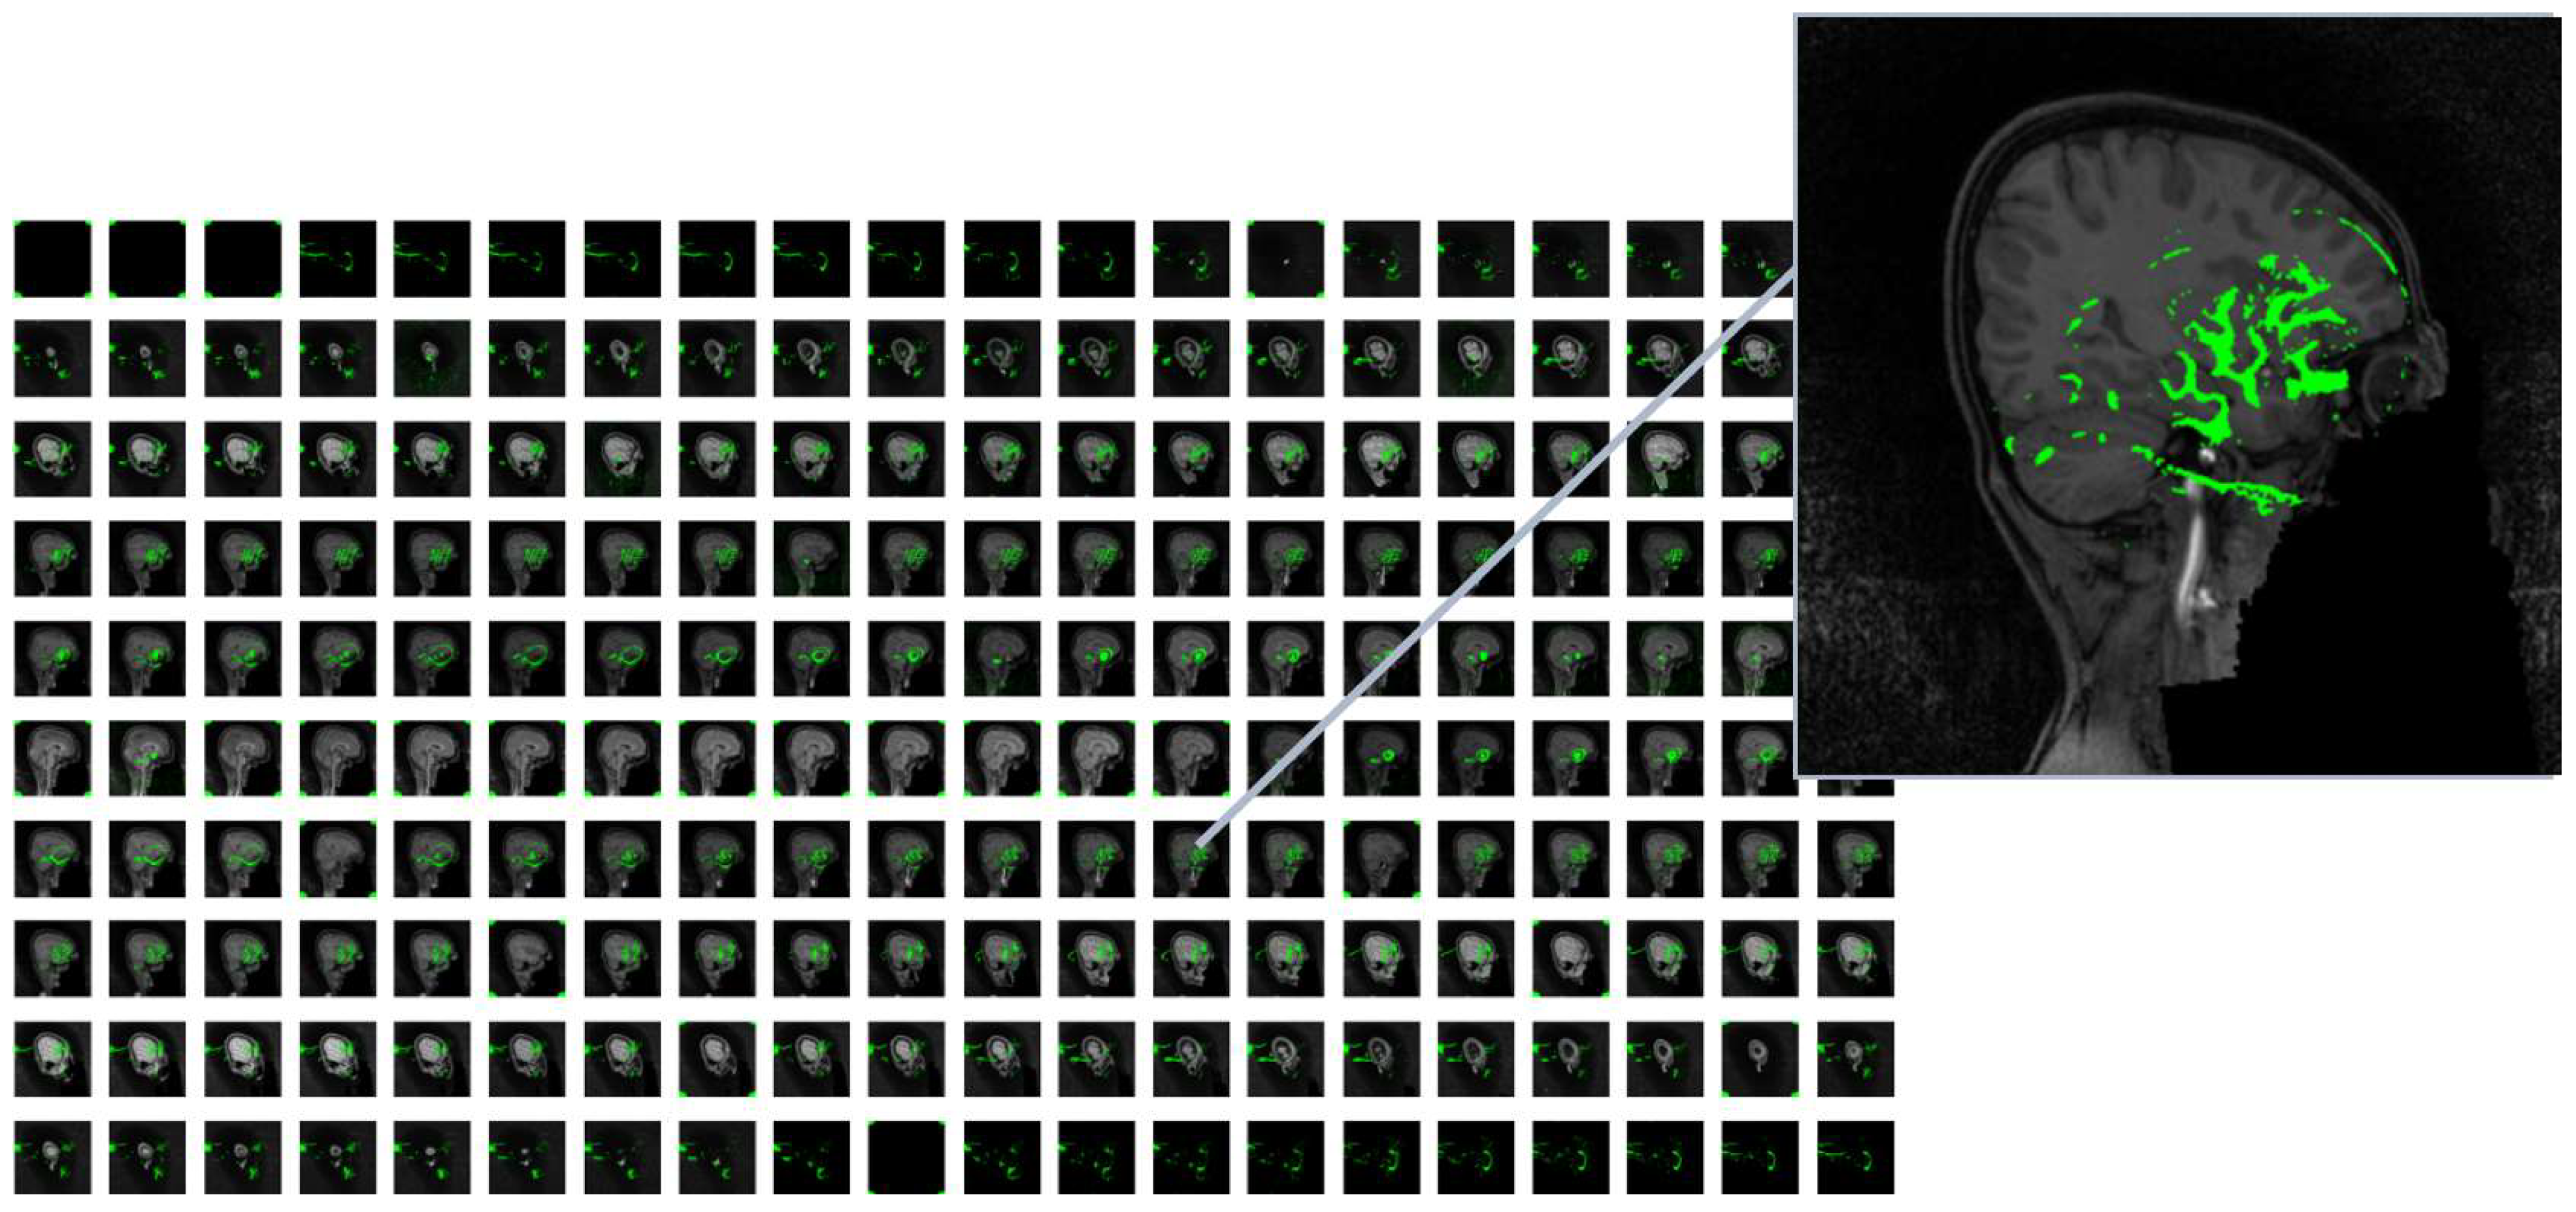
Figure 6.
The structure of the four models, which include both personal attributes and extracted feature maps in their input data. A: LSTM model structure (input data: 2d images + personal attributes) B: CNN2d model structure (input data: 2d images + personal attributes) C: CNN1d model structure (input data: 2d images + personal attributes) D: GRU model structure (input data: 2d images + personal attributes).
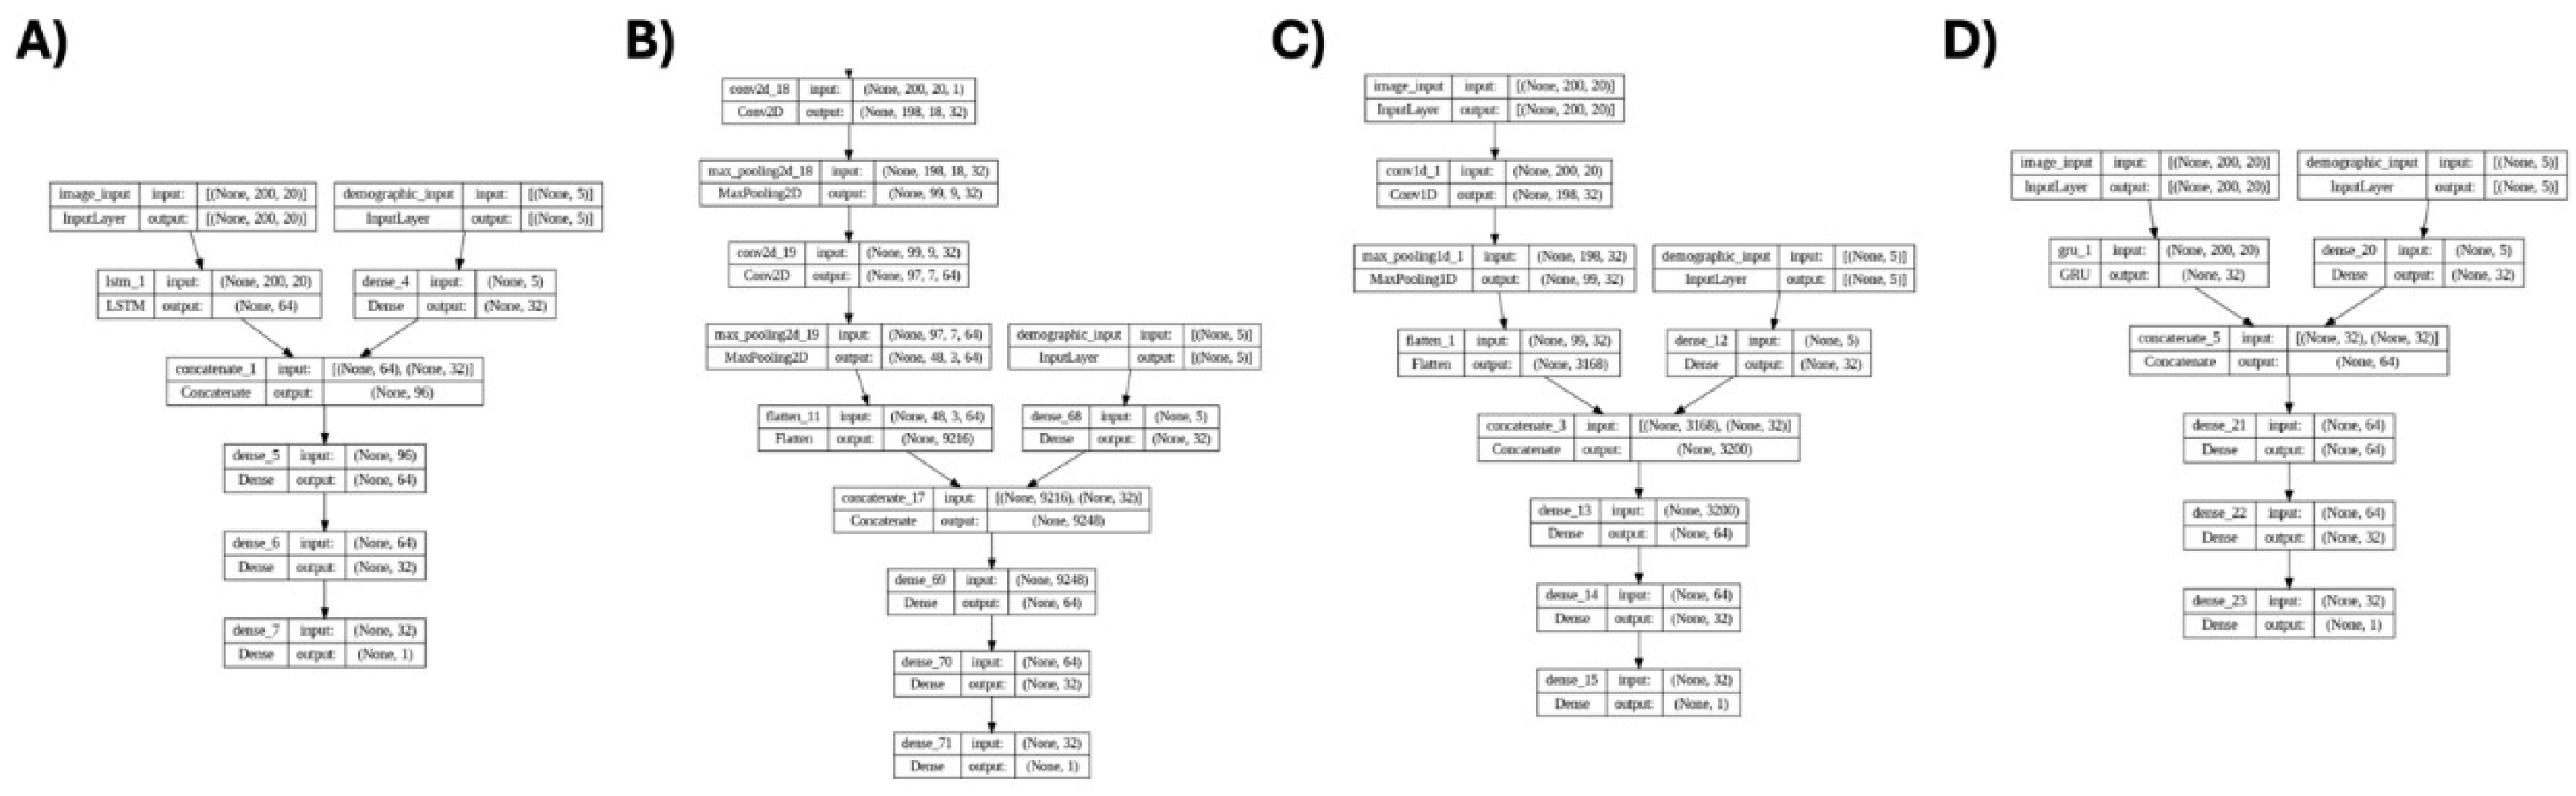
Figure 7.
A) Average results heatmap using 10-fold CV (input data: 2d images + demographic featurs). B) Average results heatmap using 10-fold CV (input data: 2d images). C) Mean Area under the curve AUC plot for each fold of cross-validation of the best model in our study, LSTM model.
Figure 7.
A) Average results heatmap using 10-fold CV (input data: 2d images + demographic featurs). B) Average results heatmap using 10-fold CV (input data: 2d images). C) Mean Area under the curve AUC plot for each fold of cross-validation of the best model in our study, LSTM model.
Disclaimer/Publisher’s Note: The statements, opinions and data contained in all publications are solely those of the individual author(s) and contributor(s) and not of MDPI and/or the editor(s). MDPI and/or the editor(s) disclaim responsibility for any injury to people or property resulting from any ideas, methods, instructions or products referred to in the content. |
© 2025 by the authors. Licensee MDPI, Basel, Switzerland. This article is an open access article distributed under the terms and conditions of the Creative Commons Attribution (CC BY) license (http://creativecommons.org/licenses/by/4.0/).
Copyright: This open access article is published under a Creative Commons CC BY 4.0 license, which permit the free download, distribution, and reuse, provided that the author and preprint are cited in any reuse.


