Submitted:
07 February 2025
Posted:
07 February 2025
You are already at the latest version
Abstract
This study investigates the effects of blue finance and marine environmental quality of the marine fishery economy using panel data for marine fisheries in China’s coastal provinces spanning 2011–2023. We use entropy, moderating effects, and threshold effects to calculate the level of blue finance and marine environmental quality, the moderating role of marine environmental quality in blue finance’s effect on the marine fishery economy, and the threshold effect of blue finance and marine environmental quality on the marine fishery economy. We find that (1) blue finance can improve the marine fishery economy, with an influence coefficient of 0.245. (2) Marine environmental quality plays a significant positive moderating role in blue finance’s effect on the marine fishery economy, with an influence coefficient of 0.325. (3) Blue finance and marine environmental quality have a first-order threshold effect on the marine fishery economy, showing a U-shaped nonlinear relationship.
Keywords:
blue finance
; marine fishery
; moderating effect
; economic quality
1. Introduction
Marine fisheries promote employment in coastal areas, increase fishermen’s incomes, help satisfy people’s diverse dietary needs, help transform and upgrade the marine industry, ensure national food security, and help safeguard national maritime sovereignty. According to the Food and Agriculture Organization, the world’s fishery and aquaculture output reached 223.2 million tons in 2022, of which 62% came from marine fisheries (69% from capture fisheries, 31% from aquaculture). Marine capture fisheries produced 79.7 million tons of aquatic animals, remaining the main source of the total global aquatic animal output (43%). A total of 89% of aquatic animal production is for human consumption, with a per capita consumption of 20.7 kg.[1] However, with the growing uncertainty posed by climate change, the increasing risks to marine environmental quality, and the reckless expansion of marine resource development, the marine fishery economy now faces problems such as resource decline, environmental deterioration, and diminishing overall benefits. In response, coastal regions are promoting the greening of marine fishery and developing blue finance to improve the marine environment and solve the problems of the marine fishery economy. In 2021, for example, the United Nations Environment Programme released Tide to the Future: Finance for a Sustainable Ocean Recovery, a practical guide to help financial institutions finance a sustainable blue economy.[2] In January 2022, International Finance Corporation issued the Blue Finance Guidelines, emphasizing sustainable development goals, marine environment protection, and the sustainable development of the marine industry.[3] In China, the 14th Five-Year Plan for the Development of the Marine Economy and the 14th Five-Year Plan for the Protection of the Marine Ecological Environmental focused on the reform and diversified development of marine investment and financing, offering policy guidance for blue finance. Blue finance refers to financial activity that specifically serves the blue economy. Based on functions such as resource allocation, risk management, and market pricing, it supports the reduction of marine plastic pollution, marine ecosystem restoration, and the sustainable development of marine-related industries.[4] At the same time, the quality of the marine environment affects the development of blue finance, which in turn affects the development of the marine fishery economy. This gives rise to questions such as the following: Can blue finance promote the sustainable development of the marine fishery economy? Can blue finance and marine environmental quality jointly promote the marine fishery economy? What is the mechanism by which the two influence the marine fishery economy? Investigating such questions holds theoretical significance for promoting blue finance and the marine fishery economy as well as practical value for coastal regions aiming to achieve the “blue transformation” of the marine economy.
Research on blue finance and the marine fishery economy mainly focuses on the meaning of blue finance and its promotion of the marine economy. The Asian Development Bank defines blue finance as an emerging area in climate finance, where blue bonds and blue loans serve as innovative financing instruments, and funds are invested in blue economy domains such as water and wastewater management, marine plastic reduction, marine ecosystem restoration, sustainable shipping, eco-friendly tourism, and offshore renewable energy.[5] Hu Jinyan et al. (2018) proposed that blue finance is a concentrated reflection of the “green” concept in the marine field that encourages investors to participate in marine environmental protection using blue financial instruments.[6] Investigating financial support for the marine economy and marine environmental protection, He Dan (2021) highlighted blue finance and related financial products as the main areas for development.[7] Deng Yu (2023) reviewed and summarized the development and practices of domestic and international blue finance and suggested the following for its further development: Clarify the development goals and main tasks of blue finance, set up professional departments or specialized institutions for blue finance, accelerate innovations in blue finance investment and financing models, and deepen international cooperation.[8] Keen et al. (2017) suggested that blue finance is essential for promoting sustainable blue economy development and protecting marine ecosystems.[9] Wabnitza and Blasiak (2019) focused on the practical functions of blue finance, noting that it raises funds from international investors and invests them in ocean-related projects.[10] Chen Lingxiang (2022) noted that blue bonds promote the segmentation and improvement of the green bond market, optimize local debt structures, and help achieve the goal of carbon neutrality.[11] Considering the development advantages of the Guangdong–Hong Kong–Macao Greater Bay Area, Meng Fanchen (2023) proposed that a blue financial system could be built in the area through measures such as coordinating forces, improving rules, cultivating subjects, innovating tools, establishing think tanks, and preventing risks.[12] Chen Tingting (2022) noted that constructing a blue financial system could further promote the blue economy and support the high-quality development of the marine economy.[13] Cheng Baozhi (2023) characterized blue finance as an open financial system containing diversified financing channels, risk-control tools, and financial products that can guide the role of capital in structurally adjusting the marine industry and transforming its development. For example, blue bonds, an innovative investment tool in the capital market, can optimize the allocation of marine production factors and overcome the financing constraints of marine-related enterprises.[14] Like green finance, blue finance can perform the function of “resource allocation” and leverage capital-oriented financial resources to flow to blue projects through products such as blue credit, bonds, and funds.[15]
Studies have mainly focused on blue finance’s effect on marine economy development. Few, however, have specifically studied blue finance and the development of the marine fishery economy through empirical investigation. This study, therefore, takes the marine fishery economies of China’s coastal provinces and cities as the research object and explores blue finance’s effect on the marine fishery economy. Furthermore, we analyze marine environmental quality as a moderator in blue finance’s effect on the marine fishery economy and reveal the marginal effects of blue finance and marine environmental quality on the marine fishery economy.
This study’s marginal contributions are as follows. First, we explore the effects of blue finance and marine environmental quality in China’s coastal provinces and cities on the marine fishery economy and reveal blue finance’s promotion of the marine fishery economy. This enriches the related literature on the marine fishery economy. Second, existing studies mainly analyze the mechanisms and development paths of marine fishery economy development in terms of upgrading marine fisheries and developing the digital economy. They do not, however, consider the effect of blue finance and marine environmental quality on the marine fishery economy. Based on the characteristics of the marine fishery economy, we analyze the mechanisms by which blue finance, marine environmental quality, and other factors influence the marine fishery economy. This expands theories of blue finance and empirical research on the marine fishery economy. Third, we reveal the regulating role of marine environmental quality in blue finance’s promotion of the marine fishery economy and the marginal effects of blue finance and marine environmental quality on the marine fishery economy. We further clarify the path by which blue finance promotes the marine fishery economy. This can serve as a reference for governments to formulate policies for blue finance and the marine fishery economy.
2. Study Design and Methods
2.1. Study Area
We select 11 coastal provinces (cities) in China as the research objects: Liaoning, Tianjin, Hebei, Shandong, Jiangsu, Shanghai, Zhejiang, Fujian, Guangdong, Guangxi, and Hainan. We calculate data related to blue finance and marine environmental quality to explore the relationship between the two and their effect on the marine fishery economy. The study period is 2011–2023. The data used mainly come from the China Statistical Yearbook, China Environmental Statistical Yearbook, and China Fishery Statistical Yearbook.
2.2. Indicator System Construction
Blue finance and the marine environment are relatively complex systems. We therefore construct an index system to accurately measure the level of blue finance and marine environmental quality. Blue finance is divided into seven indicators: blue credit, blue investment, blue insurance, blue bonds, blue support, blue fund, and blue equity. (1) Blue credit: This refers to loans provided by banks or other financial institutions to finance sustainable projects in the marine economy (e.g., desalination, marine engineering equipment manufacturing). (2) Blue investment: This is an investment method that integrates environmental protection and sustainable development concepts into investment decision-making. Blue investment includes clean marine energy, marine environmental protection, and marine water resource management. (3) Blue insurance: This provides risk protection for activities in marine and coastal areas (e.g., climate index insurance) to deal with risks arising from climate change. (4) Blue bonds: These are similar to green bonds but are specifically designed to finance sustainable projects in marine and coastal areas, such as marine conservation and renewable energy. (5) Blue support: This refers to the proportion of government investment in marine environmental protection in general budget expenditure. (6) Blue fund: This is an investment fund focused on ocean-related projects, such as marine ecosystem restoration and marine biodiversity conservation. (7) Blue equity: Similar to green rights and interests, it aims to use market mechanisms to reduce pollution or greenhouse gas emissions and promote the green, low-carbon development of the ocean. It can include carbon markets, emission rights trading, energy use rights trading, and water rights trading. All of these indicators play an important role in blue finance and are therefore selected to construct a blue finance indicator system.
We construct an evaluation index system for marine environmental quality using previously selected indicators, mainly classified in two dimensions: marine resource quality and marine ecological quality. For the measurement of marine resource quality, we select the relative annual variation in sea levels, the area of coastal wetland, and the proportion of stations whose sea sediment conditions meet the quality standard of class I marine sediment. Marine ecological quality is measured by four indexes: chemical oxygen demand of phytoplankton diversity index, zooplankton diversity index, benthic biodiversity index, and annual average number of fecal coliforms in the water. Table 1 shows the specific indicators.
2.3. Methods
2.3.1. Data Standardization
Because of differences in the dimensions and positive and negative indicators of blue finance and marine environmental quality, it is necessary to standardize the indicator data. The specific treatment methods are as follows:
The positive indicator is
The negative indicator is
2.3.2. Entropy Method
There are many methods for measuring the weight of indicators, and each has its own advantages and disadvantages. However, the entropy method has the advantages of strong objectivity and high precision, and it can effectively avoid the index weight error caused by index weight subjectivity. Thus, it is widely used in economics, management, and other fields for weight calculation. We therefore select the entropy method to calculate the weight and comprehensive score of each index of blue finance and marine environmental quality. The calculation formula for index entropy is as follows:
where . represents the specific gravity matrix of the sample index values; represents the standardized data matrix of each indicator; represents the index entropy value, where ; represents the number of indicators; and is the total number of research objects.
Index weight calculation:
where represents the weight of each indicator layer.
where represents the comprehensive score of marine environmental quality.
2.3.3. Moderation Model
First, the following benchmark measurement model is established to verify blue finance’s effect on the marine fishery economy:
where represents the level of the marine fishery economy, represents the level of blue finance, represents the control variable, represents the individual-fixed effect and controls the differences between marine fishery economies in different provinces, represents the time-fixed effect and controls variables related to time, and is the random disturbance term.
Second, to determine whether marine environmental quality plays a regulatory role in promoting the marine fishery economy through blue finance, the following model is established:
where represents the level of marine environmental quality, is the moderating variable; and is the interaction term. The remaining variables are consistent with the above meanings.
2.3.4. Threshold Model
We use a panel threshold regression model proposed by Hansen (1999) to test whether there is a nonlinear relationship among variables such as blue finance, marine environmental quality, and the marine fishery economy.[16] As a nonlinear econometric model, the essence of threshold regression is to find the threshold variable among the variables reflecting the causal relationship. The panel threshold regression model is
In the formula, 1(·) is an indicative function. When the expression in parentheses is false, the value is 0; otherwise, it is 1. According to whether the threshold variable is greater than the threshold value , the sample interval can be divided into two regimes. The slope values and are used to distinguish the two regimes.
Similarly, based on the one-threshold model, the case of multiple thresholds in the model can also be considered. Next, the two-threshold model is taken as an example, and the above model is
where . The calculation process of the two-threshold model is similar to that of the one-threshold model, which is to estimate the second threshold value when the first threshold value is fixed.
2.4. Variable Description
(1) Explained variable: We take the marine fishery economy as the explained variable and use the output value level of marine fishery to measure () and take the logarithm of these values. (2) Explanatory variable: This study takes blue finance as the explanatory variable (), uses the blue finance index system shown in Table 1 for calculation, and takes the logarithm of these values. (3) Regulating variable: Marine environmental quality is selected as the regulating variable of the model (). Similarly, we use the marine environmental quality index system shown in Table 1 for calculation and take the logarithm of these values. (4) Threshold variable: Blue finance and marine environmental quality are used as threshold variables to measure whether they have a nonlinear relationship with the marine fishery economy. (5) Control variable: We select factors that might affect marine fishery economy development as control variables, including the level of marine fishery infrastructure, which is represented by the year-end ownership of marine production fishing vessels (). The production capacity of marine fisheries is expressed by the total amount of marine products (). The output capacity of marine fisheries is expressed by the value of marine fishing (), and the logarithm of these variables is taken to eliminate heteroscedasticity and multicollinearity.As shown in Table 2.
3. Empirical Analysis
3.1. Blue Finance and Marine Environmental Quality Analysis
In Figure 1, blue finance shows a wavy upward trend, with a low overall level and obvious gaps between provinces. During the study period, the blue finance level of coastal provinces increases significantly, with an average increase of nearly four times, from 0.129 to 0.508, and an average annual growth rate of 3%. Blue finance grows the fastest in Shandong, with the blue finance index rising from 0.043 to 0.457, a nearly tenfold increase. The blue finance index in Hainan increases from 0.361 to 0.668, an increase of nearly 1.85 times, with an average annual growth rate of 6%. This shows that China has attached importance to blue finance in recent years, innovated investment and financing models, enhanced the role of blue finance in the marine field, and supported the sustainable development of the marine economy. However, in terms of the blue financial index of each province, the overall level is low. The average value of the blue financial index only reached 0.508 by the end of 2023. Regarding heterogeneity in blue finance development, it varies greatly between provinces. Among them, the blue finance level of Hainan is relatively high, with an average of 0.503; by the end of 2023, it had reached 0.667. Guangdong’s blue finance development level is second only to Hainan, reaching 0.609 by the end of 2023. Meanwhile, Liaoning, Guangxi, Zhejiang, and Shandong all have relatively low levels of blue finance. All were at around 0.45 by the end of 2023, significantly lower than the average for that year. Among them, Liaoning had the lowest blue finance level, with an average value of only 0.267—about half the average value of the blue finance index of Hainan.
In Figure 2, the overall level of marine environmental quality shows a steep upward trend in China’s coastal provinces and cities, averaging about 0.559. However, interprovincial differences are still significant. During the study period, the marine environmental quality of all provinces and cities shows significant improvement. Among them, the marine environmental quality of Jiangsu remains at a high level, with an average value of 0.645. That of Shandong ranks second, with an average of 0.631. Hainan’s marine environmental quality shows the fastest growth, with an average annual growth rate of nearly 7%. At the end of 2023, marine environmental quality was 0.558. This shows that since China implemented the construction of marine ecological civilization, marine environmental quality has greatly improved, the quality and stability of the marine ecosystem have been enhanced, and the carrying capacity and resilience of the marine environment have been strengthened. Nevertheless, there is an obvious, widening gap in marine environmental quality between regions. During the study period, marine environmental quality in Jiangsu rises from 0.551 to 0.716, with an average of 0.645, while that of Tianjin rises slowly from 0.274 to 0.425, with an average of 0.336. Shanghai’s marine environmental quality rises from 0.349 to 0.395, with an average of only 0.311. The average level of marine environmental quality in Tianjin, Shanghai, and other areas is clearly lower than that of the coastal regions and is only half that of Jiangsu, indicating polarization in marine environmental quality among provinces.
3.2. Benchmark Regression Results
Table 3 lists the baseline regression results for blue finance’s effect on the economic development of marine fisheries. Column (1) shows the regression results when controlling the fixed effects of province and year but without adding control variables. We can see that blue finance has a significantly positive effect on the marine fishery economy, passing the significance test at the level of 1%. Column (2) shows the regression results of the random-effect model after adding control variables. Column (3) shows the regression results of the fixed-effect model after adding control variables. After the Hausman test, the fixed-effect model is better. Column (4) shows the results of the two-way fixed-effect model. The coefficient of blue finance’s effect on the marine fishery economy fails the significance test. Therefore, the regression results in column (3) are better. In conclusion, the estimated coefficient of blue finance on the marine fishery economy is significantly positive at the 1% level, and the result is 0.2447. This shows that blue finance development can improve the marine fishery economy. Meanwhile, marine fishery infrastructure, production capacity, and output capacity all pass the significant test at the 1% level, showing a positive effect.
3.3. Moderating Effect Results
Column (1) of Table 4 shows the results for blue finance’s effect on the marine fishery economy. Column (2) shows that the influence coefficient of marine environmental quality on the marine fishery economy is 0.5342 and passes the significance test at the level of 1%. Column (2) shows the regression results of the fixed effects model with control variables added. Similarly, blue finance has a significant positive driving effect on the marine fishery economy. By comparing the AIC results, it can be concluded that the AIC value of the fixed effects model is -256.513, which is significantly lower than the AIC value of the least squares method. Therefore, the fixed effects model has more advantages than the least squares method model. Column (3) shows the regression results of the random effects model with control variables added. After Hausman’s test, it was found that the fixed effects model performed better. Column (4) shows the results of the bidirectional fixed effects model, and the coefficient of the impact of blue finance on the economic level of marine fisheries did not pass the significance test. Therefore, compared with the results of column (2), the regression results of column (2) are better. In summary, the estimated coefficient of blue finance for the level of marine fishery economy is significantly positive at the 1% level, with a result of 0.2447. This fully indicates that the development of blue finance can effectively improve the level of marine fishery economy development.Meanwhile, the infrastructure, production capacity, and output capacity of marine fisheries have all passed a significant test at the 1% level and have a positive impact on the economic development of marine fisheries.
3.4. Threshold Effect Results
Taking the marine fishery economy as the explained variable, whether there is a threshold value, one threshold value and two threshold values of blue finance are estimated. Referring to Hansen’s (1999) bootstrap method, the p-value corresponding to the test statistic is obtained by repeated sampling 1000 times to determine whether there is a threshold effect. Table 5 shows the results. In the one-threshold model, the F-statistic is significant at the 1% level; that is, the p-value is less than 0.01. Therefore, there is a threshold value in the model. In Table 5, according to the principle of the threshold model, the threshold estimate is the corresponding value when the likelihood ratio (LR) statistic approaches 0. Figure 3 shows the threshold estimate of −1.0586 for blue finance and the LR function diagram under the 95% confidence interval. Figure 4 shows the LR function diagram of the threshold estimate of −1.0285 for marine environmental quality. Among them, the lowest point of the LR statistic is the corresponding true threshold value; the dashed line indicates the critical value of 7.35. Since the critical value of 7.35 is obviously greater than the threshold value, the above threshold value can be considered true and effective.
In addition to the threshold values, the panel threshold regression results for blue finance and marine environmental quality are obtained, as shown in Table 5. When the threshold variable is , the effect of different values on the marine fishery economy is quite different. When blue finance develops in the middle and early stages (≤−1.0586), its influence coefficient on the marine fishery economy is 0.1573, which is significant at the 1% level and plays a significant positive role in promoting the marine fishery economy, but it shows a gradually decreasing trend. When blue finance reaches the middle and late stages (−1.0586<), the regression coefficient becomes 0.0812 and fails the significance test, but this also shows that blue finance has a marginal effect on the marine fishery economy. We can conclude that blue finance’s effect on the marine fishery economy is in a U-shaped state. When the threshold value of −0.1586 is exceeded, blue finance’s effect on the marine fishery economy can gradually increase with the continuous improvement of the blue finance level.
When the threshold variable is , the effects of different values on the marine fishery economy are also quite different. When marine environmental quality is in the middle and early stages (≤−1.0285), its influence coefficient on the marine fishery economy is 0.2123, which is significant at the level of 1%. It also plays a significant positive role in promoting marine fishery economy development but shows a gradual decline. When marine environmental quality reaches the middle and late stages (−1.0285<), the regression coefficient becomes 0.2826, which passes the significance test at 1%. This indicates that marine environmental quality plays a significant role in promoting the marine fishery economy, and this influence is gradually increasing. In conclusion, the influence of marine environmental quality on the marine fishery economy is U-shaped. When marine environmental quality is below the threshold value of −1.0285, it promotes the marine fishery economy, but this effect will gradually weaken. Marine environmental quality’s promotion of the marine fishery economy will increase as its quality increases.
4. Discussion
This study reveals the mechanism by which blue finance and marine environmental quality influence the marine fishery economies of China’s coastal provinces and cities. We conclude the following: First, blue finance has a significant positive effect on the marine fishery economy. The regression results in column (3) in Table 3 show that the coefficient of blue finance’s effect on the marine fishery economy is 0.2447 and statistically significant. This is because blue finance can provide diversified financial instruments and service innovations for marine fishery development, optimize resource allocation, meet different market players’ needs, help upgrade the marine fishery industry, help optimize the structure of the marine fishery economy, and enhance its quality. This aligns with previous findings indicating that blue finance is necessary for promoting the sustainable development of the blue economy.[11,12,13,14,15] Blue bonds, an innovative investment tool in the capital market, help optimize the allocation of marine production factors and overcome the financing constraints of marine-related enterprises.[8,9,10] Thus, our study supports and extends the findings of previous research in many ways.
Second, marine environmental quality plays a significant regulatory role in blue finance’s promotion of the marine fishery economy. As shown in Table 5, the regression coefficient of the moderating effect is 0.325, which is significantly positive. This means that improving marine environmental quality can enhance the resource allocation and risk management of blue finance in its effect on the marine fishery economy and promote marine fishery’s sustainable development. Previous studies have focused on blue finance’s effect on marine economy development and marine environmental quality, as well as marine environmental quality’s effect on the marine economy. They have not, however, analyzed the mechanism of marine environmental quality in blue finance’s promotion of the marine fishery economy. We confirm this mechanism, thus broadening research in this area. This holds significance for accelerating blue finance system construction, improving marine environmental quality, and enhancing the quality of the marine fishery economy.
Third, blue finance and marine environmental quality have marginal effects on promoting marine fishery economy development. As shown in Table 5, blue finance and marine environmental quality both have a first-order threshold effect on the marine fishery economy, with threshold values of −1.058 and −1.0285, respectively, and the effect coefficients under the first-order thresholds are 0.1537 and 0.2123. This demonstrates that blue finance is crucial for the sustainable development of the marine fishery economy. At the same time, blue finance and marine environmental quality jointly affect the marine fishery economy. However, there is a nonlinear relationship in the effect of blue finance and marine environmental quality on the marine fishery economy. This is because, as part of a long-term process, in the early stage of blue finance development, it can provide financial support for the marine fishery economy through resource allocation, risk management, and market pricing, while also promoting marine ecosystem health to balance the growth of the marine fishery economy and marine environmental protection. Examples include blue loans and loans provided by banks or other financial institutions to finance sustainable marine fishery projects. Such projects can include deep-sea fishery development, modernized sea ranches, or zero-carbon fishery island construction. Blue funds focus on investing in marine-type projects such as marine ecosystem restoration and marine biodiversity conservation. Based on this, various forms of blue finance have come into being, and the blue finance market has been growing. However, as the amount of blue finance investment rises and the scale expands, the related risks and the cost of intermediary transactions also increase. Problems with financial technology and development mechanisms are also gradually exposed, resulting in market failure. This will hinder the optimal allocation of resources and the control of risk, and blue finance’s effect on the marine fishery economy will be weakened. However, with the continuous improvement of blue finance policies, technologies, and mechanisms, blue finance will further promote the utilization and allocation of marine fishery resources, thus having favorable effects on the marine fishery structure and economy. The effects of marine environmental quality are similar.
We analyze the driving effect of blue finance on the quality of the marine fishery economy in terms of the relationship between finance and economic development. This holds both theoretical and practical value for promoting blue finance’s ability to serve the blue economy. First, this improves our understanding of the development trends of blue finance and its role in marine fishery economy development, enriching research in this area and providing a new perspective on blue finance’s use of financial instruments and services to promote the marine fishery industry. In this way, we offer a new research framework for the diversified promotion of the high-quality development of marine fisheries. Second, we provide a realistic path and policy reference for the high-quality development of the marine fishery economy. The marine fishery economy currently faces problems such as a lack of financial resources and risk control, as well as low ecological product efficiency. We verify that the development of blue finance empowers marine fishery economy development and expands its high-quality development path.
Despite these contributions, this study has some limitations. Given the limitations of data availability, some indicators are not included in the evaluation index system, which will affect the accuracy of the empirical results. For example, indicators such as risk management assessment are not included because the data are not available. At the same time, this study lacks an in-depth analysis of whether blue finance’s effect on the marine fishery economy is regionally heterogeneous and whether blue finance can reduce the adverse effects of climate change on the marine fishery economy. This can be investigated in future research. Although this study is based on blue finance data for China, its conclusions are equally applicable to other coastal countries and regions (e.g., Europe, South Africa, India, Brazil), which can provide decision-making references for other countries and regions to formulate high-quality blue finance development policies. These countries also face problems such as imperfect blue finance policies, mechanisms, and technologies, as well as the weak promotion of the marine fishery economy. The sustainable development of the marine fishery economy can be better promoted by improving blue finance policies, mechanisms, and other aspects.
5. Conclusion
By measuring the effects of blue finance and marine environmental quality on the marine fishery economy in 11 regions of China from 2011 to 2023, we derive the following conclusions:
(1) Blue finance can promote the improvement of the marine fishery economy. Blue finance has a positive driving effect on the marine fishery economy, and the estimated coefficient is significantly positive at the 1% level, with a result of 0.2447. This indicates that the development of blue finance can effectively enhance the marine fishery economy.
(2) Marine environmental quality has a significant moderating effect on blue finance’s effect on the marine fishery economy. Under the regulation of marine environmental quality, the coefficient of influence of blue finance on the marine fishery economy is 0.4532 and passes significance at the 1% level. This indicates that marine environmental quality can further enhance the promotion effect of blue finance on the marine fishery economy.
(3) Blue finance and marine environmental quality have a nonlinear relationship in their effect on the marine fishery economy. Blue finance and marine environmental quality have a first-order threshold effect on the marine fishery economy. The threshold value of blue finance is −1.0586, and its effect coefficient on the marine fishery economy is 0.1573. This indicates a significant positive driving effect on the marine fishery economy but with a gradually decreasing trend. The threshold value of marine environmental quality is −1.0285. When marine environmental quality is below the threshold value of −1.0285, it has a positive driving effect on the marine fishery economy, but the influence will be gradually weakened. When the threshold value of −1.0285 exceeds, the promotion effect of marine environmental quality on the marine fishery economy will show a rising trend with marine environmental quality continuously increasing.
Author Contributions
Conceptualization, data analysis, and original draft, Y.J.; methodology, software, and visualization, L.H.; writing—review and editing, W.S.and Y.X.; supervision, project administration, and funding acquisition, Y.L. All authors have read and agreed to the published version of the manuscript.
Funding
Social Science Planning Fund of Liaoning Province:“Research on Promoting the Development Path of Liaoning’s Marine New Quality Productivity” (L24BJY004).
Institutional Review Board Statement
Not applicable.
Informed Consent Statement
Not applicable.
Data Availability Statement
The data presented in this study are available upon request from the corresponding author.
Acknowledgments
The authors would like to thank the editors for their kind and insightful advice. We thank two anonymous reviewers for constructive comments that improved this manuscript.
Conflicts of Interest
The authors declare no conflicts of interest.
References
- FAO.The State of World Fisheries and Aquaculture 2024: Blue Transformation in action—Summary Rome(SOFIA)[EB/OL]. 2024.https://openknowledge.fao.org/handle/20.500.14283/cd0683en.
- ADBI.Proposing Regulatory-Driven Blue Finance Mechanism for Blue Economy Development[R/OL]. 2020.http://www.adb.org.
- IFC.Guidelines for Blue Finance:Guidance for financing the Blue Economy, buliding on the Green Bond Principles and the Green Loan Principles[R/OL].2022. Guidelines for Blue Finance.
- Wang Shuang. Basic connotation, development status and prospect of blue finance. J. International Finance. 2023(4):41-46. [CrossRef]
- Blue group. Blue are delighted to announce that we will be runnning a 0% finance offer through the month of september 2019[EB/OL].https://blue-group.com/news/news-articles/blue-0-finance-offer/.
- Hu Jinyan, Zhao Jian. The strategic significance and basic path of financial support for marine economy in the new era[J]. Review of Economics and Management. 2018,34(5):12-17. [CrossRef]
- He Dan. Research on International practice of Blue Finance and its enlightenment to China[J]. Regional Finance Research. 2021(1):34-41.
- Deng Yu. Development process, practical experience and countermeasures of blue finance[J]. Exploration of Finance Theory.2023(5):13-20. [CrossRef]
- MR Keen, AM Schwarz, L Wini-Simeon.Towards defining the Blue Economy:Practical lessons from pacific ocean governance[J].Marine Policy. 2017,88(FEB.):333-341. [CrossRef]
- CCC Wabnitz, R Blasiak.The Rapidly Changing World of Ocean Finance[J]. Marine Policy. 2019,107(SEP.):103526. [CrossRef]
- Chen Lingxiang. Development status, Existing problems and suggestions of blue Bonds[J].Chinese Market. 2022(7):46-48. [CrossRef]
- Meng Fanchen, Chen Wenhu,Chen Jiajia. Development advantages and implementation paths of blue finance in Guangdong-Hong Kong-Macao Greater Bay Area[J]. Rural Finance Research. 2023(12):55-64. [CrossRef]
- Chen Tingting. Analysis of blue finance path supporting high-quality development of marine economy: from the perspective of Fujian Province[J]. Fujian Finance. 2022(7):19-25.
- Cheng Baozhi. International process and practice of blue finance development in China[J].The economic community. 2023(6):34-43.
- Deng Yu. Research on the development path of China’s blue finance: International experience, local innovation and route design[J]. Southwest Finance. 2023(7):26-39..
- Bruce E. Hansen. Sample Splitting and Threshold Estimation[J].Economics.Econometrica. 2000,68,pp.575-603. [CrossRef]
- Xing Miao, Zhang Jiangang, Feng Weimin. Research on the Coupling Development of China’s Financial and marine Industrial Structure[J].. Resource development and markets.2016,32(6):728-734.
- Di Qianbin, Guo Yali. Verification of interactive stress relationship and calculation of coordination degree of sustainable development system of marine economy: a case study of six coastal cities in Liaoning Province. J. Marine Environmental Science. 2016(3):453-459.
- Kildow J T, Mcllgorm A. The importance of estimating the contribution of the oceans to national economies. J. Marine Policy. 2010,2(34):367-374.
- Qin Huaiyu, Tang Ning. EKC model test on the relationship between marine economic growth and marine environmental pollution. J. The Contemporary Economy. 2009(17):158-159.
- Cui Gengrui. Whether Digital Finance Can Enhance China’s Economic Resilience. J. Journal of Shanxi University of Finance and Economics. 2021,43(12):29-41.
- Zheng Yi. Evaluation and analysis of marine economic and environmental performance in coastal areas of China. J. Marine Economics. 2014(2):13-19.
- Zhang Yujie, Li Mingxin, Guo Yue. Enlightenment of United Nations Environment Program’s series of blue finance measures to China’s development. J. Economic vertical and horizontal. 2023(9):86-93.
- Mathew J,Robertson C.Shades of Blue in Financing:Transforming the Ocean Economy with Blue Bonds. J. Journal of Investment Compliance. 2021,22(3):243-247.
- Thompson B.Blue Bonds for marine Conservation and a Sustainable Ocean Economy:Status, Trends, and Insights from Green Bonds. J. Marine Policy. 2022.
- Guo Pwiyuan, Bi Lianshan. A review of Sustainable Blue Economy and Finance Principles. [N/OL]. Finance in China. 2022,(23):51-53.
- Han G X, Song W M, Li Y, et al. Enhancement of coastal blue carbon:Concepts, techniques, and future suggestions. Bulletin of Chinese Academy of Sciences. 2023,38(3):492-503.
- Qiu Rongshan, Yin Wei, Han Limin. Evaluation of high quality development level and classification of regional marine economy in China. J. Statistics and Decision. 2023,39(1):103-108.
Figure 1.
Levels of blue financial development in China (2011–2023).
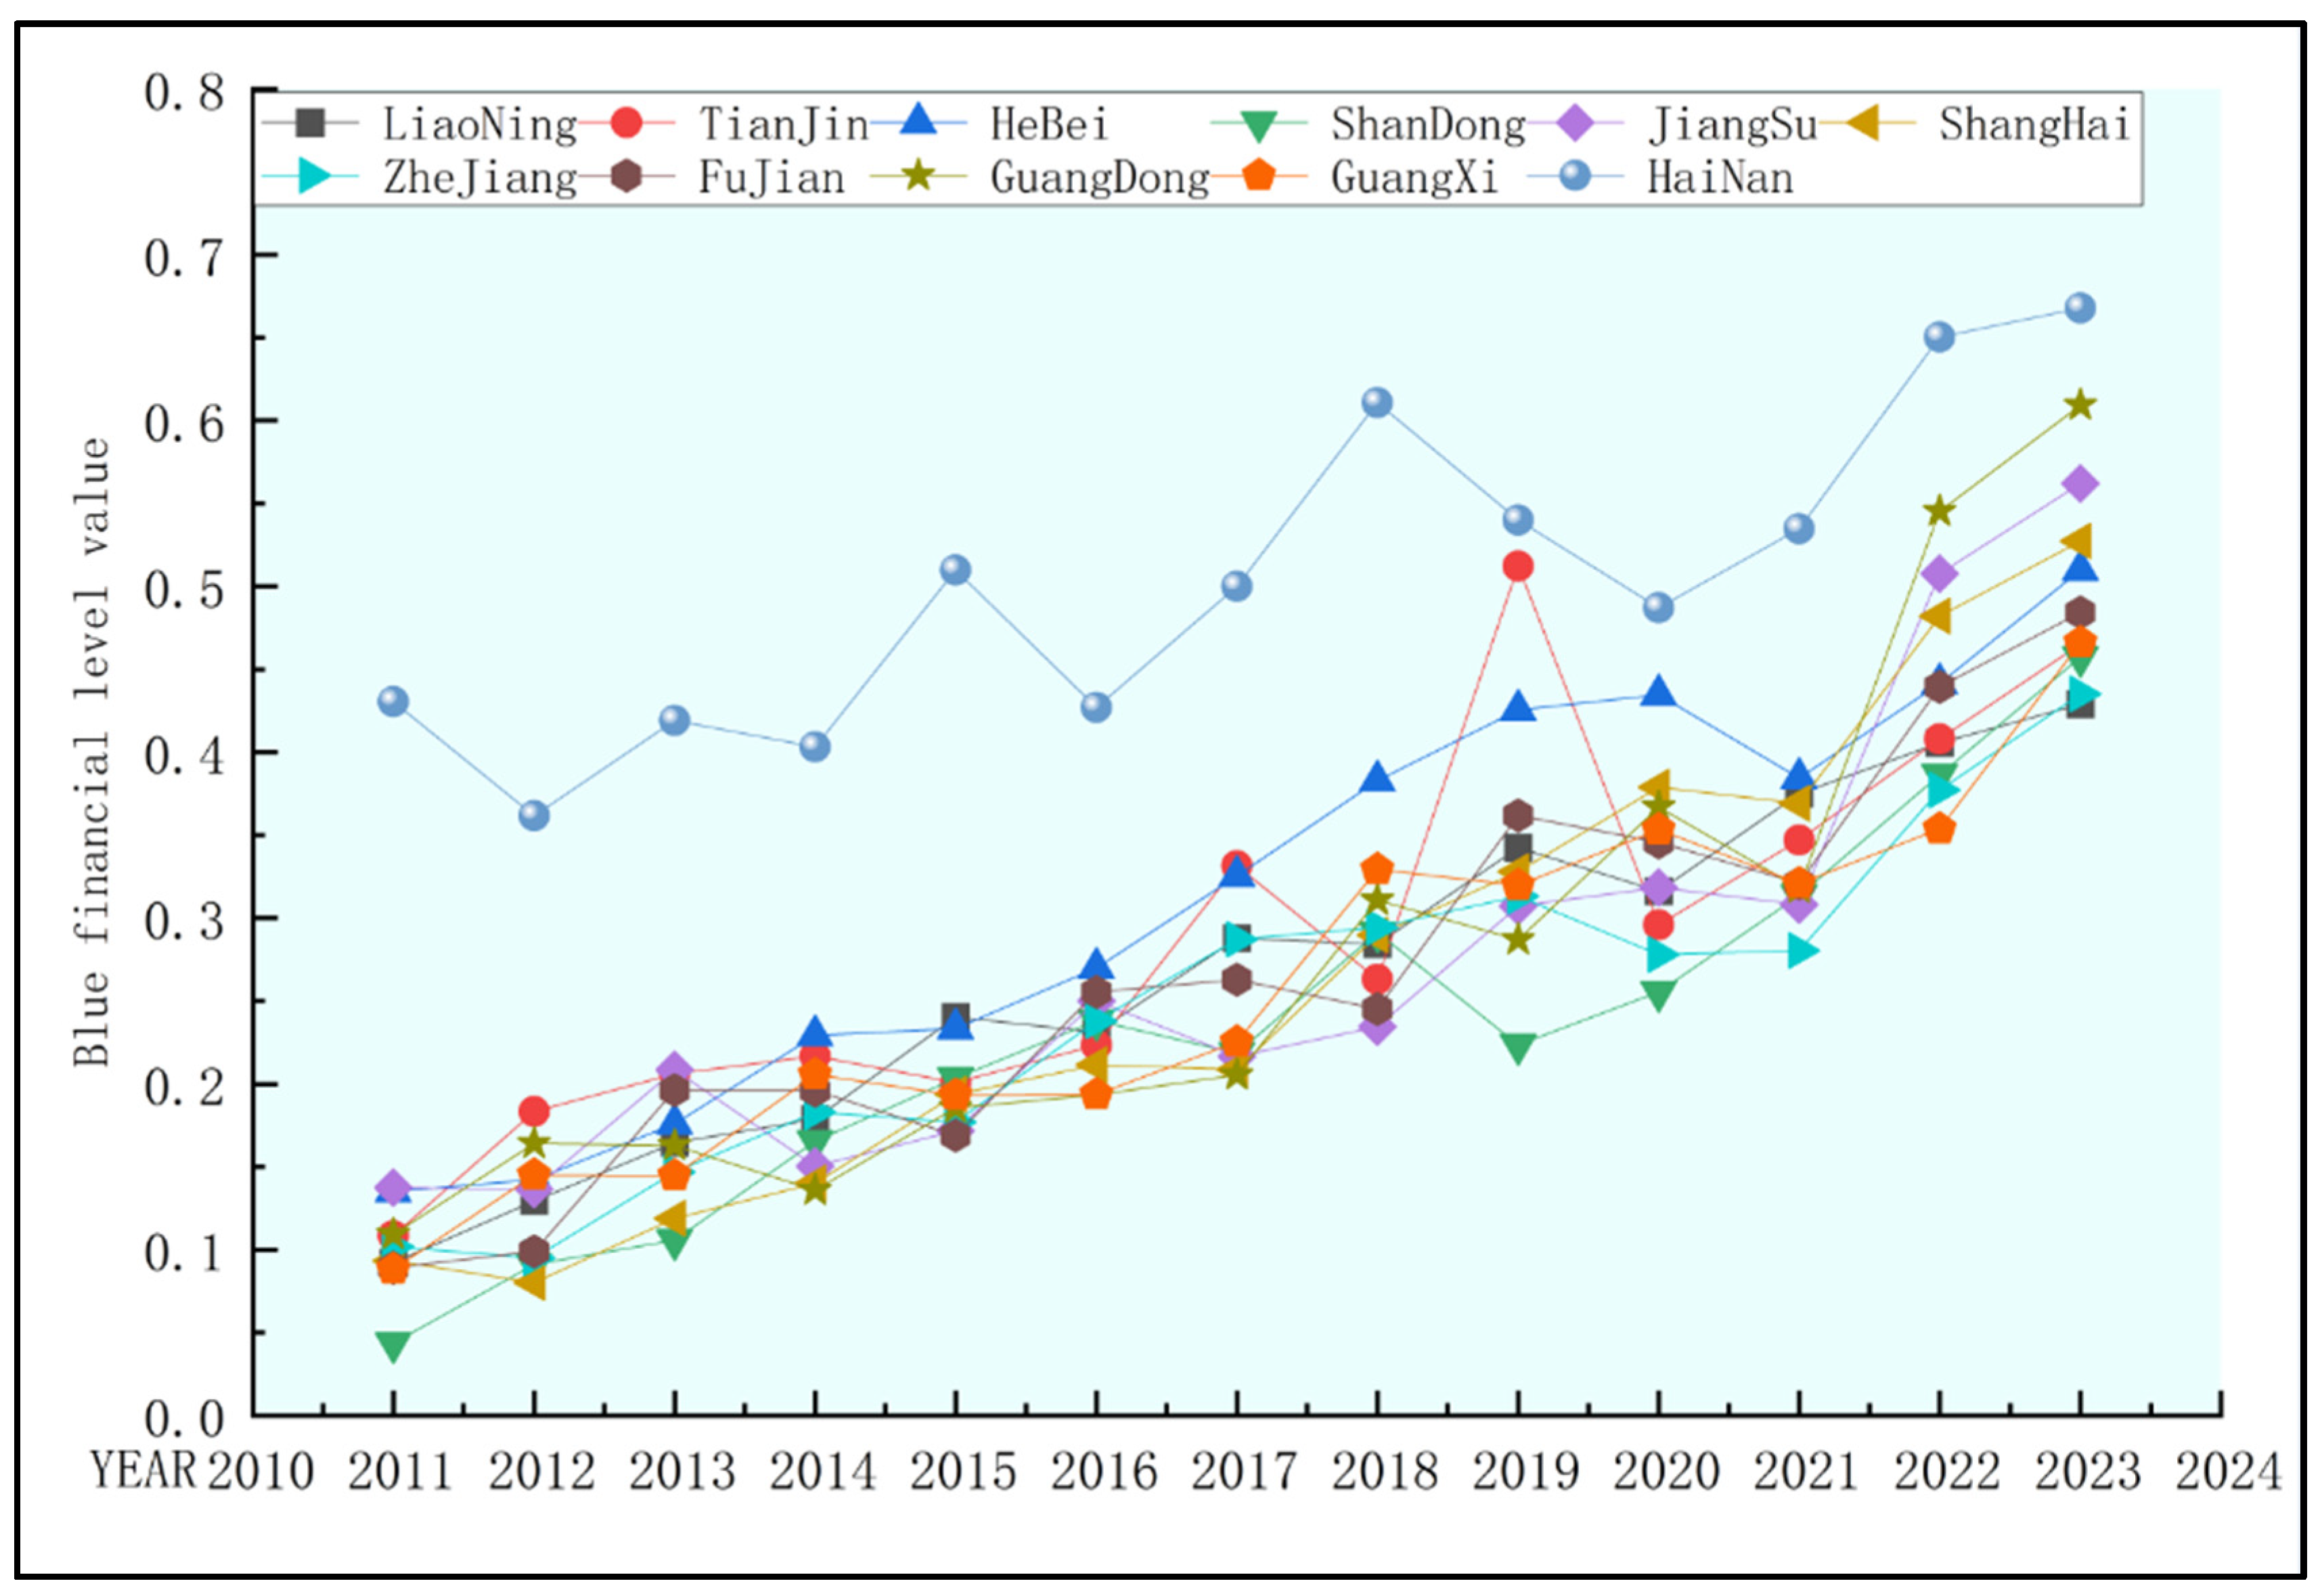
Figure 2.
Marine environmental quality in China (2011–2023).
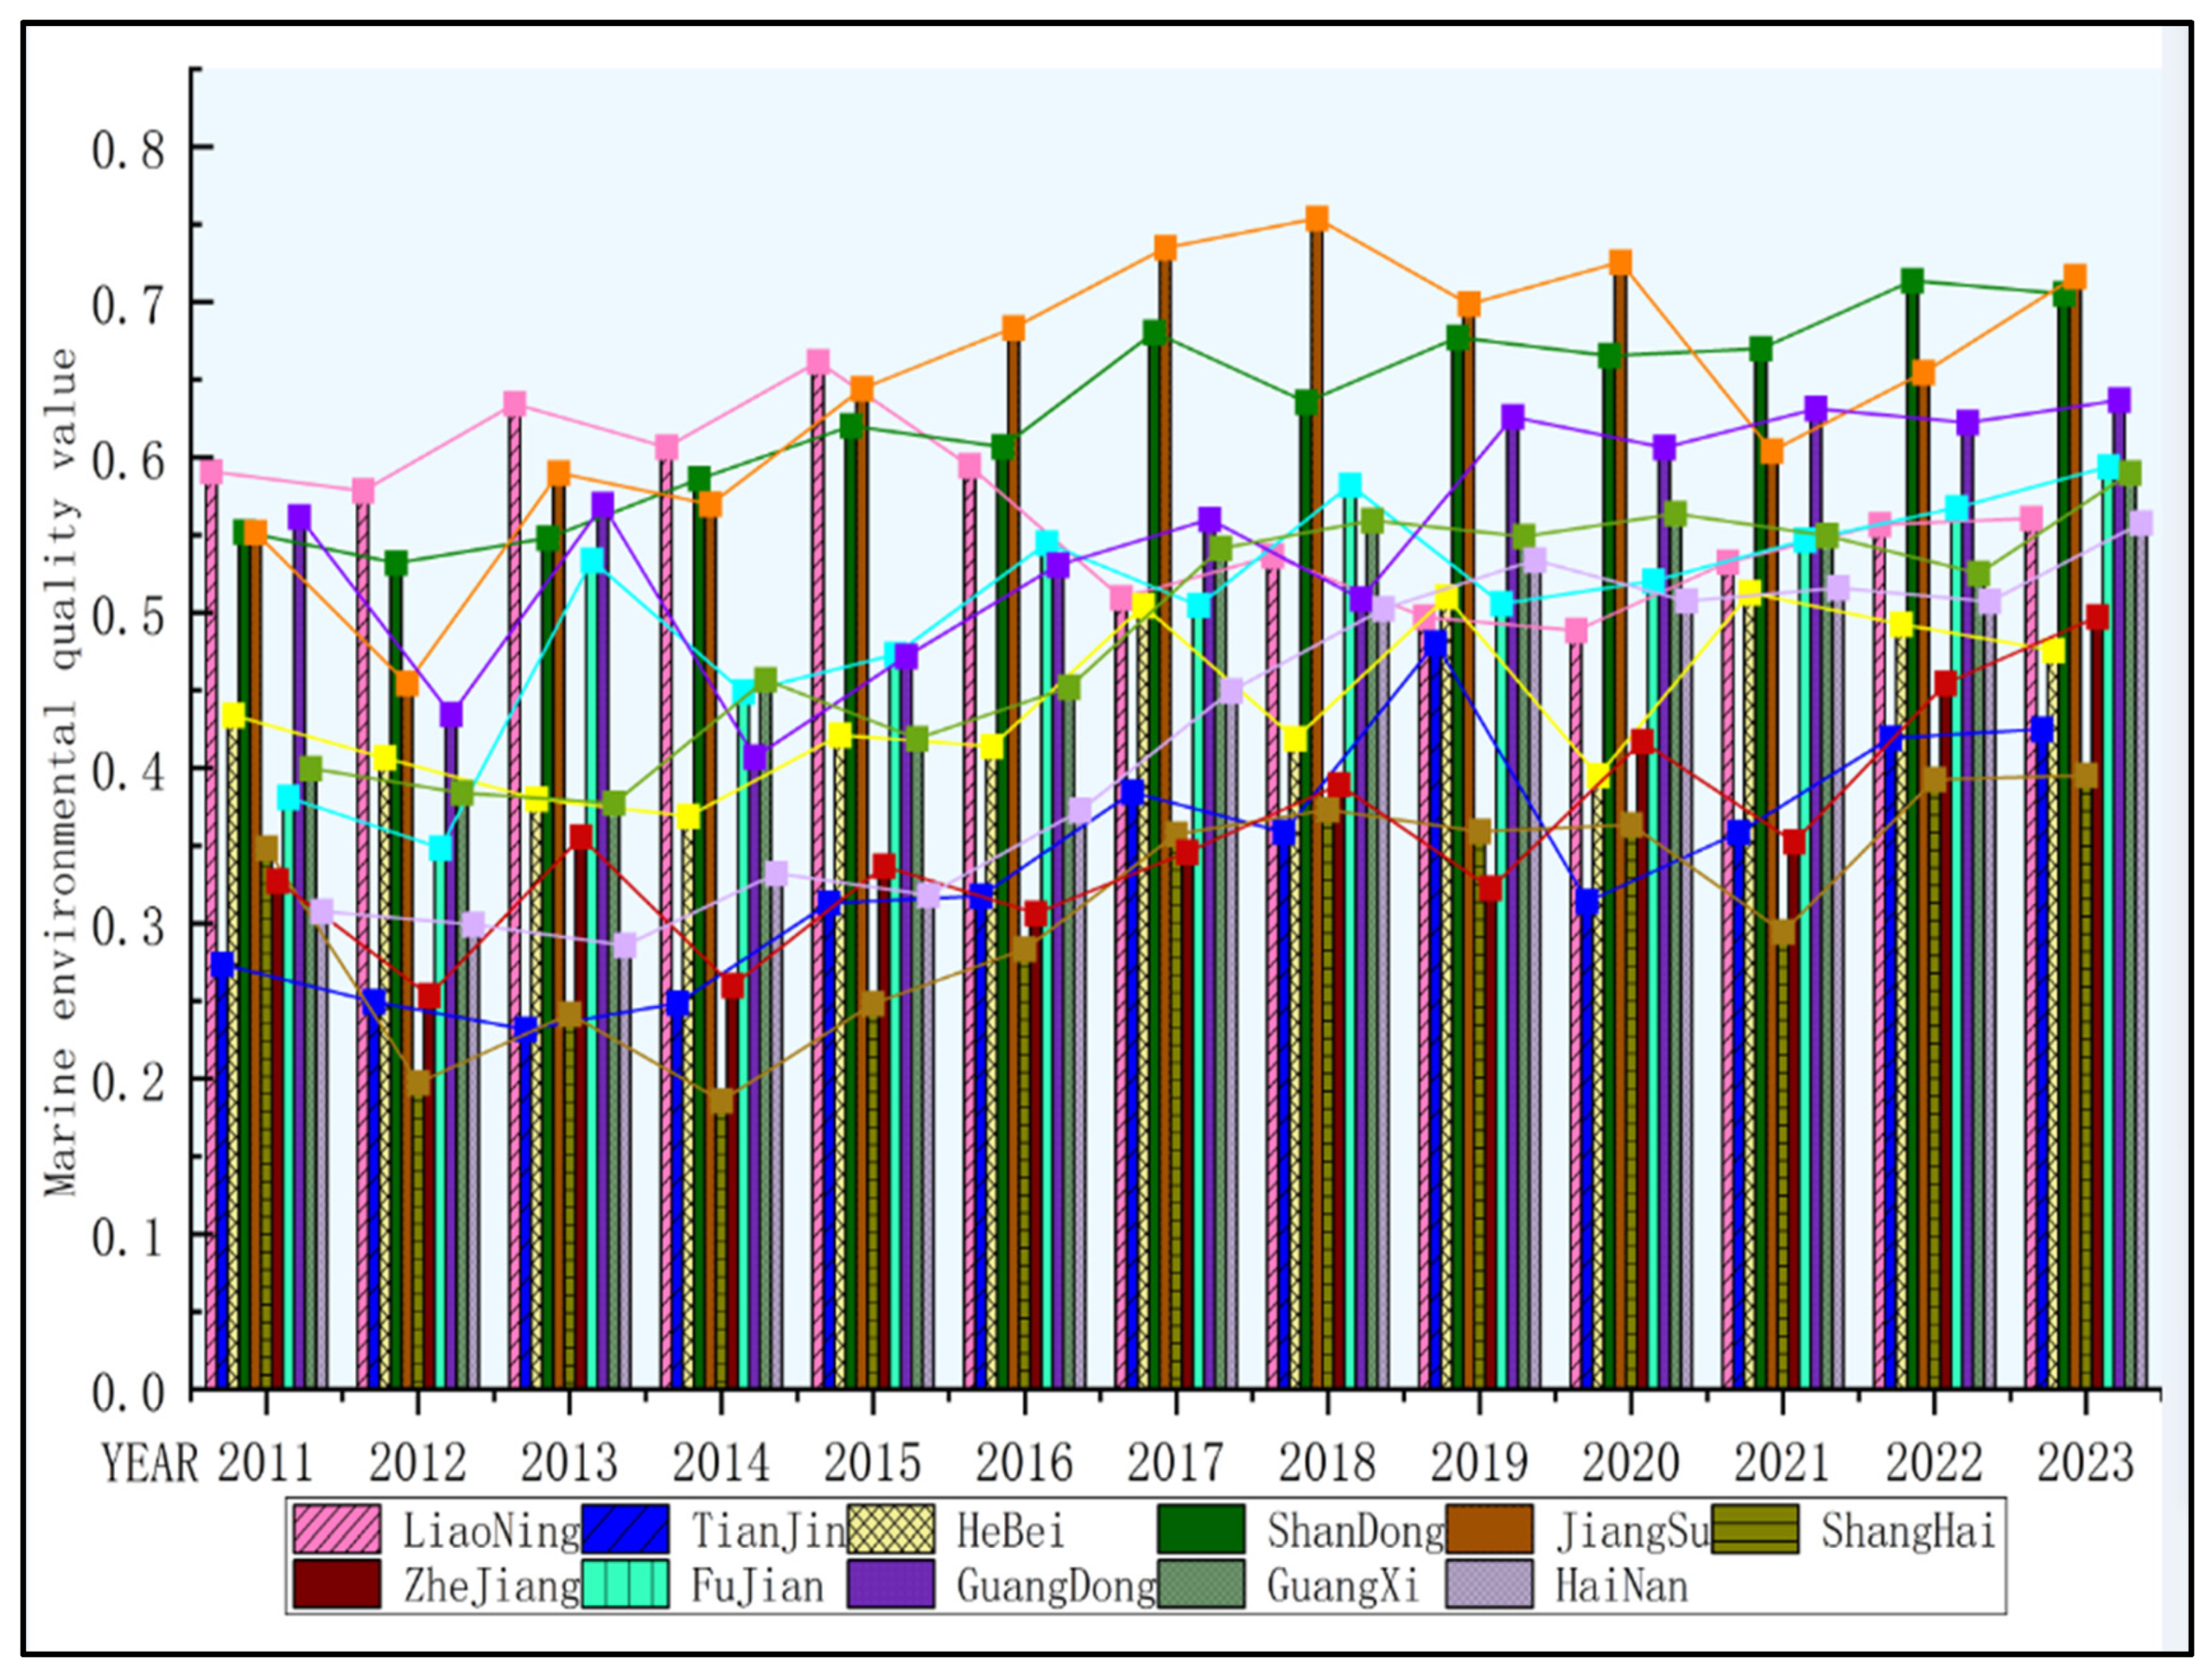
Figure 3.
Blue finance 1 intermediate threshold estimation results.
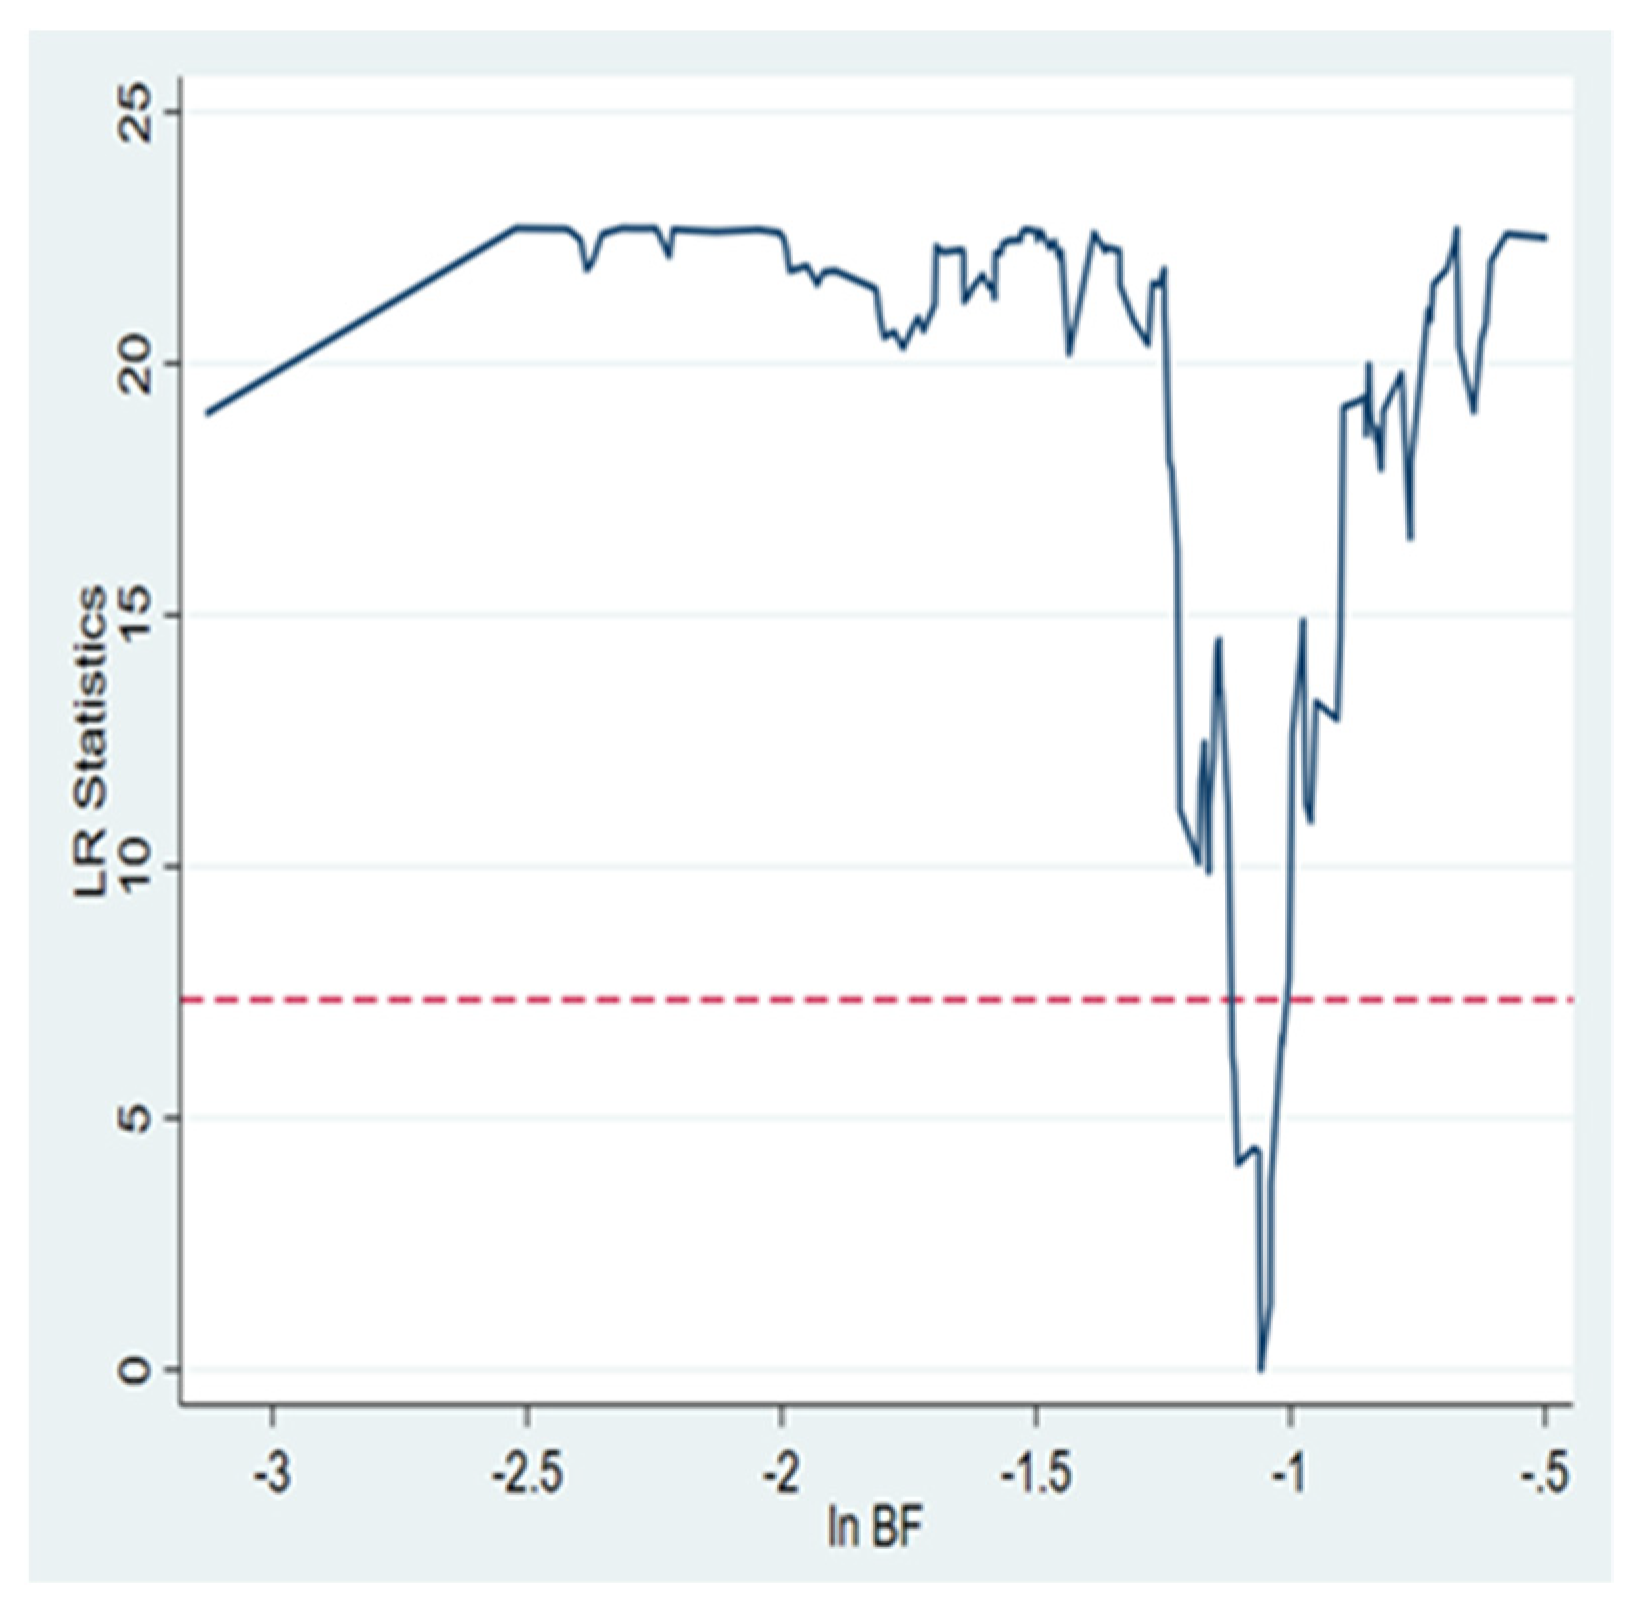
Figure 4.
Marine environmental quality 1 intermediate threshold estimation results.
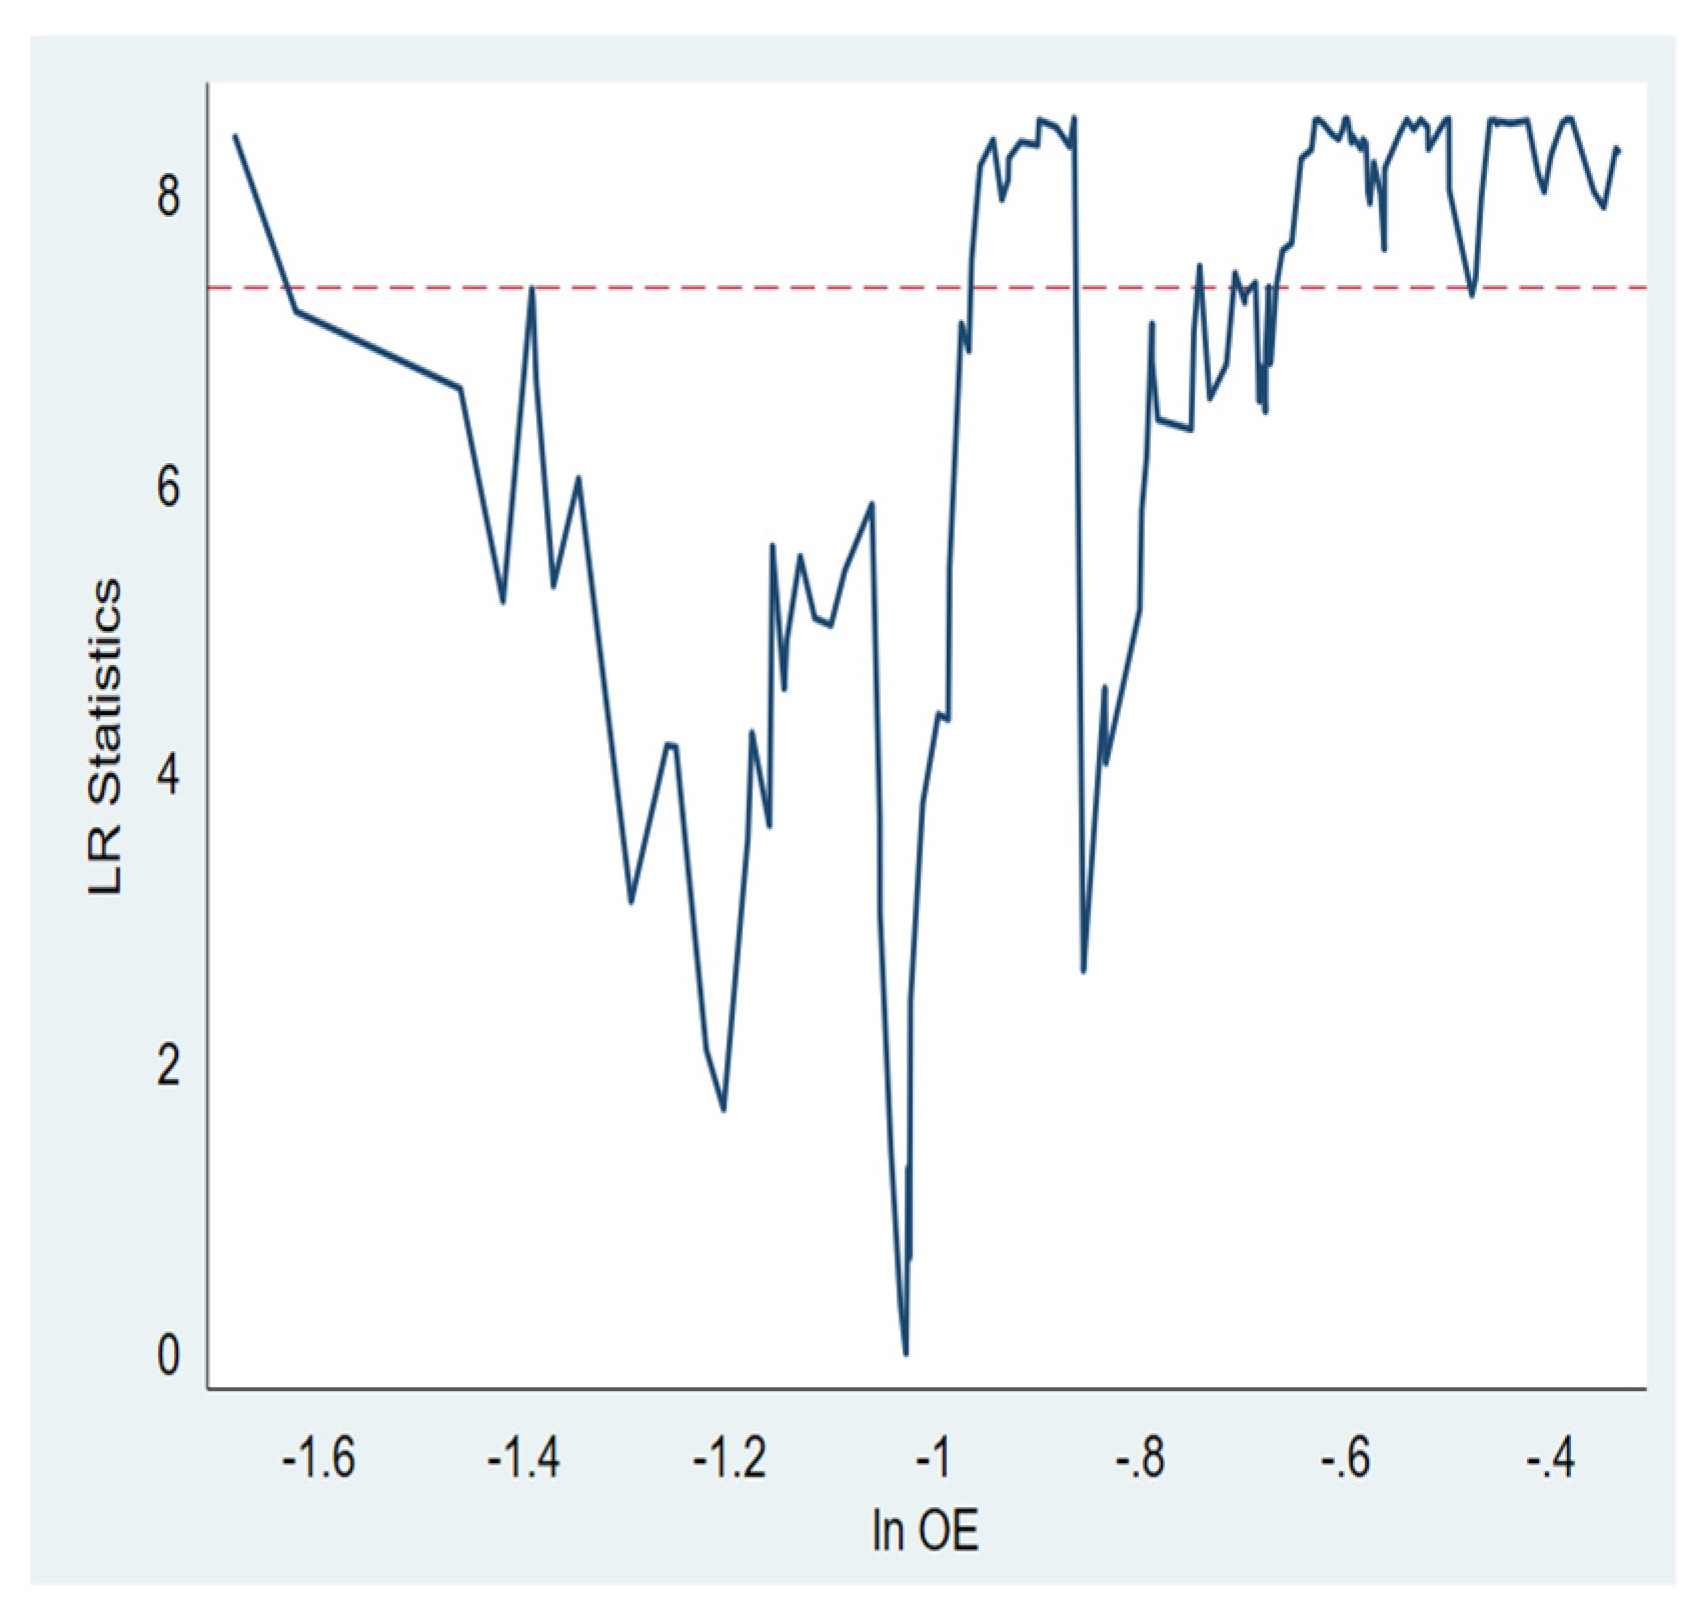

Table 1.
Indicator system for evaluating blue finance and marine environmental quality.
| Target Layer | Rule Layer | Index Layer | Index (Positive/Negative) | Weight |
| Blue finance level |
Blue credit | Total credit of provincial marine environmental protection projects (billion CNY)/total credit of the province (billion CNY) | Positive | 0.1715 |
| Blue investment | Total investment in marine environmental governance (billion CNY)/GDP (billion CNY) | Positive | 0.1105 | |
| Blue insurance | Income from environmental pollution liability insurance (billion CNY)/total premium income from environmental protection (billion CNY) | Positive | 0.1721 | |
| Blue bonds | Total amount of blue bonds issued (billion CNY)/total amount of all bonds issued (billion CNY) | Positive | 0.1328 | |
| Blue support | Fiscal expenditure on environmental protection (billion CNY)/fiscal expenditure from general budget (billion CNY) | Positive | 0.1084 | |
| Blue fund | Total market value of blue funds (billion CNY)/total market value of all funds (billion CNY) | Positive | 0.1591 | |
| Blue equity | Total amount of carbon trading, energy trading, and emission trading (billion CNY)/total amount of equity market trading (billion CNY) | Positive | 0.1457 | |
| Marine environmental quality level |
Marine resource quality | Relative annual variation of sea level (mm) | Negative | 0.1331 |
| Coastal wetland area (thousand hectares) |
Positive | 0.3582 | ||
| Proportion of stations where the sediment conditions in the sea area meet the quality standards of class I marine sediments (%) | Positive | 0.0808 | ||
| Marine ecological quality | Phytoplankton diversity index chemical oxygen demand | Positive | 0.1175 | |
| Diversity index of planktonic animals | Positive | 0.0536 | ||
| Benthic biodiversity index | Positive | 0.2392 | ||
| Annual average number of fecal coliforms in water (PCS/L) | Negative | 0.0176 |
Note: Weights are calculated using the method given in Section 2.3.2.
Table 2.
Descriptive statistics of the variables.
| Variable type | Specific variables | Variable symbol | Observations | Mean | Standard deviation | Maximum value | Minimum value | Coefficient of Variation |
| Explained variable | Marine fishery economy |
143 | −1.324 | 1.371 | 0.4503 | −4.611 | -1.0355337 | |
| Explanatory variable | Blue finance | 143 | −1.363 | 0.523 | −0.403 | −3.131 | -.3848626 | |
| Regulating variable | Marine environment | 143 | −0.781 | 0.300 | −0.282 | −1.682 | -.38387408 | |
| Control variable | Production of fishing boats | 143 | −0.867 | 1.17 | 0.928 | −3.778 | -1.3554619 | |
| Seafood products | 143 | −1.904 | 1.525 | −0.239 | −5.563 | -.8006338 | ||
| Marine fishing value | 143 | −2.185 | 1.129 | −0.323 | −5.505 | -.51692772 |
Table 3.
Benchmark regression results.
| Variable | Ordinary model (1) | Random effect (2) | Fixed effect (3) | Two-way fixed effect (4) |
| 0.4766 (***) | 0.2574 (***) | 0.2447 (***) | 0.055 (0.239) | |
| 0.1213 (0.112) | 0.2397 (***) | 0.188 (**) | ||
| 0.303 (***) | 0.2501 (***) | 0.3997 (***) | ||
| 0.703 (***) | 0.7109 (***) | 0.6197 (***) | ||
| -cons | −0.6747 (***) | 1.245 (***) | 1.247 (***) | 0.7972 (***) |
| AIC | -23.915 | -256.513 | ||
| Hausman | Chi2(5)=203.65(***) | |||
| Sample size | 143 | 143 | 143 | 143 |
| Adjusted | 0.864 | 0.943 | 0.935 | 0.952 |
Note: *, **, and *** indicate significance at the 10%, 5%, and 1% levels, respectively.
Table 4.
Measurement results for the adjustment effect.
| Variable | (1) | (2) | (3) |
| 0.2447 (***) | 0.1906 (***) | 0.4532 (***) | |
| 0.5342 (***) | 1.003 (***) | ||
| * | 0.325 (***) | ||
| 0.2397 (***) | −0.252 (***) | −0.2868 (***) | |
| 0.2501 (***) | 0.6438 (***) | 0.6642 (***) | |
| 0.7109 (***) | 0.5216 (***) | 0.5335 (***) | |
| -cons | 1.247 (***) | 1.50 (***) | 1.901 (***) |
| Sample size | 143 | 143 | 143 |
| Adjusted | 0.935 | 0.9807 | 0.982 |
Note: Standard errors in parentheses; *p<0.1, **p<0.05, ***p<0.001.
Table 5.
Threshold effect measurement results.
| Category | Blue finance | Marine environmental quality | ||
| Threshold number | 1 | 2 | 1 | 2 |
| F-value | 50.69 | 10.53 | 15.00 | 2.63 |
| P-value | 0.019 | 0.298 | 0.02 | 0.865 |
| 10% critical value level | 30.58 | 10.445 | ||
| 5% critical value level | 38.51 | 12.298 | ||
| 1% critical value level | 56.93 | 16.995 | ||
| Threshold value | −1.0586 | −1.0285 | ||
| Corresponding value | 0.3469 | 0.3575 | ||
| 95% confidence interval | (−1.092, −1.04) | (−1.048, −1.026) | ||
| 0.4377 (***) | 0.189 (***) | |||
| 0.3762 (***) | 0.201 (***) | |||
| 0.7682 (***) | 0.756 (***) | |||
| 0.1537 (**) | ||||
| 0.0812 (0.37) | ||||
| 0.2123 (***) | ||||
| 0.2826 (***) | ||||
| 1.515 (***) | 1.238 (***) | |||
| 0.944 | 0.922 | |||
| Sample size | 143 | 143 | ||
Note: Standard errors in parentheses; *p<0.1, **p<0.05, ***p<0.001.
Disclaimer/Publisher’s Note: The statements, opinions and data contained in all publications are solely those of the individual author(s) and contributor(s) and not of MDPI and/or the editor(s). MDPI and/or the editor(s) disclaim responsibility for any injury to people or property resulting from any ideas, methods, instructions or products referred to in the content. |
© 2025 by the authors. Licensee MDPI, Basel, Switzerland. This article is an open access article distributed under the terms and conditions of the Creative Commons Attribution (CC BY) license (http://creativecommons.org/licenses/by/4.0/).
Copyright: This open access article is published under a Creative Commons CC BY 4.0 license, which permit the free download, distribution, and reuse, provided that the author and preprint are cited in any reuse.


