
Submitted:
05 February 2025
Posted:
06 February 2025
You are already at the latest version
Abstract
This study aimed to evaluate the effectiveness of an innovative platform (the Bilateral Corneal Symmetry 3-D Analyzer - BiCSA) and a novel corneal symmetry index (the Volume Between Spheres – VBS) in differentiating normal corneas from those with keratoconus. Pentacam imaging data of 30 healthy corneas and 30 keratoconus cases were analyzed. BiCSA was utilized to determine the VBS for each case. Statistical analyses included comparing mean VBS values between groups and assessing sensitivity, specificity, and positive predictive value (PPV). Keratoconus patients exhibited significantly higher VBS scores compared to healthy controls, particularly within the central 4.0 mm zone (11.4 versus 6.3). Using a VBS threshold of 11.3 in the central zone identified 40% of keratoconus cases (40% sensitivity), but 100% of cases surpassing the threshold were keratoconus (100% PPV). Lowering the threshold to 10.4 increased case detection to 90% while maintaining a high PPV (84.2%). These findings suggest that VBS, particularly when focused on the central 4.0 mm zone, can be a valuable tool for early keratoconus screening and identifying potential corneal abnormalities requiring further clinical evaluation. No healthy control corneas in this study exceeded a VBS threshold of 11.4 at 4mm, indicating that values above this warrant further investigation.
Keywords:
corneal topography
; interocular symmetry
; keratoconus
; corneal elevation
; anterior cornea
; posterior cornea
1. Introduction
Corneal topography and elevation maps are fundamental tools in ophthalmology, providing crucial insights into corneal shape and curvature. While unilateral corneal assessments offer valuable information, recognizing and characterizing asymmetry between fellow eyes is gaining increasing clinical significance [1,2,3,4,5]. Current symmetry analyses often rely on limited parameters, such as local curvature or single-point thickness measurements, potentially overlooking subtle but clinically relevant deviations.
To address this limitation, there is a critical need for innovative approaches that comprehensively assess corneal symmetry across the entire surface. This necessitates the development of novel algorithms for generating symmetry colormaps, systematically classifying their patterns, and establishing robust metrics and reference ranges for identifying abnormal corneas.
In our previous work [6], we explored the feasibility of utilizing the fellow eye as a reference surface to analyze elevation symmetry across the entire cornea. Employing a large dataset (n = 4613 participants) of Pentacam images, we developed a method for subtracting elevation matrices, generating color-coded symmetry maps, and extracting key features for machine learning analysis. This analysis revealed distinct symmetry patterns, including the "flat" pattern indicative of high symmetry in normal corneas, the "tilt" pattern potentially associated with imaging or visual axis discrepancies, the "cone" pattern consistent with keratoconus, and the "4-leaf" pattern potentially related to aniso-astigmatism or direct symmetry in the presence of astigmatism. These patterns are further illustrated in Figure 1.
To translate these findings into clinical practice, we have developed a dedicated software tool (the Bilateral Corneal Symmetry 3-D Analyzer - BiCSA) that automates the analysis of corneal symmetry. BiCSA incorporates advanced image registration techniques, developed using machine learning, to correct for potential head tilt or rotation during image acquisition. This software compares thousands of anterior and posterior corneal elevation measurement points between fellow eyes, providing quantitative metrics of symmetry and identifying unique patterns of asymmetry. By leveraging this innovative tool with its integrated image registration capabilities, we aim to enhance the detection of subtle corneal abnormalities that might otherwise remain undetected by conventional unilateral assessments. In our current studies, the aim is to assess the performance of BiCSA and a novel corneal symmetry index (the Volume Between Spheres – VBS, which represents the volume enclosed between two spheres, where one cornea is centered on its fellow cornea) in distinguishing normal corneas from cases with subtle corneal abnormalities. Here we present preliminary validation results for clinical disease states utilizing this novel software [7].
2. Materials and Methods
In this retrospective study, we used a subset of Pentacam imaging data from 60 eyes of 30 patients with healthy corneas and 30 patients diagnosed with corneal degenerative disease. Inclusion criteria for the healthy group included normal visual acuity, no history of ocular surgery, and no evidence of corneal disease based on clinical examination and Pentacam imaging. Inclusion criteria for the corneal disease group included a clinical diagnosis of corneal disease by a corneal specialist and no history of ocular surgery.
Imaging had been performed on all participants using the Pentacam HR (Oculus Optikgeräte GmbH, Wetzlar, Germany). Each Pentacam scan generates a 140x140 matrix of elevation data points, representing approximately 20,000 elevation measurements across the corneal surface. The BiCSA was utilized to analyze the Pentacam data and derive the VBS for each case.
Statistical analysis was performed using Microsoft Excel. Mean VBS values were calculated for each group, and independent samples t-test was used to compare mean VBS values between groups. We also determined the sensitivity, specificity, and positive predictive value (PPV) for different VBS thresholds.
The study was conducted according to the guidelines of the Declaration of Helsinki and approved by the Institutional Review Board of Morgan State University (IRB #20/10-0119, approved on 30 September 2020).
3. Results
3.1. Examples of BiCSA Output
3.1.1. Normal Cornea
Figure 2 demonstrates the impact of image registration in a case with normal corneas. In this example, initial alignment with zero image adjustment resulted in a "tilt" pattern, with a high VBS value (30 units) suggesting potential pathology. However, after applying automated image registration, the VBS was significantly reduced to approximately 6 units, and the symmetry map transitioned to a "flat" pattern, characteristic of highly symmetric bilateral normal corneas (Figure 1).
3.1.2. Aniso-Astigmatism
Figure 3 illustrates anterior elevation asymmetry maps in a case of aniso-astigmatism. Initial manual alignment with zero image registration revealed an irregular symmetry pattern with a high VBS value. After applying automated image registration, the interocular differences were significantly reduced, the VBS decreased from about 40 to approximately 14, and the symmetry map transitioned to a "4-leaf" pattern, consistent with aniso-astigmatism.
3.2. Keratoconus Detection
3.2.1. Group Comparisons
Analysis of corneal elevation asymmetry within the central 4.0 mm zone revealed a significant difference between patients with keratoconus and healthy controls (independent t-test p < 0.0001). Mean VBS score was 6.3 in the healthy control group, and patients with keratoconus demonstrated a significantly higher mean VBS score of 11.4 and a mean inter-group difference of 5.1 points (95% confidence interval of mean difference: 2.2 to 8.1). This represents a strong association between increased corneal asymmetry and the presence of keratoconus.
When assessing asymmetry within a larger 6.0 mm zone, the difference between groups was less pronounced (mean difference of 3.4 points, p = 0.11), suggesting that the most significant asymmetry in keratoconus manifests in the central corneal region.
3.2.2. Sensitivity and Specificity Analysis
For keratoconus screening, a VBS threshold of 11.3 in the central 4.0 mm zone yielded 100% PPV and identified 40% of cases. Lowering the threshold to 10.4 increased case detection to 90% while maintaining a high PPV (84.2%).
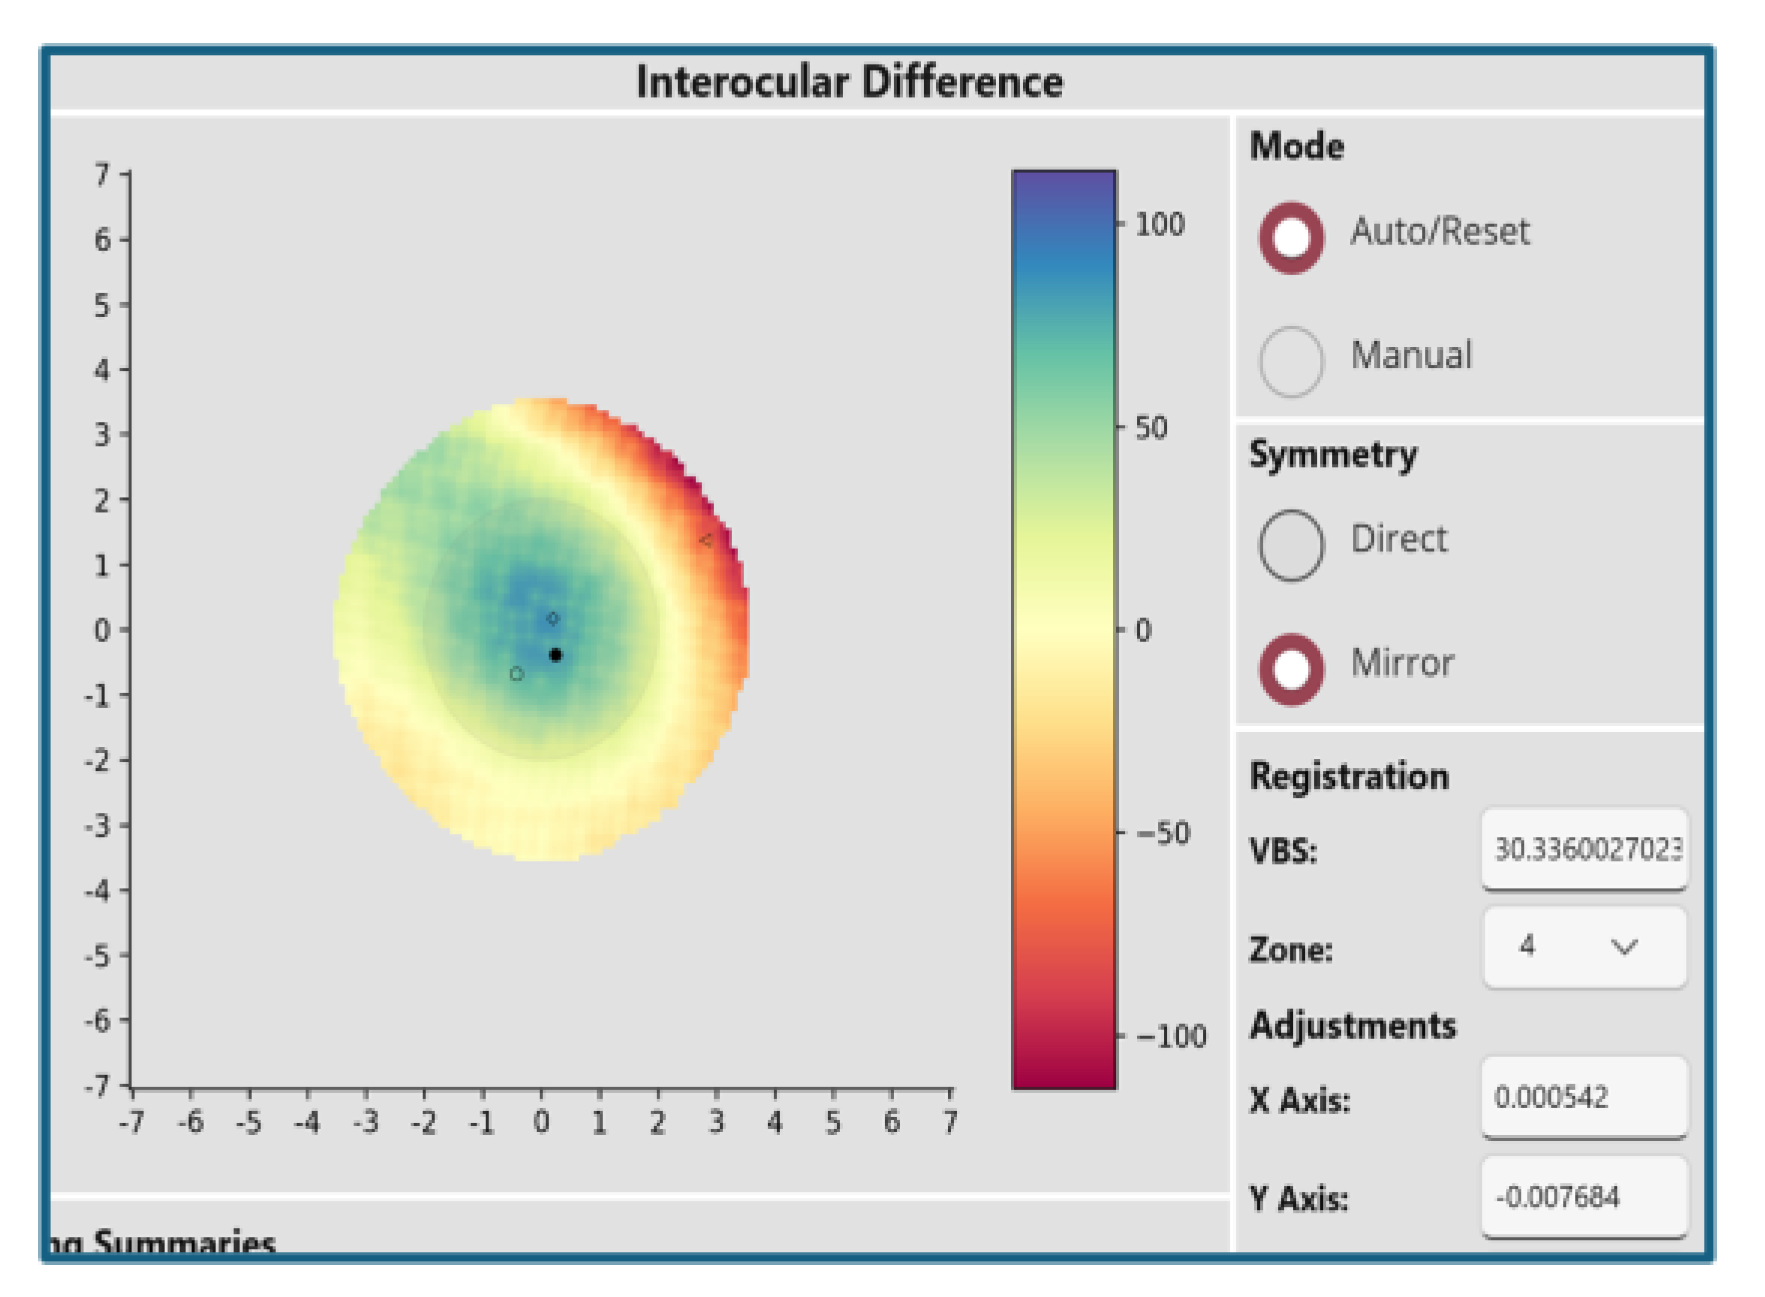
Figure 4 illustrates a case of keratoconus where the anterior elevation VBS score is 30.3, far exceeding the cutoffs of 10.4 or 11.3. The blue area appreciated in the center of the image reflects the asymmetry in how the central cornea of the left eye is bulging forward.
4. Discussion
Numerous studies have demonstrated the effectiveness of machine learning and deep learning models in detecting keratoconus using various corneal parameters [8,9,10,11,12,13]. More recent research has utilized a new corneal biomechanical parameter (the Corvis Biomechanical Index - CBI) which combines corneal thickness profiles with deformation parameters for improved keratoconus detection [14]. Additionally, some studies have employed deep learning to detect keratoconus using corneal dynamic videos [15]. While these approaches focus on specific corneal parameters or utilize advanced machine learning techniques, this study explores a novel approach: analyzing interocular corneal symmetry. This approach offers a more comprehensive assessment by considering the subtle differences between fellow eyes, enabling the detection of various corneal abnormalities beyond keratoconus through a single corneal imaging evaluation.
The Bilateral Corneal Symmetry 3-D Analyzer demonstrates significant potential for enhancing the clinical evaluation of corneal health. By quantifying interocular corneal symmetry into various metrics and generating comprehensive symmetry maps, BiCSA provides valuable insights beyond traditional unilateral assessments.
The identification of distinct symmetry patterns, such as the "flat" pattern in healthy corneas and the "cone" pattern associated with keratoconus, highlights the ability of BiCSA to characterize corneal morphology with greater precision. Furthermore, the incorporation of advanced image registration techniques significantly improves the accuracy and reliability of the analysis by correcting for potential head tilt or rotation during image acquisition.
The successful identification of keratoconus cases, with high sensitivity and specificity at optimized VBS thresholds, underscores the clinical utility of BiCSA for early disease detection. Importantly, BiCSA may also prove valuable in identifying subtle corneal abnormalities that might be missed in routine clinical examinations.
4.1. Clinical Applicaitons
4.1.1. Anterior Corneal Conditions
In practical use, we envision that this technique can flag abnormalities beyond keratoconus for eye care professionals to examine, as various conditions may affect the anterior cornea. Given that no control corneas in this sample exceeded the VBS threshold of 11.4 at 4mm, values higher than this can be marked for further review.
Traditional corneal examinations often miss subtle abnormalities, particularly those located in the corneal periphery, as they primarily focus on the central region. For example, conditions like anterior basement membrane dystrophy with Salzmann Nodular Degeneration (SND) can develop subtle peripheral nodules that remain undetected during routine exams. SND is characterized by the formation of gray-white to bluish nodules, which are more commonly located in the peripheral cornea [16]. While these nodules may not significantly impact central vision initially, they can gradually extend centrally, distort the corneal shape, and lead to decreased vision and irregular astigmatism. Symmetry analysis between fellow eyes, as performed by BiCSA, can be a valuable tool for identifying SND earlier and more easily. By comparing the topographical maps of both eyes, clinicians can detect asymmetries or abnormalities that might not be apparent when examining each eye individually. This enhanced detection capability allows for earlier diagnosis and intervention, potentially improving patient outcomes.
4.1.2. Posterior Corneal Conditions
Beyond anterior corneal conditions, BiCSA may also have significant implications for the management of posterior corneal diseases. Fuchs dystrophy, a progressive condition characterized by corneal endothelial cell dysfunction, is a leading cause of corneal transplantation. While current clinical assessments can identify Fuchs dystrophy, predicting disease progression and the need for future intervention remains challenging [17]. BiCSA analysis of posterior corneal elevation may provide valuable prognostic information. For example, in our preliminary analysis, patients with Fuchs dystrophy who exhibited higher VBS values for posterior corneal elevation were more likely to require subsequent corneal transplantation.
5. Conclusions
To our knowledge, BiCSA represents a unique and novel approach to corneal symmetry analysis, offering a comprehensive and automated platform for assessing corneal health, identifying subtle abnormalities that may go undetected in routine examinations, and decision making for timely ophthalmic interventions. Further research and clinical validation are crucial to fully explore the clinical potential of BiCSA in various corneal conditions.
6. Patents
The methods and systems described herein are the subject of a published patent application (US20240074654A1) [7].
Author Contributions
Conceptualization, SM, AE, GG, and AF; methodology, SM, AE, SY, and FK; software, SM, SY, and FK; validation, AE, GG, and AF; formal analysis, SM and AE; investigation, SM, AE, SY, FK, GG, and AF; resources, SM; data curation, SM and AE; writing—original draft preparation, SM, AE and SY; writing—review and editing, SM, AE, SY, FK, GG and AF; visualization, SM, AE, SY and FK; supervision, SM; project administration, SM; funding acquisition, SM and AE.
Funding
Research reported here was supported by the TEDCO Maryland Innovation Initiative under award number MII_0922-002_2. The first author is supported by the National Institute of General Medical Sciences of the National Institutes of Health (NIH) under Award Number RL5GM118972 and the National Institute on Minority Health and Health Disparities of the NIH under award number U54MD013376. The content is solely the responsibility of the authors and does not necessarily represent the official views of the funding organizations.
Institutional Review Board Statement
The study was conducted according to the guidelines of the Declaration of Helsinki and approved by the Institutional Review Board of Morgan State University (IRB #20/10-0119, approved on 30 September 2020).
Informed Consent Statement
Patient consent was waived due to the use of a secondary de-identified database. As no direct interaction with human subjects occurred, the requirement for patient consent was waived by the Institutional Review Board.
Data Availability Statement
The data that support the findings of this study are available from the corresponding author upon reasonable request. Researchers interested in utilizing the BiCSA software for their own research are encouraged to contact the corresponding author to discuss potential collaborations.
Acknowledgments
The authors wish to thank the principal investigators of the Shahroud Eye Cohort Study Drs. M.H. Emamian, A. Fotouhi, and H. Hashemi for generously sharing the deidentified data files.
Conflicts of Interest
The first author holds the license for the BiCSA software and is an inventor on the patent application (US20240074654A1) related to the technology described in this manuscript. The funders had no role in the design of the study; in the collection, analyses, or interpretation of data; in the writing of the manuscript; or in the decision to publish the results.
Abbreviations
The following abbreviations are used in this manuscript:
| BiSCA | The Bilateral Corneal Symmetry 3-D Analyzer |
| VBS | Volume Between Spheres |
| PPV | Positive Predictive Value |
References
- Naderan, M.; Rajabi, M.T.; Zarrinbakhsh, P. Intereye Asymmetry in Bilateral Keratoconus, Keratoconus Suspect and Normal Eyes and Its Relationship with Disease Severity. Br. J. Ophthalmol. 2017, 101, 1475–1482. [Google Scholar] [CrossRef] [PubMed]
- Kovács, I.; Miháltz, K.; Kránitz, K.; Juhász, É.; Takács, Á.; Dienes, L.; Gergely, R.; Nagy, Z.Z. Accuracy of Machine Learning Classifiers Using Bilateral Data from a Scheimpflug Camera for Identifying Eyes with Preclinical Signs of Keratoconus. J. Cataract Refract. Surg. 2016, 42, 275–283. [Google Scholar] [CrossRef] [PubMed]
- Dienes, L.; Kránitz, K.; Juhász, É.; Gyenes, A.; Takács, Á.; Miháltz, K.; Nagy, Z.Z.; Kovács, I. Evaluation of Intereye Corneal Asymmetry in Patients with Keratoconus. A Scheimpflug Imaging Study. PLOS ONE 2014, 9, e108882. [Google Scholar] [CrossRef] [PubMed]
- Henriquez, M.A.; Izquierdo, L.J.; Mannis, M.J. Intereye Asymmetry Detected by Scheimpflug Imaging in Subjects With Normal Corneas and Keratoconus. Cornea 2013, 32, 779–782. [Google Scholar] [CrossRef] [PubMed]
- Mehravaran, S. Pancorneal Symmetry Analysis of Fellow Eyes: A Machine Learning Proof of Concept Study. PhD Thesis, Morgan State University, 2021.
- Mehravaran, S.; Dehzangi, I.; Rahman, M. Interocular Symmetry Analysis of Corneal Elevation Using the Fellow Eye as the Reference Surface and Machine Learning. Healthcare 2021, 9, 1738 2021. [Google Scholar] [CrossRef]
- Mehravaran, S. Method and Device for Fellow-Eye Corneal Topography 2024. US Patent number US20240074654A1, March 2024.
- Zéboulon, P.; Debellemanière, G.; Bouvet, M.; Gatinel, D. Corneal Topography Raw Data Classification Using a Convolutional Neural Network. Am. J. Ophthalmol. 2020, 219, 33–39. [Google Scholar] [CrossRef] [PubMed]
- Al-Timemy, A.H.; Ghaeb, N.H.; Musa, Z.M.; Escudero, J. Deep Transfer Learning for Improved Detection of Keratoconus Using Corneal Topographic Maps. Cogn. Comput. 2021. [Google Scholar] [CrossRef]
- Kamiya, K.; Ayatsuka, Y.; Kato, Y.; Fujimura, F.; Takahashi, M.; Shoji, N.; Mori, Y.; Miyata, K. Keratoconus Detection Using Deep Learning of Colour-Coded Maps with Anterior Segment Optical Coherence Tomography: A Diagnostic Accuracy Study. BMJ Open 2019, 9, e031313. [Google Scholar] [CrossRef] [PubMed]
- Kuo, B.-I.; Chang, W.-Y.; Liao, T.-S.; Liu, F.-Y.; Liu, H.-Y.; Chu, H.-S.; Chen, W.-L.; Hu, F.-R.; Yen, J.-Y.; Wang, I.-J. Keratoconus Screening Based on Deep Learning Approach of Corneal Topography. Transl. Vis. Sci. Technol. 2020, 9, 53. [Google Scholar] [CrossRef] [PubMed]
- Yousefi, S.; Yousefi, E.; Takahashi, H.; Hayashi, T.; Tampo, H.; Inoda, S.; Arai, Y.; Asbell, P. Keratoconus Severity Identification Using Unsupervised Machine Learning. PloS One 2018, 13, e0205998. [Google Scholar] [CrossRef] [PubMed]
- Lavric, A.; Valentin, P. KeratoDetect: Keratoconus Detection Algorithm Using Convolutional Neural Networks. Comput. Intell. Neurosci. 2019, 2019, 8162567. [Google Scholar] [CrossRef] [PubMed]
- Vinciguerra, R.; Ambrósio, R.; Elsheikh, A.; Roberts, C.J.; Lopes, B.; Morenghi, E.; Azzolini, C.; Vinciguerra, P. Detection of Keratoconus With a New Biomechanical Index. J. Refract. Surg. Thorofare NJ 1995 2016, 32, 803–810. [Google Scholar] [CrossRef] [PubMed]
- Abdelmotaal, H.; Hazarbassanov, R.M.; Salouti, R.; Nowroozzadeh, M.H.; Taneri, S.; Al-Timemy, A.H.; Lavric, A.; Yousefi, S. Keratoconus Detection-Based on Dynamic Corneal Deformation Videos Using Deep Learning. Ophthalmol. Sci. 2024, 4, 100380. [Google Scholar] [CrossRef] [PubMed]
- Paranjpe, V.; Galor, A.; Monsalve, P.; Dubovy, S.R.; Karp, C.L. Salzmann Nodular Degeneration: Prevalence, Impact, and Management Strategies. Clin. Ophthalmol. 2019, 13, 1305–1314. [Google Scholar] [CrossRef] [PubMed]
- Eghrari, A.O.; Gottsch, J.D. Fuchs’ Corneal Dystrophy. Expert Rev. Ophthalmol. 2010, 5, 147–159. [Google Scholar] [CrossRef] [PubMed]
Figure 1.
Representative examples of corneal symmetry maps. The "flat" pattern is characteristic of high symmetry observed in healthy corneas, "tilt" is potentially indicative of imaging or visual axis discrepancies, the "cone" pattern is consistent with the presence of keratoconus, and the "4-leaf" pattern is potentially associated with aniso-astigmatism or direct symmetry in the presence of astigmatism.
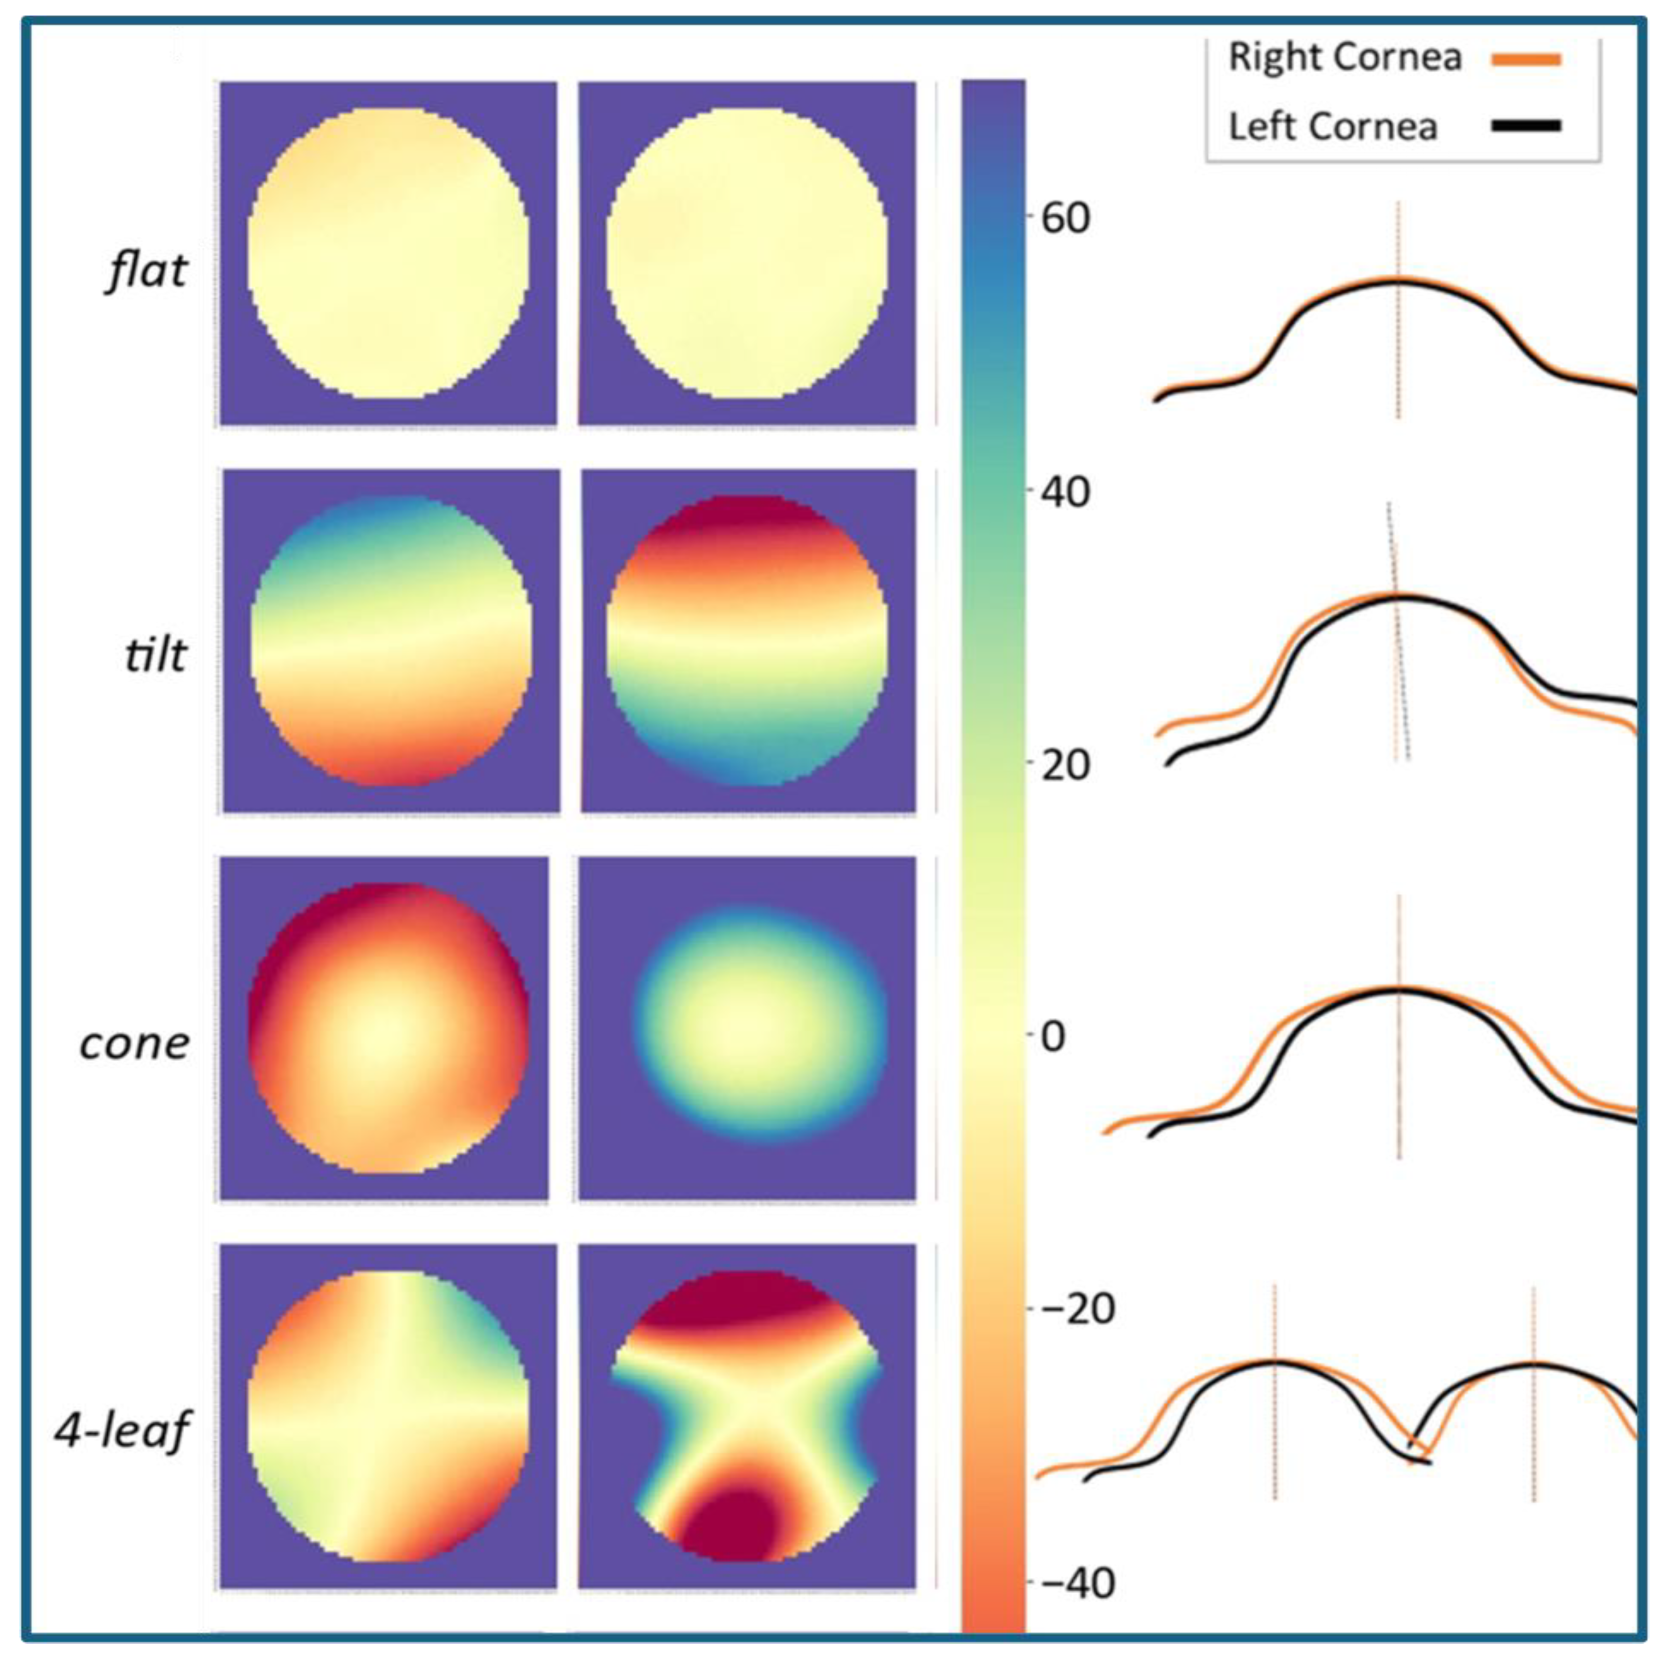
Figure 2.
Anterior elevation symmetry maps before and after auto-registration in a normal case. In this example, the right-hand panel of the screenshot on the left indicates that alignment is on the manual mode, mirror symmetry, and zero adjustments to registration parameters. According to the ring and zone summary data, the colors of the difference map, and the Volume Between Spheres (VBS), interocular difference is relatively high, and corneal pathology or abnormality can be suspected. However, VBS is significantly reduced from 30 to about 6 after applying auto-alignment and registration (far right), and the map pattern becomes “flat” which is indicative of normal corneas bilaterally.
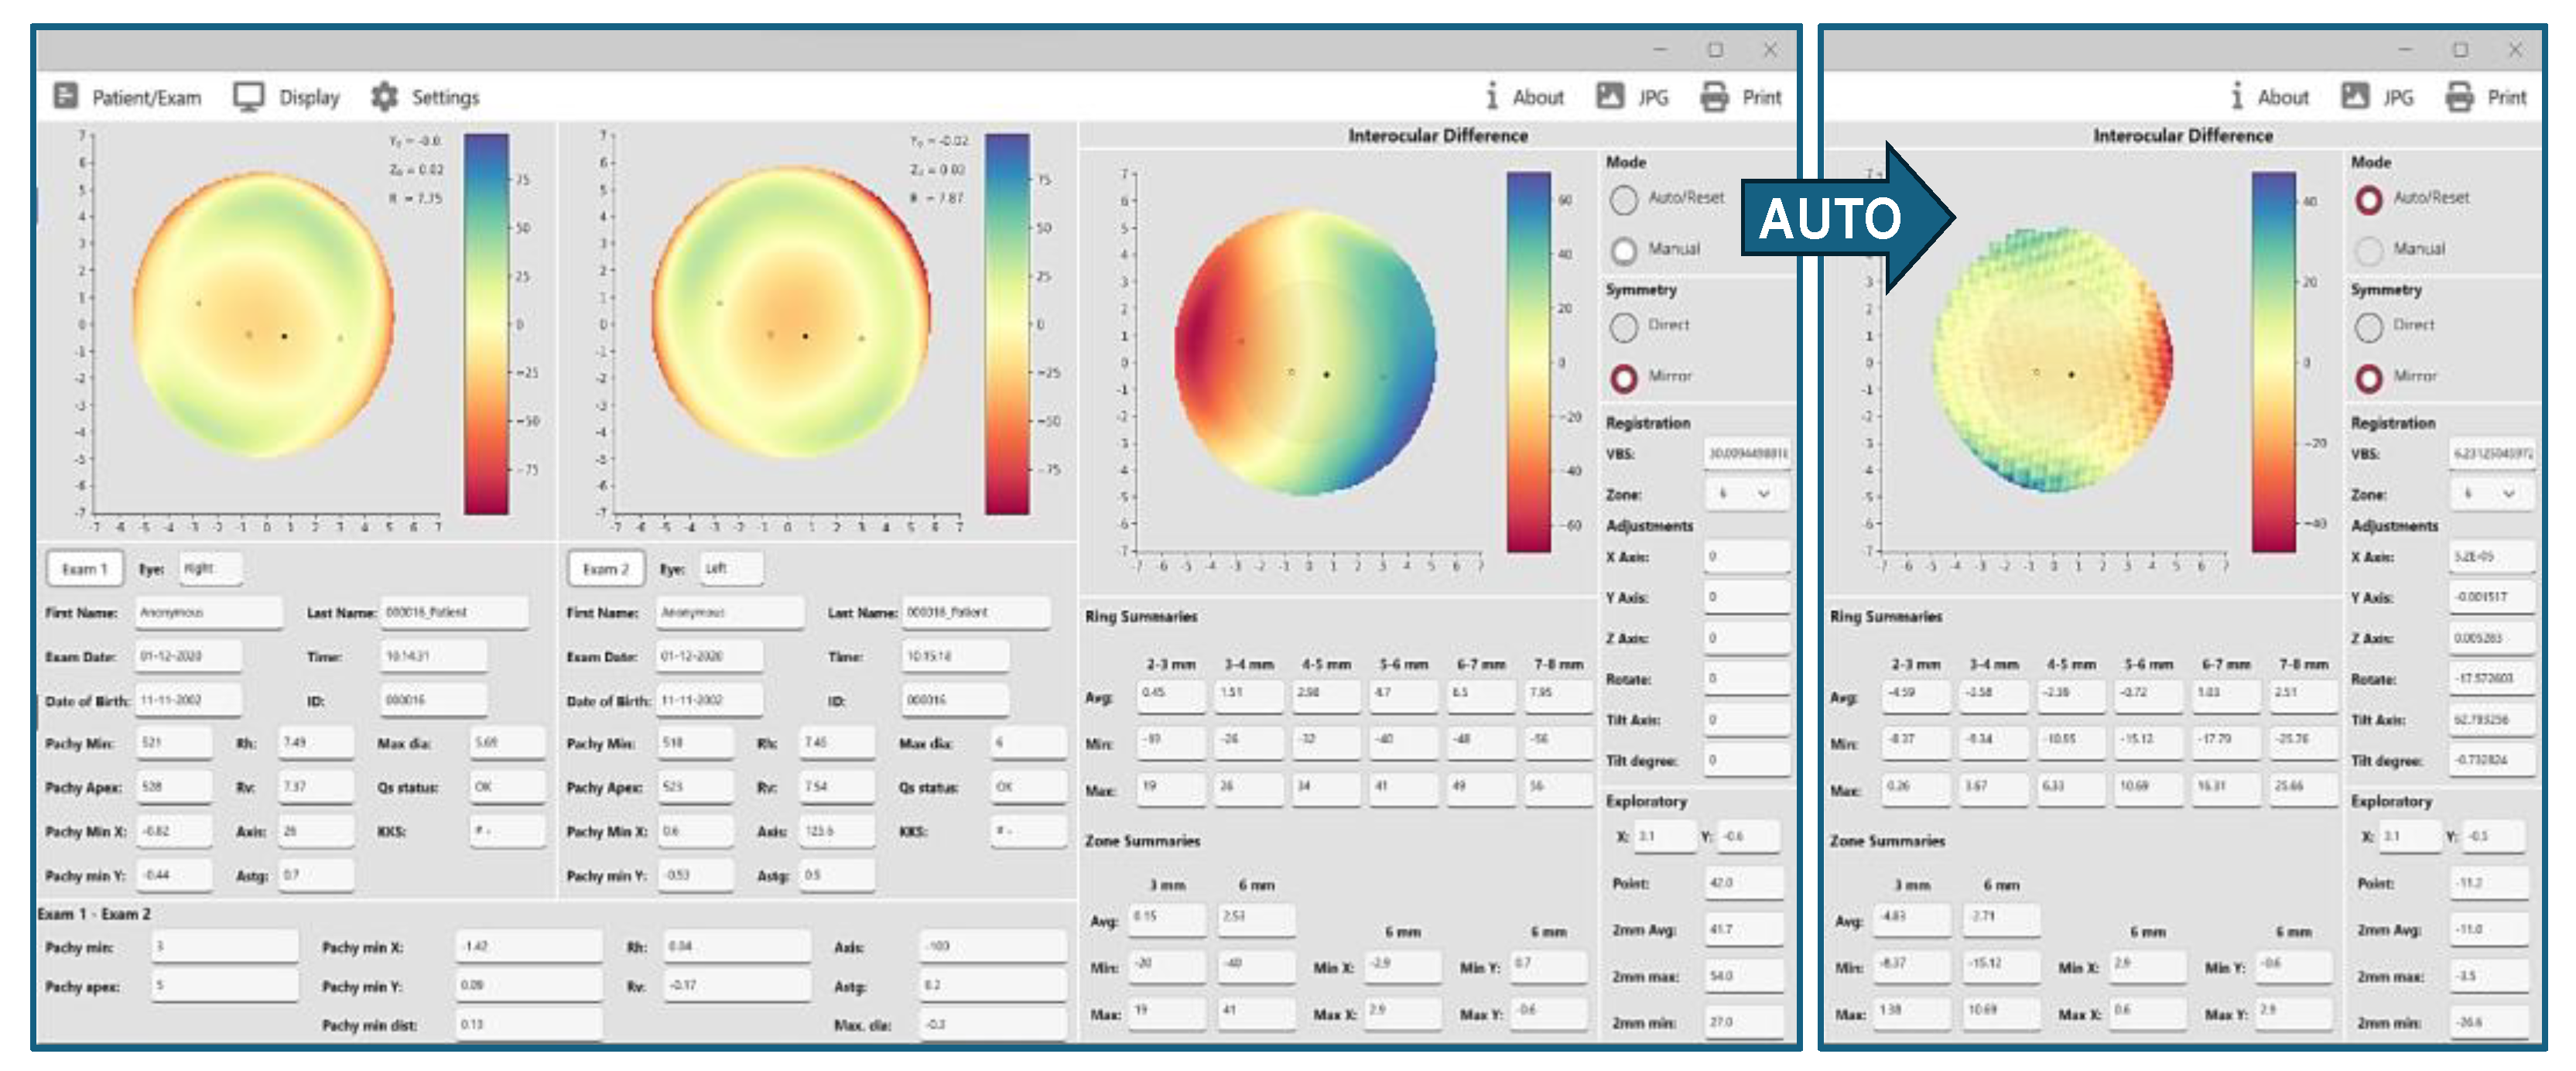
Figure 3.
Anterior elevation symmetry maps before and after auto-registration in a case of aniso-astigmatism. In this example, alignment is first on the manual mode, mirror symmetry, and zero adjustments to registration parameters. According to summary data, the colors and map, and the Volume Between Spheres (VBS), the interocular difference is relatively high, and the presence of a corneal pathology or abnormality can be suspected. However, after applying auto-alignment and registration (far right), interocular differences are significantly smaller, VBS is reduced by 26 points (from 40 to 14), and the map pattern becomes “four-leaf” which is consistent with aniso-astigmatism. The bottom left panel of the left screenshot (Exam 1 – Exam 2) also shows an interocular difference of 1.3 diopters of astigmatism.
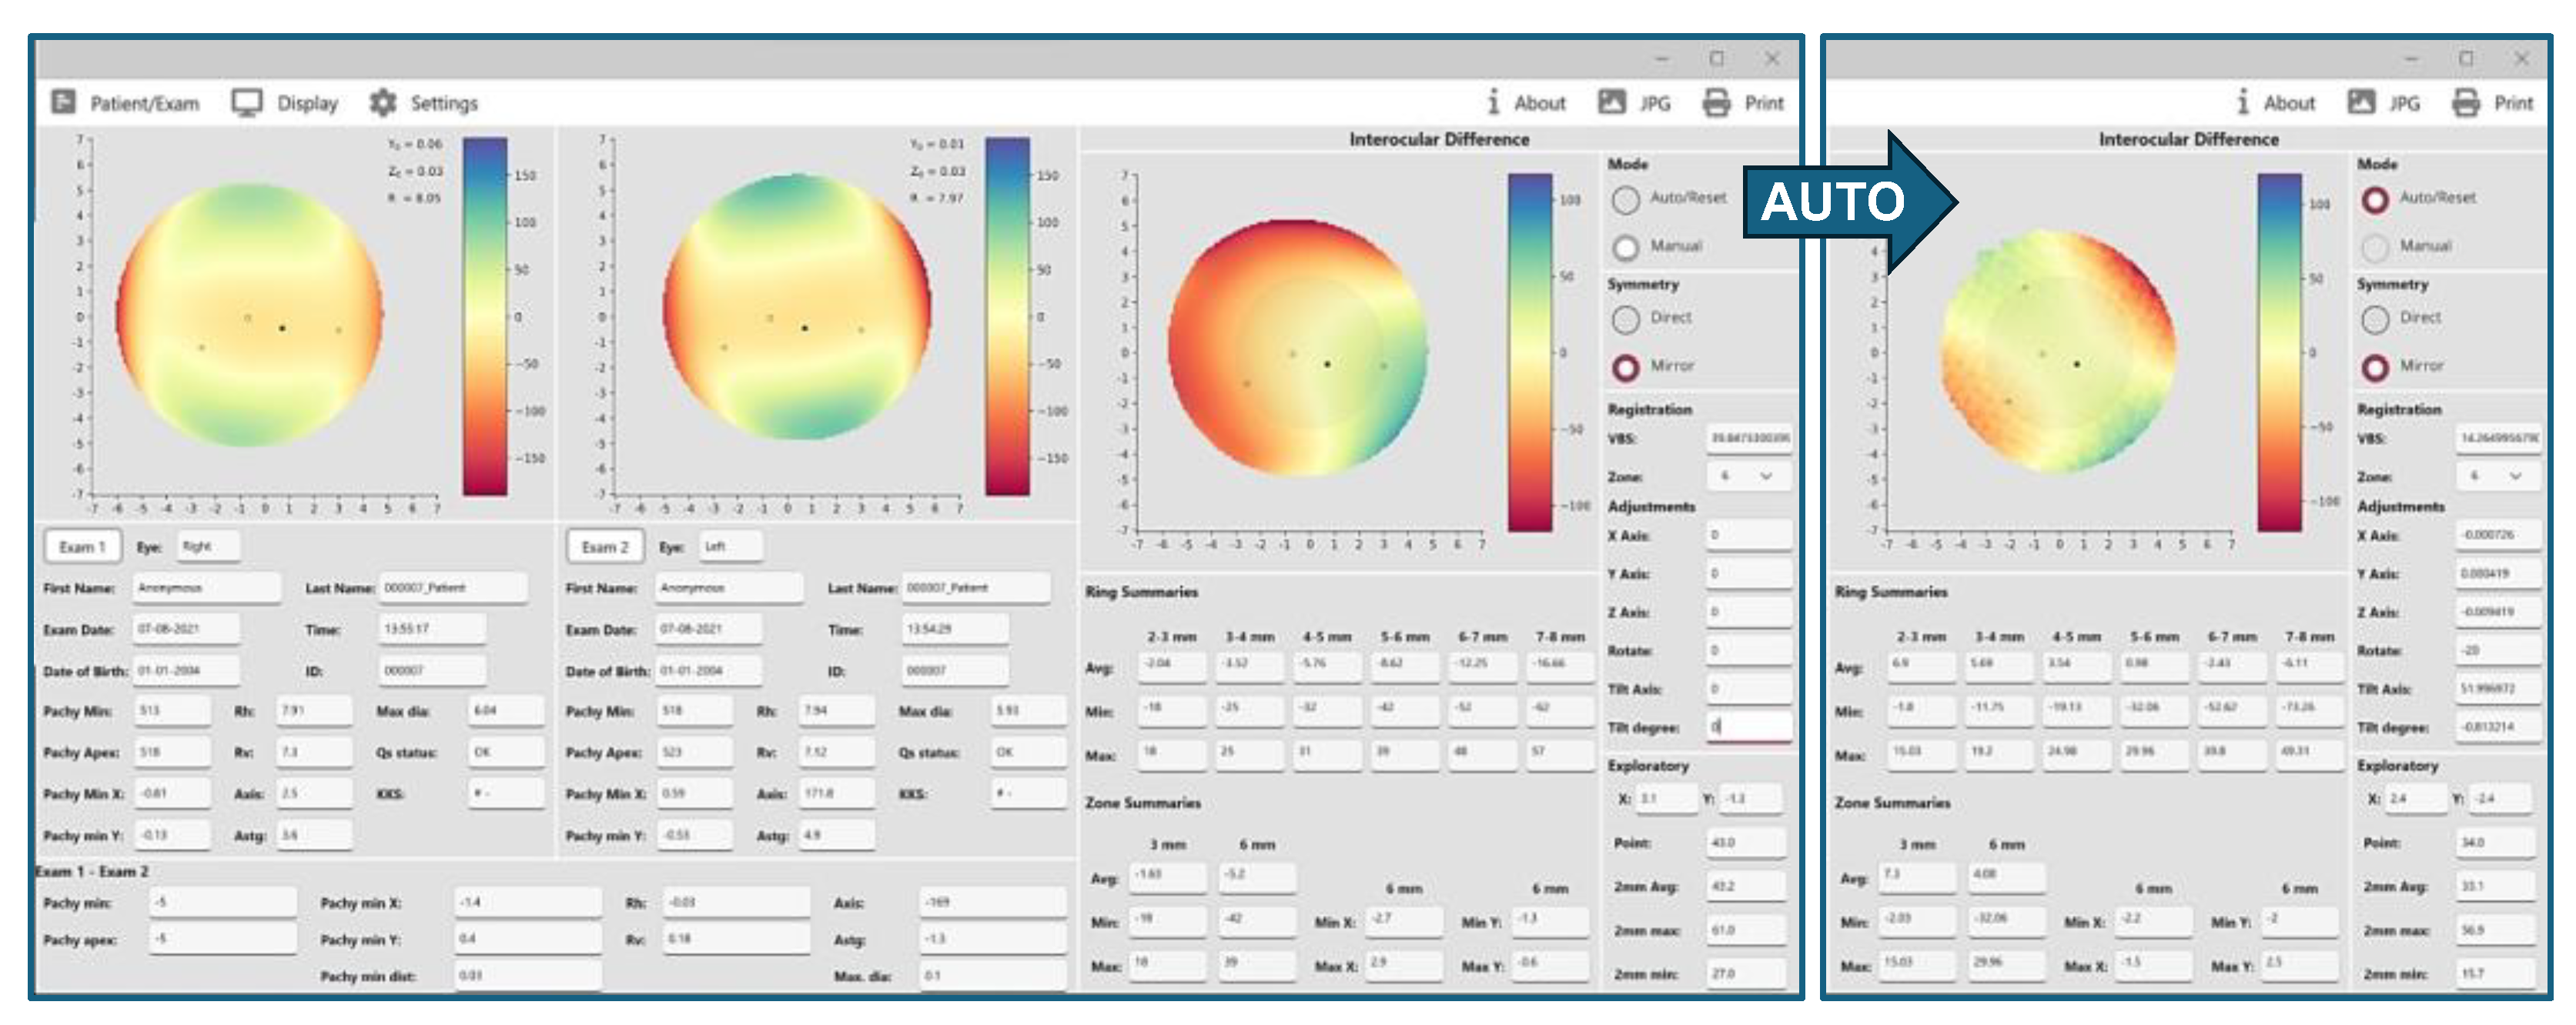
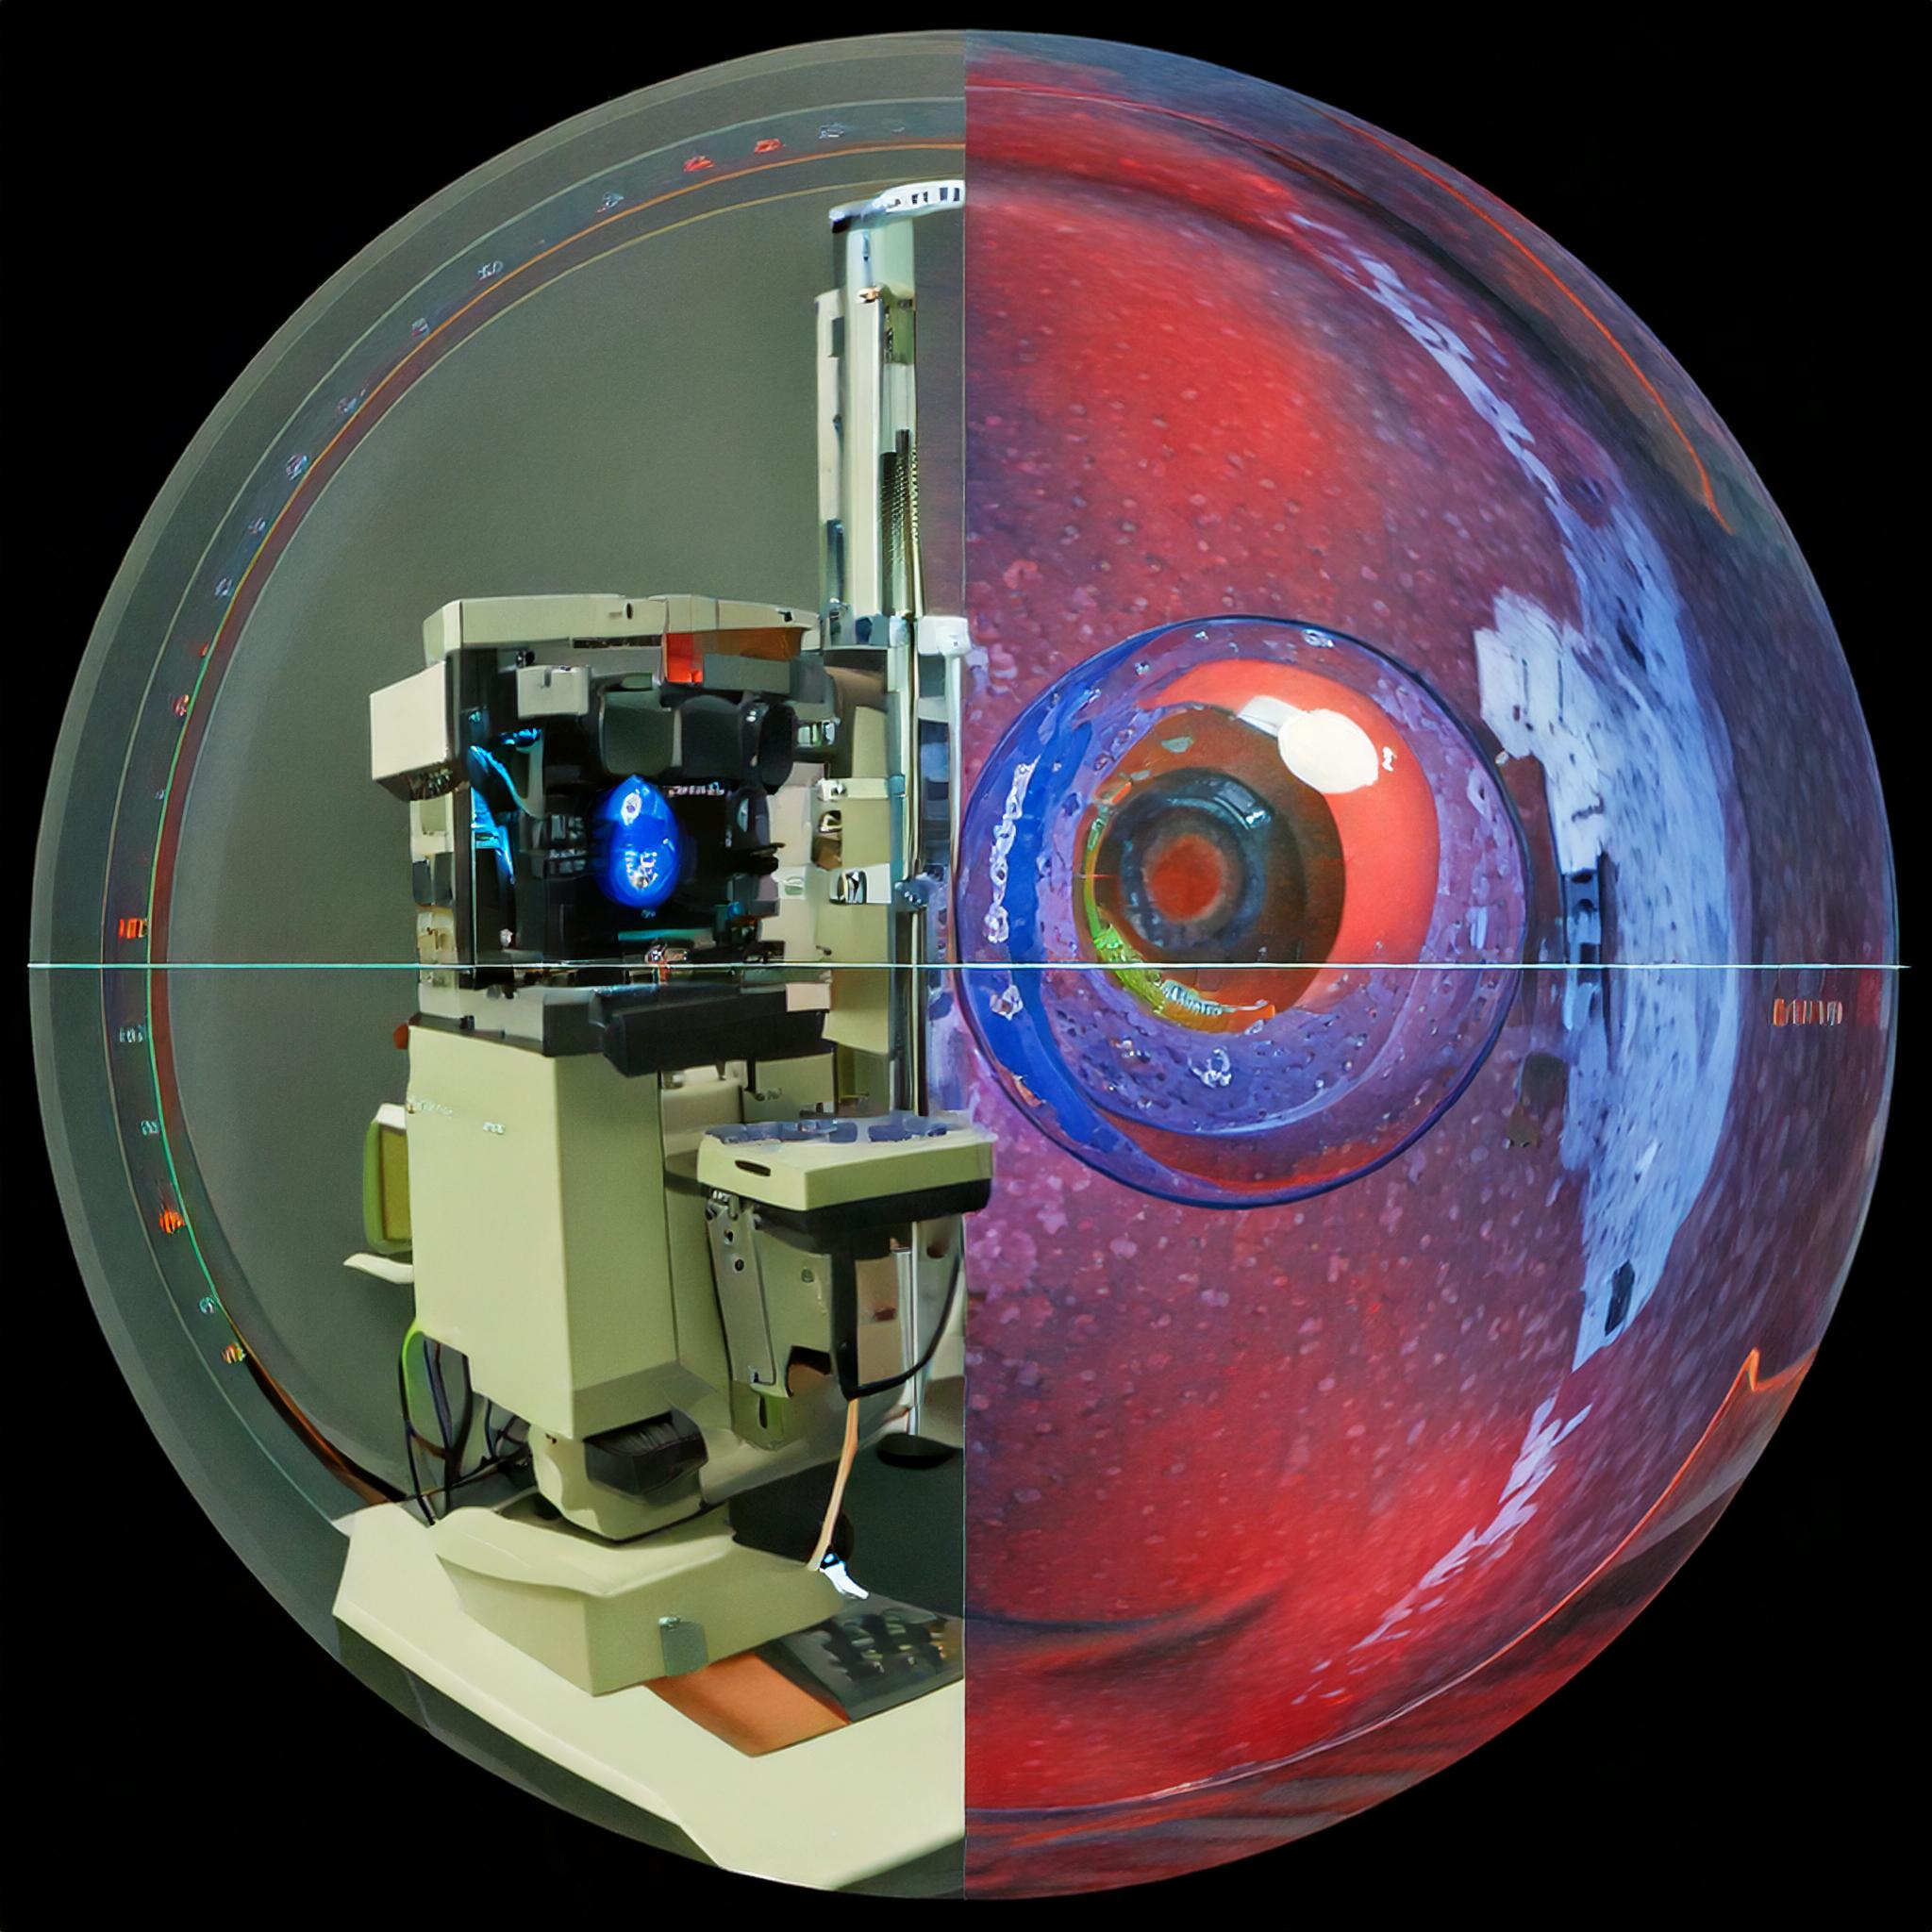
Figure 4.
Anterior elevation symmetry map in a case of keratoconus. In this example, the Volume Between Spheres score of 30.3 significantly exceeds the established cutoffs of 10.4 and 11.3. The central blue area in this map represents the region of greatest asymmetry between fellow eyes, consistent with the characteristic bulging observed in keratoconus.
Disclaimer/Publisher’s Note: The statements, opinions and data contained in all publications are solely those of the individual author(s) and contributor(s) and not of MDPI and/or the editor(s). MDPI and/or the editor(s) disclaim responsibility for any injury to people or property resulting from any ideas, methods, instructions or products referred to in the content. |
© 2025 by the authors. Licensee MDPI, Basel, Switzerland. This article is an open access article distributed under the terms and conditions of the Creative Commons Attribution (CC BY) license (http://creativecommons.org/licenses/by/4.0/).
Copyright: This open access article is published under a Creative Commons CC BY 4.0 license, which permit the free download, distribution, and reuse, provided that the author and preprint are cited in any reuse.


