Preprint
Article

This version is not peer-reviewed.

Affinity and Subtypes Analysis of the Anti-Nucleocapsid Antibodies in SARS-CoV-2 Vaccinated and Non-Vaccinated Individuals

Submitted:

04 February 2025

Posted:

06 February 2025

You are already at the latest version

Abstract

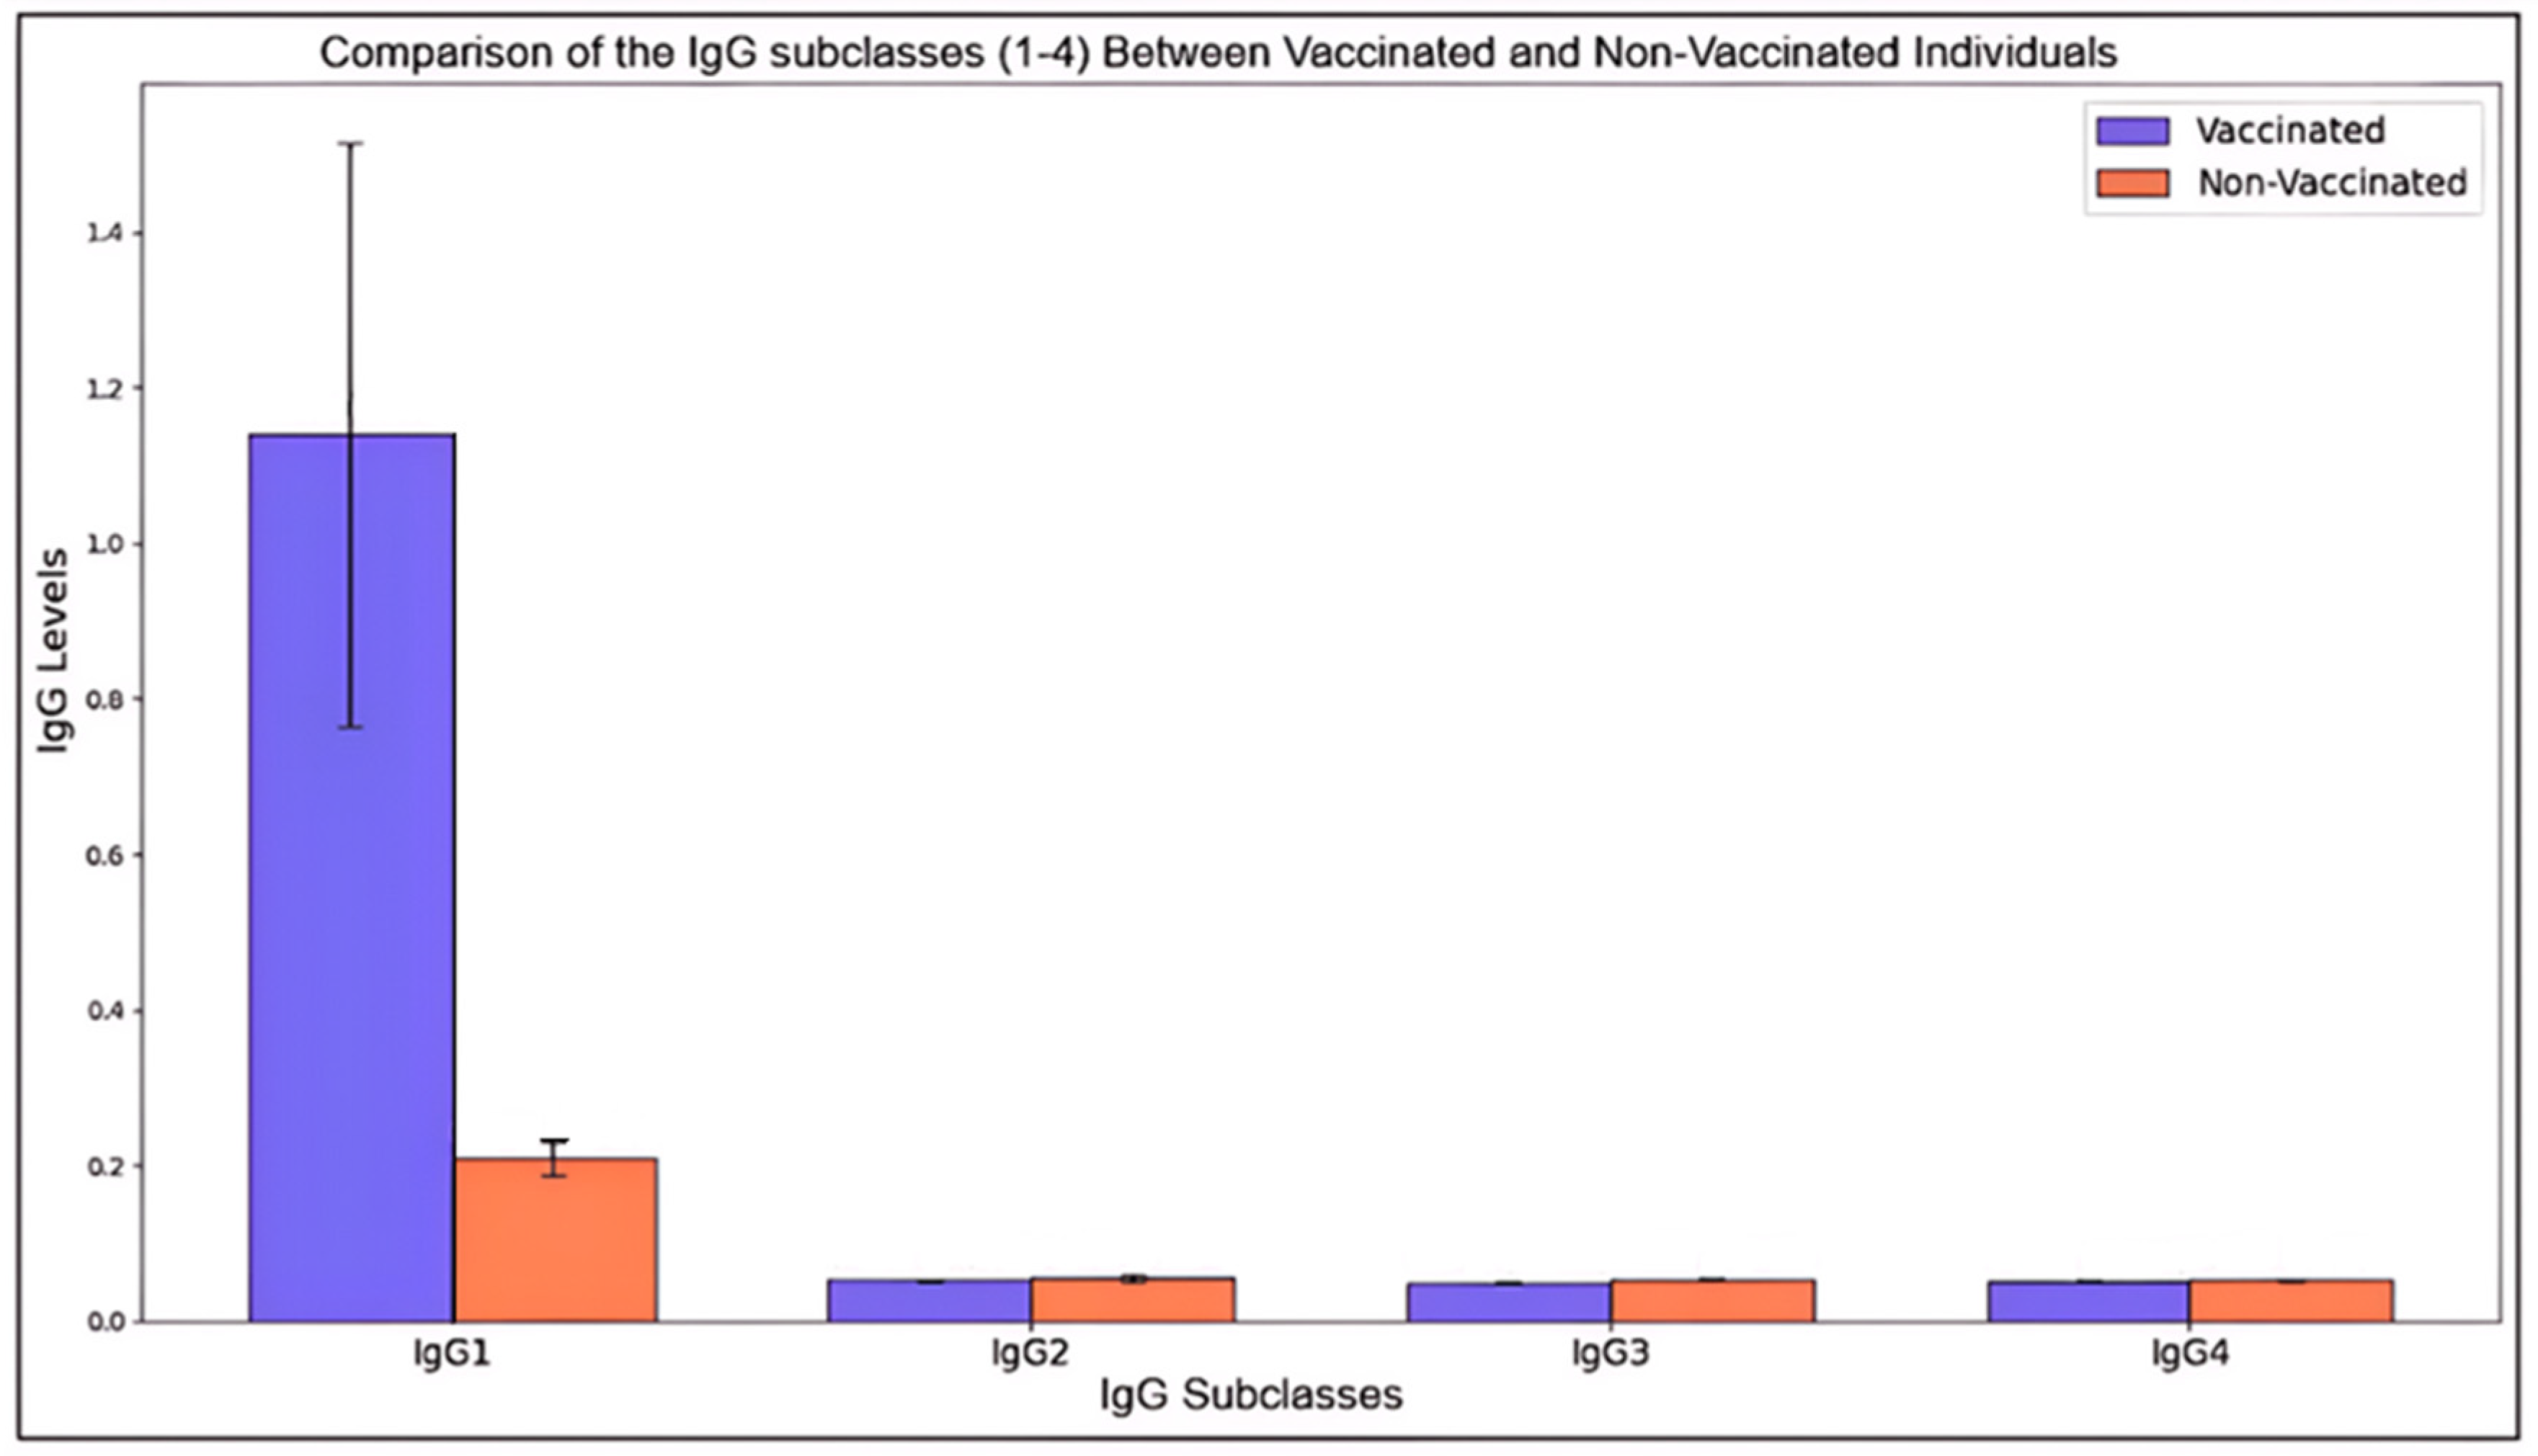
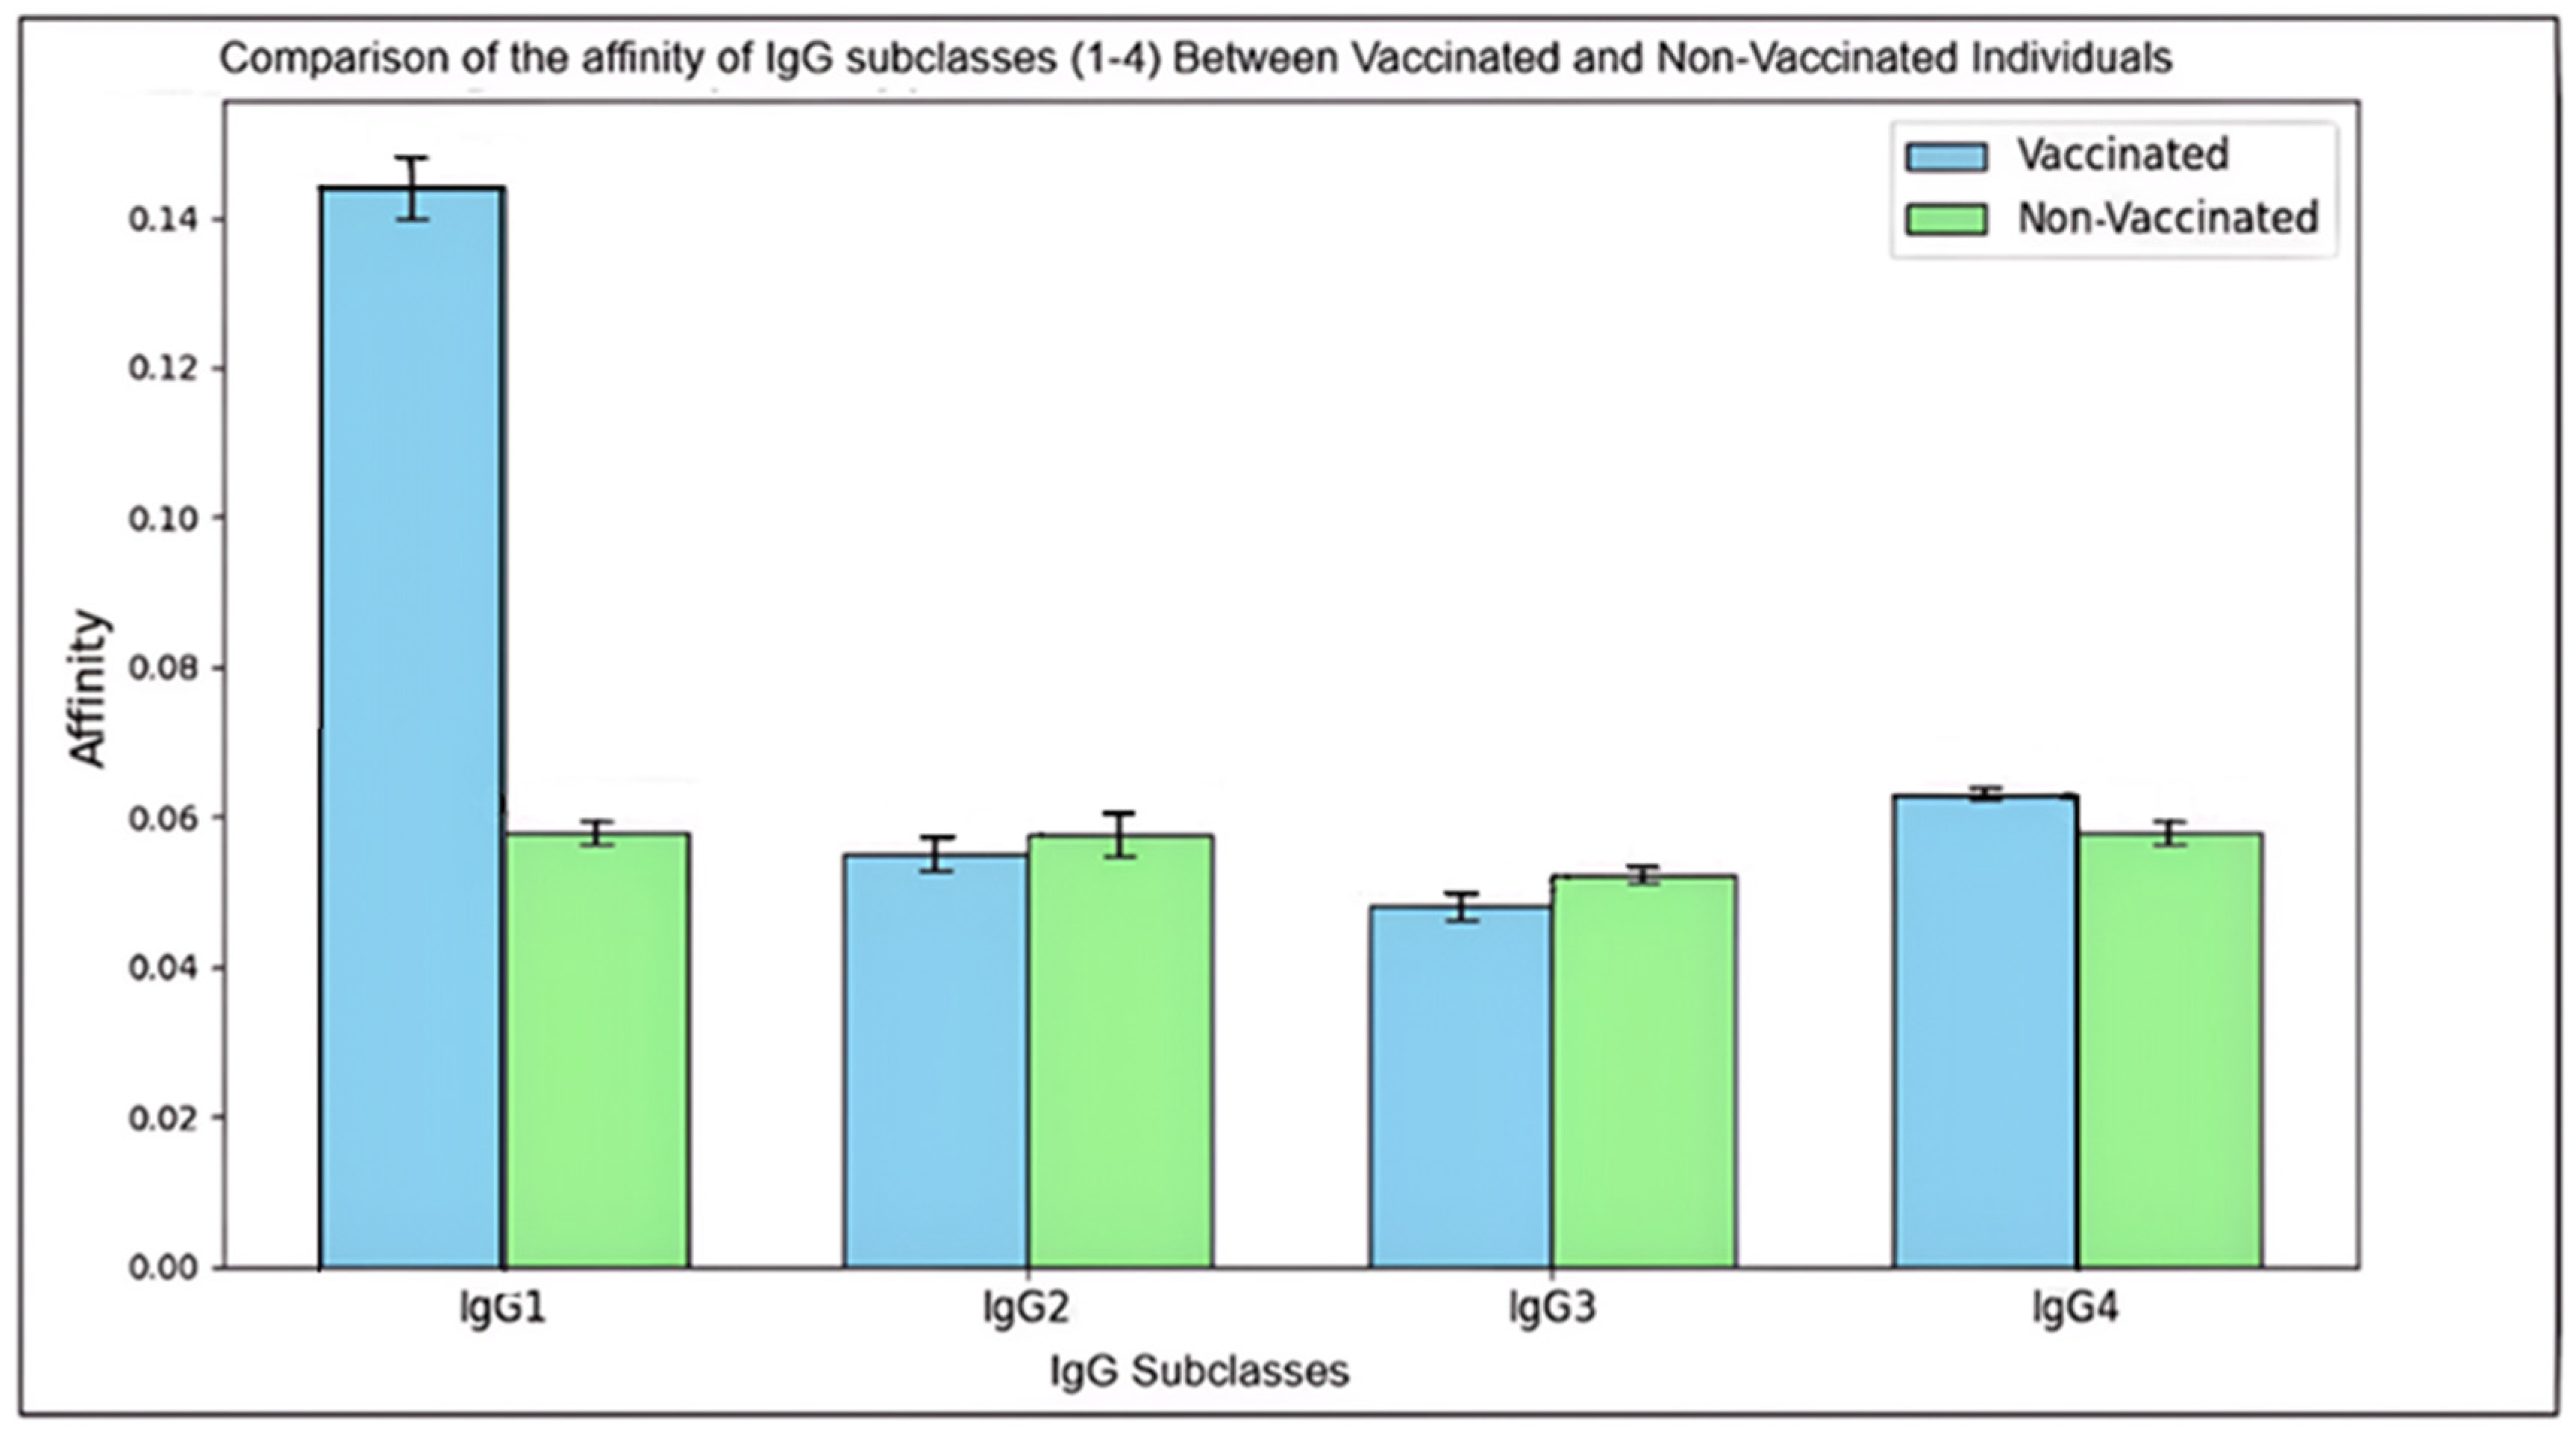
The COVID-19 pandemic has underscored the critical need to understand immune responses arising from both natural infection and vaccination. This study examines the affinity and subclass distribution of anti-nucleocapsid (anti-N) antibodies in 60 participants, comprising 30 vaccinated and 30 non-vaccinated individuals. Using enzyme-linked immunosorbent assays (ELISA), we quantified total IgG (tIgG) and its subclasses (IgG1, IgG2, IgG3, and IgG4) in serum samples. Antibody affinity was assessed using ammonium thiocyanate to evaluate the strength of antigen-antibody interactions. We observed significantly elevated levels of tIgG and its subclasses in the vaccinated participants compared to the non-vaccinated controls, indicating a more robust immune response post-vaccination. In vaccinated individuals, the mean levels of tIgG, IgG1, IgG2, IgG3, and IgG4 were 2.59, 1.02, 0.055, 0.061, and 0.095 (OD), respectively, while non-vaccinated individuals showed lower mean levels at 0.512, 0.11, 0.052, 0.051, and 0.048 (OD) for tIgG, IgG1, IgG2, IgG3, and IgG4, respectively. This notable difference suggests that vaccination promotes not only higher production of these antibody subclasses but also, as shown by the corresponding affinity tests, an increased binding strength of anti-N antibodies. These results indicate that vaccination induces a more robust and higher-quality immune response, contributing to improved immune protection against SARS-CoV-2. The study highlights the critical role of anti-N antibodies in vaccine efficacy and long-term immunity. Our findings offer valuable insights into immune dynamics, informing future vaccine development and strategies for pandemic control, potentially leading to better management of emerging variants and more effective public health interventions.

Keywords: 
;  ;  ;  ;  

1. Introduction

The SARS-CoV-2 pandemic has significantly impacted global health, originating in December 2019, with conditions resembling pneumonia [1]. SARS-CoV-2 spread faster than SARS-CoV-1 and MERS-CoV, reaching six continents within three months of emergence [2,3]. Its genome encodes four structural proteins—spike (S), envelope (E), membrane (M), and nucleocapsid (N)—with the N protein being highly immunogenic and essential for the viral replication and assembly [4,5]. The N protein contains RNA-binding N-terminal and C-terminal domains (NTD and CTD, respectively) by an serine-arginine (SR)-rich domain, contributing to its structural and functional versatility [6,7]. Anti-N antibodies are crucial for early serological detection during SARS-CoV-2 infection, with high sensitivity and persistence compared to antibodies against other structural proteins of this virus [8,9,10]. RNA testing of upper respiratory samples detects viral RNA before symptom onset, peaking in the first symptomatic week [11,12]. Elevated RNA levels in the blood correlate with severe disease outcomes [13]. IgG antibodies emerge 7–14 days post-symptom onset, persisting for 4–6 months, while IgA and IgM decline rapidly [14,15,16]. Neutralizing antibodies suggest some immunity against reinfection, though protective thresholds remain undefined [17,18,19]. A single mRNA vaccine dose elicits a robust neutralizing response in previously infected individuals, comparable to two doses in infection-naïve individuals [20,21,22].
Humoral responses influence COVID-19 prognosis, with IgG1 and IgG3 dominating SARS-CoV-2 responses. IgG4 production increases after repeated mRNA vaccinations, potentially modulating immune overactivation. However, emerging evidence suggests that this increase in IgG4 levels may not be a protective mechanism; rather, it constitutes an immune tolerance mechanism to the spike protein that could promote unopposed SARS-CoV-2 infection and replication by suppressing natural antiviral responses. [23,24]. IgG4 responses can either be beneficial or harmful depending on the situation [24,25].
Additionally, SARS-CoV-2 may induce IgG4 synthesis to promote immune tolerance and evade immune surveillance [26]. The N protein disrupts host immune responses, contributing to the inflammation and severe outcomes [27,28,29]. While natural antibodies provide temporary protection, their persistence and efficacy against variants remain uncertain [4,30]. This study investigates anti-N antibody presence, affinity, and distribution among vaccinated and unvaccinated individuals, aiming to guide future vaccine strategies and public health efforts.
Coronaviruses are zoonotic pathogens, with bats often identified as their primary reservoir [31]. Transmission to humans occurs via intermediate hosts, such as pangolins [32]. SARS-CoV-2 is more infectious than SARS-CoV-1 due to its enhanced binding to the ACE2 receptor, facilitated by a distinct surface protein [33,34]. Unlike SARS-CoV-1, which peaks in viral load during the second week of infection, SARS-CoV-2 reaches its highest viral concentration in the upper respiratory tract within the first symptomatic week [35]. Its spike glycoprotein features S1 and S2 subunits responsible for cell adhesion and membrane fusion [36]. Genetic studies suggest the absence of furin-like cleavage sites in pangolin coronaviruses enhances human transmissibility [37]. The N protein comprises 419 amino acids with three intrinsically disordered regions (IDRs) and two conserved structural regions (CSRs) [38,39]. SARS-CoV-2 shares strong genomic similarities with MERS-CoV and SARS-CoV-1, indicating evolutionary ties and shared functional characteristics [40,41]. The N protein is highly conserved among coronaviruses [42,43,44]. Structural analysis reveals a positively charged pocket in the NTD domain, facilitating viral RNA binding and assembly [45]. Within the SARS-CoV-2 framework, the N protein is indispensable for the viral life cycle, facilitating RNA release, replication, and virion assembly [46,47].
The N protein suppresses type I interferon production more effectively than SARS-CoV’s N protein, interfering with retinoic acid-inducible gene I (RIG-I) and mitochondrial antiviral-signaling protein (MAVS) pathways [48,49,50,51,52,53,54,55,56]. It prevents STAT1/2 phosphorylation and nuclear translocation, blocking type I interferon responses [49,57]. The N protein also sequesters virus-derived double-stranded RNAs, impairing RNA-induced silencing mechanisms [58,59,60]. These strategies enable SARS-CoV-2 to evade innate immunity. Higher concentrations of anti-N antibodies are associated with severe COVID-19 outcomes [61,62,63,64,65]. However, in cancer patients with persistent SARS-CoV-2 infection, lower antibody levels correlate with extended viral load duration [66]. SARS-CoV-2 N protein-specific antibodies bind to cell surfaces and activate Fc receptor-expressing cells, affecting disease severity [67]. While antibody levels decline during convalescence, memory B cells persist, peaking at 150 days post-infection [68]. Maintaining B-cell memory is critical for effective control of COVID-19 [66,69].
SARS-CoV-2 N protein-specific CD4+ and CD8+ T cells play a vital role in immune responses. CD4+ T cells exhibit antigen experience and aid prolonged antibody production [70,71]. CD8+ T cells recognizing N protein epitopes are associated with reduced disease severity and sustained antiviral potency [72,73,74]. Epitope N105-113, conserved across coronaviruses, elicits strong CD8+ T cell responses, particularly in HLA-B07 genotype individuals, highlighting its potential for vaccine design [73,74,75].
IgG subclasses, distinguished by their heavy chain constant regions, play varied roles in immune responses [76,77,78]. IgG1 and IgG3 dominate in mild and severe COVID-19 cases, respectively, with IgG3 declining over time [79,80,81,82]. IgG4, the least common subclass, mitigates inflammation and immune overactivation but is also implicated in autoimmune disorders [25,83].
Repeated administration of SARS-CoV-2 mRNA vaccines has been shown to increase IgG4 antibody levels, which are typically associated with immune tolerance and reduced pro-inflammatory responses. This immunological adaptation reflects a dynamic shift in the antibody profile with successive doses of mRNA vaccines. For instance, Buhre et al. (2023) reported that mRNA vaccines, compared to adenovirus-based vaccines, induced significantly higher levels of IgG4 antibodies over the long term, while maintaining low levels of galactosylation and sialylation in the Fc region of IgG [86]. Similarly, Hartley et al. (2023) demonstrated that a third dose of mRNA vaccines enhanced IgG4 isotype switching and improved memory B cell recognition of Omicron subvariants, a response not observed in adenovirus-primed individuals [87].
Yoshimura et al. (2024) further supported these findings by showing that repeated mRNA vaccination elicited IgG4 responses specifically targeting the spike receptor-binding domain [88]. Kiszel et al. (2023) highlighted the influence of prior SARS-CoV-2 infection on IgG4 class switching, showing that previously infected individuals exhibited a more pronounced IgG4 response following mRNA vaccination [89]. Akhtar et al. (2023) noted the emergence of tolerance-inducing IgG4 antibodies after booster doses, emphasizing their anti-inflammatory potential [90]. Espino et al. (2024) provided additional evidence from Latin American populations, demonstrating a significant rise in IgG4 levels after repeated Pfizer-BioNTech mRNA vaccinations, although these antibodies displayed limited neutralization capacity against Omicron subvariants [91].
Collectively, these studies demonstrate that repeated SARS-CoV-2 mRNA vaccination promotes an IgG4-dominated response, signifying an evolving immune adaptation that balances long-term protection and immune tolerance. Understanding the mechanisms and implications of this antibody profile is critical for optimizing vaccination strategies, particularly concerning booster doses and the challenges posed by emerging variants.
Currently approved SARS-CoV-2 vaccines target spike protein, focusing on the receptor-binding domain (RBD) as a critical site for neutralization. However, mutations within the RBD have significantly reduced vaccine efficacy against variants like Omicron. First identified in late 2021, the Omicron variant exhibits a remarkable ability to evade neutralizing antibodies elicited by vaccines targeting the original Wuhan strain [92,93]. This is largely attributed to extensive mutations in the RBD, which enhance its binding affinity to the human ACE2 receptor and alter its antigenic properties, leading to immune evasion [94,95,96]. Liu et al. (2021) demonstrated that the extensive RBD mutations in Omicron reduced the binding of neutralizing antibodies, thereby diminishing the efficacy of vaccines developed against the ancestral spike protein [97]. Shah and Woo (2022) expanded on these findings, highlighting Omicron’s enhanced ACE2 binding and resistance to approved therapeutic antibodies, further emphasizing the need for updated vaccines tailored to its unique mutations [98].
Renner et al. (2024) underscored that the cross-protective efficacy of existing vaccines is significantly reduced against Omicron, pointing to the urgent need for variant-specific vaccines to maintain robust protection against emerging strains [99]. Similarly, Zhang et al. (2022) provided structural insights into Omicron’s spike mutations, showing how these changes not only improve ACE2 binding but also amplify immune evasion, making neutralization by antibodies more difficult [100].
Despite a weaker binding affinity to ACE2 compared to the Delta variant, Wu et al. (2022) noted that Omicron’s extensive mutations enable it to escape neutralizing antibodies more effectively, complicating control efforts with existing vaccines [101]. Dejnirattisai et al. (2022) emphasized the widespread neutralizing antibody escape seen with Omicron, raising concerns that prior immunity from vaccination or infection may not sufficiently protect against reinfection [102].
Finally, Planas et al. (2022) confirmed the considerable escape of Omicron from antibody neutralization [103]. Their findings emphasize the urgent need for the development of new vaccines and therapeutic strategies to combat this highly evasive variant [103]. Vaccines incorporating the N protein show promise due to its conserved T cell epitopes, eliciting robust T cell responses and offering protection against diverse SARS-CoV-2 variants [104,105,106]. Preclinical studies demonstrated the protective efficacy of N protein-based vaccines, with strong IFNγ responses and tissue-resident memory T cells observed [107,108,109]. Vaccines combining S and N proteins enhance protection against the SARS-CoV-2 variants, despite the limited neutralizing activity of N-specific antibodies [109,110]. N-specific T cells are crucial for secondary defense mechanisms, providing prolonged protection [107,108,111,112]. In vivo studies highlighted the importance of CD8+ T cells in controlling viral load and preventing weight loss after Omicron challenges [109].
The N protein of SARS-CoV-2 is a pivotal structural and functional component, crucial for viral replication, immune evasion, and pathogenesis. Anti-N antibodies and T-cell responses provide valuable insights into the immune response and vaccine development. Vaccines targeting the N protein could fill gaps left by spike protein-based vaccines, offering broader protection against variants. Further research is essential to optimize vaccine strategies, ensuring durable immunity and effective control of SARS-CoV-2 and its evolving variants.

2. Materials and Methods

2.1. Materials

2.1.1. Participants and Samples

Sixty [60] venous blood samples (2-5 mL) were obtained by venipuncture with informed consent from consecutive healthy individuals attending a local medical facility in Jeddah, Saudi Arabia, for routine medical check-ups from February 2014 to January 2023. The samples included 30 non-vaccinated individuals and 30 individuals vaccinated with COVID-19 vaccines approved in Saudi Arabia (Pfizer-BioNTech, Moderna, AstraZeneca, and Johnson & Johnson). Volunteers with immune disorders or those who had received immunomodulators were excluded based on the medical history data and participants’ responses.
The vaccinated individuals received varying numbers and combinations of vaccine doses. Among the vaccinated group, 12 individuals received three doses of the Pfizer-BioNTech vaccine, four individuals received two doses of the AstraZeneca vaccine, and four individuals received a combination of two doses of AstraZeneca and one dose of Pfizer-BioNTech. Two individuals received one dose of Pfizer-BioNTech followed by one dose of Moderna, two individuals received three doses of AstraZeneca, and one individual received a single dose of the Johnson & Johnson vaccine. Additionally, two individuals received two doses of Pfizer-BioNTech, while three individuals received two doses of AstraZeneca followed by one dose of Pfizer-BioNTech. This distribution indicates that the majority of the vaccinated individuals received three doses of a vaccine, while others received two doses or a combination of different vaccines.
The study participants consisted of 29 males and 31 females, with ages ranging from 11 to 73 years and an average age of 43.89 years. The average age of male participants was 46.07 years, and the average age of female participants was 41.79 years. The majority of participants were Saudi nationals; however, six samples were from individuals of other nationalities. These included one Egyptian male (Sample #6), two Egyptian females (Samples #15 and #49), one Malaysian female (Sample #22), one Moroccan female (Sample #75), and one Pakistani female (Sample #8). Samples were age- and gender-stratified, as detailed in the table below.
All sera were separated from clotted whole-blood samples by centrifugation at room temperature and stored at -20°C in 1.5 mL Safe-Lock Eppendorf tubes. Prior to analysis, all samples were diluted 1:100 in phosphate-buffered saline (PBS).
Table 1. Serum Samples, gender, age, and vaccination status.
Vaccinated Non-vaccinated (control)
S.# Sex Age Vaccine doses S.# Sex Age
1 Female 63 Pfizer (3 doses) 1 Female 30
2 Male 39 Pfizer (3 doses) 2 Male 56
3 Female 28 AstraZeneca (2 doses) 3 Female 37
4 Female 26 AstraZeneca (2 doses) + Pfizer (1 dose) 4 Female 29
5 Female 23 Pfizer (3 doses) 5 Female 67
6 Male 20 AstraZeneca (2 doses) + Pfizer (1 dose) 6 Female 64
7 Female 27 AstraZeneca (2 doses) + Pfizer (1 dose) 7 Male 61
8 Female 33 Pfizer (3 doses) 8 Female 45
9 Female 27 Pfizer (3 doses) 9 Female 11
10 Female 24 Pfizer (3 doses) 10 Female 61
11 Male 36 Pfizer (3 doses) 11 Male 71
12 Male 38 Pfizer (1 dose) + Moderna (1 dose) 12 Female 51
13 Male 30 AstraZeneca (2 doses) 13 Female 56
14 Female 29 Pfizer (3 doses) 14 Male 30
15 Female 27 Pfizer (3 doses) 15 Male 46
16 Female 30 Pfizer (3 doses) 16 Male 59
17 Male 37 Pfizer (3 doses) 17 Female 54
18 Male 35 Pfizer (3 doses) 18 Male 56
19 Male 37 Pfizer (2 doses) 19 Female 55
20 Male 36 Pfizer (1 dose) + Moderna (1 dose) 20 Male 71
21 Male 37 AstraZeneca (3 doses) 21 Female 49
22 Male 40 AstraZeneca (3 doses) 22 Male 63
23 Male 28 Pfizer (2 doses) 23 Female 66
24 Male 37 Pfizer (3 doses) 24 Female 50
25 Male 35 AstraZeneca (2 dose) 25 Male 72
26 Female 18 AstraZeneca (2 doses)+ Pfizer (1 dose) 26 Male 61
27 Female 51 Johnson & Johnson (1 dose) 27 Male 64
28 Female 49 AstraZeneca (2 doses)+ Pfizer (1 dose) 28 Female 56
29 Male 30 Pfizer (3 doses) 29 Male 73
30 Male 32 Pfizer (3 doses) 30 Female 36

2.1.2. Anti–Human Antibodies

Anti-human antibodies were employed in ELISA experiments to detect human serum IgG and its subtypes, including IgG1, IgG2, IgG3, and IgG4. The primary antibodies used in this study included anti-human IgG (H+L) antibodies, which bind to both the heavy and light chains of human IgG antibodies and were sourced from Sigma (catalog number SAB3701347-2MG). Additionally, subtype-specific monoclonal anti-human IgG antibodies conjugated with biotin were used to target IgG1 (catalog number B6775-.2ML), IgG2 (catalog number B3398-.2ML), IgG3 (catalog number B3523-.2ML), and IgG4 (catalog number B3648-.2ML), all of which were produced in mice and obtained from Sigma. These reagents ensured the accurate and reliable detection of the IgG subtypes in the study. The antibody conjugates, substrates, and chemicals utilized in the experiments included Streptavidin−Peroxidase derived from Streptomyces avidinii, sourced from Sigma (catalog number S5512-.1MG). The peroxidase substrate, 3,3′,5,5′-Tetramethylbenzidine (TMB) Liquid Substrate System, was obtained from Sigma (catalog number T8665-1L). Additional reagents included ammonium thiocyanate (NH₄SCN, 99.99% trace metals basis, catalog number 431354-50G), TWEEN 20 (Polyethylene glycol sorbitan monolaurate, catalog number P1379-25ML), phosphate-buffered saline (PBS, catalog number P4417-100TAB), and sulfuric acid (H₂SO₄, 99.99%, catalog number 339741), all sourced from Sigma. The SARS-CoV-2 nucleocapsid protein (AA 1-419) with a C-terminal His-tag, derived from transfected human HEK293 cells and with purity >90%, was procured from antibodies-online (catalog number ABIN6952469).
The experimental hardware and machines included 96-well microwell plates supplied by Greiner bio-one (catalog number E17023B3). An ELISA plate washer (BioTek ELx50, catalog number BK-9622) and a plate absorbance reader (BioTek ELx800, catalog number BM-MR9600) were used to perform and analyze the ELISA assays. Two types of balances were utilized: a compact precision balance (Kern KB 360-3N) with a maximum capacity of 361g and precision of 0.001g, and an analytical balance (Instruchem JEX-200 Chyo) with a maximum capacity of 200g and precision of 0.01mg.

2.2. Methods

The ELISA test was conducted to evaluate serum anti-IgG, total IgG subtypes, and affinity tests using an indirect ELISA method. The process began with the preparation of the coating buffer. Sodium Carbonate (Na₂CO₃) and Sodium Bicarbonate (NaHCO₃) were accurately weighed and dissolved in distilled water. The solution was transferred to a volumetric flask, and distilled water was added to reach a total volume of 1000 ml. The pH was adjusted to 9.6, and the solution was stored at 4°C. To this buffer, 2 µl of antigen (N protein) was added per 1000 ml. Next, the blocking buffer was prepared by dissolving a PBS tablet in distilled water, followed by the addition of Bovine Serum Albumin (BSA) and Tween 20. The pH was adjusted to 7.4, and the solution was stored at 4°C. The washing/dilution buffer was prepared similarly, with the addition of BSA, Tween 20, and PBS tablets, and the pH was adjusted to 7.4.
The ELISA procedure began with antigen coating, where 50 µl of the coating buffer was added per well, and the plates were incubated overnight at 4-8°C. The plates were then blocked with 100 µl/well of blocking solution and incubated for 60 minutes at 37°C. After incubation, the plates were washed and dried.
Primary antibodies were added next. Serum samples were diluted in the dilution buffer, and 50 µl of the mixture was added per well in triplicate. The plates were incubated for 1 hour, followed by washing. Secondary antibodies were then prepared and added. The anti-IgG antibody was prepared by diluting it to a 1:50,000 ratio in the washing solution. For specific anti-IgG subtypes, the following dilutions were used: anti-IgG1 at a 1:1000 dilution, anti-IgG2 at a 1:30,000 dilution, anti-IgG3 at a 1:40,000 dilution, and anti-IgG4 at a 1:50,000 dilution. The plates were incubated for 30 minutes at 37°C, followed by washing.
The streptavidin-peroxidase conjugate was prepared and added to each well, and the plates were incubated for 1 hour at 37°C. After incubation, the plates were washed, and TMB substrate was added to each well. The plates were incubated in darkness for 15 minutes, and the reaction was stopped by adding sulfuric acid, changing the liquid color to yellow. The absorbance of all wells was recorded at a wavelength of 450 nm using a reader machine. This reading was performed within 10 minutes following the addition of the stop solution. For evaluating IgG subtypes affinity, a single elution with a 4 M concentration of ammonium thiocyanate was used. The chaotropic agent was added to each well and incubated for 15 minutes at room temperature. The plates were then washed, and the subsequent steps were carried out similarly. This detailed step-by-step process ensured accurate measurement of total anti-IgG antibody concentrations, IgG subclasses, and affinity, culminating in the absorbance reading that provided the necessary data for analysis.

2.3. Statistical Analysis

The collected absorbance values were used to calculate the levels of total IgG and its subclasses. Mean and standard deviation were calculated for each IgG subclass in both vaccinated and non-vaccinated groups. T-tests were used to compare differences in antibody levels and affinity between the groups. This analysis provided insights into the immune response elicited by vaccination, highlighting differences in IgG subclass distribution and affinity.

3. Results

3.1. Total IgG in Vaccinated and Non-Vaccinated (X±SD)

The data from Table 2 provide a detailed comparison of total IgG (tIgG) levels between vaccinated and non-vaccinated individuals, focusing on mean values and standard deviations. In the vaccinated group, the mean tIgG levels are generally higher, indicating a stronger immune response due to vaccination. For example, Sample #1 (Female) has a mean IgG level of 2.25 (OD) with a standard deviation of 0.042, while Sample #2 (Male) has a mean of 2.336 with a standard deviation of 0.089. The range of mean values for the vaccinated group spans from 1.403 (Sample #29, Male) to 2.592 (OD) (Sample #20, Male). The standard deviation values vary, reflecting the diversity in immune response among individuals, with the SD ranging from 0.011 (Sample #5, Female) to 1.190 (Sample #29, Male). Both male and female participants are included in the vaccinated group, with no clear pattern of higher or lower tIgG levels based on gender alone.
In contrast, the non-vaccinated group generally exhibits lower mean tIgG levels, suggesting a baseline level of tIgG in the absence of vaccination. For instance, Sample #1 (Female) has a mean tIgG level of 0.5117 (OD) with a standard deviation of 0.1665, and Sample #2 (Male) has a mean of 0.7523 (OD) with a standard deviation of 0.1155. The mean values for the non-vaccinated group range from 0.5117 (Sample #1, Female) to 0.8190 (OD) (Sample #5, Female). The standard deviation values are also lower in this group, ranging from 0.0014 (Sample #15, Male) to 0.2144 (Sample #13, Female), indicating less variability in tIgG levels among non-vaccinated individuals. Similar to the vaccinated group, both males and females are represented, with no significant gender-based differences in tIgG levels.
When comparing the two groups, it is evident that vaccinated individuals tend to have higher tIgG levels on average. For example, Sample #17 (Male) in the vaccinated group has a mean IgG level of 2.451 (OD) with a standard deviation of 0.014, compared to Sample #17 (Female) in the non-vaccinated group with a mean of 0.7523 (OD) and a standard deviation of 0.1155. This finding underscores the effectiveness of vaccination in boosting the immune response. Additionally, the greater variability in tIgG levels among vaccinated individuals suggests that individual factors such as health status, genetics, and environmental influences may affect the immune response to vaccination. There is no distinct trend indicating that one gender consistently has higher or lower tIgG levels within each group.
In conclusion, the data from Table 2 highlights the impact of vaccination on tIgG levels, demonstrating higher mean levels and greater variability in vaccinated individuals compared to non-vaccinated controls. This information is crucial for understanding the benefits of vaccination and the range of immune responses it can generate. While gender does not appear to significantly influence tIgG levels, the overall findings emphasize the importance of vaccination in promoting a stronger immune response.

3.2. Anti-N IgG1 Among Vaccinated and Non-Vaccinated (X±SD)

The data presented in Table 3 provide a detailed comparison of IgG1 levels between vaccinated and non-vaccinated (control) individuals, with a focus on mean values and standard deviations. This comparison is essential for understanding the immune response elicited by vaccination. In the vaccinated group, the mean IgG1 levels exhibit a wide range, from as low as 0.05 (Sample #19, Male) to as high as 2.348 (OD) (Sample #20, Male). This significant variation suggests that the immune response to vaccination can differ greatly among individuals. The standard deviation values, which range from 0.0028 (Sample #19, Male) to 0.553 (Sample #24, Male), further highlight this variability. Such differences in the spread of IgG1 levels indicate that while some individuals may have a robust response to the vaccine, others may have a more moderate increase in IgG1 levels. The data includes both male and female participants, but there is no clear pattern indicating that one gender consistently has higher or lower IgG1 levels.
In contrast, the non-vaccinated (control) group shows generally lower mean IgG1 levels, ranging from 0.053 (Sample #7, Male) to 0.373 (OD) (Sample #29, Male). The standard deviation values in this group are also lower, ranging from 0.001 (Sample #7, Male) to 0.141 (Sample #24, Female), suggesting less variability in IgG1 levels among non-vaccinated individuals. This lower variability could imply a more uniform baseline level of IgG1 in the absence of vaccination. Similar to the vaccinated group, both males and females are represented, and there is no distinct trend indicating significant gender-based differences in IgG1 levels.
When comparing the two groups, it is evident that vaccinated individuals tend to have higher IgG1 levels on average. This finding underscores the effectiveness of vaccination in enhancing the immune response, as reflected by the increased IgG1 levels. Additionally, the greater variability in IgG1 levels among vaccinated individuals suggests that the vaccine elicits a diverse range of immune responses, which could be influenced by various factors such as individual health status, genetics, and environmental factors.
In conclusion, the data from Table 3 highlights the impact of vaccination on IgG1 levels, demonstrating higher mean levels and greater variability in vaccinated individuals compared to non-vaccinated controls. This information is crucial for understanding the benefits of vaccination and the range of immune responses it can generate. While gender does not appear to significantly influence IgG1 levels within each group, the overall findings emphasize the importance of vaccination in promoting a stronger immune response.

3.3. Anti-N IgG2 Among Vaccinated and Non-Vaccinated (X±SD)

The data in Table 4 compares IgG2 levels between vaccinated and non-vaccinated (control) individuals, focusing on mean values and standard deviations. For the vaccinated group, the mean IgG2 levels range from 0.050 (Sample #2, Male) to 0.066 (OD) (Sample #8, Female), indicating a relatively narrow range of immune responses among individuals. The standard deviation values, ranging from 0.0005 (Sample #4, Female) to 0.0123 (Sample #7, Female), suggest some variability in IgG2 levels, but not as pronounced as seen in IgG1 levels. Both males and females are included in the vaccinated group, with no clear pattern of higher or lower IgG2 levels based on gender alone.
In the non-vaccinated group, the mean IgG2 levels are also within a narrow range, from 0.049 (Sample #20, Male) to 0.206 (OD) (Sample #19, Female). The standard deviation values, ranging from 0.0005 (Sample #4, Female) to 0.2221 (Sample #19, Female), indicate a similar level of variability as seen in the vaccinated group. This suggests that the baseline IgG2 levels in non-vaccinated individuals are relatively consistent. Both genders are represented in this group as well, without distinct trends indicating significant gender-based differences in IgG2 levels.
Comparatively, the mean IgG2 levels in vaccinated individuals are slightly higher on average than those in non-vaccinated individuals. This suggests that vaccination may have a modest effect on increasing IgG2 levels. However, the variability in IgG2 levels is similar between the two groups, indicating that individual differences in immune response are present regardless of vaccination status.
In summary, Table 4 shows that vaccination leads to a slight increase in IgG2 levels compared to non-vaccinated controls, with similar variability in both groups. Gender does not appear to significantly influence IgG2 levels within each group. This data highlights the nuanced impact of vaccination on IgG2 levels, suggesting a modest enhancement of immune response.

3.4. Anti-N IgG3 Among Vaccinated and Non-Vaccinated (X±SD)

The data in Table 5 compares IgG3 levels between vaccinated and non-vaccinated (control) individuals, focusing on mean values and standard deviations. For the vaccinated group, the mean IgG3 levels range from 0.047 (Sample #14, Female) to 0.0753 (OD) (Sample #18, Male), indicating a relatively narrow range of immune response among individuals. The standard deviation values, ranging from 0.0005 (Sample #13, Male) to 0.0102 (Sample #19, Male), suggest some variability in IgG3 levels, but not as pronounced as seen in IgG1 levels. Both males and females are included in the vaccinated group, with no clear pattern of higher or lower IgG3 levels based on gender alone.
In the non-vaccinated group, the mean IgG3 levels are also within a narrow range, from 0.0433 (Sample #12, Female) to 0.158 (OD) (Sample #3, Female). The standard deviation values, ranging from 0.00047 (Sample #4, Female) to 0.0359 (Sample #3, Female), indicate a similar level of variability as seen in the vaccinated group. This suggests that the baseline IgG3 levels in non-vaccinated individuals are relatively consistent. Both genders are represented in this group as well, without distinct trends indicating significant gender-based differences in IgG3 levels.
Comparatively, the mean IgG3 levels in vaccinated individuals are slightly higher on average than those in non-vaccinated individuals. This suggests that vaccination may have a modest effect on increasing IgG3 levels. However, the variability in IgG3 levels is similar between the two groups, indicating that individual differences in immune response are present regardless of vaccination status.
In summary, Table 5 shows that vaccination leads to a slight increase in IgG3 levels compared to non-vaccinated controls, with similar variability in both groups. Gender does not appear to influence IgG3 levels within each group significantly. This data highlights the nuanced impact of vaccination on IgG3 levels, suggesting a modest enhancement of imm une response.

3.5. Anti-N IgG4 Among Vaccinated and Non-Vaccinated (X±SD)

The data in Table 6 compares IgG4 levels between vaccinated and non-vaccinated (control) individuals, focusing on mean values and standard deviations. For the vaccinated group, the mean IgG4 levels range from 0.046 (Sample #30, Male) to 0.144 (OD) (Sample #17, Male), indicating a relatively narrow range of immune responses among individuals. The standard deviation values, ranging from 0.00047 (Samples #13, Male; #6, Male; #27, Female) to 0.00455 (Sample #14, Female), suggest some variability in IgG4 levels, but not as pronounced as seen in IgG1 levels. Both males and females are included in the vaccinated group, with no clear pattern of higher or lower IgG4 levels based on gender alone.
In the non-vaccinated group, the mean IgG4 levels are also within a narrow range, from 0.043 (Sample #26, Male) to 0.058 (OD) (Samples #1, Female; #3, Female). The standard deviation values, ranging from 0.00047 (Samples #4, Female; #27, Male) to 0.00386 (Sample #3, Female), indicate a similar level of variability as seen in the vaccinated group. This suggests that the baseline IgG4 levels in non-vaccinated individuals are relatively consistent. Both genders are represented in this group as well, without distinct trends indicating significant gender-based differences in IgG4 levels.
Comparatively, the mean IgG4 levels in vaccinated individuals are slightly higher on average than those in non-vaccinated individuals. This suggests that vaccination may have a modest effect on increasing IgG4 levels. However, the variability in IgG4 levels is similar between the two groups, indicating that individual differences in immune response are present regardless of vaccination status.
When comparing IgG4 with other IgG subclasses, we observe that IgG1 shows the most significant increase post-vaccination, with mean levels ranging from 0.05 (Sample #19, Male) to 2.3477 (OD) (Sample #20, Male) in vaccinated individuals, compared to 0.053 (Sample #7, Male) to 0.373 (Sample #29, Male) in non-vaccinated individuals. The variability in IgG1 levels is also higher in vaccinated individuals, indicating a more diverse immune response. For IgG2, the mean levels in vaccinated individuals range from 0.050 (Sample #2, Male) to 0.0663 (OD) (Sample #8, Female), with a similar level of variability in both vaccinated and non-vaccinated groups. IgG3 levels show a slight increase post-vaccination, with mean levels ranging from 0.047 (Sample #14, Female) to 0.0753 (OD) (Sample #18, Male) in vaccinated individuals, and a similar variability in both groups.
Overall, the data across all IgG subclasses (IgG1, IgG2, IgG3, and IgG4) indicates that vaccination generally leads to an increase in IgG levels, with the most significant increase observed in IgG1. The variability in IgG levels is higher in vaccinated individuals for IgG1, suggesting a more diverse immune response. For IgG2, IgG3, and IgG4, the increases are modest, and the variability is similar between vaccinated and non-vaccinated groups. Gender does not appear to significantly influence IgG levels within each group for any of the IgG subclasses. This comprehensive comparison highlights the nuanced impact of vaccination on different IgG subclasses, emphasizing the overall enhancement of immune response post-vaccination.

3.6. Affinity of IgG1 in Vaccinated and Non-Vaccinated (X±SD)

The data in Table 7 compares the affinity of IgG1 strength between vaccinated and non-vaccinated (control) individuals for N, focusing on mean values and standard deviations. For the vaccinated group, the mean affinity of IgG1 ranges from 0.0503 (Sample #5, Female) to 0.3347 (OD) (Sample #16, Female), indicating a broad range of immune responses among individuals. The standard deviation values, ranging from 0.0005 (Sample #13, Male) to 0.0198 (Sample #20, Male), suggest some variability in IgG1 affinity levels, but not as pronounced as seen in total IgG1 levels. Both males and females are included in the vaccinated group, with no clear pattern of higher or lower IgG1 affinity based on gender alone.
In the non-vaccinated group, the mean affinity of IgG1 ranges from 0.0457 (Samples #6, Female; #23, Female) to 0.2763 (OD) (Sample #2, Male). The standard deviation values, ranging from 0.0008 (Sample #6, Female) to 0.0109 (Sample #2, Male), indicate a similar level of variability as seen in the vaccinated group. This suggests that the baseline affinity of IgG1 in non-vaccinated individuals is relatively consistent. Both genders are represented in this group as well, without distinct trends indicating significant gender-based differences in IgG1 affinity.
Comparatively, the mean affinity of IgG1 in vaccinated individuals is generally higher than in non-vaccinated individuals. This suggests that vaccination may enhance the affinity of IgG1, leading to a more effective immune response. However, the variability in IgG1 affinity is similar between the two groups, indicating that individual differences in immune response are present regardless of vaccination status.

3.7. Affinity of IgG2 in Vaccinated and Non-Vaccinated (X±SD)

The data in Table 8 compares the affinity of IgG2 strength between vaccinated and non-vaccinated (control) individuals for N, focusing on mean values and standard deviations. For the vaccinated group, the mean affinity of IgG2 ranges from 0.048 (Sample #13, Male) to 0.0663 (OD) (Sample #8, Female), indicating a relatively narrow range of immune responses among individuals. The standard deviation values, ranging from 0.00047 (Samples #4, Female; #6, Male) to 0.00287 (Sample #1, Female), suggest some variability in IgG2 affinity levels, but not as pronounced as seen in total IgG1 levels. Both males and females are included in the vaccinated group, with no clear pattern of higher or lower IgG2 affinity based on gender alone.
In the non-vaccinated group, the mean affinity of IgG2 ranges from 0.0447 (Sample #22, Male) to 0.05767 (OD) (Sample #1, Female). The standard deviation values, ranging from 0.00047 (Samples #4, Female; #6, Female) to 0.00125 (Samples #2, Male; #9, Female), indicate a similar level of variability as seen in the vaccinated group. This suggests that the baseline affinity of IgG2 in non-vaccinated individuals is relatively consistent. Both genders are represented in this group as well, without distinct trends indicating significant gender-based differences in IgG2 affinity.
Comparatively, the mean affinity of IgG2 in vaccinated individuals is generally higher than in non-vaccinated individuals. This suggests that vaccination may enhance the affinity of IgG2, leading to a more effective immune response. However, the variability in IgG2 affinity is similar between the two groups, indicating that individual differences in immune response are present regardless of vaccination status.

3.8. Affinity of IgG3 in Vaccinated and Non-Vaccinated (X±SD)

The data in Table 9 compares the affinity of IgG3 strength between vaccinated and non-vaccinated (control) individuals for N, focusing on mean values and standard deviations. For the vaccinated group, the mean affinity of IgG3 ranges from 0.045 (Sample #26, Female) to 0.06767 (OD) (Sample #7, Female), indicating a relatively narrow range of immune response among individuals. The standard deviation values, ranging from 0.00047 (Samples #4, Female; #8, Female; #17, Male) to 0.00386 (Sample #7, Female), suggest some variability in IgG3 affinity levels, but not as pronounced as seen in total IgG1 levels. Both males and females are included in the vaccinated group, with no clear pattern of higher or lower IgG3 affinity based on gender alone.
In the non-vaccinated group, the mean affinity of IgG3 ranges from 0.0433 (Sample #12, Female) to 0.0633 (OD) (Sample #4, Female). The standard deviation values, ranging from 0.00047 (Samples #4, Female; #7, Male) to 0.0359 (Sample #3, Female), indicate a similar level of variability as seen in the vaccinated group. This suggests that the baseline affinity of IgG3 in non-vaccinated individuals is relatively consistent. Both genders are represented in this group as well, without distinct trends indicating significant gender-based differences in IgG3 affinity.
Comparatively, the mean affinity of IgG3 in vaccinated individuals is generally higher than in non-vaccinated individuals. This suggests that vaccination may enhance the affinity of IgG3, leading to a more effective immune response. However, the variability in IgG3 affinity is similar between the two groups, indicating that individual differences in immune response are present regardless of vaccination status.

3.9. Affinity of IgG4 in Vaccinated and Non-Vaccinated (X±SD)

The data in Table 10 compares the affinity of IgG4 strength between vaccinated and non-vaccinated (control) individuals for N, focusing on mean values (X) and standard deviations (SD). In vaccinated individuals, the mean affinity of IgG4 ranges from 0.0507 to 0.144 (OD), with the highest value observed in Sample #17 (Male) and the lowest in Sample #13 (Male). The standard deviation values for this group range from 0.00047 to 0.00455, indicating some variability in IgG4 affinity levels among vaccinated individuals. Both male and female participants are included in this group, with no clear pattern of higher or lower IgG4 affinity based on gender alone.
In non-vaccinated individuals, the mean affinity of IgG4 ranges from 0.043 to 0.058 (OD), with the highest value observed in Samples #1 and #3 (both Female) and the lowest in Sample #26 (Male). The standard deviation values for this group range from 0.00047 to 0.00386, suggesting a similar level of variability as seen in the vaccinated group. Both genders are represented in this group as well, without distinct trends indicating significant gender-based differences in IgG4 affinity. When comparing the two groups, the mean affinity of IgG4 is generally higher in vaccinated individuals compared to non-vaccinated individuals. This suggests that vaccination may enhance the affinity of IgG4, leading to a more effective immune response. However, the variability in IgG4 affinity is similar between the two groups, indicating that individual differences in immune response are present regardless of vaccination status.
The data suggests that vaccination enhances the affinity of IgG4 antibodies, which could contribute to a stronger and more effective immune response. There is no significant influence of gender on IgG4 affinity levels within each group. This comprehensive comparison highlights the impact of vaccination on IgG4 affinity and the overall enhancement of the immune response post-vaccination.
Figure 1. Comparison of the IgG subclasses (1-4) Between Vaccinated and Non-Vaccinated Individuals.
Preprints 148244 g001
This histogram illustrates the mean levels (± standard deviation) of four IgG subclasses (IgG1, IgG2, IgG3, and IgG4) in vaccinated and non-vaccinated individuals. Each bar represents the mean level for a given subclass, with error bars denoting standard deviations to capture variability within each group.
The immune response enhancement through vaccination is evident in IgG subclasses, where vaccinated individuals exhibit generally higher mean levels across subclasses. IgG1, often associated with a robust response, shows a notable increase in vaccinated individuals, highlighting its role in immune defense post-vaccination. The differences between vaccinated and non-vaccinated means were statistically significant (p < 0.05) across all subclasses, particularly marked in IgG1 and IgG4, suggesting that vaccination significantly boosts immune markers associated with these antibodies. Furthermore, higher standard deviations among vaccinated samples in certain subclasses suggest diverse individual immune responses, possibly due to genetic and health variability. Standard deviations within non-vaccinated groups remained relatively consistent, indicating baseline immune levels. These findings underscore the impact of vaccination on immunoglobulin levels, particularly IgG1 and IgG4, reflecting enhanced immunological readiness in vaccinated individuals.
Figure 2. Comparison of the affinity of IgG subclasses (1-4) Between Vaccinated and Non-Vaccinated Individuals.
Preprints 148244 g002
This histogram presents the mean affinity (± standard deviation) of IgG subclasses (IgG1, IgG2, IgG3, and IgG4) among vaccinated and non-vaccinated individuals. Each bar represents the mean affinity level for a specific subclass, with error bars indicating the standard deviation to illustrate the variability within each group.
The affinity of antibodies indicating the strength of their binding to pathogens differs notably between vaccinated and non-vaccinated groups, reflecting the influence of vaccination on immune response quality. Vaccinated individuals exhibit higher mean affinities, particularly in IgG1 and IgG4, which are statistically significant (p < 0.05). This increase in affinity suggests that vaccination promotes a more effective immune response, enhancing the antibodies’ ability to neutralize pathogens more efficiently. Notably, IgG1 shows the most substantial improvement, supporting its role as a primary mediator in the immune response post-vaccination.
In addition, the vaccinated group’s greater standard deviations across subclasses imply a diverse immune response influenced by individual variability, such as genetics or health conditions. Conversely, the non-vaccinated group’s affinities remain consistent and lower, representing a baseline level of immunity. This comprehensive analysis emphasizes the role of vaccination in improving antibody affinity, which enhances immune system efficacy against potential infections.
Figure 3. Comparison of IgG (1-4) Subclasses Affinity Between Male and Female Patients.
Preprints 148244 g003
This histogram compares mean levels (± standard deviation) of IgG subclasses (IgG1 through IgG4) and their affinities between male and female patients. Error bars show standard deviations, capturing the spread of affinity levels within each subclass.
The results reveal slight differences in IgG subclass levels and affinities between genders, with females showing marginally higher mean levels, particularly in IgG2 and IgG4. However, these differences were not statistically significant (p > 0.05), suggesting that any observed variations may be due to normal biological variation rather than distinct immunological differences between male and female patients. Standard deviations indicate moderate variability within both groups, slightly higher among females in certain subclasses. This variability hints at individual immune response differences, which may result from genetic, environmental, or health-related factors rather than gender alone.
In conclusion, while females displayed a trend of marginally higher IgG levels and affinities, these findings do not imply a significant gender-based difference in immune response across IgG subclasses. The similarities in these immunological measures underscore the general consistency in IgG responses across genders in this patient group.
Figure 4. Comparison of the IgG subclasses (1-4) between male and female participants.
Preprints 148244 g004
The histogram presents a comparative analysis of IgG subclasses (IgG1-4) between male and female participants, with mean levels displayed along with standard deviations in parentheses above each bar. IgG1 levels are slightly higher in males than in females, suggesting a possible variation in immune response for this subclass. IgG2 levels are nearly equal across genders, indicating that this subclass may exhibit a more consistent immune response, unaffected by gender-based differences. For IgG3, a minor increase in female levels is observed, while IgG4 levels are marginally higher in males.
Statistical significance testing was performed to assess these differences, and the results indicate that while some variations in IgG subclasses are visible, they are not statistically significant at a conventional threshold (p > 0.05). This lack of significant difference suggests that, for IgG subclasses in this study, gender does not substantially affect the antibody response. The consistent levels across genders, especially for IgG2 and IgG3, imply that immune response to the nucleocapsid protein of SARS-CoV-2 in these subclasses may be generally robust and uniform across male and female participants, irrespective of minor mean differences. This uniformity supports the idea that the immune response induced may be more influenced by external factors, such as vaccination status or antigen exposure, than by gender alone.

4. Discussion

The study on the affinity and subclasses of anti-N protein antibodies in SARS-CoV-2 vaccinated and non-vaccinated individuals provides a comprehensive analysis of the immune response dynamics. The N protein of SARS-CoV-2 is highly immunogenic and is expressed abundantly during infection [9], making it a significant target for antibody responses. Antibodies against the N protein are detectable early in the infection and persist longer than those against other viral proteins [8], which is crucial for understanding long-term immunity and the potential for reinfection.
IgG4, one of the four subclasses of IgG antibodies, is known for its unique properties, including its ability to undergo Fab-arm exchange and its anti-inflammatory effects [76]. Unlike IgG1 and IgG3, which are typically involved in pro-inflammatory responses, IgG4 is associated with immune tolerance and long-term immunity [113]. The production of IgG4 following repeated antigen exposure, such as vaccination, suggests a role in modulating the immune response to prevent overactivation and potential tissue damage.
The study revealed that vaccinated individuals exhibited higher levels of IgG4 antibodies against the N protein compared to non-vaccinated individuals. This increase in IgG4 levels post-vaccination may be explained by hybrid immunity, a phenomenon where individuals who have both recovered from SARS-CoV-2 infection and subsequently received vaccination exhibit enhanced immune responses. This aligns with the findings by Irrgang et al. [114], who reported that repeated mRNA vaccinations or breakthrough infections can boost IgG4 antibody levels, predominantly spike-specific. However, the presence of anti-N IgG4 antibodies in mRNA vaccine recipients suggests prior exposure to the N protein through natural infection, as mRNA vaccines themselves do not contain the genetic code for the N protein. [24,110]
Several studies have explored the dynamics of IgG4 in response to SARS-CoV-2 infection and vaccination. For instance, [23] reported a significant increase in IgG4 levels following multiple doses of mRNA vaccines [90,115] suggesting a role in long-term immune regulation. Similarly, [23,24] highlighted the potential of IgG4 to induce tolerance against the spike protein, drawing parallels with allergen-specific immunotherapy, which could facilitate reinfection and other unintended consequences. The role of the N protein in modulating immune responses has also been extensively studied [47,49]. [48] demonstrated that the N protein can suppress type I interferon responses, aiding in viral immune evasion. This suppression could be counteracted by the presence of high-affinity IgG4 antibodies, which may enhance the clearance of the virus without triggering excessive inflammation [49].
The interaction between the N protein and IgG4 antibodies is pivotal in understanding the immune response to SARS-CoV-2. The N protein’s ability to interfere with host immune pathways, such as the RIG-I signaling pathway, underscores the importance of a balanced antibody response [56]. IgG4’s anti-inflammatory properties could help maintain this balance, preventing the detrimental effects of an overactive immune response while ensuring effective viral clearance.
Interestingly, Saudi Arabia’s history with the MERS coronavirus, another member of the Betacoronavirus genus, provides a unique context for this study. Prior exposure to MERS may have influenced baseline immunity in the population, potentially affecting antibody dynamics in response to SARS-CoV-2. Elevated IgG levels in some participants could reflect immunological imprinting or cross-reactivity due to previous exposure to coronaviruses. This warrants further exploration to determine if such prior exposure contributes to the observed variations in antibody responses. The findings of this study have significant implications for vaccine development and public health strategies [116]. The induction of IgG4 antibodies through vaccination could be a crucial factor in designing vaccines that not only provide protection but also minimize adverse inflammatory responses. This approach could be particularly beneficial for individuals with underlying health conditions that predispose them to severe COVID-19.
Future studies should focus on the long-term persistence of IgG4 antibodies and their protective efficacy against emerging SARS-CoV-2 variants [109]. Additionally, research should explore the potential of combining N protein-based vaccines with other viral antigens to enhance the breadth and durability of the immune response.
The study also delves into the broader context of SARS-CoV-2 immunity, examining the roles of other IgG subclasses (IgG1, IgG2, and IgG3) in the immune response. IgG1 and IgG3 are typically involved in pro-inflammatory responses and are crucial for pathogen neutralization. The study found that vaccinated individuals had higher levels of IgG1 and IgG3 compared to non-vaccinated individuals, indicating a robust immune response post-vaccination. IgG2 showed a slight increase in vaccinated individuals, suggesting a modest enhancement of immune response.
The study employed the Enzyme-Linked Immunosorbent Assay (ELISA) technique to isolate and characterize these antibodies. This technique allowed us to quantify the antibodies and determine their affinity for the N protein. The analysis of antibody subclasses provided insights into the diversity of the immune response. The comparison of antibody prevalence and properties in vaccinated versus non-vaccinated individuals highlighted how vaccination status affects the immune response, particularly the response to the N protein.
The study’s methodology involved collecting venous samples from vaccinated and non-vaccinated individuals, separating the sera, and using ELISA to quantify IgG antibodies and their subclasses. The results showed significant differences in antibody levels and affinities between the two groups, with vaccinated individuals exhibiting higher levels of IgG1, IgG3, and IgG4, and higher antibody affinities overall. The study also explored the impact of gender on antibody levels and affinities. While female participants generally exhibited higher IgGs levels and affinities compared to male participants, particularly in the vaccinated group, these differences were not statistically significant. This trend, though not definitive, suggests a potential for variations in immune response between genders. However, the lack of statistical significance indicates that further studies with larger sample sizes would be necessary to confirm any true gender-based differences in response to vaccination and to assess potential implications for vaccine efficacy and public health strategies.
In summary, this study provides a comprehensive analysis of the immune response to the SARS-CoV-2 N protein in vaccinated and non-vaccinated individuals, highlighting the roles of IgG subclasses. IgG1 and IgG4 were the most elevated in vaccinated individuals, with IgG1 contributing to viral neutralization and IgG4, an anti-inflammatory subclass, potentially reducing immune overactivation. These findings have significant implications for vaccine strategies and public health, emphasizing the need for further research into the long-term impacts of vaccination on immunity against SARS-CoV-2.

5. Conclusions and Future Work

This study provides a comprehensive analysis of the affinity and IgG subclasses of anti-N protein antibodies in SARS-CoV-2 vaccinated and non-vaccinated individuals. The findings highlight several key points. Vaccinated individuals generally exhibit higher levels of IgG antibodies compared to non-vaccinated individuals, with a particularly significant increase in IgG1. This suggests that vaccination effectively enhances the immune response, leading to a higher production of this antibody subclass. Among the IgG subclasses, IgG1 shows the highest increase in both anti-N antibody levels and affinity in vaccinated individuals, indicating that vaccination not only boosts the quantity of IgG1 but also enhances its quality, making it more effective in binding to antigens.
The affinity of IgG1 antibodies is significantly higher in vaccinated individuals, which points to a stronger and more effective immune response. The affinities of IgG2, IgG3, and IgG4 show minor increases, with IgG2 showing the least change. This suggests that while vaccination enhances the overall immune response, its impact is most pronounced on IgG1. Additionally, female participants generally show higher IgG levels and affinities than males, especially in the vaccinated group. However, this difference is not significant. More samples are needed to confirm any gender-based differences in immune response.
The findings underscore the importance of targeting the N protein in vaccine development. The robust antibody response to the N protein, especially in vaccinated individuals, highlights its potential as a key component in future vaccines. This study’s results suggest that incorporating the N protein in vaccines could enhance their effectiveness, particularly in inducing a strong and durable immune response.
Building on these findings, several areas for future research are identified. Longitudinal studies are needed to monitor the persistence of IgG subclasses and their affinities over time in both vaccinated and non-vaccinated individuals. This will provide insights into the durability of the immune response and the potential need for booster vaccinations. Expanding the study to include a more diverse population sample, considering factors such as age, ethnicity, and underlying health conditions, will help to generalize the findings and understand the immune response across different demographic groups.
Investigating the underlying mechanisms that drive the differences in antibody responses between vaccinated and non-vaccinated individuals is also crucial. This includes exploring the role of different vaccine platforms and adjuvants in shaping the immune response. Further research should also explore the gender differences observed in this study to understand the biological and hormonal factors that may influence the immune response to vaccination. This could lead to more tailored vaccination strategies.
Assessing the antibody response to different SARS-CoV-2 variants, particularly focusing on the N protein, will help determine the effectiveness of current vaccines against emerging variants and guide the development of next-generation vaccines. Exploring the potential of combination vaccines that target both the S and N proteins could enhance the breadth and robustness of the immune response, providing better protection against diverse SARS-CoV-2 variants. By addressing these areas, future research can build on the current findings to enhance our understanding of the immune response to SARS-CoV-2 and improve vaccine strategies for better public health outcomes.

Author Contributions

Conceptualization, E.M.R.; methodology, A.E and E.M.R.; software, A.E and E.M.R.; validation, A.E, A.C., V.N.U., and E.M.R.; formal analysis, A.E; investigation, A.E.; resources, A.E, S.M.F. and, E.M.R; data curation, A.E., A.C., V.N.U, S.M.F. and M.R writing—original draft preparation, A.E and E.M.R; writing—review and editing, A.E, A.C., V.N.U., S.M.F. and E.M.R.; visualization, A.E. and E.M.R.; supervision, E.M.R.; project administration, E.M.R.; All authors have read and agreed to the published version of the manuscript.

Funding

This research received no external funding.

Institutional Review Board Statement

Not applicable.

Informed Consent Statement

Not applicable.

Conflicts of Interest

The authors declare no conflicts of interest.

References

  1. Xu X, Chen P, Wang J, Feng J, Zhou H, Li X, et al. Evolution of the novel coronavirus from the ongoing Wuhan outbreak and modeling of its spike protein for risk of human transmission. Sci China Life Sci. 2020 Mar;63(3):457–60.
  2. Cui J, Li F, Shi ZL. Origin and evolution of pathogenic coronaviruses. Nat Rev Microbiol. 2019 Mar;17(3):181–92.
  3. Holshue ML, DeBolt C, Lindquist S, Lofy KH, Wiesman J, Bruce H, et al. First Case of 2019 Novel Coronavirus in the United States. N Engl J Med. 2020 Mar 5;382(10):929–36.
  4. Lu R, Zhao X, Li J, Niu P, Yang B, Wu H, et al. Genomic characterisation and epidemiology of 2019 novel coronavirus: implications for virus origins and receptor binding. The Lancet. 2020 Feb;395(10224):565–74.
  5. Narayanan K, Chen CJ, Maeda J, Makino S. Nucleocapsid-independent specific viral RNA packaging via viral envelope protein and viral RNA signal. J Virol. 2003 Mar;77(5):2922–7.
  6. Hurst KR, Koetzner CA, Masters PS. Identification of in vivo-interacting domains of the murine coronavirus nucleocapsid protein. J Virol. 2009 Jul;83(14):7221–34.
  7. Huang Q, Yu L, Petros AM, Gunasekera A, Liu Z, Xu N, et al. Structure of the N-terminal RNA-binding domain of the SARS CoV nucleocapsid protein. Biochemistry. 2004 May 25;43(20):6059–63.
  8. Tan YJ, Goh PY, Fielding BC, Shen S, Chou CF, Fu JL, et al. Profiles of antibody responses against severe acute respiratory syndrome coronavirus recombinant proteins and their potential use as diagnostic markers. Clin Diagn Lab Immunol. 2004 Mar;11(2):362–71.
  9. Shi Y, Yi Y, Li P, Kuang T, Li L, Dong M, et al. Diagnosis of severe acute respiratory syndrome (SARS) by detection of SARS coronavirus nucleocapsid antibodies in an antigen-capturing enzyme-linked immunosorbent assay. J Clin Microbiol. 2003 Dec;41(12):5781–2.
  10. Leung DTM, Tam FCH, Ma CH, Chan PKS, Cheung JLK, Niu H, et al. Antibody Response of Patients with Severe Acute Respiratory Syndrome (SARS) Targets the Viral Nucleocapsid. J Infect Dis. 2004 Jul 15;190(2):379–86.
  11. Zou L, Ruan F, Huang M, Liang L, Huang H, Hong Z, et al. SARS-CoV-2 Viral Load in Upper Respiratory Specimens of Infected Patients. N Engl J Med. 2020 Mar 19;382(12):1177–9.
  12. To KKW, Tsang OTY, Leung WS, Tam AR, Wu TC, Lung DC, et al. Temporal profiles of viral load in posterior oropharyngeal saliva samples and serum antibody responses during infection by SARS-CoV-2: an observational cohort study. Lancet Infect Dis. 2020 May;20(5):565–74.
  13. Chen W, Lan Y, Yuan X, Deng X, Li Y, Cai X, et al. Detectable 2019-nCoV viral RNA in blood is a strong indicator for the further clinical severity. Emerg Microbes Infect. 2020;9(1):469–73.
  14. Ong DSY, de Man SJ, Lindeboom FA, Koeleman JGM. Comparison of diagnostic accuracies of rapid serological tests and ELISA to molecular diagnostics in patients with suspected coronavirus disease 2019 presenting to the hospital. Clin Microbiol Infect. 2020 Aug;26(8):1094.e7-1094.e10.
  15. Long QX, Liu BZ, Deng HJ, Wu GC, Deng K, Chen YK, et al. Antibody responses to SARS-CoV-2 in patients with COVID-19. Nat Med. 2020 Jun;26(6):845–8.
  16. L’Huillier AG, Meyer B, Andrey DO, Arm-Vernez I, Baggio S, Didierlaurent A, et al. Antibody persistence in the first 6 months following SARS-CoV-2 infection among hospital workers: a prospective longitudinal study. Clin Microbiol Infect. 2021 Jan 20;27(5):784.e1-8.
  17. Lumley SF, O’Donnell D, Stoesser NE, Matthews PC, Howarth A, Hatch SB, et al. Antibody Status and Incidence of SARS-CoV-2 Infection in Health Care Workers. N Engl J Med. 2021 Feb 11;384(6):533–40.
  18. Jeffery-Smith A, Iyanger N, Williams S V, Chow JY, Aiano F, Hoschler K, et al. Antibodies to SARS-CoV-2 protect against re-infection during outbreaks in care homes, September and October 2020. Euro Surveill. 2021 Feb;26(5).
  19. Addetia A, Crawford KHD, Dingens A, Zhu H, Roychoudhury P, Huang ML, et al. Neutralizing Antibodies Correlate with Protection from SARS-CoV-2 in Humans during a Fishery Vessel Outbreak with a High Attack Rate. J Clin Microbiol. 2020 Oct 21;58(11).
  20. Prendecki M, Clarke C, Brown J, Cox A, Gleeson S, Guckian M, et al. Effect of previous SARS-CoV-2 infection on humoral and T-cell responses to single-dose BNT162b2 vaccine. Lancet. 2021 Mar 27;397(10280):1178–81.
  21. Abu Jabal K, Ben-Amram H, Beiruti K, Batheesh Y, Sussan C, Zarka S, et al. Impact of age, ethnicity, sex and prior infection status on immunogenicity following a single dose of the BNT162b2 mRNA COVID-19 vaccine: real-world evidence from healthcare workers, Israel, December 2020 to January 2021. Euro Surveill. 2021 Feb;26(6).
  22. Krammer F, Srivastava K, Alshammary H, Amoako AA, Awawda MH, Beach KF, et al. Antibody Responses in Seropositive Persons after a Single Dose of SARS-CoV-2 mRNA Vaccine. N Engl J Med. 2021 Apr 8;384(14):1372–4.
  23. Irrgang P, Gerling J, Kocher K, Lapuente D, Steininger P, Habenicht K, et al. Class switch toward noninflammatory, spike-specific IgG4 antibodies after repeated SARS-CoV-2 mRNA vaccination. Sci Immunol. 2023 Jan 27;8(79):eade2798.
  24. Uversky VN, Redwan EM, Makis W, Rubio-Casillas A. IgG4 Antibodies Induced by Repeated Vaccination May Generate Immune Tolerance to the SARS-CoV-2 Spike Protein. Vaccines (Basel). 2023 May 17;11(5).
  25. Huijbers MG, Plomp JJ, van der Maarel SM, Verschuuren JJ. IgG4-mediated autoimmune diseases: a niche of antibody-mediated disorders. Ann N Y Acad Sci. 2018 Feb;1413(1):92–103.
  26. Rubio-Casillas A, Redwan EM, Uversky VN. Does SARS-CoV-2 Induce IgG4 Synthesis to Evade the Immune System? Biomolecules. 2023 Sep 1;13(9).
  27. Asa, CS. Contraception in Dogs and Cats. Vet Clin North Am Small Anim Pract. 2018 Jul;48(4):733–42.
  28. Toldo S, Bussani R, Nuzzi V, Bonaventura A, Mauro AG, Cannatà A, et al. Inflammasome formation in the lungs of patients with fatal COVID-19. Inflamm Res. 2021 Jan;70(1):7–10.
  29. Rodrigues TS, de Sá KSG, Ishimoto AY, Becerra A, Oliveira S, Almeida L, et al. Inflammasomes are activated in response to SARS-CoV-2 infection and are associated with COVID-19 severity in patients. J Exp Med. 2021 Mar 1;218(3).
  30. Gudbjartsson DF, Norddahl GL, Melsted P, Gunnarsdottir K, Holm H, Eythorsson E, et al. Humoral Immune Response to SARS-CoV-2 in Iceland. N Engl J Med. 2020 Oct 29;383(18):1724–34.
  31. Ge XY, Li JL, Yang XL, Chmura AA, Zhu G, Epstein JH, et al. Isolation and characterization of a bat SARS-like coronavirus that uses the ACE2 receptor. Nature. 2013 Nov 28;503(7477):535–8.
  32. Zhang T, Wu Q, Zhang Z. Probable Pangolin Origin of SARS-CoV-2 Associated with the COVID-19 Outbreak. Curr Biol. 2020 Apr 6;30(7):1346-1351.e2.
  33. Wölfel R, Corman VM, Guggemos W, Seilmaier M, Zange S, Müller MA, et al. Virological assessment of hospitalized patients with COVID-2019. Nature. 2020 May;581(7809):465–9.
  34. Cevik M, Bamford CGG, Ho A. COVID-19 pandemic-a focused review for clinicians. Clin Microbiol Infect. 2020 Jul;26(7):842–7.
  35. Cevik M, Tate M, Lloyd O, Maraolo AE, Schafers J, Ho A. SARS-CoV-2, SARS-CoV, and MERS-CoV viral load dynamics, duration of viral shedding, and infectiousness: a systematic review and meta-analysis. Lancet Microbe. 2021 Jan;2(1):e13–22.
  36. Shereen MA, Khan S, Kazmi A, Bashir N, Siddique R. COVID-19 infection: Origin, transmission, and characteristics of human coronaviruses. J Adv Res. 2020 Jul;24:91–8.
  37. Lam TTY, Jia N, Zhang YW, Shum MHH, Jiang JF, Zhu HC, et al. Identifying SARS-CoV-2-related coronaviruses in Malayan pangolins. Nature. 2020 Jul;583(7815):282–5.
  38. Ma J, Chen Y, Wu W, Chen Z. Structure and Function of N-Terminal Zinc Finger Domain of SARS-CoV-2 NSP2. Virol Sin. 2021 Oct;36(5):1104–12.
  39. Sarkar S, Runge B, Russell RW, Movellan KT, Calero D, Zeinalilathori S, et al. Atomic-Resolution Structure of SARS-CoV-2 Nucleocapsid Protein N-Terminal Domain. J Am Chem Soc. 2022 Jun 15;144(23):10543–55.
  40. Peng Y, Du N, Lei Y, Dorje S, Qi J, Luo T, et al. Structures of the SARS-CoV-2 nucleocapsid and their perspectives for drug design. EMBO J. 2020 Oct 15;39(20):e105938.
  41. Zhou P, Yang XL, Wang XG, Hu B, Zhang L, Zhang W, et al. A pneumonia outbreak associated with a new coronavirus of probable bat origin. Nature. 2020 Mar;579(7798):270–3.
  42. Chang C ke, Hou MH, Chang CF, Hsiao CD, Huang T huang. The SARS coronavirus nucleocapsid protein--forms and functions. Antiviral Res. 2014 Mar;103:39–50.
  43. Dinesh DC, Chalupska D, Silhan J, Koutna E, Nencka R, Veverka V, et al. Structural basis of RNA recognition by the SARS-CoV-2 nucleocapsid phosphoprotein. PLoS Pathog. 2020 Dec;16(12):e1009100.
  44. Liu C, Ginn HM, Dejnirattisai W, Supasa P, Wang B, Tuekprakhon A, et al. Reduced neutralization of SARS-CoV-2 B.1.617 by vaccine and convalescent serum. Cell. 2021 Aug 5;184(16):4220-4236.e13.
  45. Zinzula L, Basquin J, Bohn S, Beck F, Klumpe S, Pfeifer G, et al. High-resolution structure and biophysical characterization of the nucleocapsid phosphoprotein dimerization domain from the Covid-19 severe acute respiratory syndrome coronavirus 2. Biochem Biophys Res Commun. 2021 Jan 29;538:54–62.
  46. Weisblum Y, Schmidt F, Zhang F, DaSilva J, Poston D, Lorenzi JC, et al. Escape from neutralizing antibodies by SARS-CoV-2 spike protein variants. Elife. 2020 Oct 28;9.
  47. Eltayeb A, Al-Sarraj F, Alharbi M, Albiheyri R, Mattar E, Abu Zeid IM, et al. Overview of the SARS-CoV-2 nucleocapsid protein. Int J Biol Macromol. 2024 Mar;260(Pt 2):129523.
  48. Gori Savellini G, Anichini G, Gandolfo C, Cusi MG. SARS-CoV-2 N Protein Targets TRIM25-Mediated RIG-I Activation to Suppress Innate Immunity. Viruses. 2021 Jul 23;13(8).
  49. Zhao Y, Sui L, Wu P, Wang W, Wang Z, Yu Y, et al. A dual-role of SARS-CoV-2 nucleocapsid protein in regulating innate immune response. Signal Transduct Target Ther. 2021 Sep 1;6(1):331.
  50. Oh SJ, Shin OS. SARS-CoV-2 Nucleocapsid Protein Targets RIG-I-Like Receptor Pathways to Inhibit the Induction of Interferon Response. Cells. 2021 Mar 2;10(3).
  51. Zheng Y, Deng J, Han L, Zhuang MW, Xu Y, Zhang J, et al. SARS-CoV-2 NSP5 and N protein counteract the RIG-I signaling pathway by suppressing the formation of stress granules. Signal Transduct Target Ther. 2022 Jan 24;7(1):22.
  52. Wang S, Dai T, Qin Z, Pan T, Chu F, Lou L, et al. Targeting liquid-liquid phase separation of SARS-CoV-2 nucleocapsid protein promotes innate antiviral immunity by elevating MAVS activity. Nat Cell Biol. 2021 Jul;23(7):718–32.
  53. Xia H, Cao Z, Xie X, Zhang X, Chen JYC, Wang H, et al. Evasion of Type I Interferon by SARS-CoV-2. Cell Rep. 2020 Oct 6;33(1):108234.
  54. Lei X, Dong X, Ma R, Wang W, Xiao X, Tian Z, et al. Activation and evasion of type I interferon responses by SARS-CoV-2. Nat Commun. 2020 Jul 30;11(1):3810.
  55. Li JY, Liao CH, Wang Q, Tan YJ, Luo R, Qiu Y, et al. The ORF6, ORF8 and nucleocapsid proteins of SARS-CoV-2 inhibit type I interferon signaling pathway. Virus Res. 2020 Sep;286:198074.
  56. Chen K, Xiao F, Hu D, Ge W, Tian M, Wang W, et al. SARS-CoV-2 Nucleocapsid Protein Interacts with RIG-I and Represses RIG-Mediated IFN-β Production. Viruses. 2020 Dec 30;13(1):47.
  57. Mu J, Fang Y, Yang Q, Shu T, Wang A, Huang M, et al. SARS-CoV-2 N protein antagonizes type I interferon signaling by suppressing phosphorylation and nuclear translocation of STAT1 and STAT2. Cell Discov. 2020 Sep 15;6(1):65.
  58. Cui L, Wang H, Ji Y, Yang J, Xu S, Huang X, et al. The Nucleocapsid Protein of Coronaviruses Acts as a Viral Suppressor of RNA Silencing in Mammalian Cells. J Virol. 2015 Sep;89(17):9029–43.
  59. Mu J, Xu J, Zhang L, Shu T, Wu D, Huang M, et al. SARS-CoV-2-encoded nucleocapsid protein acts as a viral suppressor of RNA interference in cells. Sci China Life Sci. 2020 Sep;63(9):1413–6.
  60. Chen YM, Wei JL, Qin RS, Hou JP, Zang GC, Zhang GY, et al. Folic acid: a potential inhibitor against SARS-CoV-2 nucleocapsid protein. Pharm Biol. 2022 Dec;60(1):862–78.
  61. Visvabharathy L, Hanson B, Orban Z, Lim PH, Palacio N, Jain R, et al. Neuro-COVID long-haulers exhibit broad dysfunction in T cell memory generation and responses to vaccination. medRxiv [Internet]. 2021 Aug 9. Available online: http://www.ncbi.nlm.nih.gov/pubmed/34401886.
  62. Yang L, Xu Q, Yang B, Li J, Dong R, Da J, et al. IgG antibody titers against SARS-CoV-2 nucleocapsid protein correlate with the severity of COVID-19 patients. BMC Microbiol. 2021 Dec 18;21(1):351.
  63. Feng W, Xiang Y, Wu L, Chen Z, Li Q, Chen J, et al. Nucleocapsid protein of SARS-CoV-2 is a potential target for developing new generation of vaccine. J Clin Lab Anal. 2022 Jun;36(6):e24479.
  64. Sen SR, Sanders EC, Gabriel KN, Miller BM, Isoda HM, Salcedo GS, et al. Predicting COVID-19 Severity with a Specific Nucleocapsid Antibody plus Disease Risk Factor Score. mSphere. 2021 Apr 28;6(2).
  65. Voss C, Esmail S, Liu X, Knauer MJ, Ackloo S, Kaneko T, et al. Epitope-specific antibody responses differentiate COVID-19 outcomes and variants of concern. JCI Insight. 2021 Jul 8;6(13).
  66. Lyudovyk O, Kim JY, Qualls D, Hwee MA, Lin YH, Boutemine SR, et al. Impaired humoral immunity is associated with prolonged COVID-19 despite robust CD8 T cell responses. Cancer Cell. 2022 Jul 11;40(7):738-753.e5.
  67. Domingo López-Muñoz A, Kosik I, Holly J, Yewdell JW. Cell surface SARS-CoV-2 nucleocapsid protein modulates innate and adaptive immunity. Vol. 8, Sci. Adv. 2022.
  68. Hartley GE, Edwards ESJ, Aui PM, Varese N, Stojanovic S, McMahon J, et al. Rapid generation of durable B cell memory to SARS-CoV-2 spike and nucleocapsid proteins in COVID-19 and convalescence. Sci Immunol. 2020 Dec 18;5(54).
  69. Lee CY, Shah MK, Hoyos D, Solovyov A, Douglas M, Taur Y, et al. Prolonged SARS-CoV-2 Infection in Patients with Lymphoid Malignancies. Cancer Discov. 2022 Jan 1;12(1):62–73.
  70. Nelson RW, Chen Y, Venezia OL, Majerus RM, Shin DS, MGH COVID-19 Collection & Processing Team, et al. SARS-CoV-2 epitope-specific CD4+ memory T cell responses across COVID-19 disease severity and antibody durability. Sci Immunol. 2022 Jul 22;7(73):eabl9464.
  71. Martner A, Grauers Wiktorin H, Törnell A, Ringlander J, Arabpour M, Lindh M, et al. Transient and durable T cell reactivity after COVID-19. Proc Natl Acad Sci U S A. 2022 Jul 26;119(30):e2203659119.
  72. Bange EM, Han NA, Wileyto P, Kim JY, Gouma S, Robinson J, et al. CD8+ T cells contribute to survival in patients with COVID-19 and hematologic cancer. Nat Med. 2021 Jul;27(7):1280–9.
  73. Peng Y, Felce SL, Dong D, Penkava F, Mentzer AJ, Yao X, et al. An immunodominant NP105-113-B*07:02 cytotoxic T cell response controls viral replication and is associated with less severe COVID-19 disease. Nat Immunol. 2022 Jan;23(1):50–61.
  74. Nguyen THO, Rowntree LC, Petersen J, Chua BY, Hensen L, Kedzierski L, et al. CD8+ T cells specific for an immunodominant SARS-CoV-2 nucleocapsid epitope display high naive precursor frequency and TCR promiscuity. Immunity. 2021 May 11;54(5):1066-1082.e5.
  75. Lineburg KE, Grant EJ, Swaminathan S, Chatzileontiadou DSM, Szeto C, Sloane H, et al. CD8+ T cells specific for an immunodominant SARS-CoV-2 nucleocapsid epitope cross-react with selective seasonal coronaviruses. Immunity. 2021 May 11;54(5):1055-1065.e5.
  76. GREY HM, KUNKEL HG. H CHAIN SUBGROUPS OF MYELOMA PROTEINS AND NORMAL 7S GAMMA-GLOBULIN. J Exp Med. 1964 Aug 1;120(2):253–66.
  77. TERRY WD, FAHEY JL. SUBCLASSES OF HUMAN GAMMA-2-GLOBULIN BASED ON DIFFERENCES IN THE HEAVY POLYPEPTIDE CHAINS. Science. 1964 Oct 16;146(3642):400–1.
  78. Mayumi M, Kuritani T, Kubagawa H, Cooper MD. IgG subclass expression by human B lymphocytes and plasma cells: B lymphocytes precommitted to IgG subclass can be preferentially induced by polyclonal mitogens with T cell help. J Immunol. 1983 Feb;130(2):671–7.
  79. Atanackovic D, Avila S V., Lutfi F, de Miguel-Perez D, Fan X, Sanchez-Petitto G, et al. Deep dissection of the antiviral immune profile of patients with COVID-19. Commun Biol. 2021 Dec 16;4(1):1389.
  80. Chakraborty S, Gonzalez J, Edwards K, Mallajosyula V, Buzzanco AS, Sherwood R, et al. Proinflammatory IgG Fc structures in patients with severe COVID-19. Nat Immunol. 2021 Jan;22(1):67–73.
  81. Yates JL, Ehrbar DJ, Hunt DT, Girardin RC, Dupuis AP, Payne AF, et al. Serological analysis reveals an imbalanced IgG subclass composition associated with COVID-19 disease severity. Cell Rep Med. 2021 Jul 20;2(7):100329.
  82. Korobova ZR, Zueva E V, Arsentieva NA, Batsunov OK, Liubimova NE, Khamitova I V, et al. Changes in Anti-SARS-CoV-2 IgG Subclasses over Time and in Association with Disease Severity. Viruses. 2022 Apr 29;14(5).
  83. Moura AD, da Costa HHM, Correa VA, de S Lima AK, Lindoso JAL, De Gaspari E, et al. Assessment of avidity related to IgG subclasses in SARS-CoV-2 Brazilian infected patients. Sci Rep. 2021 Sep 3;11(1):17642.
  84. Yang X, Wang F, Zhang Y, Wang L, Antonenko S, Zhang S, et al. Comprehensive Analysis of the Therapeutic IgG4 Antibody Pembrolizumab: Hinge Modification Blocks Half Molecule Exchange In Vitro and In Vivo. J Pharm Sci. 2015 Dec;104(12):4002–14.
  85. Schuurman J, Van Ree R, Perdok GJ, Van Doorn HR, Tan KY, Aalberse RC. Normal human immunoglobulin G4 is bispecific: it has two different antigen-combining sites. Immunology. 1999 Aug;97(4):693–8.
  86. Buhre JS, Pongracz T, Künsting I, Lixenfeld AS, Wang W, Nouta J, et al. mRNA vaccines against SARS-CoV-2 induce comparably low long-term IgG Fc galactosylation and sialylation levels but increasing long-term IgG4 responses compared to an adenovirus-based vaccine. Front Immunol. 2022;13:1020844.
  87. Hartley GE, Fryer HA, Gill PA, Boo I, Bornheimer SJ, Hogarth PM, et al. Third dose COVID-19 mRNA vaccine enhances IgG4 isotype switching and recognition of Omicron subvariants by memory B cells after mRNA but not adenovirus priming. 2023.
  88. Yoshimura M, Sakamoto A, Ozuru R, Kurihara Y, Itoh R, Ishii K, et al. The appearance of anti-spike receptor binding domain immunoglobulin G4 responses after repetitive immunization with messenger RNA-based COVID-19 vaccines. Int J Infect Dis. 2024 Feb;139:1–5.
  89. Kiszel P, Sík P, Miklós J, Kajdácsi E, Sinkovits G, Cervenak L, et al. Class switch towards spike protein-specific IgG4 antibodies after SARS-CoV-2 mRNA vaccination depends on prior infection history. Sci Rep. 2023 Aug 13;13(1):13166.
  90. Akhtar M, Islam MR, Khaton F, Soltana UH, Jafrin SA, Rahman SIA, et al. Appearance of tolerance-induction and non-inflammatory SARS-CoV-2 spike-specific IgG4 antibodies after COVID-19 booster vaccinations. Front Immunol. 2023;14:1309997.
  91. Espino AM, Armina-Rodriguez A, Alvarez L, Ocasio-Malavé C, Ramos-Nieves R, Rodriguez Martinó EI, et al. The Anti-SARS-CoV-2 IgG1 and IgG3 Antibody Isotypes with Limited Neutralizing Capacity against Omicron Elicited in a Latin Population a Switch toward IgG4 after Multiple Doses with the mRNA Pfizer-BioNTech Vaccine. Viruses. 2024 Jan 26;16(2).
  92. Chiang HL, Liang KH, Lu RM, Kuo TW, Lin Y, Wu HC. Broadly neutralizing human antibodies against Omicron subvariants of SARS-CoV-2. J Biomed Sci. 2023 Jul 31;30(1):59.
  93. Zhou H, Møhlenberg M, Thakor JC, Tuli HS, Wang P, Assaraf YG, et al. Sensitivity to Vaccines, Therapeutic Antibodies, and Viral Entry Inhibitors and Advances To Counter the SARS-CoV-2 Omicron Variant. Clin Microbiol Rev. 2022 Sep 21;35(3).
  94. Starr TN, Greaney AJ, Stewart CM, Walls AC, Hannon WW, Veesler D, et al. Deep mutational scans for ACE2 binding, RBD expression, and antibody escape in the SARS-CoV-2 Omicron BA.1 and BA.2 receptor-binding domains. PLoS Pathog. 2022 Nov 18;18(11):e1010951.
  95. Xue S, Han Y, Wu F, Wang Q. Mutations in the SARS-CoV-2 spike receptor binding domain and their delicate balance between ACE2 affinity and antibody evasion. Protein Cell. 2024 May 28;15(6):403–18.
  96. Geng Q, Shi K, Ye G, Zhang W, Aihara H, Li F. Structural Basis for Human Receptor Recognition by SARS-CoV-2 Omicron Variant BA.1. J Virol. 2022 Apr 27;96(8).
  97. Liu L, Iketani S, Guo Y, Chan JFW, Wang M, Liu L, et al. Striking antibody evasion manifested by the Omicron variant of SARS-CoV-2. Nature. 2022 Feb 24;602(7898):676–81.
  98. Shah M, Woo HG. Omicron: A Heavily Mutated SARS-CoV-2 Variant Exhibits Stronger Binding to ACE2 and Potently Escapes Approved COVID-19 Therapeutic Antibodies. Front Immunol. 2021;12:830527.
  99. Renner TM, Stuible M, Cass B, Perret S, Guimond J, Lord-Dufour S, et al. Reduced cross-protective potential of Omicron compared to ancestral SARS-CoV-2 spike vaccines against potentially zoonotic coronaviruses. npj Viruses. 2024 Nov 21;2(1):58.
  100. Zhang J, Cai Y, Lavine CL, Peng H, Zhu H, Anand K, et al. Structural and functional impact by SARS-CoV-2 Omicron spike mutations. Cell Rep. 2022 Apr 26;39(4):110729.
  101. Dhawan M, Saied AA, Mitra S, Alhumaydhi FA, Emran T Bin, Wilairatana P. Omicron variant (B.1.1.529) and its sublineages: What do we know so far amid the emergence of recombinant variants of SARS-CoV-2? Biomed Pharmacother. 2022 Oct;154:113522.
  102. Dejnirattisai W, Huo J, Zhou D, Zahradník J, Supasa P, Liu C, et al. SARS-CoV-2 Omicron-B.1.1.529 leads to widespread escape from neutralizing antibody responses. Cell. 2022 Feb 3;185(3):467-484.e15.
  103. Planas D, Saunders N, Maes P, Guivel-Benhassine F, Planchais C, Buchrieser J, et al. Considerable escape of SARS-CoV-2 Omicron to antibody neutralization. Nature. 2022 Feb;602(7898):671–5.
  104. Wussow F, Kha M, Faircloth K, Nguyen VH, Iniguez A, Martinez J, et al. COH04S1 and beta sequence-modified vaccine protect hamsters from SARS-CoV-2 variants. iScience. 2022 Jun 17;25(6):104457.
  105. Chiuppesi F, Zaia JA, Frankel PH, Stan R, Drake J, Williams B, et al. Safety and immunogenicity of a synthetic multiantigen modified vaccinia virus Ankara-based COVID-19 vaccine (COH04S1): an open-label and randomised, phase 1 trial. Lancet Microbe. 2022 Apr;3(4):e252–64.
  106. Jiang W, Shi L, Cai L, Wang X, Li J, Li H, et al. A two-adjuvant multiantigen candidate vaccine induces superior protective immune responses against SARS-CoV-2 challenge. Cell Rep. 2021 Dec 14;37(11):110112.
  107. Jia Q, Bielefeldt-Ohmann H, Maison RM, Masleša-Galić S, Cooper SK, Bowen RA, et al. Replicating bacterium-vectored vaccine expressing SARS-CoV-2 Membrane and Nucleocapsid proteins protects against severe COVID-19-like disease in hamsters. NPJ Vaccines. 2021 Mar 30;6(1):47.
  108. Ahn JY, Lee J, Suh YS, Song YG, Choi YJ, Lee KH, et al. Safety and immunogenicity of two recombinant DNA COVID-19 vaccines containing the coding regions of the spike or spike and nucleocapsid proteins: an interim analysis of two open-label, non-randomised, phase 1 trials in healthy adults. Lancet Microbe. 2022 Mar;3(3):e173–83.
  109. Hajnik RL, Plante JA, Liang Y, Alameh MG, Tang J, Bonam SR, et al. Dual spike and nucleocapsid mRNA vaccination confer protection against SARS-CoV-2 Omicron and Delta variants in preclinical models. Sci Transl Med. 2022 Sep 14;14(662):eabq1945.
  110. Castro JT, Azevedo P, Fumagalli MJ, Hojo-Souza NS, Salazar N, Almeida GG, et al. Promotion of neutralizing antibody-independent immunity to wild-type and SARS-CoV-2 variants of concern using an RBD-Nucleocapsid fusion protein. Nat Commun. 2022 Aug 17;13(1):4831.
  111. Afkhami S, D’Agostino MR, Zhang A, Stacey HD, Marzok A, Kang A, et al. Respiratory mucosal delivery of next-generation COVID-19 vaccine provides robust protection against both ancestral and variant strains of SARS-CoV-2. Cell. 2022 Mar 3;185(5):896-915.e19.
  112. Wang CY, Hwang KP, Kuo HK, Peng WJ, Shen YH, Kuo BS, et al. A multitope SARS-CoV-2 vaccine provides long-lasting B cell and T cell immunity against Delta and Omicron variants. J Clin Invest. 2022 May 16;132(10).
  113. Schur, PH. IgG subclasses--a review. Ann Allergy. 1987 Feb;58(2):89–96, 99.
  114. Hui, DS. Hybrid immunity and strategies for COVID-19 vaccination. Lancet Infect Dis. 2023 Jan;23(1):2–3.
  115. Gelderloos AT, Verheul MK, Middelhof I, de Zeeuw-Brouwer ML, van Binnendijk RS, Buisman AM, et al. Repeated COVID-19 mRNA vaccination results in IgG4 class switching and decreased NK cell activation by S1-specific antibodies in older adults. Immunity & Ageing. 2024 Sep 14;21(1):63.
  116. Chiuppesi F, Nguyen VH, Park Y, Contreras H, Karpinski V, Faircloth K, et al. Synthetic multiantigen MVA vaccine COH04S1 protects against SARS-CoV-2 in Syrian hamsters and non-human primates. NPJ Vaccines. 2022 Jan 21;7(1):7.
Table 2. Total IgG in vaccinated and non-vaccinated (X±SD).
Vaccinated Non-vaccinated (control)
Sample number Mean (X) Standard Deviation (SD) Gender Sample number Mean (X) Standard Deviation (SD) Gender
#1 2.250 0.042 Female #1 0.512 0.167 Female
#2 2.336 0.089 Male #2 0.752 0.116 Male
#3 2.319 0.062 Female #3 0.775 0.139 Female
#4 2.229 0.030 Female #4 0.586 0.178 Female
#5 2.258 0.011 Female #5 0.819 0.130 Female
#6 2.183 0.080 Male #6 0.708 0.083 Female
#7 2.10 0.25 Female #7 0.549 0.116 Male
#8 2.01 0.35 Female #8 0.812 0.113 Female
#9 2.31 0.10 Female #9 0.715 0.116 Female
#10 2.28 0.15 Female #10 0.586 0.178 Female
#11 2.178 0.096 Male #11 0.756 0.160 Male
#12 2.306 0.011 Male #12 0.660 0.195 Female
#13 2.10 0.23 Male #13 0.745 0.214 Female
#14 2.16 0.15 Female #14 0.727 0.112 Male
#15 1.88 0.26 Female #15 0.518 0.001 Male
#16 0.84 0.56 Female #16 0.512 0.167 Male
#17 2.451 0.014 Male #17 0.752 0.116 Female
#18 1.70 0.12 Male #18 0.775 0.139 Male
#19 2.412 0.048 Male #19 0.586 0.178 Female
#20 2.592 0.016 Male #20 0.819 0.130 Male
#21 2.434 0.100 Male #21 0.708 0.083 Female
#22 2.486 0.023 Male #22 0.549 0.116 Male
#23 2.47 0.11 Male #23 0.812 0.113 Female
#24 2.441 0.032 Male #24 0.715 0.116 Female
#25 2.45 0.10 Male #25 0.586 0.178 Male
#26 2.363 0.034 Female #26 0.756 0.160 Male
#27 2.501 0.056 Female #27 0.660 0.195 Male
#28 1.71 0.42 Female #28 0.745 0.214 Female
#29 1.4 1.2 Male #29 0.727 0.112 Male
#30 1.88 0.26 Male #30 0.624 0.001 Female
Table 3. Anti-N IgG1 among vaccinated and non-vaccinated (X±SD).
Vaccinated Non-vaccinated (control)
Sample number Mean (X) Standard Deviation (SD) Gender Sample number Mean (X) Standard Deviation (SD) Gender
#1 0.1443 0.0083 Female #1 0.0663 0.0021 Female
#2 0.2797 0.0108 Male #2 0.1203 0.0065 Male
#3 1.0117 0.0175 Female #3 0.1120 0.0312 Female
#4 1.5940 0.0035 Female #4 0.0653 0.0035 Female
#5 1.2063 0.0172 Female #5 0.0547 0.0021 Female
#6 0.8613 0.0266 Male #6 0.0753 0.0023 Female
#7 0.4510 0.0061 Female #7 0.0530 0.0010 Male
#8 0.6750 0.0115 Female #8 0.1450 0.0092 Female
#9 0.1003 0.0029 Female #9 0.0963 0.0042 Female
#10 1.1467 0.0382 Female #10 0.0887 0.0029 Female
#11 1.7470 0.0682 Male #11 0.1003 0.0251 Male
#12 0.9363 0.0064 Male #12 0.0677 0.0038 Female
#13 0.5203 0.0210 Male #13 0.3127 0.0129 Female
#14 0.8817 0.0278 Female #14 0.0673 0.0029 Male
#15 0.5375 0.0078 Female #15 0.2680 0.0212 Male
#16 1.4877 0.0083 Female #16 0.2603 0.0285 Male
#17 1.3603 0.0641 Male #17 0.0613 0.0023 Female
#18 0.5377 0.0818 Male #18 0.3517 0.0619 Male
#19 0.0500 0.0028 Male #19 0.0773 0.0021 Female
#20 2.3477 0.3050 Male #20 0.0853 0.0040 Male
#21 1.1397 0.3751 Male #21 0.2090 0.0215 Female
#22 1.7917 0.1093 Male #22 0.1383 0.0169 Male
#23 1.7467 0.0587 Male #23 0.0783 0.0114 Female
#24 0.7747 0.5534 Male #24 0.2033 0.1409 Female
#25 1.4160 0.1129 Male #25 0.125 0.065 Male
#26 1.8209 0.0665 Female #26 0.128 0.030 Male
#27 0.8823 0.4975 Female #27 0.073 0.005 Male
#28 1.2237 0.4916 Female #28 0.064 0.0 Female
#29 0.3290 0.3741 Male #29 0.373 0.048 Male
#30 0.5275 0.0035 Male #30 0.061 0.004 Female
Table 4. Anti-N IgG2 among vaccinated and non-vaccinated (X±SD).
Vaccinated Non-vaccinated (control)
Sample number Mean (X) Standard Deviation (SD) Gender Sample number Mean (X) Standard Deviation (SD) Gender
#1 0.0583 0.0012 Female #1 0.062 0.0028 Female
#2 0.059 0.0016 Male #2 0.0537 0.0005 Male
#3 0.0593 0.0017 Female #3 0.0533 0.0026 Female
#4 0.0553 0.0034 Female #4 0.0507 0.0005 Female
#5 0.0537 0.0005 Female #5 0.0523 0.0029 Female
#6 0.0563 0.0050 Male #6 0.0543 0.0012 Female
#7 0.0597 0.0123 Female #7 0.0503 0.0029 Male
#8 0.0583 0.0060 Female #8 0.0517 0.0033 Female
#9 0.0547 0.0054 Female #9 0.0613 0.0069 Female
#10 0.0503 0.0024 Female #10 0.0513 0.0021 Female
#11 0.0533 0.0061 Male #11 0.0507 0.0025 Male
#12 0.053 0.0029 Male #12 0.078 0.0439 Female
#13 0.0500 0.0014 Male #13 0.0497 0.0005 Female
#14 0.0507 0.0025 Female #14 0.074 0.0325 Male
#15 0.0525 0.0005 Female #15 0.054 0.0030 Male
#16 0.0513 0.0017 Female #16 0.0527 0.0017 Male
#17 0.0510 0.0022 Male #17 0.07 0.0283 Female
#18 0.0527 0.0033 Male #18 0.1997 0.2124 Male
#19 0.0503 0.0012 Male #19 0.2060 0.2221 Female
#20 0.0527 0.0066 Male #20 0.0497 0.0012 Male
#21 0.0500 0.0014 Male #21 0.061 0.0136 Female
#22 0.0517 0.0012 Male #22 0.055 0.0043 Male
#23 0.062 0.0008 Male #23 0.0527 0.0034 Female
#24 0.0527 0.0017 Male #24 0.0503 0.0029 Female
#25 0.0603 0.0111 Male #25 0.0527 0.0029 Male
#26 0.0570 0.0042 Female #26 0.053 0.0022 Male
#27 0.0550 0.0036 Female #27 0.051 0.0008 Male
#28 0.0587 0.0012 Female #28 0.0537 0.0025 Female
#29 0.0597 0.0019 Male #29 0.0553 0.0019 Male
#30 0.059 0.0010 Male #30 0.063 0.0010 Female
Table 5. Anti-N IgG3 among vaccinated and non-vaccinated (X±SD).
Vaccinated Non-vaccinated (control)
Sample number Mean (X) Standard Deviation (SD) Gender Sample number Mean (X) Standard Deviation (SD) Gender
#1 0.0527 0.0019 Female #1 0.052 0.00163 Female
#2 0.0477 0.0012 Male #2 0.05067 0.00047 Male
#3 0.0493 0.0040 Female #3 0.158 0.03590 Female
#4 0.0500 0.0022 Female #4 0.04933 0.00170 Female
#5 0.0507 0.0012 Female #5 0.045 0.00082 Female
#6 0.0550 0.0024 Male #6 0.09833 0.00974 Female
#7 0.0557 0.0005 Female #7 0.04767 0.00189 Male
#8 0.0520 0.0022 Female #8 0.054 0.00432 Female
#9 0.0507 0.0012 Female #9 0.07633 0.00386 Female
#10 0.0477 0.0005 Female #10 0.05133 0.00047 Female
#11 0.0547 0.0038 Male #11 0.04733 0.00170 Male
#12 0.0473 0.0019 Male #12 0.046 0.00082 Female
#13 0.0603 0.0005 Male #13 0.139 0.01431 Female
#14 0.0470 0.0014 Female #14 0.04733 0.00094 Male
#15 0.0480 0.0010 Female #15 0.0485 0.00050 Male
#16 0.0690 0.0065 Female #16 0.061 0.00374 Male
#17 0.0643 0.0026 Male #17 0.06133 0.00544 Female
#18 0.0753 0.0070 Male #18 0.06533 0.00411 Male
#19 0.0680 0.0102 Male #19 0.054 0.00163 Female
#20 0.0703 0.0097 Male #20 0.06033 0.00170 Male
#21 0.0577 0.0049 Male #21 0.059 0.00216 Female
#22 0.0537 0.0033 Male #22 0.056 0.00141 Male
#23 0.0570 0.0059 Male #23 0.05533 0.00249 Female
#24 0.0500 0.0036 Male #24 0.06367 0.00713 Female
#25 0.0633 0.0062 Male #25 0.05767 0.00236 Male
#26 0.0557 0.0033 Female #26 0.052 0.0057 Male
#27 0.0660 0.0029 Female #27 0.0553 0.0050 Male
#28 0.0537 0.0005 Female #28 0.052 0.0022 Female
#29 0.0540 0.0008 Male #29 0.0507 0.0029 Male
#30 0.0620 0.0090 Male #30 0.0515 0.0045 Female
Table 6. Anti-N IgG4 among vaccinated and non-vaccinated (X±SD).
Vaccinated Non-vaccinated (control)
Sample number Mean (X) Standard Deviation (SD) Gender Sample number Mean (X) Standard Deviation (SD) Gender
#1 0.049 0.00082 Female #1 0.046 0.00082 Female
#2 0.050 0.00283 Male #2 0.04467 0.00125 Male
#3 0.048 0.00082 Female #3 0.04567 0.00386 Female
#4 0.048 0.00216 Female #4 0.04267 0.00309 Female
#5 0.04833 0.00094 Female #5 0.04333 0.00125 Female
#6 0.05067 0.00125 Male #6 0.05233 0.00189 Female
#7 0.05133 0.00205 Female #7 0.04467 0.00189 Male
#8 0.04667 0.00262 Female #8 0.046 0.00163 Female
#9 0.04833 0.00613 Female #9 0.04767 0.00330 Female
#10 0.046 0.00141 Female #10 0.04467 0.00205 Female
#11 0.050 0.00356 Male #11 0.043 0.00141 Male
#12 0.04633 0.00170 Male #12 0.04433 0.00125 Female
#13 0.05133 0.00236 Male #13 0.06167 0.00450 Female
#14 0.050 0.00455 Female #14 0.04833 0.00249 Male
#15 0.047 0.001 Female #15 0.05 0.002 Male
#16 0.04767 0.00047 Female #16 0.054 0.00163 Male
#17 0.10133 0.00309 Male #17 0.049 0.00141 Female
#18 0.04733 0.00189 Male #18 0.04533 0.00125 Male
#19 0.05967 0.00047 Male #19 0.04533 0.00205 Female
#20 0.051 0.00082 Male #20 0.04367 0.00094 Male
#21 0.048 0.00163 Male #21 0.04567 0.00094 Female
#22 0.04467 0.00047 Male #22 0.04433 0.00125 Male
#23 0.04767 0.00094 Male #23 0.04467 0.00094 Female
#24 0.04567 0.00125 Male #24 0.048 0.00374 Female
#25 0.050 0.00141 Male #25 0.04667 0.00047 Male
#26 0.04633 0.00094 Female #26 0.043 0.00082 Male
#27 0.05867 0.00047 Female #27 0.04967 0.00309 Male
#28 0.04633 0.00047 Female #28 0.04733 0.00125 Female
#29 0.04467 0.00125 Male #29 0.04667 0.00047 Male
#30 0.046 0.001 Male #30 0.0455 0.0005 Female
Table 7. Affinity of IgG1 in vaccinated and non-vaccinated (X±SD).
Vaccinated Non-vaccinated (control)
Sample number Mean (X) Standard Deviation (SD) Gender Sample number Mean (X) Standard Deviation (SD) Gender
#1 0.0633 0.0021 Female #1 0.073 0.0028 Female
#2 0.1177 0.0050 Male #2 0.2763 0.0109 Male
#3 0.1873 0.0005 Female #3 0.0883 0.0025 Female
#4 0.1987 0.0049 Female #4 0.1123 0.0012 Female
#5 0.0503 0.0012 Female #5 0.0713 0.0012 Female
#6 0.055 0.0008 Male #6 0.0457 0.0033 Female
#7 0.0963 0.0041 Female #7 0.1743 0.0033 Male
#8 0.1623 0.0024 Female #8 0.1457 0.0026 Female
#9 0.0477 0.0009 Female #9 0.1467 0.0042 Female
#10 0.0953 0.0048 Female #10 0.125 0.0071 Female
#11 0.1203 0.0025 Male #11 0.052 0.0016 Male
#12 0.2263 0.0066 Male #12 0.0937 0.0017 Female
#13 0.0527 0.0005 Male #13 0.0970 0.0029 Female
#14 0.1403 0.0005 Female #14 0.1023 0.0062 Male
#15 0.2040 0.0010 Female #15 0.087 0.0 Male
#16 0.3347 0.0100 Female #16 0.2747 0.0144 Male
#17 0.2223 0.0165 Male #17 0.084 0.0029 Female
#18 0.108 0.0062 Male #18 0.1393 0.0059 Male
#19 0.108 0.0057 Male #19 0.0633 0.0012 Female
#20 0.1993 0.0198 Male #20 0.075 0.0033 Male
#21 0.2063 0.0009 Male #21 0.0663 0.0021 Female
#22 0.139 0.0067 Male #22 0.066 0.0029 Male
#23 0.1303 0.0012 Male #23 0.0457 0.0012 Female
#24 0.0777 0.0017 Male #24 0.123 0.0024 Female
#25 0.1837 0.0029 Male #25 0.1467 0.0045 Male
#26 0.0757 0.0009 Female #26 0.1547 0.0054 Male
#27 0.3237 0.0039 Female #27 0.0833 0.0046 Male
#28 0.1863 0.0060 Female #28 0.0553 0.0019 Female
#29 0.0507 0.0029 Male #29 0.3257 0.0017 Male
#30 0.0685 0.0015 Male #30 0.046 0.001 Female
Table 8. Affinity of IgG2 in vaccinated and non-vaccinated (X±SD).
Vaccinated Non-vaccinated (control)
Sample number Mean (X) Standard Deviation (SD) Gender Sample number Mean (X) Standard Deviation (SD) Gender
#1 0.055 0.00216 Female #1 0.05767 0.00287 Female
#2 0.0523 0.00249 Male #2 0.050 0.00082 Male
#3 0.0543 0.00125 Female #3 0.05433 0.00047 Female
#4 0.0513 0.00047 Female #4 0.054 0.00163 Female
#5 0.0480 0.00141 Female #5 0.04933 0.00047 Female
#6 0.0503 0.00125 Male #6 0.05067 0.00047 Female
#7 0.0587 0.00125 Female #7 0.04767 0.00170 Male
#8 0.0663 0.00236 Female #8 0.05067 0.00125 Female
#9 0.0517 0.00125 Female #9 0.049 0.00082 Female
#10 0.0497 0.00094 Female #10 0.04833 0.00094 Female
#11 0.0483 0.00094 Male #11 0.051 0.00163 Male
#12 0.0537 0.00094 Male #12 0.04767 0.00205 Female
#13 0.048 0.0 Male #13 0.04833 0.00170 Female
#14 0.04767 0.00047 Female #14 0.0483 0.0025 Male
#15 0.053 0.002 Female #15 0.0465 0.0007 Male
#16 0.04933 0.00125 Female #16 0.0617 0.0021 Male
#17 0.05267 0.00094 Male #17 0.0487 0.0012 Female
#18 0.052 0.00082 Male #18 0.052 0.0017 Male
#19 0.04767 0.00125 Male #19 0.056 0.0010 Female
#20 0.04933 0.00205 Male #20 0.0473 0.0012 Male
#21 0.051 0.00163 Male #21 0.0517 0.0025 Female
#22 0.04767 0.00125 Male #22 0.0447 0.0015 Male
#23 0.047 0.00245 Male #23 0.062 0.0036 Female
#24 0.04733 0.00170 Male #24 0.0517 0.0029 Female
#25 0.04867 0.00125 Male #25 0.0527 0.0015 Male
#26 0.04667 0.00125 Female #26 0.0467 0.0006 Male
#27 0.05033 0.00170 Female #27 0.050 0.0020 Male
#28 0.051 0.00082 Female #28 0.0577 0.0021 Female
#29 0.047 0.00082 Male #29 0.0500 0.0016 Male
#30 0.0515 0.00050 Male #30 0.0605 0.0005 Female
Table 9. Affinity of IgG3 in vaccinated and non-vaccinated (X±SD).
Vaccinated Non-vaccinated (control)
Sample number Mean (X) Standard Deviation (SD) Gender Sample number Mean (X) Standard Deviation (SD) Gender
#1 0.04767 0.00170 Female #1 0.0523 0.00094 Female
#2 0.048 0.00141 Male #2 0.053 0.00082 Male
#3 0.04833 0.00094 Female #3 0.050 0.0 Female
#4 0.052 0.00408 Female #4 0.0633 0.00047 Female
#5 0.04733 0.00249 Female #5 0.0453 0.00094 Female
#6 0.047 0.00163 Male #6 0.049 0.00163 Female
#7 0.06767 0.00386 Female #7 0.0447 0.00047 Male
#8 0.04667 0.00047 Female #8 0.0467 0.00125 Female
#9 0.045 0.00082 Female #9 0.0587 0.00125 Female
#10 0.04533 0.00125 Female #10 0.046 0.0 Female
#11 0.05833 0.00125 Male #11 0.044 0.00163 Male
#12 0.06533 0.00125 Male #12 0.0433 0.00094 Female
#13 0.04567 0.00125 Male #13 0.0443 0.00170 Female
#14 0.04533 0.00047 Female #14 0.0453 0.00094 Male
#15 0.049 0.0 Female #15 0.047 0.0 Male
#16 0.04867 0.00047 Female #16 0.0527 0.00125 Male
#17 0.04833 0.00047 Male #17 0.0513 0.00047 Female
#18 0.04733 0.00125 Male #18 0.0603 0.00125 Male
#19 0.04867 0.00125 Male #19 0.068 0.00163 Female
#20 0.04933 0.00170 Male #20 0.0473 0.00125 Male
#21 0.04767 0.00047 Male #21 0.0477 0.00094 Female
#22 0.04833 0.00094 Male #22 0.047 0.00082 Male
#23 0.04867 0.00249 Male #23 0.0527 0.00125 Female
#24 0.046 0.00082 Male #24 0.0497 0.00125 Female
#25 0.048 0.00141 Male #25 0.0477 0.00094 Male
#26 0.047 0.00163 Female #26 0.045 0.00082 Male
#27 0.04767 0.00094 Female #27 0.0447 0.00047 Male
#28 0.04733 0.00125 Female #28 0.0463 0.00094 Female
#29 0.04733 0.00094 Male #29 0.04767 0.00125 Male
#30 0.046 0.0 Male #30 0.05 0.0 Female
Table 10. Affinity of IgG4 in vaccinated and non-vaccinated (X±SD).
Vaccinated Non-vaccinated (control)
Sample number Mean (X) Standard Deviation (SD) Gender Sample number Mean (X) Standard Deviation (SD) Gender
#1 0.063 0.00082 Female #1 0.058 0.00163 Female
#2 0.05367 0.00047 Male #2 0.05533 0.00125 Male
#3 0.0553 0.00094 Female #3 0.058 0.00141 Female
#4 0.0573 0.0017 Female #4 0.054 0.00141 Female
#5 0.0547 0.0019 Female #5 0.0547 0.0012 Female
#6 0.0647 0.00047 Male #6 0.0533 0.0009 Female
#7 0.0567 0.0017 Female #7 0.0517 0.0005 Male
#8 0.053 0.0014 Female #8 0.055 0.0008 Female
#9 0.0533 0.0012 Female #9 0.0523 0.0017 Female
#10 0.0553 0.0012 Female #10 0.0513 0.0012 Female
#11 0.059 0.0014 Male #11 0.0490 0.0008 Male
#12 0.0527 0.00094 Male #12 0.0473 0.0021 Female
#13 0.0507 0.00047 Male #13 0.5057 0.0082 Female
#14 0.054 0.0022 Female #14 0.0477 0.0009 Male
#15 0.052 0.001 Female #15 0.049 0.0 Male
#16 0.0553 0.0012 Female #16 0.0597 0.0005 Male
#17 0.144 0.0041 Male #17 0.0537 0.0005 Female
#18 0.0543 0.00047 Male #18 0.0517 0.0005 Male
#19 0.06467 0.00047 Male #19 0.052 0.0024 Female
#20 0.05767 0.00170 Male #20 0.0507 0.0012 Male
#21 0.05567 0.00094 Male #21 0.0513 0.0012 Female
#22 0.05233 0.00125 Male #22 0.0513 0.0005 Male
#23 0.054 0.00141 Male #23 0.0507 0.0019 Female
#24 0.053 0.00141 Male #24 0.0527 0.0012 Female
#25 0.05833 0.00205 Male #25 0.0517 0.0009 Male
#26 0.05367 0.00047 Female #26 0.0493 0.0012 Male
#27 0.06433 0.00047 Female #27 0.0493 0.00047 Male
#28 0.05233 0.00047 Female #28 0.0500 0.00141 Female
#29 0.052 0.00141 Male #29 0.0520 0.00082 Male
#30 0.052 0.001 Male #30 0.0495 0.0005 Female
Disclaimer/Publisher’s Note: The statements, opinions and data contained in all publications are solely those of the individual author(s) and contributor(s) and not of MDPI and/or the editor(s). MDPI and/or the editor(s) disclaim responsibility for any injury to people or property resulting from any ideas, methods, instructions or products referred to in the content.
Copyright: This open access article is published under a Creative Commons CC BY 4.0 license, which permit the free download, distribution, and reuse, provided that the author and preprint are cited in any reuse.
Prerpints.org logo

Preprints.org is a free preprint server supported by MDPI in Basel, Switzerland.

Subscribe

Disclaimer

Terms of Use

Privacy Policy

Privacy Settings

© 2025 MDPI (Basel, Switzerland) unless otherwise stated