
Submitted:
05 February 2025
Posted:
06 February 2025
You are already at the latest version
Preprints on COVID-19 and SARS-CoV-2
Abstract
Severe acute respiratory syndrome coronavirus 2 (SARS-CoV-2) is responsible for the present global coronavirus disease 2019 (Covid-19) which can be transmitted by aerosols and droplets. Aerosol transmission can be controlled by maintaining the proper level of dust, temperature, humidity, etc., and designing the ventilation system properly to minimize the transmission. This experiment examined the efficacy of modified air ventilation arrangements to decrease the infection risk in isolation rooms during COVID-19-type pandemics. Poor airflow distribution in traditional designs often results in cross-contamination, which threatens patient protection. Computational Fluid Dynamics (CFD) simulations and experimental validations were employed to evaluate the airflow patterns under different ventilation modifications. The results indicate that “Modification 2, ” with an inlet on the ceiling and outlet vents behind each bed, achieves optimal airflow by positioning the inlets on the ceiling and outlets behind each bed, preventing vortex formation, and minimizing contaminant spread between patients. This configuration significantly reduces the risk of infection transmission, as air exits the room faster compared to conventional designs. "Modification 2 enhances isolation room safety by reducing infection risk, offering valuable insights for hospital design and improved infection control policies.
Keywords:
Indoor Airflow Optimization
; Hospital Infection Control
; Contaminant Dispersion Modeling
; CFD Simulation
1. Introduction
Coronavirus disease 2019 (COVID-19) has emerged as a global pandemic, creating global concern over the mitigation of the transmission of Severe Acute Respiratory Syndrome Coronavirus 2 (SARS-CoV-2) (Salamone et al. 2021). The main interpersonal SARS-CoV-2 transmission routes, according to the World Health Organization (WHO), are droplet and direct contact (World Health Organization 2021). Studies have also shown that it is impossible to ignore the aerosol transmission route. In particular, tiny droplet nuclei (containing the virus) generated by exhaling, coughing, or sneezing can generate suspended aerosols that travel further through the air and cause illnesses (Morawska et al. 2020, Bak et al. 2021, Xu et al. 2022). To minimize transmission, it is possible to regulate the level of pollution, temperature, humidity, ventilation, improved hygiene, sanitization, wearing masks, and using personal safety equipment (PPE) by medical and sanitary staff, among other factors. In addition, there is sufficient evidence to show a connection between ventilation techniques and the spread of nosocomial diseases inside buildings (Li et al. 2007). Ventilation is a key approach for eliminating indoor contaminants (such as viruses) and reducing exposure risks, especially in public areas, such as offices (Xu et al. 2020). According to a study by Li et al., airflow patterns and ventilation rates have a significant impact on how quickly infectious diseases propagate through air (Li et al. 2007).
To prevent and manage infectious diseases, it is crucial to study the spread of contamination in intensive care units (AK Sahu et al. 2018, Verma et al. 2018). Techniques for air-conditioning systems to enhance ventilation rates during the COVID-19 outbreak have been published by the American Society of Heating, Refrigerating, and Air Conditioning Engineers (ASHRAE) (ASHRAE 2022). The Federation of European Heating, Ventilation, and Air Conditioning Associations (REHVA) recommends a higher ventilation rate in particular circumstances, particularly in the occupant activity zone (REHVA 2020). All of these solutions offer crucial advice for ventilation systems to reduce airborne transmission. However, increasing the ventilation rate also results in an increased energy use for ventilation (Cao and Ren 2018). To guarantee a probability of infection less than 1 percent within 0.25 hours, according to Dai et al., utilizing the minimum ventilation rate would result in at least a two-fold increase in energy consumption. Instead, the ventilation rate should be 100-350 m3 per hour for each person in a restricted environment (Dai and Zhao 2020). The creation of effective ventilation systems and modes can help to reduce the spread of infectious diseases and increase the effectiveness of energy conservation from the perspective of airflow patterns (Motamedi et al. 2022). Yang used mixing and displacement ventilation techniques to examine the air quality in a four-bed hospital ward (Yang 2013). In this study, it was discovered that the latter technique, which calls for a larger air supply, offers better infection control and improves the quality of the air inhaled because it reduces the age of the air. Therefore, this technique should be used as the primary method of ventilation in isolation rooms.
Even though extensive research exists on airborne infection spread, most studies focus on isolated parameters like particulate tracking and fluid interactions. However, there is a critical lack of comprehensive studies incorporating participatory characteristics. Given the rapid spread of emerging viruses and the strain on isolation rooms, it is essential to reassess ventilation design principles to mitigate cross-contamination risks for patients and healthcare workers. This study aims to numerically model an air ventilation system in an isolation room to evaluate its effectiveness in reducing airborne infection transmission.
A five-bed isolation room was selected for numerical modeling and CFD simulations. The study analyzes airflow patterns, velocity distribution, and airborne contaminant spread. The ventilation system is benchmarked with air supplied from the north wall and exhausted through the south wall to optimize infection control.
This study proposes that modifying inlet and outlet configurations in ventilation systems can significantly improve airflow dynamics and reduce contamination. It outlines the theoretical framework, methodology, and a detailed analysis of simulation results, validated through experiments. The findings provide insights into optimal isolation room design and offer practical recommendations for enhancing infection control in healthcare settings.
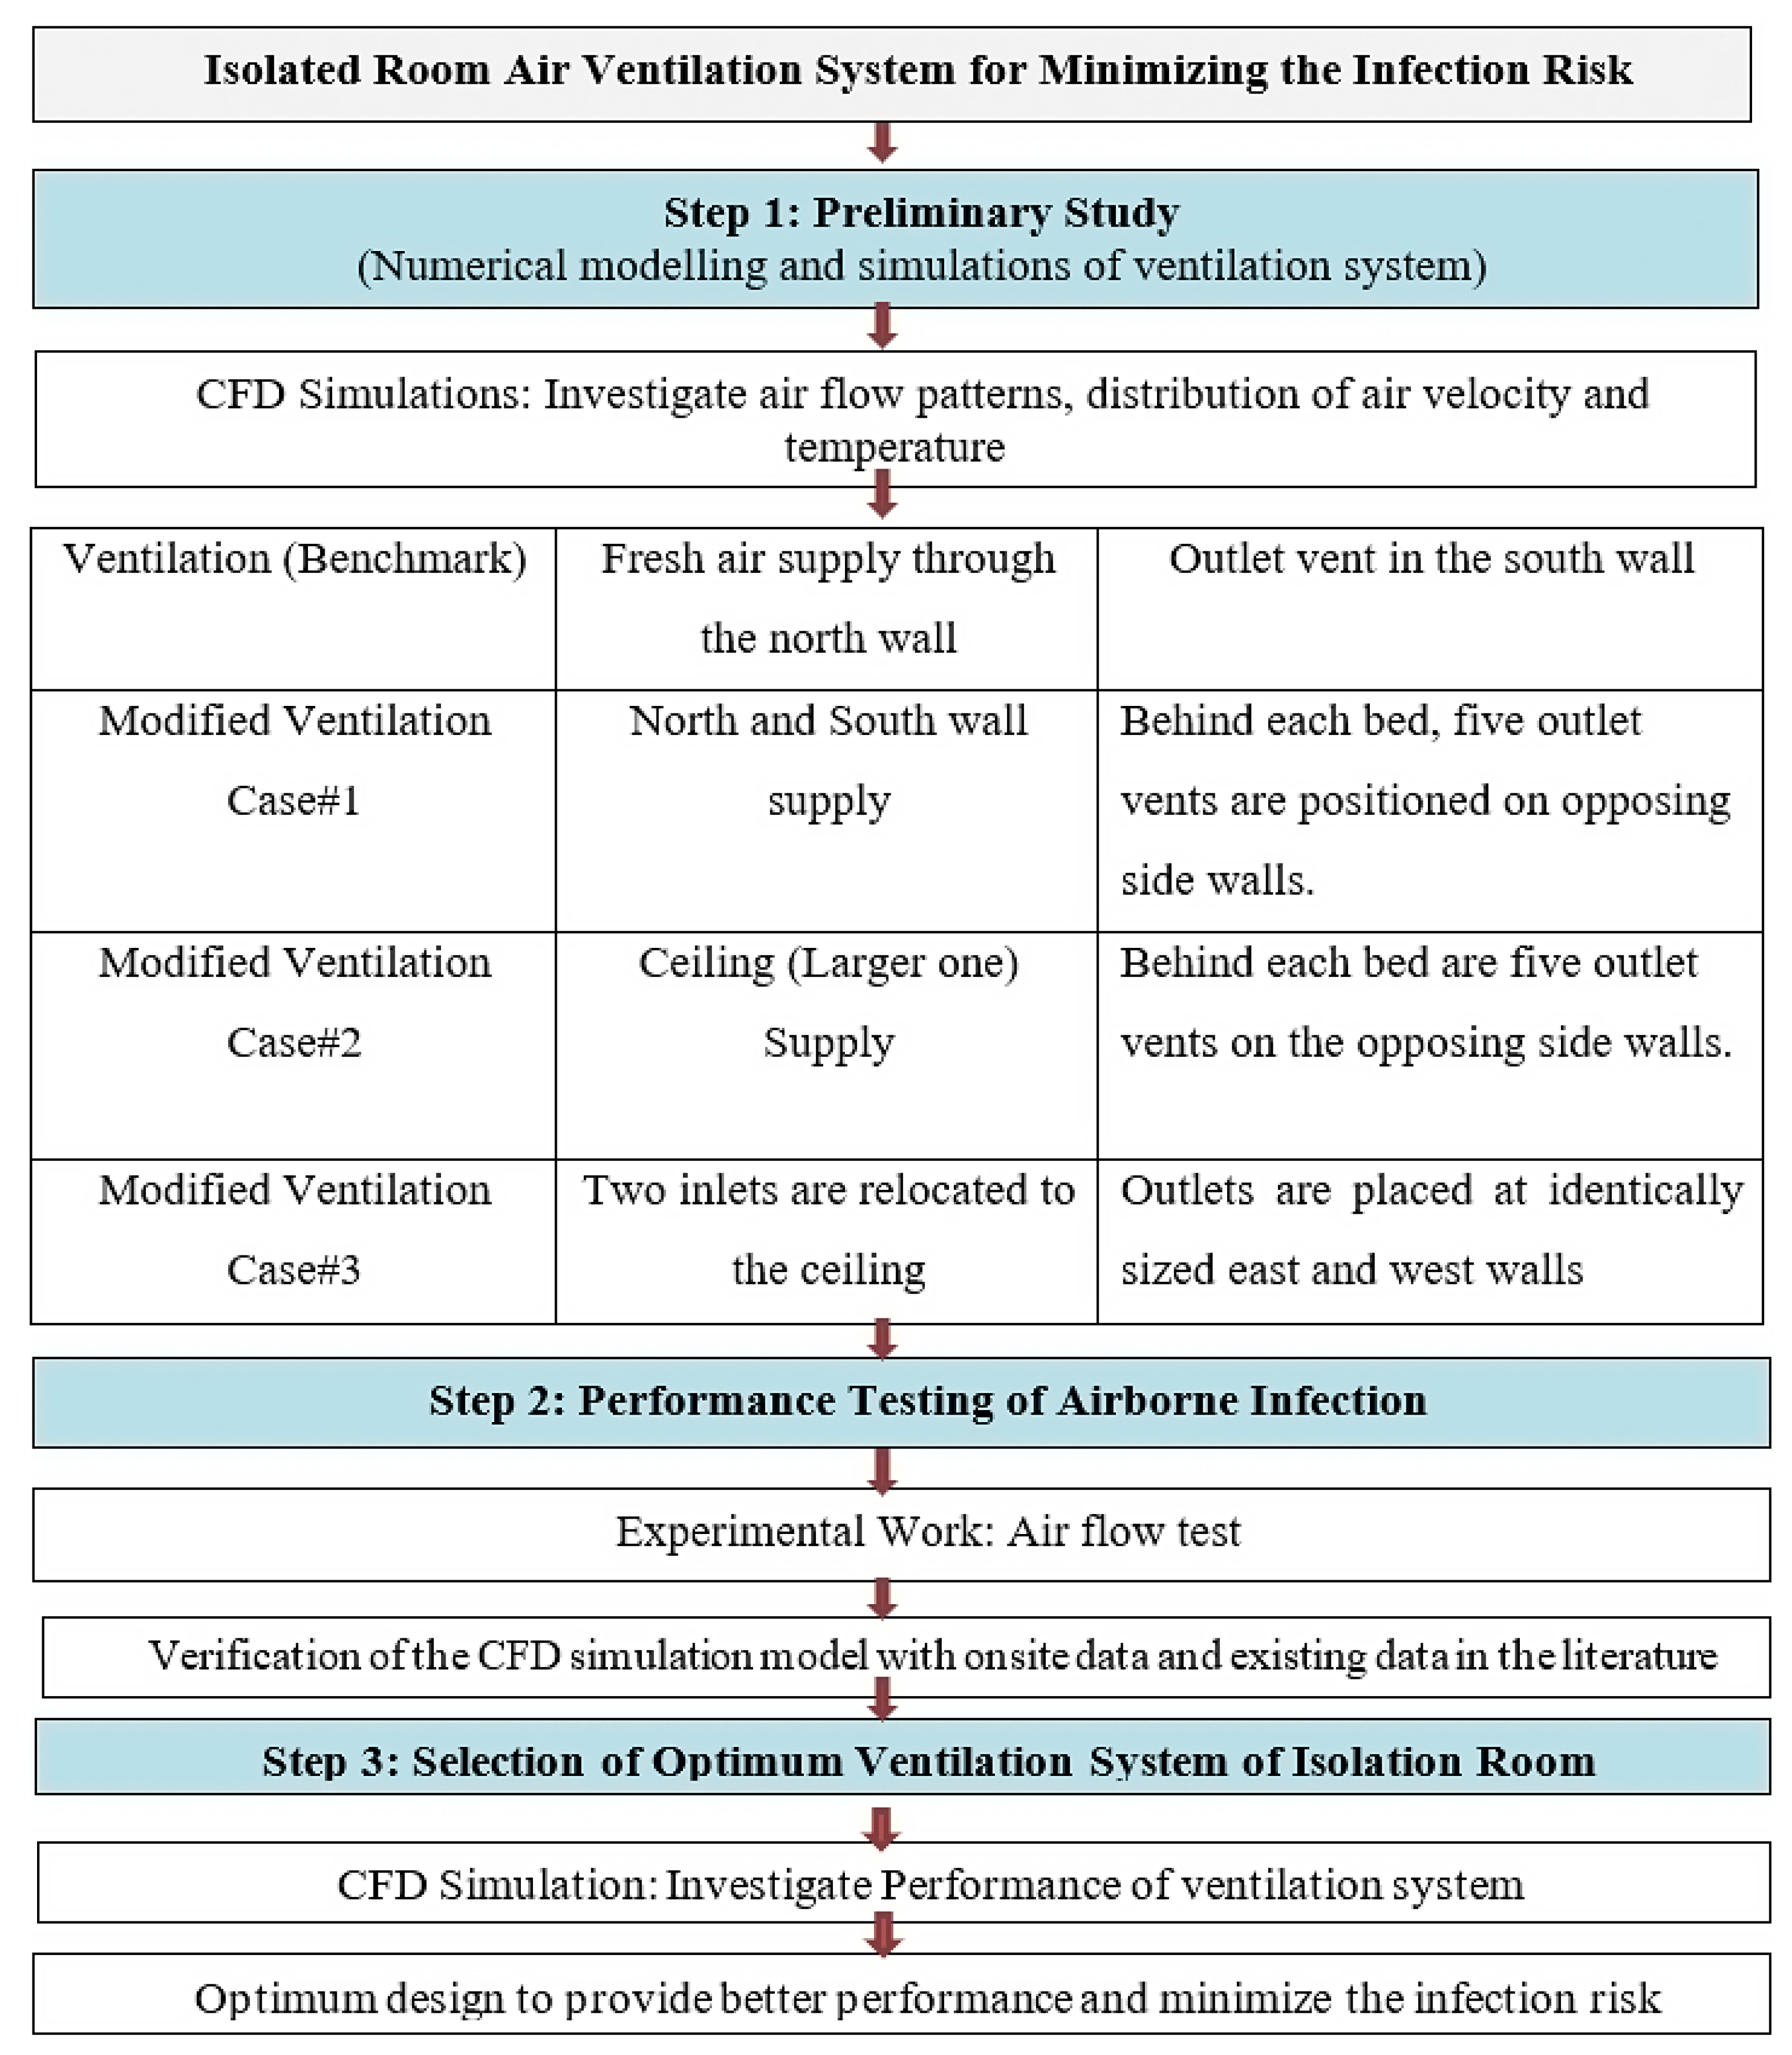
Figure 1.
Research Methodology and Procedure.
2. Numerical Computation
2.1. Geometry Preparation
Sahu et al.'s work provides the geometrical parameters and computational domain of the isolation room (Sahu et al. 2019) and (Arjmandi et al. 2022).
(Sahu et al. 2019) used computational fluid dynamics (CFD) to model and simulate the flow patterns and contaminant movement in multiple-bed hospital intensive care units (ICU) with constant inlet and outlet vents and different inlet angles to investigate the path of contaminant transfer in the hospital. In their simulation, the basic ICU layout and dimensions were taken from the BALCO hospital's ICU in Chhattisgarh, India. The research of (Arjmandi et al. 2022) utilized the same computational domain and geometrical parameters as (Sahu et al. 2019) to computationally evaluate the effectiveness parameters of the airflow system to limit the transmission of particles in the air in intensive care units..
In the present study, a numerical analysis of the air ventilation system in an isolated room was carried out to minimize the infection risk of a COVID-19-type pandemic. The basic dimensions and layout of the isolation room are the same as those described by (Sahu et al. 2019). Three different modified ventilation systems were numerically simulated and analyzed by moving the inlet and outlet vents. Because the isolation room's fundamental computational domain was derived from prior research, it is referred to as benchmark ventilation in the present work.
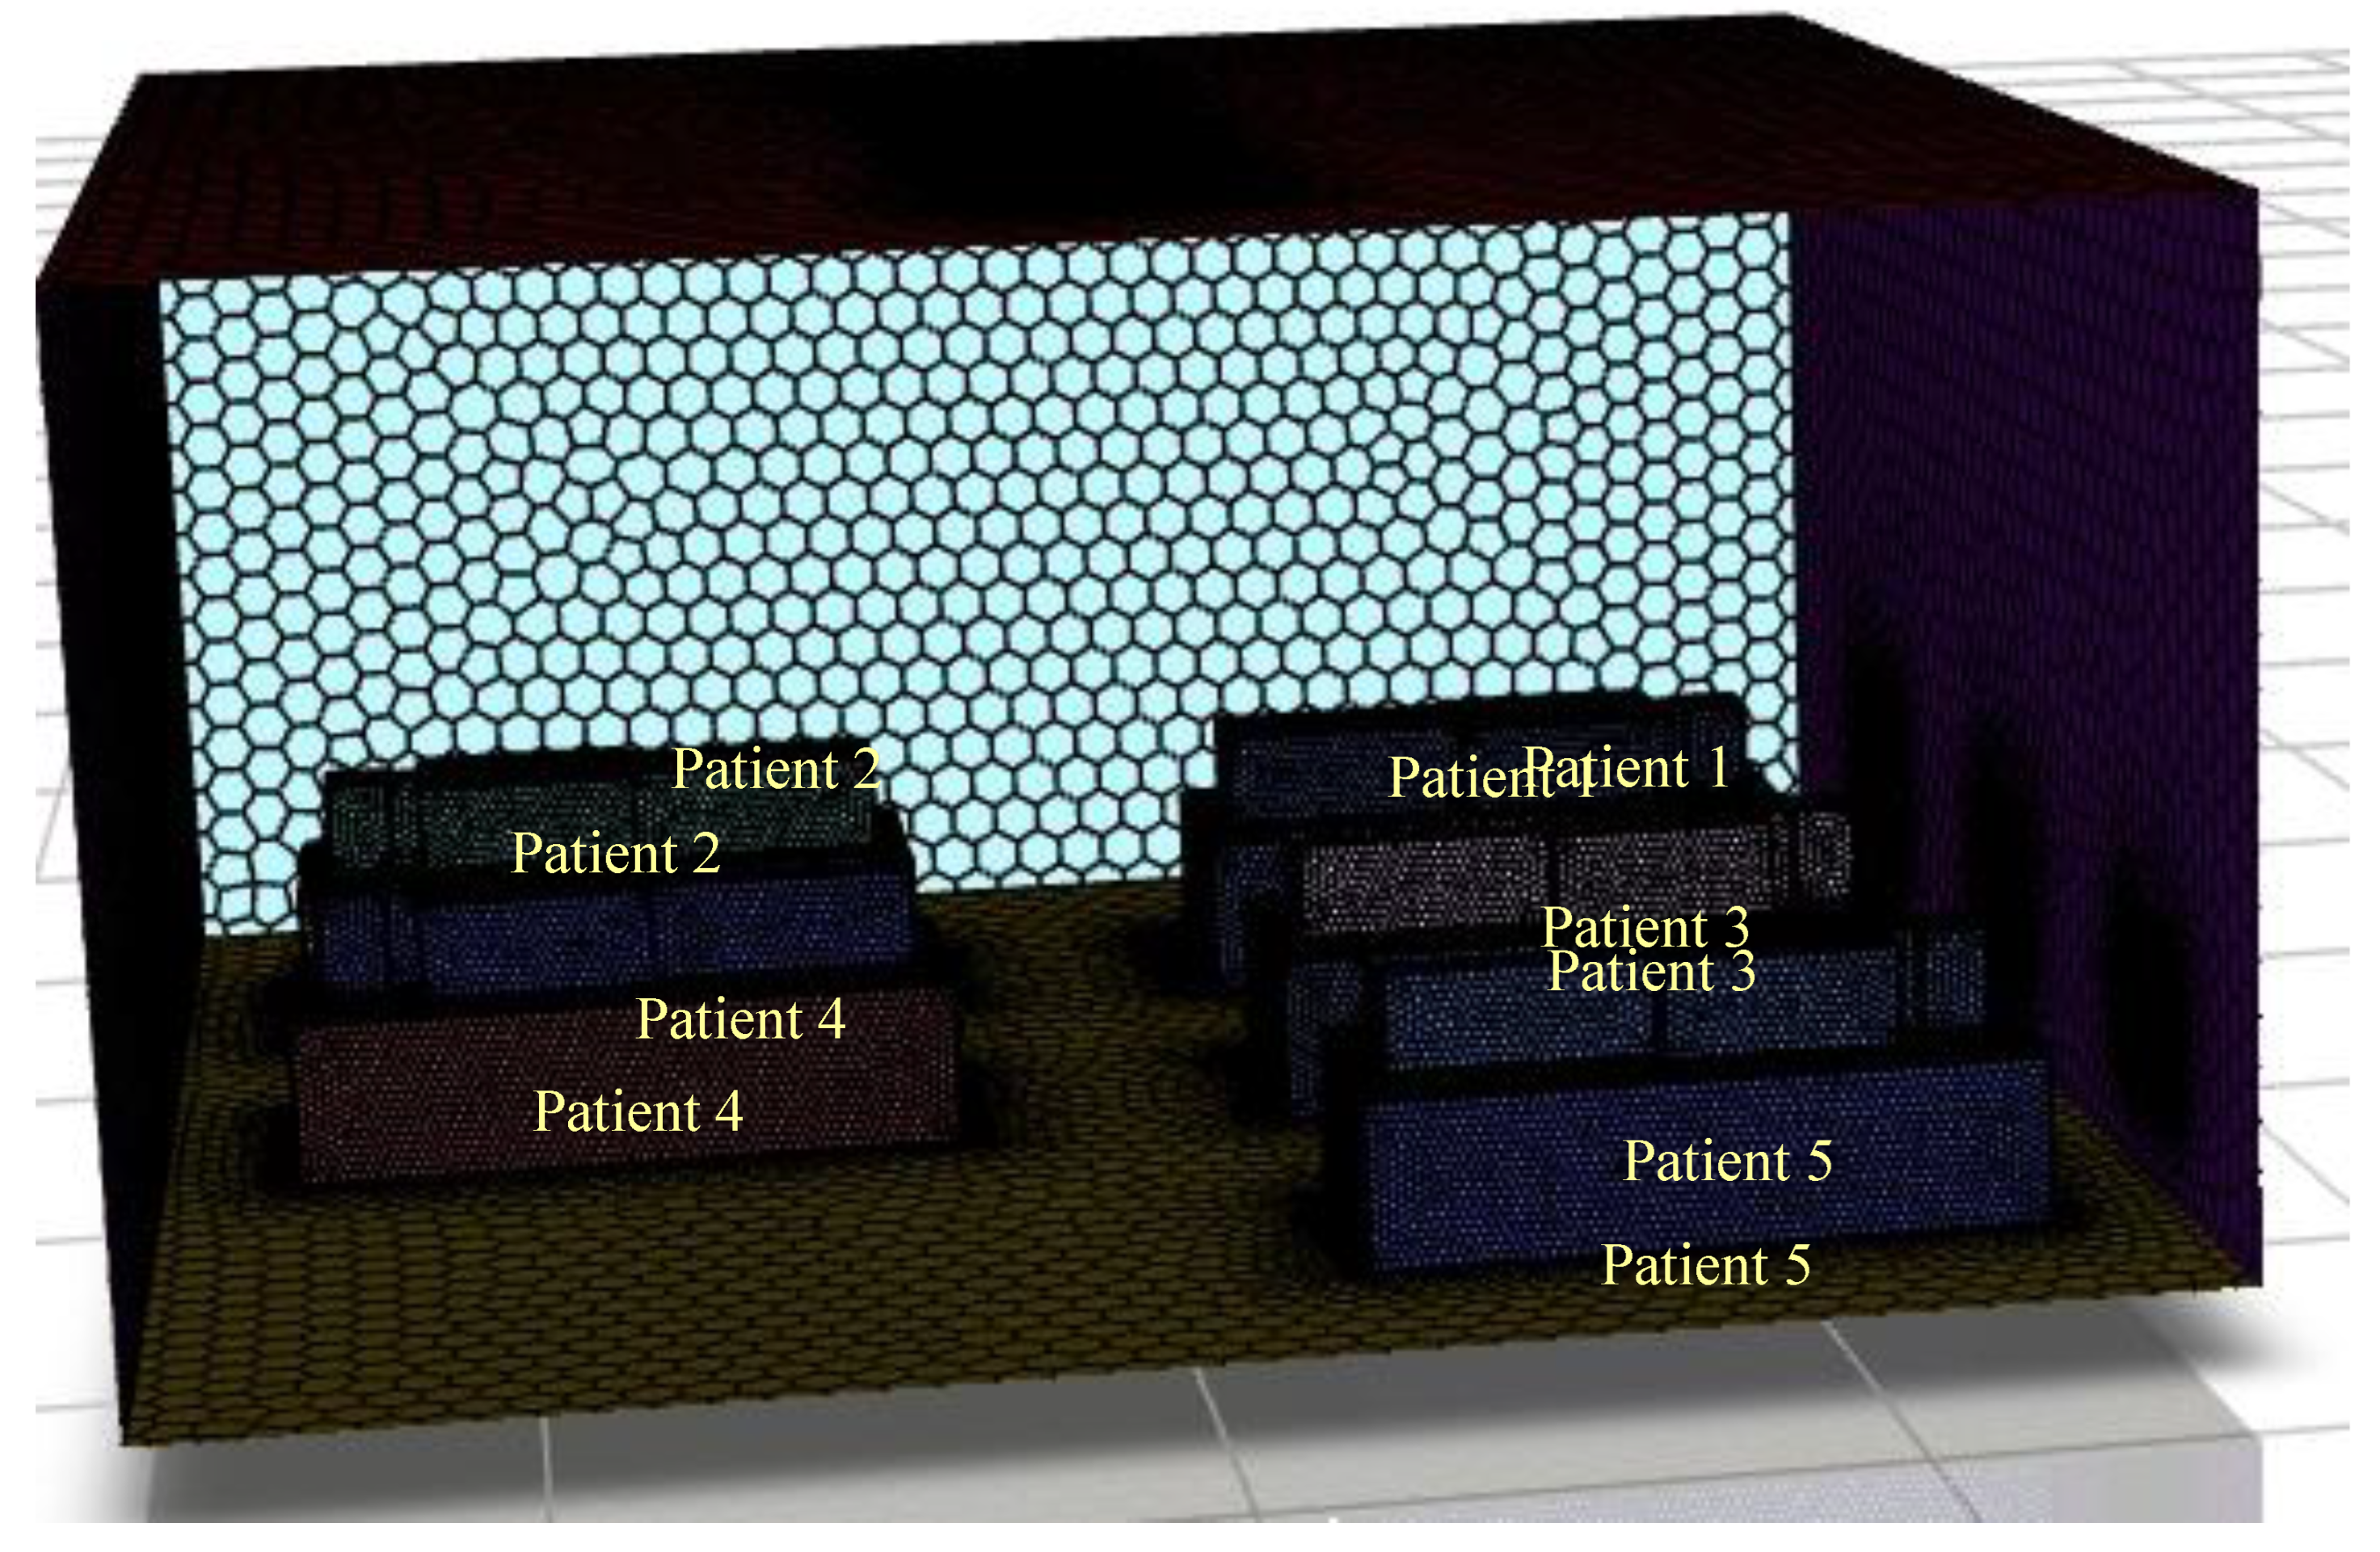
2.1.1. Geometrical Parameters of Isolated Room
Development of a three-dimensional isolation room with five patients lying on a bed. Figure 2 illustrates the structure of this study and the shapes of the isolation rooms, patients on beds, and patients' computing domains. As shown in Figure 2, the north wall of the isolation room had two input vents, and the opposite side of the south wall had two outlet vents. An isometric view of the isolation room model, also known as the benchmark (Li et al. 2021), is shown in Figure 2. In this Figure, the two air inlets and outlets are on the north and south walls, respectively. Table 1 presents dimensions of the geometry.
2.2. Meshing
The mesh generation process was designed to ensure high-quality computational grids for accurate airflow simulations. Surface and volume meshing techniques were applied, incorporating smooth transition boundary layers and polyhexcore meshing for optimal resolution. Curvature and proximity functions were used to refine the mesh, while parallel meshing improved efficiency. The final computational grid consisted of approximately 516,000 cells, ensuring precise numerical analysis. Meshing parameters are shown in Table 2.
Figure 3.
Geometry of the second case in the current study (modification 1).
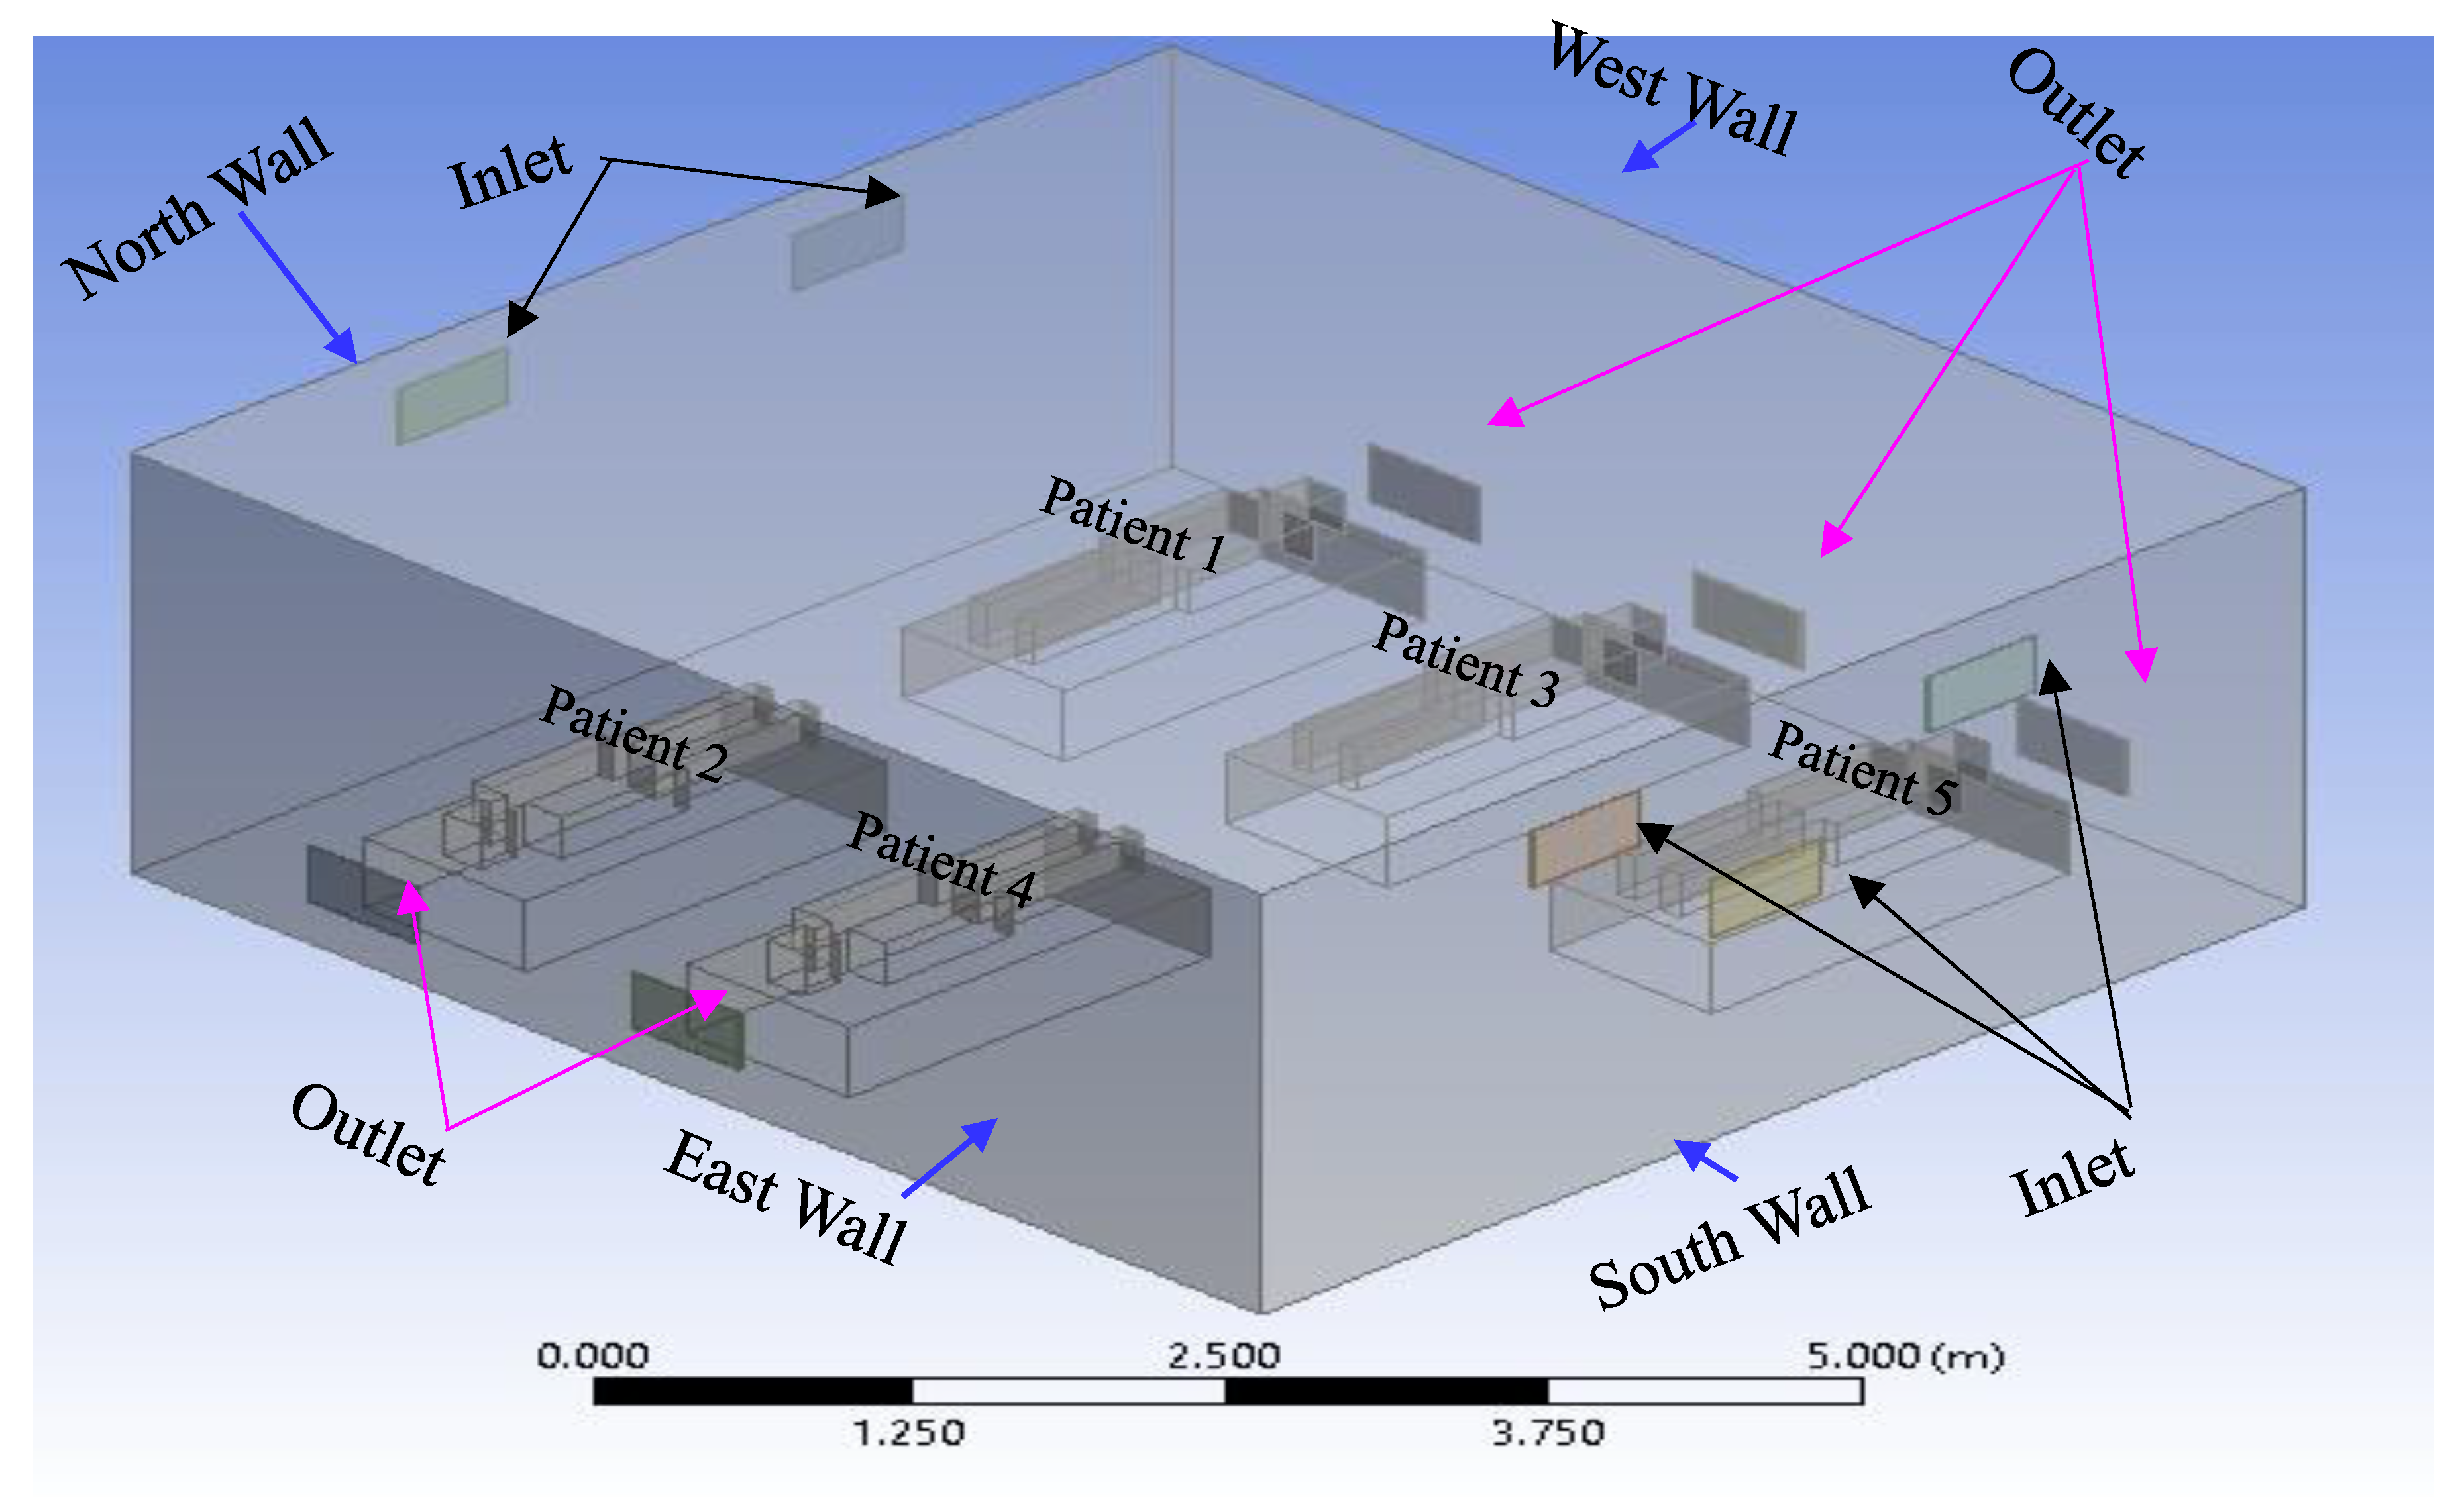
Figure 4.
Geometry of the third case in the current study (modification 2).
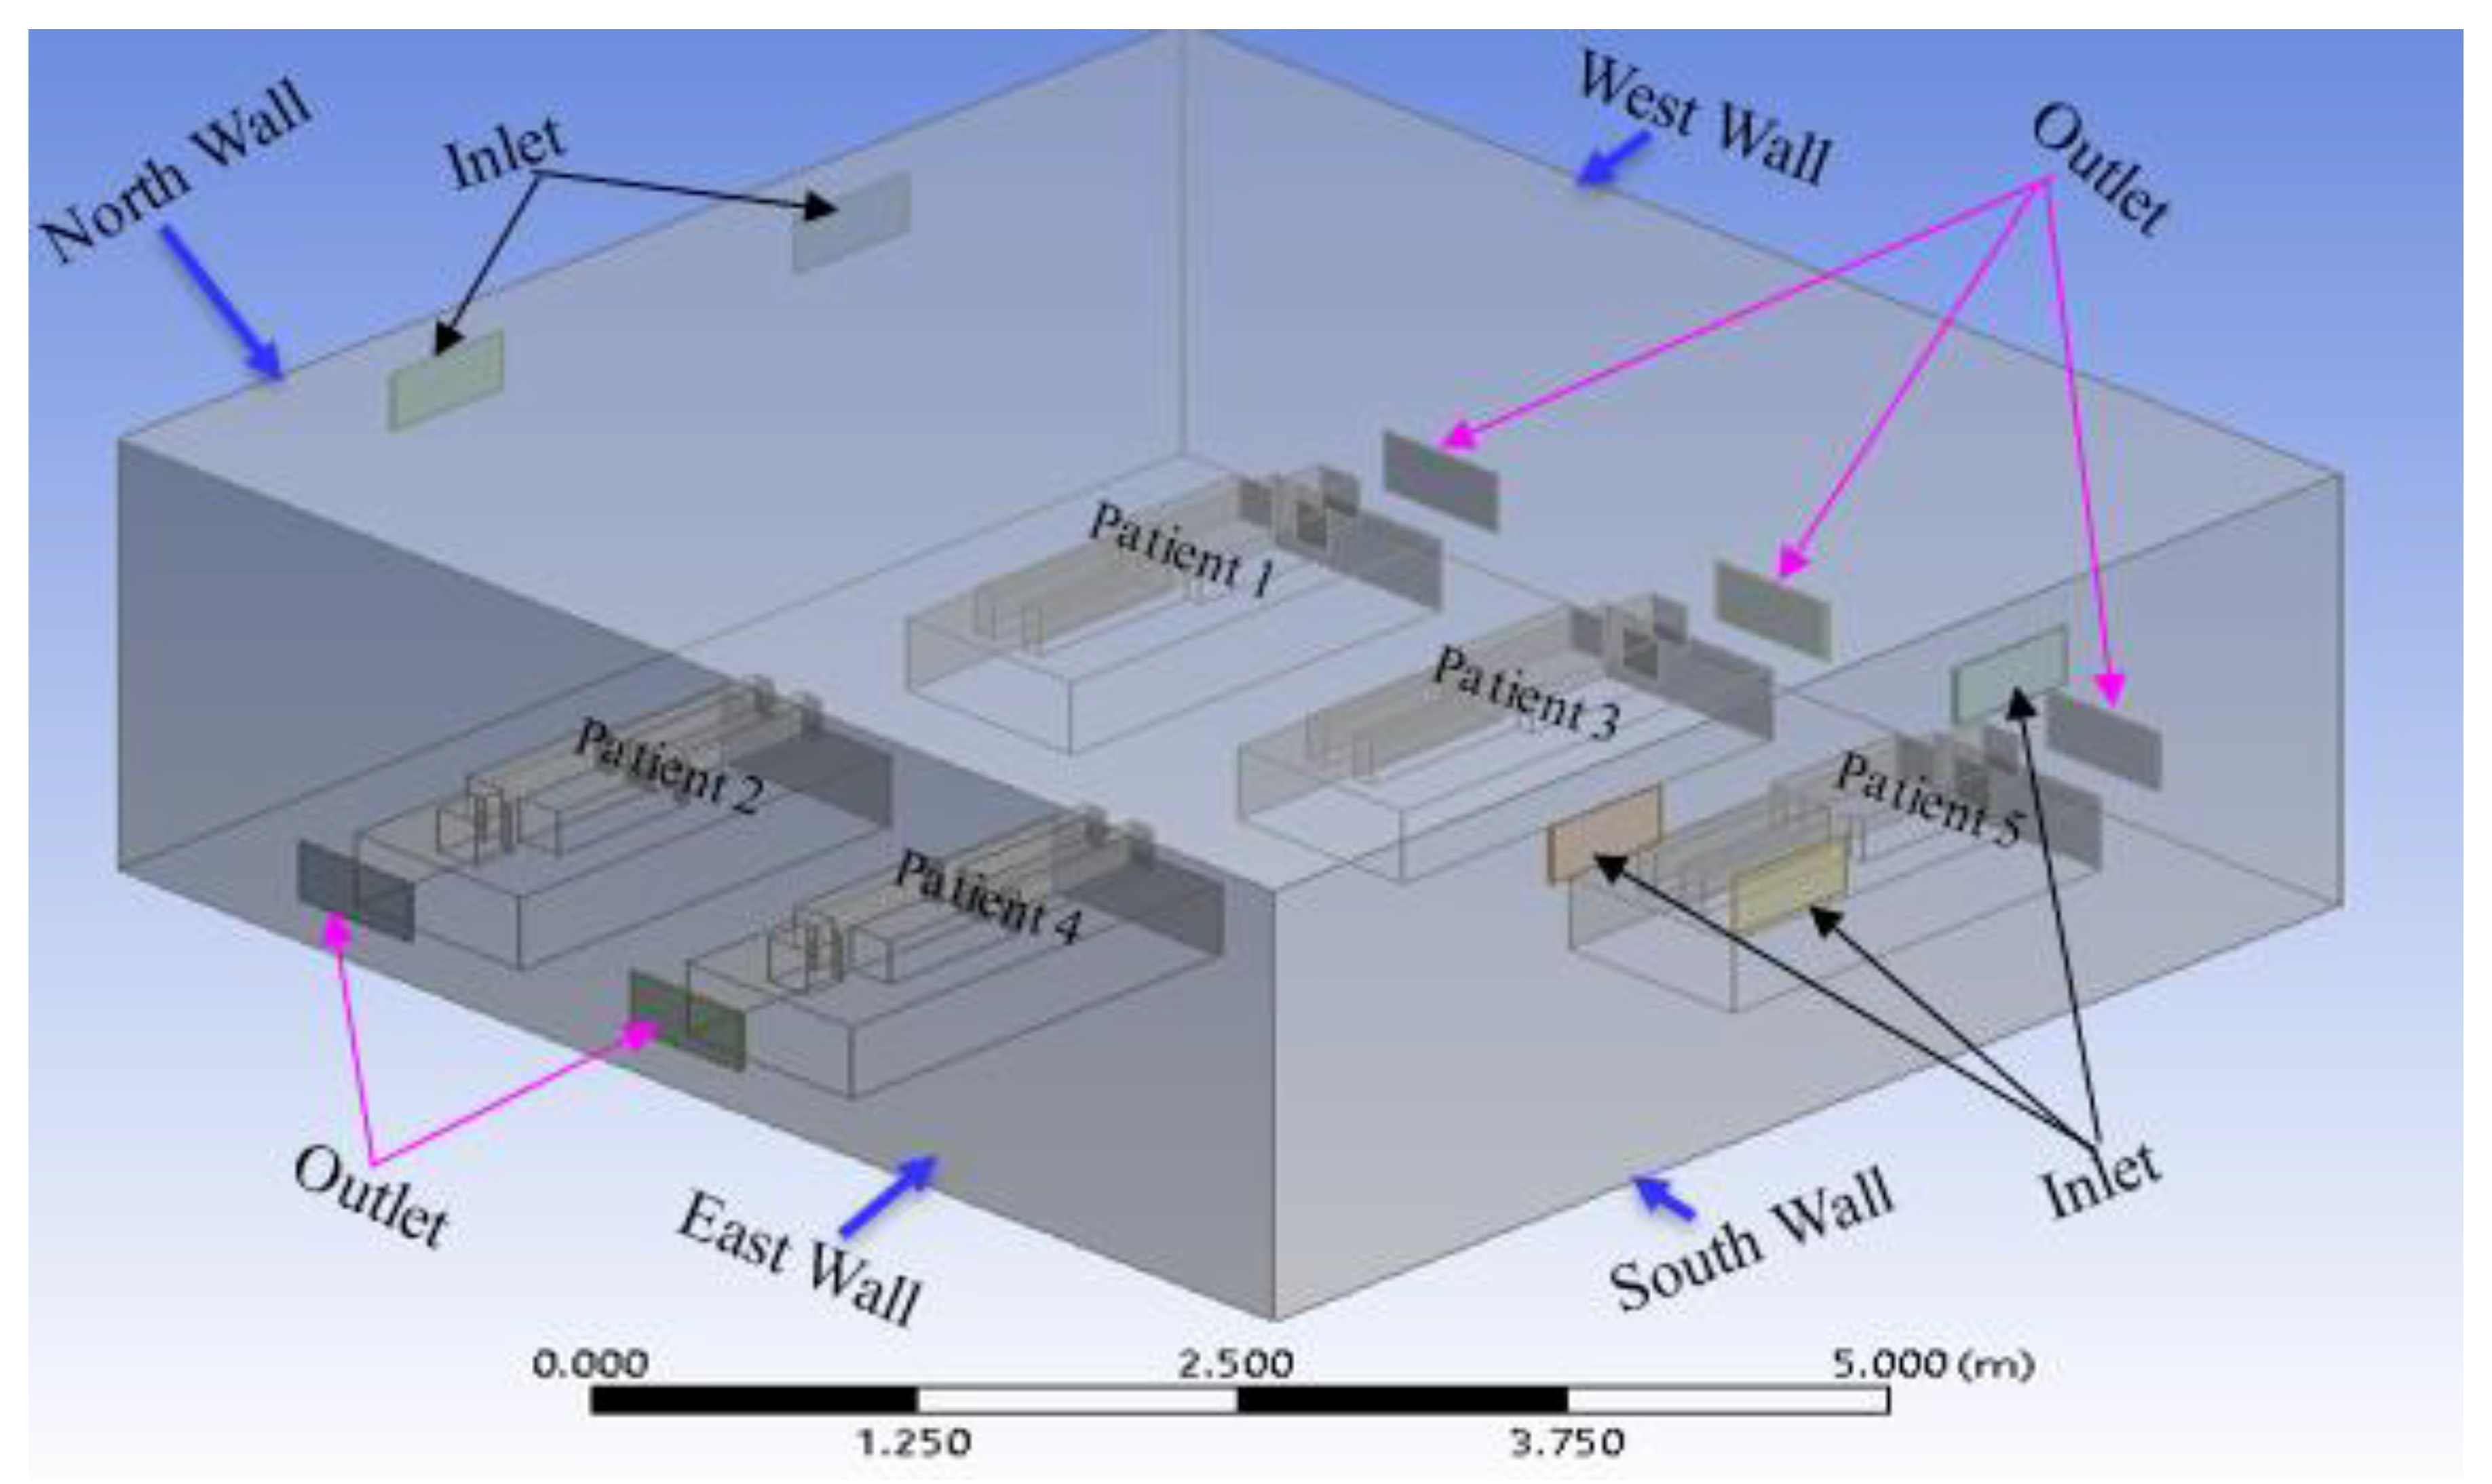
Figure 5.
Geometry of the fourth case in the current study (modification 3).
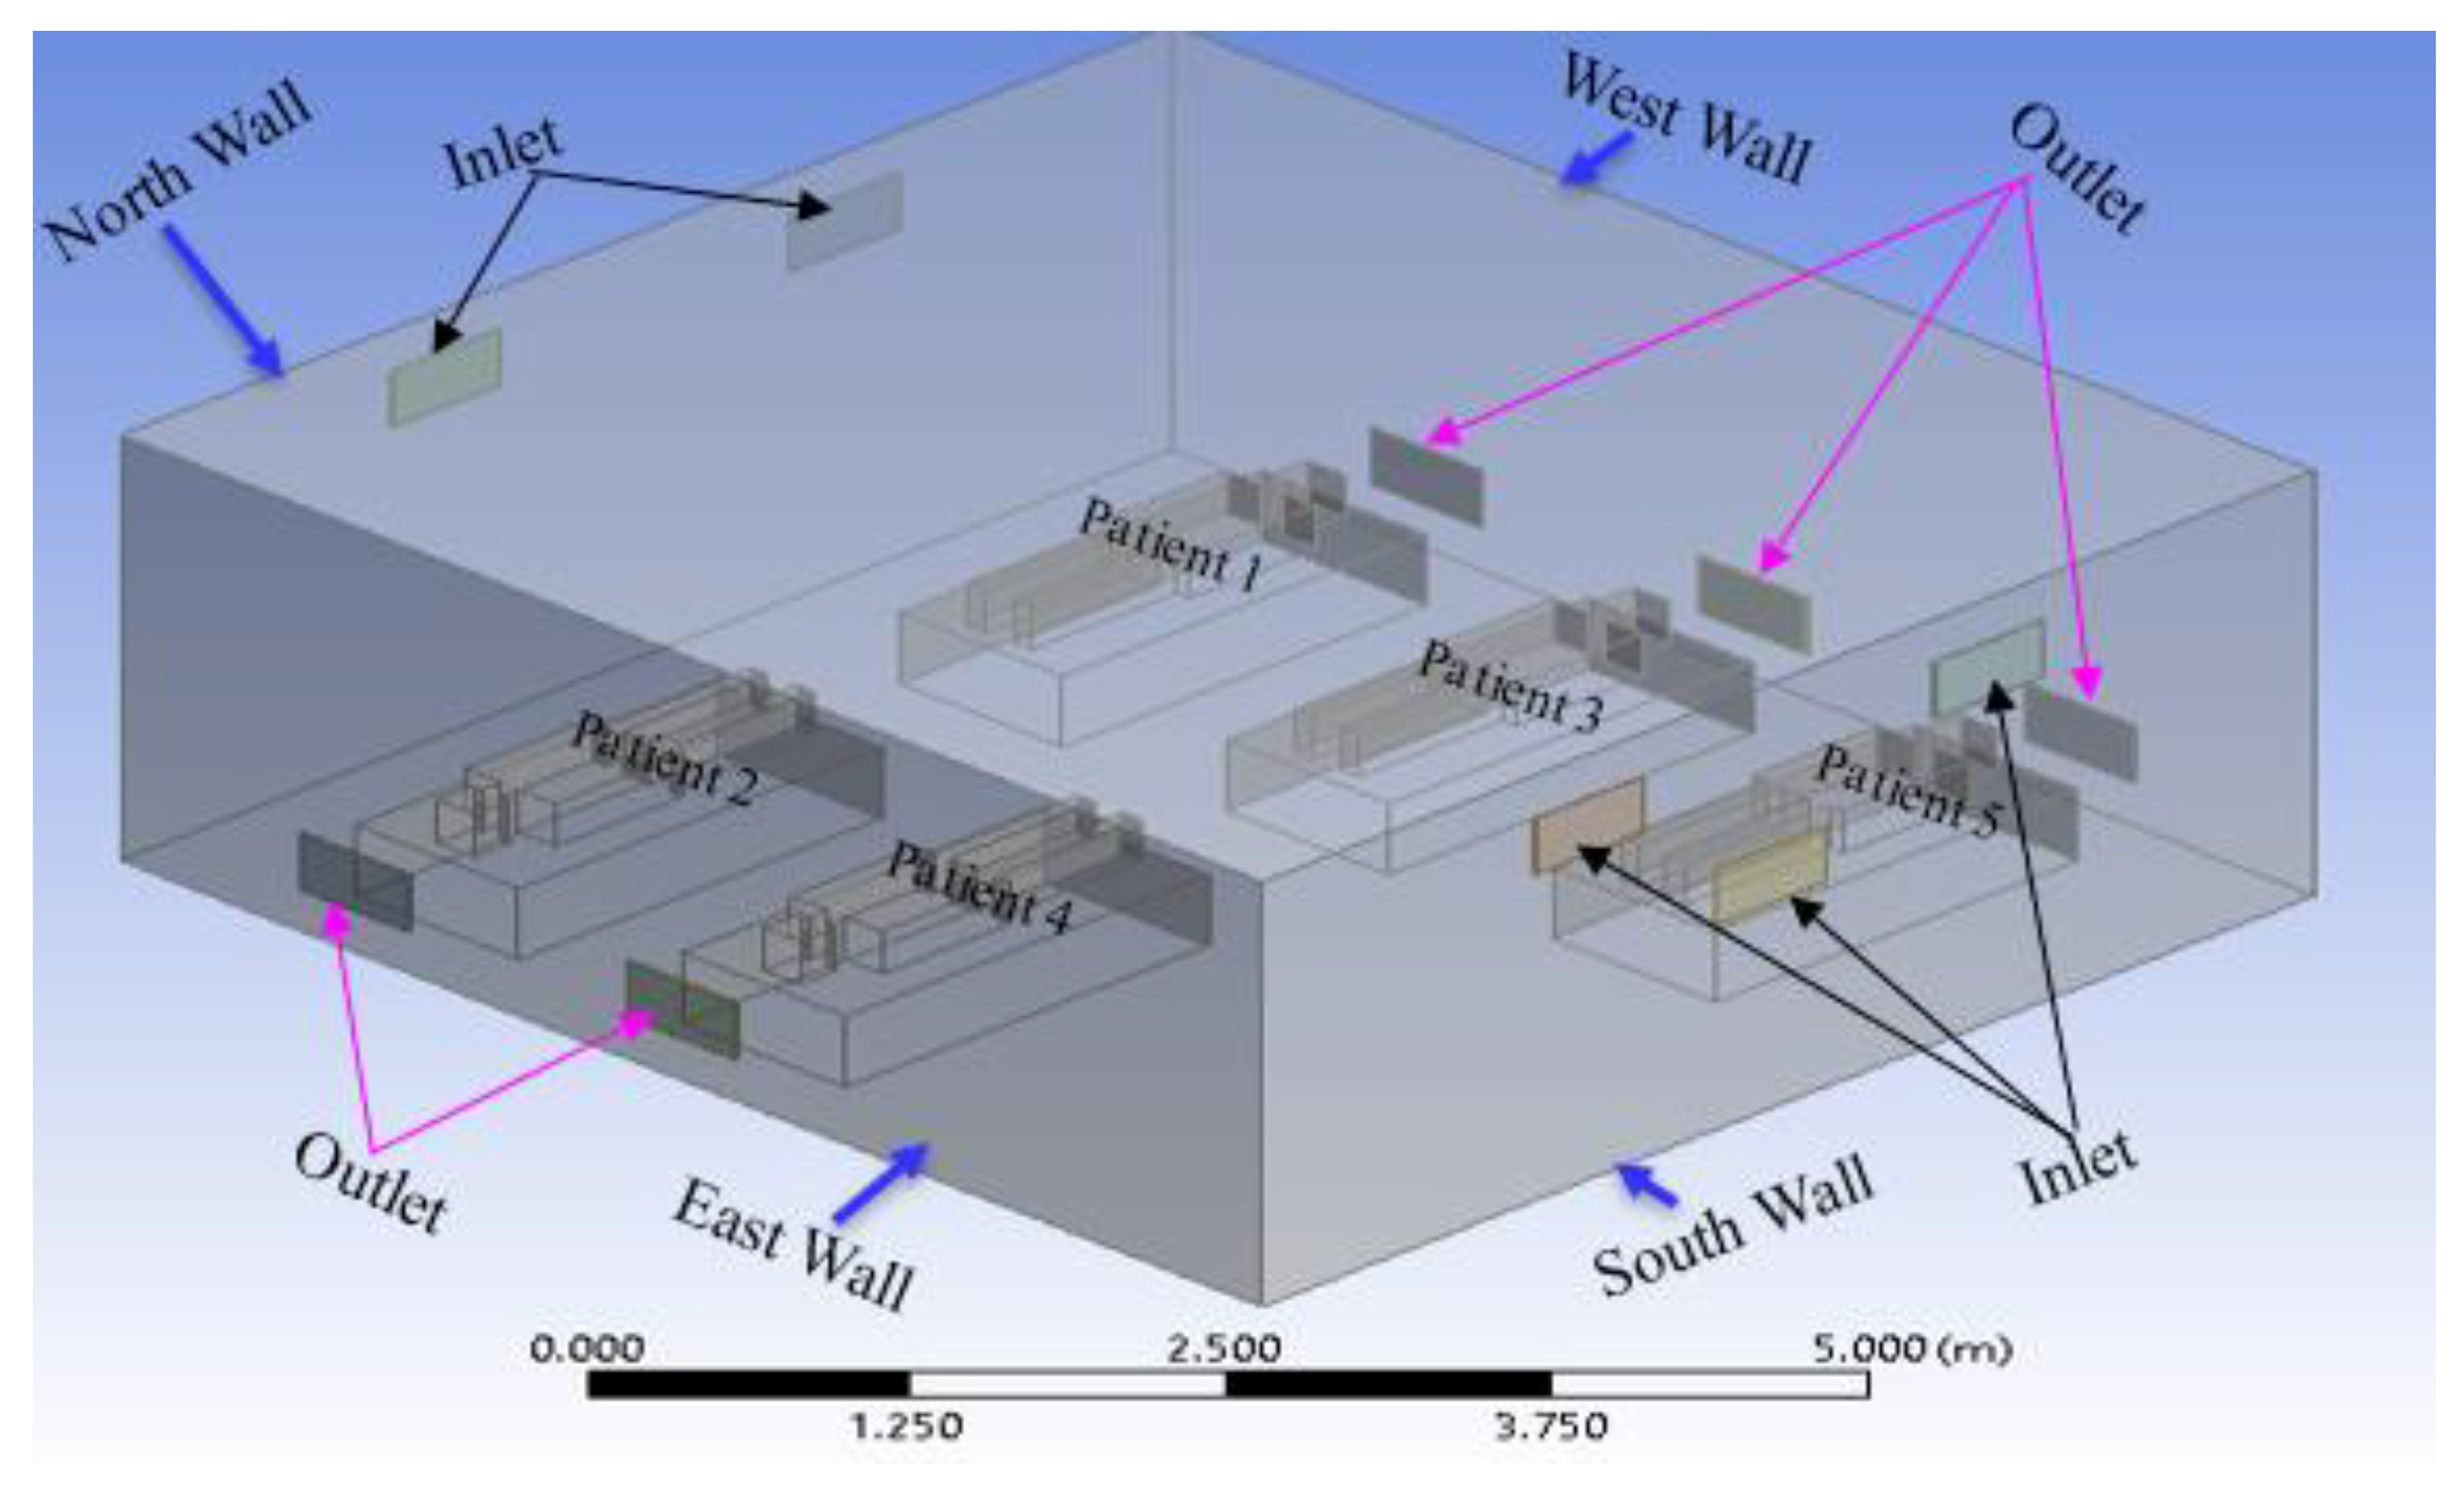
Figure 6.
Computational grid.
2.3. Numerical Method and Boundary Conditions
The airflow in the area was calculated using computational fluid dynamics (CFD). The feasibility study employed the Reynolds-averaged Navier-Stokes (RANS) method, which uses the k–ε model for turbulence transport (where k is the kinetic energy of the turbulence and ε is the turbulent dissipation). A semi-implicit pressure link equation with first-order upwind spatial discretization was used to solve the governing equations for the current study. Gravitational acceleration was chosen using a pressure-based solver and an absolute velocity formulation. The k–ε (2 equations) realizable turbulence model with scalable wall functions for improved near-wall treatment is resolved using the finite volume computational fluid dynamics program ANSYS FLUENT.
The velocity profile was plotted along the length of the room. No heat generation or mass transfer is considered. As listed in Table 3, the values of the average air inlet and outlet temperatures of the room fresh air inlet and outlet velocities were obtained from the benchmark reference (Sahu et al. 2019) for the present numerical analysis.
2.4. Grid Independence Test
To investigate the effects of the variation in cell number on the surface, face, and volume meshing, computational analyses were performed for coarse meshing, meshing for the present analysis mesh, and fine meshing. To achieve grid independence, the velocity was analyzed and compared for all meshes. The velocities at different positions along a vertical straight line measured from the floor to the ceiling were computed and are shown in Figure 7. The measuring line was 3 m from the north and east walls.
The comparisons among the coarse mesh, present analysis mesh, and fine mesh are graphically presented in Figure 8.
As can be observed from Figure 8, when the mesh element was increased to 5, 15,962 (for the present analysis) from the coarser mesh at the same velocity and temperature, the results varied significantly. However, when the mesh element was increased even more to 10, 80,715 (fine mesh) at the same velocity and temperature, the result remained nearly constant, as in the previous results. As a result, 5, 15,962 cells (for the current analysis) were used to complete the simulation.
3. Results and Discussion
3.1. Code Validation
Four different ventilation systems, including the benchmark and three modifications, were used to simulate the dispersion of airborne particles in an isolated room with five beds. After identifying the case with the least spread, factors affecting infection control were investigated. Because the viability of the grid and the predictive capacity of the numerical model have both been established, a level of confidence can be placed in both. The performance of the ventilation systems was then further analyzed in relation to the airflow pattern and airborne contaminant distribution. An optimization method was then carried out to further improve ventilation system performance for removing airborne contaminant tons to minimize the infection risk of COVID-19 type pandemic. As previously stated, (Sahu et al. 2019) and Arjmandi et al. (Sahu et al. 2019, Arjmandi et al. 2022) served as the source for the geometry of the cases, except for the ventilation vent positions. The approach and the current numerical model were validated using existing numerical and experimental research (Sahu et al. 2019, Arjmandi et al. 2022) before examining the fluid dynamics and patterns of the isolation room geometry. It is clear from Figure 9 that the computational domain and velocity at various locations within the designed room are in excellent agreement with published experimental and numerical data (Sahu et al. 2019, Arjmandi et al. 2022). Here, pink with a green circular symbol indicates the present analysis, gray with a red circular symbol suggests the research of (Arjmandi et al. 2022), and blue with a green circular symbol indicates the research of (Sahu et al. 2019).
In this study, an experimental investigation of air ventilation systems without patients was performed to validate the numerical model of the simulation. A numerical analysis was also performed under the same boundary conditions as in the experimental investigation. Figure 10 and 11 show the experimental model room considered for the validation. The model room's length, width, and height were 3.6 m, 3.5 m, and 3.6 m, respectively. One inlet and exhaust fan were used in the experiment. The inlet and outlet had a rectangular cross section of 35 cm × 35 cm. The numerical model of the experimental isolation room is shown in Figure 12. The inlet fan was positioned on the south wall and the outlet fan on the west wall of the room. The inlet velocity of the model isolated room was measured at regular intervals. The experimental data were recorded after steady-state conditions were achieved. The velocity in the isolation room was analyzed using a digital anemometer. The reference line for the measurement is shown in yellow.
The experimental and numerical results are compared in Figure 13, which compares the room velocity variation with the vertical distance between the experimental and computational data. Fresh air from the atmosphere enters through the inlet, flows horizontally, and hits the opposite wall. The experimental room was filled with fresh air, which moved towards the outlet vent after striking the opposite wall. In the figures, the blue line with a circular blue symbol represents the simulation results, and the red line with a circular red symbol represents the experimental results. Because of the temporary installation of an inlet and exhaust fan using an extra frame and glue at the window in the office room of the university, the isolation room was not properly air sealed. In addition, slight hand dispositioning occurred while measuring the velocity using a measuring tool. Thus, the velocity profile decreases with the vertical height of the room and reaches its lowest value on the north wall side of the room.
3.2. Influence of the Ventilation Modes on Ventilation Performance
Several computational analyses were performed on the benchmark and various modified ventilation systems to determine the velocity distribution inside an isolation room. In each scenario, constant airflow was established within the room. The spatial distribution of the indoor airflow was used to examine the ventilation effectiveness of the various ventilation types. Figure 14 shows the streamline distributions for the various ventilation techniques. The results indicate that air is more sufficiently mixed for modifications 1 and 3.
3.3. Graphical Analysis of the Velocity Vector at Patients 1, 3, 5
The velocity vector along the XY plane, 0.6 m away from the west wall in the z direction inside the isolation room, was measured for nearly all the patients (1, 3, and 5) at Modification 2. The benchmark and modifications 1 and 3 are investigated numerically using a similar procedure. Figure 15 shows the vector contours.
The distribution of velocity along the isolation room length is shown in Figure 15. This figure shows that the movement of the velocity vector in benchmark case 15 (a) is not properly directional for the individual patient. Similarly, for Modifications 1 and 3, Figure 15b,d show that the velocity vectors inside the room were not directional to the patient. It has been shown from the velocity vector diagram of Modification 2, shown in Figure 15 (c), that the velocity vector inside the isolation room is properly transmitted to the patients.
The contour of the velocity vector for patients 1, 3, and 5 shows that for the benchmark ventilation system, the velocity vectors are seen to be mixed from one patient to the next. This phenomenon was also observed in the velocity vector contours for Modifications 1 and 3. This arrangement helps the patient and others to become infected, and the room is expected to be frequently contaminated. However, for Modification 2, the velocity vector is not mixed from one patient to the next owing to the modified arrangement of the inlet and exhaust fans over the patient bed. This arrangement helps the patient and others to become disinfected, and the room is not expected to be contaminated frequently.
A comparison of the velocity distributions in the isolation room for patients 1, 3, and 5 for various modification cases is shown in Figure 16. In the figure, the y-axis indicates the velocity in m/s and the x-axis indicates the room length in meters. The colored graphs (blue, purple, maroon, and olive) indicate modifications 2, 1, 3, and benchmark, respectively. It can be seen from Figure 16 that the magnitude of the velocity of Modification 2 (blue) is higher than that of the other modifications to the isolation-room length. Owing to the location of the air inlet and outlet vents in the isolation room, the magnitudes of the velocities for patients 1, 3, and 5 in Modification 2 were higher than those of the others. In Modification-2, as shown in Figure 4, a single rectangular inlet with a relatively large aperture draws air into the room and five exhaust ventilators are placed behind one bed on the opposition sidewalls. In contrast, the benchmark case, as shown in Figure 2, has two inlet vents on the north wall and two outlet vents on the side wall. Similarly, in Modification 1, as shown in Figure 3, the five exhaust outlets are situated on the reverse sidewalls behind one bed, and the inlet is situated exactly where the benchmark is. In Modification 3, as depicted in Figure 5, the two inlets are positioned on the ceiling, and the outlets are situated on identically sized east and west walls.
3.4. Graphical Analysis of the Velocity Vector at Patient 2, 4
The velocity vector along the XY plane 5.2 m distance from the west wall in the z-axis inside the isolation room for nearly one, three, and five heads was measured for Modification 2. The benchmark and modifications 1 and 3 are investigated numerically using a similar procedure. Figure 17 shows the results.
The distribution of velocity along the length of the isolation room is shown in Figure 12. This figure shows that the movement of the velocity vector in benchmark case 17 (a) is not properly directional for the individual patient. Similarly, for Modifications 1 and 3, Figure 17 (b) and 17 (d) show that the velocity vectors inside the room are not directional to the patient. The velocity vector diagram of Modification 2, shown in Figure 17 (c), shows that the velocity vector inside the isolation room is properly transmitted to the patients.
The contour of the velocity vector for patients 2 and 4 shows that for the benchmark ventilation system, the velocity vectors are seen to be mixed up from one patient to the next. This phenomenon was also observed in the velocity vector contours for Modifications 1 and 3. This arrangement helps the patient and others to become infected, and the room is expected to be frequently contaminated. However, for Modification 2, the velocity vector is not mixed from one patient to the next owing to the modified arrangement of the inlet and exhaust fans over the patient bed. This arrangement helps the patient and others to become disinfected, and the room is not expected to be contaminated frequently.
A comparison of the velocity distributions in the isolation room for patients 2 and 4 for various modification cases is shown in Figure 18. In the Figure, the y-axis indicates the velocity in m/s and the x-axis indicates the room length in meters. In addition, the black, maroon, purple, and blue graphs indicate Modifications 2, 1, 3, and the benchmark, respectively. As shown in Figure 13, the magnitude of the velocity of Modification-2 (black) is higher than that of the other modifications for the isolation room length.
Because of the location of the air inlet and outlet vent in the isolation room, the magnitude of the velocity for patients 2 and 4 in Modification 2 is higher than that of the others. In Modification 2, as shown in Figure 4, a single rectangular inlet with a relatively large aperture draws air into the room, and five exhaust vents are situated behind one bed on the reverse sidewalls. In contrast, the benchmark case shown in Figure 2 has two inlet vents on the north wall and two outlet vents on the side wall. Similarly, in Modification 1, as shown in Figure 3, the inlet was located exactly where the benchmark was, and the five exhaust vents were situated behind each bed on the countering sides. The two inlets are located in the ceiling and outlets are placed at identically sized east and west walls in Modification 3 as shown in Figure 5
3.5. The Airborne Contaminant Distributions at the Patient’s 1 & 3
Figure 19a shows the movement of the velocity vector and airborne contaminants inside the isolation room in the benchmark ventilation system. The figure shows that the velocity vector is not properly directional for an individual patient. An air vortex is present inside the isolation room. Owing to the vortex flow inside the room, the COVID-19 type virus is not minimized by the ventilation system. As a result, the patient will be infected again, and the room will be frequently contaminated.
The movement of the velocity vector and airborne contaminant in patients 1 and 3 inside the isolation room at the benchmark ventilation system is shown in Figure 19a. It can be observed from the Figure that vortex flow exists between patients 1 and 3. Owing to the vortex flow, Patient 3 will be infected again by Patient 1, and the room will frequently be contaminated.
The movement of the velocity vector and airborne contaminant in patients 1 and 3 inside the isolation room in the Modification 1 ventilation system is shown in Figure 19b. As shown in the illustration, there was a vortex movement between patients 1 and 3. The vortex movement causes the room to become contaminated regularly and also results in Patient 1 being infected by Patient 3.
Table 1 and Table 3 inside the isolation room with the Modification 2 ventilation system is shown in Figure 19c. As can be seen from the Figure, the velocity vector is not mixed between one patient and other patients. There was no air vortex around either of the patients. The air vector movement of both patients was directed towards the exhaust vent. As a result, there is a lower risk of infection spreading among patients in the isolation room because of this modified air ventilation system.
The movement of the velocity vector and airborne contaminant in patients 1 and 3 inside the isolation room with the Modification 3 ventilation system is shown in Figure 19d. As shown in the illustration, there was a vortex movement between patients 1 and 3. The vortex movement causes the room to become contaminated regularly and also results in Patient 1 being infected by Patient 3.
3.6. Airborne Contaminant Distribution at the Patient’s 2 and 4
The movement of the velocity vector and airborne contaminant in patients 2 and 4 inside the isolation room at the benchmark ventilation system is shown in Figure 20a. It can be observed from the figure that a vortex flow exists between patients 2 and 4. Owing to the vortex flow, Patient 4 will again be infected by Patient 2, and the room will frequently be contaminated.
The movement of the velocity vector in patients 2 and 4 inside the isolation room with the Modification 1 ventilation system is shown in Figure 20b. As shown in the illustration, there was a vortex movement between patients 2 and 4. Owing to the vortex flow, which also results in the infection of patient 2 by patient 4, the room frequently becomes contaminated.
The movement of the velocity vector in patients 2 and 4 inside the isolation room for the modification 2 ventilation system is shown in Figure 20c. As shown in the Figure, the velocity vectors are not mixed between one patient and the other patients. No air vortices were observed around the patient. The air vector movement of both patients was directed towards the exhaust vent. As a result, there is a lower risk of infection among patients in the isolation room because of this modified air ventilation system.
The movement of the velocity vector in patients 2 and 4 inside the isolation room with the modification 3 ventilation system is shown in Figure 20d. As shown in the illustration, there was a vortex movement between patients 2 and 4. Owing to vortex movement, which also results in the infection of patient 2 by patient 4, the room is frequently contaminated.
4. Conclusion
A three-dimensional steady CFD model was developed to analyze the air ventilation system in an isolation room, focusing on the air velocity and temperature distributions. Various configurations of inlet and outlet vents were numerically investigated to minimize the risk of infection spread, particularly during pandemics, such as COVID-19. The positions of the patient beds were fixed, and different ventilation modifications were studied.
Among the tested configurations, the benchmark case and modifications 1 and 3 showed significant mixing of air velocity vectors between patients, thereby increasing the likelihood of contamination. In contrast, modification 2 was the most effective. This modification features a single large ceiling-mounted inlet vent and five outlet vents positioned behind the patient beds. The airflow pattern in this setup prevents cross-contamination by avoiding air mixing and directing air directly to exhaust vents, thereby eliminating air vortices within the room.
The velocity distribution in Modification 2 was also higher than that in the other setups, ensuring the faster removal of contaminated air. This arrangement reduces the risk of infection spreading among patients and provides a safer ventilation strategy. Based on these findings, modification 2 is recommended as the optimal ventilation system for isolation rooms, offering an efficient solution to control contamination and minimize infection risks during pandemics.
Author contributions: Conceptualization: Mohammad Zoynal Abedin and Jungko Moni Chakma. Methodology: Jungko Moni Chakma, Saddam Hossen, and Md. All Amin Sumon. Formal analysis and investigation: Jungko Moni Chakma, Saddam Hossen and Md. All Amin Sumon. Writing-original draft preparation: Mohammad Zoynal Abedin, Jungko Moni Chakma, and Md. All Amin Sumon. Writing – review and editing: Mohammad Zoynal Abedin and Saddam Hossen. Supervision: Mohammad Zoynal Abedin. The authors acknowledge the use of AI-driven language tools to improve the writing and linguistic quality of the manuscript.
Ethical Compliance
Ethical review and approval were not required as per institutional and national guidelines. None of the human or animal subjects were included in this study.
Funding
The authors (s) received no financial support for this article's research, authorship, and/or publication.
Conflict of Interest
The authors declare that they have no financial or personal conflicts of interest that could potentially influence the findings presented in this study.
References
- AK Sahu, SL Sinha, and TN Verma, 2018. Numerical simulation of air flow to ventilate intensive care unit of hospital. International Research Publication House.
- Arjmandi, H.; Amini, R.; Kashfi, M.; Abikenari, M.A.; Davani, A. Minimizing the COVID-19 spread in hospitals through optimization of ventilation systems. Phys. Fluids 2022, 34, 037103. [Google Scholar] [CrossRef] [PubMed]
- ASHRAE, 2022. ASHRAE Positions on Infectious Aerosols.
- Bak, A. , Mugglestone, M.A., Ratnaraja, N.V., Wilson, J.A., Rivett, L., Stoneham, S.M., Bostock, J., Moses, S.E., Price, J.R., Weinbren, M., Loveday, H.P., Islam, J., and Wilson, A.P.R., 2021. SARS-CoV-2 routes of transmission and recommendations for preventing acquisition: joint British Infection Association (BIA), Healthcare Infection Society (HIS), Infection Prevention Society (IPS) and Royal College of Pathologists (RCPath) guidance. Journal of Hospital Infection, 114, 79–103.
- Cao, S.-J.; Ren, C. Ventilation control strategy using low-dimensional linear ventilation models and artificial neural network. 144. [CrossRef]
- Dai, H.; Zhao, B. Association of the infection probability of COVID-19 with ventilation rates in confined spaces. Build. Simul. 2020, 13, 1321–1327. [Google Scholar] [CrossRef] [PubMed]
- Li, Y.; Leung, G.M.; Tang, J.W.; Yang, X.; Chao, C.Y.H.; Lin, J.Z.; Lu, J.W.; Nielsen, P.V.; Niu, J.; Qian, H.; et al. Role of ventilation in airborne transmission of infectious agents in the built environment ? a multidisciplinary systematic review. Indoor Air 2007, 17, 2–18. [Google Scholar] [CrossRef] [PubMed]
- Li, Y. Li, Y., Qian, H., Hang, J., Chen, X., Cheng, P., Ling, H., Wang, S., Liang, P., Li, J., Xiao, S., Wei, J., Liu, L., Cowling, B.J., and Kang, M. Probable airborne transmission of SARS-CoV-2 in a poorly ventilated restaurant. Building and Environment 2021, 196, 107788. [Google Scholar] [CrossRef] [PubMed]
- Morawska, L. , Tang, J.W., Bahnfleth, W., Bluyssen, P.M., Boerstra, A., Buonanno, G., Cao, J., Dancer, S., Floto, A., Franchimon, F., Haworth, C., Hogeling, J., Isaxon, C., Jimenez, J.L., Kurnitski, J., Li, Y., Loomans, M., Marks, G., Marr, L.C., Mazzarella, L., Melikov, A.K., Miller, S., Milton, D.K., Nazaroff, W., Nielsen, P. V., Noakes, C., Peccia, J., Querol, X., Sekhar, C., Seppänen, O., Tanabe, S. ichi, Tellier, R., Tham, K.W., Wargocki, P., Wierzbicka, A., and Yao, M., 2020. How can airborne transmission of COVID-19 indoors be minimised? Environment International, 142, 105832.
- Motamedi, H.; Shirzadi, M.; Tominaga, Y.; Mirzaei, P.A. CFD modeling of airborne pathogen transmission of COVID-19 in confined spaces under different ventilation strategies. Sustain. Cities Soc. 2021, 76, 103397–103397. [Google Scholar] [CrossRef] [PubMed]
- REHVA, 2020. REHVA COVID-19 guidance document, How to operate and use building services in order to prevent the spread of the coronavirus disease (COVID-19) virus (SARS-CoV-2) in workplaces.
- Sahu, A.K.; Verma, T.N.; Sinha, S.L. Numerical Simulation of Air Flow in Multiple Beds Intensive Care Unit of Hospital. Int. J. Automot. Mech. Eng. 2019, 16, 6796–6807. [Google Scholar] [CrossRef]
- Salamone, F.; Barozzi, B.; Bellazzi, A.; Belussi, L.; Danza, L.; Devitofrancesco, A.; Ghellere, M.; Meroni, I.; Scamoni, F.; Scrosati, C. Working from Home in Italy during COVID-19 Lockdown: A Survey to Assess the Indoor Environmental Quality and Productivity. Buildings 2021, 11, 660. [Google Scholar] [CrossRef]
- Verma, T.N., Sahu, A.K., and Sinha, S.L., 2018. Numerical Simulation of Air Pollution Control in Hospital. 185–206.
- World Health Organization, 2021. Coronavirus disease (COVID-19): How is it transmitted? [online].
- Xu, C.; Liu, W.; Luo, X.; Huang, X.; Nielsen, P. V. Prediction and control of aerosol transmission of SARS-CoV-2 in ventilated context: from source to receptor. Sustainable Cities and Society 2022, 76, 103416. [Google Scholar] [CrossRef] [PubMed]
- Xu, C.; Luo, X.; Yu, C.; Cao, S.-J. The 2019-nCoV epidemic control strategies and future challenges of building healthy smart cities. Indoor Built Environ. 2020, 29, 639–644. [Google Scholar] [CrossRef]
- Yang, J.-H. CFD Analysis of the Inhaled-Air Quality for the Inpatients in a Four-Bed Sickroom. J. Asian Arch. Build. Eng. 2013, 12, 109–116. [Google Scholar] [CrossRef]
Figure 2.
Isometric view of the isolation room model (benchmark) (Sahu et al. 2019).
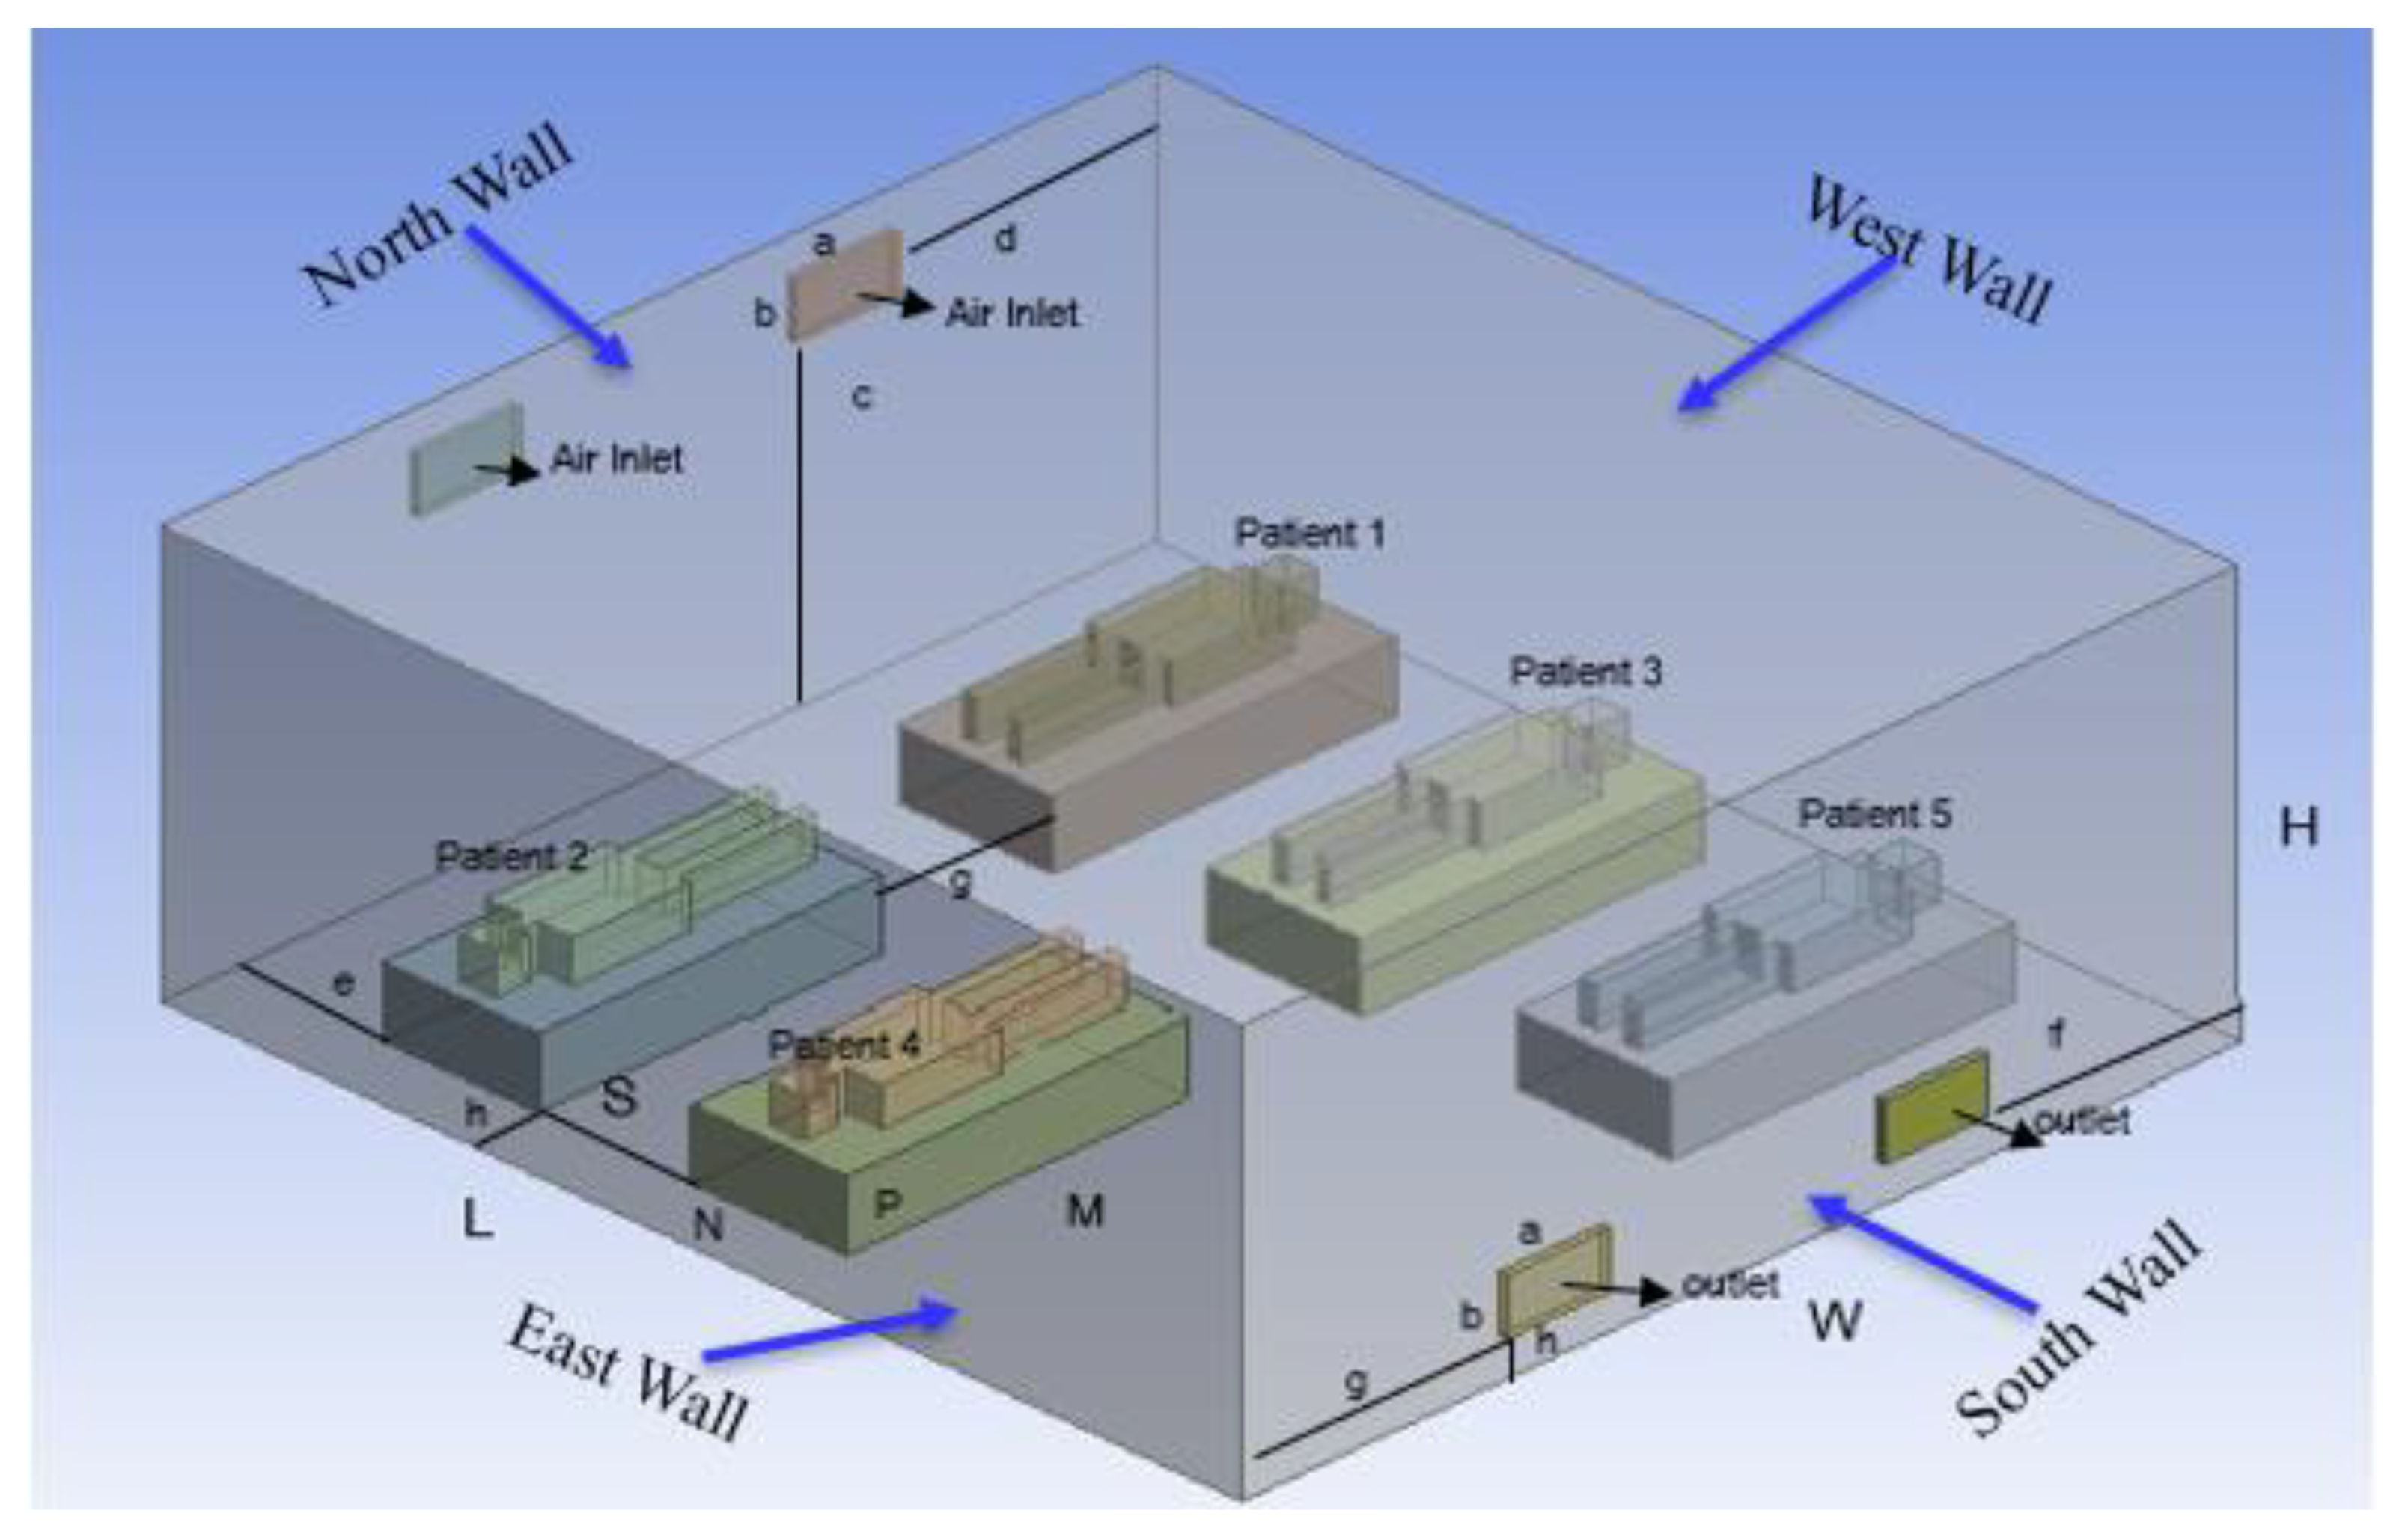
Figure 7.
Vertical straight line measured from floor to ceiling.
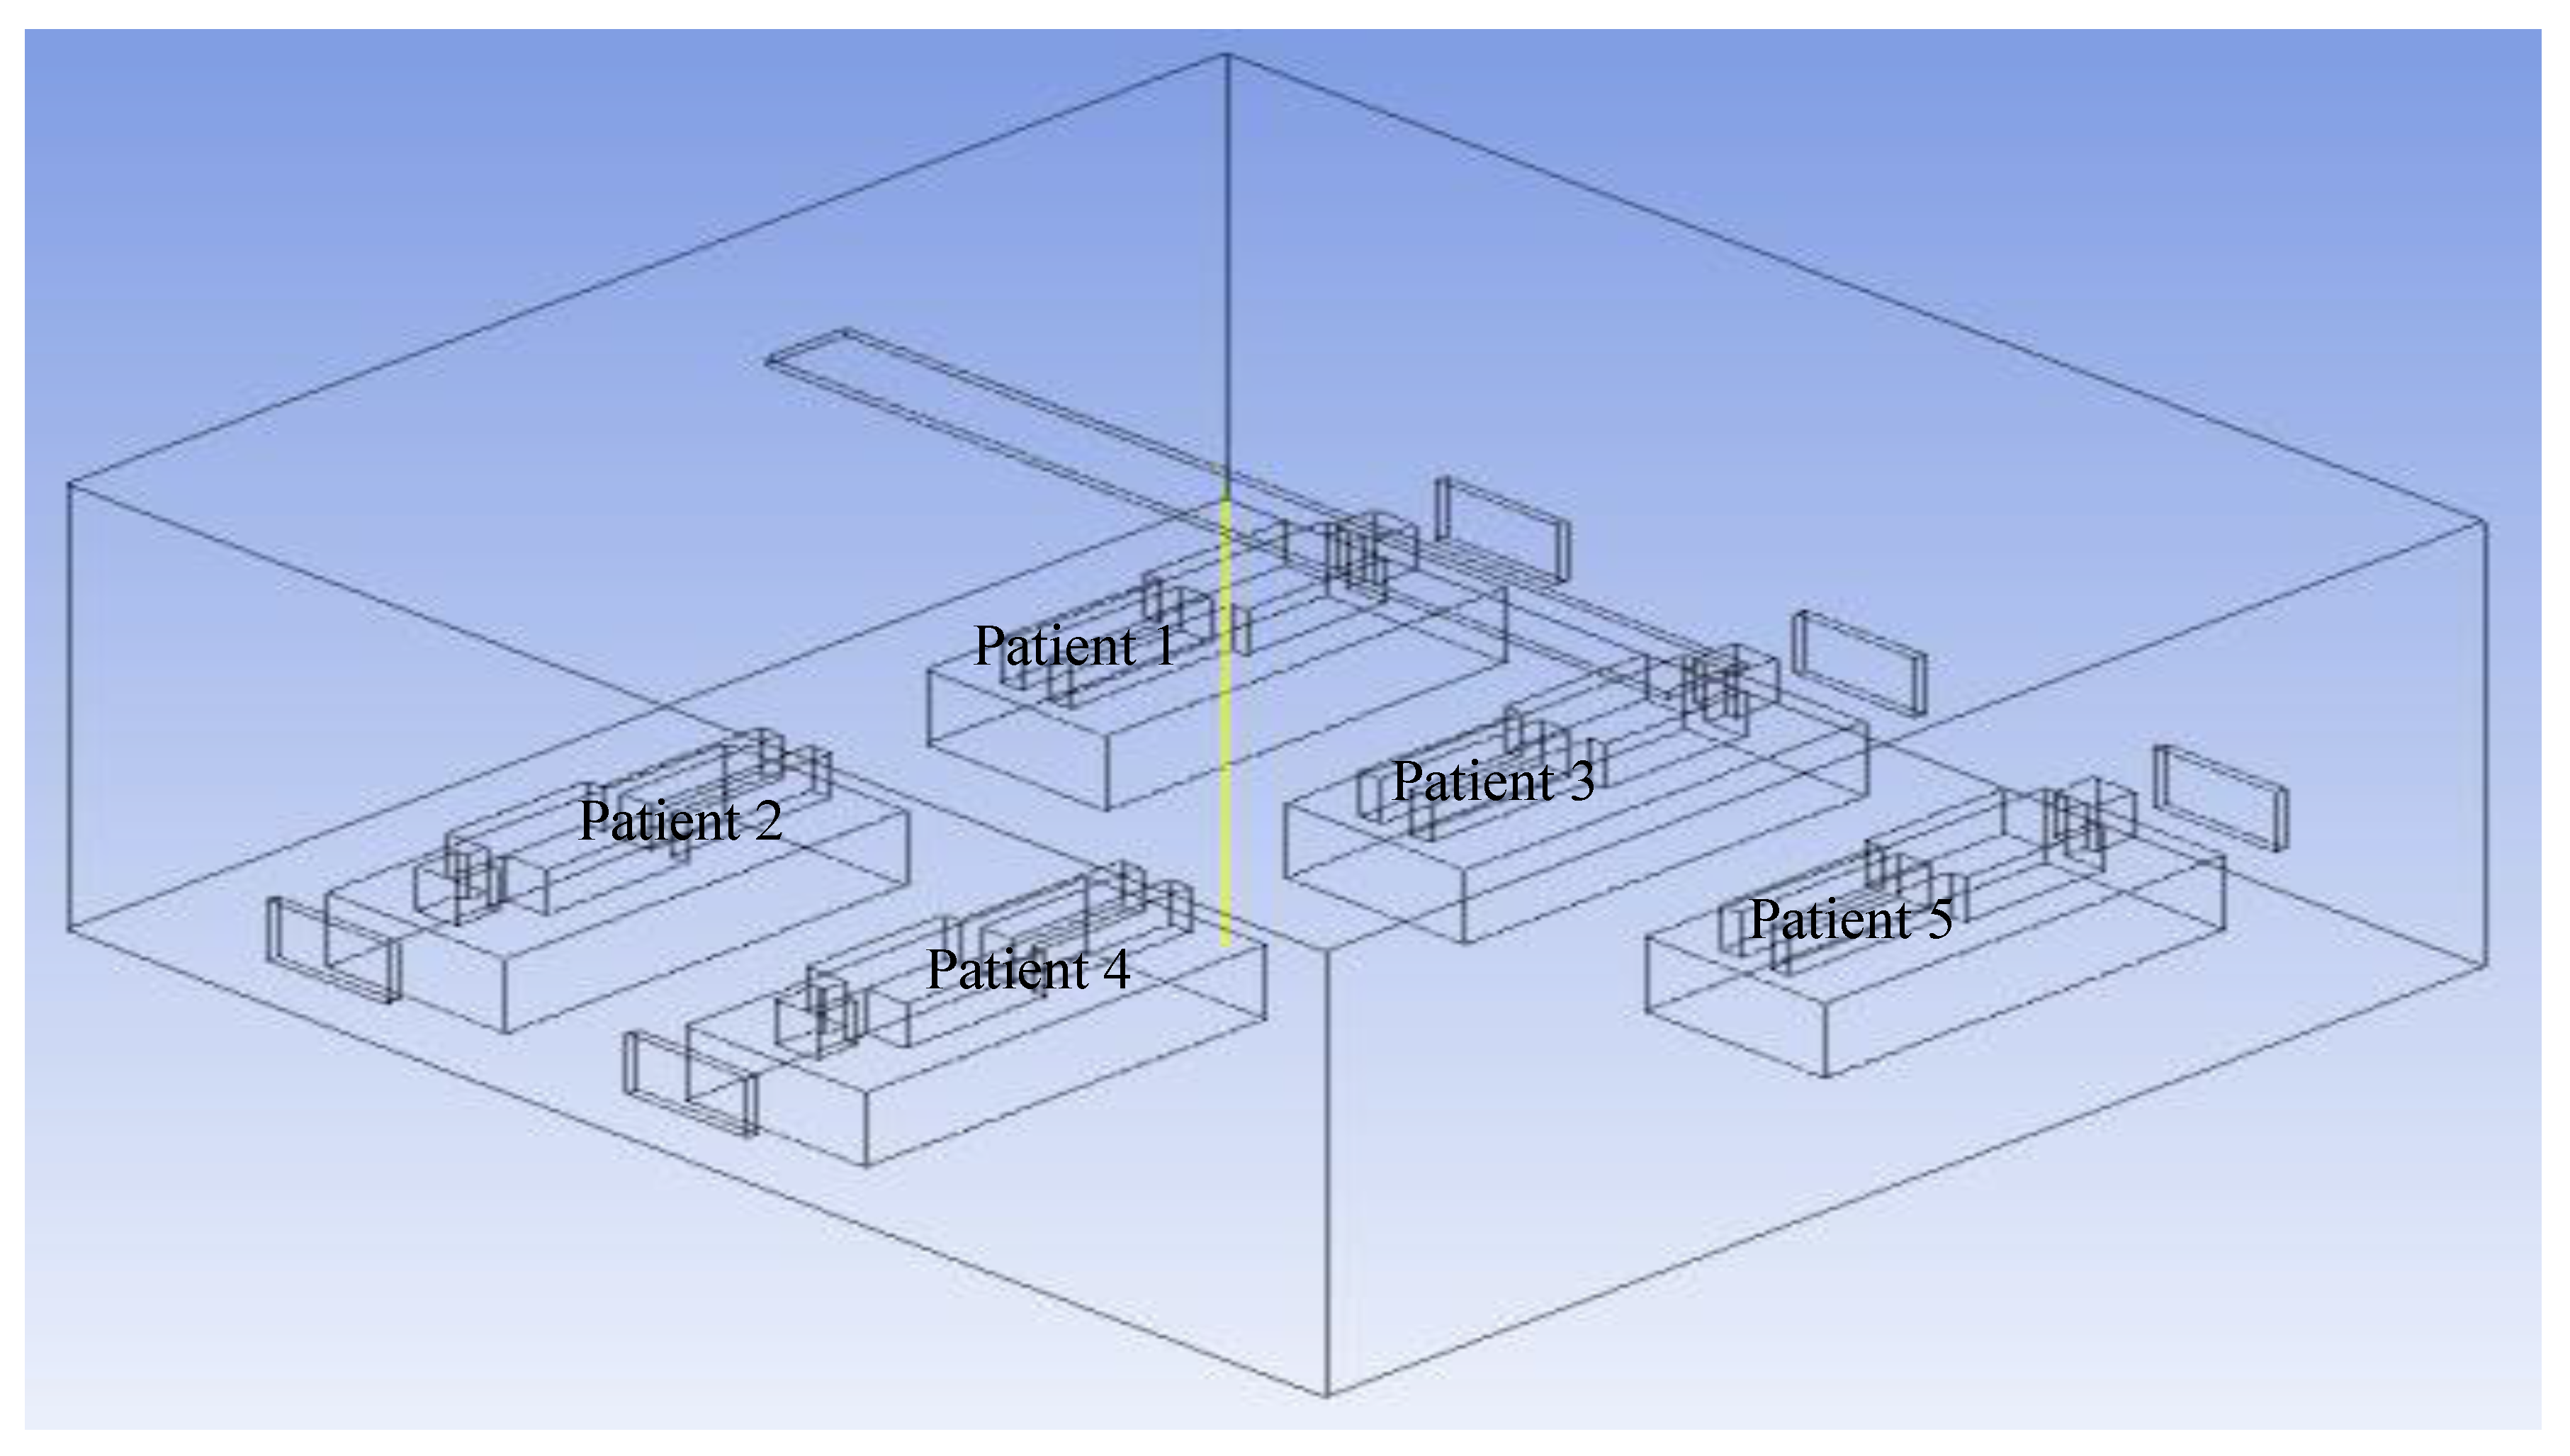
Figure 8.
Comparison between three different mesh grids: (a) coarse mesh, (b) present analysis mesh, and (c) fine mesh.
Figure 8.
Comparison between three different mesh grids: (a) coarse mesh, (b) present analysis mesh, and (c) fine mesh.
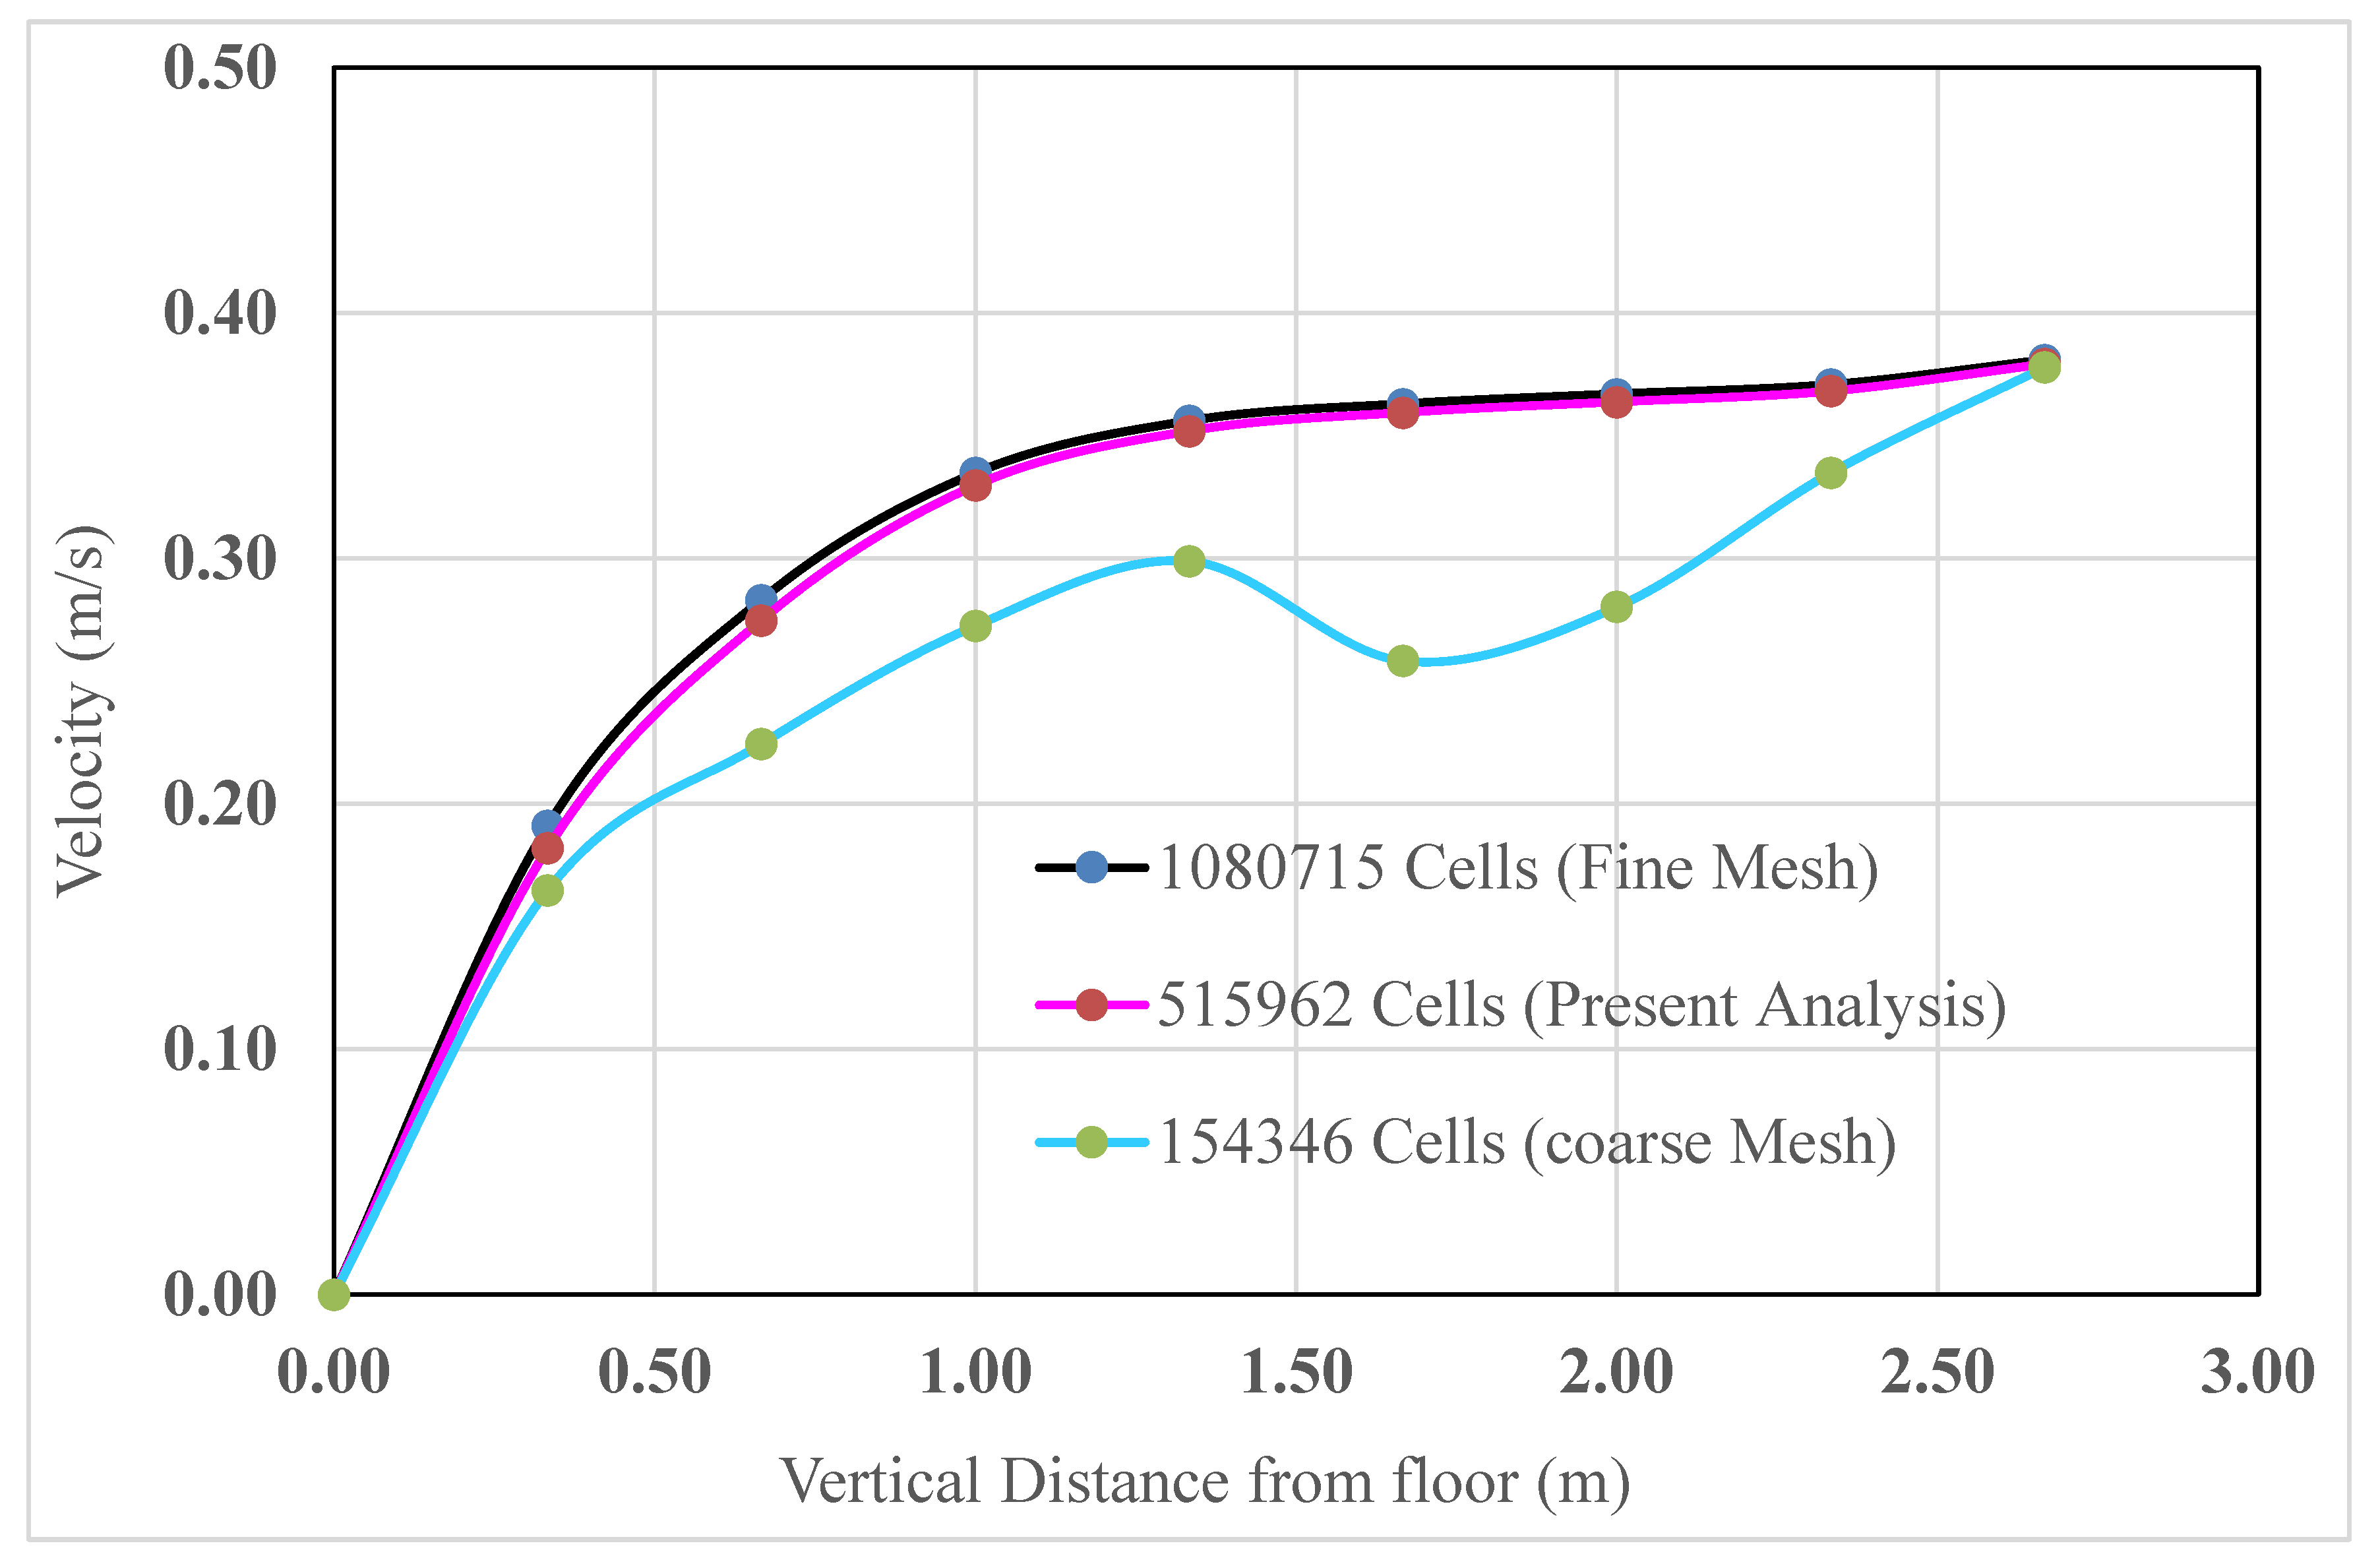
Figure 9.
Comparison of velocity distributions at various positions in the isolation room.
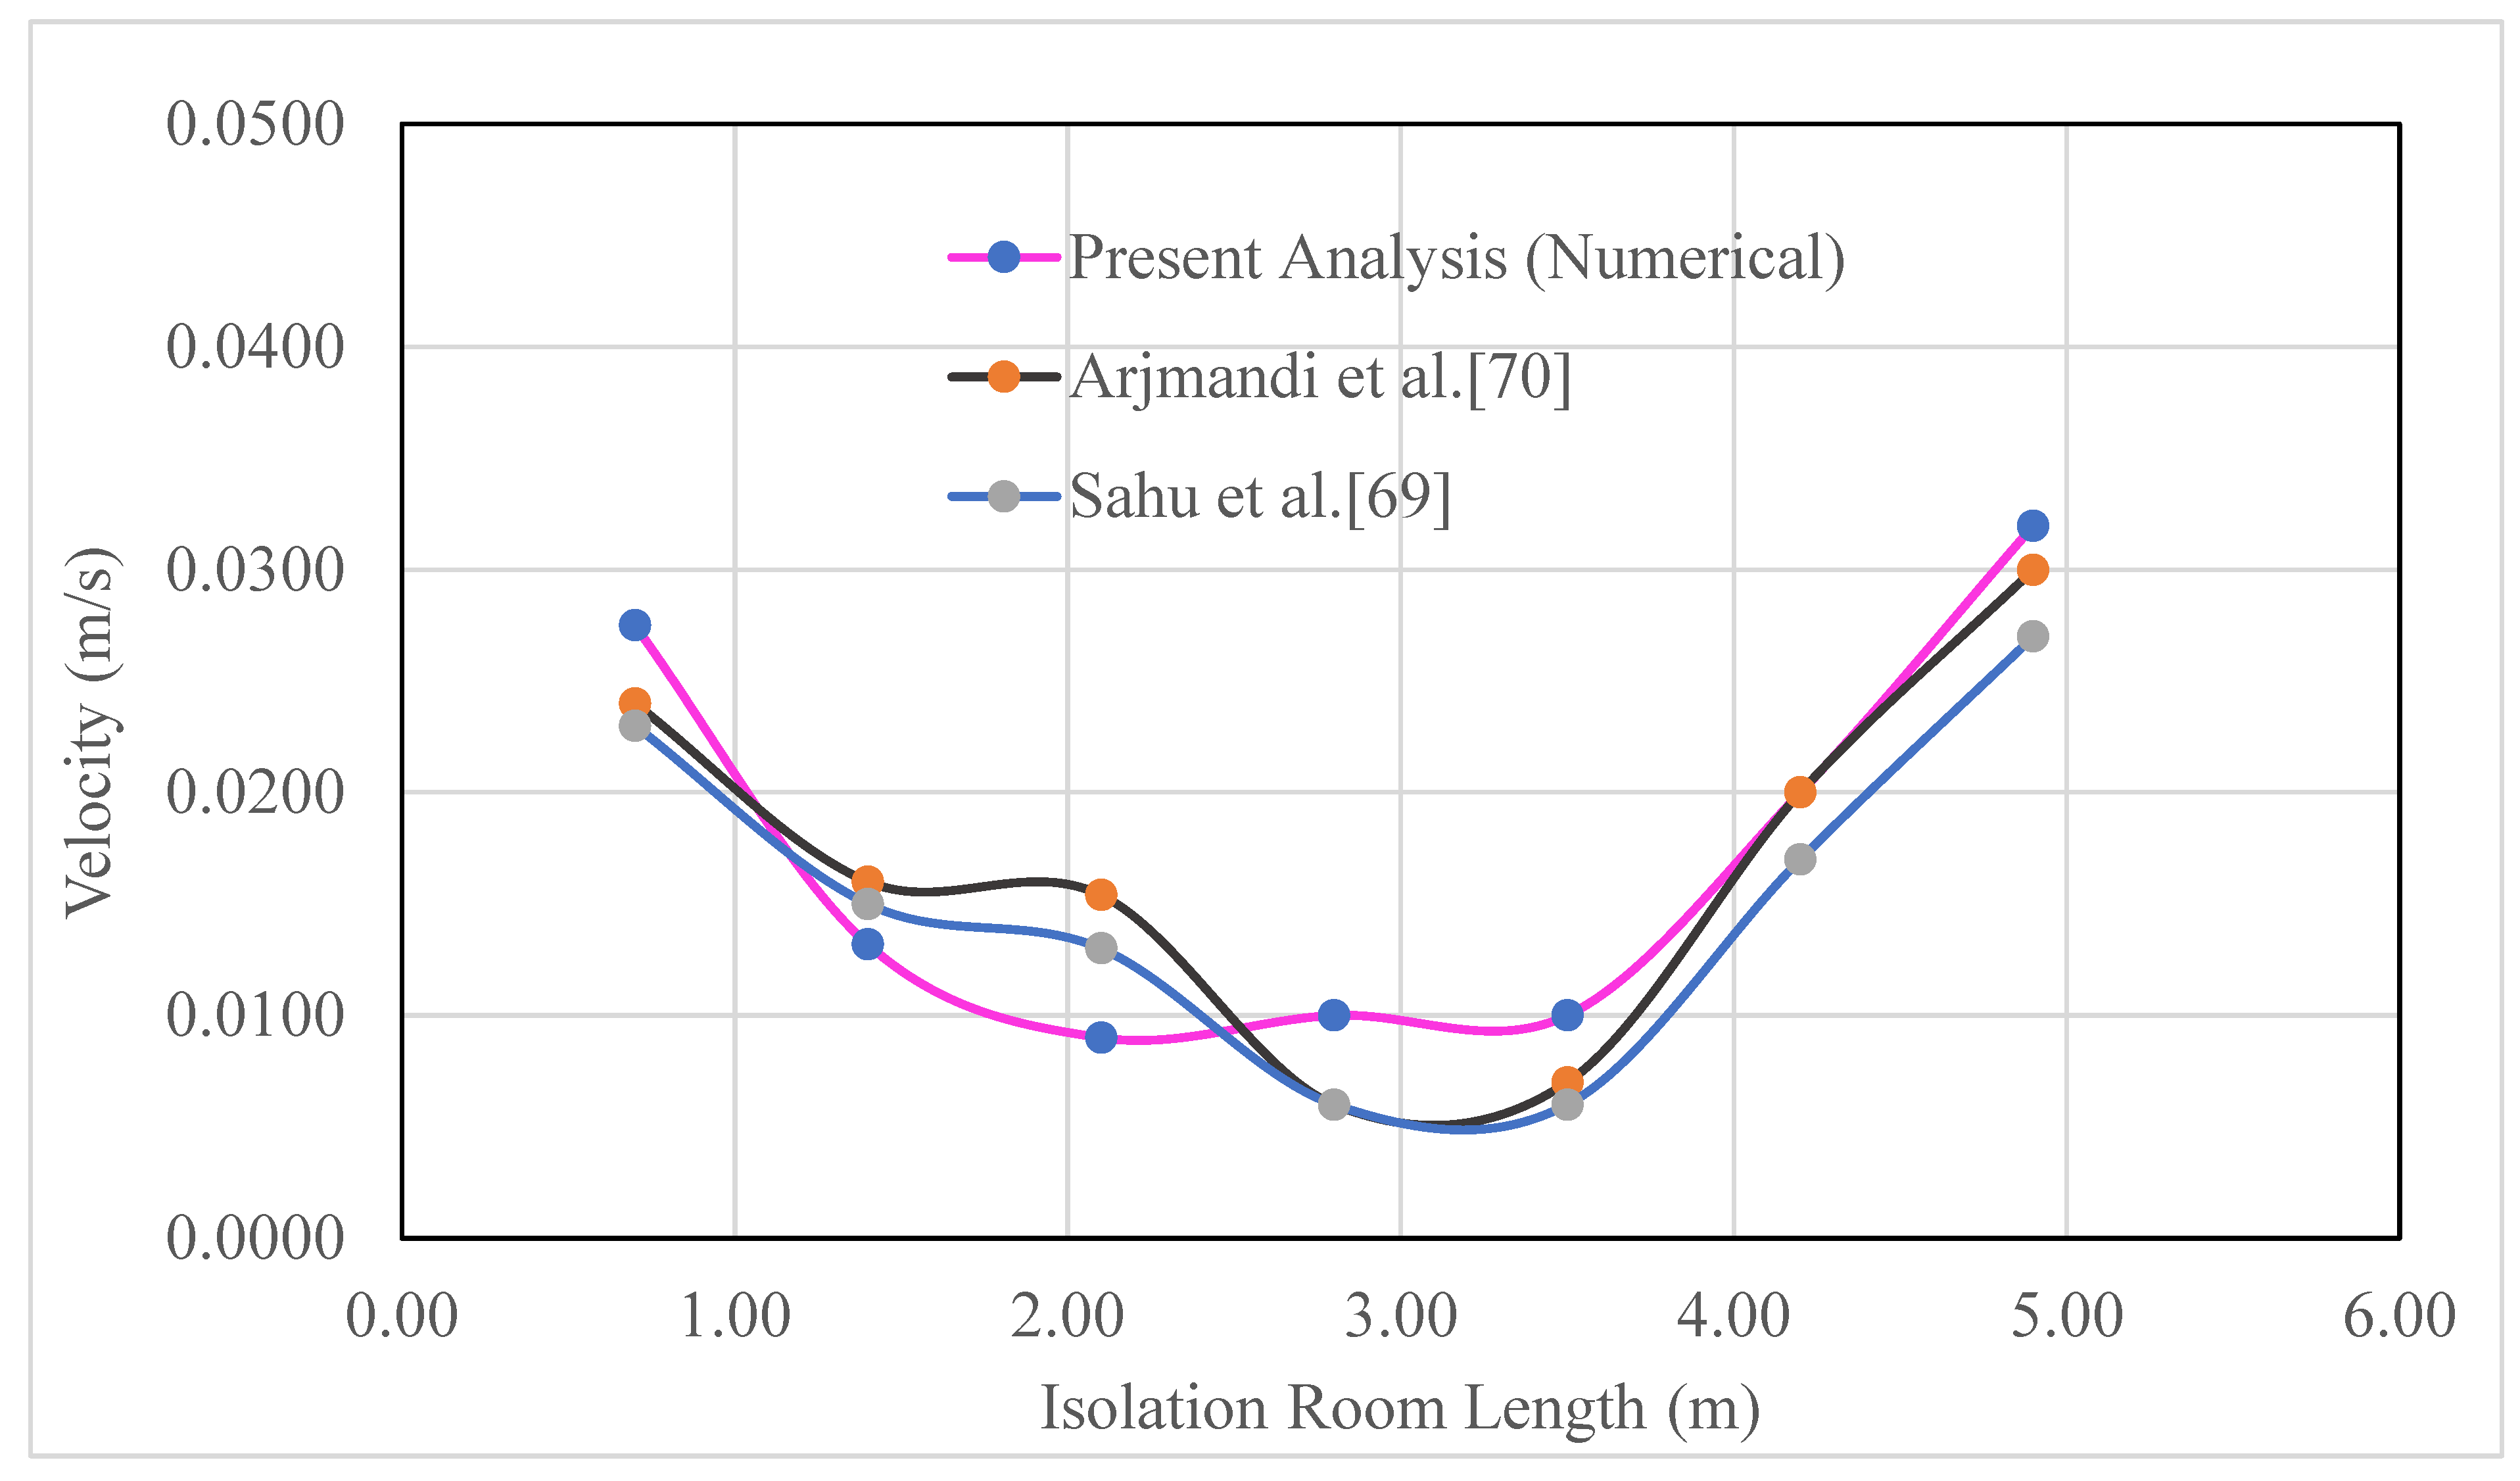
Figure 10.
Experimental model of isolation room (front side).
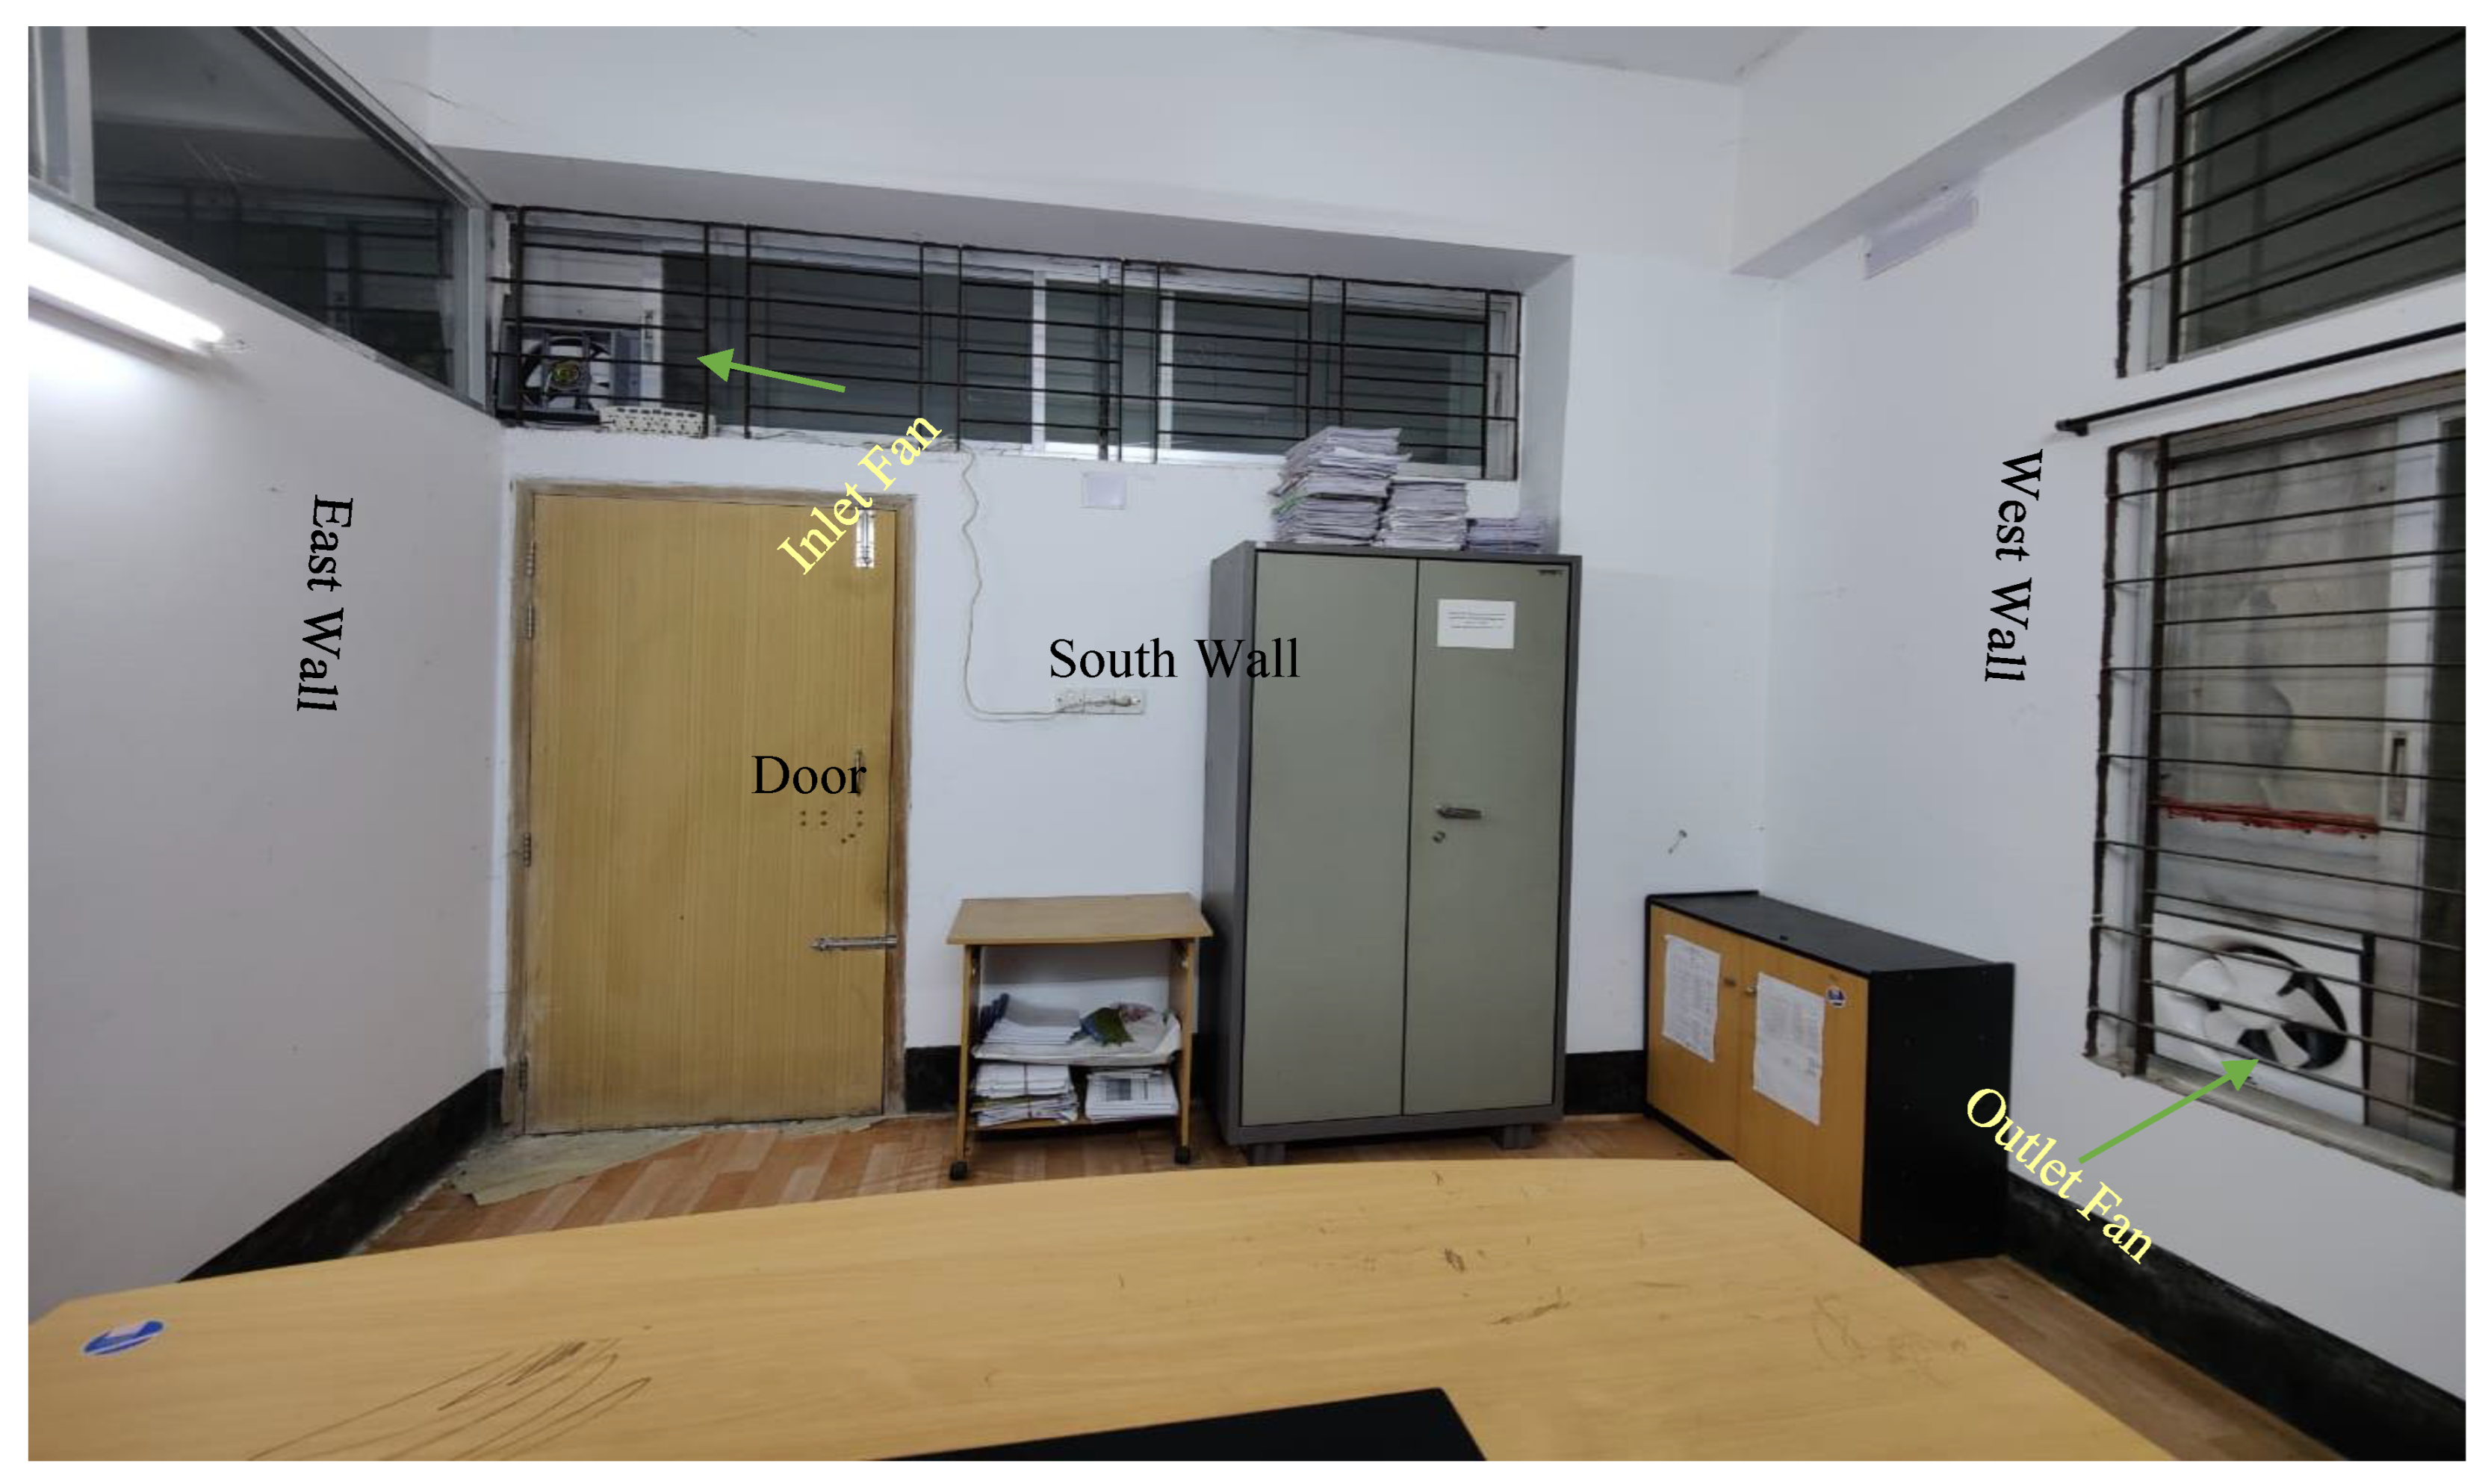
Figure 11.
Experimental model of isolation room (rear side).
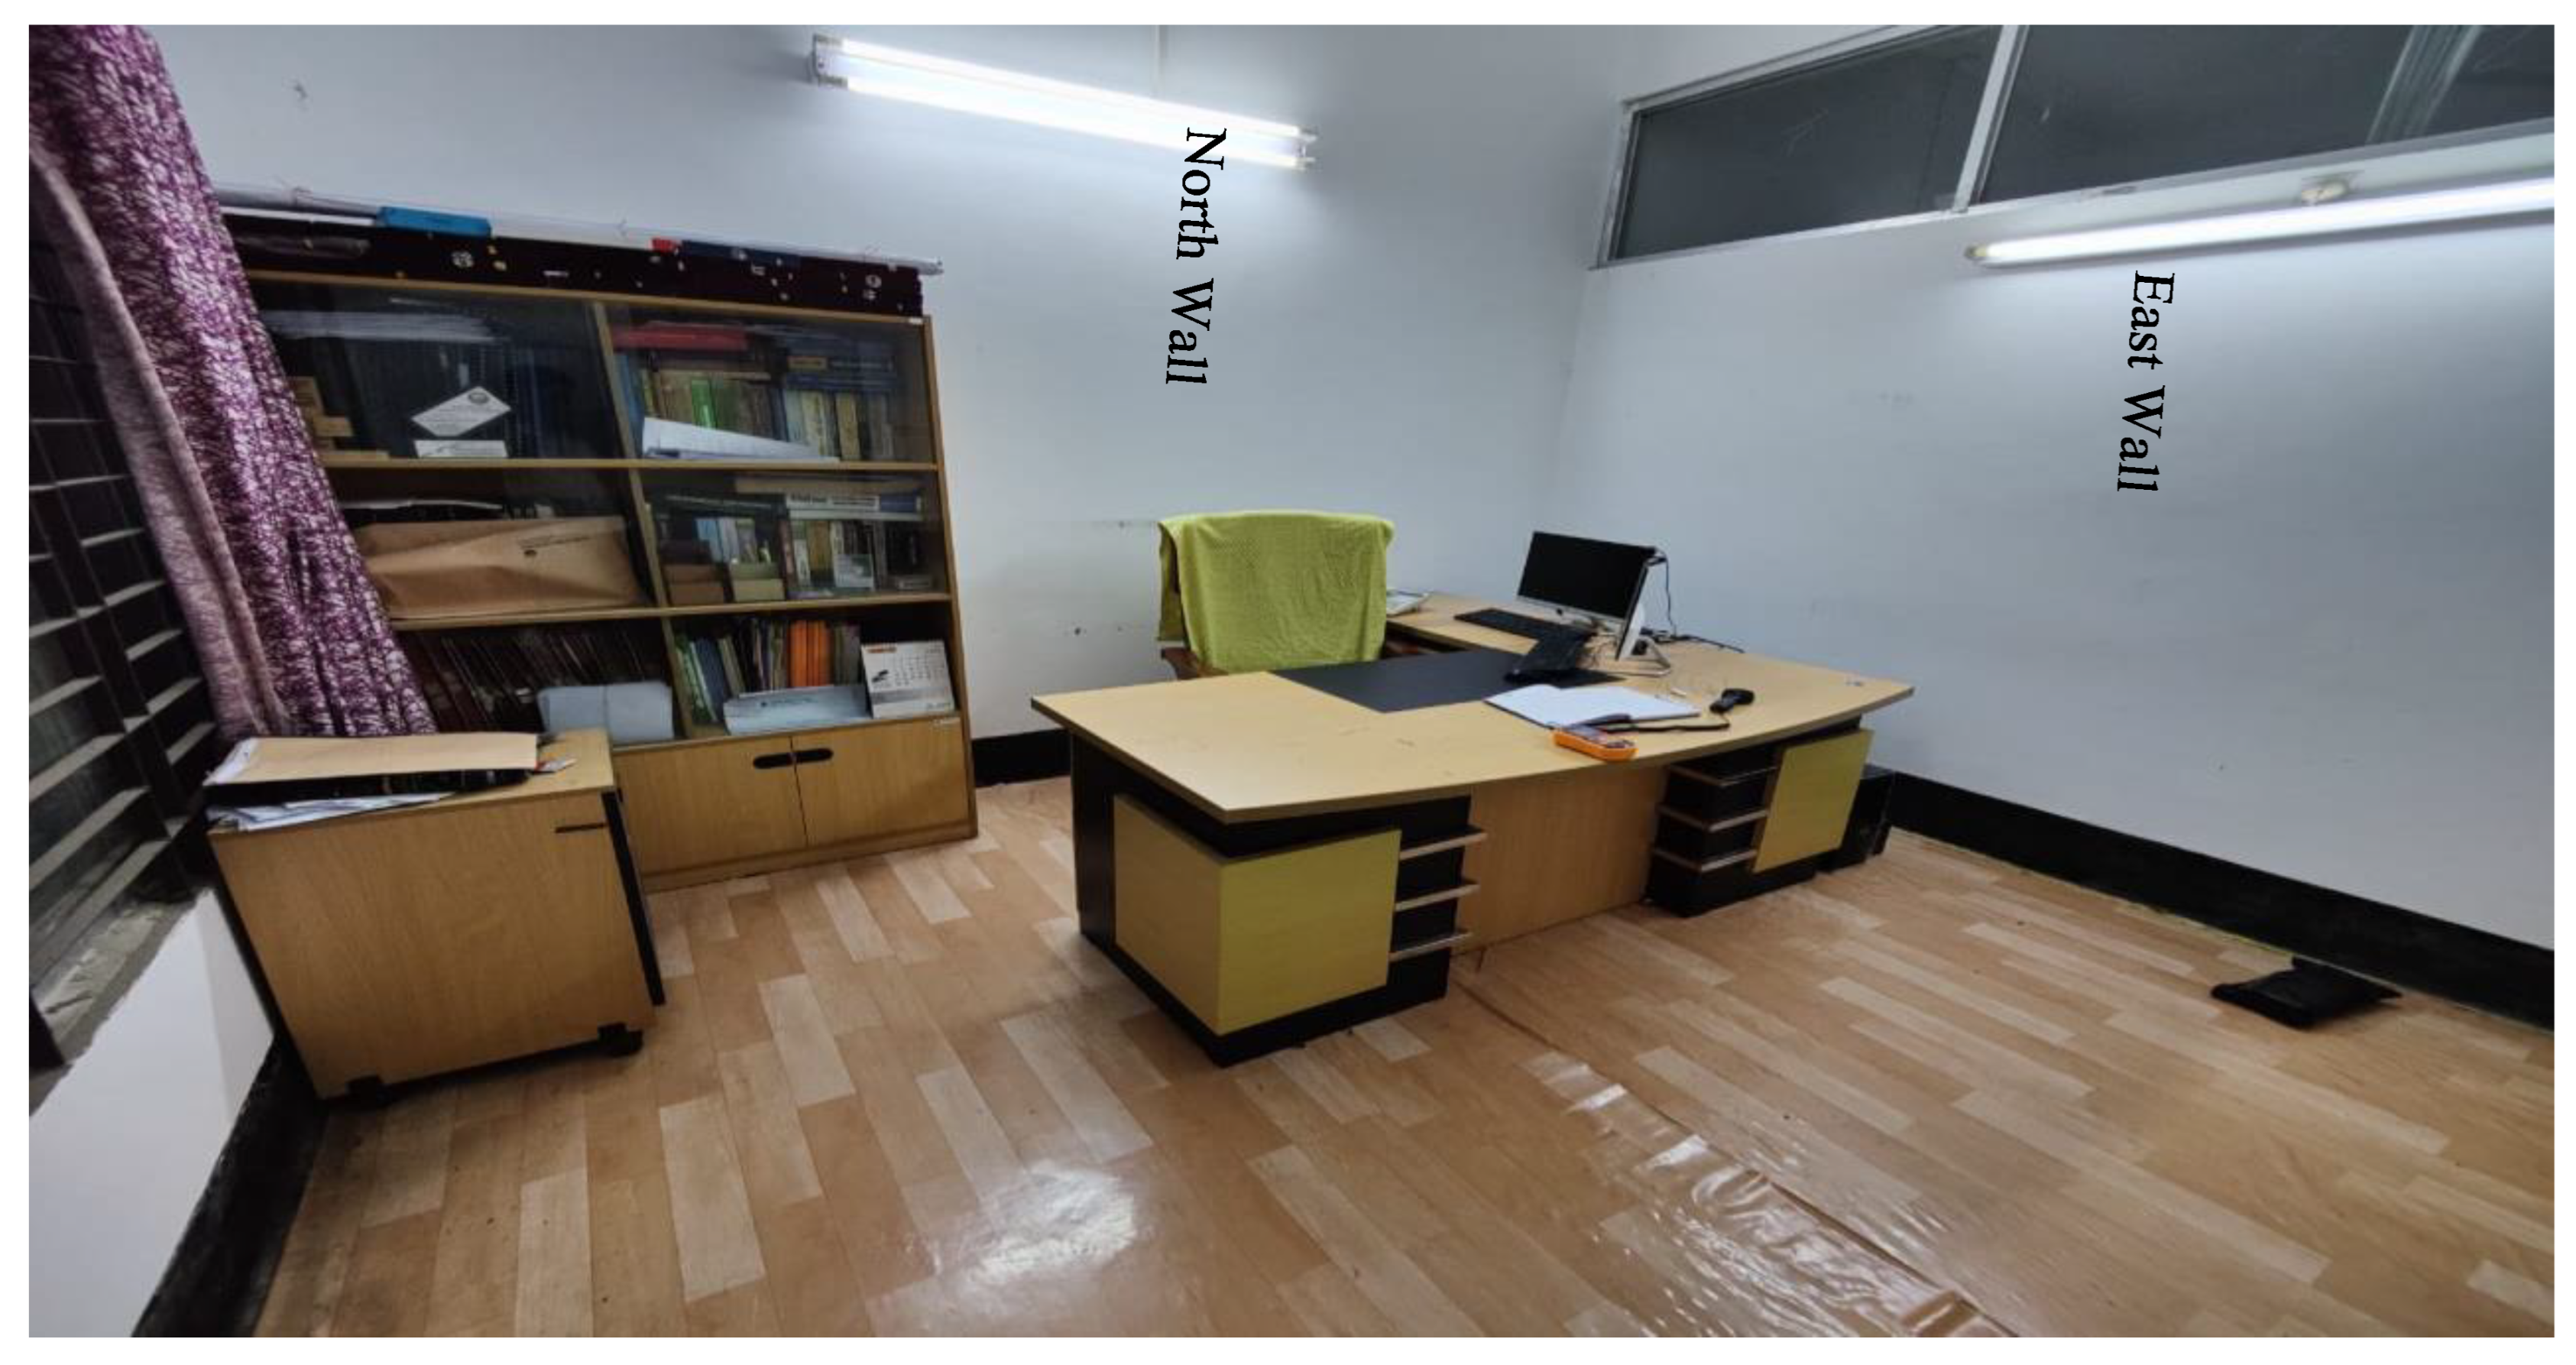
Figure 12.
Numerical model of experimental isolation room.
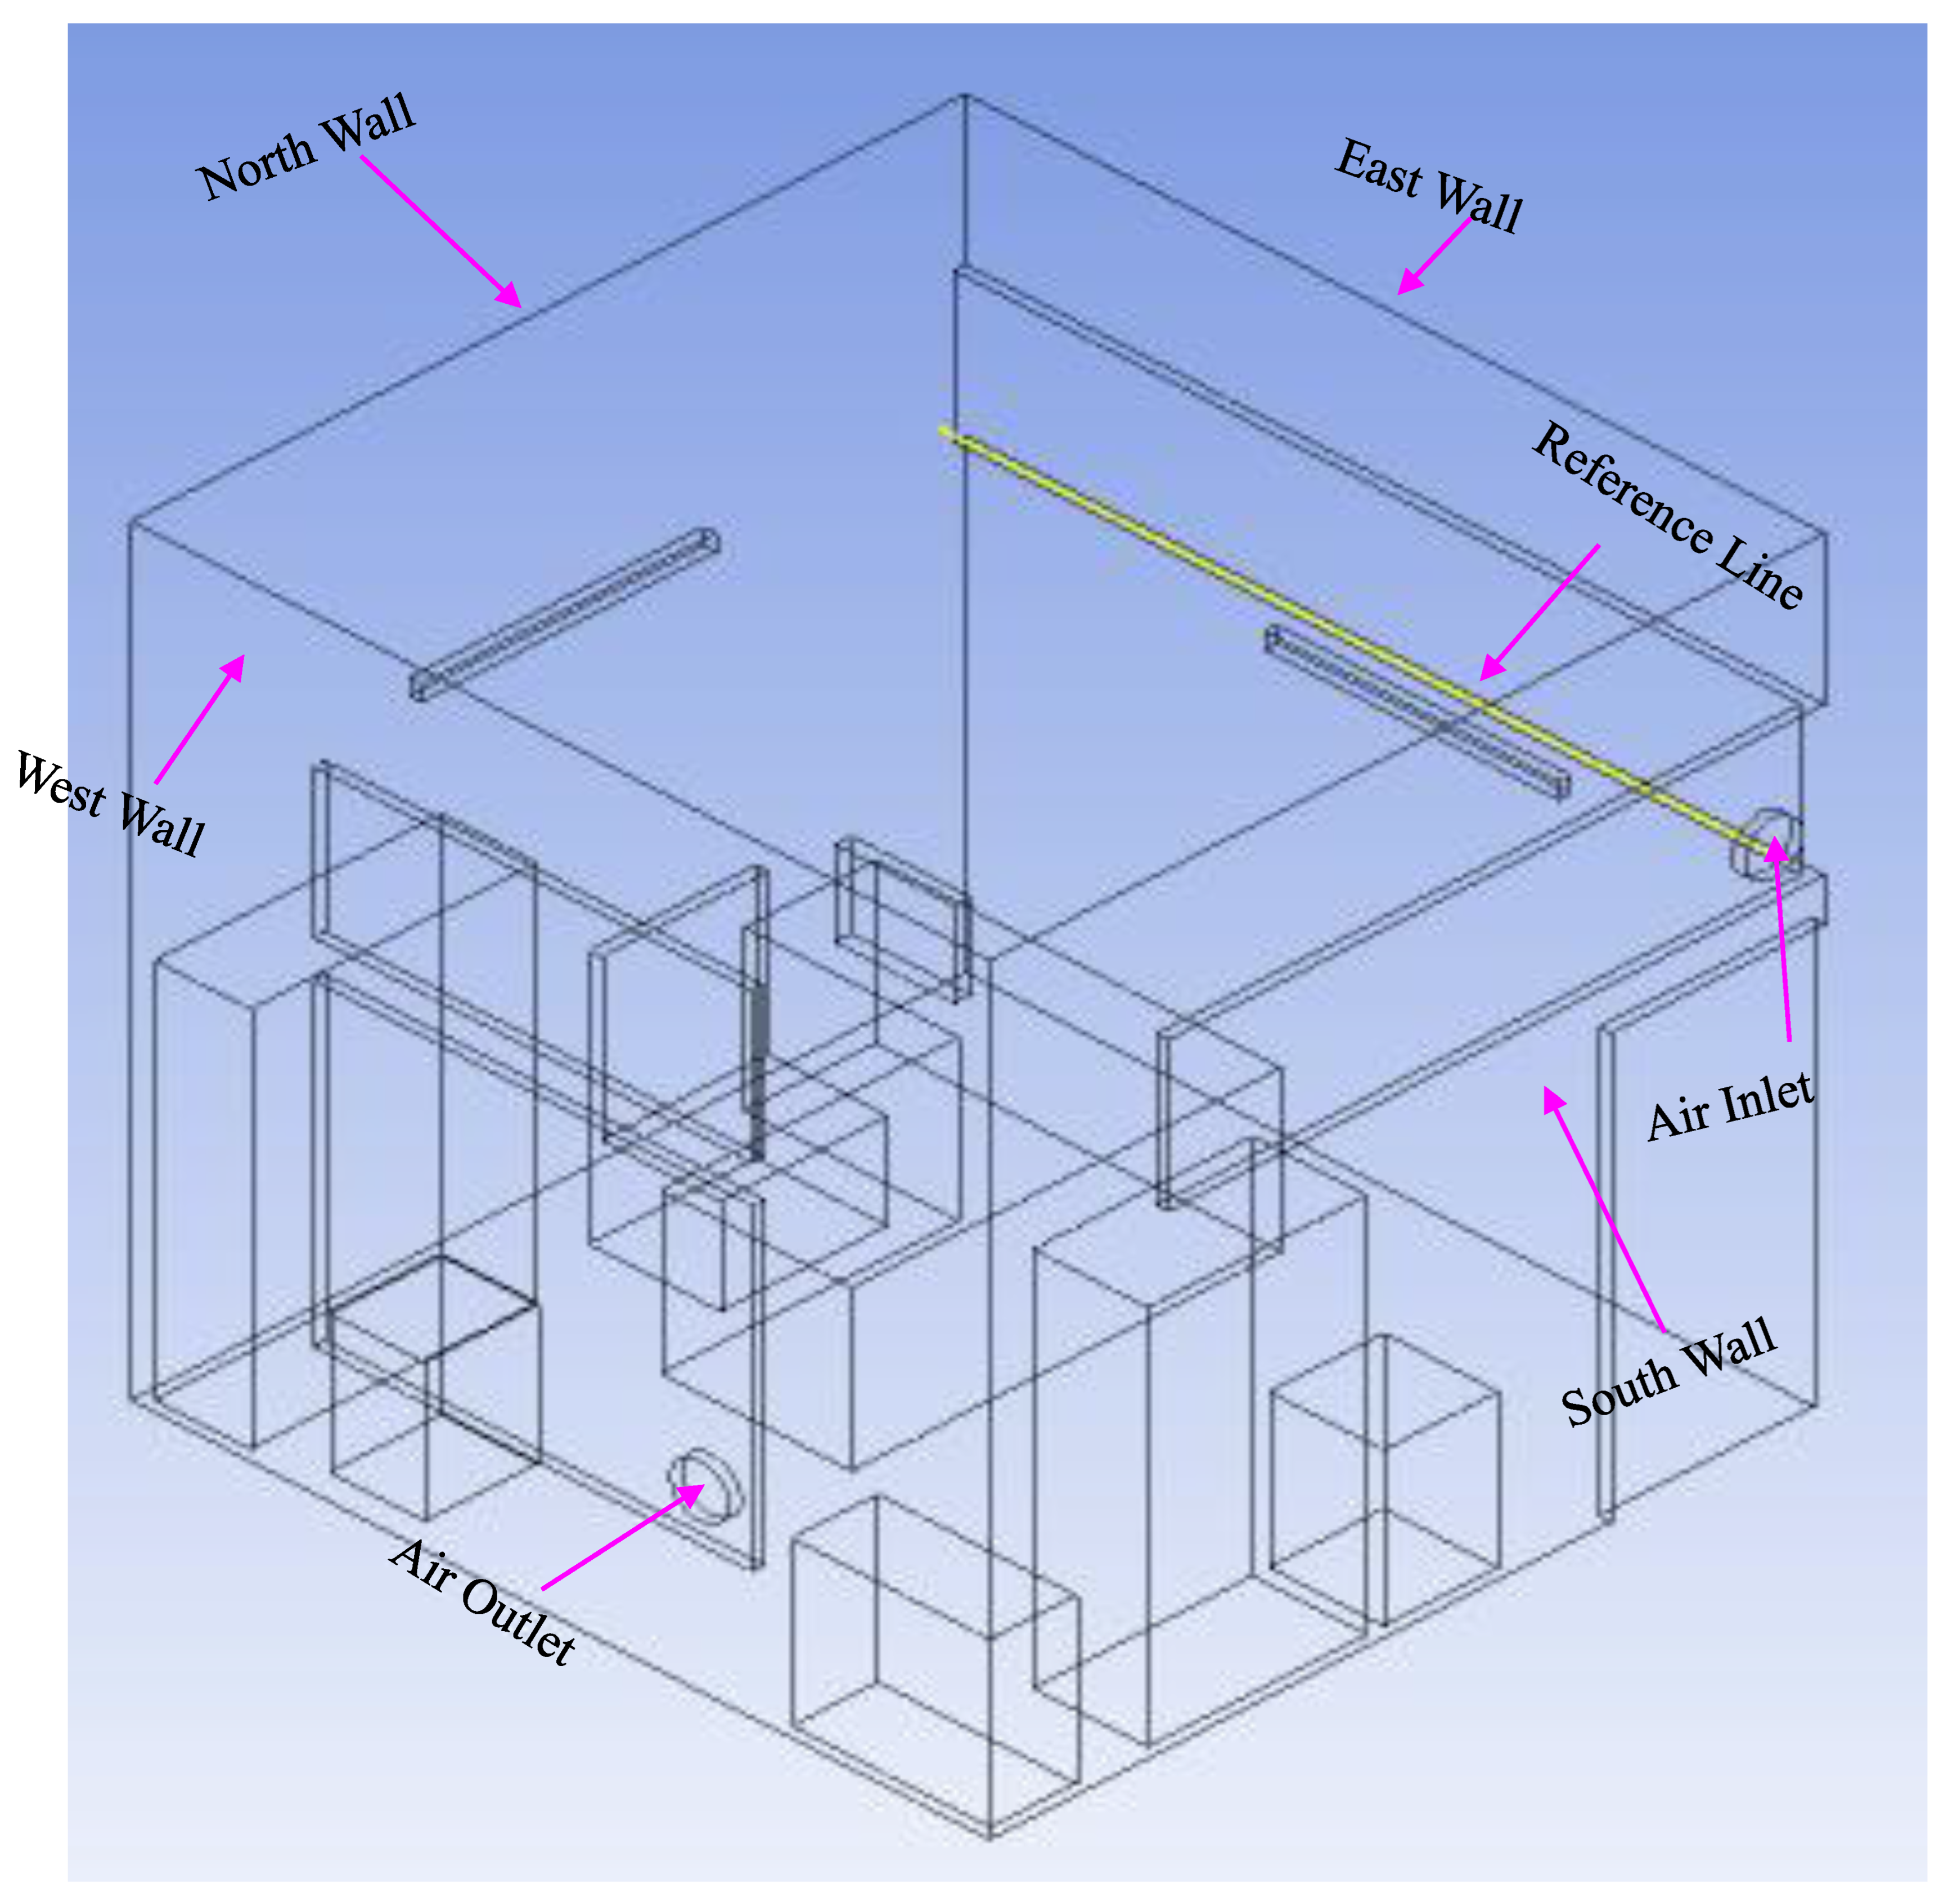
Figure 13.
Comparison of velocity variation along room length between experimental and computational data in the isolation room.
Figure 13.
Comparison of velocity variation along room length between experimental and computational data in the isolation room.
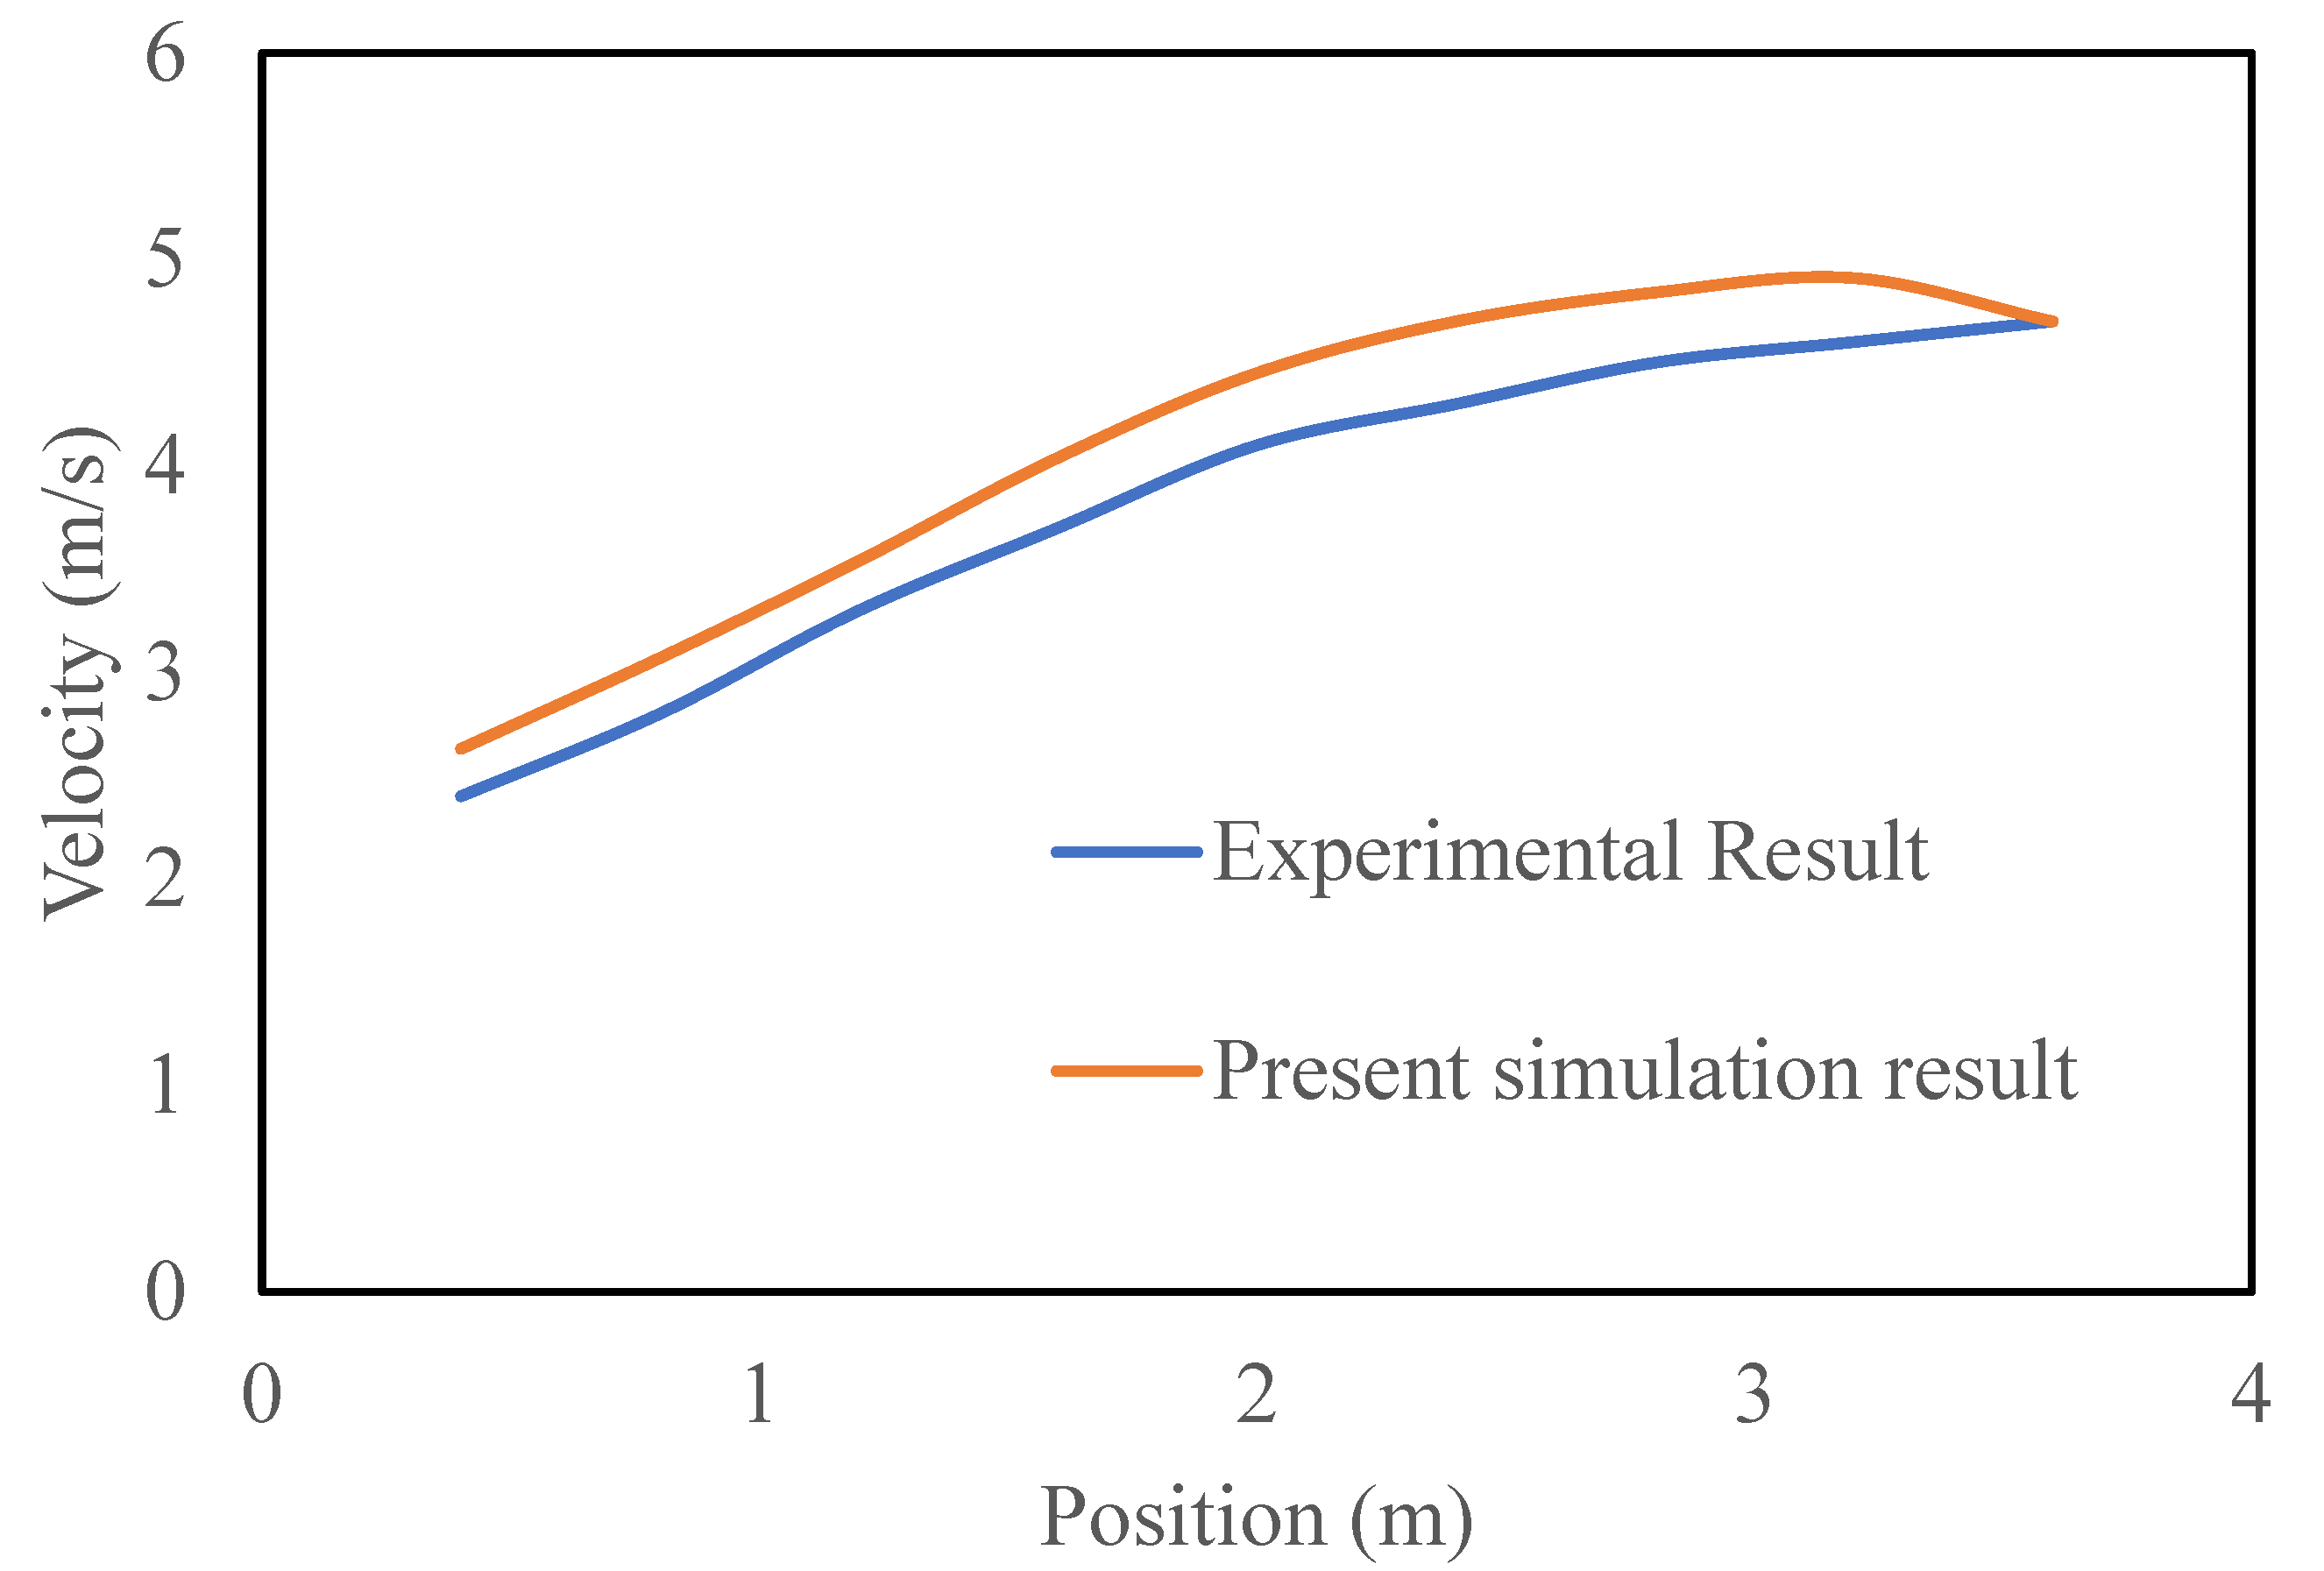
Figure 14.
Steady-state airflow streamlines for different modifications. a) Steady-state airflow streamlines in benchmark. b) Steady-state airflow streamlines in modification 1. c) Steady-state airflow streamlines in Modification 2. d) Steady-state airflow streamlines in modification 3.
Figure 14.
Steady-state airflow streamlines for different modifications. a) Steady-state airflow streamlines in benchmark. b) Steady-state airflow streamlines in modification 1. c) Steady-state airflow streamlines in Modification 2. d) Steady-state airflow streamlines in modification 3.
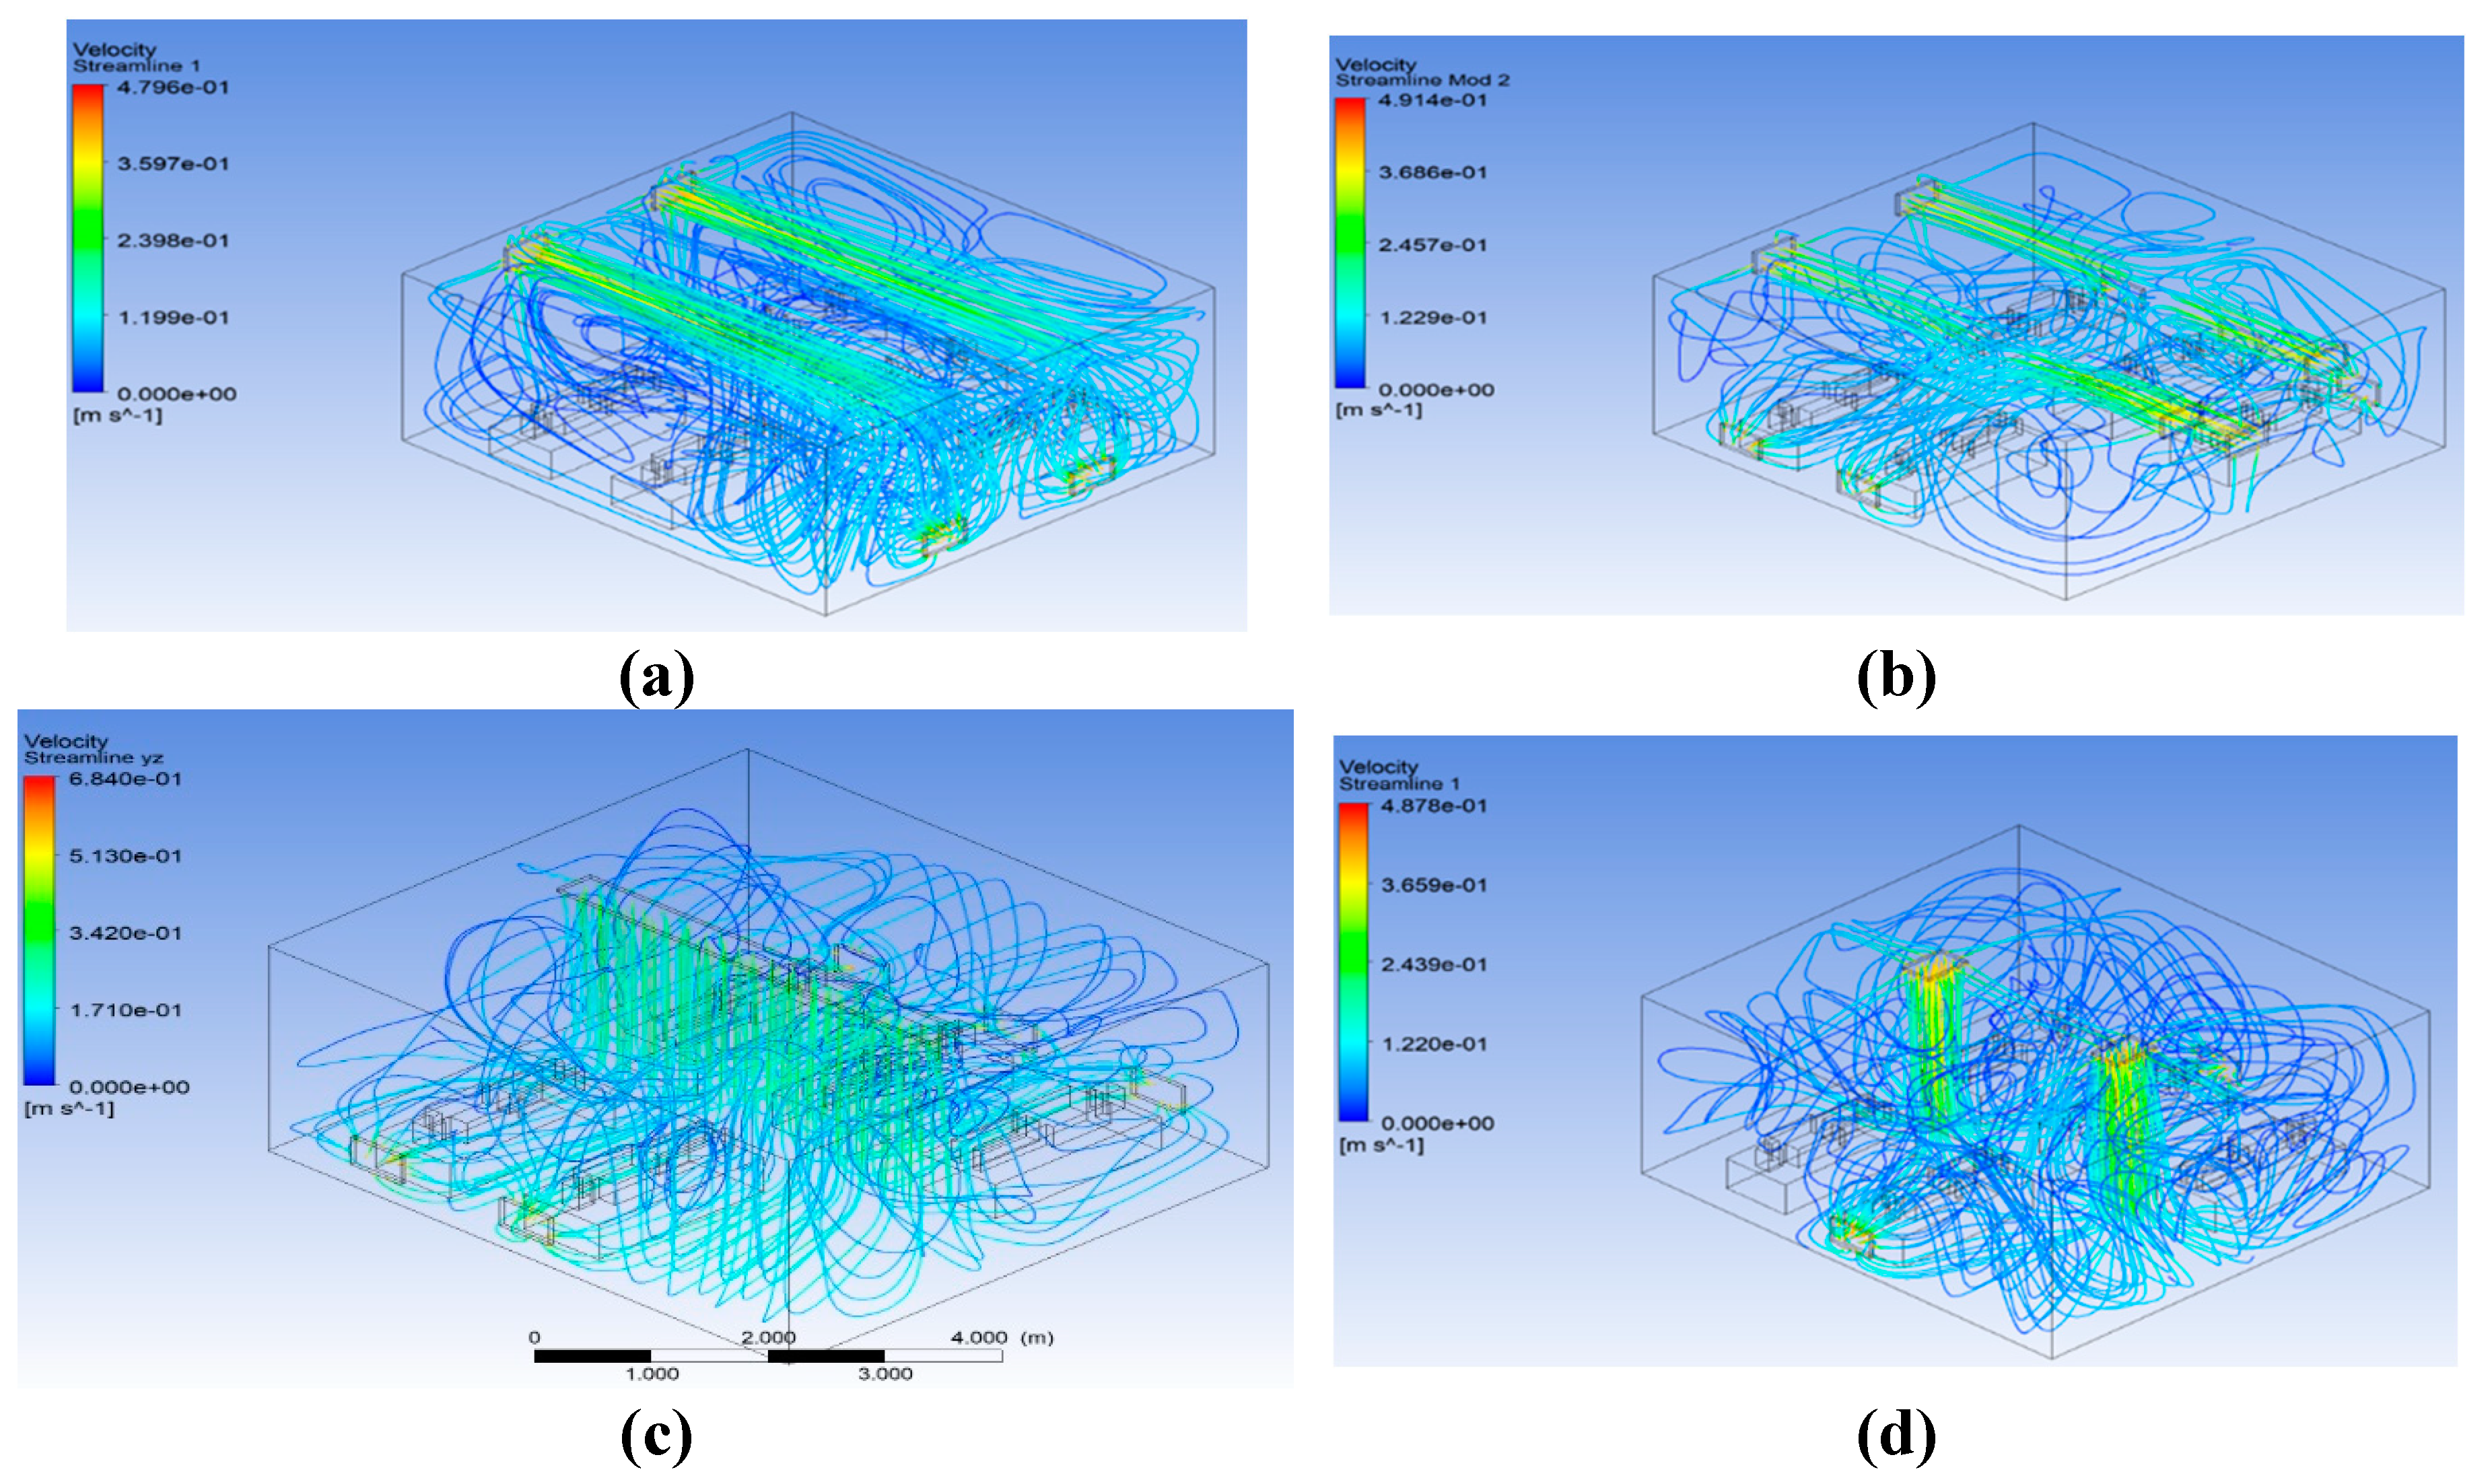
Figure 15.
Velocity vector at patient’s 1, 3, and 5 (a) benchmark (b) Modification 1, (c) Modification 2 (d) Modification 3.
Figure 15.
Velocity vector at patient’s 1, 3, and 5 (a) benchmark (b) Modification 1, (c) Modification 2 (d) Modification 3.
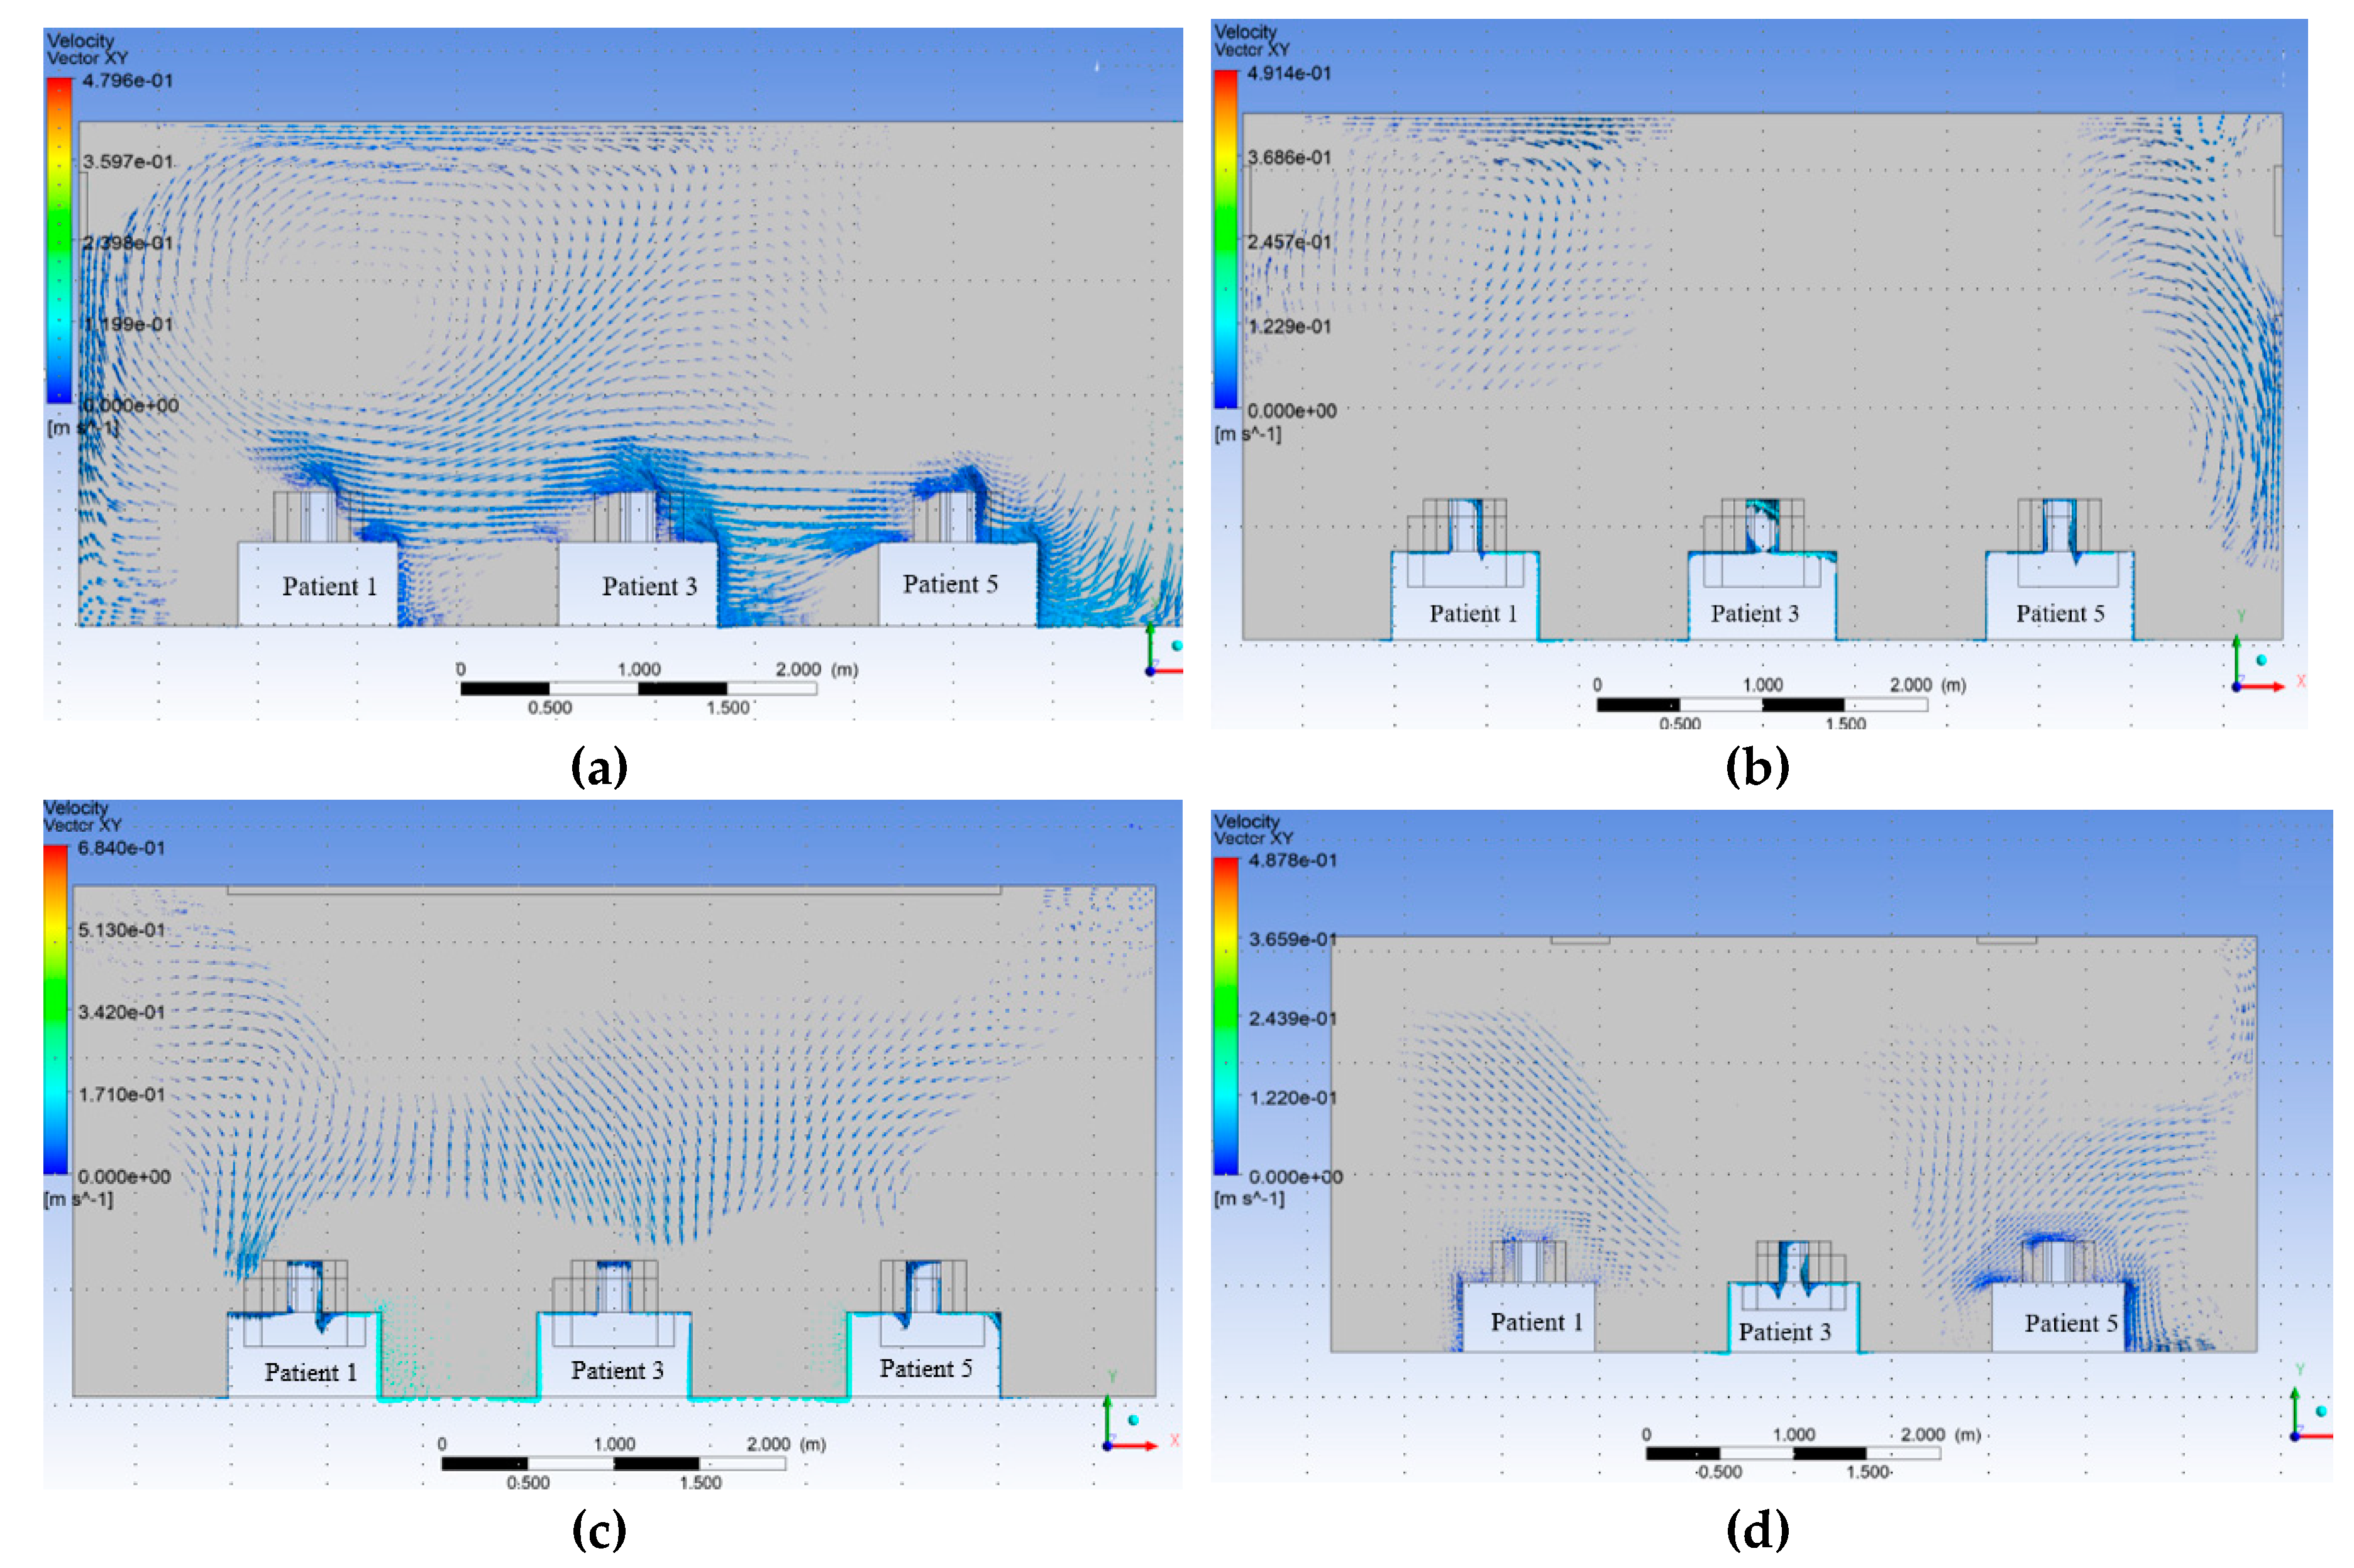
Figure 16.
Comparison of velocity distribution in the isolation room for patients 1, 3, and 5 for various modification cases.
Figure 16.
Comparison of velocity distribution in the isolation room for patients 1, 3, and 5 for various modification cases.
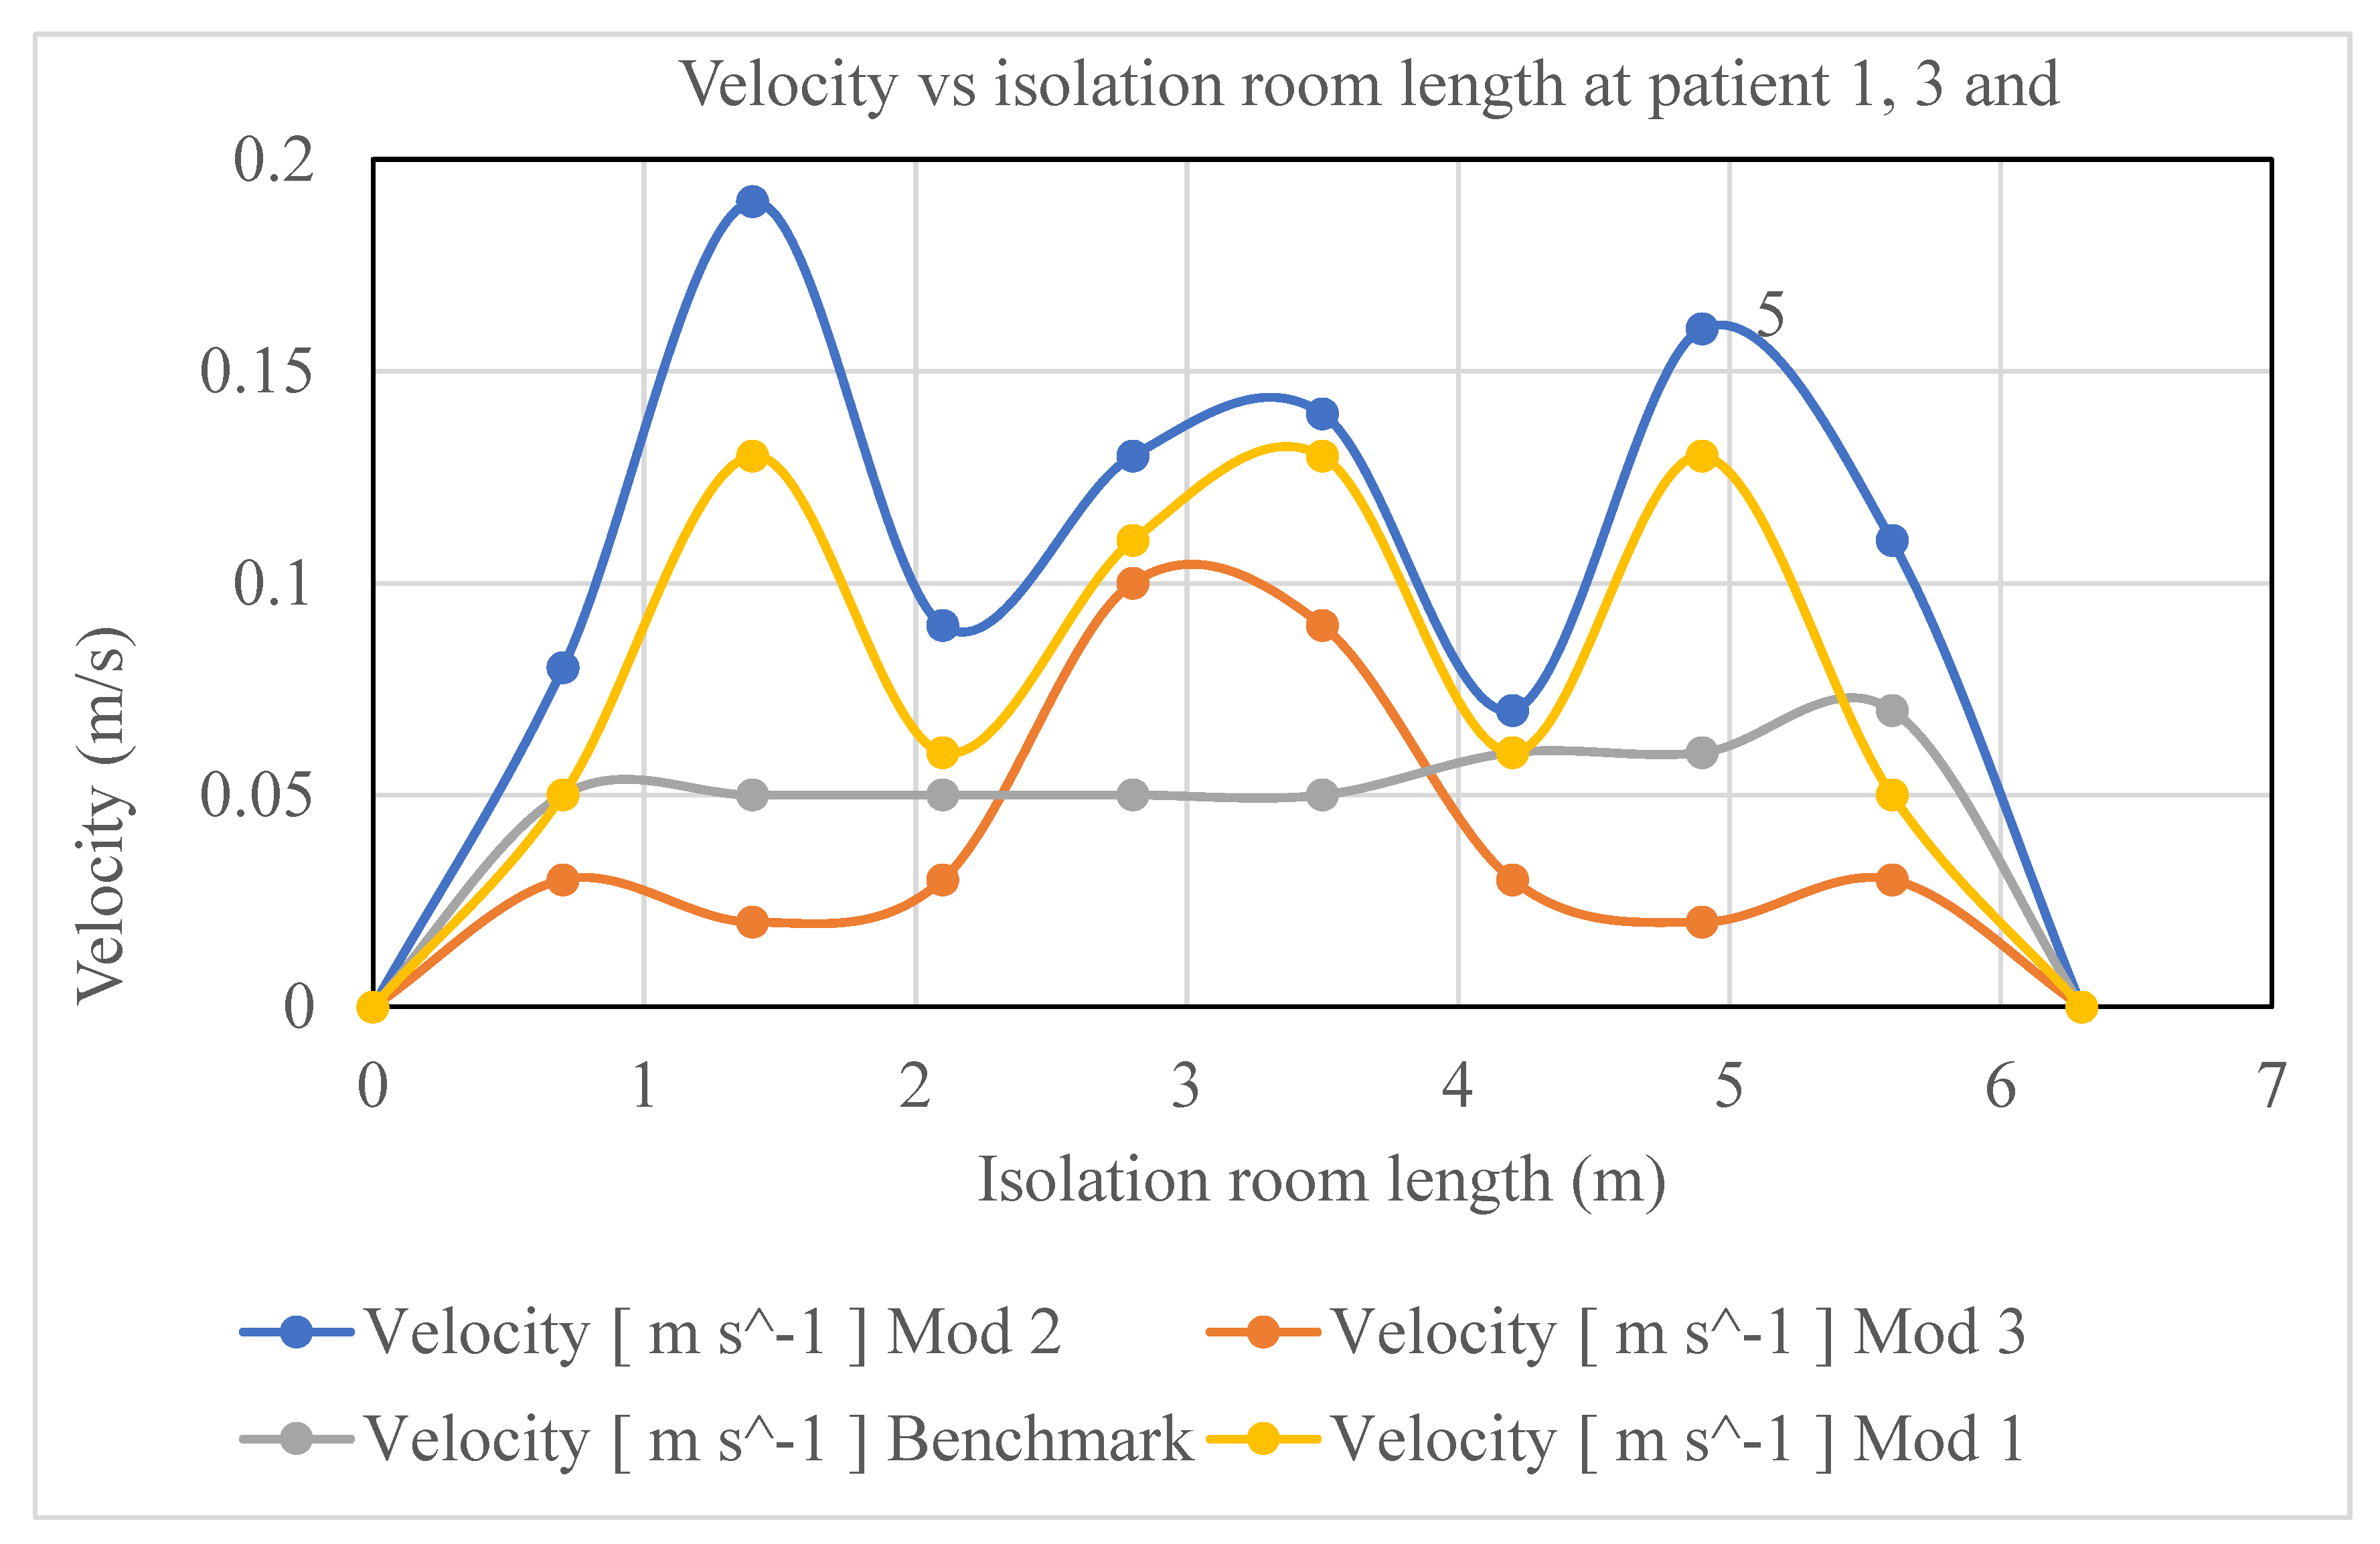
Figure 17.
Velocity vectors for patients 2 and 4 at (a) benchmark, (b) modification 1, (c) modification 2, and (d) modification 3.
Figure 17.
Velocity vectors for patients 2 and 4 at (a) benchmark, (b) modification 1, (c) modification 2, and (d) modification 3.
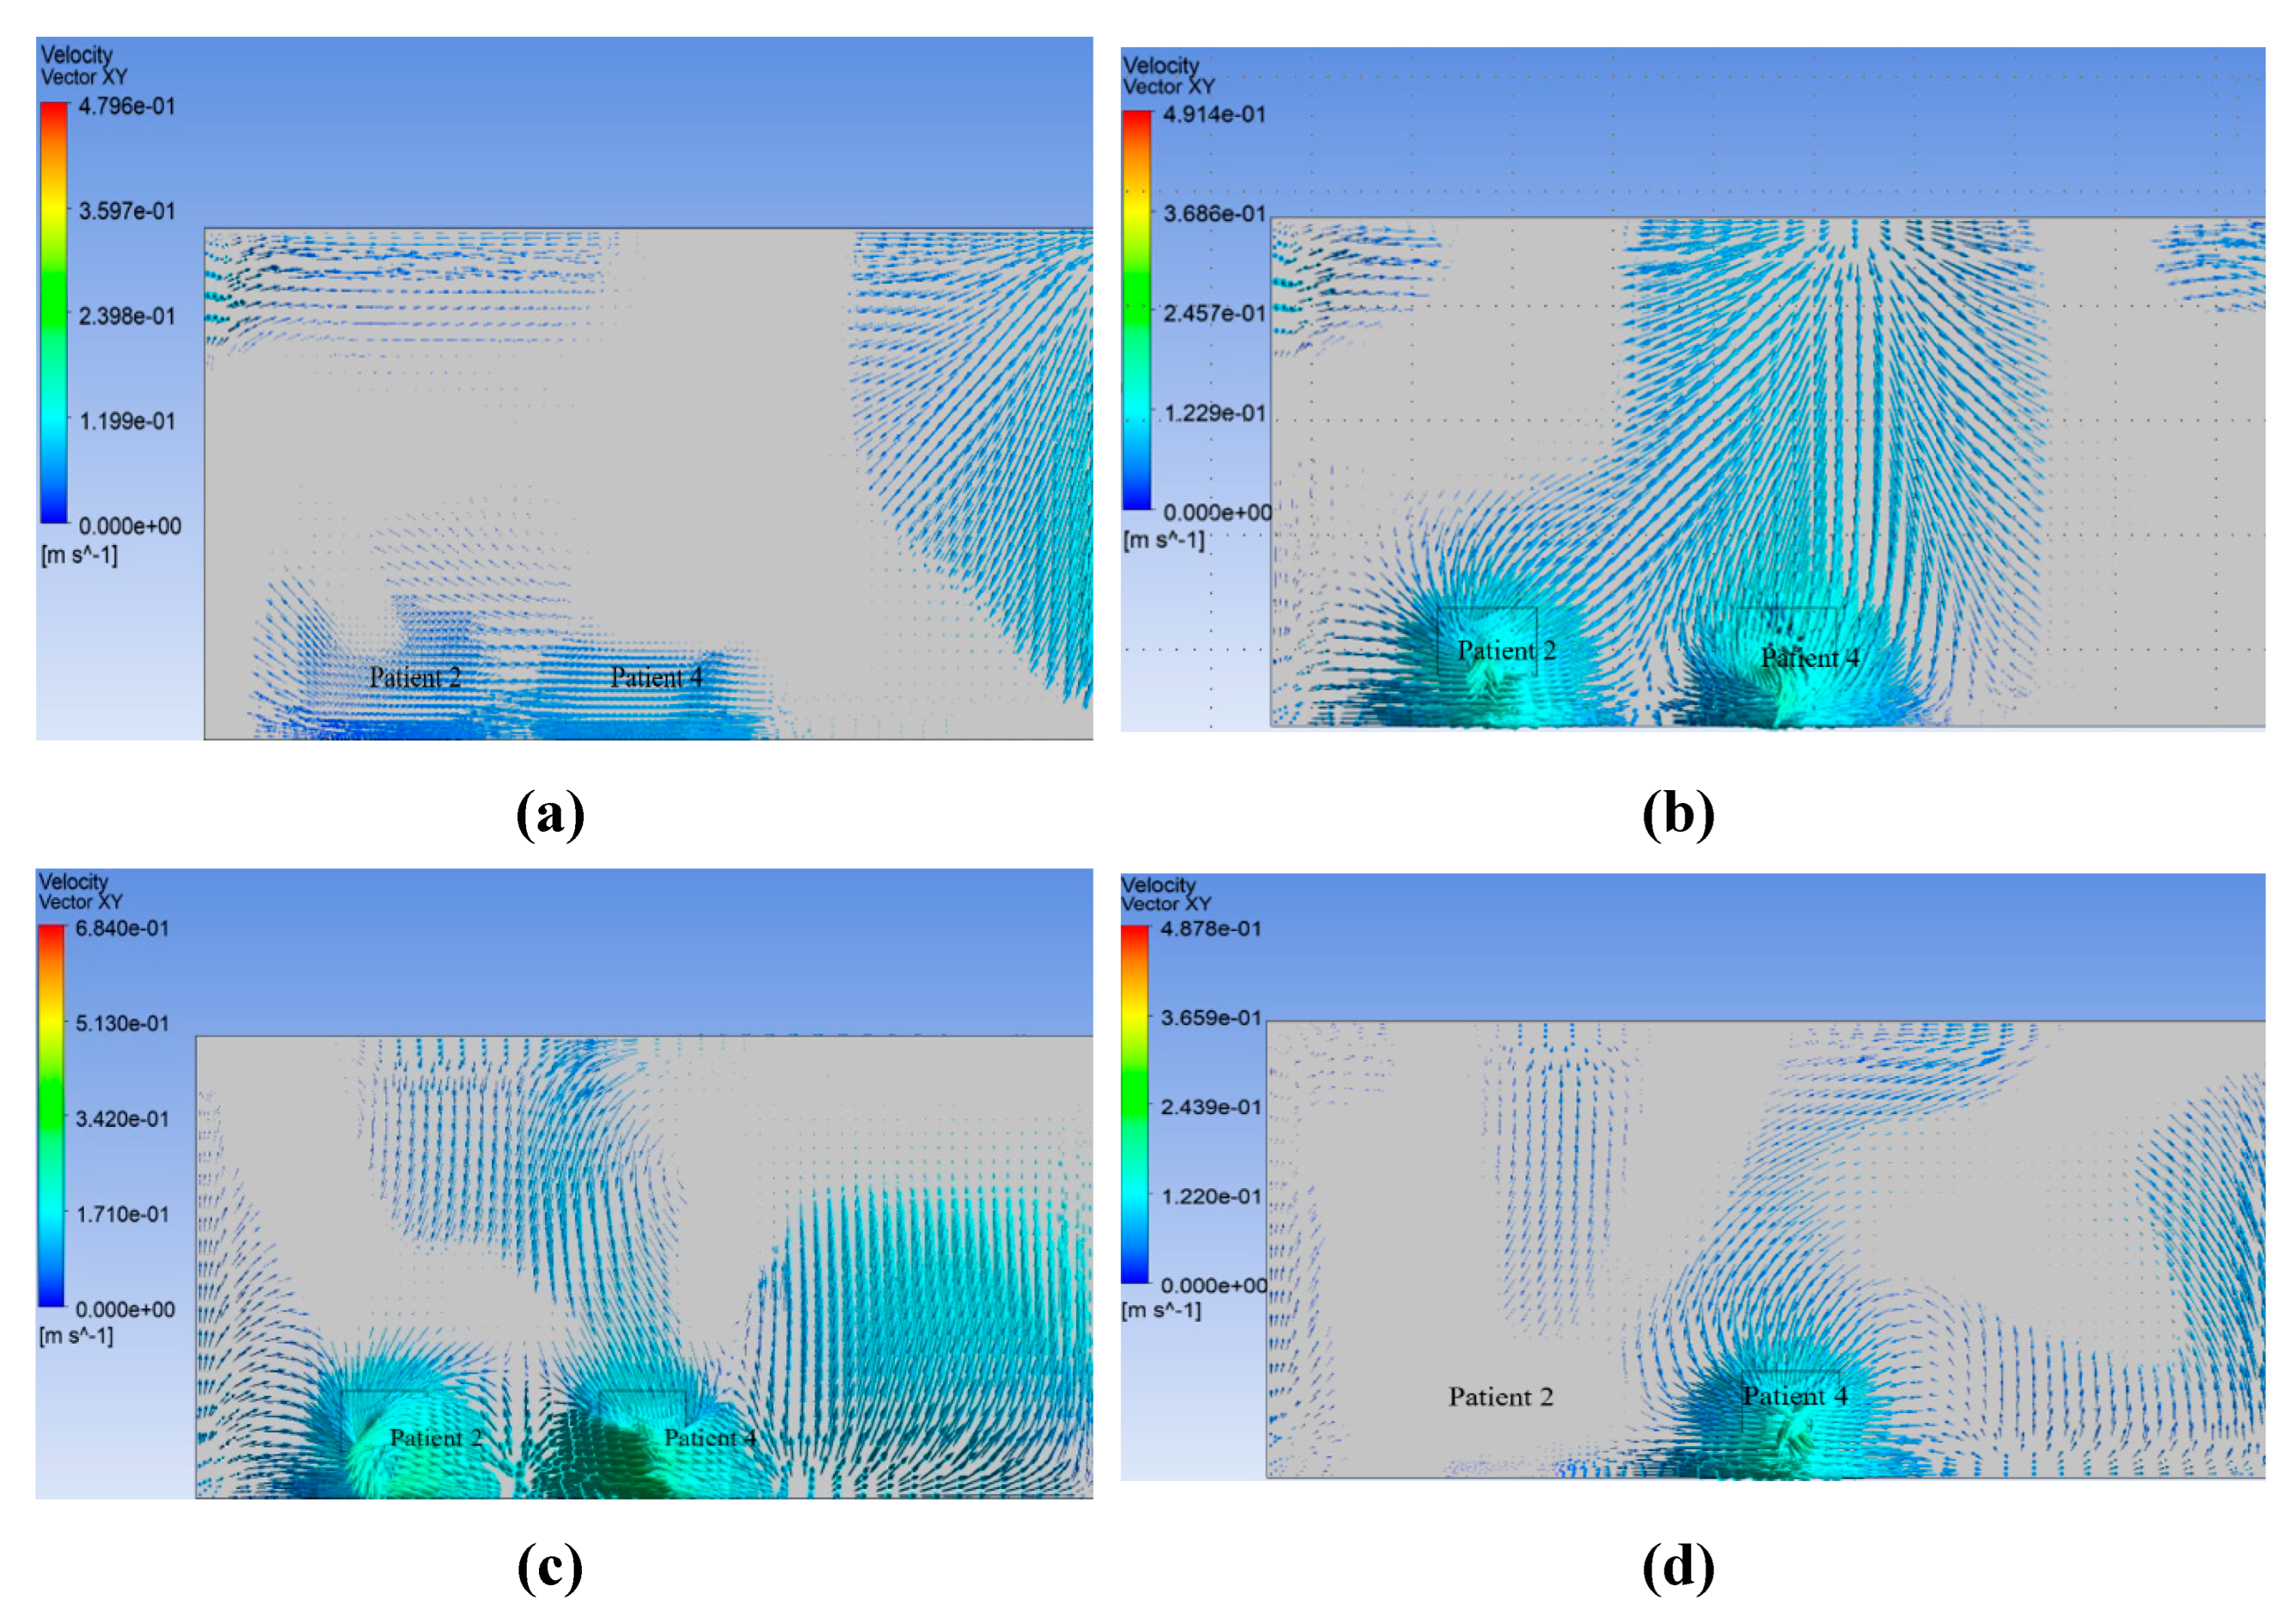
Figure 18.
Comparison of velocity distributions in the isolation room for patients 2 and 4 for various modification cases.
Figure 18.
Comparison of velocity distributions in the isolation room for patients 2 and 4 for various modification cases.
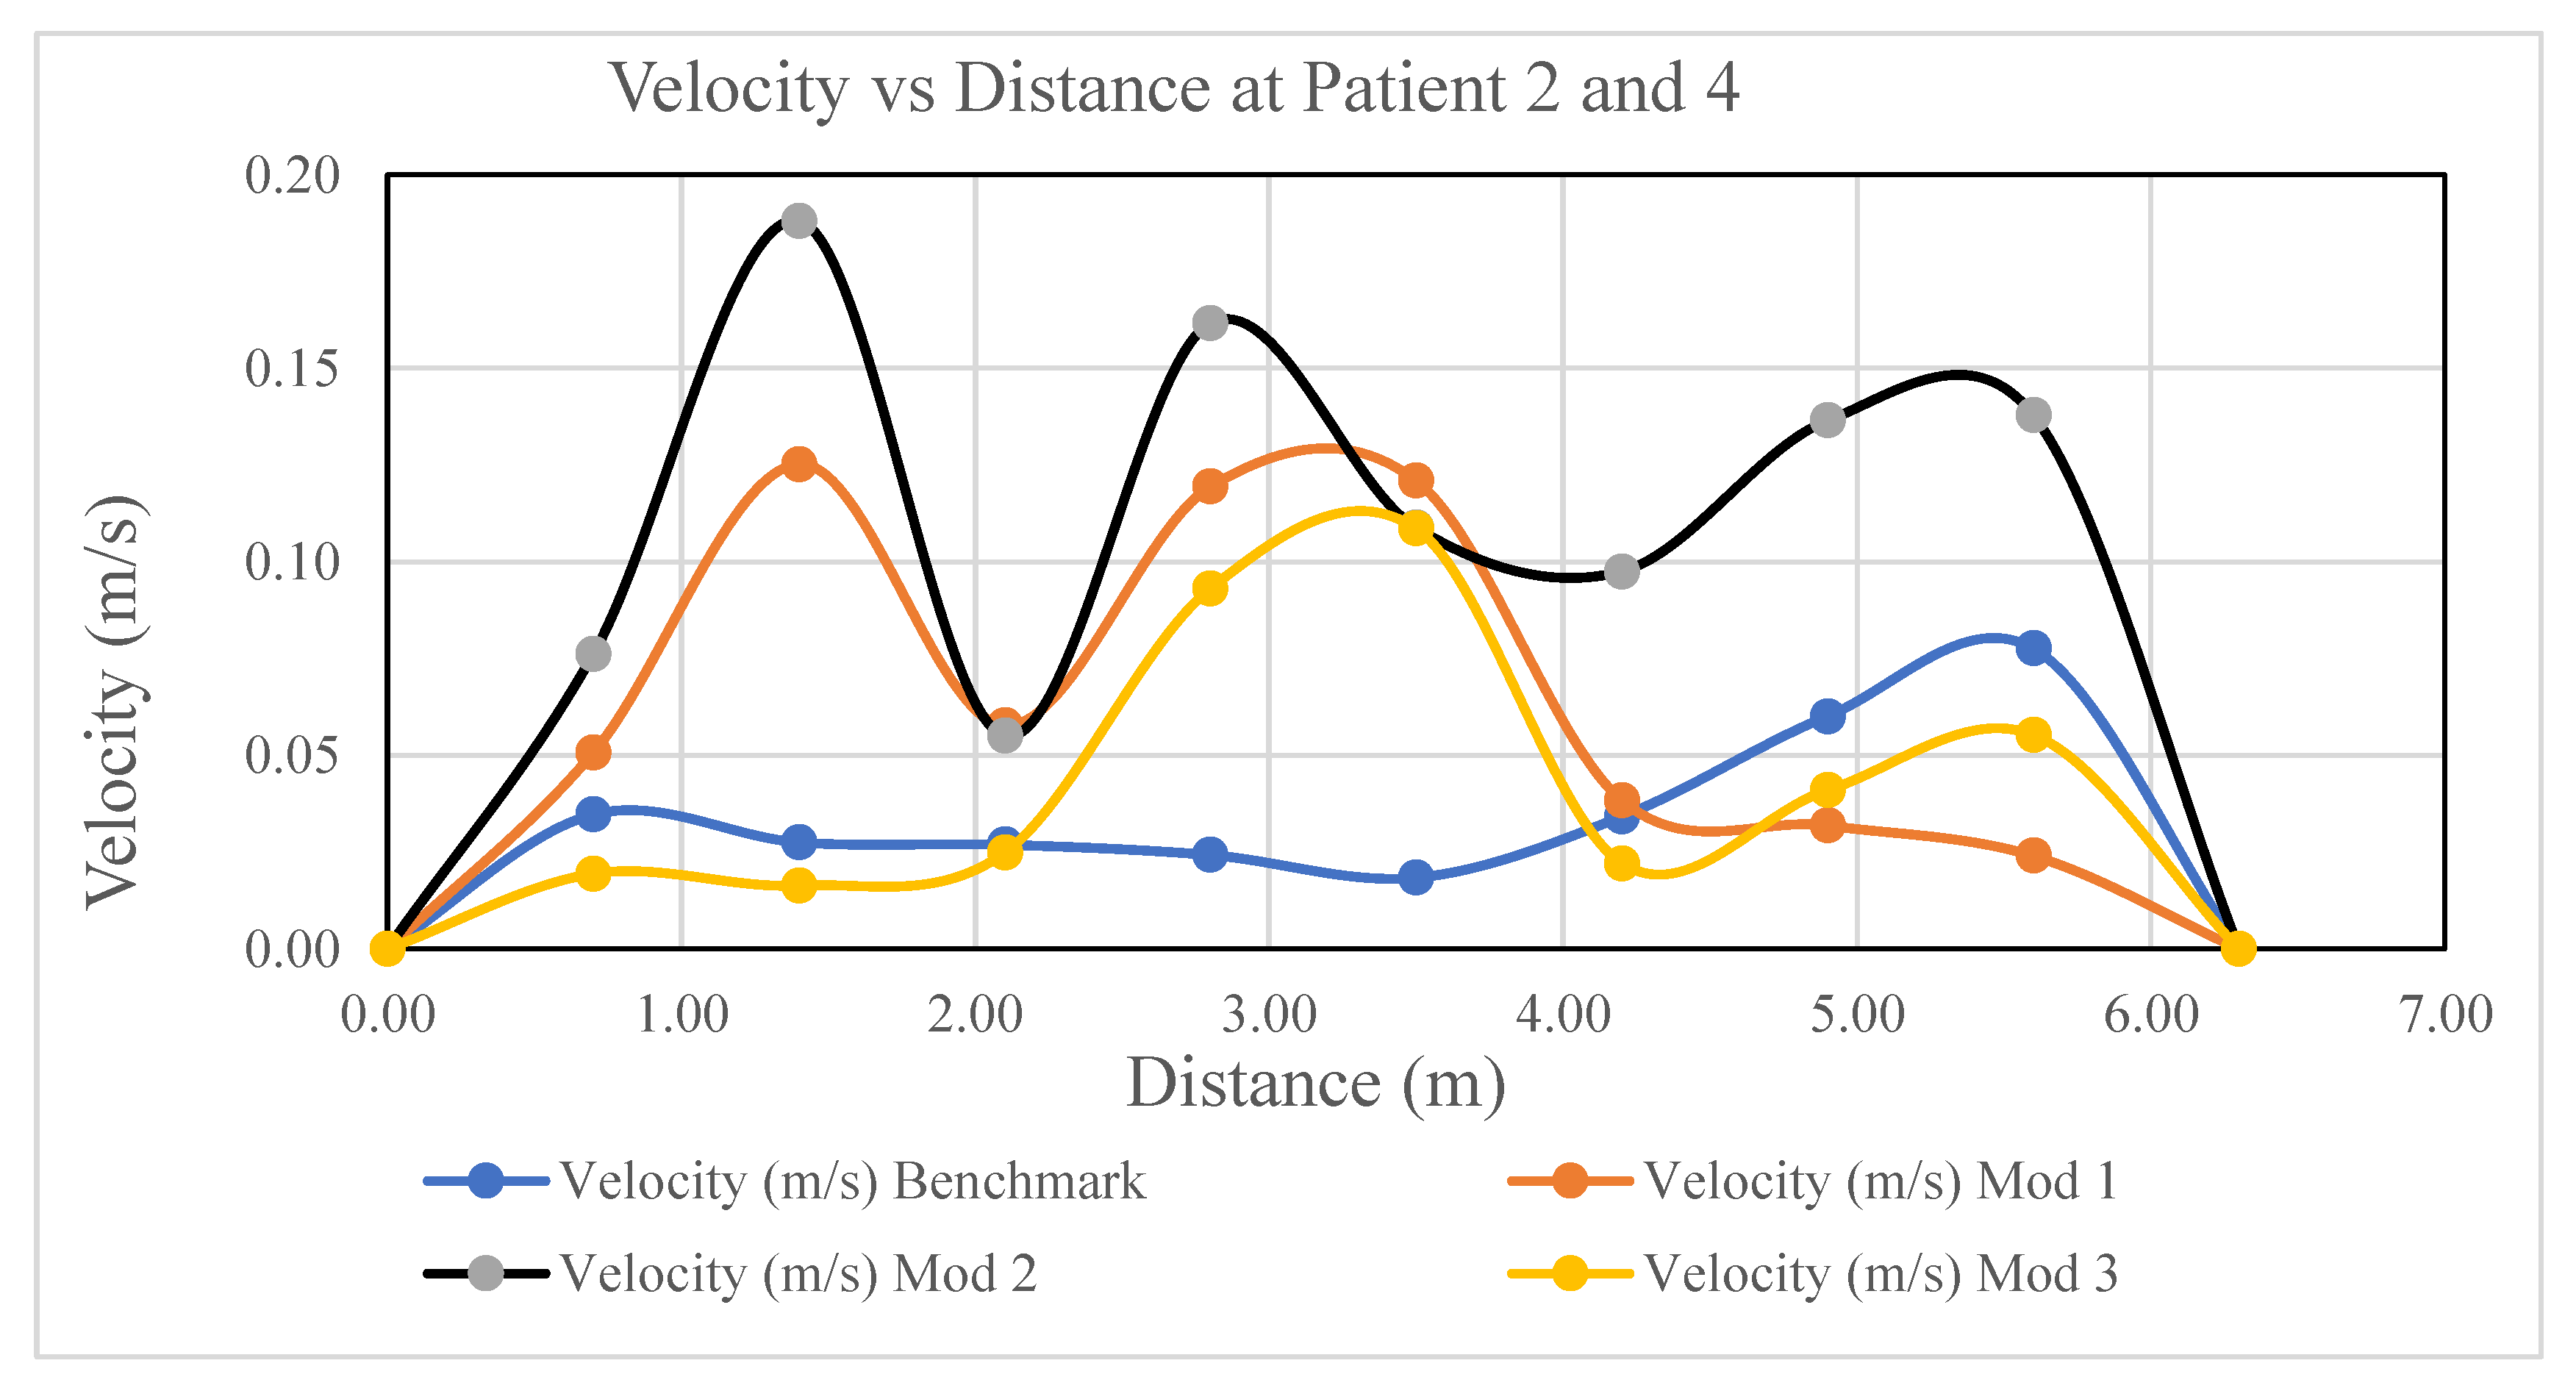
Figure 19.
Movement of velocity vector along with contaminant in patients 1 and 3 in (a) benchmark, (b) modification 1, (c) modification 2, and (d) modification 3.
Figure 19.
Movement of velocity vector along with contaminant in patients 1 and 3 in (a) benchmark, (b) modification 1, (c) modification 2, and (d) modification 3.
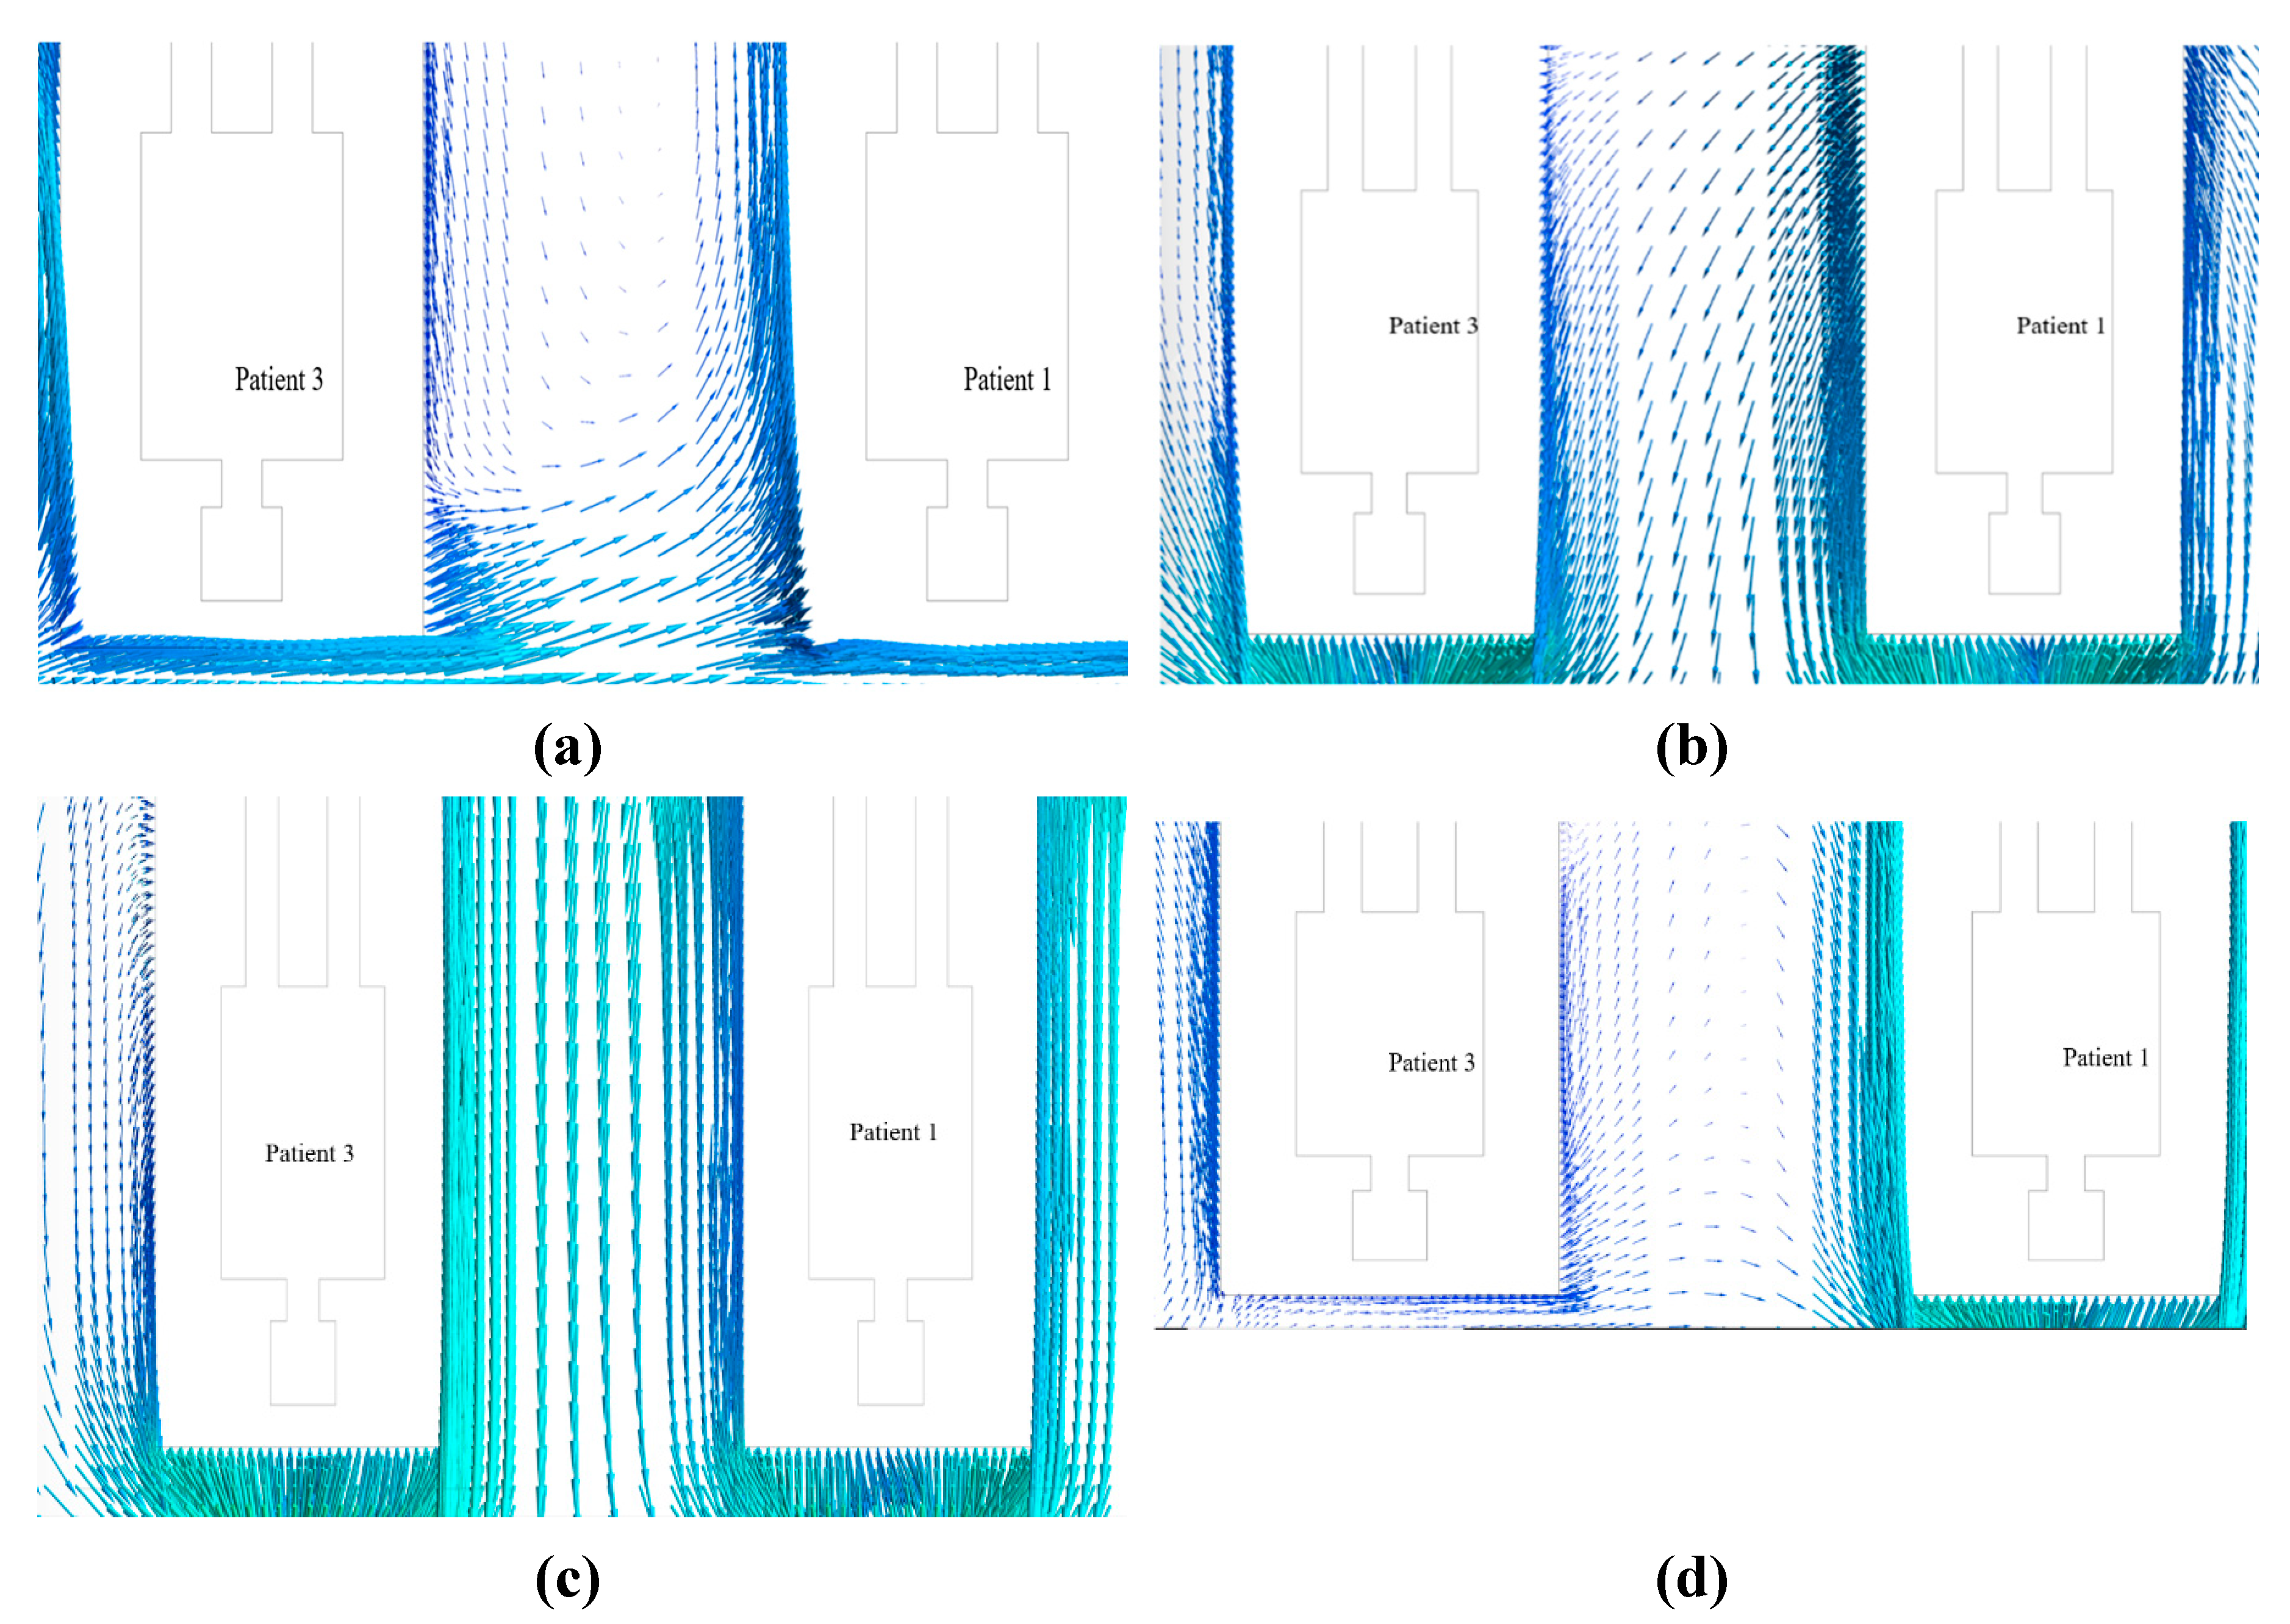
Figure 20.
Movement of the velocity vector along with the airborne contaminant in patients 2 and 4 in (a) benchmark, (b) modification 1, (c) modification 2, and (d) modification 3.
Figure 20.
Movement of the velocity vector along with the airborne contaminant in patients 2 and 4 in (a) benchmark, (b) modification 1, (c) modification 2, and (d) modification 3.
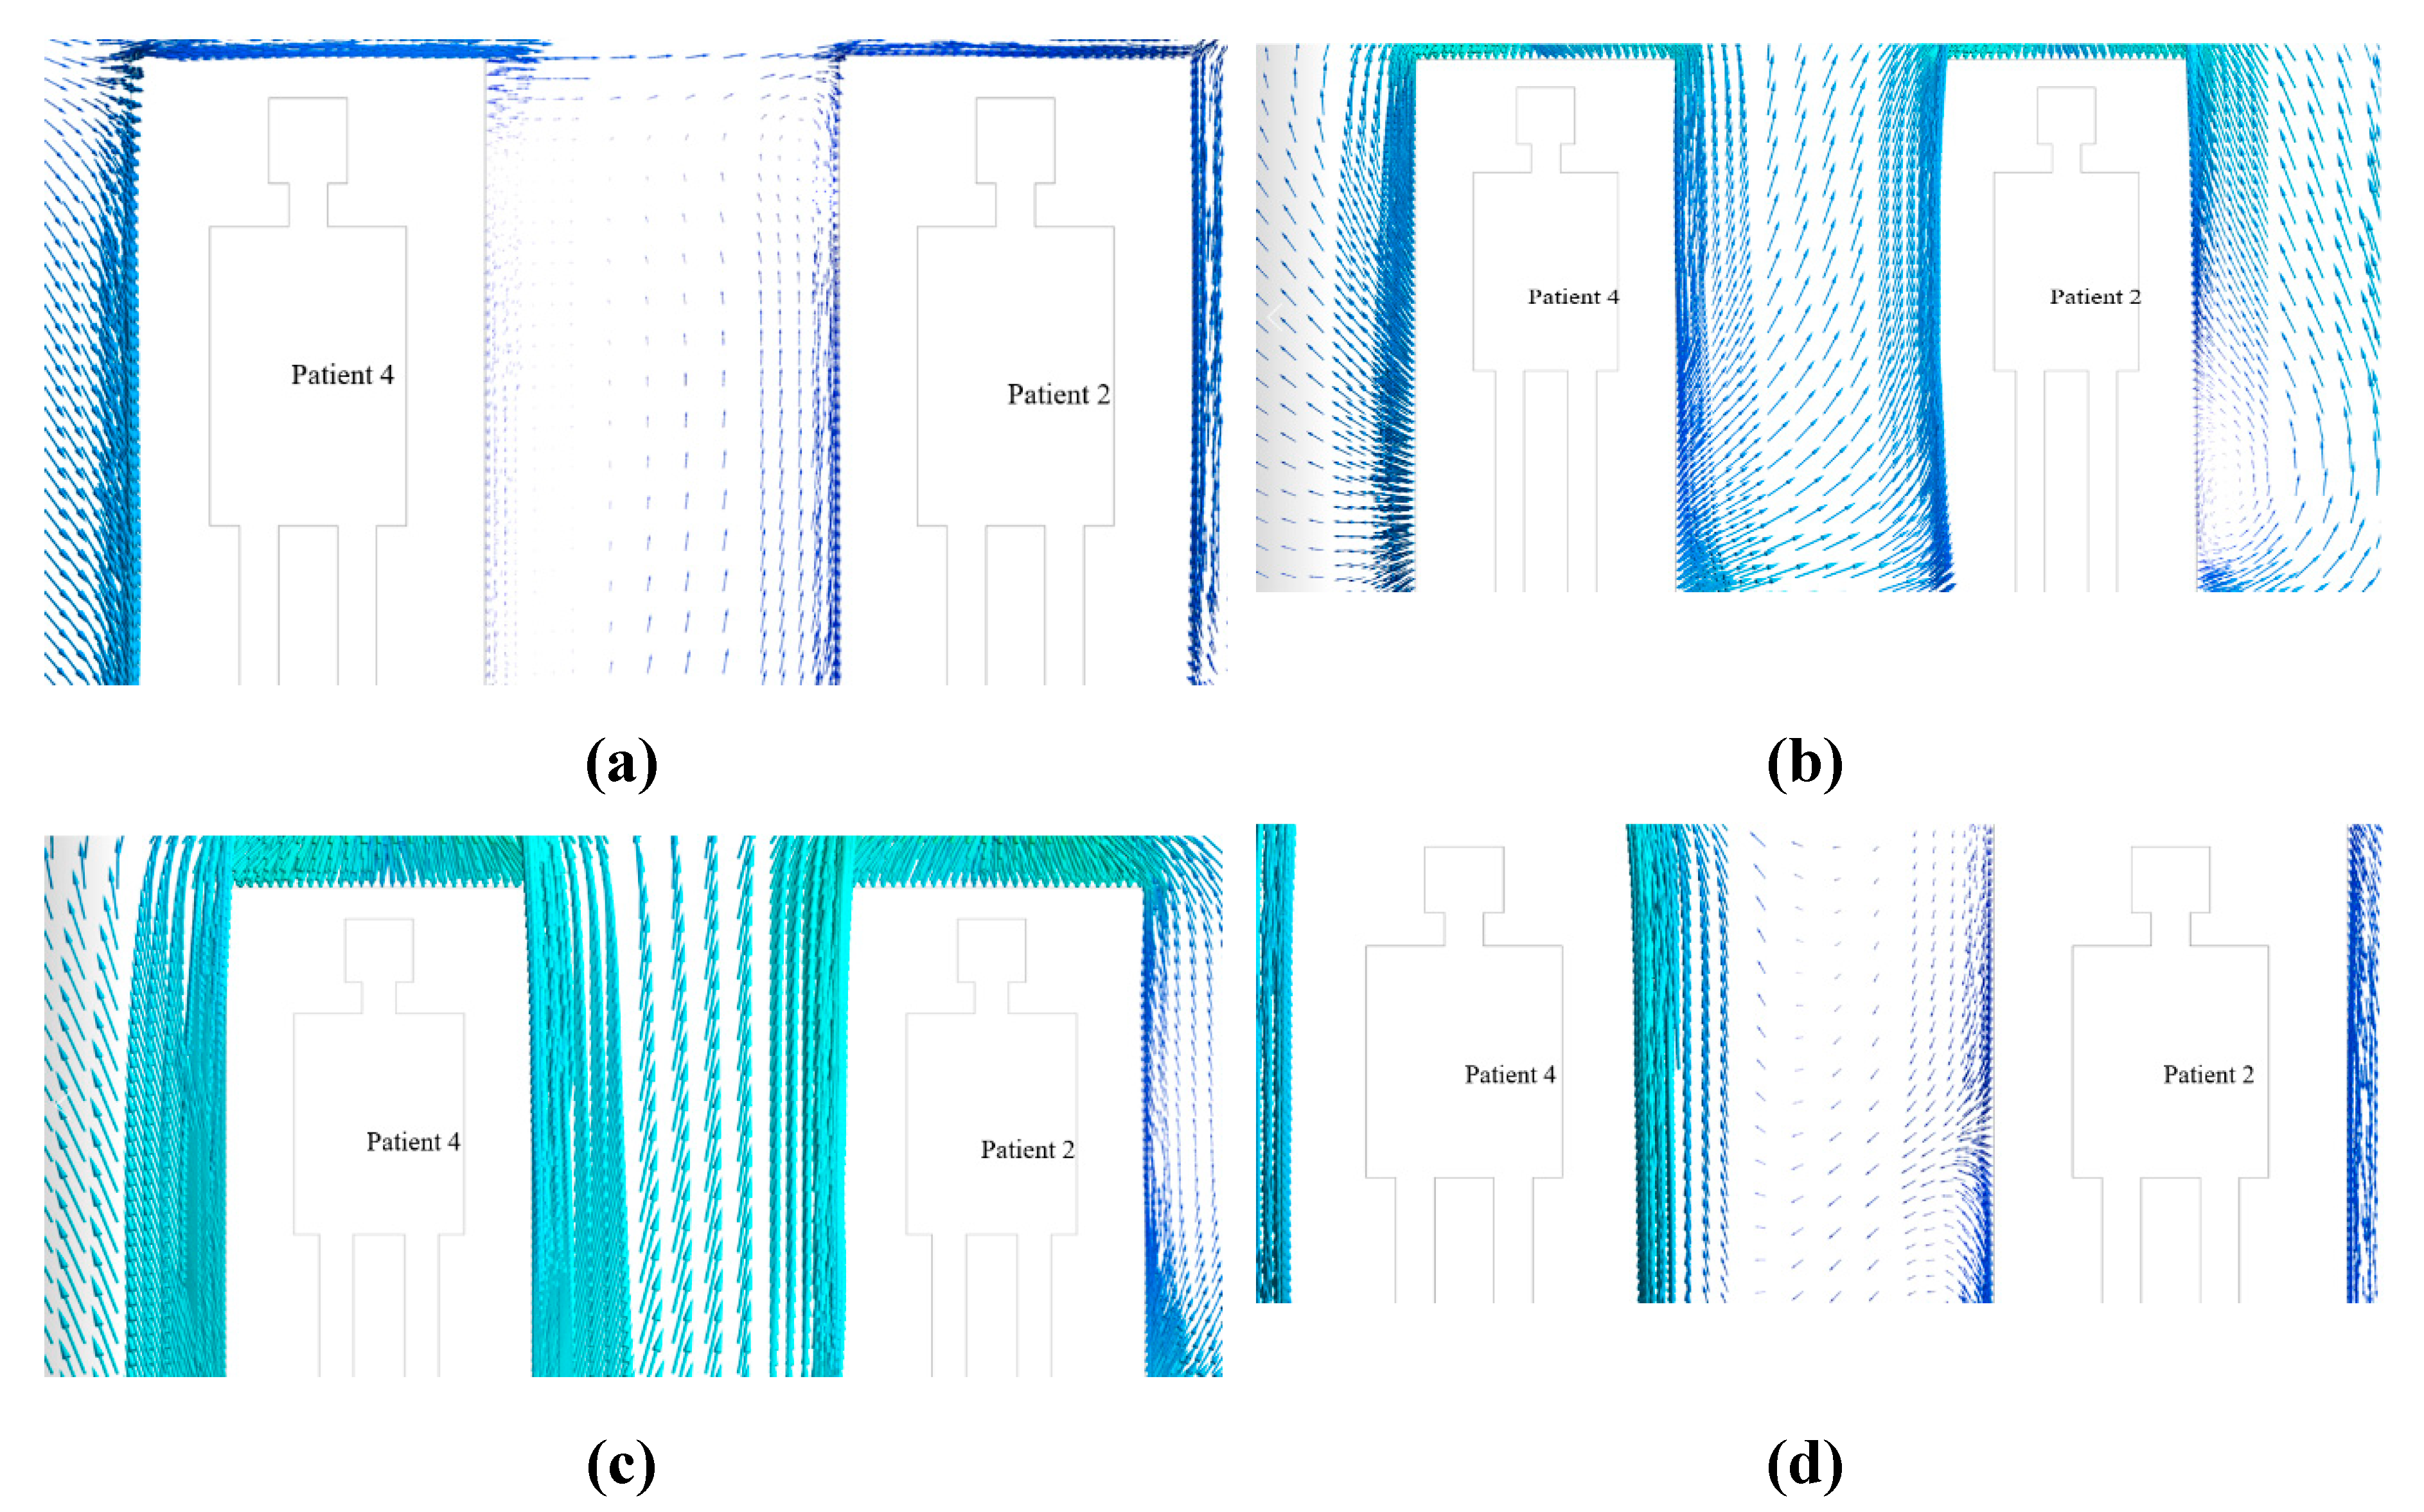

Table 1.
Dimensions and geometrical parameters of isolation room.
| Name of Parameter | Symbol of Parameter | Dimension (m) |
|---|---|---|
| Length of the room | Lr | 6.3 |
| Width of the room | Wr | 5.8 |
| Height of the room | Hr | 3 |
| Distance between patients’ bed | Sdp | 0.9 |
| Length of patient bed | MLb | 2.0 |
| Width of patient bed | NWp | 0.9 |
| Height of patient bed | PHb | 0.5 |
| Length of air inlet & outlet | aLa | 0.4 |
| Height of air inlet & outlet | bHa | 0.6 |
| Distance of air inlet from floor | c | 2.3 |
| Distance of inlet from west wall | d | 1.5 |
| Distance of 2nd patient bed from north wall | e | 0.9 |
| Distance of outlet from east and west wall | f, g | 1.5 |
| Height of outlet from floor | h | 0.45 |
Table 2.
Mesh Properties.
| Parameter | Description | Value |
|---|---|---|
| Target Mesh Size (Faces) | Mesh size for all faces | 0.03 |
| Growth Rate (Faces) | Growth rate for face meshing | 1.2 |
| Target Mesh Size (Body) | Mesh size for the body | 0.15 |
| Growth Rate (Body) | Growth rate for body meshing | 1.2 |
| Surface Meshing Min Size | Minimum surface mesh size | 0.012 |
| Surface Meshing Max Size | Maximum surface mesh size | 0.55 |
| Surface Growth Rate | Growth rate for surface meshing | 1.2 |
| Curvature Normal Angle | Angle for curvature size function | 18° |
| Boundary Layer Type | Type of boundary layer | Smooth Transition |
| Boundary Layer Layers | Number of layers in boundary layer | 3 |
| Transition Ratio | Transition ratio for boundary layer | 0.272 |
| Boundary Layer Growth Rate | Growth rate for boundary layer | 1.2 |
| Volume Meshing Type | Type of volume meshing | PolyHexCore |
| Peel Layer | Number of peel layers in volume meshing | 1 |
| Max Cell Length | Maximum cell length in volume meshing | 0.762 |
| Parallel Meshing | Parallel meshing enabled | Yes |
| Cell Quality Limit | Quality limit for volume mesh | 0.15 |
| Total Cells Generated | Total number of mesh cells | 5.16 × 10⁵ |
Table 3.
Boundary conditions for the isolation room.
| Fresh Air Inlet velocity (m/s) | 0.4 |
| Air inlet temperature (0C) | 20 |
| Flow field | Incompressible flow (Steady State) |
| Flow model | K –ε (2 equations) realizable turbulence model |
| Outlet pressure (Pa) | 0 |
| Outlet Velocity (m/s) | 0.4 |
| Air outlet temperature (0C) | 20 |
| Wall | No Slip |
Disclaimer/Publisher’s Note: The statements, opinions and data contained in all publications are solely those of the individual author(s) and contributor(s) and not of MDPI and/or the editor(s). MDPI and/or the editor(s) disclaim responsibility for any injury to people or property resulting from any ideas, methods, instructions or products referred to in the content. |
© 2025 by the authors. Licensee MDPI, Basel, Switzerland. This article is an open access article distributed under the terms and conditions of the Creative Commons Attribution (CC BY) license (http://creativecommons.org/licenses/by/4.0/).
Copyright: This open access article is published under a Creative Commons CC BY 4.0 license, which permit the free download, distribution, and reuse, provided that the author and preprint are cited in any reuse.


