1. Introduction
The Russia-Ukraine conflict has caused global tensions and raised concerns about its impact on international trade. Russia and Ukraine both play crucial roles in various supply chains, including manufacturing, energy, innovation, and agribusiness. The medical sector is particularly noteworthy among the variety of industries impacted worldwide because of its vital role in public health and safety. The paper seeks to analyze the several risks that have directly resulted from the conflict and emerged in Bangladesh's medical supply chain. Disruption of these supply chains can lead to price fluctuations, shortages, and delays in essential goods. An analytical study explores how disruptions in the supply chain affect pricing decisions. Businesses must now consider risk management, technological changes, and consumer preferences to manage uncertainties effectively. By considering disruption timing and product substitution, optimal pricing strategies and order levels can be determined to mitigate risks and update supply contracts (Gupta, Ivanov, and Choi, 2021). The Russia-Ukraine conflict showcases the vulnerability of countries like Bangladesh to distant geopolitical events. It emphasizes the importance of understanding the potential economic impacts and managing risks (Talukder M. T. I. et al., 2024). The global and local supply chains are being significantly affected by the interruption in demand and supply due to the Coronavirus outbreak. These supply chains vary in their structures and capacities, but they all play a crucial role in alleviating the suffering of those affected. The sharing of both physical and intellectual resources is widespread, and this exchange of resources and knowledge is essential for facilitating effective communication between suppliers and buyers (Hayat et al., n.d.)The impact of the Russia-Ukraine War on Bangladesh's medical sector, including supply chain issues with medical hardware, drugs, and components from affected nations. Examining weaknesses in transportation, customs, and regulations causing supply disruptions, leading to component shortages, delays, and increased costs (Hoang-Tien, 2022). The paper proposes supply chain resilience capability & 4 risk-mitigating strategies for sustainability risks. Survey data is used for modeling (Han and Um, 2024). All organizations have predictable recovery and anti-damage capabilities during the Russia-Ukraine War, except for a grain company. Notably, the most significant trade flows do not occur in economically weak and politically vulnerable countries. To resist the impact of this war, production capacity and energy sources should be enhanced. Global organizations should also strengthen the balance of energy and food security between big and small countries (Zhou et al., 2023). Multi-attribute assessment in legislative tasks is discussed, emphasizing the use of the SWARA method and linear normalization for dispute resolution (Keršuliene, Zavadskas, and Turskis, 2010). The study focuses on prominent environmental, social, and geological criteria that cause damage to air, water, soil, and society. The goal is to define landfill site selection criteria in Baghdad. Three parts cover municipal solid waste criteria, the SWARA technique explanation, and applying the technique to determine landfill site weights (Majeed and Breesam, 2021). This paper examines recent investigations on SCM, presenting the state of SCRM studies and identifying areas requiring further investigation. It explores risk concerns in SCM and emphasizes the need for cooperation and information exchange among SC partners. Rising topics include technology, big data analytics, and blockchain in SCRM. The paper identifies three risk sources in SCs and discusses risk-mitigating strategies such as avoidance, control, cooperation, and flexibility. Developing AI risk management models can enhance SC competence in the dynamic business environment (Emrouznejad, Abbasi, and Sıcakyüz, 2023).
To reduce drug scarcity, a study used a coordinated mathematical and simulation model. Five studies used intelligent modeling, nine used secondary data analysis methods, and one used stepwise weight assessment ratio analysis, an MCDM method (Chowdhury et al., n.d.; Wang, Cheng, and Wang, 2022). Various factors like technology, unforeseen situations, drug supply, and environmental aspects influence the supply chain. To ensure efficient supply chain processes, identifying and avoiding bottlenecks and disruptions is crucial. COVID-19 has increased the focus on risks in the pharmaceutical supply chain, and the potential of supply chain technologies is extensively discussed in articles (Čerkauskienė and Meidute-Kavaliauskiene, 2023). A sustainable supply chain organizes natural resources, finances, and information to protect customers' and partners' well-being, focusing on finance, ecology, and society. Supply chain practitioners use research findings to maintain stability and competitiveness (Wang et al., 2022). The AHP technique by Thomas Saaty involves breaking complex decisions into criteria and sub-criteria levels. It considers subjective and quantitative factors, widely used in business, design, healthcare, and the environment (Saaty, 2001). SWARA determined the weights of supplier evaluation criteria, while WASPAS determined sustainable suppliers' final ranking. Findings indicate that stability of cost, continuous improvement and quality control, past performance and reputation, and shorter lead time and timely delivery are the most important criteria. Finance-related and service-related criteria ranked highest (Debnath et al., 2023). SWARA's strategy enables systematic decision-making by considering multiple criteria. It utilizes Stepwise Weight Assessment Ratio Analysis (SWARA) to enhance SSC endurance amid the pandemic. The outcome suggests prioritizing supply chain feasibility for managing supplier-purchaser relationships and expanding SSCS during and after COVID-19 (Hayat et al., n.d.). This paper by Zavadskas, Turskis, and Kildienė explores various multi-criteria decision-making procedures, including the SWARA method. It highlights the significance of the SWARA method in decision-making by enabling quantitative analysis and identifying the best choice. It was introduced in 2010 by Kersuliene, Zavadskas, and Turkish (Alinezhad and Khalili n.d.). In this approach, which uses the weighting method, the decision-maker determines the initial prioritizing and relative relevance of each choice for each characteristic before determining the relative weight of each attribute (Alinezhad and Khalili, n.d.).
The purpose of this study is to investigate the dangers that the Russia-Ukraine war has caused to the supply chain in Bangladesh's medical industry and to suggest ways to improve sustainability. Thirty risk indicators were found after a thorough literature search, and six major hazards were chosen based on expert judgments and literature studies to create an extensive risk hierarchy. Analytic Hierarchy Process (AHP) and Step-wise Weight Assessment Ratio Analysis (SWARA) are used to examine supply chain risks and deal with post-war difficulties in order to accomplish this. Taking into account the pertinent criteria, the AHP approach is utilized to ascertain the relative significance of each risk factor. The weight of each risk factor is then determined using the SWARA approach, and the factors are ranked according to how they affect the sustainability of the supply chain.
2. Methods
2.1. Using Analytic Hierarchy Process Method
The Analytic Hierarchy Process seems to give a strong way to deal with suitably estimating the significant data (Triantaphyllou and Mann, 1995). The AHP is a technique given the various leveled examinations of a specific issue in components of hierarchy that are organized in levels. The AHP technique gives that a specific issue is progressively deteriorated and, to some extent, settled, and then those halfway arrangements are once more joined to get an answer for the underlying issue. As indicated by the AHP technique, components of an issue under examination are disseminated in a progressive design from the total goal on top of a progressive construction through criteria and sub-criteria on their particular levels to options on the most minimal level. Options present the end-product of an issue examination, that is, weight values about the set goal. The AHP technique empowers leaders to structure a perplexing issue as a straightforward hierarchy and survey a significant number of quantitative and subjective factors efficiently. The proposed research comprises many steps, as referenced below:
Step 1: Identification of existing risk factors: The goal of this step is to create a far-reaching rundown of risks because of the occasions that could have an unfavorable effect. In this step, the most significant supply chain risks are recognized through a literature overview (
Table 1) and from experts‟ input. A sum of 30 supply chain risk variables and six significant risks are distinguished from investigating the existing literature.
Step 2: Selection of the Evaluating Criteria: In this step, we gather a few criteria from the related proposition paper to distinguish the risk. Those criteria are Probability, Supply Chain Disruption, Ethical and Social Responsibility, Quality and Security, Demand Variability. From that point onward, we made a questionnaire survey for the experts to choose the criteria as indicated by our other options. As such, four criteria were chosen.
Step 3: Evaluation of Identified Risks Using the AHP Method: The fundamental benefit of AHP is its capacity to check and lessen the irregularity of master decisions. While diminishing inclination in the dynamic cycle, this technique makes collective choice through agreement using the mathematical mean of singular decisions.
In the AHP examination, a pairwise evaluation lattice was created because of the Saaty 1-9 inclination scale. In like manner, the level of the general meaning of components at each level was assessed.
Taking into account n viewpoints, the pairwise development of characteristic i with property j yields a square lattice
An×n as follows:
where a
ij symbolizes the relative significance of attribute i concerning attribute j. In the matrix a
ij=1 when i=j and a
ij=1/a
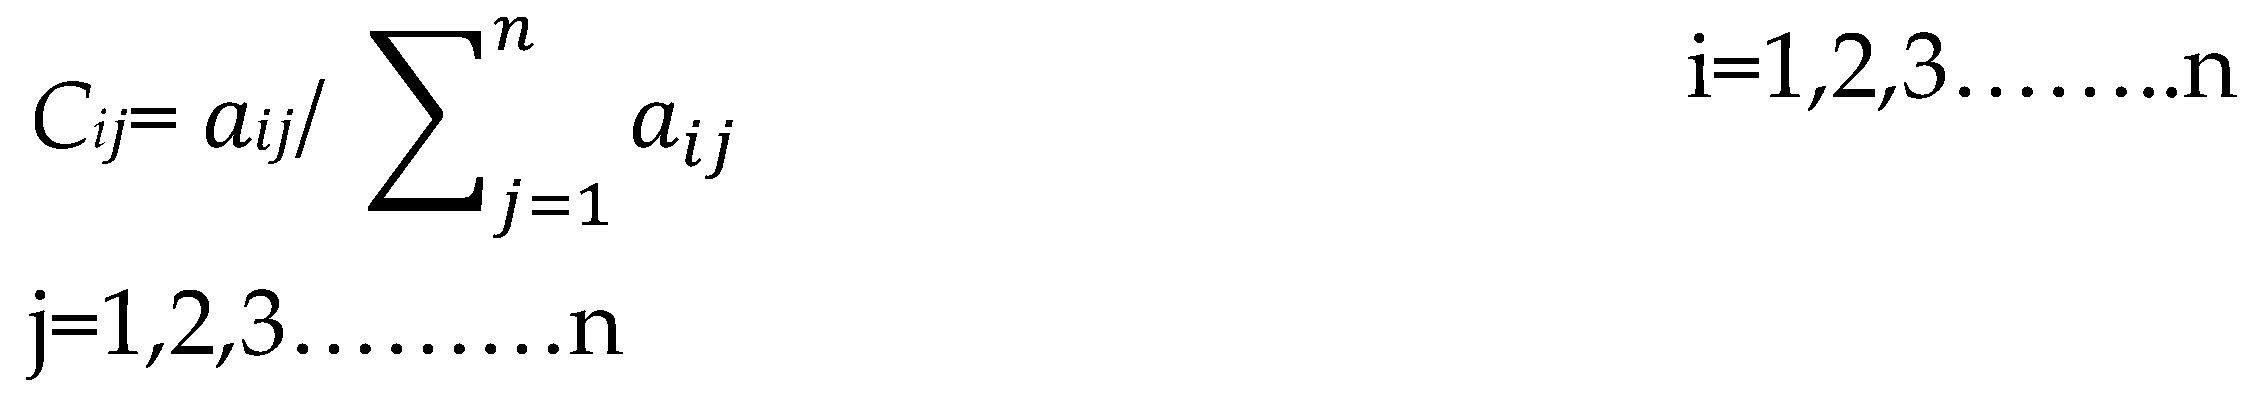
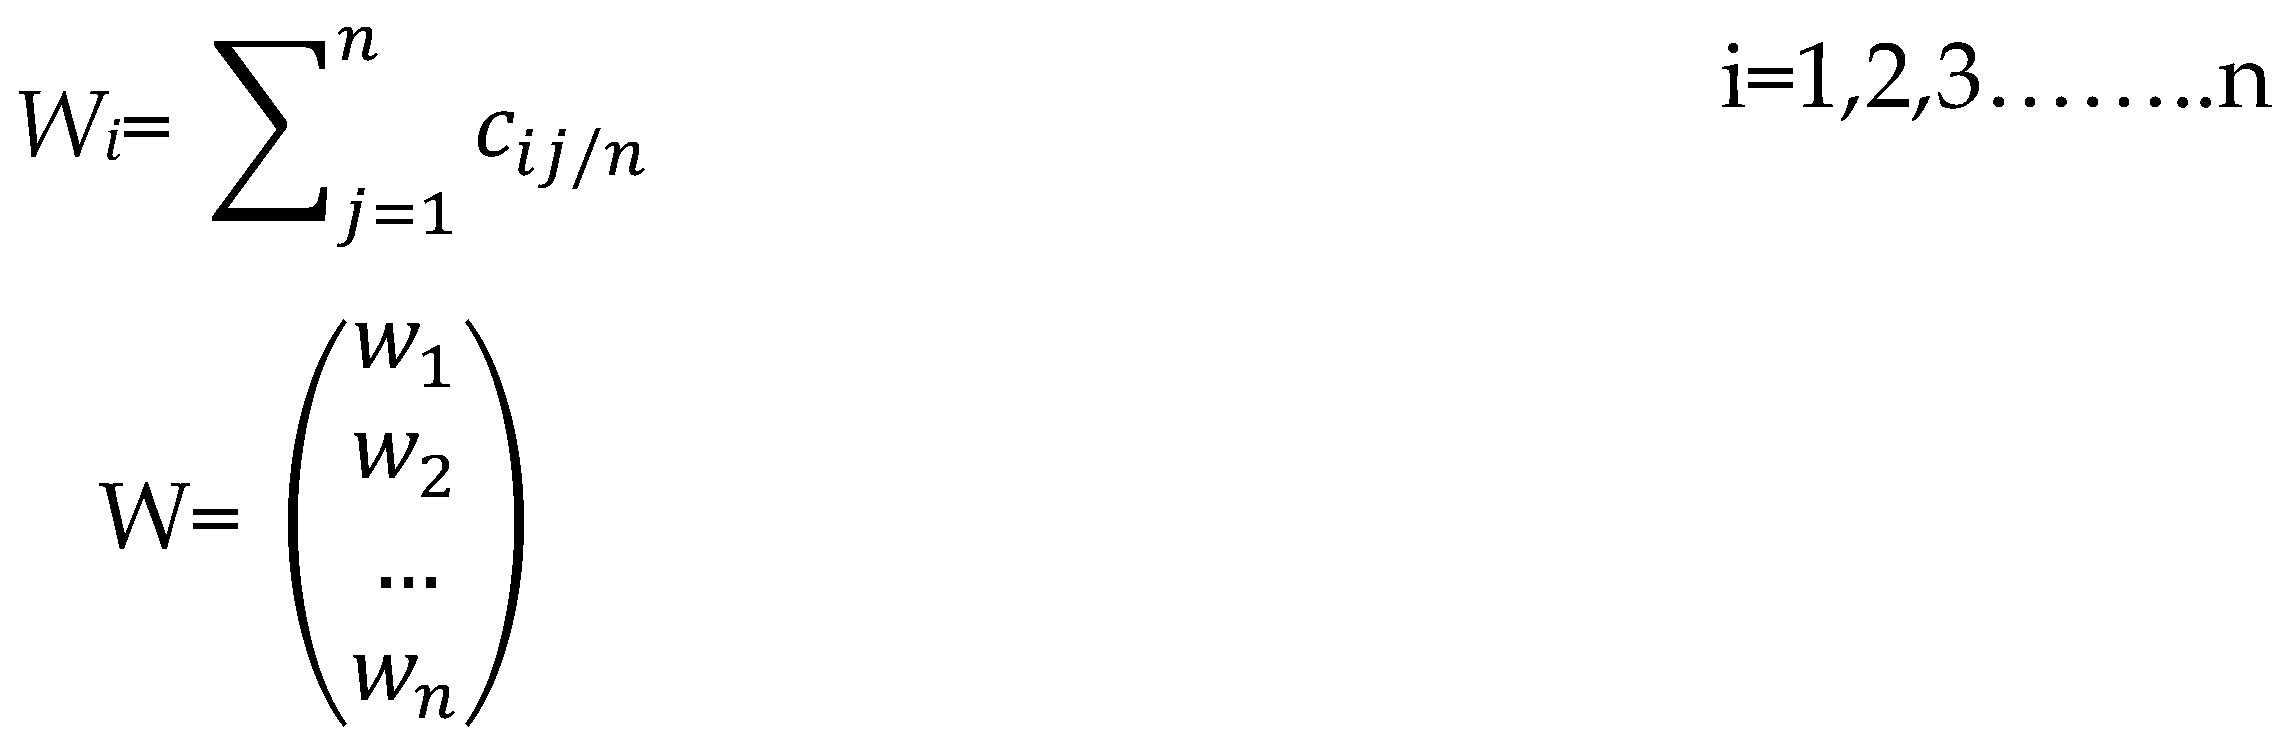
ij. Then the normalized decision matrix was formed according to equation (1) and the weighted normalized decision matrix was formed according to equations (2) and (3)
Furthermore, the maximum eigenvector λ
max was calculated using equation (3)
where E= Nth root value/∑ Nth root value and row matrix
Finally, the consistency index (CI) was calculated using λ
max according to equation (4), and the consistency ratio (CR) was calculated using equation (5)
where n denotes the order of the matrix
To work out the weighted standardized structure the property weight information is required. From the explanatory hierarchy prepared (AHP), the general load of every criterion has been evaluated. The phonetic definitions for the importance extents are displayed in
Table 2. The experts were approached to look into the match canny correlation system. There were various conflicts inside the discussion prepared.
The experts were mentioned to participate in a pairwise correlation network. There were different contentions in the conversation process. The conversation is expected to synchronize to show up at congruity for every examination grid.
2.2. Stepwise Weight Assessment Ratio Analysis Method
Gathering the necessary data (criteria), during hypothetical review and fieldwork about the review point in light of the examination plan that is utilized to track down the primary criteria and sub-criteria in the Medical Sector. This study provides a decision-support flowchart for ranking the most critical supply chain risks in Bangladesh's medical industry and finding their relationships.
The main benefit of the SWARA method based on decision-making problems is that it needn't bother with an evaluation to determine decision problems and to orchestrate the criteria and it is a scale to find the priorities weights of criteria based on organizations' systems or plans. Following the identification and creation of a list of criteria utilized in a decision-making process. The essential standards of SWARA and the strategy of the assurance of the overall weights of criteria can be detailed through the ensuing strides as underneath:
Step 1: Shorting criteria based on importance is necessary. In this step, experts rank predetermined criteria in order of the significance they have, for instance, the most significant criteria are listed first.
Step 2: As certain the relative relevance of the average value, Sj. It is important to establish their relevance in the following manner, starting with the criterion that came in second place. It is determined to what extent criterion Cj is more than criterion Cj+1.
Step 3: Using this formula, determine the co-efficient K
j:
Step 4: Calculate the revised weight Qj using the information below:
Step 5: Determined the weights of the criteria whose sums are equal to 1:
where W
j is the criteria’s relative weight value
These weights are typically determined by the experts' opinions on that sector, shown in
Table 3. This is the initial step of the SWARA Method. With the experts' help, the following data were found.
3. Results and Discussion
3.1. Data Analysis of the AHP Method
The fundamental benefit of AHP is its ability to check and diminish the irregularity of master decisions. While decreasing predisposition in the dynamic process, this strategy gives collective choice-making through agreement utilizing the mathematical mean of the individual choices. AHP gets sizes of values from pairwise correlations related to evaluations and is appropriate for multi-goals.
Microsoft Excel imports and standardizes all values in a table, assigning weights. The λmax value is determined, followed by the Consistency Record and Consistency Ratio. The weights for each item in the table are then calculated, resulting in a weight matrix.
The priority weights are obtained from pairwise assessments of alternative options for each decision criterion. In
Table 4, the priority matrix, formed by the weights of each alternative, is then multiplied by the decision criterion's priority weights for the objective.
For risk selection criteria’s calculation of normalizing weight is λmax= 4.1597, CI= 0.0532, and CR= 0.0591<.10 respectively.
The need weights were acquired from the pair-wise assessment of alternatives concerning every decision criterion addressing the nearby weights. The need matrix formed from the nearby weights of every alternative was multiplied by the need weight matrix of the decision criteria concerning the objective.
Table 5 represents the calculation of normalizing weight, λ
max, CI, and CR for criteria 1.
For criteria 1 the calculation of normalizing weight is λmax= 6.3699, CI= 0.074, and CR= 0.0597<.10 respectively.
The need weights were acquired from the pair-wise assessment of alternatives concerning every decision criterion addressing the nearby weights. The need matrix formed from the nearby weights of every alternative was multiplied by the need weight matrix of the decision criteria concerning the objective.
Table 6 represents the calculation of normalizing weight, λ
max, CI, and CR for criteria 2.
For criteria 2, the calculation of normalizing weight is λmax= 6.3982, CI= 0.07963, and CR= 0.064<.10 respectively.
The need weights were acquired from the pair-wise assessment of alternatives concerning every decision criterion addressing the nearby weights. The need matrix formed from the nearby weights of every alternative was multiplied by the need weight matrix of the decision criteria concerning the objective.
Table 7 represents the Calculation of normalizing weight, λ
max, CI, and CR for criteria 3.
For criteria 3 calculation of normalizing weight is λmax= 6.498007511, CI= 0.099601502, and CR= 0.0803<.10 respectively.
The need weights were acquired from the pair-wise assessment of alternatives concerning every decision criterion addressing the nearby weights. The need matrix formed from the nearby weights of every alternative was multiplied by the need weight matrix of the decision criteria concerning the objective.
Table 8 represents the calculation of normalizing weight, λ
max, CI, and CR for criteria 4.
For criteria 4 calculation of normalizing weight is λmax= 6.591729311, CI= 0.118345862, and CR= 0.0954<.10 respectively.
The priority weights were obtained from the pair-wise evaluation of alternatives concerning each decision standard addressing the nearby weights. Thus, to decide the last alternative positioning, the priority matrix formed from the nearby weights of each alternative was multiplied by the priority weight matrix of the decision criteria concerning the objective.
According to
Table 9, the priority matrix indicated that the risk of fuel cost increase was the most critical, based on the criteria, and it was ranked 1.
Fuel Cost Increasing Risk had the highest priority weight (31.815%), which can contribute to the reduction of Supply Chain Disruption, Demand Variability, Quality and Security, and Ethical and Social Responsibility. Economic Risk had the Second-highest relative score of (23.649%). The increasing risk of fuel costs is the most crucial in the medical sector.
The AHP method determines ranking order: A1>A2>A3>A4>A5>A6. The proposed technique sought to suggest an organized evaluation model to identify and rank the supply chain risks in the medical sector and the AHP approach.
The proposed method suggests a strategy for minimizing the variety of risk categories and enhancing the decision-making process.
Table 10.
The final ranking of risk factors.
Table 10.
The final ranking of risk factors.
| Risks |
Ranking |
| Fuel Cost Increasing Risk |
1 |
| Economic Risk |
2 |
| Transportation and logistics Management Risk |
3 |
| Demand Risk |
4 |
| Relationship Management Risk |
5 |
| Sustainability Management Risk |
6 |
3.2. Data Analysis of SWARA Method
The procured data was subjected to scrutiny by being used in the formulation of the SWARA Method. This process aimed to identify the most dominant risks by utilizing all relevant matrices. The SWARA approach was employed to obtain weight values that hold significance in the decision-making process.
The first step of the SWARA method in our study involved compiling a helpful list of obstacles. Previous research articles have identified several hurdles, such as "Sustainable supply chain hurdles," among others. A systematic survey of the sustainable supply chain was conducted by thoroughly examining numerous legitimate academic journals.
Additionally, several reputable websites and scholarly books on the topic were consulted. Subsequently, professional perspectives on the supply chain for perishable goods were gathered through online interactions with experts from both the academic and perishable business sectors.
Based on their professional judgment, repetitive risks and risks with insignificant values were eliminated. Ultimately, six significant hurdles were chosen for the SWARA analysis. The second phase utilized the data obtained from the experts' assessments. They assigned degrees of significance to the identified impediments.
Adherence to the SWARA method was crucial in determining the weight of the risks.
Table 11 displays the list of obstacles and information gathered from the Expert Assessment.
Table 12 is organized in sequential order based on the estimated risk weights.
Here, observers’ values come from experts. The Pj value is computed by averaging the first row. Pj for lack of Fuel Cost Increasing Risk= (0.8+01+0.9+0.6+0.7)/5=0.80.
We obtained the P value from
Table 12 in the case. S
j was obtained by subtracting the second value of P
j from the first value of
Pj - Sj for Relationship management risk is (0.80-0.74) = 0.06.
The first value of Kj is always 1. Then, by adding 1 to the second value of Sj, 1+0.06=1.06 has been obtained by us. Similarly, Kj for the Sustainability Management Risk is 1.02, which was received.
The first value of Qj is 1.
Qj of relationship management risk, Qj(2nd) =Qj(2nd) = = =0.943
Similarly, following the same procedure to calculate the value of the remaining Qj.
W for Fuel cost Increasing Risk,
Wj= = = 0.20002
Similarly, following the same procedure, the remaining values of Wj are determined.
The supply chain industry commonly employs various methods to demonstrate risk assessment. However, a common challenge across these methods is the lack of sufficient and reliable quantitative data to provide an ideal risk assessment. Therefore, the implementation of decision-support strategies becomes crucial.
This research paper presents a model that utilizes the Analytic Hierarchy Process (AHP) and SWARA methods to analyze and assess risks hierarchically. These methods rely on the subjective evaluations, expertise, and intuition of experts in evaluating different categories and levels of risk. The test results of this model are promising, indicating its potential applicability in real-world scenarios.
Furthermore, the results demonstrate no significant differences in risk assessment outcomes when using the AHP techniques. Conversely, the SWARA model also utilizes these techniques to determine priority weighting and rank supply chain risks.
Through a comprehensive literature review, expert opinions, and discussions, several risks were identified.
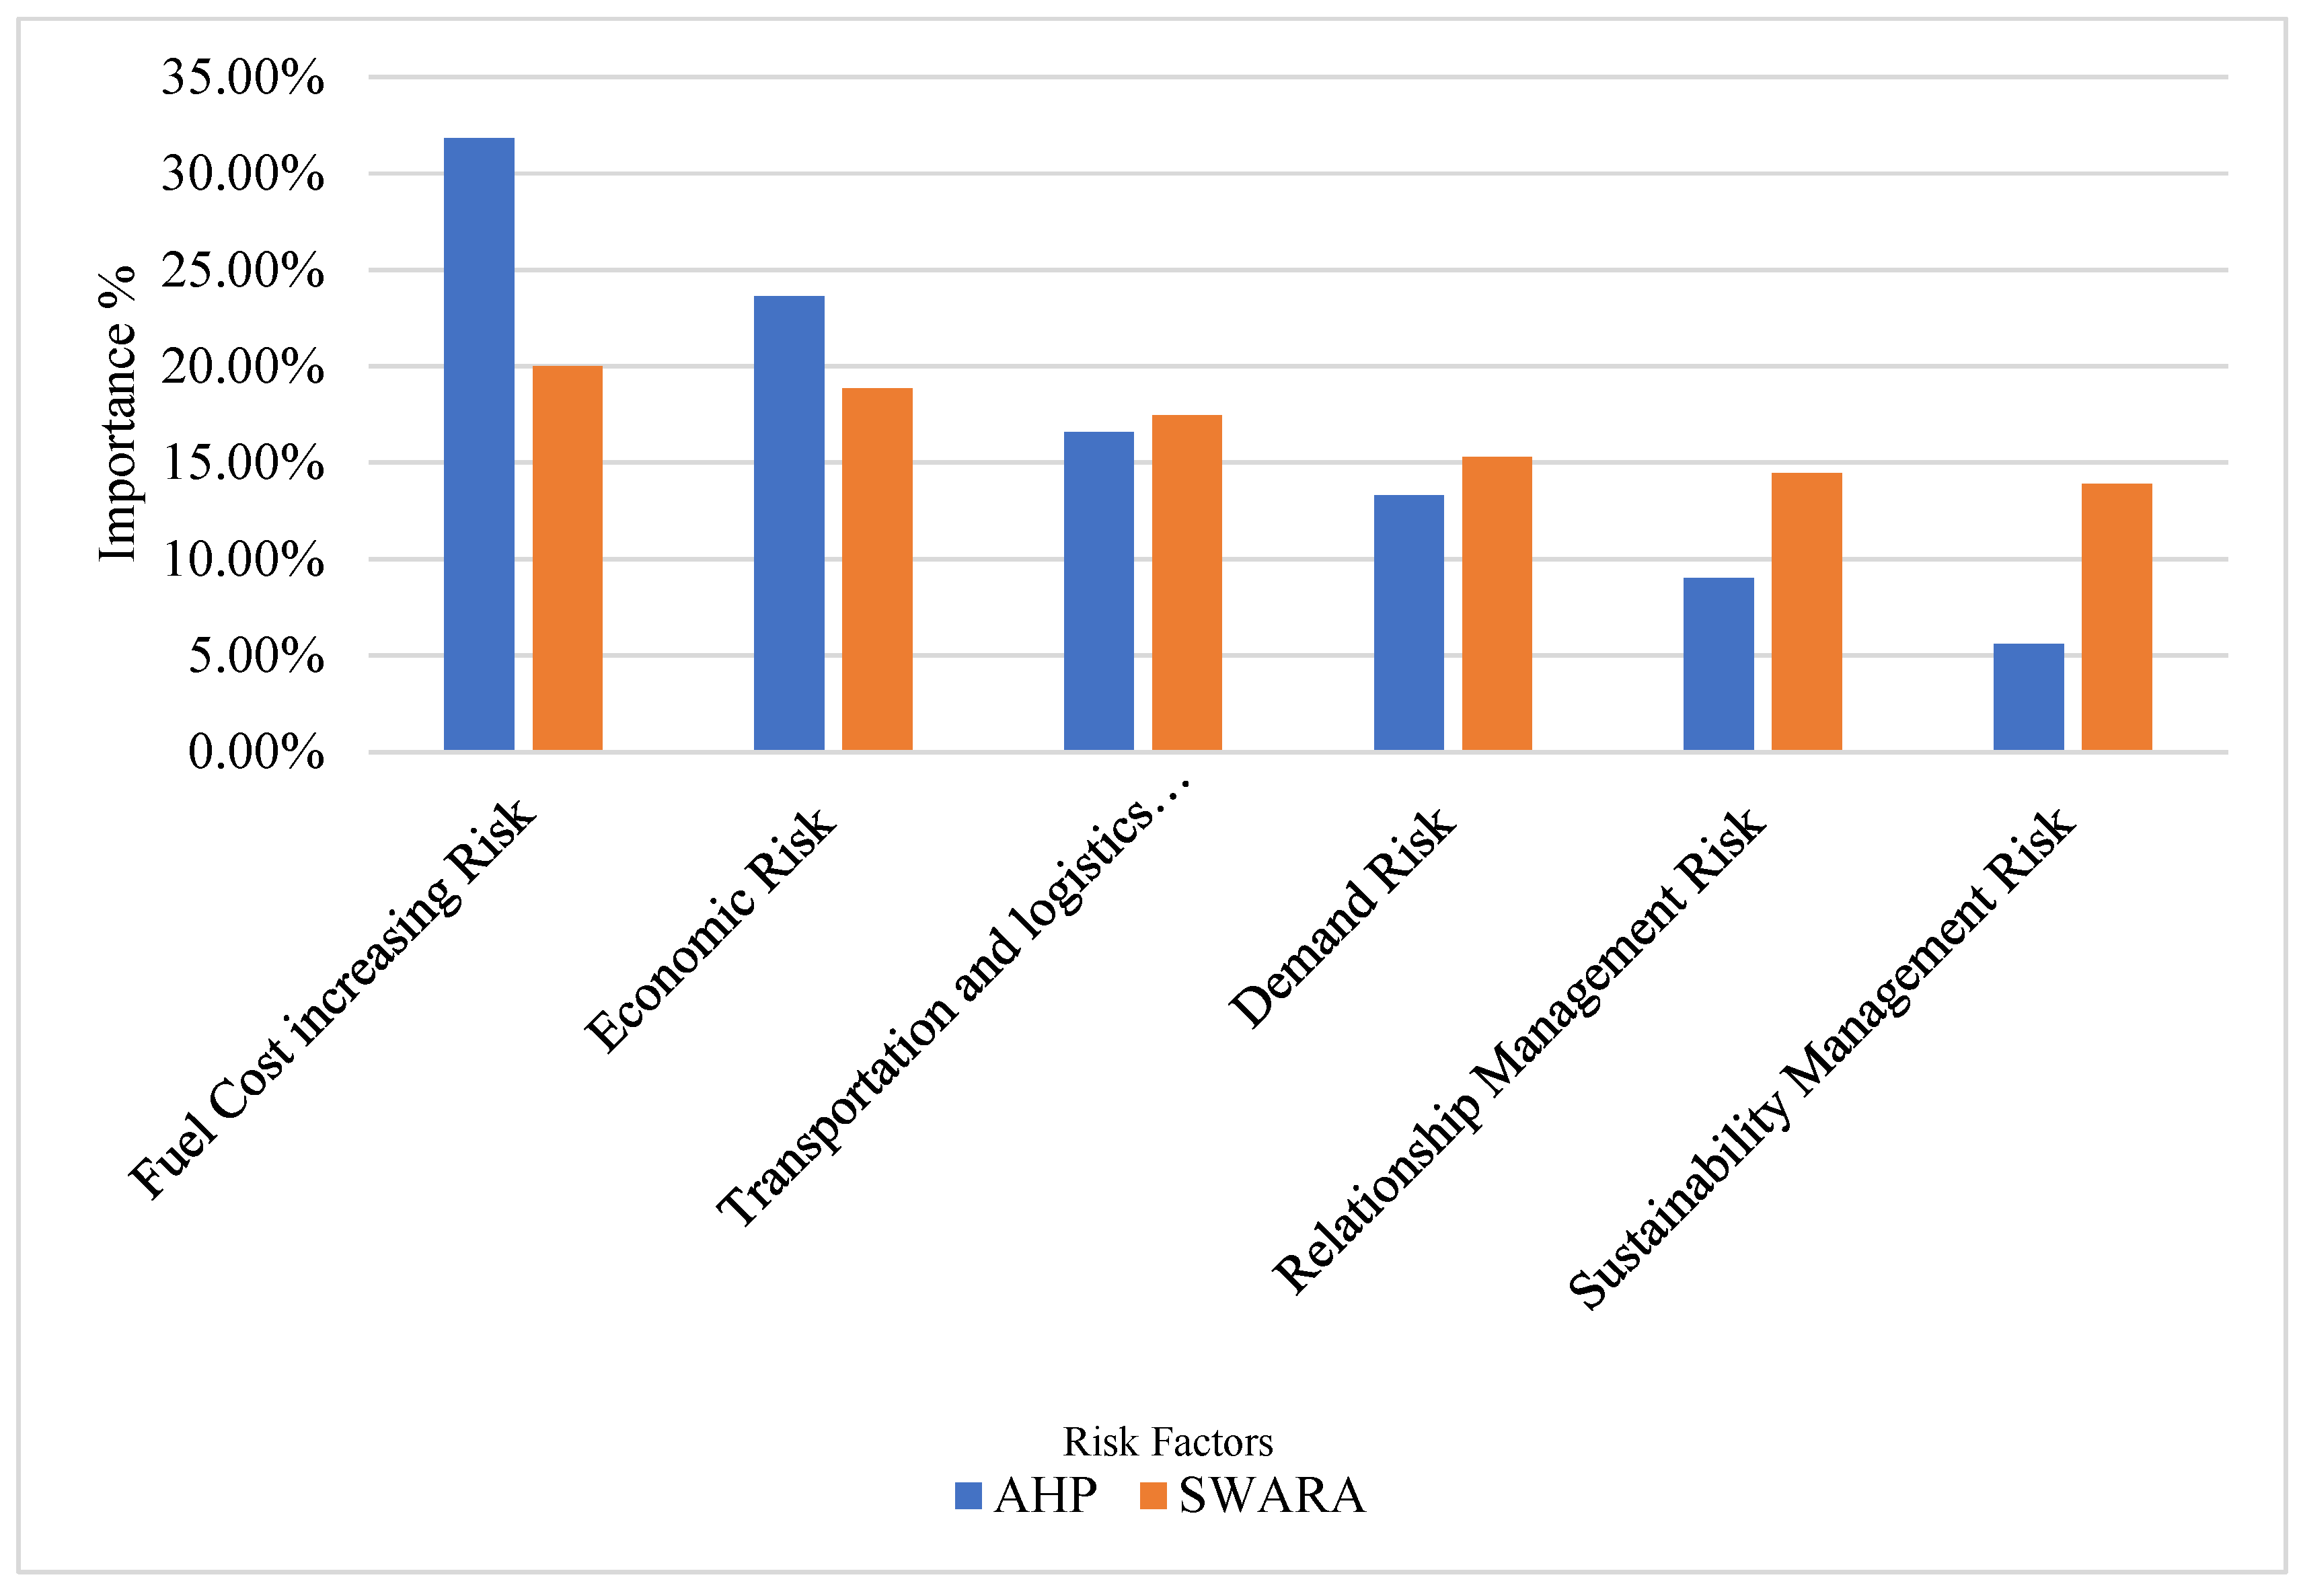
Figure 1. illustrates the comparative analysis of different methods for weighting and ranking risks using AHP and SWARA.
The main objective was to identify the critical risk factors associated with Supply Chain Management (SCM) and propose a risk network for assessing these risks. Following an extensive literature review, numerous significant risks and sub-risk factors related to SCM were identified. Subsequently, an expert poll was conducted to determine whether these risks are prevalent in the medical supply chain sector. As a result, six major risks and 22 sub-risks were identified. The final priority rankings were determined using two methodologies. The Analytic Hierarchy Process (AHP) revealed that technical risk was the most critical risk, with a priority weight of 31.815%, contributing to mitigating risks such as supply chain disruption, ethical and social responsibility, quality and security, and demand variability. Economic risk received the second-highest relative score of 23.649%, placing it in the second rank. Conversely, the step-wise weight assessment ratio analysis (SWARA) method indicated that the fuel cost increase risk was the most critical, with a score of 20.001%, ranking it first. SWARA also ranked other risks, such as Transportation & Logistic Management Risk, Demand Risk, Relationship Management Risk, and Sustainability Management Risk, in order of priority. It is essential to address these risks proactively to enhance sustainability in the medical sector of Bangladesh.
4. Conclusions
The medical industry faces numerous challenges in Bangladesh during the Ukraine-Russian war, such as the rising cost of fuel, intense global competition, reliance on raw materials, disruptions in the supply chain, variability in demand, and the impact of globalization. These difficulties have had a significant impact on the supply chain of the medical industries. In Bangladesh, the medical field is particularly vulnerable to various risks that can arise at any point in the supply chain, potentially jeopardizing its sustainability. This study has utilized two strategies, namely AHP and SWARA, to address these challenges.
The AHP strategy primarily employs the fundamental ratio to validate correlations. On the other hand, the SWARA strategy offers several advantages when the overall approach, whether pairwise analysis or strategy-based, is not a major challenge or concern. This allows experts to have more flexibility in demonstrating the weightage of each criterion compared to other more significant standards. Consequently, decision-makers can gain a clearer understanding of their criteria weighting preferences and make more informed choices.
AHP and SWARA based model is proposed for evaluating the supply chain risks in the context of the medical sector.
6 major and 22 sub-significant supply chain risks with regards to the area were distinguished through the current writing audit and from the experts’ feedback. After that, AHP techniques were utilized to rank these risks.
The priority matrix demonstrated by the AHP method that the specialized risk was the most basic risk in light of the measures and positioned as 1. Fuel Cost Increasing Risk had the most noteworthy priority weight, which can add to the decrease of risks of supply chain disruption, ethical and social responsibility, quality and security, and demand variability.
The implementation of SSCM is of utmost importance for the Bangladeshi medical sector to achieve a competitive edge in both domestic and international markets, particularly in times of conflict. It is essential for top management to promptly comply with governmental norms and regulations and raise awareness through sustainable supply chain practices. However, it should be noted that the outcomes of the SWARA and AHP studies may differ among experts due to their subjective judgments.
By addressing the challenges encountered in creating sustainable supply chains, the research's outcomes will help Bangladesh's healthcare sector as well as several other industries. Moreover, the findings of this research will assist policymakers in developing targeted strategic measures.
After careful consideration, it is evident that the review holds immense significance and usefulness. This is primarily due to the fact that if the organizations can effectively implement the proposed strategy in their supply chain to mitigate risks within the company, it will lead to an increase in their efficiency and productivity. As a result, substantial savings will be achieved. Furthermore, the sustainability aspect of the element will prove beneficial to all stakeholders, whether they are directly associated with the organizations, supply chain partners, or indirectly connected to the customers.
Funding
No particular grant was given for this research by governmental, private, or nonprofit funding organizations.
Acknowledgments
The authors would like to express gratitude to the experts and professionals for their valuable contributions in our surveys and interviews, strengthening our research.
Conflicts of Interest
According to the authors, there are no declared conflicting interests.
References
- Alinezhad, Alireza, and Javad Khalili. n.d. International Series in Operations Research & Management Science New Methods and Applications in Multiple Attribute Decision Making (MADM).
- Čerkauskienė, Alma, and Ieva Meidute-Kavaliauskiene. 2023. “The Aspects of Supply Chain Risk Management in the Healthcare Industry.” Journal of Logistics, Informatics and Service Science 10(1):1–19. [CrossRef]
- Chowdhury, Priyabrata, Sanjoy Kumar Paul, Shahriar Kaisar, and Md Abdul Moktadir. n.d. COVID-19 Pandemic Related Supply Chain Studies: A Systematic Review.
- Debnath, Binoy, A. B. M. Mainul Bari, Md. Mahfujul Haq, Diego Augusto de Jesus Pacheco, and Muztoba Ahmad Khan. 2023. “An Integrated Stepwise Weight Assessment Ratio Analysis and Weighted Aggregated Sum Product Assessment Framework for Sustainable Supplier Selection in the Healthcare Supply Chains.” Supply Chain Analytics 1:100001. [CrossRef]
- Emrouznejad, Ali, Sina Abbasi, and Çiğdem Sıcakyüz. 2023. “Supply Chain Risk Management: A Content Analysis-Based Review of Existing and Emerging Topics.” Supply Chain Analytics 3:100031. [CrossRef]
- Gupta, Varun, Dmitry Ivanov, and Tsan Ming Choi. 2021. “Competitive Pricing of Substitute Products under Supply Disruption.” Omega (United Kingdom) 101. [CrossRef]
- Han, Neungho, and Juneho Um. 2024. “Risk Management Strategy for Supply Chain Sustainability and Resilience Capability.” Risk Management 26(2). [CrossRef]
- Hayat, Khizar, Sharafat Ali Government, Graduate College Kot, Pakistan Muhammad, and Adeel Khan. n.d. “Exploring Factors of the Sustainable Supply Chain in the Post-COVID-19 Pandemic: SWARA Approach.”. [CrossRef]
- Hoang-Tien, Nguyen. 2022. Russia-Ukraine War and Risks to Global Supply Chains.
- Keršuliene, Violeta, Edmundas Kazimieras Zavadskas, and Zenonas Turskis. 2010. “Racionalaus Ginču̧ Sprendimo Būdo Nustatymas Taikant Nauja̧ Kriteriju̧ Svoriu̧ Nustatymo Metoda̧, Pagri̧sta̧ Nuosekliu Laipsnišku Poriniu Kriteriju̧ Santykinės Svarbos Lyginimu.” Journal of Business Economics and Management 11(2):243–58. [CrossRef]
- Majeed, Raafat Ali, and Hatem Khaleefah Breesam. 2021. “Application of SWARA Technique to Find Criteria Weights for Selecting Landfill Site in Baghdad Governorate.” IOP Conference Series: Materials Science and Engineering 1090(1):012045. [CrossRef]
- Saaty, Thomas L. 2001. Chapter 2 Fundamentals of the Analytic Hierarchy Process.
- Talukder M. T., I. , Pavel S. A. K., Islam M. Z., Monwar M. M., Ahmed E., Sultana S, and Akter T. 2024. “The War between Russia and Ukraine and Its Impact on Bangladesh: A Comprehensive Study.” Asian Journal of Economics, Business and Accounting 24(4):278–90. [CrossRef]
- Triantaphyllou, Evangelos, and Stuart H. Mann. Using the Analytic Hierarchy Process for Decision Making in Engineering Applications: Some Challenges. Journal of Industrial Engineering: Applications and Practice 1995, 2, 35–44. [Google Scholar]
- Wang, Liang, Yiming Cheng, and Zeyu Wang. Risk Management in Sustainable Supply Chain: A Knowledge Map towards Intellectual Structure, Logic Diagram, and Conceptual Model. Environmental Science and Pollution Research 2022, 29, 66041–66067. [Google Scholar] [CrossRef] [PubMed]
- Zhou, Xi Yin, Gang Lu, Zhicheng Xu, Xiaoqing Yan, Soon Thiam Khu, Junfeng Yang, and Jian Zhao. 2023. “Influence of Russia-Ukraine War on the Global Energy and Food Security.” Resources, Conservation and Recycling 188. [CrossRef]
|
Disclaimer/Publisher’s Note: The statements, opinions and data contained in all publications are solely those of the individual author(s) and contributor(s) and not of MDPI and/or the editor(s). MDPI and/or the editor(s) disclaim responsibility for any injury to people or property resulting from any ideas, methods, instructions or products referred to in the content. |
© 2025 by the authors. Licensee MDPI, Basel, Switzerland. This article is an open access article distributed under the terms and conditions of the Creative Commons Attribution (CC BY) license (http://creativecommons.org/licenses/by/4.0/).