Submitted:
04 February 2025
Posted:
05 February 2025
You are already at the latest version
Abstract
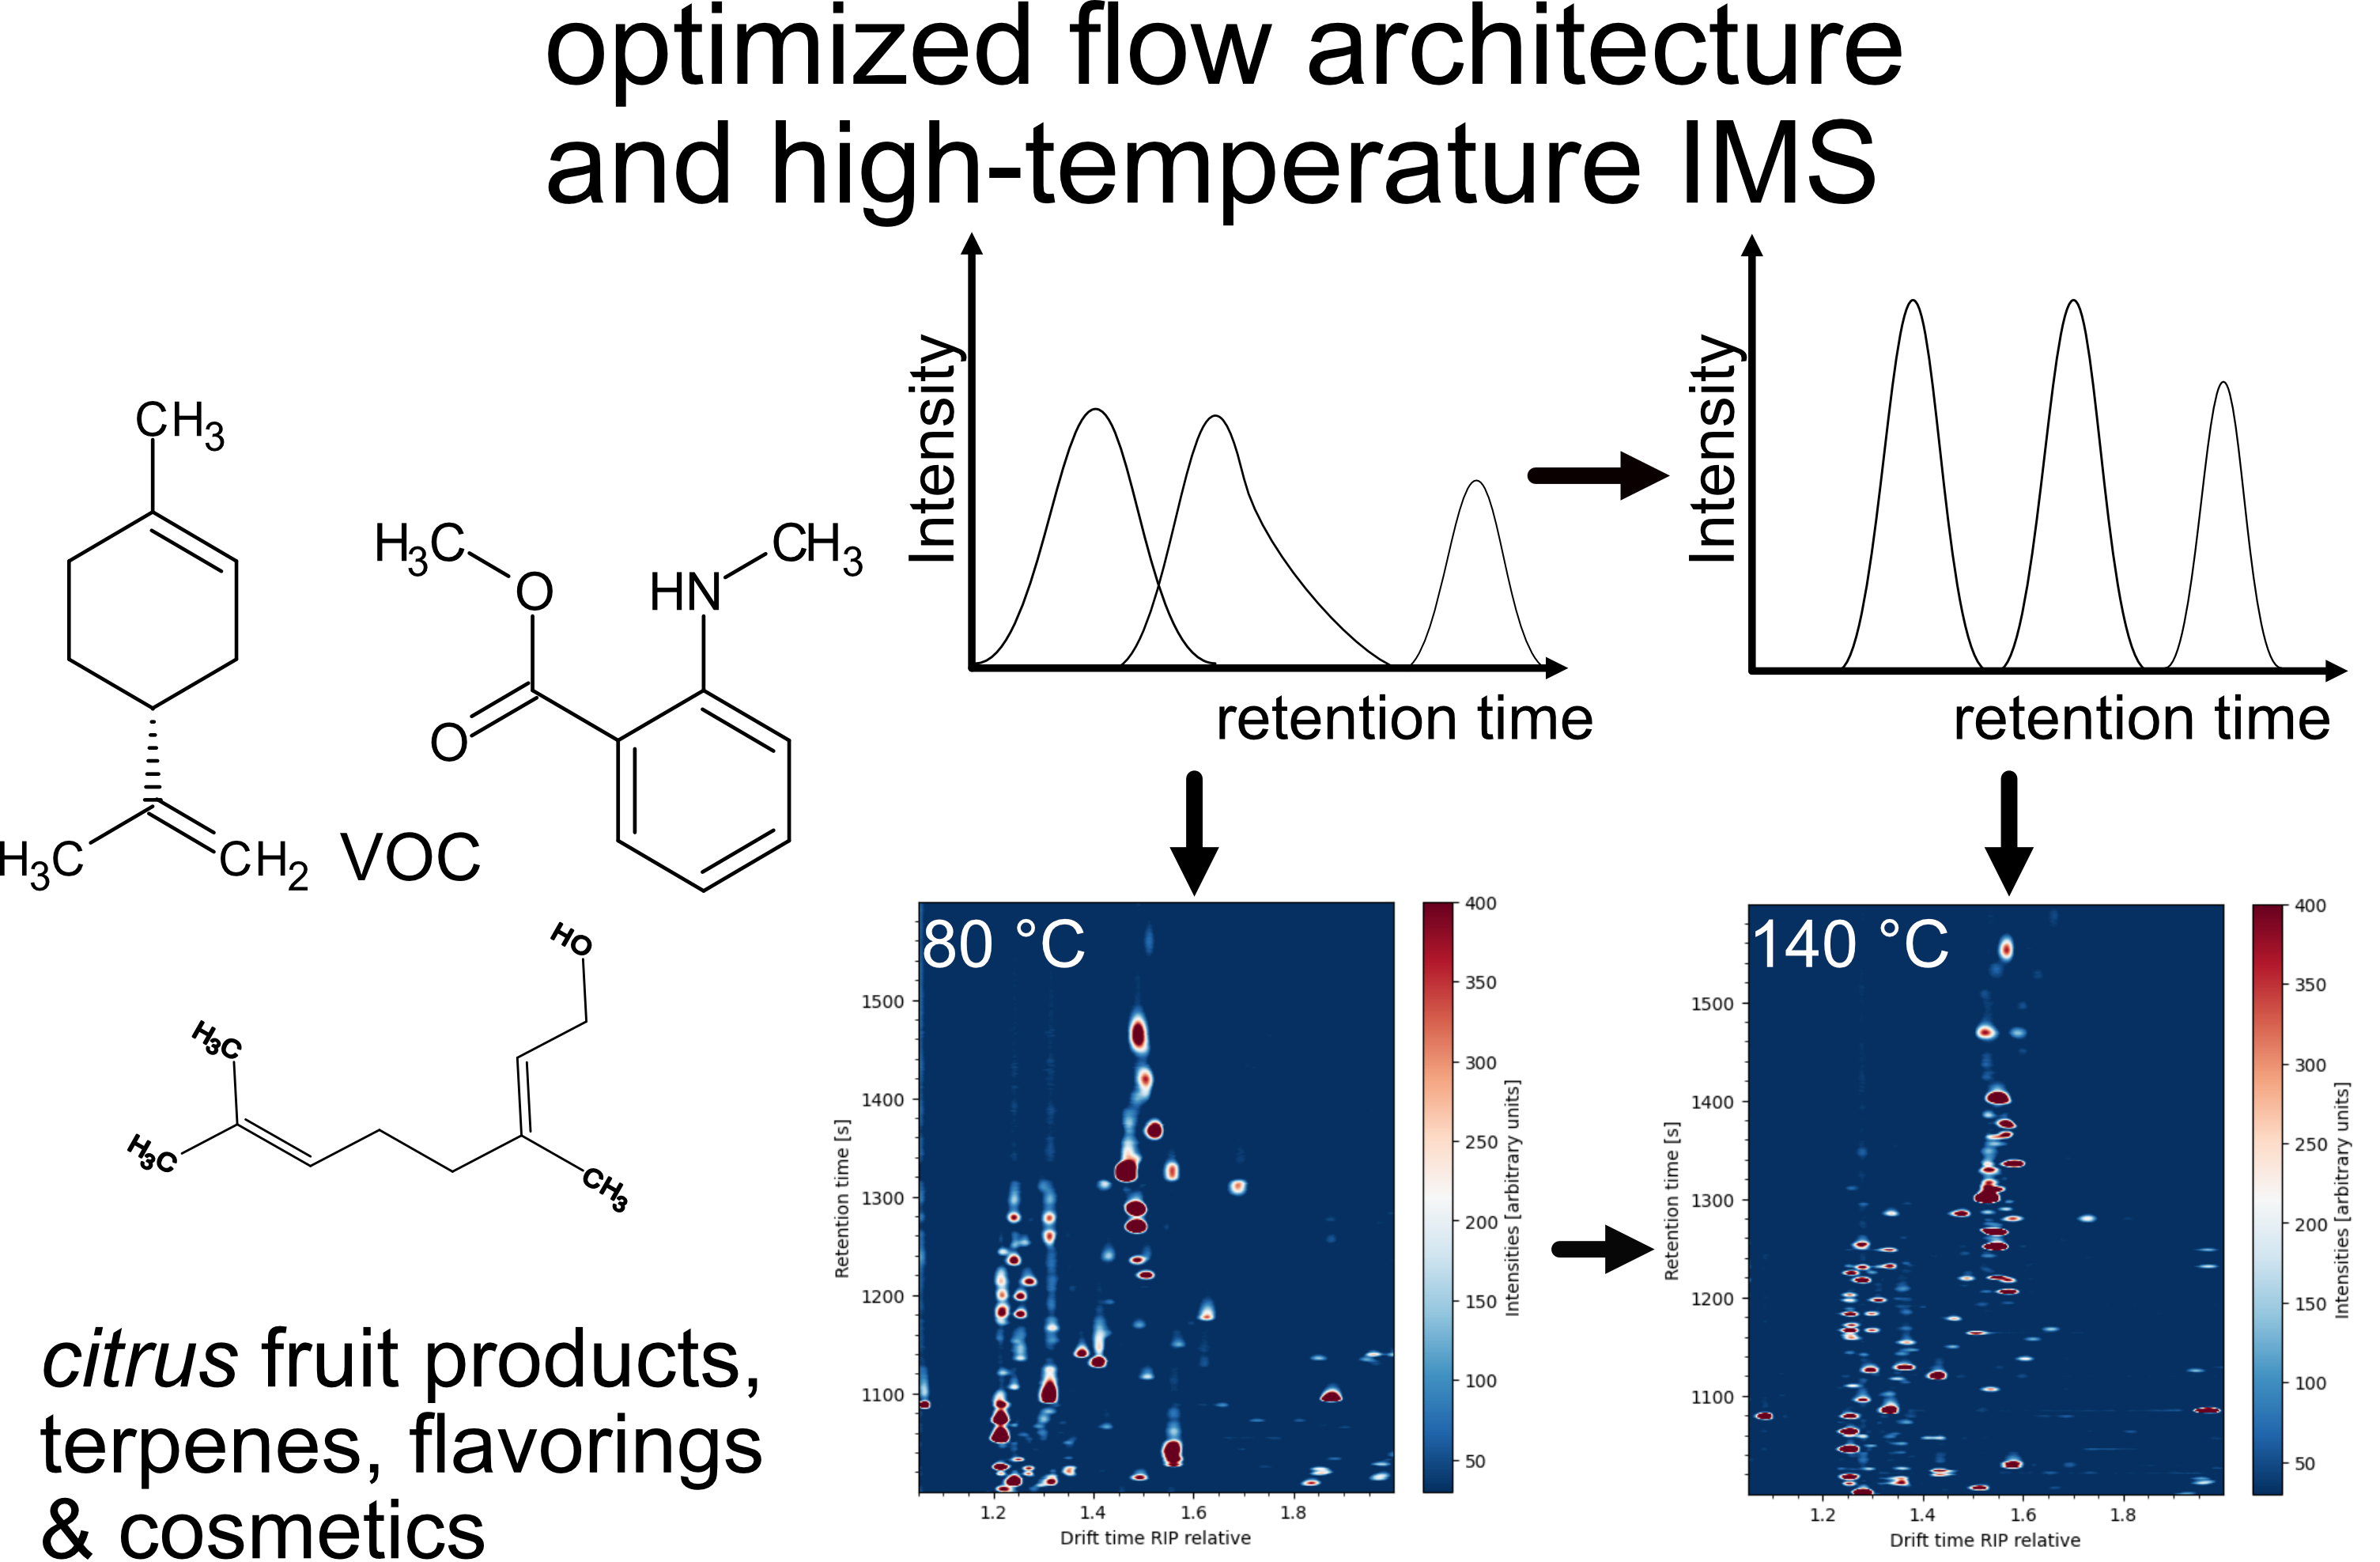
Gas chromatography – ion mobility spectrometry (GC-IMS) is a powerful technique in the field of food and flavor analysis specifically, as well as for the determination of volatile organic compounds (VOC) in general. It offers high sensitivity and selectivity, combined with a robust design. Sample preparation is typically not required and operating principles under ambient conditions facilitate routine analysis and usage at points of care. Up to now, a plethora of applications of GC-IMS exist in the fields of food analysis, primarily for determining flavors and evaluating the authenticity of food. However, the general issue of peak tailing is so far non-addressed in IMS. Typical drift tube applications (DTIMS) are designed with emphasis to high detection sensitivities and feature large void volumes. This study aimed at developing an optimized IMS instrument design (“focus IMS”), which allows for a signal mapping of the eluting compounds. Due to an optimized flow architecture of sample and drift gas, in combination with an increased drift tube temperature, IMS peak tailing is decreased significantly. In this study, the influence of drift gas flow and IMS cell temperature on the peak shape of several relevant allergenic terpenes was investigated. The peak quality optimization of DTIMS approaches for especially high-boiling substances facilitates the analysis of complex matrices, such as cosmetics, Citrus peel and essence oils as well as terpenes and terpenoids in general.
Keywords:
GC-IMS
; volatile organic compounds
; terpenoids
; static headspace sampling
; flavor analysis
1. Introduction
In recent years, an increasing number of applications of gas chromatography – ion mobility spectrometry (GC-IMS) in the quality analysis of food and other products such as food contact materials and cosmetics have been published. GC-IMS shows advantages in terms of sample preparation, cost reduction, and greener analytics [1]. In comparison to gas chromatography – mass spectrometry (GC-MS), there is no need for an energy-intensive vacuum system and nitrogen is a feasible carrier gas option, while GC-MS still mainly relies on helium in most use cases. The simple and robust technology and its impressive sensitivity for polar and medium polar compounds, paired with the simplified and the nearly “no-sample-preparation-needed” headspace approach make GC-IMS an ideal strategy for point-of-need analytics [1]. Several authors described applications of GC-IMS for the quality control of e.g., honey or olive oil, as well as applications for evaluating the authenticity of juices and essential oils [2,3,4,5,6,7]. While GC-IMS proved to be highly proficient in these fields, a typical observation in all published studies on GC-IMS is a distinct peak tailing effect in the IMS cell. Even when samples do not contain a high number and amount of high-boiling volatile organic compounds (VOC), such as terpenes or related compounds, the disadvantageous peak tailing was clearly present in all cases. This effect manifests when samples are rich in terpenes or high-boiling VOC and culminates in peak tailings of 60 seconds for e.g., geraniol, carvone, pinene, citral, and β-caryophyllene, in particular in the presence of complex matrices such as from Citrus peel [6,8,9]. This leads to an interference of signals when co-elution of different compounds occurs in complex matrices. A recent study reported on a dependency of the IMS cell temperature to peak shape and a reduced peak tailing at temperatures above 100 °C for alcohols, phenylpropanoids, and terpenoids [10]. Specifically, the latter are a highly complex and abundant class of natural compounds, playing an important role in chemical and pharmaceutical industries, e.g., in flavorings, foods and beverages, cosmetics [11,12].
The most commonly used commercial GC-IMS systems are drift tube based IMS (DTIMS), where ions are accelerated in a drift region against a defined drift gas and are detected with a Faraday plate [13]. Due to the collisions with drift gas molecules, each analyte features a certain drift time. This depends on its mass, charge, geometric structure and further temperature, drift gas, and the electric field strength [13,14]. Ionization is typically achieved with the use of beta emitters, commonly based on 63Ni or 3H, with the latter typically offering a higher sensitivity, as well as lower radiation hazards [13,15]. Since the usage of low-dose radiation tritium sources below 1 GBq is exempted from permission in the European Union, there are nowadays more low-dose tritium systems with an dose-level of approximately 100 MBq [4,6,16,17]. The ionization process is a reaction cascade initiated by collisions of electrons from the beta emitter 3H with the drift gas atmosphere of nitrogen or air [13]. In a clean atmosphere, proton-water clusters commonly termed reactant ions [H2O]nH+ are formed, while the number of water atoms depends on moisture and temperature of drift gas atmosphere [13,18,19]. Collisions between these clusters and sample molecules lead to adduct ion formation. This process is shown in equation 1 for low analyte loads and respectively for high analyte concentrations in equation 2 [13].
At low electric fields between 100-350 V·cm−1, the Mason-Schamp equation (see Eq. (3)) is applicable to calculate the ion mobility K.
The analyte concentration is an important variable in IMS. It affects the formation of monomers and dimers and further, leads to tailing effects of high-boiling volatile compounds [19,20].
Within the development of the classical DTIMS in the 1970s, the main goal was set on maximum sensitivity rather than an optimal signal mapping. Up to now, commercially available cells are typically not optimized in their flow dynamics, which results in partially substantial tailing effects. Consequently, a complex composition of samples often shows co-elution of different compounds. This is particularly critical for compounds with similar drift times, such as monoterpenes. In a worst-case scenario, a separation is neither possible by drift time nor in retention time due to the aforementioned tailing effects. Figure 1 shows an optimized flow architecture of the focus system in comparison to a conventional DTIMS setup. Due to this flow architecture, the chromatographic peak shape and resolution is improved, which typically increases overall sensitivity due to a higher signal/noise (S/N) ratio.
Figure 1.
Schematic setup of the classic 3H-drift time ion mobility spectrometer (a) and the focus 3H-drift time ion mobility spectrometer (b).
Figure 1.
Schematic setup of the classic 3H-drift time ion mobility spectrometer (a) and the focus 3H-drift time ion mobility spectrometer (b).
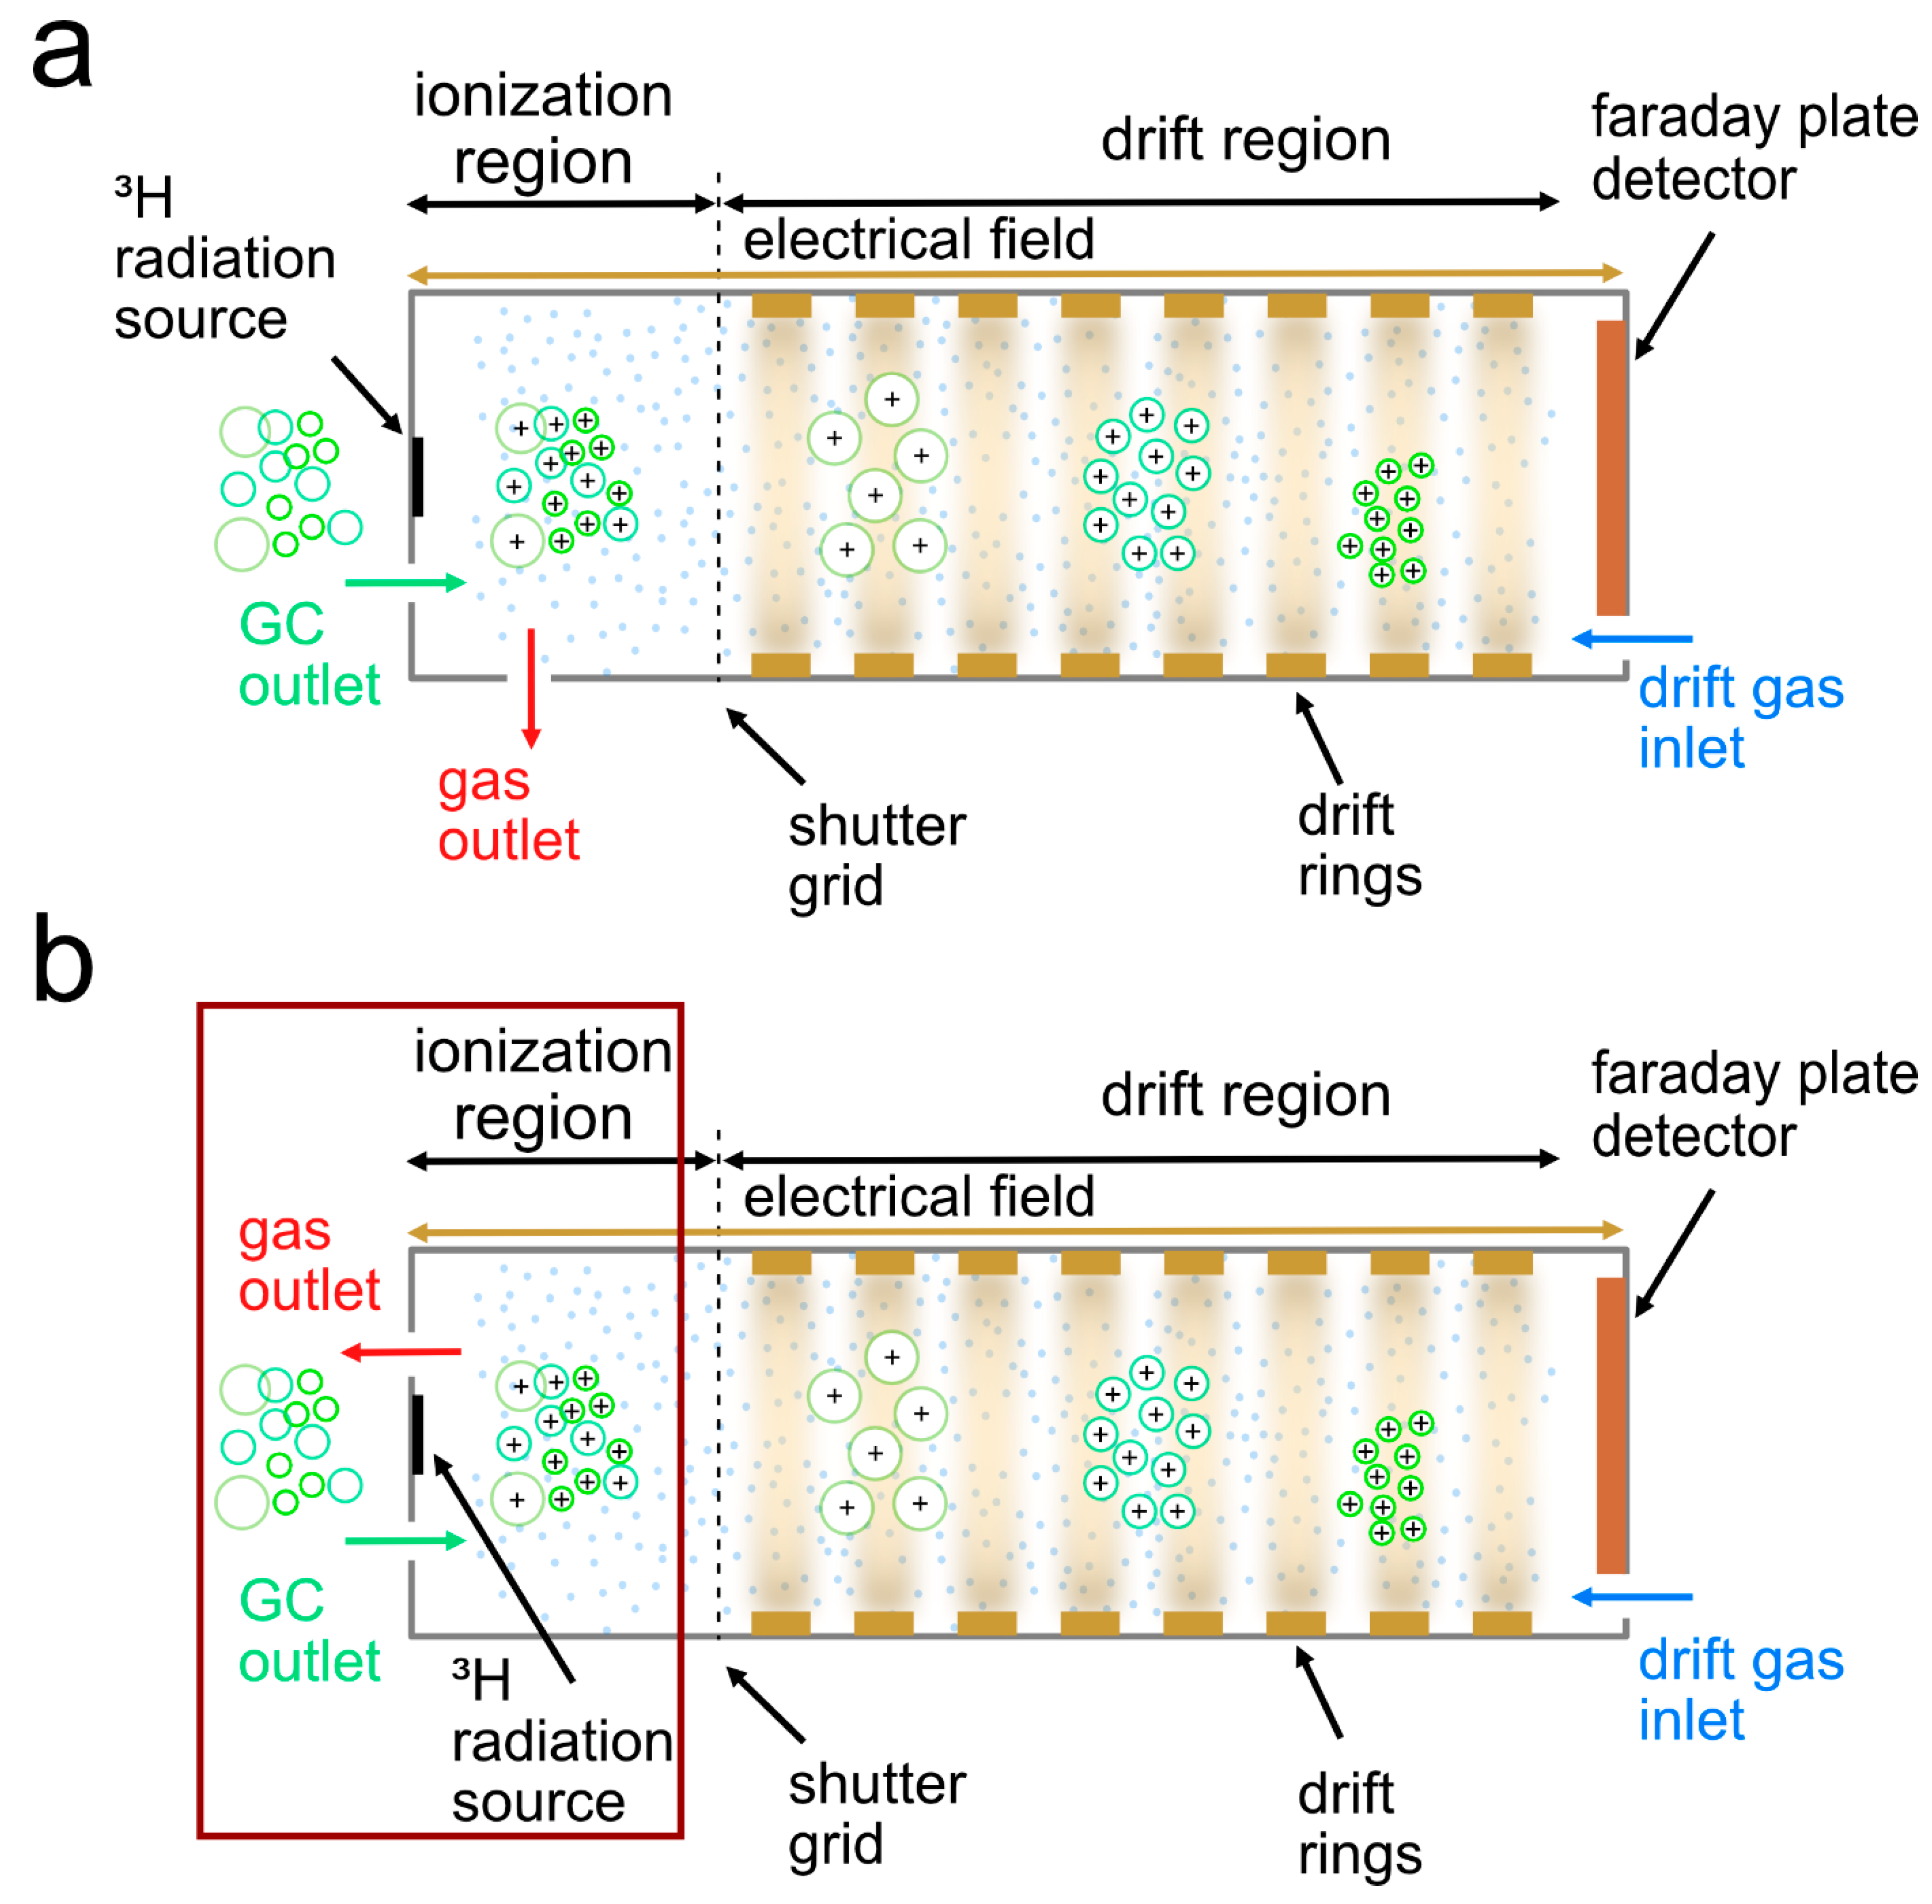
A further key component for optimal peak shapes is to maintain optimal chromatographic conditions. Peak tailing in GC may result from a number of different effects, such as overloading, incorrect liner dimensions, polar interactions, adsorption or condensation effects. To minimize adsorption and condensation effects, transfer lines used to connect the separation column with the detection system require an appropriately high temperature to minimize condensation effects. However, common DTIMS systems typically designed for simple and potentially mobile applications are operating at temperatures below 100 °C, which is sufficient for VOC with a comparatively low boiling points, but leads to well described tailing effects for high-boiling VOC [8,10].
For the characterization of peak shapes in chromatography, often statistical moments are used. The description of a gaussian peak shape is discussed in numerous publications [21,22,23,24,25]. The zeroth statistical moment describes the area under the peak profile, while the first moment M1 is the center of gravity, which corresponds to the peak median [22,23]. The peak width is related to the second statistical moment. It is the variance of the peak profile and defines the spread of the peak about its center of gravity [21]. The standard deviation σ of a gaussian peak is expressed as the square root of the second statistical moment M2. For the description of peak shape and symmetry, different factors are described in the literature and are visualized in Figure 2.
Figure 2.
Visual description of different peak parameters regarding width and asymmetry.
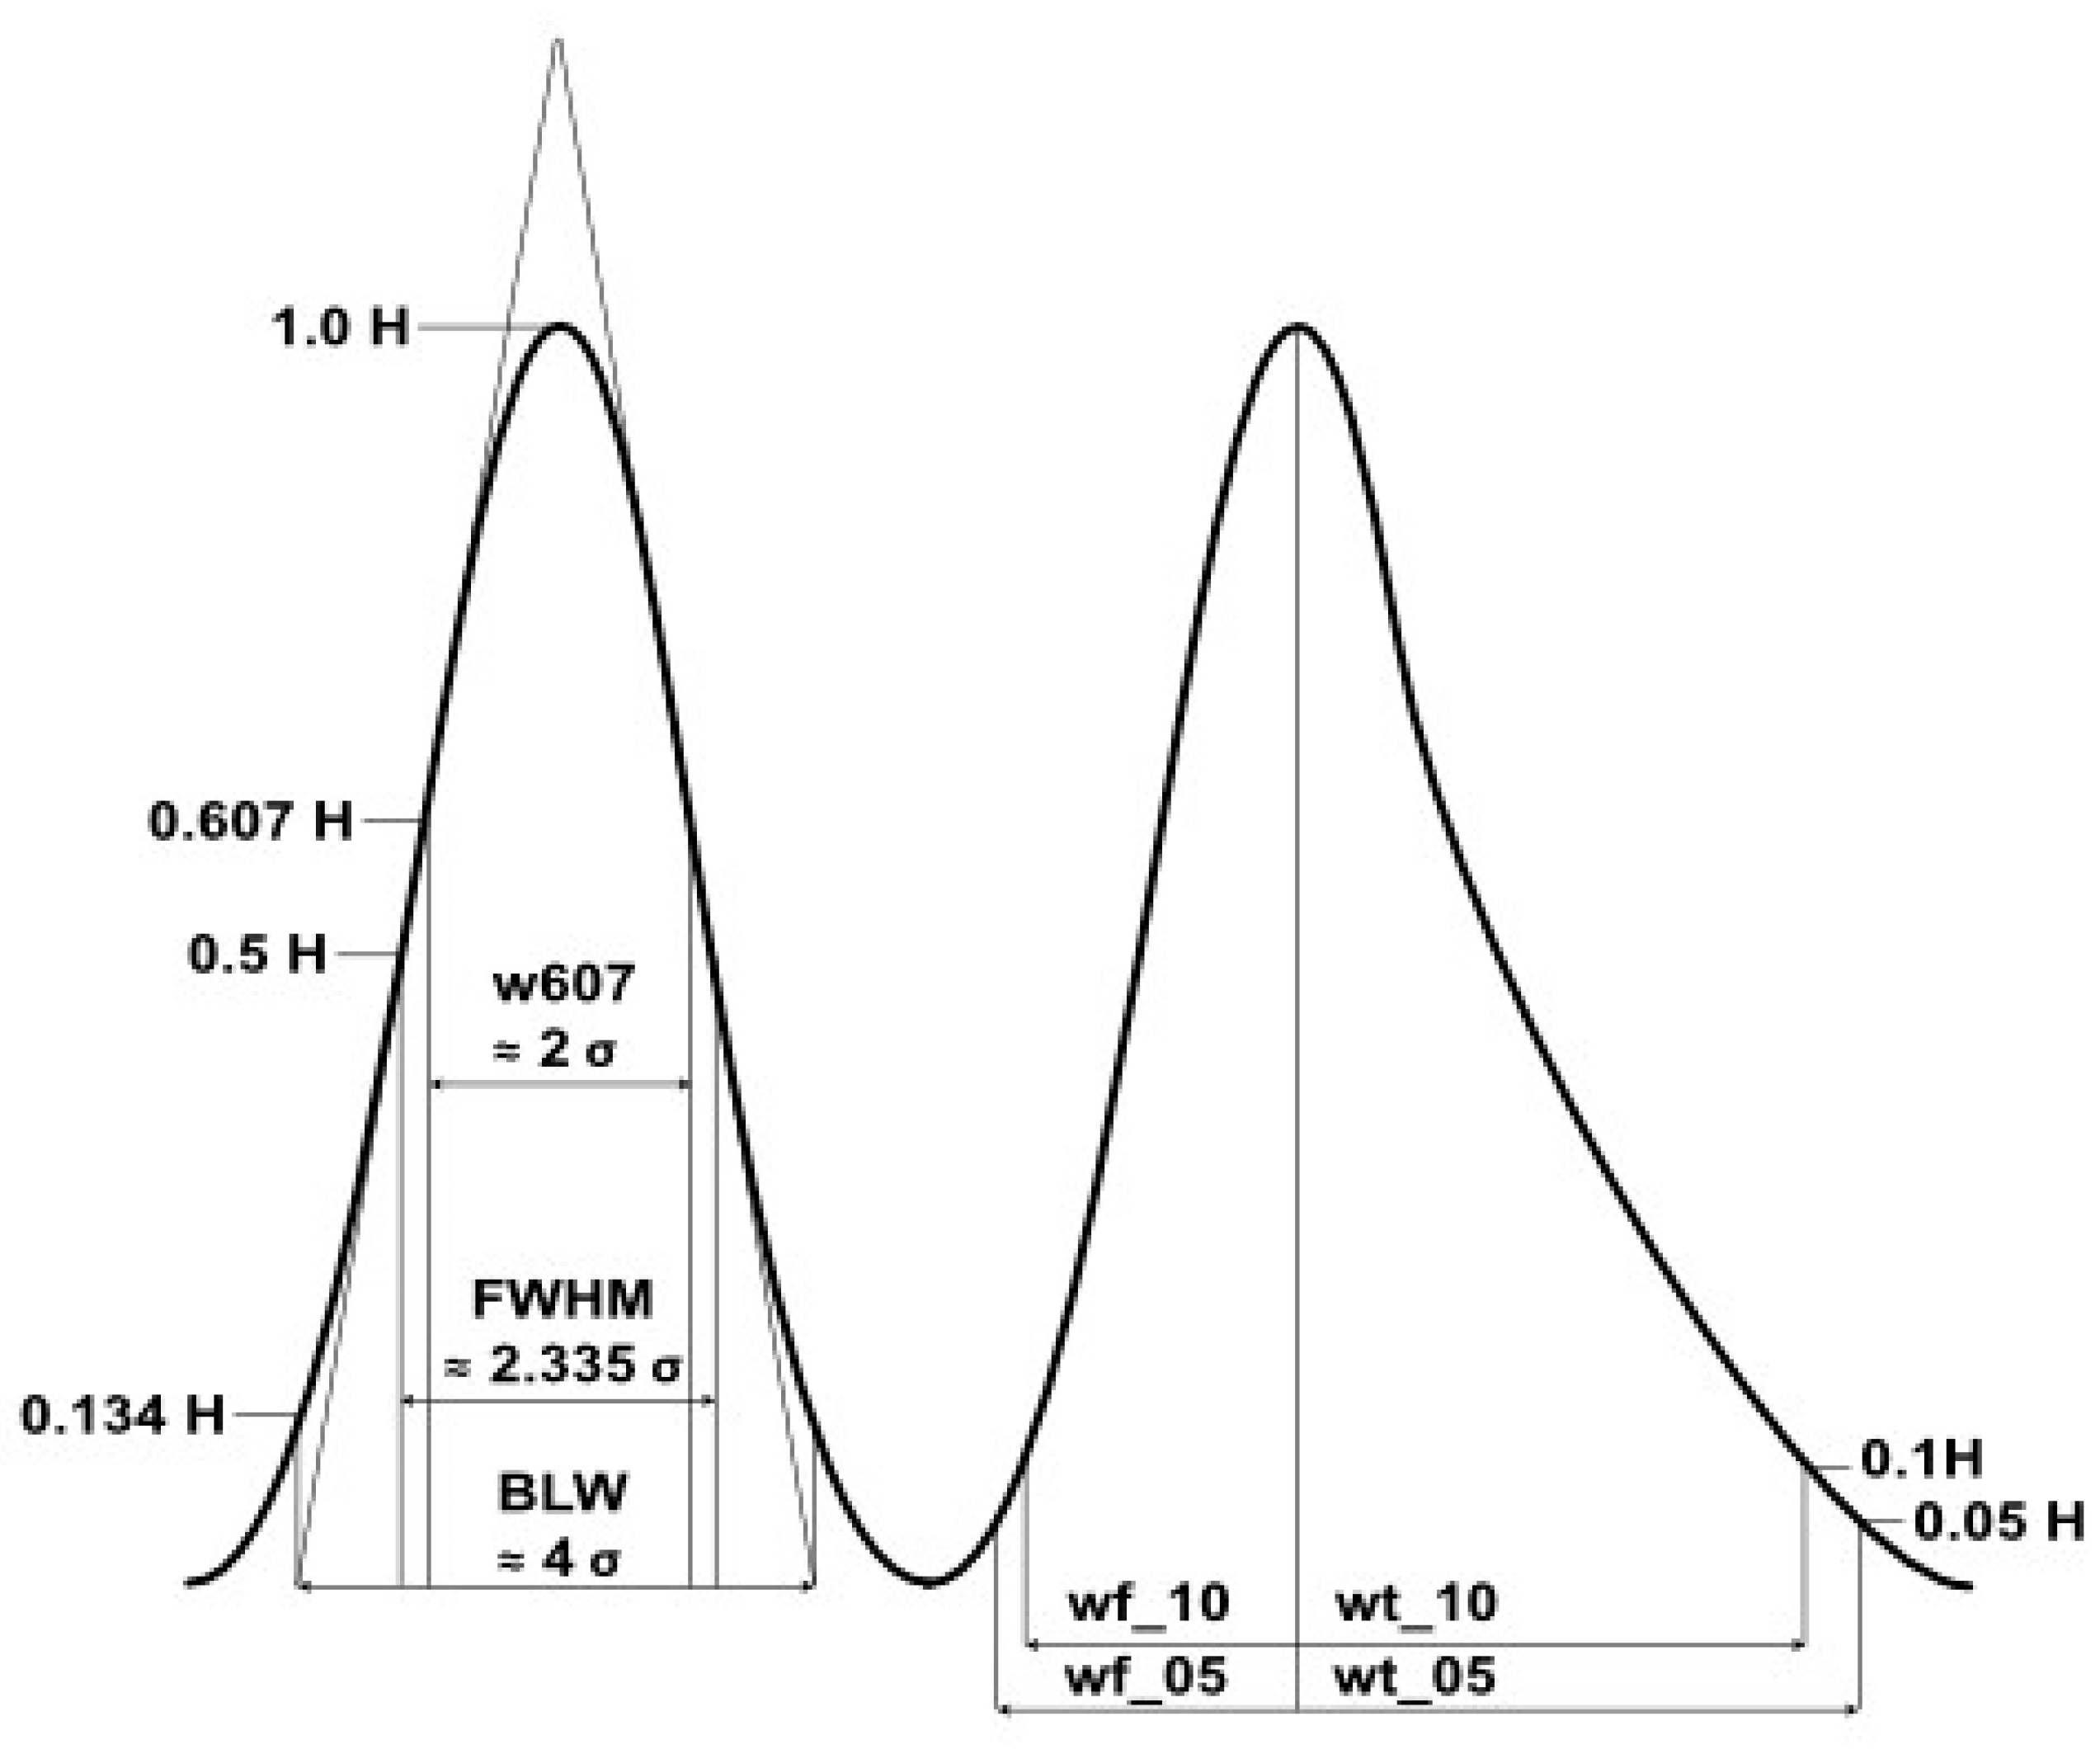
For the peak width, the most common method of description is the full width at half maximum (FWHM) with 2.355 σ for a gaussian distribution. Further, the values of full width at 0.607 of the peak maximum with 2 σ and the base width of peaks with 4 σ are relevant for the width description of peaks [23]. The description of the peak asymmetric in GC-MS often is calculated via the USP tailing factor (Eq. 4) or the asymmetric factor (Eq. 5).
The tailing factor is an important parameter for peak symmetry or asymmetry. Ideally, a peak should have a gaussian shape, displayed as the left peak in Figure 2, and a symmetry between the front and back half of the peak at a defined peak height, leading to a tailing factor of 1.0. Tailing factors above 1.0 are described as peak tailing, while values below 1.0 are defined as peak fronting. With the focus on maximum sensitivity, peak shape regarding tailing effects in GC-IMS was not part of research within the last decades, and there is no common definition for the tailing factor. Within former publications for peak shape in GC-IMS, the tailing factor is described the half width parameters at 10% height and the distance of the first half (Eq. 6) [10].
An optimized peak shape is mandatory with regard to complex matrices, such as food, flavorings and cosmetics, and in addition the point of care capabilities of GC-IMS. Exemplarily is the use of terpenoids in cosmetics and fragrances. However, their allergenic potential or their relevance for evaluating authenticity of different Citrus fruit products, e.g., juices or oils, need to be considered. The EU regulation 2023/1545 for labelling of fragrance allergens in cosmetic products was updated in July 2023 with 45 new entries such as Citrus limon, Citrus aurantium amara, and Citrus aurantium dulcis peel oil and as such, there is an increased demand for more sophisticated and selective analytical approaches [26,27]. In the context of Citrus fruit products, highly complex profiles of up to 300 different VOC is a challenging, but promising source of information [28]. In general, Citrus fruit oils can be differentiated into two groups: Citrus juice oils recovered during the concentration process and Citrus fruit peel oils, resulting from the upcycling of the peels [29,30]. Recovered juice oils are also called “essence oils” and differ from the peel oils mainly in oxygenated substances, as they show a higher content of esters and a lower content of aldehydes in comparison to the peel oils [31]. Oils of different Citrus fruits vary in concentration of substances and in composition. Grapefruit and orange oils contain the fruity ester ethyl butyrate, while for mandarin oils, methyl-n-methylanthranilate is well described [32]. In general, monoterpene hydrocarbons constitute the major volatile fraction with limonene, β-pinene, camphene, γ-terpinene, terpinolene, and similar compounds. Further VOC are sesquiterpene hydrocarbons, such as β-caryophyllene or β-bisabolene, monoterpene alcohols (e.g., linalool, geraniol, or α-terpineol) and aldehydes, such as neral, geranial, or nonanal [28]. While some major compounds (e.g., limonene) have only a limited aroma impact, some low-abundant compounds are particularly important for Citrus flavors and show distinct effects on the aroma [29]. Due to this complex pattern of VOC at different concentrations, peak tailing commonly leads to interference of signals and finally, to a substantial loss of information. Even though there has recently been research in the field of hyper-fast GC in combination with flow-optimized IMS cells, peak tailing and peak shape in general, especially with conventional GCs, is an existing and unaddressed issue in the analysis of volatile flavor compounds, such as terpenes, in the field of HS-GC-IMS analysis [33].
Consequently, the aim of this study was to systematically minimize effects that lead to excessive tailing in GC-IMS systems: first, by an optimized flow architecture and second, by high IMS drift tube temperatures to reduce condensation effects. As an example, a number of representative terpenes and terpenoids were selected. These insights could be beneficial for optimization of GC-IMS-based strategies in the analysis of complex flavor and essential oil samples, as well as cosmetic products containing contact allergens, such as citronellol or geraniol.
2. Materials & Methods
2.1. Reagents and Samples
Analytical standards of ethyl butyrate (CAS: 105-54-4), (R)-(+)-limonene (CAS: 5989-27-5), γ–terpinene (CAS: 99-85-4), geraniol (CAS: 106-24-1) and geranyl acetate (CAS: 105-87-3) were purchased from Sigma-Aldrich Chemie GmbH, Taufkirchen, Germany. Citral (CAS: 5392-40-5) and β–pinene (CAS: 18172-67-3) from Alfa Aesar by Thermo Fisher GmbH, Kandel, Germany as well as α–terpineol (CAS: 98-55-5) and citronellol (CAS: 106-22-9) from Acros Organics by Thermo Fisher GmbH, Kandel, Germany. methyl-n-methylanthranilate (CAS: 85-91-6) was purchased from Thermo Fisher GmbH, Kandel, Germany, sabinene (CAS: 3387-41-5) from Molekula GmbH, München, Germany, (S)-(+)-carvone (CAS: 2244-16-8) from Merck KGaA, Darmstadt, Germany and β-caryophyllene (CAS: 87-44-5) by Carl Roth GmbH & Co. KG, Karlsruhe, Germany. Canola oil (Brassica napus seed oil) was the solvent for the standards and obtained by GLOBUS-Holding GmbH & Co. KG, St. Wendel, Germany.
Two standards were prepared, the first one included 0.2 mg/g. ethyl butyrate, sabinene, β-pinene, (R)-(+)-limonene, γ–terpinene, α–terpineol as well as (S)-(+)-carvone. The second standard was prepared with 0.2 mg/g citral, citronellol and geraniol in a concentration of and 0.4 mg/g β-caryophyllene, geranyl acetate and methyl-n-methylanthranilate.
In Table 1, the flavor compounds with their physical properties are displayed. For the experiment, several compounds were selected, covering esters, aldehydes, monoterpenes, monoterpene alcohols, a monoterpenoid acetate ester, as well as a sesquiterpene. Generally, the compounds are in a mass range between 116 g/mol to 204 g/mol and show boiling points from 120 °C to nearly 260 °C, representing a large range of flavor active VOC.

Table 1.
Structural formula, physical properties, and appearance of the selected flavor compounds.
| Compound |
Molar Mass [g/mol] |
Boiling point [°C] |
Structure | Appearance |
| Ethyl butyrate (CAS: 105-54-4) | 116.16 | 120 - 121 |  |
Sweet oranges (C. sinensis (L.) Osbeck), mandarins (C. reticulata) |
| Sabinene (CAS: 3387-41-5) | 136.23 | 163 - 164 |  |
All Citrus fruits |
| β – Pinene (CAS: 18172-67-3) | 136.23 | 166 |  |
All Citrus fruits |
| (R)-(+)-Limonene (CAS: 5989-27-5) | 136.23 | 177 - 178 |  |
All Citrus fruits |
| γ – Terpinene (CAS: 99-85-4) | 136.24 | 182 |  |
All Citrus fruits |
| α – Terpineol (CAS: 98-55-5) | 154.25 | 217 - 219 |  |
All Citrus fruits |
| (S)-(+)-Carvone (CAS: 2244-16-8) | 150,22 | 230 - 231 |  |
All Citrus fruits |
| Geraniol (CAS: 106-24-1) | 154.25 | 229 - 230 |  |
All Citrus fruits |
| Geranyl acetate (CAS: 105-87-3) | 196,29 | 138 |  |
All Citrus fruits |
| Citronellol (CAS: 106-22-9) | 156,27 | 225 |  |
All Citrus fruits |
| Citral (CAS: 5392-40-5) | 152.23 | 227 - 229 |  |
All Citrus fruits |
| Methyl-N-Methylanthranilate (CAS: 85-91-6) |
165.19 | 255 |  |
Mandarins (C. reticulata) |
| β-Caryophyllene (CAS: 87-44-5) | 204,35 | 256 - 259 |  |
Grapefruits (C. paradisisi) |
2.2. Instrumentation
All measurements were performed with a prototype Focus-HTIMS (Gesellschaft für analytische Sensorsysteme mbH, Dortmund, Germany), coupled to a 6890N gas chromatograph (Agilent Technologies Inc., Santa Clara, CA, USA), equipped with a CombiPAL headspace sampling unit (CTC Analytics AG, Zwingen, Switzerland). Prior to the measurements, the headspace conditions were optimized via design of experiment (DOE), using 20 analysis runs and a central composite design (CCD) approach. The temperature range was set between 50 °C and 110 °C and the incubation time in a range of 300 - 1,100 s. Further, the influence of injection volume was evaluated in a range from 250 - 1,200 µL. To optimize the peak areas while minimizing the incubation temperature, the following parameters were set for the measurements: static headspace injection was carried out with an incubation at 85 °C for 12 min and 400 rpm. 1 mL headspace volume was injected by a gastight 2.5 mL syringe (Trajan Scientific Australia Pty Ltd., Ringwood, Australia). To avoid condensation effects, the headspace syringe was heated to 100 °C. The syringe was flushed for 5 min after each injection with nitrogen to avoid cross contamination effects. Chromatographic separation was performed on a HP-5 capillary column (operating temperature: −60 - 325 °C/350 °C; SN: USB345942H) with a 30 m × 0.32 mm × 0.25 μm film thickness (Agilent Technologies Inc., Santa Clara, CA, USA). Injection was performed using a split/splitless injector at 200 °C and a split ratio of 1:20. Carrier gas was nitrogen with a purity of 99.99 % at constant pressure of 6.7 psi. GC oven was programmed from 40 °C to 120 °C with 5 °C/min and from 120 °C to 240 °C with 12 °C/min, resulting in a run time of 26 min and afterwards, a post run of 4 min at 240 °C. The transfer line to the IMS was set to 200 °C.
The prototype Focus-HTIMS setup is based on an 3H ionization source (approx. 100 MBq ß-emission). The drift tube has a diameter of 15.2 mm and a length of 53 mm. The material was stainless steel and PEEK. For the experiments, the IMS was operated in positive ion mode at a constant voltage of 2.5 kV with different drift gas flows of nitrogen, explained in the following chapter. The injection voltage was 2,500 V and the blocking voltage 70 V. The drift gas flow was controlled using a mass flow controller (Voegtlin Instruments AG, Aesch, Switzerland). The IMS cell was heated with two high performance cartridge heaters. Thus, the prototype allows for temperature control of the drift tube up to 180 °C. Each spectrum was averaged of six scans, using an injection pulse width of 100 μs, a repetition rate of 21 ms and a sampling frequency of 228 kHz.
2.3. Experimental Design for High Temperature Focus IMS
Within the experiment, the effect of temperature and drift gas flow was evaluated. As gas density is highly dependent on the temperature, a full factorial design was selected. Selected temperatures were 80 °C, 100 °C, 120 °C, 140 °C, and 160 °C, while drift gas flow was set to 100 mL/min, 125 mL/min, 150 mL/min, 175 mL/min, and 200 mL/min, respectively. Consequently, there are 25 different IMS settings for evaluation of temperature and drift gas settings. Further measurements of two standards with common volatile compounds of different terpenes and Citrus fruit related substances were taken in triplicates, resulting in 150 analyses.
2.4. Data Processing and Evaluation
2.4.1. Reactant Ion Peak (RIP) and Background Calculations
For evaluation of the RIP height and the RIP position, the .mea-files were imported with gc-ims-tools [29] and subsequently preprocessed. Intensity values of the spectra, as well as the drift time data were accessed and further evaluated, using the functions .argmax() for the RIP position and .max() for the RIP height from numpy [34]. The signal height was converted to [V] as the raw data is in binary format. For calculation of the background intensity, drift time values were set relative to the RIP and data between 1.05 ms and 1.20 ms of the drift time axis was used. For the retention time axis, the area between 1,150 s and 1,300 s was evaluated and data was further processed with numpy .mean() and .std() functions [34].
2.4.2. Data Evaluation of the Experiments for High Temperature Focus IMS
The .mea files were imported by gc-im-tools. For drift and retention time dimension, the prominence and minimum peak height were set and further local maxima were calculated using scipy.signal.find_peaks() function [35]. Therefore, the spectrum was projected onto the axis of the drift time by calculating the values along the retention time axis, with the given prominence and minimum peak height. GC spectra at detected peaks were extracted and further, retention time dimension was evaluated with defined values of prominence and minimum peak height. Several peak and spectrum parameters were evaluated, such as drift time [ms], retention time [s], position of the RIP [ms] and drift tube temperature [°C]. In addition, the peak height, the peak width and the left and right horizontal intersection points at 10% and 50% height were calculated. FWHM was accessed as the difference between the right and left intersection points at a peak height of 50%. The tailing factor was calculated using Eq. 6.
3. Results & Discussion
3.1. RIP & Background Calculations
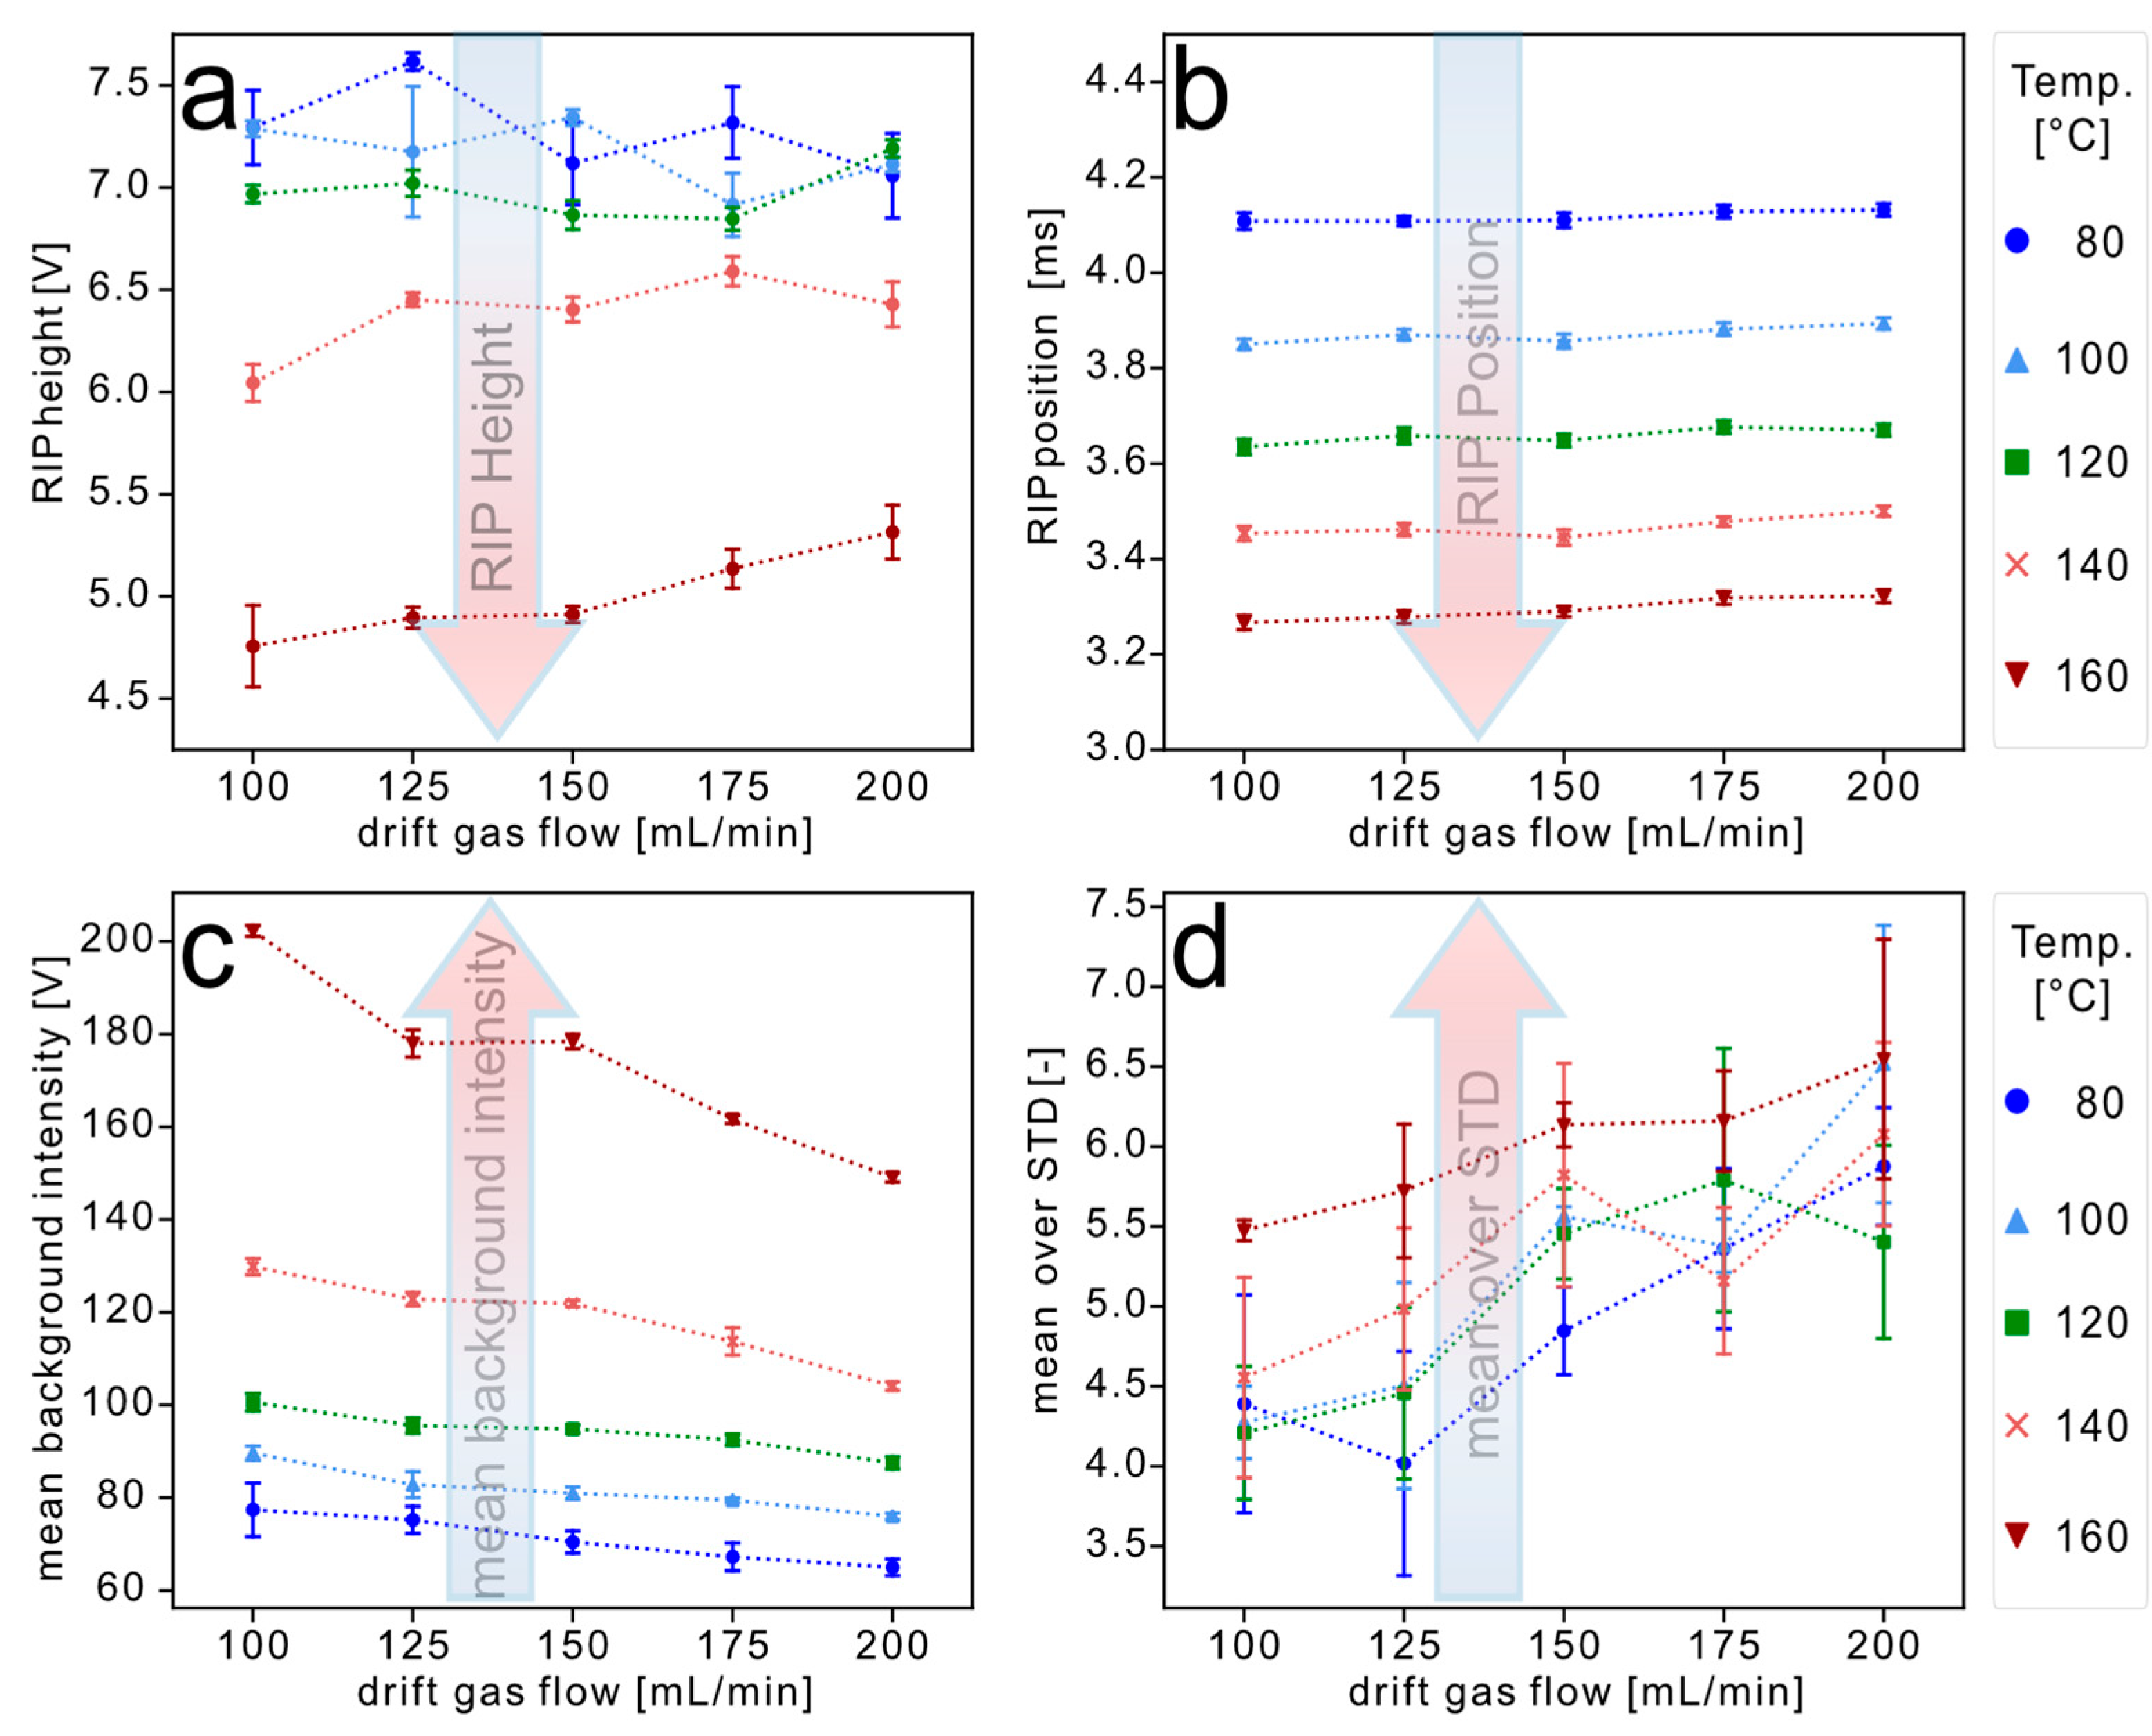
Within the studies, height and position of the RIP were evaluated, as well as the background and the standard deviation of the background. Results are shown in Figure 3. In Figure 3a, the RIP height is shown at different drift gas flows, depending on the IMS cell temperature. While the RIP heights at 80 °C, 100 °C and 120 °C were approximately constant in a range between 7-7.5 V, the RIP heights at 140 °C and 160 °C were significantly decreased. At 160 °C, the RIP height was decreased to values between 4.75 - 5.35 V. Further, there was an increase of the RIP height observable with an increasing drift gas flow. This effect was perceptible at a cell temperature of 140 °C with an increase from 6.035 V at 100 mL/min to 6.430 V at 200 mL/min and at 160 °C from 4.757 V at 100 mL/min to 5.318 V at 200 mL/min.
The decrease of the RIP height at high temperatures is most likely caused due to a decrease in moisture and consequently, fewer proton water clusters. At higher drift gas flows, this effect is less distinct, due to a subsequent higher moisture content of the gas atmosphere. For RIP position, shown in Figure 3b, no observable effects of a shift at different drift gas flow rates were noticed. The dependence of the RIP position and IMS cell temperatures were already described earlier in the literature and are in line with the Mason-Schamp-Equation (Eq. 3) [6,10]. In Figure 3c, the mean background intensities are visualized and show that higher temperatures led to higher mean background intensities. This correlation was also reported by Capitain et al., recently [10]. However, all data curves featured a distinct decrease in the mean background intensity at higher drift gas flow rates. The decrease of the mean background intensity was most prominent at 160 °C, with a decrease from 202.28 V at 100 mL/min to 149.09 V at 200 mL/min, with a loss of 0.497 V/mL·min−1. A decrease of the mean background intensity was also prominent at the other cell temperatures, e.g. at 80°C, with a loss of 0.124 V/mL·min−1 from 77.40 V at a drift gas flow of 100 mL/min to 64.98 V at 200 mL/min. In Figure 3d, the mean background intensity over STD is visualized, which affects the signal-to-noise ratio (SNR). In a previous study, Capitain et al. demonstrated that for higher IMS cell temperatures, this term increased and, therefore, the SNR decreases. For SNR, further the peak height is relevant, which was already observed lower at IMS cell temperatures of 160 °C and above. Due to the significantly lower RIP height and fewer proton water clusters, this is also expected in the focus IMS prototype. However, not only the temperature affects the mean over STD, but also an increase in drift gas flow did show an increase in mean background intensity over STD. Further, increased drift gas flows are affecting the flow equilibrium between sample and drift gas and cause a dilution or washout effect of the analytes.
Figure 3.
Effect of drift gas flow on RIP height (a), RIP position (b), mean background intensity (c) and mean background intensity over STD (d) dependent on drift tube temperature.
Figure 3.
Effect of drift gas flow on RIP height (a), RIP position (b), mean background intensity (c) and mean background intensity over STD (d) dependent on drift tube temperature.
3.2. Data Evaluation of the Experiments for High Temperature Focus IMS
As shown in previous experiments, the influence of IMS cell temperature and drift gas flow depends on substance group, boiling point and the type of formed proton adducts [10]. Within the next section, the impact of drift tube temperatures between 80 - 160 °C and different drift gas flows in a range of 100 - 200 mL/min to the peak shape of terpenes and other flavor compounds were evaluated. As the selected substances are common in complex matrices, such as essential oils or essence oils, the quality parameters of peak height, FWHM and tailing factor were evaluated.
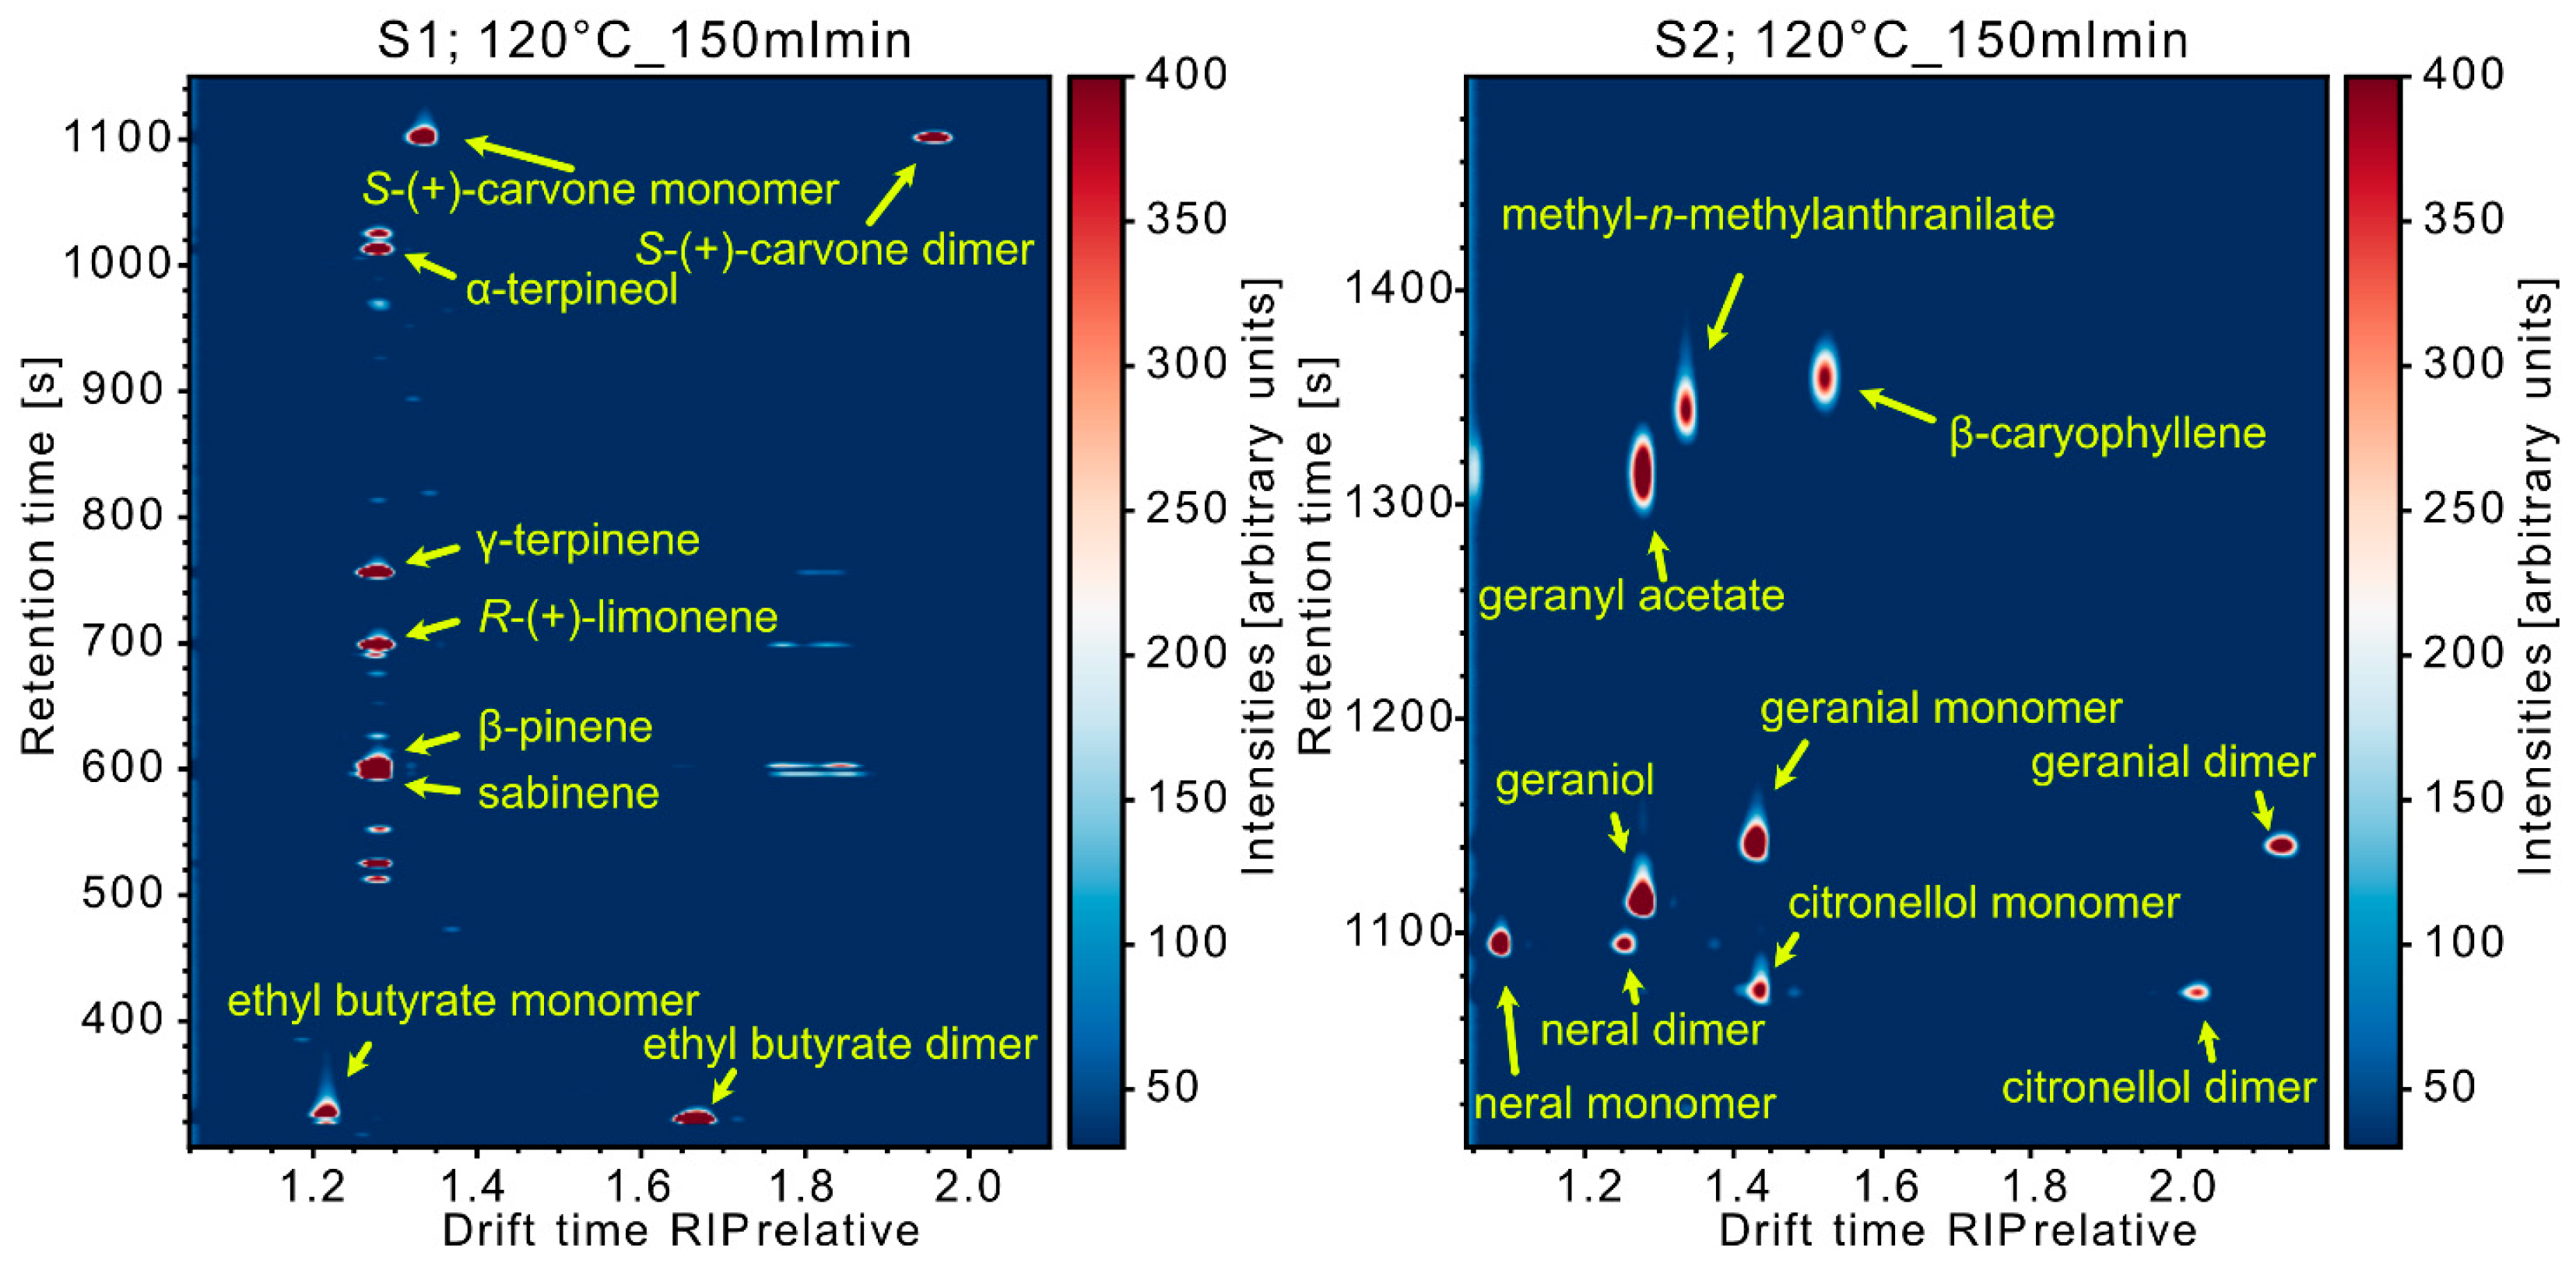
While it was already shown that higher IMS cell temperatures have a beneficial effect on peak tailing and peak width for alcohols, ketones and other different contact allergens in the work of Capitain et al., this effect was also observed for all investigated flavor compounds [10]. However, the focus drift gas flow resulted in distinct reduced tailing factors by a factor of 2-3, even at lower temperatures of 80 °C and 100 °C in comparison to the classic DTIMS flow design. Comparing to other studies of HS-GC-IMS with terpenes and flavor compounds, peak shape is improved and all analytes indicated acceptable peak shapes even for (S)-(+)-carvone, citronellol, geraniol or the sesquiterpene β-caryophyllene, as visualized in Figure 4 [6,8,10].
Figure 4.
GC-IMS spectrum of standard 1 and 2 at 120° C IMS cell temperature and 150 ml/min drift gas flow.
Figure 4.
GC-IMS spectrum of standard 1 and 2 at 120° C IMS cell temperature and 150 ml/min drift gas flow.
The peak shape of geraniol is particularly important for analytics in fields of fragrance and cosmetics, because the substance is listed as an allergenic compound in cosmetic products together with (R)-(+)-limonene and citral. Since July 2023, this list was further updated with pinene, terpineol, β-caryophyllene, geranyl acetate and carvone, as well as several other substances and peel oils of different Citrus fruits [26]. Every cosmetic product containing one of the listed substances must comply with the restrictions after 31st July 2026 for the new placement on the European market and after 31st July 2028 for existing products. Thus, reliable analytical procedures have gained importance for the 45 added compounds. With an improved peak shape, analytics of terpenes, terpenoids and other fragrance allergens in complex cosmetic matrices are substantially simplified through HS-GC-IMS approaches, which do not demand for time consuming sample pre-treatment steps and an energy consuming vacuum system, such as GC-MS.
Within the following paragraphs the already mentioned peak quality parameters of the evaluated substances are displayed and discussed. For enhanced readability, 7 of the 13 analytes are visualized exemplarily, while all other graphs have been included in the supplementary data. In Figure 5, the impact of the drift gas flow to the FWHM and tailing factor on the peaks of (R)-(+)-limonene, the quantitatively predominate volatile compound of Citrus peel oils, and γ-terpinene, which represents about nine percent of the volatile fraction of cold pressed lemon oil, at five different drift tube temperatures are visualized [28]. The peak heights of the monoterpenes (R)-(+)-limonene and γ-terpinene were observed increased at higher temperatures. While an improved peak height was visible from 80 °C to 140 °C, there was no further improvement from 140 °C to 160 °C. This effect is most likely explainable due to adsorption effects at rather low drift tube temperatures, leading towards peak tailing and higher FWHM values at low drift tube temperatures. FWHM decreased with an increasing drift gas flow, as well as with higher temperatures. However, the standard deviations for both compounds at 80 °C and 160 °C were higher than for the temperatures in between. The tailing factor of (R)-(+)-limonene and γ-terpinene did not indicate a substantial effect of IMS cell temperature and drift gas flow rates. A good peak symmetry for (R)-(+)-Limonene was observed at all drift tube temperatures and drift gas flows, within a range of 0.90 to 1.10. However, tailing factors were observed slightly higher at increased temperatures, as well as higher drift gas flow rates.
Figure 5.
Effect of drift gas flow and drift tube temperature on peak height (a and d), FWHM (b and e) and tailing factor (c and f) of (R)-(+)-limonene and γ-terpinene.
Figure 5.
Effect of drift gas flow and drift tube temperature on peak height (a and d), FWHM (b and e) and tailing factor (c and f) of (R)-(+)-limonene and γ-terpinene.
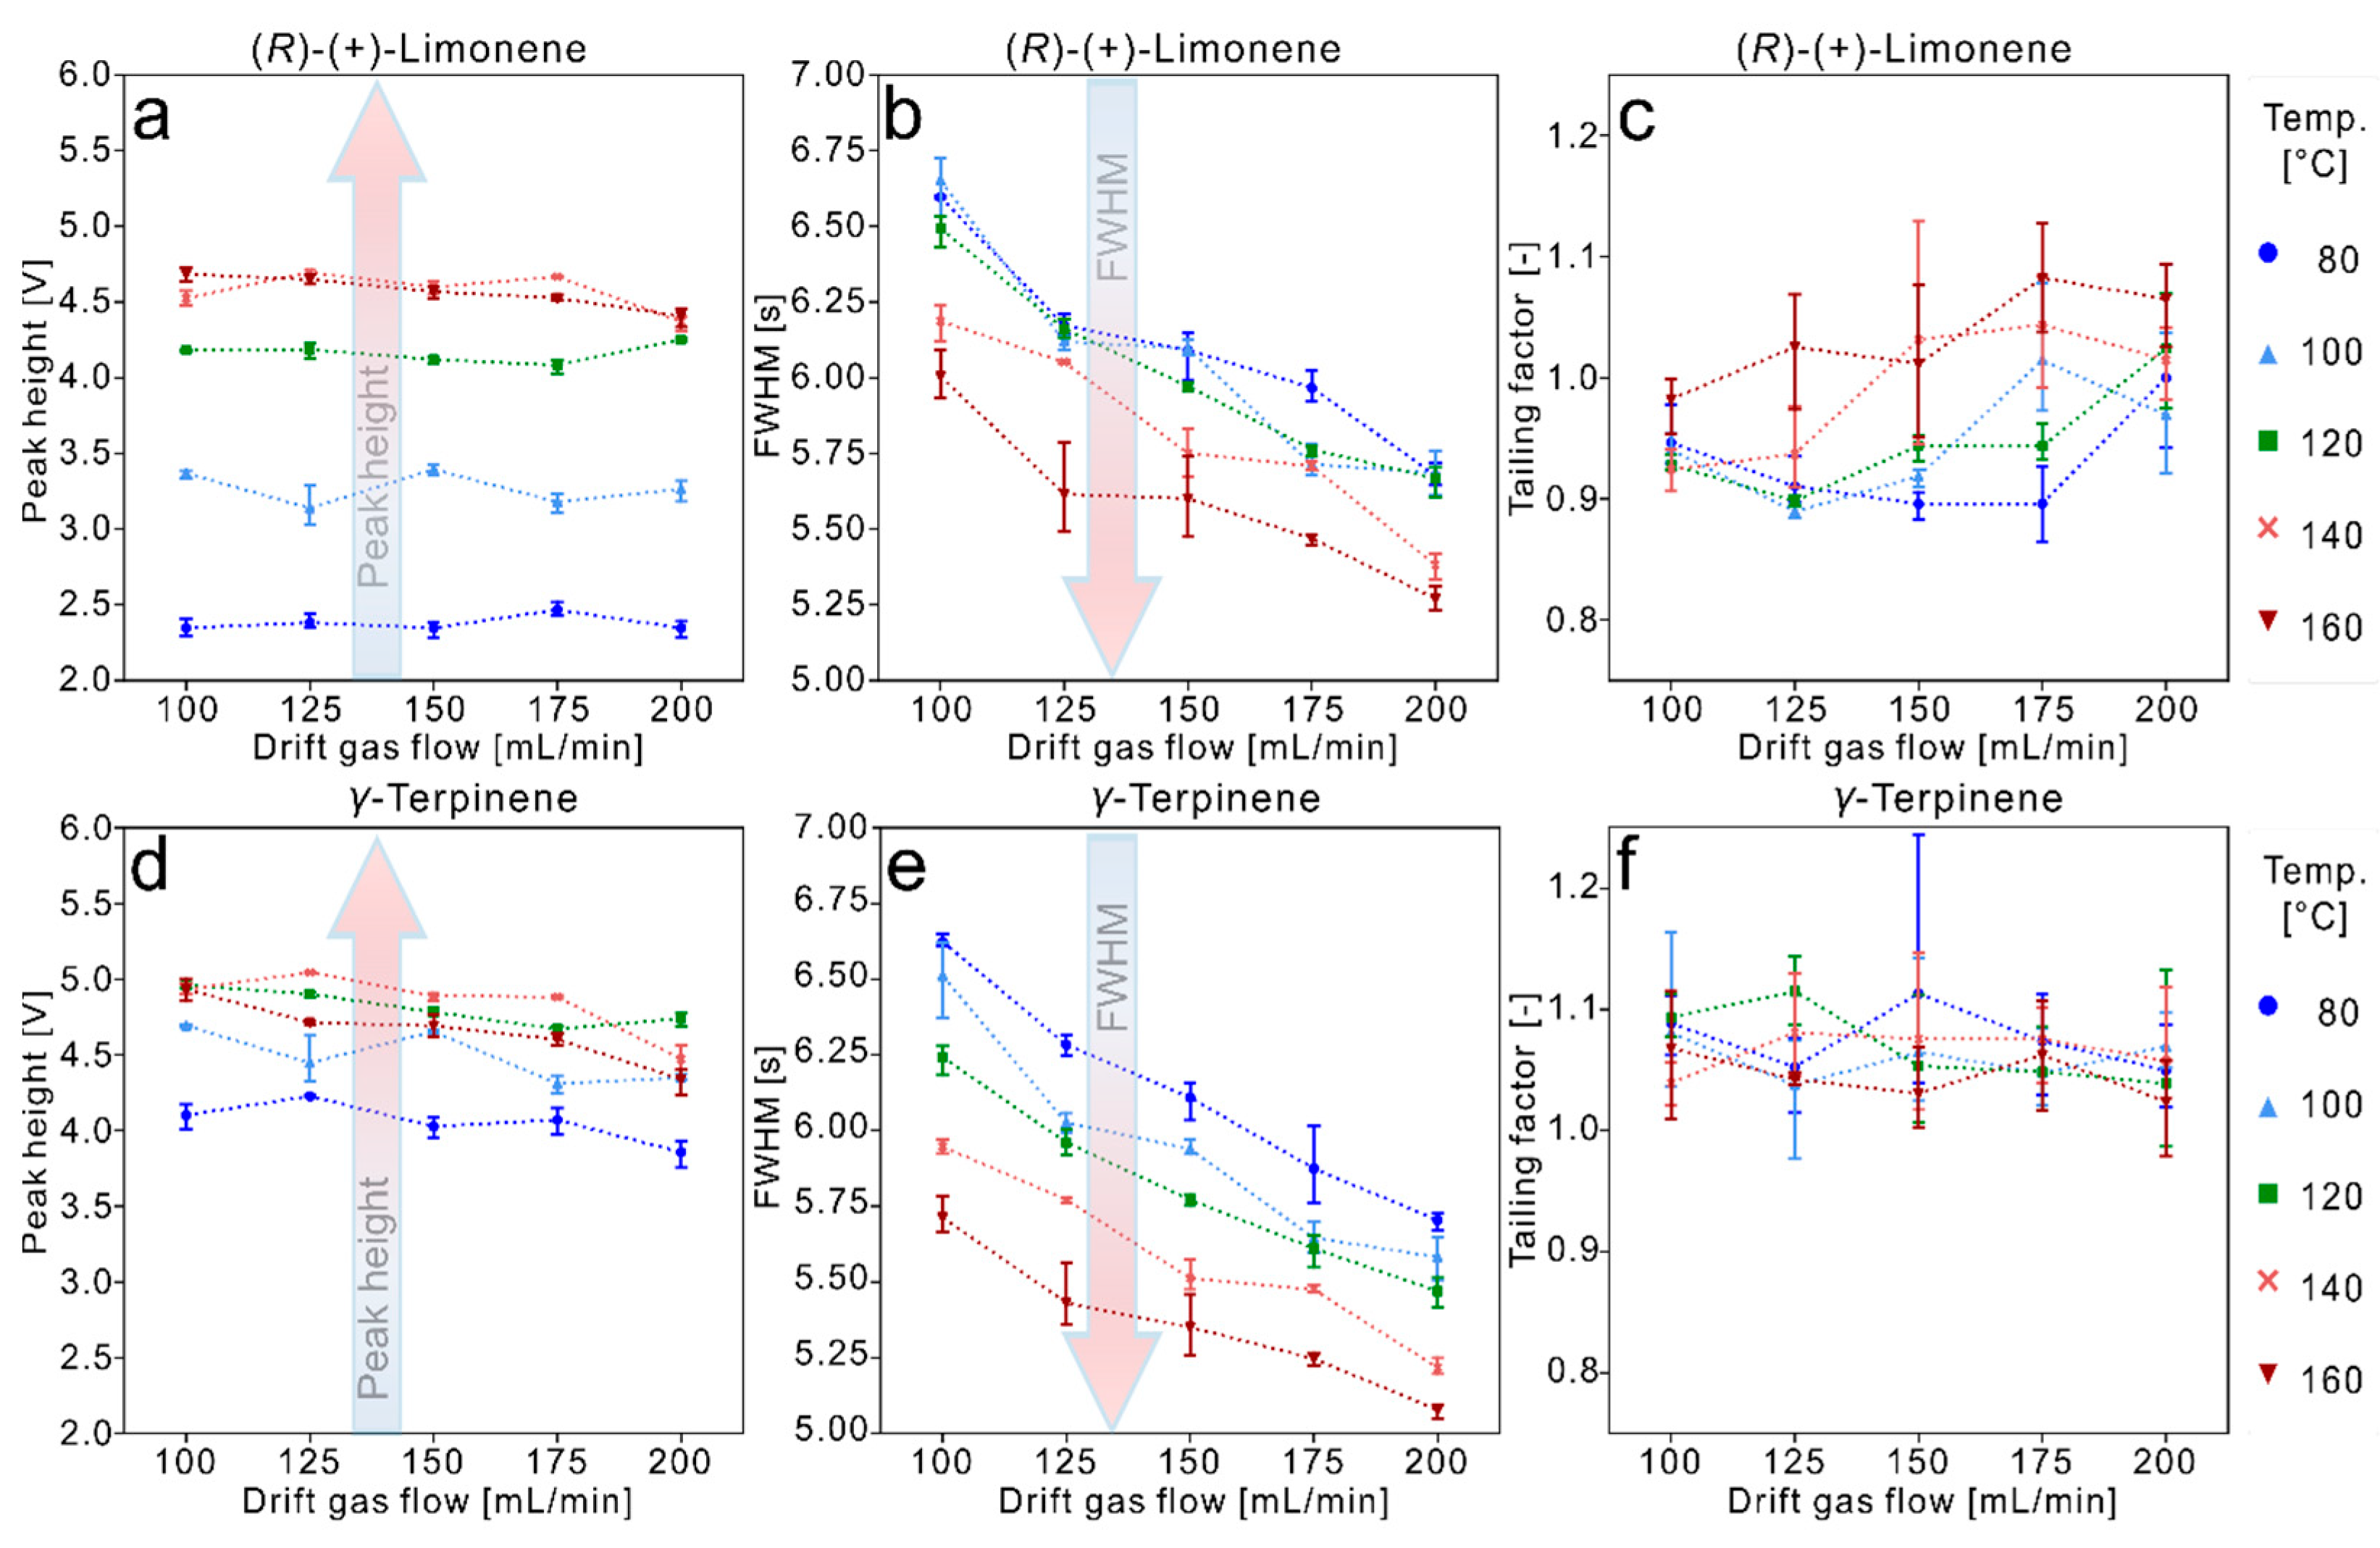
For γ-terpinene, the tailing factor also indicated a symmetric peak shape with values between 1.0 and 1.15 (Figure 5f). The tailing factor is marginally decreasing with higher IMS cell temperatures and higher drift gas flow rates. Similar effects were observed for the monoterpenes sabinene and β-pinene, with an improved peak height up to an IMS cell temperature of 140 °C. The FWHM of β-pinene decreased notably for higher drift tube temperatures and an increasing drift gas flow, while the FWHM of the sabinene peak only featured a decrease at temperatures of 140 °C and 160 °C and higher drift gas flows of 175 mL/min and 200 mL/min (Figure S1b,e). However, the signal of β-pinene exhibited a slight peak fronting with a tailing factor of below 0.9.
For ethyl butyrate monomer and dimer, a decreased peak height at higher temperatures was visible and was observed minimal at 160 °C (Figure S2a,d). In contrast to terpenes, ethyl butyrate is a smaller molecule with a boiling point of 120 - 121 °C, while the boiling points of (R)-(+)-limonene and γ-terpinene range around 180 °C. Thus, adsorption effects are less likely to have a distinct influence in peak height of ethyl butyrate monomer and dimer. Peak height was particularly affected with the significantly decreased RIP height and less proton water clusters at higher drift tube temperatures, resulting in less intense peaks. FWHM of the peaks, was observed smaller at higher temperatures for both signals (Figure S2b,e). Further, there was a decrease in FWHM at higher drift gas flows, but the effect of temperature to FWHM was more perceivable. An increase of the drift tube temperature to 160 °C at a drift gas flow of 150 mL/min led to a FWHM of 4.40 ± 0.08 s for the monomer and 5.34 ± 0.12 s for the dimer, in comparison to a FWHM of 8.83 ± 0.08 s and 6.58 ± 0.02 s at a temperature of 80 °C. The tailing factors of ethyl butyrate monomer and dimer decreased with higher drift tube temperatures, as well as with higher drift gas flows, resulting in more symmetric peaks (Figure S2c,f).
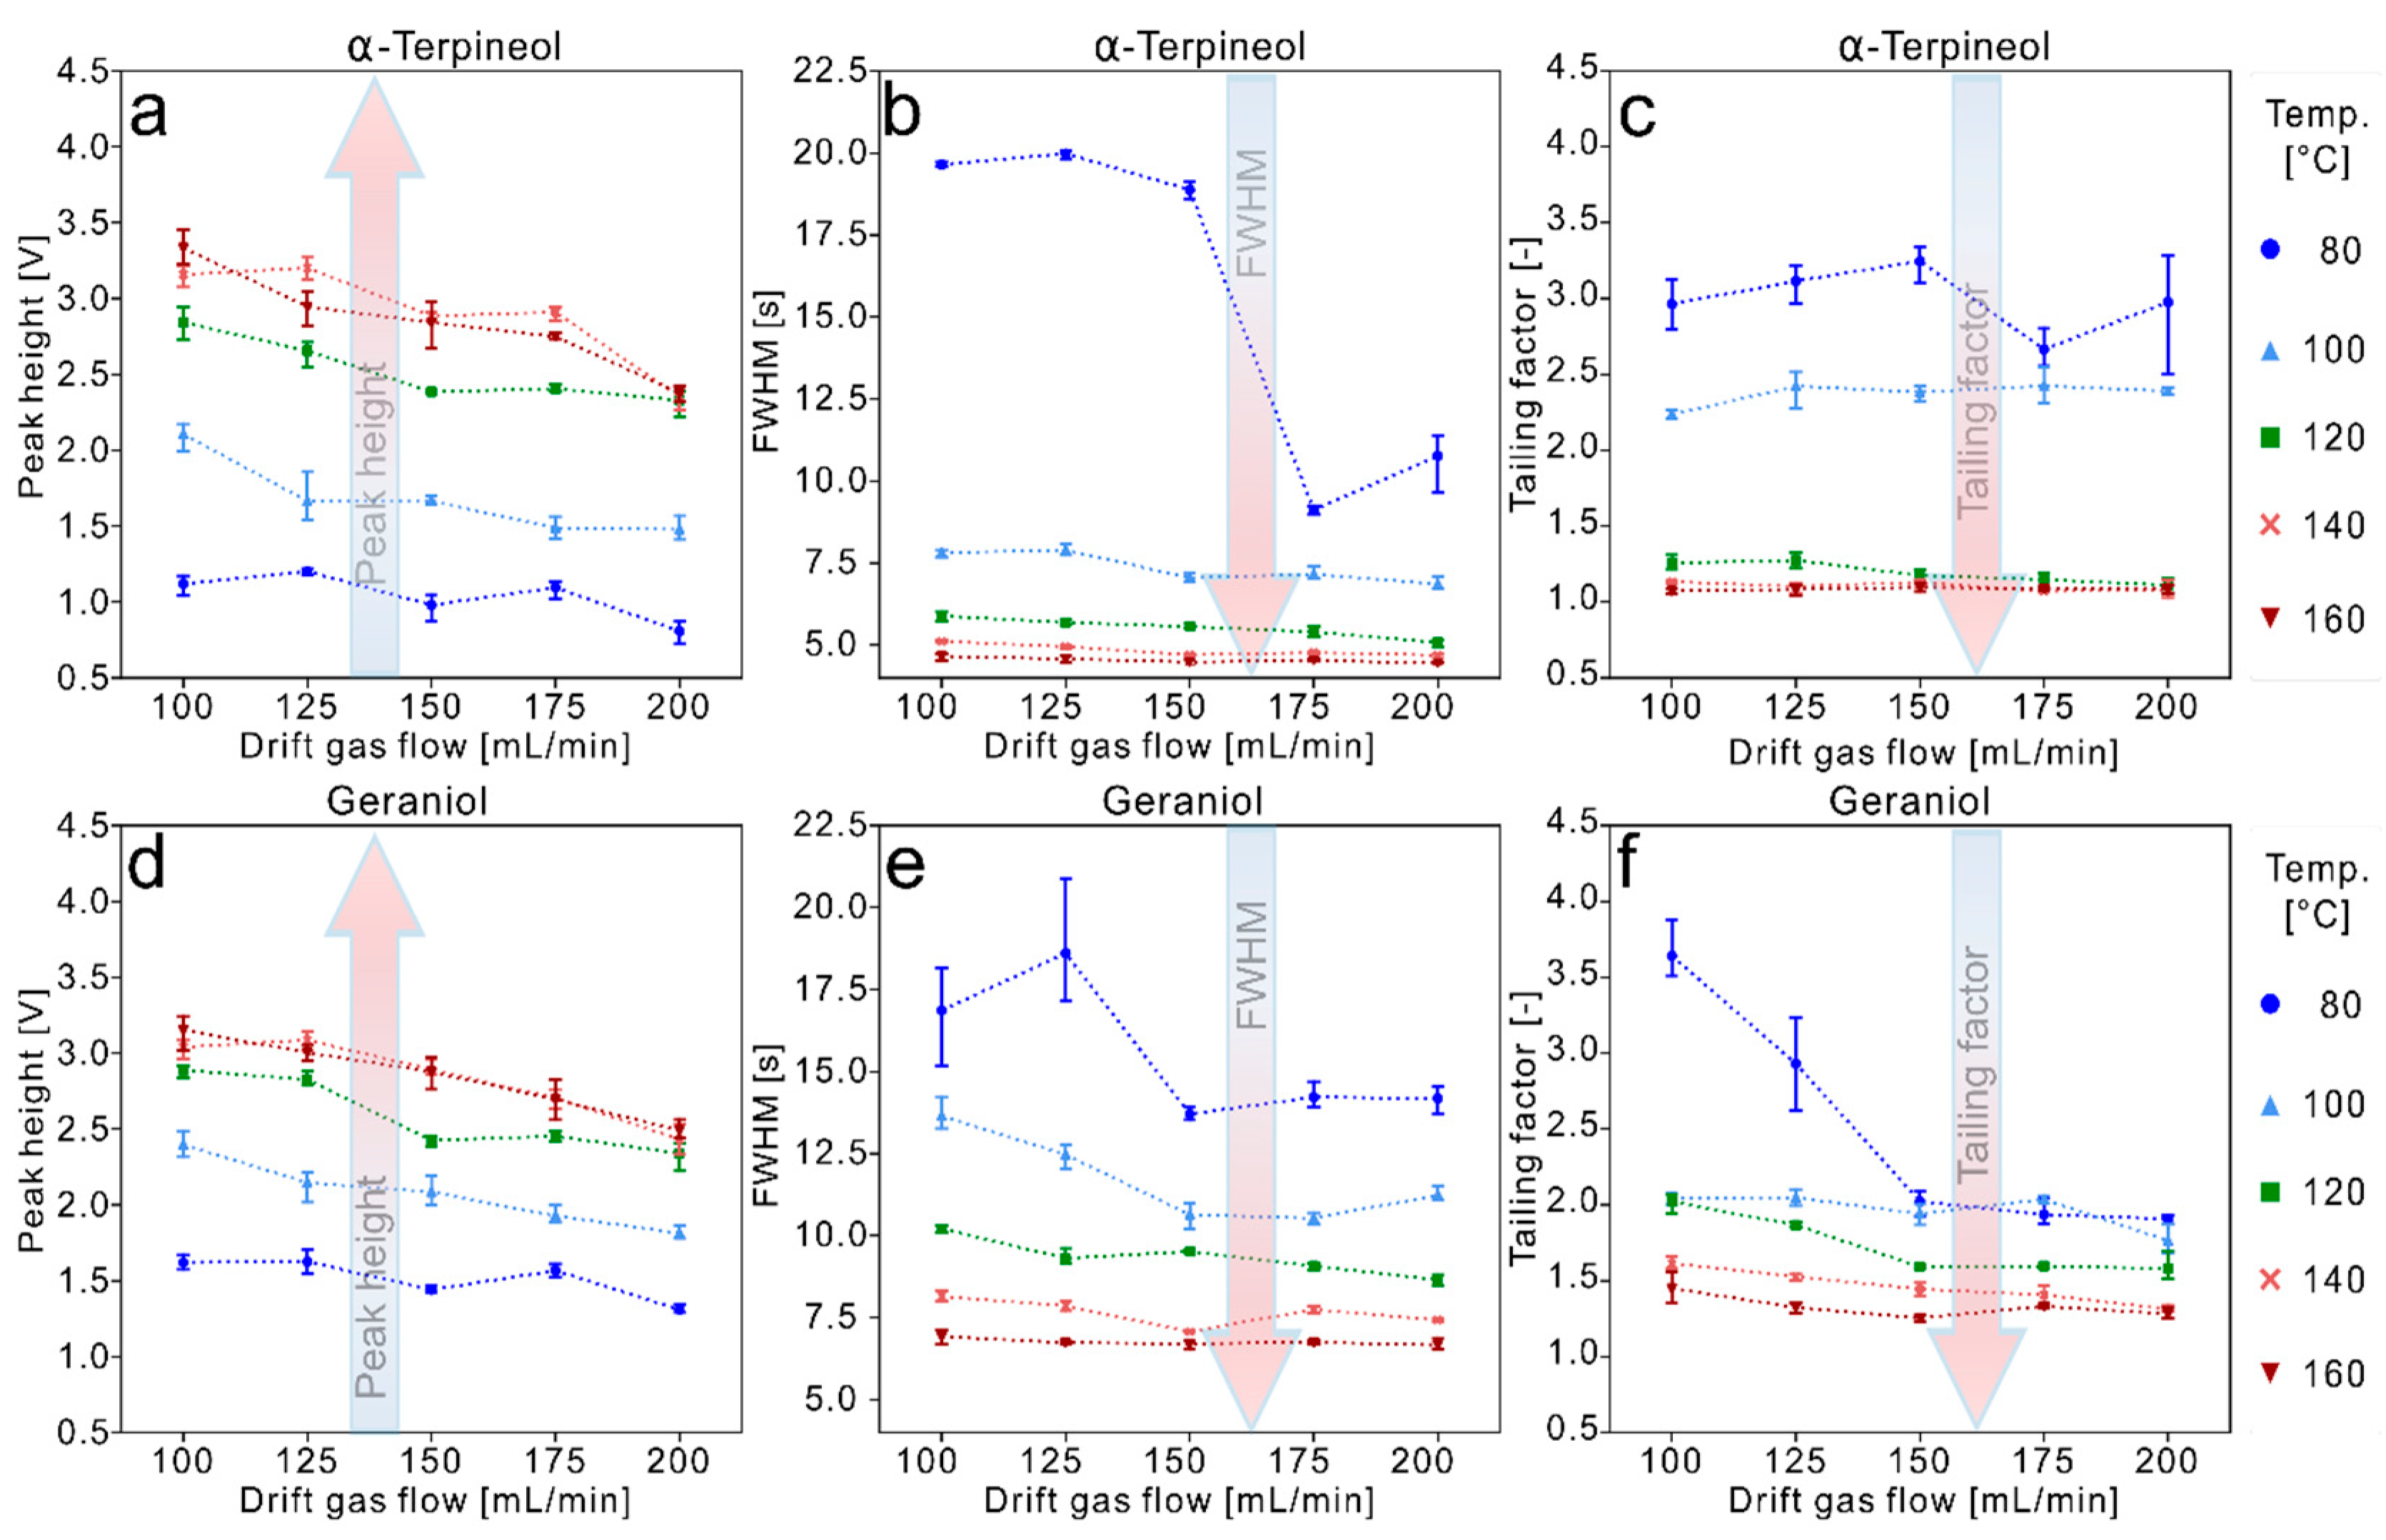
In Figure 6, peak height, FWHM and tailing factors of the monoterpene alcohol α-terpineol and the monoterpene allyl alcohol geraniol are displayed. For those similar trends were observable, with an increased peak height at high drift tube temperatures. However, there was a decrease in peak height observable with higher drift gas flow rates, presumably due to dilution effects.
While FWHM of geraniol at 80 °C was in a range of 13 - 19 s at the evaluated drift gas flows, FWHM at 160 °C was in a range of approximately 6.5 - 7 s. For α-terpineol, at 80°C the FWHM was approximately 20 s and an increase in temperature to 100 °C was already reducing the FWHM by more than a factor of 2 (Figure 6b,e). Drift gas flow only affected the FWHM at 175 mL/min and 200 mL/min at 80 °C drift tube temperature. Peak symmetry of both substances was particular dependent on the temperature. While the tailing factor of geraniol did show a decrease from 3.5 to 2.0 with an increased drift gas flow at 80 °C, this effect was not observable at α-terpineol. There, the Tailing factor was near to 3.0 at 80 °C and 2.4 at 100 °C, respectively. Further, drift tube temperatures of 120 °C or even higher featured a beneficial effect on peak symmetry. Tailing factors of geraniol at 140 °C and 160 °C were close to 1.5 and for α-terpineol, tailing factors at a drift tube temperature of 140 °C and 160 °C were decreased, by a factor of two, to less than 1.2, in comparison to a drift tube temperature of 100 °C at all drift gas flow rates.
Figure 6.
Effect of drift gas flow and drift tube temperature on peak height (a and d), FWHM (b and e) and tailing factor (c and f) of α-terpineol and geraniol.
Figure 6.
Effect of drift gas flow and drift tube temperature on peak height (a and d), FWHM (b and e) and tailing factor (c and f) of α-terpineol and geraniol.
Citral, the mixture of the isomers geranial and neral featured similar results: for both substances, the monomer and dimer were evaluated. While the neral monomer and dimer showed an increase in peak height up to a temperature of 160 °C, the geranial monomer and dimer signals increased up to a temperature of 140 °C, but showed a moderate decrease at a temperature of 160 °C (Figure S3a,d). The FWHM of the geranial monomer peak decreased by a factor of 3.5 with an increase in drift tube temperature of 80 °C to 140 °C and 160 °C. Further, a higher drift gas flow indicated a positive effect regarding FWHM, limited to a drift tube temperature of 80 °C. FWHM of the geranial dimer did show comparable effects, but is reduced by a factor of two. For the tailing factors of the geranial monomer and dimer, a decent peak symmetry was observed at drift tube temperatures of 120 °C and above (Figure S3c,f). In comparison to the peak tailing at 80 °C, there is a reduction by a factor of three and two, respectively for the monomer and dimer. The dimer indicated a smaller tailing factor with an increased drift gas flow at 80 °C and 100 °C drift tube temperature, while this effect is negligible at higher temperatures. In comparison to the monomer of geranial, FWHM of the neral monomer at 80 °C drift tube temperature is substantially smaller, while the FWHM of the dimer were observed in a similar range (Figure S4b,e). Tailing factors of neral monomer featured a decrease with higher drift gas flows of 175 mL/min and 200 mL/min at 80 °C. Again, a significant impact of drift tube temperature to peak symmetry was observable for the neral monomer and dimer. This effect was previously described by Capitain et al. for citral, citronellol, and geraniol [10]. However, the focus drift gas flow architecture depicted a beneficial impact on peak symmetry, in comparison to previous studies. There for instance, the peak shape of geranial monomer indicated a severe tailing [8,10]. In the previous evaluation of an high temperature drift tube IMS, tailing factors of neral dimer were observed distinct above 15.0 and in range of 7.5 for the monomer, at 80 °C and a drift gas flow of 150 mL/min [10]. These values were observed significantly reduced with the focus flow design to 3.10 ± 0.25 for the neral dimer and 2.73 ± 0.11 for the neral monomer, resulting in a reduction by a factor of five and three, respectively. At a drift tube temperature of 160 °C and a drift gas flow of 200 mL/min, the dimer of neral was not detected, supposedly to dilution effects of the higher drift gas flow and the increased background noise, as already described in the previous sections. The peak height of citronellol monomer and dimer did show a maximum at 120 °C drift tube temperature. For the monomer, at 140 °C and 160 °C, peak height is not significantly below the heights at 120 °C, however, the citronellol dimer featured a substantial decrease in peak height with temperatures above 120 °C (Figure S5a,d). The corresponding spectra indicated a different behavior of citronellol at temperatures above 120 °C, with forming a monomer and only a very small dimer. Similar effects were already observed for the dimer of cinnamal in previous research [10]. While there is an explicit description of the dependency of analyte concentration on monomer and dimer formation in a number of studies, the influence of high temperatures for monomer and dimer formation were not part of research yet and should be evaluated in further studies [8,20]. The monomer and dimer of citronellol displayed a considerably lower FWHM at higher temperatures in the IMS drift tube, while the impact of the drift gas flow was limited (Figure S5b,e). The tailing factors are decreased substantially at higher IMS cell temperatures, similar to geraniol. Further, tailing factor indicated that low drift tube temperatures, 80 - 100 °C, featured a higher standard deviation of the tailing factors for citronellol monomer peaks, while higher drift gas flows, 175 mL/min and 200 mL/min, led to increased standard deviations of tailing factors for the dimer peak (Figure S5c,f). For (S)-(+)-carvone monomer and dimer, peak height is maximum at 120 °C and 140 °C drift tube temperature and indicates a decrease at 160 °C, similar to the data of geranial. The monomer did show an FWHM at 80 °C and 150 mL/min is 27.64 ± 1.76 s, and a tailing factor of 2.89 ± 0.33. These values were decreased significantly at a drift tube temperature of 160 °C and drift gas flow of 150 mL/min to 6.97 ± 0.17 and 1.03 ± 0.06, respectively. For the dimer peak this is also observable. However, there is no significant optimization of FWHM and tailing factor with a further increase of temperature from 140 °C to 160 °C (Figure S6b,c,e,f). The peak height and peak shape quality parameters of the late eluting compounds geranyl acetate, methyl-n-methylanthranilate and β-caryophyllene are visualized in Figure 7. Peak height is increased for all displayed analytes with higher temperatures, while the difference between 140 °C and 160 °C was again observed only minimal. Further there is a decrease in peak height with an increase in drift gas flow for all of the late eluting compounds.
Figure 7.
Effect of drift gas flow and drift tube temperature on peak height (a, d and g), FWHM (b, e and h) and tailing factor (c, f and i) of Geranyl acetate, methyl-n-methylanthranilate and β-Caryophyllene.
Figure 7.
Effect of drift gas flow and drift tube temperature on peak height (a, d and g), FWHM (b, e and h) and tailing factor (c, f and i) of Geranyl acetate, methyl-n-methylanthranilate and β-Caryophyllene.
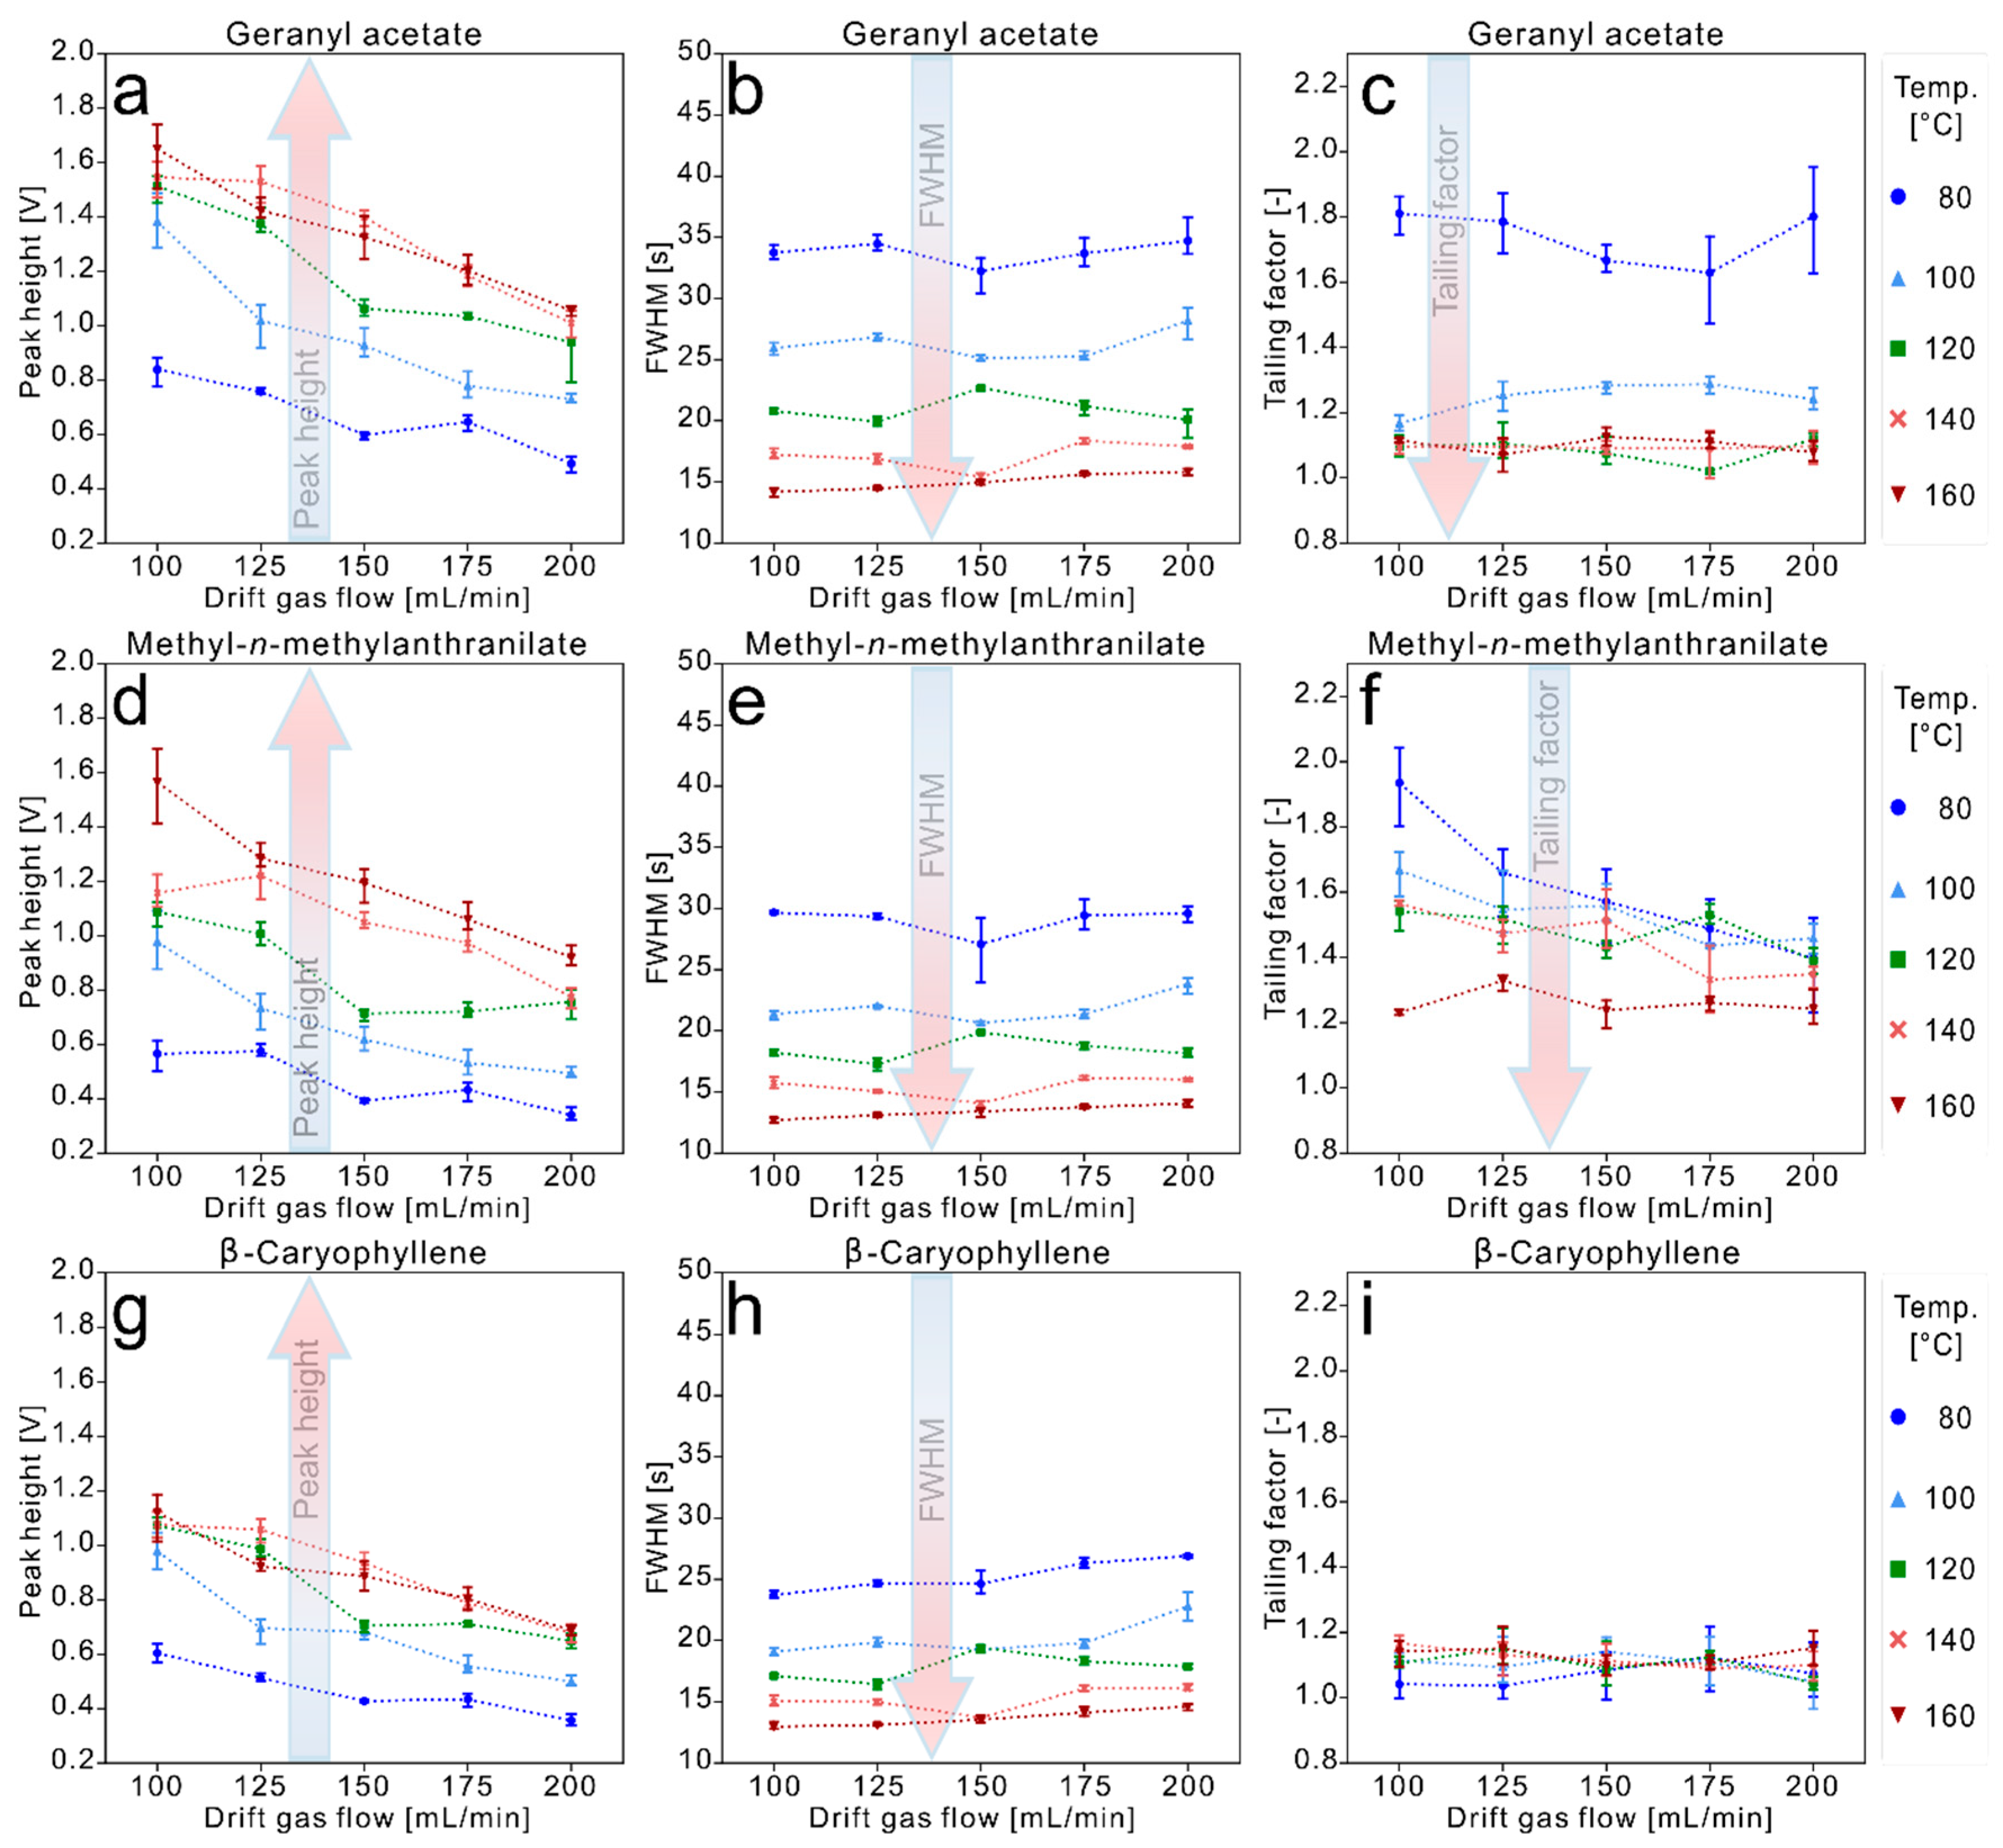
The sesquiterpene β-caryophyllene did feature an improved FWHM at higher temperatures, Figure 7h. While FWHM at 80 °C is in range of 25 s, an increase in drift tube temperature to 120 °C already led to a decreased FWHM between 15 s and 20 s, for all the experimental drift gas settings. Drift tube temperature of 140 °C again led to similar results, regarding FWHM, such as a drift tube temperature of 160 °C. FWHM of geranyl acetate and methyl-n-methylanthranilate featured a similar decrease by more than a factor of two, with an increase in drift tube temperature to 140 °C (Figure 7b,e). However, for these high-boiling VOC, a small increase of FWHM at higher drift gas flows was observed. While the tailing factors of geranyl acetate and β-caryophyllene were not affected by the drift gas flow, a decrease in tailing factor was observed for methyl-n-methylanthranilate with an increased drift gas flow, Figure 7c,f,i. Even though the peak shape of these compounds featured comparatively large FWHM, prior studies show peaks with a length of approximately 100 s for β-caryophyllene and methyl-n-methylanthranilate [6,9]. Thus, there is a significant improvement regarding peak shape due to the focus flow design in combination with a high-temperature drift tube.
Complex signal patterns, such as found in Citrus peel or essence oils require optimization of DTIMS systems. The broad spectrum of eluting compounds, including alcohols, esters, ketones as well as terpenes, terpenoids and sesquiterpenes, demands for optimal separation and peak shape for substances with a boiling point range of approximately 80 °C up to 260 °C.
In Figure 8, the complexity of an exemplary grapefruit essence oil GC-IMS spectrum is visualized, at settings of 150 mL/min drift gas flow and a cell temperature of 140 °C. The spectrum features well-separated, narrow and symmetric peaks even for high-boiling VOC, such as the sesquiterpenes. This is in particular beneficial for the analysis of highly complex samples such as the aforementioned Citrus peel and essence oils, but also for cosmetics, complex food and beverages.
Figure 8.
GC-IMS spectrum of a pink grapefruit essence oil at 140 °C and 150 mL/min.

4. Conclusions
The presented results demonstrate that the peak shape quality of selected flavor compounds is substantially improved by the focus drift gas flow architecture and higher IMS drift tube temperatures. Peak shape and peak tailing are remarkably reduced in comparison to other experiments with common DTIMS. Especially at drift tube temperatures of 80 °C and 100 °C, tailing factors and FWHM values are reduced by a factor > 2. The positive effects are observable for all chemical compounds from esters to monoterpenes, monoterpene alcohols and sesquiterpenes. Thus, measurements of complex flavor samples can be optimized, as peak tailing and consequently, interference of analytes are reduced. The influence of the temperature for peak shape of terpenes is more prominent than the drift gas flow, however, at typical IMS cell temperatures of 80 °C and 100 °C, an increased drift gas flow to 175 mL/min or 200 mL/min resulted in a slight improvement in peak shape for most of the flavor compounds. An increase of drift tube temperature from 140 - 160 °C featured only a neglectable improvement. For most of the investigated VOC, an IMS cell adjustable up to 140 °C, in combination with the focus flow technique at 150 mL/min drift gas flow can improve peak symmetry and FWHM already significantly. In conjunction with the system-immanent soft ionization and the higher temperature range of up to 180°C, the prototypic focus high-temperature IMS widens the analytical scope to higher boiling terpenoids and even sesquiterpenes without the so far dominating tailing effects. Overall, the approach allows for a more detailed analysis of cosmetics, flavorings, food products and quality control of terpenes and terpenoids using HS-GC-IMS.
Supplementary Materials
The following supporting information can be downloaded at the website of this paper posted on Preprints.org.
Author Contributions
Lukas Bodenbender: Writing - Original draft, Data curation, Visualization, Formal Analysis, Conceptualization, Sascha Rohn: Writing - Review & Editing, Supervision. Philipp Weller: Writing - Review & Editing, Funding Acquisition, Supervision, Conceptualization
Acknowledgements
This research work was financially supported within the project “DeepAuthent” (FKZ: 13FH138KX0) by the Federal Ministry of Education and Research (BMBF), Berlin, Germany. The authors further thank Gesellschaft für Analytische Sensorsysteme (G.A.S) mbH, Dortmund, Germany, for providing the prototypic high-temperature focus ion mobility spectrometer.
Notes
The authors declare no competing financial interest or personal relationships that could have appeared to influence the work reported in this paper.
References
- Parastar, H.; Weller, P. Towards greener volatilomics: Is GC-IMS the new Swiss army knife of gas phase analysis? TrAC Trends in Analytical Chemistry 2024, 170, 117438. [Google Scholar] [CrossRef]
- Gerhardt, N.; Birkenmeier, M.; Schwolow, S.; Rohn, S.; Weller, P. Volatile-Compound Fingerprinting by Headspace-Gas-Chromatography Ion-Mobility Spectrometry (HS-GC-IMS) as a Benchtop Alternative to 1H NMR Profiling for Assessment of the Authenticity of Honey. Anal. Chem. 2018, 90, 1777–1785. [Google Scholar] [CrossRef] [PubMed]
- Gerhardt, N.; Schwolow, S.; Rohn, S.; Pérez-Cacho, P.R.; Galán-Soldevilla, H.; Arce, L.; Weller, P. Quality assessment of olive oils based on temperature-ramped HS-GC-IMS and sensory evaluation: Comparison of different processing approaches by LDA, kNN, and SVM. Food Chem. 2019, 278, 720–728. [Google Scholar] [CrossRef]
- Brendel, R.; Schwolow, S.; Rohn, S.; Weller, P. Volatilomic Profiling of Citrus Juices by Dual-Detection HS-GC-MS-IMS and Machine Learning-An Alternative Authentication Approach. J. Agric. Food Chem. 2021, 69, 1727–1738. [Google Scholar] [CrossRef]
- Garrido-Delgado, R.; Del Dobao-Prieto, M.M.; Arce, L.; Valcárcel, M. Determination of volatile compounds by GC-IMS to assign the quality of virgin olive oil. Food Chem. 2015, 187, 572–579. [Google Scholar] [CrossRef]
- Rodríguez-Maecker, R.; Vyhmeister, E.; Meisen, S.; Rosales Martinez, A.; Kuklya, A.; Telgheder, U. Identification of terpenes and essential oils by means of static headspace gas chromatography-ion mobility spectrometry. Anal. Bioanal. Chem. 2017, 409, 6595–6603. [Google Scholar] [CrossRef]
- Schanzmann, H.; Augustini, A.L.R.M.; Sanders, D.; Dahlheimer, M.; Wigger, M.; Zech, P.-M.; Sielemann, S. Differentiation of Monofloral Honey Using Volatile Organic Compounds by HS-GCxIMS. Molecules 2022, 27. [Google Scholar] [CrossRef]
- Brendel, R.; Schwolow, S.; Rohn, S.; Weller, P. Comparison of PLSR, MCR-ALS and Kernel-PLSR for the quantification of allergenic fragrance compounds in complex cosmetic products based on nonlinear 2D GC-IMS data. Chemometrics and Intelligent Laboratory Systems 2020, 205, 104128. [Google Scholar] [CrossRef]
- Lv, W.; Lin, T.; Ren, Z.; Jiang, Y.; Zhang, J.; Bi, F.; Gu, L.; Hou, H.; He, J. Rapid discrimination of Citrus reticulata 'Chachi' by headspace-gas chromatography-ion mobility spectrometry fingerprints combined with principal component analysis. Food Res. Int. 2020, 131, 108985. [Google Scholar] [CrossRef]
- Capitain, C.C.; Zischka, M.; Sirkeci, C.; Weller, P. Evaluation of IMS drift tube temperature on the peak shape of high boiling fragrance compounds towards allergen detection in complex cosmetic products and essential oils. Talanta 2023, 257, 124397. [Google Scholar] [CrossRef]
- Breitmaier, E. Terpenes: Flavors, fragrances, pharmaca, pheromones, 1. Reprint; Wiley-VCH: Weinheim, 2008; ISBN 9783527317868. [Google Scholar]
- Schrader, J.; Bohlmann, J. Biotechnology of Isoprenoids; Springer International Publishing: Cham, 2015; ISBN 978-3-319-20106-1. [Google Scholar]
- Borsdorf, H.; Eiceman, G.A. Ion Mobility Spectrometry: Principles and Applications. Applied Spectroscopy Reviews 2006, 41, 323–375. [Google Scholar] [CrossRef]
- Borsdorf, H.; Rudolph, M. Gas-phase ion mobility studies of constitutional isomeric hydrocarbons using different ionization techniques. International Journal of Mass Spectrometry 2001, 208, 67–72. [Google Scholar] [CrossRef]
- Leonhardt, J.W. New detectors in environmental monitoring using tritium sources. Journal of Radioanalytical and Nuclear Chemistry, Articles 1996, 206, 333–339. [Google Scholar] [CrossRef]
- COUNCIL DIRECTIVE 2013/59/EURATOM of 5 December 2013 laying down basic safety standards for protection against the dangers arising from exposure to ionising radiation .
- Garrido-Delgado, R.; Dobao-Prieto, M.M.; Arce, L.; Aguilar, J.; Cumplido, J.L.; Valcárcel, M. Ion mobility spectrometry versus classical physico-chemical analysis for assessing the shelf life of extra virgin olive oil according to container type and storage conditions. J. Agric. Food Chem. 2015, 63, 2179–2188. [Google Scholar] [CrossRef] [PubMed]
- Eiceman, G.A.; Nazarov, E.G.; Rodriguez, J.E.; Berglof, J.F. Positive reactant ion chemistry for analytical, high temperature ion mobility spectrometry (IMS): Effects of electric field of the drift tube and moisture, temperature, and flow of the drift gas. International Journal for Ion Mobility Spectrometry 1998, 1, 28–37. [Google Scholar]
- Ewing, R.G.; Eiceman, G.A.; Stone, J.A. Proton-bound cluster ions in ion mobility spectrometry. International Journal of Mass Spectrometry 1999, 193, 57–68. [Google Scholar] [CrossRef]
- Pomareda, V.; Guamán, A.V.; Mohammadnejad, M.; Calvo, D.; Pardo, A.; Marco, S. Multivariate curve resolution of nonlinear ion mobility spectra followed by multivariate nonlinear calibration for quantitative prediction. Chemometrics and Intelligent Laboratory Systems 2012, 118, 219–229. [Google Scholar] [CrossRef]
- Morton, D.W.; Young, C.L. Analysis of Peak Profiles Using Statistical Moments. Journal of Chromatographic Science 1995, 33, 514–524. [Google Scholar] [CrossRef]
- Grushka, E. Characterization of exponentially modified Gaussian peaks in chromatography. Anal. Chem. 1972, 44, 1733–1738. [Google Scholar] [CrossRef]
- Kalambet, Y. Data acquisition and integration. In Gas chromatography, 2nd ed.; Poole, C.F., Ed.; Elsevier: Amsterdam, Netherlands, 2021; pp. 505–524; ISBN 9780128206751. [Google Scholar]
- Kalambet, Y.; Kozmin, Y.; Mikhailova, K.; Nagaev, I.; Tikhonov, P. Reconstruction of chromatographic peaks using the exponentially modified Gaussian function. J. Chemometrics 2011, 25, 352–356. [Google Scholar] [CrossRef]
- Pápai, Z.; Pap, T.L. Analysis of peak asymmetry in chromatography. Journal of Chromatography A 2002, 953, 31–38. [Google Scholar] [CrossRef] [PubMed]
- Commission Regulation (EU) 2023/1545 of 26 July 2023 amending Regulation (EC) No 1223/2009 of the European Parliament and of the Council as regards labelling of fragrance allergens in cosmetic products: Commission Regulation (EU) 2023/1545, 2023.
- European Parliament and the council of the European Union, Regulation (EC) No 1223/2009 of the European Parliament and of the Council of 30 November 2009 on Cosmetic Products: Regulation (EC) No 1123/2009 .
- Wang, Y.; Wang, S.; Fabroni, S.; Feng, S.; Rapisarda, P.; Rouseff, R. Chemistry of citrus flavor. In The genus citrus; Talon, M., Caruso, M., Gmitter, F.G., Eds.; United Kingdom; Woodhead publishing, an imprint of Elsevier: Duxford, 2020; pp. 447–470; ISBN 9780128121634. [Google Scholar]
- Rouseff, R.L.; Ruiz Perez-Cacho, P.; Jabalpurwala, F. Historical review of citrus flavor research during the past 100 years. J. Agric. Food Chem. 2009, 57, 8115–8124. [Google Scholar] [CrossRef] [PubMed]
- Berk, Z. Production of citrus juice concentrates. Citrus Fruit Processing; Elsevier, 2016; pp 187–217, ISBN 9780128031339.
- Wolford, R.W.; Kesterson, J.W.; Attaway, J.A. Physicochemical properties of citrus essential oils from Florida. J. Agric. Food Chem. 1971, 19, 1097–1105. [Google Scholar] [CrossRef]
- Dugo, P.; Bonaccorsi, I.; Ragonese, C.; Russo, M.; Donato, P.; Santi, L.; Mondello, L. Analytical characterization of mandarin (Citrus deliciosa Ten.) essential oil. Flavour & Fragrance J 2011, 26, 34–46. [Google Scholar] [CrossRef]
- Nitschke, A.; Hitzemann, M.; Winkelholz, J.; Kirk, A.T.; Lippmann, M.; Thoben, C.; Wittwer, J.A.; Zimmermann, S. A hyper-fast gas chromatograph coupled to an ion mobility spectrometer with high repetition rate and flow-optimized ion source to resolve the short chromatographic peaks. J. Chromatogr. A 2024, 1736, 465376. [Google Scholar] [CrossRef]
- Harris, C.R.; Millman, K.J.; van der Walt, S.J.; Gommers, R.; Virtanen, P.; Cournapeau, D.; Wieser, E.; Taylor, J.; Berg, S.; Smith, N.J.; et al. Array programming with NumPy. Nature 2020, 585, 357–362. [Google Scholar] [CrossRef]
- Virtanen, P.; Gommers, R.; Oliphant, T.E.; Haberland, M.; Reddy, T.; Cournapeau, D.; Burovski, E.; Peterson, P.; Weckesser, W.; Bright, J.; et al. SciPy 1.0: fundamental algorithms for scientific computing in Python. Nat. Methods 2020, 17, 261–272. [Google Scholar] [CrossRef]
Disclaimer/Publisher’s Note: The statements, opinions and data contained in all publications are solely those of the individual author(s) and contributor(s) and not of MDPI and/or the editor(s). MDPI and/or the editor(s) disclaim responsibility for any injury to people or property resulting from any ideas, methods, instructions or products referred to in the content. |
© 2025 by the authors. Licensee MDPI, Basel, Switzerland. This article is an open access article distributed under the terms and conditions of the Creative Commons Attribution (CC BY) license (https://creativecommons.org/licenses/by/4.0/).
Copyright: This open access article is published under a Creative Commons CC BY 4.0 license, which permit the free download, distribution, and reuse, provided that the author and preprint are cited in any reuse.


