
Submitted:
03 February 2025
Posted:
04 February 2025
You are already at the latest version
Abstract
Vibrio natriegens is widely used as a production host for biotechnological processes due to its superior maximum glucose consumption rate, high growth rate, and abundant ribosomes. Most bioprocesses also need a scalable biomass separation step. This can be achieved by cross-flow filtration with ceramic membranes, although the membrane pores are susceptible to fouling. However, the fouling characteristics of V. natriegens culture broth have not been investigated in detail. We therefore characterized membrane fouling during the separation of V. natriegens biomass from culture broth using a cross-flow filtration plant with ceramic membranes. The resistance in series model was used to quantify fouling-induced resistance caused by the different components of the culture broth. The total fouling resistance was 4.1·109 ± 0.6·109 m-1 for the culture broth and 5.4·109 ± 0.7·109 m-1 for the summed broth components. Reversible resistance accounted for 86% and 81% of these totals, respectively. We then applied Hermia’s adapted filtration laws to determine the dominant fouling mechanism induced by the different broth components. In a further step, we established a setup to determine the compressibility index of the cells during cross-flow filtration, resulting in an estimated value of 0.55 ± 0.04. These results will facilitate the design of economic filtration plants and will help to establish V. natriegens as a production host for large-scale industrial processes.
Keywords:
Fouling
; Vibrio natriegens
; Compressibility Index
; Resistance in Series Model
; Hermia´s Laws
; Ceramic Membranes
; Ultrafiltration
; CFF
1. Introduction
Vibrio natriegens is a rod-shaped, halophilic, Gram-negative marine bacterium with an approximate size of 3.5 × 0.3 µm [1,2]. Its superior maximum glucose consumption rate and high growth rate make it useful for many biotechnological applications, which are facilitated by its compatibility with plasmid systems originally developed for Escherichia coli [3,4,5,6]. Accordingly, V. natriegens has been developed as an expression host for the production of recombinant peptides and proteins, and has also been used to develop a cell-free expression system and functional nanoparticles [7,8,9,10,11,12,13,14,15]. Owing to the high salt tolerance, V. natriegens can be cultivated under a non-sterile condition, and therefore, decreasing the operating costs for sterilization for large-scale industrial processes. As a promising chassis in synthetic biology, V. natriegens is able to secrete organic alcohols, acids heterologous proteins as products into the extracellular space. Like other cell-based expression systems, it is necessary to separate the V. natriegens biomass from the culture broth at the beginning of downstream processing. This can be achieved by cross-flow filtration with ceramic membranes, but the fouling characteristics of the culture broth have not been investigated in detail, and this is the starting point for process optimization.
Ceramic membranes are widely used for the filtration of organic process streams in the food and feed, pulp and paper, and bulk chemical industries, as well as in the biotechnology sector for the purification of proteins [16,17,18,19,20,21,22]. The advantages of ceramic membranes include their resistance to harsh conditions such as extreme pH and temperatures, as well as chemical cleaning agents. This means they can be regenerated frequently, which is beneficial because membrane fouling is a major limitation to the efficiency of filtration processes. Other advantages include their high resistance to abrasive media, their longevity, and their high flux per unit area, which combine to make them more attractive from an economic perspective [23,24,25]. Owing to the high chemical stability, ceramic membranes are suitable to separate V. natriegens with the products from a high-salt containing medium. However, this hypertonic environment may change the surface interaction between biological particles and membrane materials, and cause a severe fouling, which changes the separation efficiency and selectivity. Therefore, we systematically analyzed the fouling mechanism during the filtration of V. natriegens in a hypertonic solution with ceramic membranes.
The flux through a membrane depends on the driving force, the total resistance, and the permeate viscosity. The driving force during filtrations with porous membrane is the transmembrane pressure. The total resistance is composed of the membrane resistance and the fouling resistance. The membrane resistance can be calculated using 1, which is based on Darcy’s law [26,27]. The membrane resistance is equal to the total resistance when the permeate is pure water passing through a clean membrane.
where Rm is the membrane resistance, RT is the total resistance, ∆p is the transmembrane pressure, µ is the dynamic viscosity, and J is the filtrate flux.
During filtration, a filter cake builds up on the retentate side of the membrane and the total resistance is therefore the sum of the membrane resistance and cake resistance. In this case, the flux can be calculated using 2 [28].
Where α is the specific cake resistance and w is the weight of cake per filtration area. The specific cake resistance is calculated using 3, a rearrangement of 2.
We can differentiate between the true specific cake resistance and the apparent specific cake resistance, the latter shown in 3. The true specific cake resistance is calculated by replacing Rm with Rmi in 3, resulting in 4 [26]. Several approaches have been described to determinate the cake mass. In addition to weighing the entire membrane or the mechanically removed cake, it is also possible to remove the membrane and digest the cake to deduce the cake mass from the amount of protein released [29,30,31]. Another approach, which makes it possible to determine the cake mass without removing the membrane, is to measure the biomass in the feed and calculate the cake mass as the difference before and after filtration [26].
To understand Rmi, it is necessary to know that the resistances that lead to membrane fouling can be divided into those reflecting reversible and irreversible fouling. Reversible fouling is the portion of fouling that can be removed by mechanical cleaning, which can involve procedures such as backwashing, gas scouring, and relaxation, whereas irreversible fouling cannot be removed. The irreversible fouling resistance of a membrane is determined by passing water through a mechanically-cleaned membrane. The value is then calculated using 1, but replacing Rm with Rmi. The reversible fouling resistance Rrf is the difference between the total resistance of the fouled membrane minus the resistance of the cleaned membrane and the irreversible fouling resistance Rif, resulting in Rmi and leading to 5 [25,27,32,33]. The distinction between reversible and irreversible fouling allows us to assign specific fouling mechanisms to each of the resistances. Irreversible resistance is caused by the fouling mechanisms of complete blocking, standard blocking and in part by intermediate blocking, whereas reversible resistance is caused by cake deposition combined with intermediate blocking (Figure 1).
In addition to the aforementioned definitions, another definition of reversible fouling includes all fouling that can be removed mechanically and chemically, whereas irreversible fouling includes fouling that cannot be removed by these means [34,35]. These alternative definitions are not used in the current article.
𝑅𝑇=𝑅𝑚+𝑅𝑖𝑓+𝑅𝑟𝑓
With increasing transmembrane pressure, the specific cake resistance increases too. This can be mathematically expressed using 6, where α´ is a coefficient and n is the compressibility index [28,36,37]. Several factors affect the compressibility index, including cell shape and size, as well as the ionic strength of the feed [28,38,39]. Ellipsoidal cells tend to have lower compressibility indices than rod-shaped cells [28,39].
The rearrangement of 6 gives 7. These equations can be solved for n by measuring α at two different transmembrane pressures (8).
The term ∆p is often used for the transmembrane pressure [28,38,40] but the force driving compression is not transmembrane pressure but the proportion of the pressure that falls on the cake [41]. This proportion depends on the individual resistances of the cake and the membrane, and changes with the membrane resistance if the cake resistance remains constant. For this reason, we prefer to use the pressure drop across the cake to calculate the compressibility index so that it can be considered and compared independently of the membrane [42]. The pressure drops over the cake is calculated using 9.
There are two popular approaches to describe fouling mechanisms. One is the resistance in series model, which distinguishes components in the feed and allocates to each a share of the total resistance. 10 formalizes this approach [43,44]. According to this model, the sum of the fouling resistances of the medium (RME), cells (RC) and byproducts of microbial activity (RP) is equal to the fouling resistance of the fermentation broth.
The other approach distinguishes between the fouling mechanisms of complete blocking, standard blocking, intermediate blocking, and cake deposition. The mathematical description of this model for dead-end filtration is based on 11 [27,45,46]. The mechanisms underlying the different types of fouling (and their reversibility, if appropriate) are summarized in Figure 1.
2. Materials and Methods
2.1. Production of Fermentation Broth
We cultivated V. natriegens Vmax cells (Synthetic Genomics, Calipatria, CA, USA) in 250 mL of the recommended medium [11] in 1-L baffled shake flasks (Schott, Mainz, Germany). The medium was inoculated at an OD600 of 0.03 and cultivated overnight in a Multitron shaking incubator (Infors, Bottmingen, Switzerland) set at 32 °C and 250 rpm.
2.2 Feed Solutions for Filtration with the Ceramic Membrane
The feed solutions tested in the resistance in series model were V. natriegens cells in 3% NaCl, medium, culture supernatant, and culture broth. The medium deviated from the medium used for fermentation by excluding glucose. All feed solutions were adjusted to pH 7.4 ± 0.1 using 1 M NaOH or 1 M HCl. To adjust the OD600 of the culture broth, a portion was centrifuged at 8000 g for 10 min and the culture broth was diluted with the supernatant to an OD600 of 7.4. To prepare the cell solutions in 3% NaCl, 1.4 L of the overnight culture was centrifuged as described above and the pellets were resuspended in 600 mL 3% NaCl and then centrifuged again. The pellets were then resuspended in 3% NaCl and the suspension diluted in 3% NaCl until the OD600 was 7.4 ± 5% (for the fouling models) or 0.95 ± 5% (for the compressibility index experiments). The supernatant was generated by single-step centrifugation of the overnight culture as described above followed by passage through a 0.2-µm bottle-top filter (VWR, Radnor, PA, USA).
2.3. Filtration Plant
The filtrations tested using the resistance in series model and the fits using Hermia’s laws were based on a UF50A membrane (Atech Innovations, Gladbeck, Germany) with a 50-nm cut-off, an inner diameter of 6 mm and an effective length of 23.5 cm. The filtrations for the compressibility index tests were carried out using the same type of membrane, an effective length of 45 cm, an outer diameter of 25.4 cm, and 19 channels each with a diameter of 3.3 mm. The membrane materials and support materials consisted of Al2O3. The construction of the filtration plant is shown in Figure 2. The membrane was inserted into a stainless-steel holder and the feed from the tempered double-jacket reservoir was directed through an SM6000 flow sensor (IFM, Essen, Germany) to the membrane via an FCPA 80B-4/HE rotary vane pump (AFT, Rosstal, Germany). The feed temperature was adjusted by cooling the reservoir using an ECO RE 420 thermostat (Lauda, Lauda-Koenigshofen, Germany). Pressure sensors were located before and behind the membrane. The pressure sensor behind the membrane was adjacent to a ball valve allowing the transmembrane pressure to be adjusted. Behind the ball valve, the feed was recirculated back to the feed reservoir. On the permeate side of the membrane, the permeate was fed into a beaker via a pressure sensor and a downstream ball valve. The beaker was placed on a PFB 3000-2 electrical scale (Kern & Sohn, Balingen-Frommern, Germany) linked to a laptop. The permeate flow was thus recorded by averaging over 10 s using LabVision (HiTec Zang, Herzogenrath, Germany). The permeate in the beaker was emptied back into the permeate reservoir before the mass in the beaker exceeded 10% of the feed mass.
2.4. General Procedure for the Filtration Experiments
Before each filtration experiment, the cleaning solution in the filtration system was replaced with water until the permeate pH became neutral. The membrane resistance was then determined by measuring the permeate flux at five equidistant transmembrane pressures from 0.4 to 2.0 bar, using 1. In the next step, the water was drained and replaced with 3% NaCl. Afterwards, a feed volume of 1200 ± 100 mL was filled into the system and circulated for 10 min under filtration conditions with a closed permeate valve. Filtrations for the resistance in series model were carried out for a minimum of 90 min or until a steady state transmembrane flux was established, whereas filtrations to determine the compressibility index were completed after 20 min. For each filtration testing the resistance in series model, a transmembrane pressure of 0.8 bar was applied, while the temperature was maintained at 25 ± 1 °C. For the single-channel membrane, we used a cross-flow velocity of 3 m·s-1 whereas a higher volumetric flow, equivalent to a flow velocity value of 0.5 m·s-1 was used for the 19-channel membrane. Samples were taken from the permeate and feed to determine the protein concentration using a Bradford assay [11]. After filtration, we evaluated the viscosity of a permeate sample using an MCR102 modular compact rheometer (Anton Paar, Ostfildern-Scharnhausen, Germany). The feed was drained and replaced with at least 1 L of water, which was circulated within the filtration plant at a cross-flow velocity of 4.5 m·s-1 (single-channel membrane) or 0.8 m·s-1 (19-channel membrane) for 15 min with a closed permeate valve. The water was then replaced and the procedure was repeated with an open permeate valve. Having replaced the feed with fresh water again, the resistance of the irreversibly fouled membrane was determined as described above.
2.5. Filtration Experiments to Determine the Compressibility Index
The general procedure described above was followed with the following deviations. After rinsing the cleaning solution, the water was replaced with 3% NaCl. The cross-flow velocity was set to 0.5 m·s-1, and the transmembrane pressure to the value used for subsequent filtration. The feed was circulated in the filtration system with the permeate valve closed using the specified parameters for 10 min before filtration was initiated by opening the permeate valve. To avoid any influence on the biomass concentration in the feed, the permeate flow was only determined at the end of the filtration and otherwise the permeate was returned directly to the feed reservoir. Five filtrations were performed at transmembrane pressures of 0.4–2.0 bar in equidistant steps. A feed sample was taken every minute to determine the OD600. At the end of filtration, the permeate flux was measured three times and the viscosity of a permeate sample was determined as described above.
2.6. Chemical Cleaning for Ceramic Membranes
The membranes were cleaned at the same cross-flow velocities applied during filtration and at a transmembrane pressure of 0.4 bar. The first cleaning solution was 8 g·L-1 Dismozon (Hartmann, Heidenheim, Germany), applied for 1 h. The second cleaning solution was 1% (w/v) citric acid (Carl Roth, Karlsruhe, Germany) applied for 1 h. The last cleaning solution was 1% (w/v) P3 Ultrasil 14 (Ecolab Deutschland, Monheim am Rhein, Germany) applied for 2 h and also used for the subsequent storage of the filtration plant.
2.7. Data Analysis
The resistances of the clean and irreversibly fouled membranes were calculated using 1. The water fluxes of the cleaned membrane were used to calculate the membrane resistance. The total fouling resistance was calculated using the flux of the fouled membrane minus the value generated with the clean membrane. The reversible fouling resistance was the difference between the total fouling resistance and the irreversible resistance. The irreversible fouling resistance was the resistance of the mechanically cleaned membrane minus the resistance of the clean membrane. To compare resistances for the resistance in series model, total fouling resistance values were calculated from the flux 90–95 min after the start of filtration. All fitting was carried out using Origin (Origin Lab, Northampton, MA, USA). The initial value for the compressibility index fit was calculated using 8. The corresponding specific cake resistances were calculated using 6 and 9. The cake mass was calculated using OD600 values. Fouling analysis according to Hermia’s laws was carried out using 12–20.
3. Results
3.1. Resistance in Series Model
The resistance in series model was used to determine the contribution of different components in the culture broth to the fouling resistance. The resistances of the medium, the cell suspension and the culture broth were determined directly via the permeate flows before and after filtration as well as after mechanical cleaning as described in the methods section. The resistances of the microbial byproducts result indirectly from the subtraction of the resistances of the supernatant and the medium. Figure 3 provides an overview of the procedure for collecting the necessary data.
Microbial byproducts accounted for the largest share of the total resistance (48%), followed by the cells (47%) and the medium (5%). The sum of these individual resistances was compared to the resistance of the culture broth, and the same comparison was carried out for the reversible and irreversible resistances. For the total resistance and reversible resistance, the sum of the individual resistances overlapped with that of the culture broth when taking experimental uncertainty into account, but for the irreversible resistance the sum of individual resistances was higher than that of the culture broth (Figure 1. This can be explained by cell lysis in NaCl during filtration. The reason could be the lower salt concentration compared to the culture medium. The osmolarity in the medium is 1.41 mol/L, the osmolarity of 30 g/L NaCl is lower at 1.03 mol/L. A solution with 9 g/L NaCl has an even lower osmolarity of 0.34 mol/L. All microorganisms, except perhaps halophilic Halobacteria, have a positive turgor. In order to maintain this osmotic pressure, they must adapt the osmolarity of the cell interior to their environment. To this end, bacteria vary the concentration of salts and compatible solutes inside the cell [49]. Vibrionaceae, which include Vibrio natriegens, are able to adapt their osmolarity through the uptake and synthesis of compatible solutes [50]. If the osmolarity in the environment decreases faster than in the cell, the turgor increases, which can lead to a weakening of the cell and disruption [51]. Another possible explanation is the absence of substrates or the combination of both circumstances, considering that the transport of compatible solutes across the cell wall is partly dependent on ATP. The protein concentration in the cell suspension increased between the 30-min and 90-min time points during filtration, while the reverse was observed during the filtration of culture broth (Figure 5). The lysis of V. natriegens observed in preliminary experiments (see supplemental data) led to our hypothesis that cell debris was the cause of the increase in irreversible fouling. The decreasing protein concentration in the culture supernatant may reflect the absorption of proteins onto the membrane and/or depletion of the proteins due to the metabolic activity of V. natriegens. Members of the genus Vibrio are known to secrete metalloproteases and serine proteases [52]. In addition, numerous amino acids are among the substrates that can be utilized by V. natriegens [53]. This may also explain why this continuous degradation did not occur in the cell suspension. Due to the cell separation and subsequent wash step the proteases were separated from the cell suspension. The constant protein concentration during the filtration of the supernatant excludes the first hypothesis, making the second the more likely explanation. The protein concentration in the permeate of the supernatant filtration is lower than in the feed. We assume that this is due to the fact that some of the proteins are retained by the membrane. This conclusion is consistent with the observation that also in the case of the microbial byproducts a part of the fouling resistance is of reversible nature. The initial increase in protein concentration in the culture broth in the period of 5 to 30 min after the start of filtration may be a result of cell lysis caused by the shear forces in the pump. This increase cannot be observed in the cell suspension. This can be attributed to the shear forces during centrifugation of the cells when preparing the cell suspension. As a result, a more shear-sensitive proportion of the bacterial population may have already been lysed before the cell suspension was used in the filtration system.
3.2. Compressibility Index
The compressibility index was calculated using shorter filtration periods to ensure that cell lysis had a negligible impact on the fouling behavior. In preliminary experiments, the OD600 of the feed declined while circulating in the filtration system (data not shown). We assume this was caused by cell lysis during filtration under suboptimal conditions, which increased the degree of irreversible fouling by the cell lysate. This is supported by the increasing protein concentration between the 30-min and 90-min time points (Figure 5). Preliminary experiments revealed that compressibility was affected by the culture age and NaCl concentration (data not shown). Cells were therefore taken from fresh overnight cultures and we set the NaCl concentration to 30 g·L-1 in the feed. The filtration time was also reduced to 20 min, resulting in a smaller proportion of irreversible fouling relative to the total fouling resistance (1–3%). In the longer filtration runs for the other fouling models, the proportion of the irreversible fouling resistance was 29%. The proportion of irreversible fouling in total fouling resistance appears to be variable. A closer examination with the aid of the errors reveals that the irreversible resistance at 1.6 bar cannot be explained by the errors (see supplemental data). We assume that this is an outlier.
The measurement of cell mass in the feed during these experiments ensured that an equilibrium was reached between the mass of the cells in the feed and in the cake on the membrane ~15 min after the start of filtration (Figure 7). Similar findings, in which equilibrium was established within 10–15 min, were reported in another study [26]. The authors also observed continual flux decline after cake formation, which agrees with our observation of irreversible fouling (Figure 6). This was attributed in part to the medium components remaining after the cell wash [26], in agreement with the protein concentrations we measured 5 min after the start of filtration (Figure 5).
The first calculation of the compressibility index based on 8 resulted in a value of 0.56. This was used in 6 to generate the fit curve shown in Figure 8. The compressibility index of the fit curve was 0.55 ± 0.04 and the resistance coefficient was 3.33·1014 ± 0.06·1014 m2·s2·kg-2. This is comparable to the compressibility indices of 0.5–1.7 reported for E. coli, depending on the membrane type and ionic strength [38]. Furthermore, the compressibility indices of rod-shaped Bacillus circulans (n = 1.0), Rhodpseudomonas spheroides (n = 0.88) and E. coli (n = 0.79) were compared with the ellipsoid cells of Saccharomyces cerevisiae (n = 0.45) and Micrococcus glutamicus (n = 0.31) during dead-end filtration [39]. The compressibility index of V. natriegens falls between these two sets of values, perhaps because cross-flow filtration produces a different cake structure based on the oriented stacking of rod-like cells rather than random packing [28]. For n < 1, flux can be increased by increasing pressure, however, the cake resistance increases faster than increasing TMP when n > 1, leading to a critical flux at a certain TMP. Further increasing TMP does not gain more flux. This is critical to the process design and selection of process parameters.
3.3. Application of Hermia’s Laws
The permeate curves of each filtration were fitted using Hermia’s laws for cross-flow filtration (Figure 9) and dead-end filtration (Figure 10). The resulting R2 values are listed in Table 3. The feeds were the culture broth, cell-free supernatant, cells in NaCl, and cultivation medium.
For the culture broth, the calculated R2 values were contradictory. For the fitted formulas, the best model was the standard blocking model (R2 = 0.74) but this was not supported by the appearance of the fit curve. Furthermore, only 14% of the resistance was reversible, which would rule out complete blocking and standard blocking as dominant fouling mechanisms according to Figure 1. The application of Hermia’s non-adapted laws improved the fit for the cake filtration model (R2 = 0.88). This is the highest value we observed and therefore represents the best fitting model.
For the cell suspension, the best fit was the cake filtration model based on the adapted Hermia’s laws (R2 = 0.92) although the non-adapted laws also yielded a high value (R2 = 0.88). This was supported by the appearance of the fit curves. The irreversible portion of fouling (29%) was also consistent with these conclusions.
For the supernatant, the calculated R2 values were again contradictory. The reversible fouling share (89%) excluded standard and complete blocking as dominant fouling mechanisms. Nevertheless, standard blocking resulted in the best fit for the adapted Hermia’s laws (R2 = 0.58) but this was not consistent with the visual appearance of the fit curve. The equation with the best fit using the non-adapted laws was cake filtration (R2 = 0.71).
For the medium, the best fit was cake filtration based on the adapted Hermia’s laws (R2 = 0.88) although the non-adapted laws delivered similar results. This was supported by the visual appearance of the fit curve and the reversible fouling share of 92%. Based on a visual comparison, the adapted formulas therefore provide the more suitable fit in all applications.
5. Conclusions
The results of the resistance in series model were conclusive. The individual resistances of the culture components were comparable to those of the culture broth. The instability of the cells in NaCl is an important finding that must be taken into account for future applications, and should lead to process adaptations (especially shorter filtration times). The method developed to determine the compressibility index during cross-flow filtration is simple and will allow the compressibility index to be determined for other organisms with little effort. We found that the filtration time and feed composition were important parameters that must be investigated to ensure reliable results. The data will be useful to predict the filtration behavior of V. natriegens. However, factors such as a change in overflow velocity could limit the accuracy of such predictions and should be investigated in more detail. The application of Hermia’s laws revealed that there is no dominant fouling mechanism during the filtration of the culture broth. This was anticipated because the culture broth is a complex mixture of cells, proteins and salts. Even the separation of the culture broth into different components did not lead to clear results other than in the case of the cell suspension, where cake filtration was the dominant mechanism. Our data also show that the models have limited applicability when using biological feed streams. Factors such as cell lysis, metabolism, and associated temporal changes in feed composition require more complex models. Nevertheless, we have provided a starting point for the analysis of fouling during the cross-flow filtration of V. natriegens cultures, expanding our knowledge of the specific challenges and potential solutions.
Supplementary Materials
The following supporting information can be downloaded at the website of this paper posted on Preprints.org.
Author Contributions
Conceptualization, Peter Czermak; methodology, Stefan Schwarz, Rong Fan; formal analysis, Stefan Schwarz; investigation, Stefan Schwarz; resources, Peter Czermak, Mehrdad Ebrahimi; writing—original draft preparation, Stefan Schwarz;writing—review and editing, Rong Fan, Mehrdad Ebrahimi, Peter Czermak; visualization, Stefan Schwarz; supervision, Peter Czermak;project administration, Peter Czermak; funding acquisition, Peter Czermak All authors have read and agreed to the published version of the manuscript.”
Funding
This work was financially supported by the Hessian Ministry of Education and Art within the Hessian Initiative for Supporting Economic and Scientific Excellence (LOEWE) in the LOEWE-Research Center "DRUID - Novel Drug Targets against Poverty-Related and Neglected Tropical Infectious Diseases".
Institutional Review Board Statement
Not applicable.
Data Availability Statement
The original contributions presented in the study are included in the article/supplementary material, further inquiries can be directed to the corresponding author/s.
Acknowledgments
We would like to thank Oliver Birrenbach for help with the programming of Labvision, Lisa-Marie Sittek for the friendly introduction to the use of the MCR102 modular compact rheometer and Dr Richard M. Twyman for professional language editing.
Conflicts of Interest
Declare conflicts of interest or state “The authors declare no conflicts of interest.” Authors must identify and declare any personal circumstances or interest that may be perceived as inappropriately influencing the representation or interpretation of reported research results. Any role of the funders in the design of the study; in the collection, analyses or interpretation of data; in the writing of the manuscript; or in the decision to publish the results must be declared in this section. If there is no role, please state “The funders had no role in the design of the study; in the collection, analyses, or interpretation of data; in the writing of the manuscript; or in the decision to publish the results”.
References
- Austin B, Zachary A, Colwell RR. Recognition of Beneckea natriegens (Payne et al.) Baumann et al. as a member of the genus vibrio, as previously proposed by Webb and Payne. Int J Syst Bacteriol 1978;28:315–7. [CrossRef]
- Payne WJ. Studies on bacterial utilization of uronic acids. III. Induction of oxidative enzymes in a marine isolate. J Bacteriol 1958;76:301–7. [CrossRef]
- Eagon RG. Pseudomonas natriegens, a marine bacterium with a generation time of less than 10 minutes. J Bacteriol 1962;83:736–7. [CrossRef]
- Xu J, Dong F, Wu M, Tao R, Yang J, Wu M, et al. Vibrio natriegens as a pET-Compatible Expression Host Complementary to Escherichia coli. Front Microbiol 2021;12:1–11. [CrossRef]
- Maida I, Bosi E, Perrin E, Papaleo MC, Orlandini V, Fondi M, et al. Draft genome sequence of the fast-growing bacterium Vibrio natriegens strain DSMZ 759. Genome Announc 2013;1. [CrossRef]
- Hoffart E, Grenz S, Lange J, Nitschel R, Müller F, Schwentner A, et al. High substrate uptake rates empower Vibrio natriegens as production host for industrial biotechnology. Appl Environ Microbiol 2017;83. [CrossRef]
- Lee HH, Ostrov N, Wong BG, Gold MA, Khalil AS, Church GM. Functional genomics of the rapidly replicating bacterium Vibrio natriegens by CRISPRi. Nat Microbiol 2019;4:1105–13. [CrossRef]
- Weinstock MT, Hesek ED, Wilson CM, Gibson DG. Vibrio natriegens as a fast-growing host for molecular biology. Nat Methods 2016;13:849–51. [CrossRef]
- Becker W, Wimberger F, Zangger K. Vibrio natriegens: An Alternative Expression System for the High-Yield Production of Isotopically Labeled Proteins. Biochemistry 2019;58:2799–803. [CrossRef]
- Eichmann J, Oberpaul M, Weidner T, Gerlach D, Czermak P. Selection of High Producers From Combinatorial Libraries for the Production of Recombinant Proteins in Escherichia coli and Vibrio natriegens. Front Bioeng Biotechnol 2019;7. [CrossRef]
- Schwarz S, Gerlach D, Fan R, Czermak P. GbpA as a secretion and affinity purification tag for an antimicrobial peptide produced in Vibrio natriegens. Electron J Biotechnol 2022;56:75–83. [CrossRef]
- Díaz E, Blázquez ML, Fernández-Llamosas H, Carmona M, Castro L. Speeding up bioproduction of selenium nanoparticles by using Vibrio natriegens as microbial factory. Sci Rep 2017;7:1–9. [CrossRef]
- Schleicher L, Muras V, Claussen B, Pfannstiel J, Blombach B, Dibrov P, et al. Vibrio natriegens as host for expression of multisubunit membrane protein complexes. Front Microbiol 2018;9:1–10. [CrossRef]
- Des Soye BJ, Davidson SR, Weinstock MT, Gibson DG, Jewett MC. Establishing a High-Yielding Cell-Free Protein Synthesis Platform Derived from Vibrio natriegens. ACS Synth Biol 2018;7:2245–55. [CrossRef]
- Stadler KA, Becker W, Darnhofer B, Birner-Gruenberger R, Zangger K. Overexpression of recombinant proteins containing non-canonical amino acids in Vibrio natriegens: p-azido-L-phenylalanine as coupling site for 19F-tags. Amino Acids 2022;54:1041–53. [CrossRef]
- Jørgensen CE, Abrahamsen RK, Rukke EO, Johansen AG, Schüller RB, Skeie SB. Optimization of protein fractionation by skim milk microfiltration: Choice of ceramic membrane pore size and filtration temperature. J Dairy Sci 2016;99:6164–79. [CrossRef]
- Cimini A, Moresi M. Beer Clarification by Novel Ceramic Hollow-Fiber Membranes: Effect of Pore Size on Product Quality. J Food Sci 2016;81:E2521–8. [CrossRef]
- Moreno-García J, García-Martínez T, Mauricio JC, Moreno J. Yeast immobilization systems for alcoholic wine fermentations: Actual trends and future perspectives. Front Microbiol 2018;9. [CrossRef]
- Oppermann T. Mannheimia haemolytica – Bioprocess improvement of leukotoxin production using a fed-batch process and a ceramic membrane based downstream strategy. Peter Czermak, 2018.
- Ebrahimi M, Busse N, Kerker S, Schmitz O, Hilpert M, Czermak P. Treatment of the bleaching effluent from sulfite pulp production by ceramic membrane filtration. Membranes (Basel) 2015;6. [CrossRef]
- Tomczak W, Gryta M. Clarification of 1,3-propanediol fermentation broths by using a ceramic fine UF membrane. Membranes (Basel) 2020;10:1–21. [CrossRef]
- Persson A, Jönsson AS, Zacchi G. Separation of lactic acid-producing bacteria from fermentation broth using a ceramic microfiltration membrane with constant permeate flow. Biotechnol Bioeng 2001;72:269–77. [CrossRef]
- Ebrahimi M, Kerker S, Daume S, Geile M, Ehlen F, Unger I, et al. Innovative ceramic hollow fiber membranes for recycling/reuse of oilfield produced water. Desalin Water Treat 2015;55:3554–67. [CrossRef]
- Hoffmann D, Leber J, Loewe D, Lothert K, Oppermann T, Zitzmann J, et al. Purification of new biologicals using membrane-based processes. Elsevier Inc.; 2018. [CrossRef]
- Influence of Ceramic Membrane Surface Characteristics on the Flux Behavior of a Complex Fermentation Broth 2021.
- McCarthy AA, Walsh PK, Foley G. Experimental techniques for quantifying the cake mass, the cake and membrane resistances and the specific cake resistance during crossflow filtration of microbial suspensions. J Memb Sci 2002;201:31–45. [CrossRef]
- Di Bella G, Di Trapani D. A brief review on the resistance-in-series model in membrane bioreactors (MBRs). Membranes (Basel) 2019;9. [CrossRef]
- Mota M, Teixeira JA, Yelshin A. Influence of cell-shape on the cake resistance in dead-end and cross-flow filtrations. Sep Purif Technol 2002;27:137–44. [CrossRef]
- Riesmeier B, Kroner KH, Kula MR. Studies on secondary layer formation and its characterization during cross-flow filtration of microbial cells. J Memb Sci 1987;34:245–66. [CrossRef]
- Tanaka T, Tsuneyoshi SI, Kitazawa W, Nakanishi K. Characteristics in Crossflow Filtration Using Different Yeast Suspensions. Sep Sci Technol 1997;32:1885–98. [CrossRef]
- Vyas HK, Mawson AJ, Bennett RJ, Marshall AD. A new method for estimating cake height and porosity during crossflow filtration of particulate suspensions. J Memb Sci 2000;176:113–9. [CrossRef]
- Diez V, Ezquerra D, Cabezas JL, García A, Ramos C. A modified method for evaluation of critical flux, fouling rate and in situ determination of resistance and compressibility in MBR under different fouling conditions. J Memb Sci 2014;453:1–11. [CrossRef]
- Gul A, Hruza J, Yalcinkaya F. Fouling and chemical cleaning of microfiltration membranes: A mini-review. Polymers (Basel) 2021;13. [CrossRef]
- Shi X, Tal G, Hankins NP, Gitis V. Fouling and cleaning of ultrafiltration membranes: A review. J Water Process Eng 2014;1:121–38. [CrossRef]
- Slimane FZ, Ellouze F, Amar N Ben. Fouling mechanism and screening of backwash parameters: Seawater ultrafiltration case. Environ Eng Res 2019;24:298–308. [CrossRef]
- Liang J, Yu L, Wu J. The dynamic change of specific cake resistance in membrane bioreactor due to periodical cake relaxation. J Environ Chem Eng 2020;8:103837. [CrossRef]
- Ghaffour N, Qamar A. Membrane fouling quantification by specific cake resistance and flux enhancement using helical cleaners. Sep Purif Technol 2020;239. [CrossRef]
- Fane AG, Fell CJD, Hodgson PH, Leslie G, Marshall K. Microfiltration of biomass and biofluids: Effects of membrane morphology and operating conditions. Filtr Sep 1991;28:332–40. [CrossRef]
- Nakanish K, Tadokoro T, Matsuno R. On the Specific Resistance of Cakes of Microorganisms. Chem Eng Commun 1987;62:187–201. [CrossRef]
- Tanaka T, Abe KI, Asakawa H, Yoshida H, Nakanishi K. Filtration characteristics and structure of cake in crossflow filtration of bacterial suspension. J Ferment Bioeng 1994;78:455–61. [CrossRef]
- Loginov M, Doudiès F, Hengl N, Pignon F, Gésan-Guiziou G. Influence of membrane resistance on swelling and removal of colloidal filter cake after filtration pressure release. J Memb Sci 2020;595. [CrossRef]
- Sørensen BL, Sørensen PB. Structure Compression in Cake Filtration. J Environ Eng 1997;123:345–53. [CrossRef]
- Kujundzic E, Greenberg AR, Fong R, Moore B, Kujundzic D, Hernandez M. Biofouling potential of industrial fermentation broth components during microfiltration. J Memb Sci 2010;349:44–55. [CrossRef]
- Fonseca AC, Summers RS, Greenberg AR, Hernandez MT. Extra-cellular polysaccharides, soluble microbial products, and natural organic matter impact on nanofiltration membranes flux decline. Environ Sci Technol 2007;41:2491–7. [CrossRef]
- Rushton A, editor. Mathematical Models and Design Methods in Solid-Liquid Separation. Dordrecht: Springer Netherlands; 1985. [CrossRef]
- Bowen WR, Calvo JI, Hernández A. Steps of membrane blocking in flux decline during protein microfiltration. J Memb Sci 1995;101:153–65. [CrossRef]
- Burghardt JP, Coletta LA, van der Bolt R, Ebrahimi M, Gerlach D, Czermak P. Development and characterization of an enzyme membrane reactor for fructo-oligosaccharide production. Membranes (Basel) 2019;9. [CrossRef]
- Field RW, Wu D, Howell JA, Gupta BB. Critical flux concept for microfiltration fouling. J Memb Sci 1995;100:259–72. [CrossRef]
- Gunde-Cimerman N, Plemenitaš A, Oren A. Strategies of adaptation of microorganisms of the three domains of life to high salt concentrations. FEMS Microbiol Rev 2018;42:353–75. [CrossRef]
- Gregory GJ, Boyd EF. Stressed out: Bacterial response to high salinity using compatible solute biosynthesis and uptake systems, lessons from Vibrionaceae. Comput Struct Biotechnol J 2021;19:1014–27. [CrossRef]
- Magpusao J, Oey I, Kebede B. Opportunities and Challenges of Algal Protein Extraction and Production. Innov Food Process Technol A Compr Rev 2020:216–33. [CrossRef]
- Liu D, Wu C, Wu R, Huang J, Liao B, Lei M, et al. Comprehensive analysis of the phylogeny and extracellular proteases in genus Vibrio strain. Microb Pathog 2019;131:1–8. [CrossRef]
- Thoma F, Blombach B. Metabolic engineering of Vibrio natriegens. Essays Biochem 2021;65:381–92. [CrossRef]
Figure 1.
Visualization of different fouling mechanisms, adapted from Di Bella and Di Trapani (2019).
Figure 1.
Visualization of different fouling mechanisms, adapted from Di Bella and Di Trapani (2019).
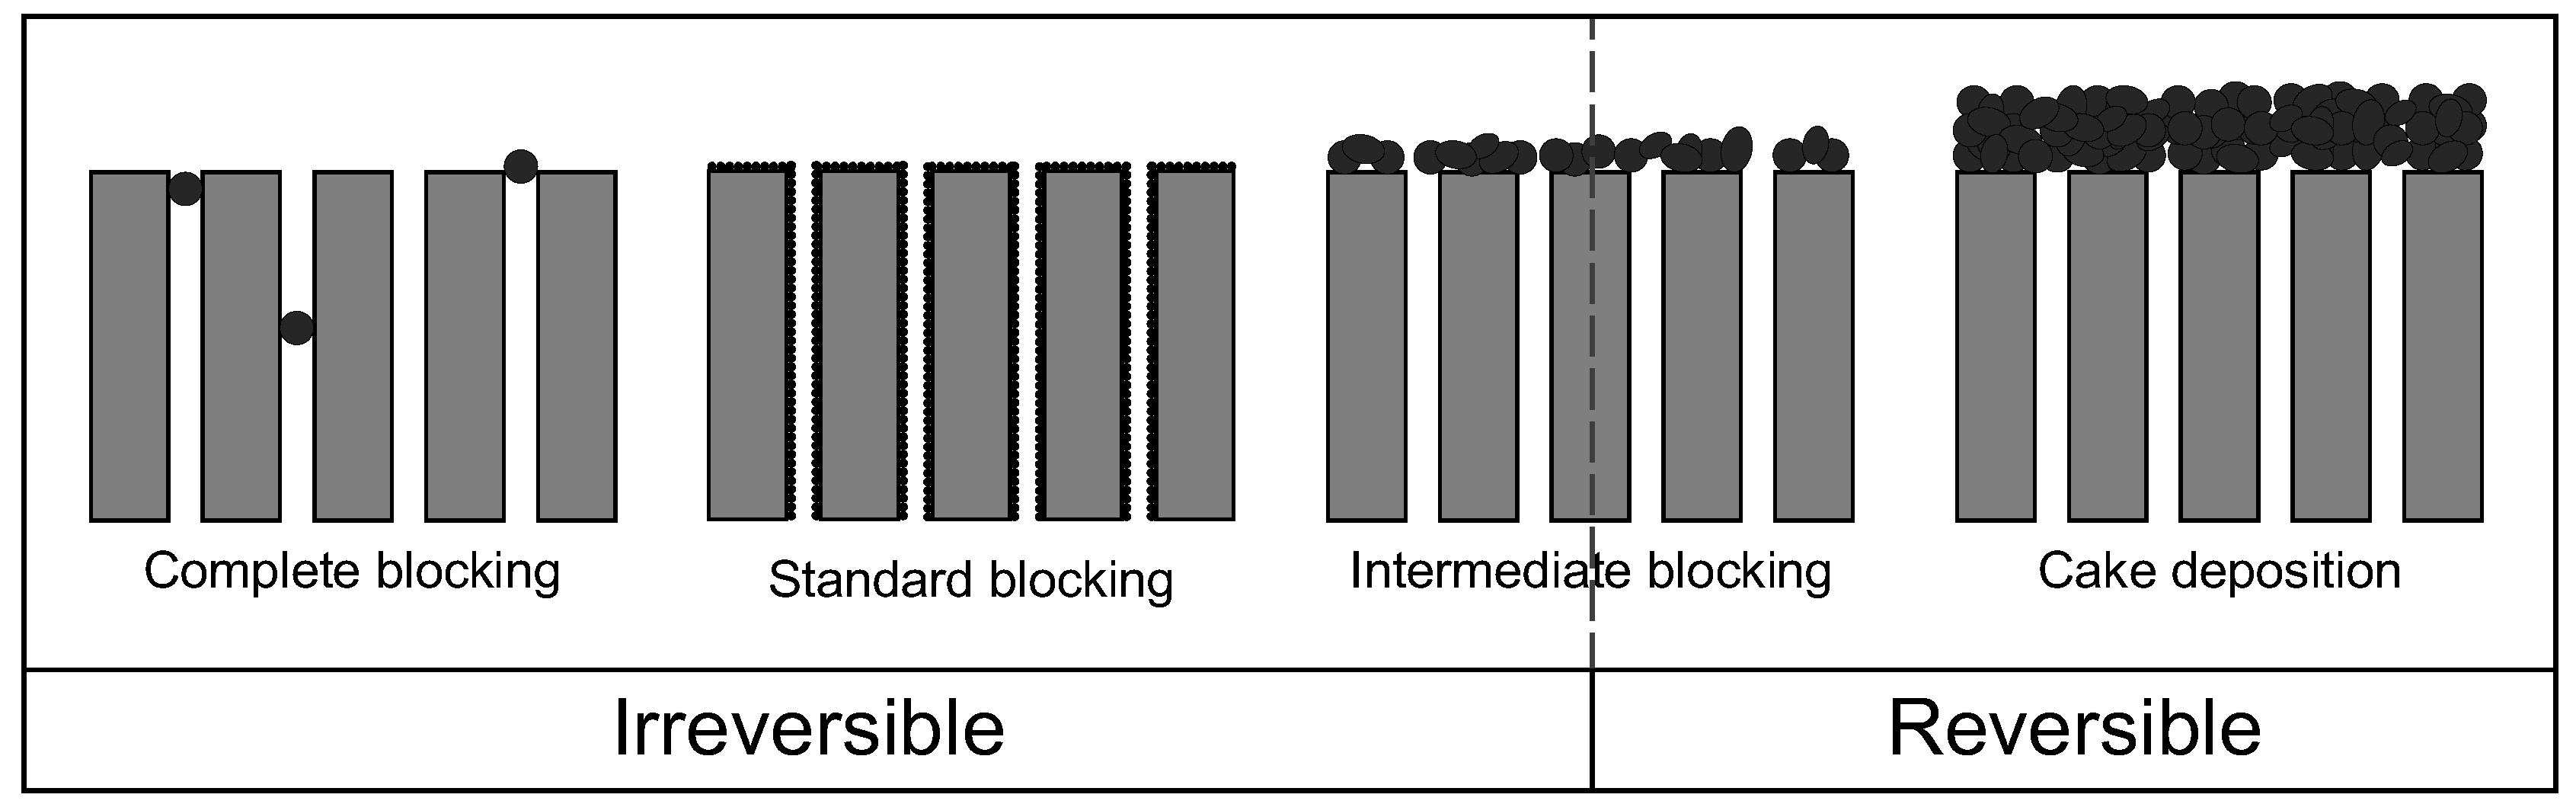
Figure 2.
Setup of the filtration plant: PI = Pressure indicator, TI = temperature indicator, FI = flow indicator, TIC = temperature indicator and controller
Figure 2.
Setup of the filtration plant: PI = Pressure indicator, TI = temperature indicator, FI = flow indicator, TIC = temperature indicator and controller
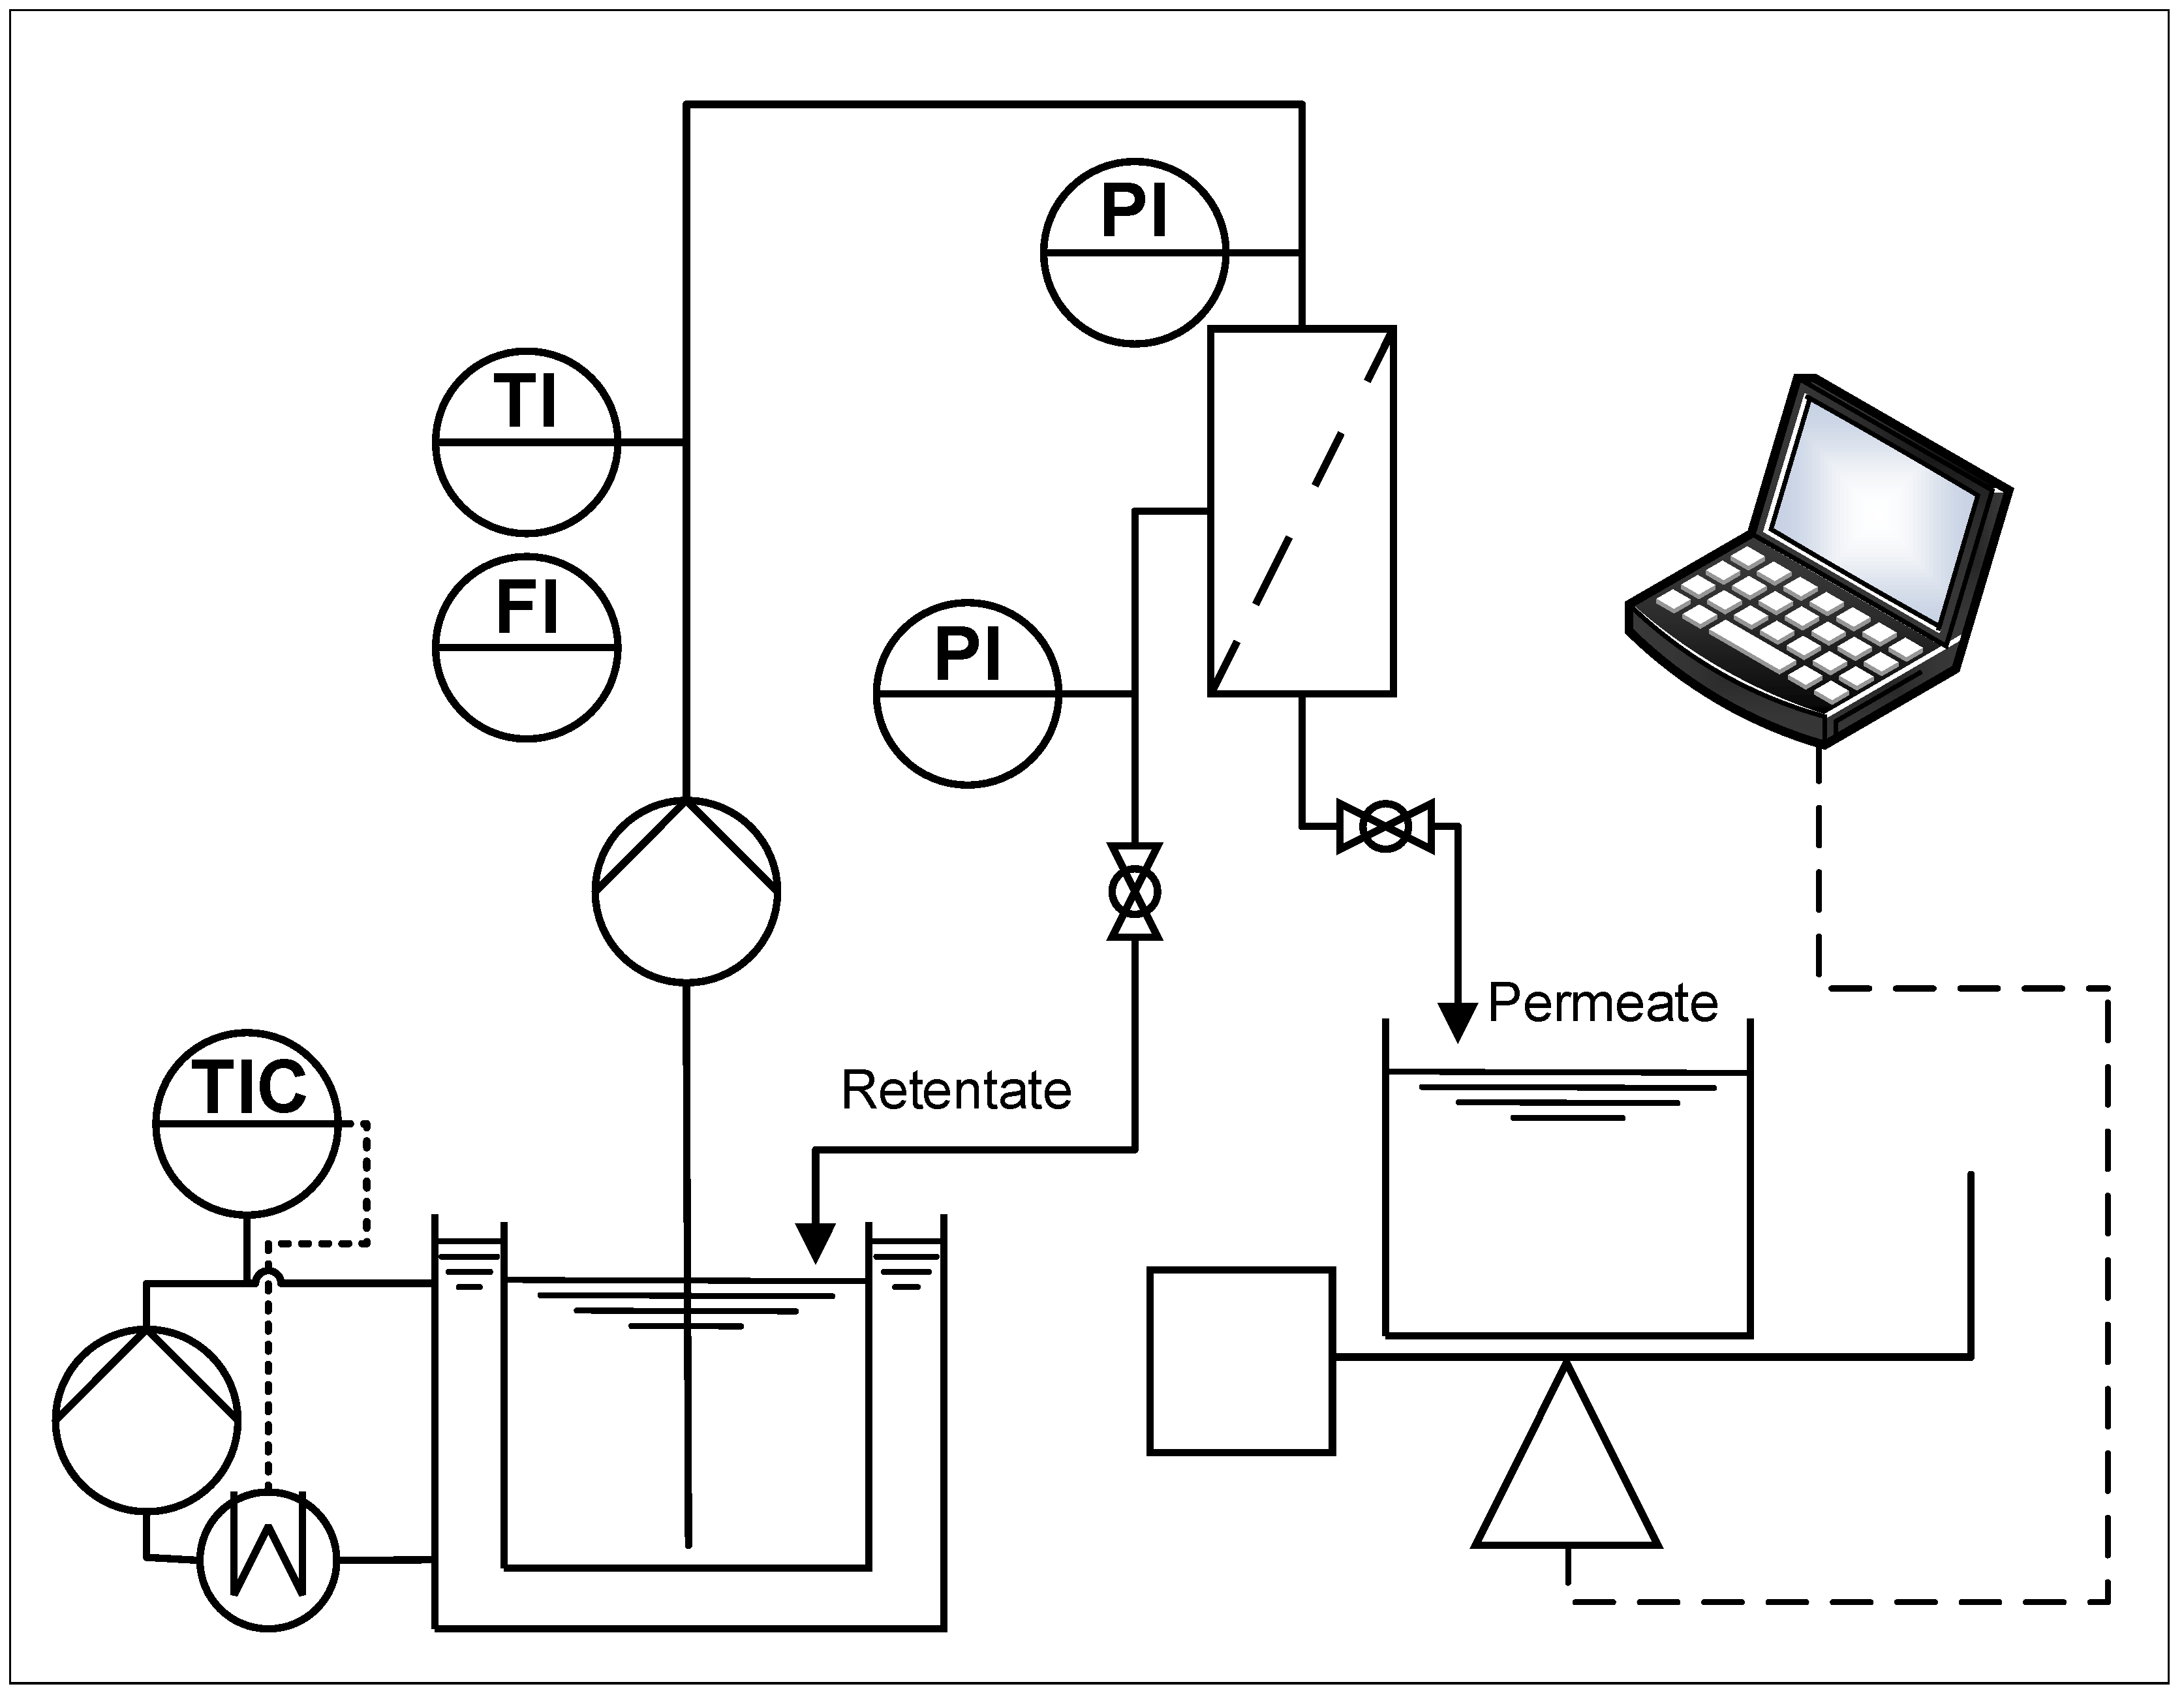
Figure 3.
Overview of the procedure for calculating the resistances of the resistance in series model.
Figure 3.
Overview of the procedure for calculating the resistances of the resistance in series model.
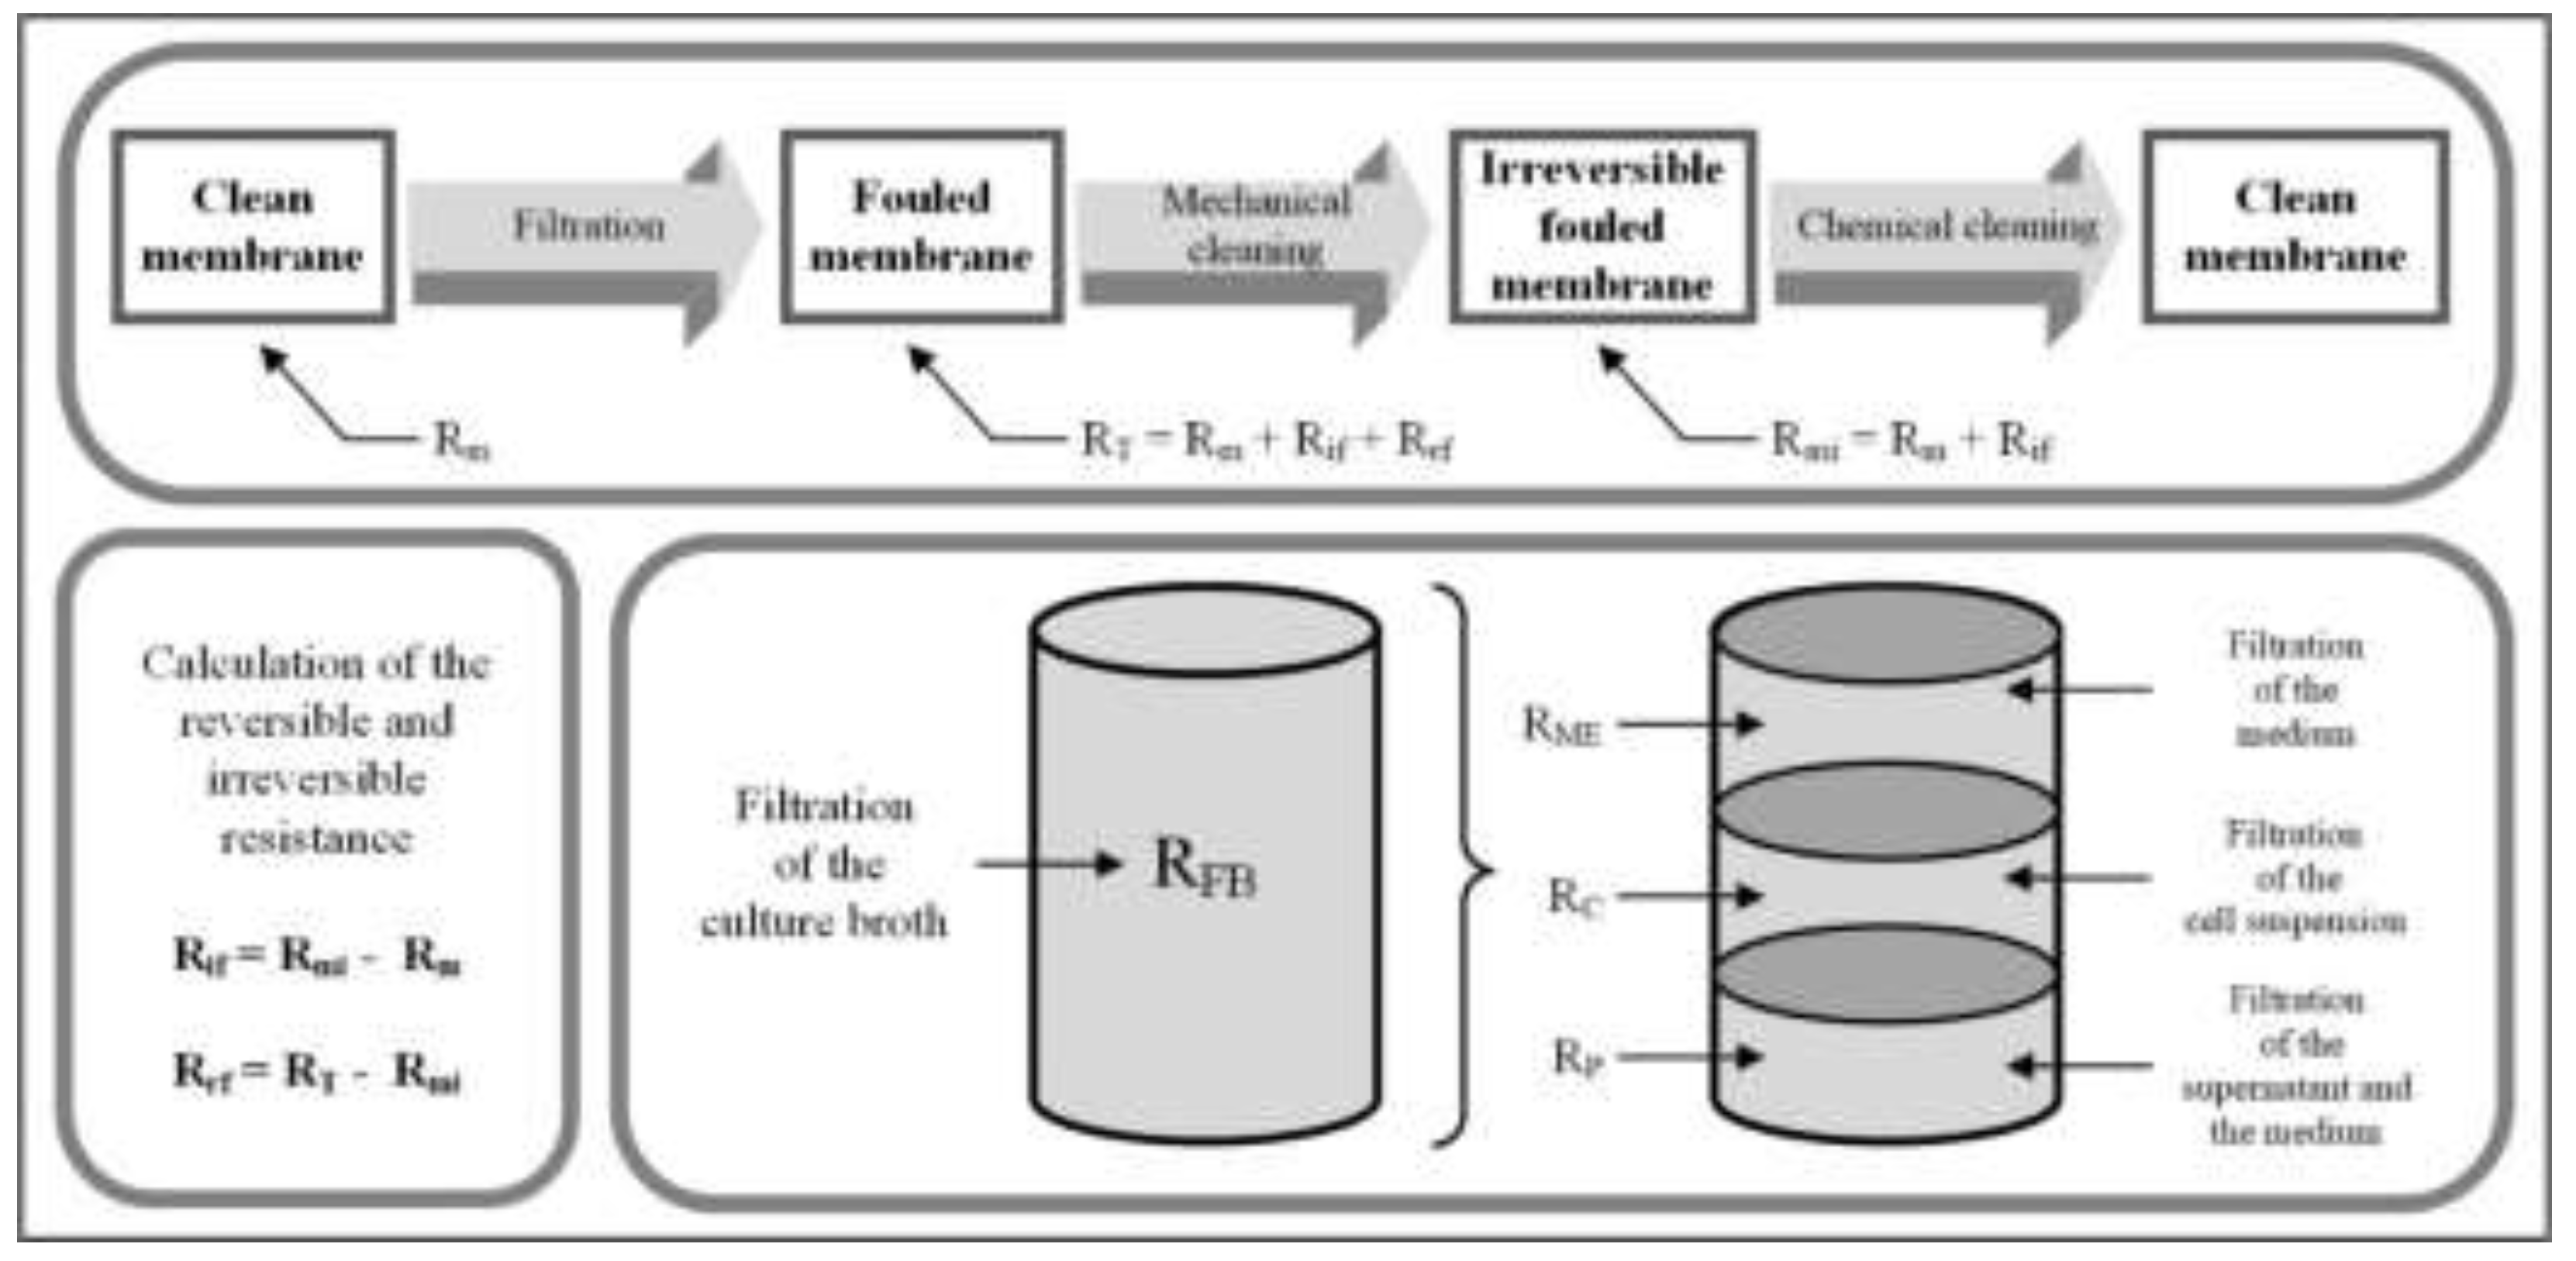
Figure 4.
Resistances of broth components compared to the overall resistance of the culture broth. Error bars were calculated by Gaussian error propagation.
Figure 4.
Resistances of broth components compared to the overall resistance of the culture broth. Error bars were calculated by Gaussian error propagation.
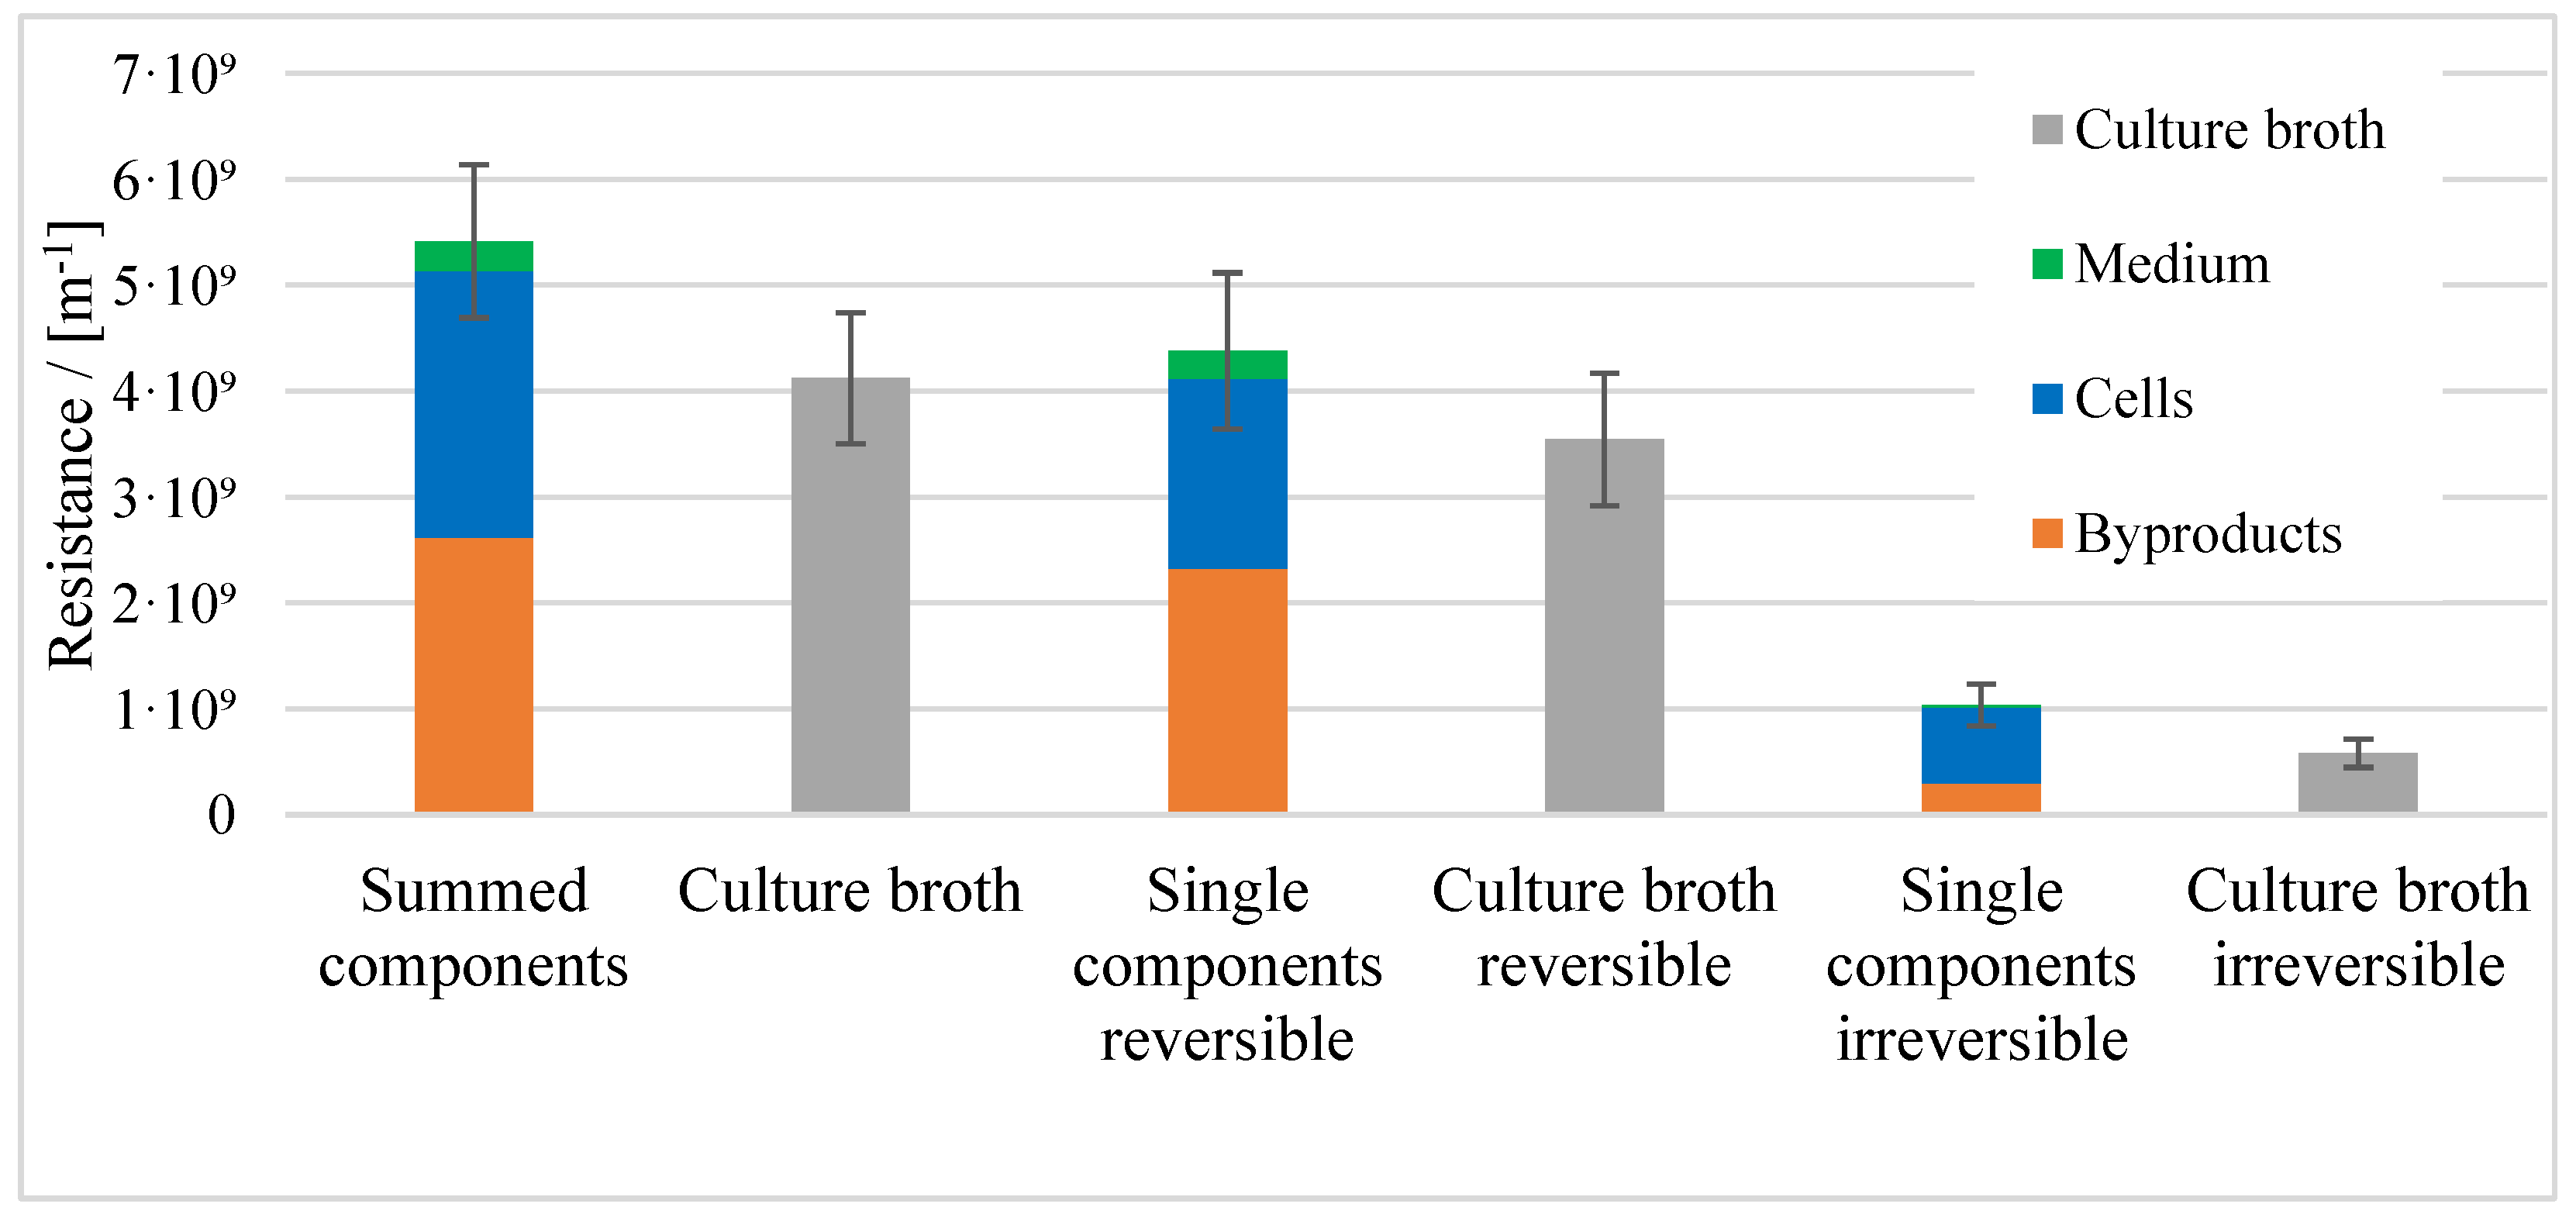
Figure 5.
Protein concentration in the feed and permeate: (A) = cells, permeate side, (B) = culture broth, permeate side, (C) = supernatant, permeate side, (D) = supernatant, feed side. Data are means ± standard deviations (n = 3).
Figure 5.
Protein concentration in the feed and permeate: (A) = cells, permeate side, (B) = culture broth, permeate side, (C) = supernatant, permeate side, (D) = supernatant, feed side. Data are means ± standard deviations (n = 3).
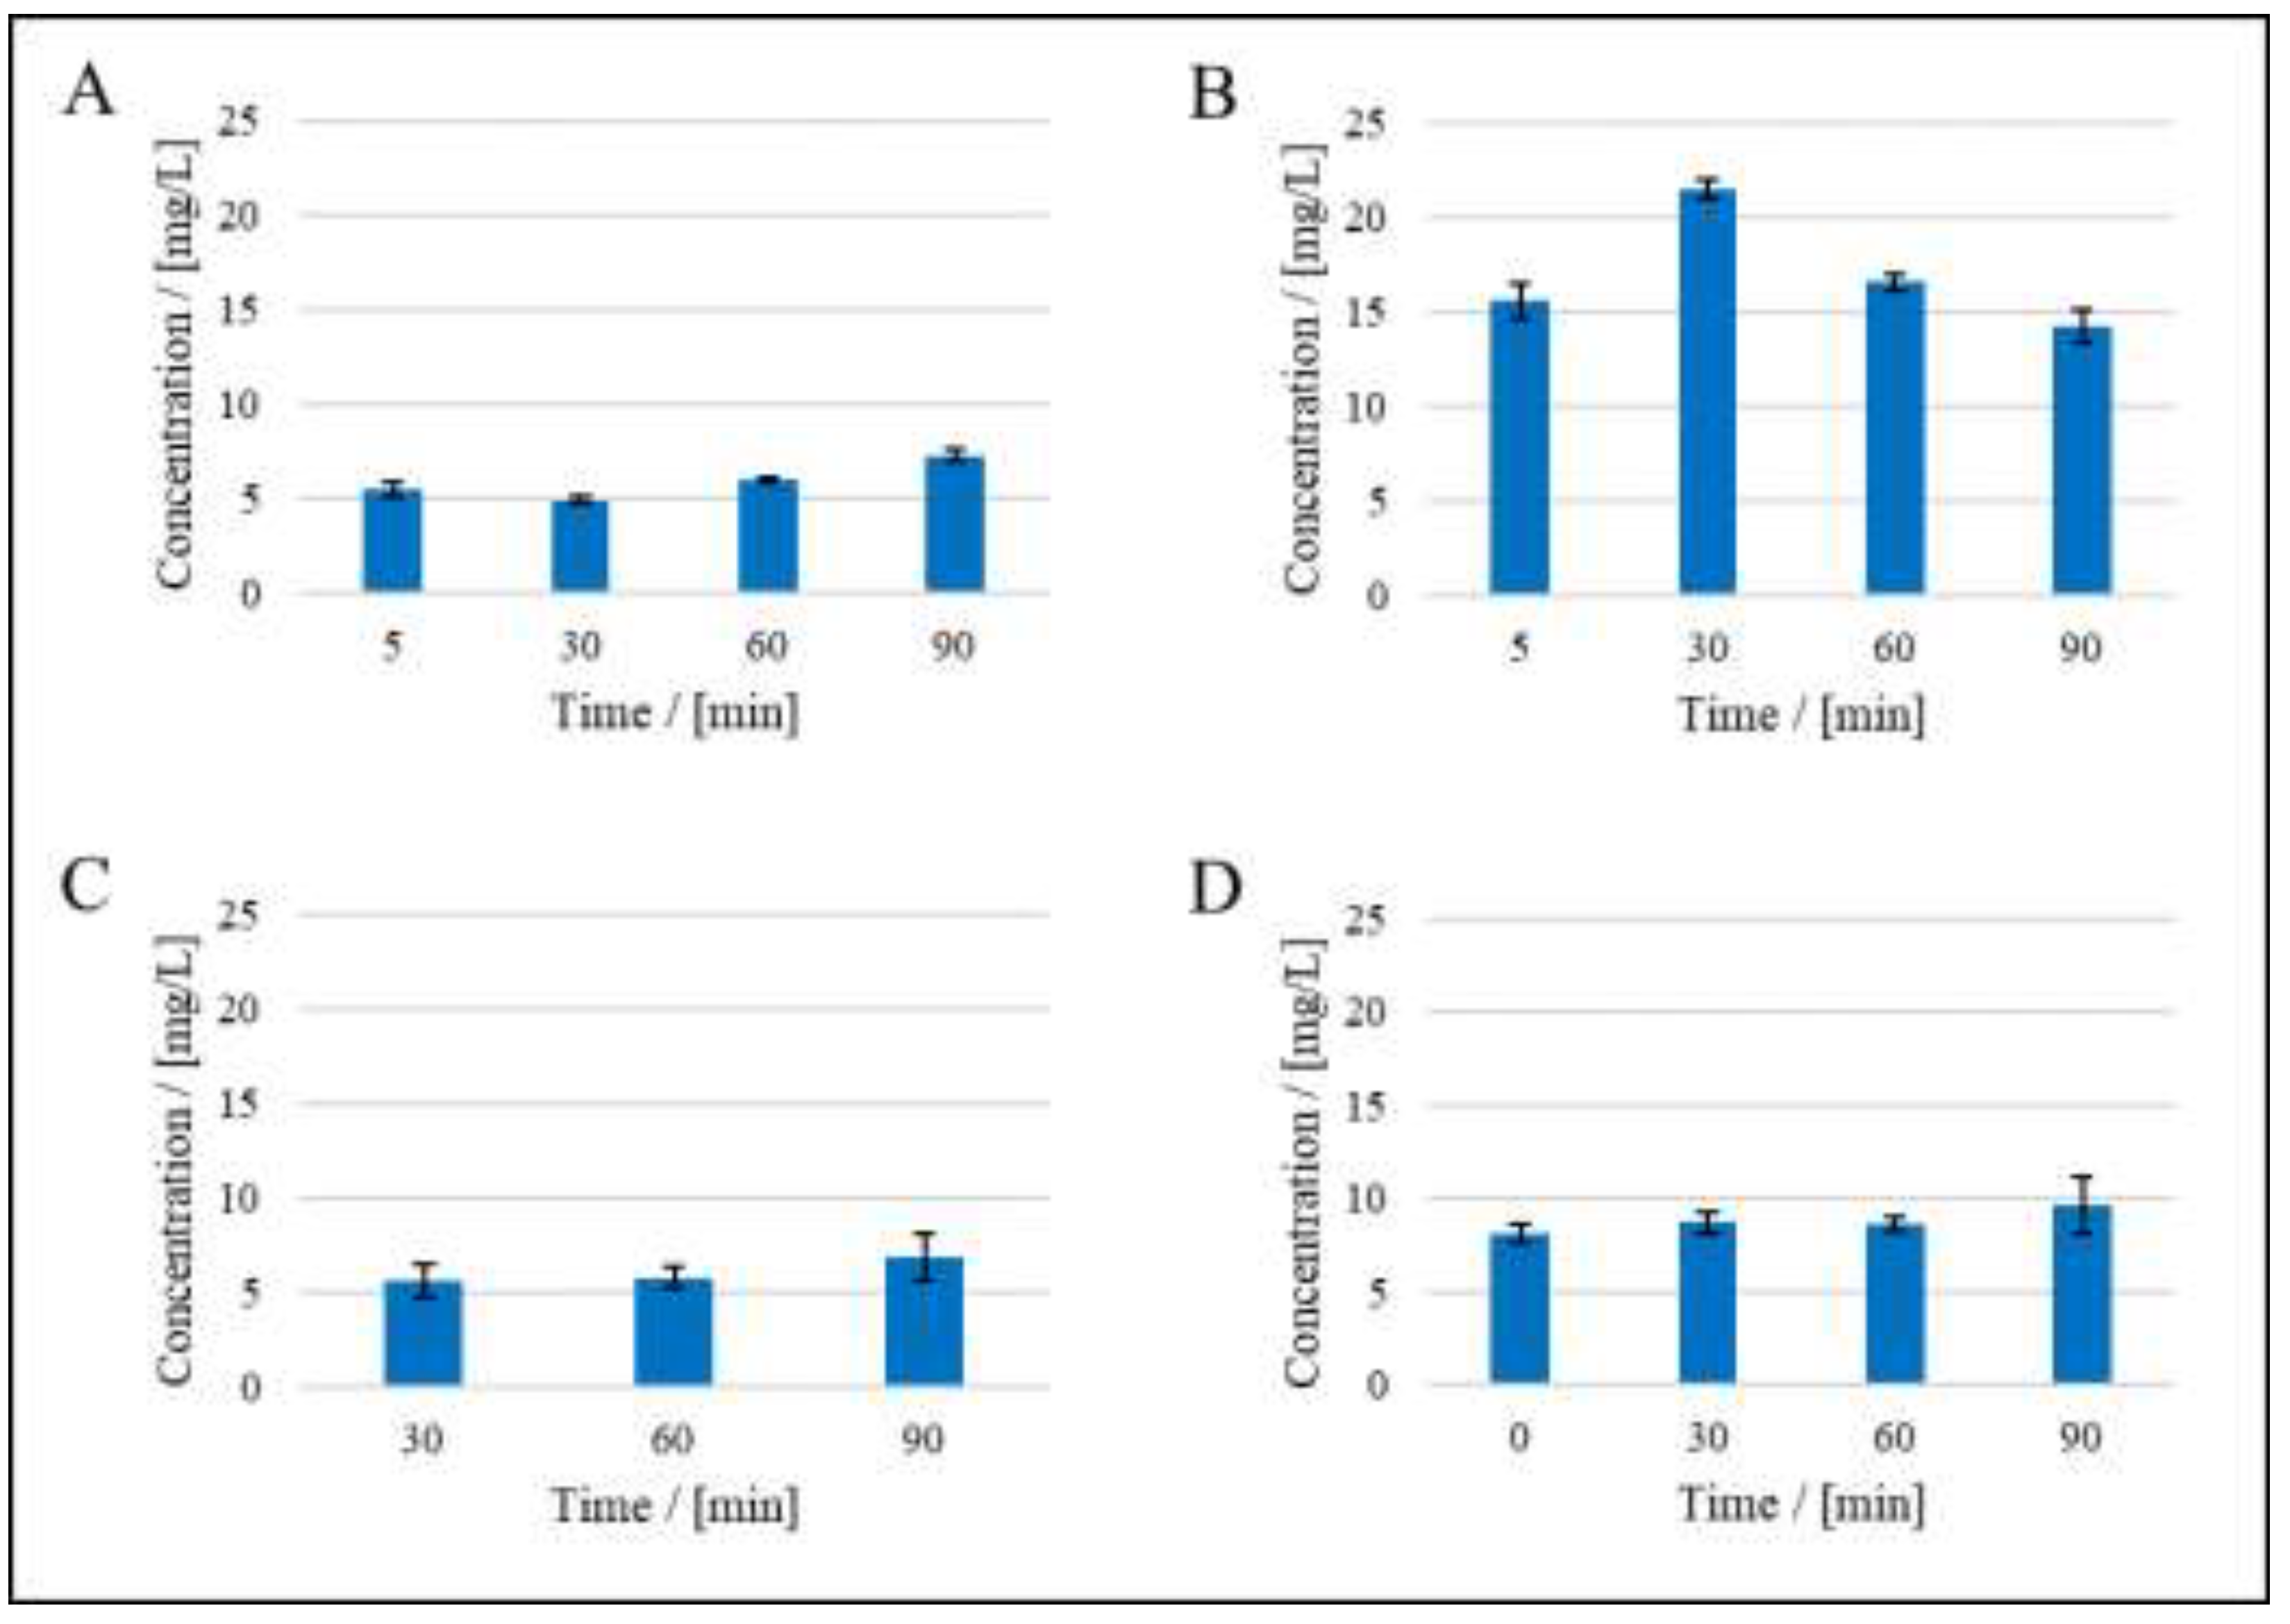
Figure 6.
Components of total resistance to calculate the compressibility index (resistance of the cleaned membrane, and resistances attributed to reversible and irreversible fouling).
Figure 6.
Components of total resistance to calculate the compressibility index (resistance of the cleaned membrane, and resistances attributed to reversible and irreversible fouling).
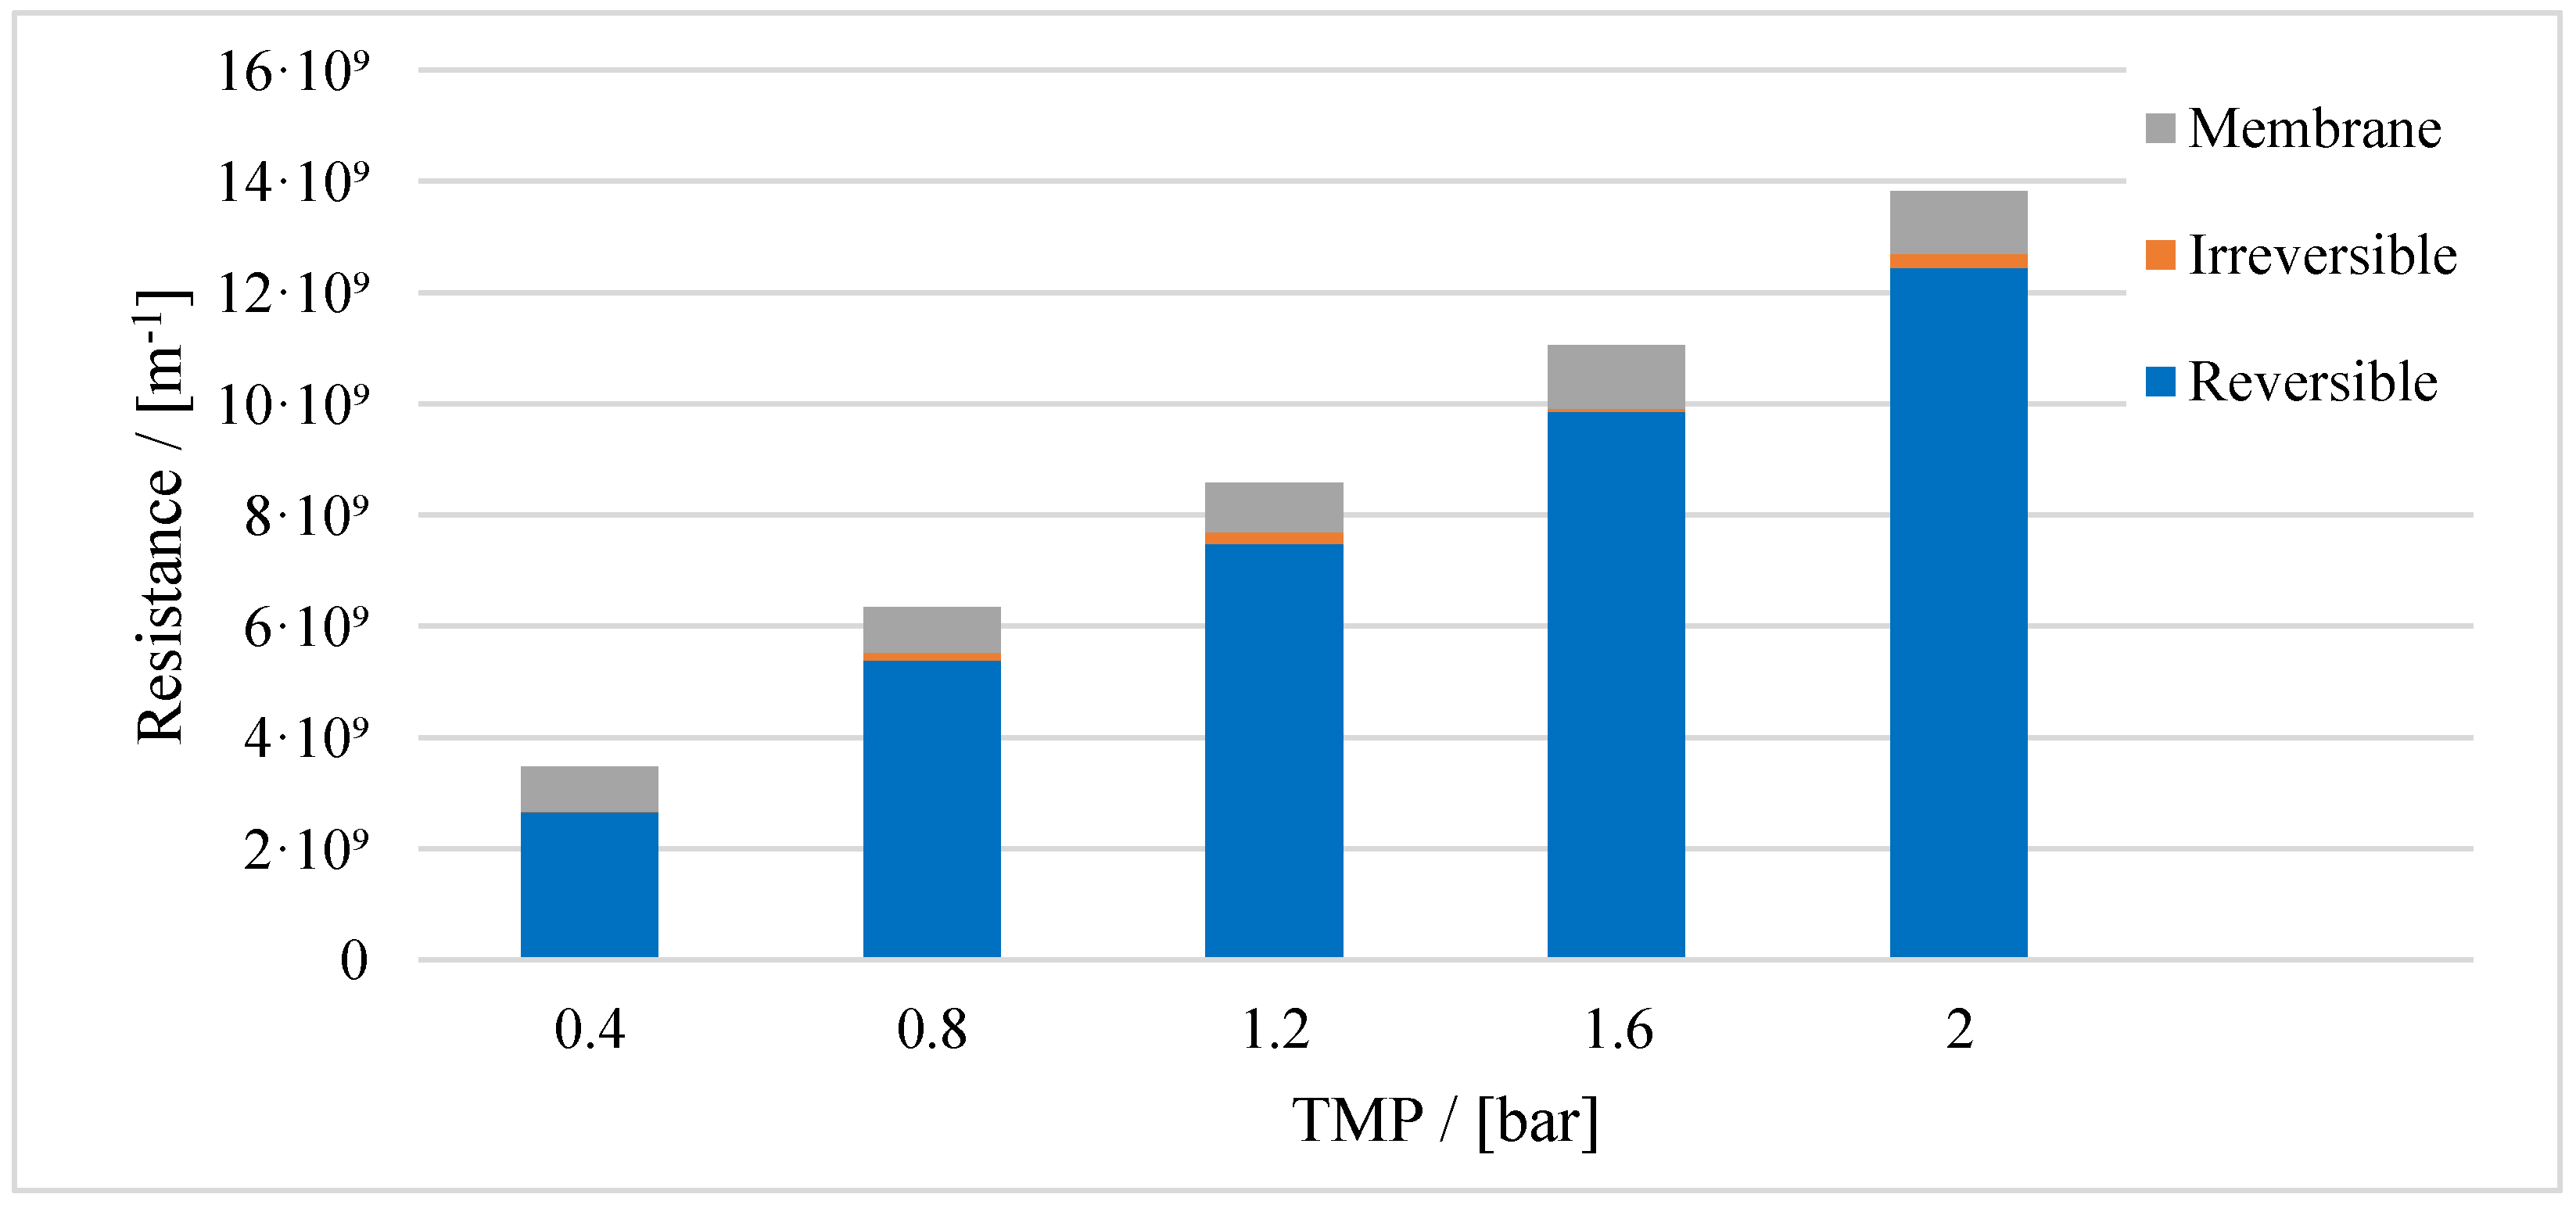
Figure 7.
OD600 values measured during the course of filtration to determine the compressibility index.
Figure 7.
OD600 values measured during the course of filtration to determine the compressibility index.
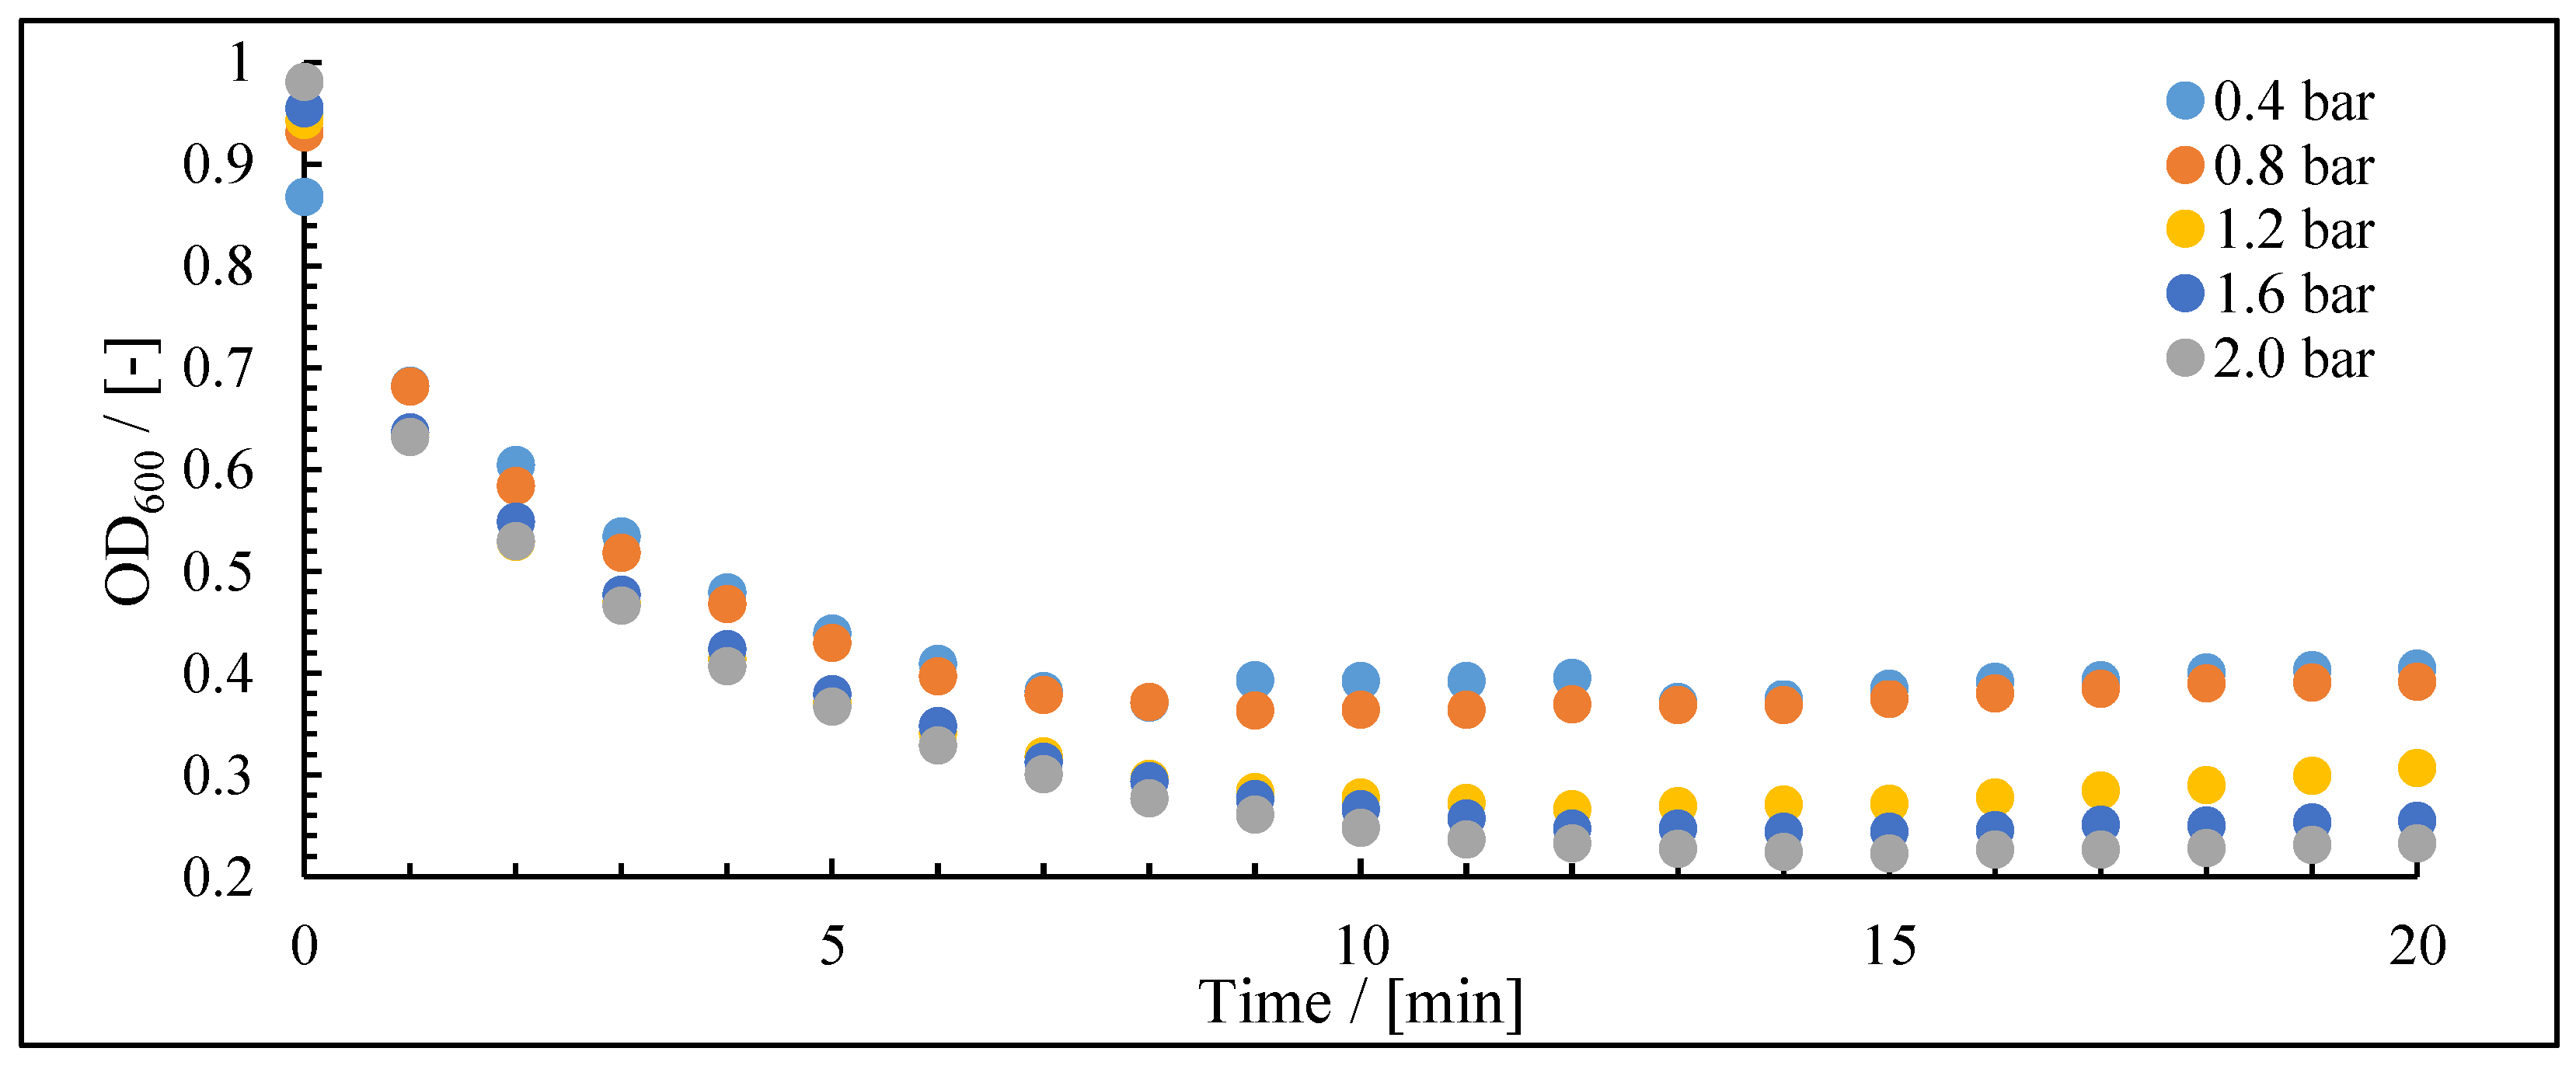
Figure 8.
Fit of the specific cake resistance plotted against the pressure over the cake (R2 = 0.99).
Figure 8.
Fit of the specific cake resistance plotted against the pressure over the cake (R2 = 0.99).

Figure 9.
Filtration fit curves using Hermias’s adapted laws: (A) culture broth, (B) = cells, (C) = supernatant, (D) = medium.
Figure 9.
Filtration fit curves using Hermias’s adapted laws: (A) culture broth, (B) = cells, (C) = supernatant, (D) = medium.
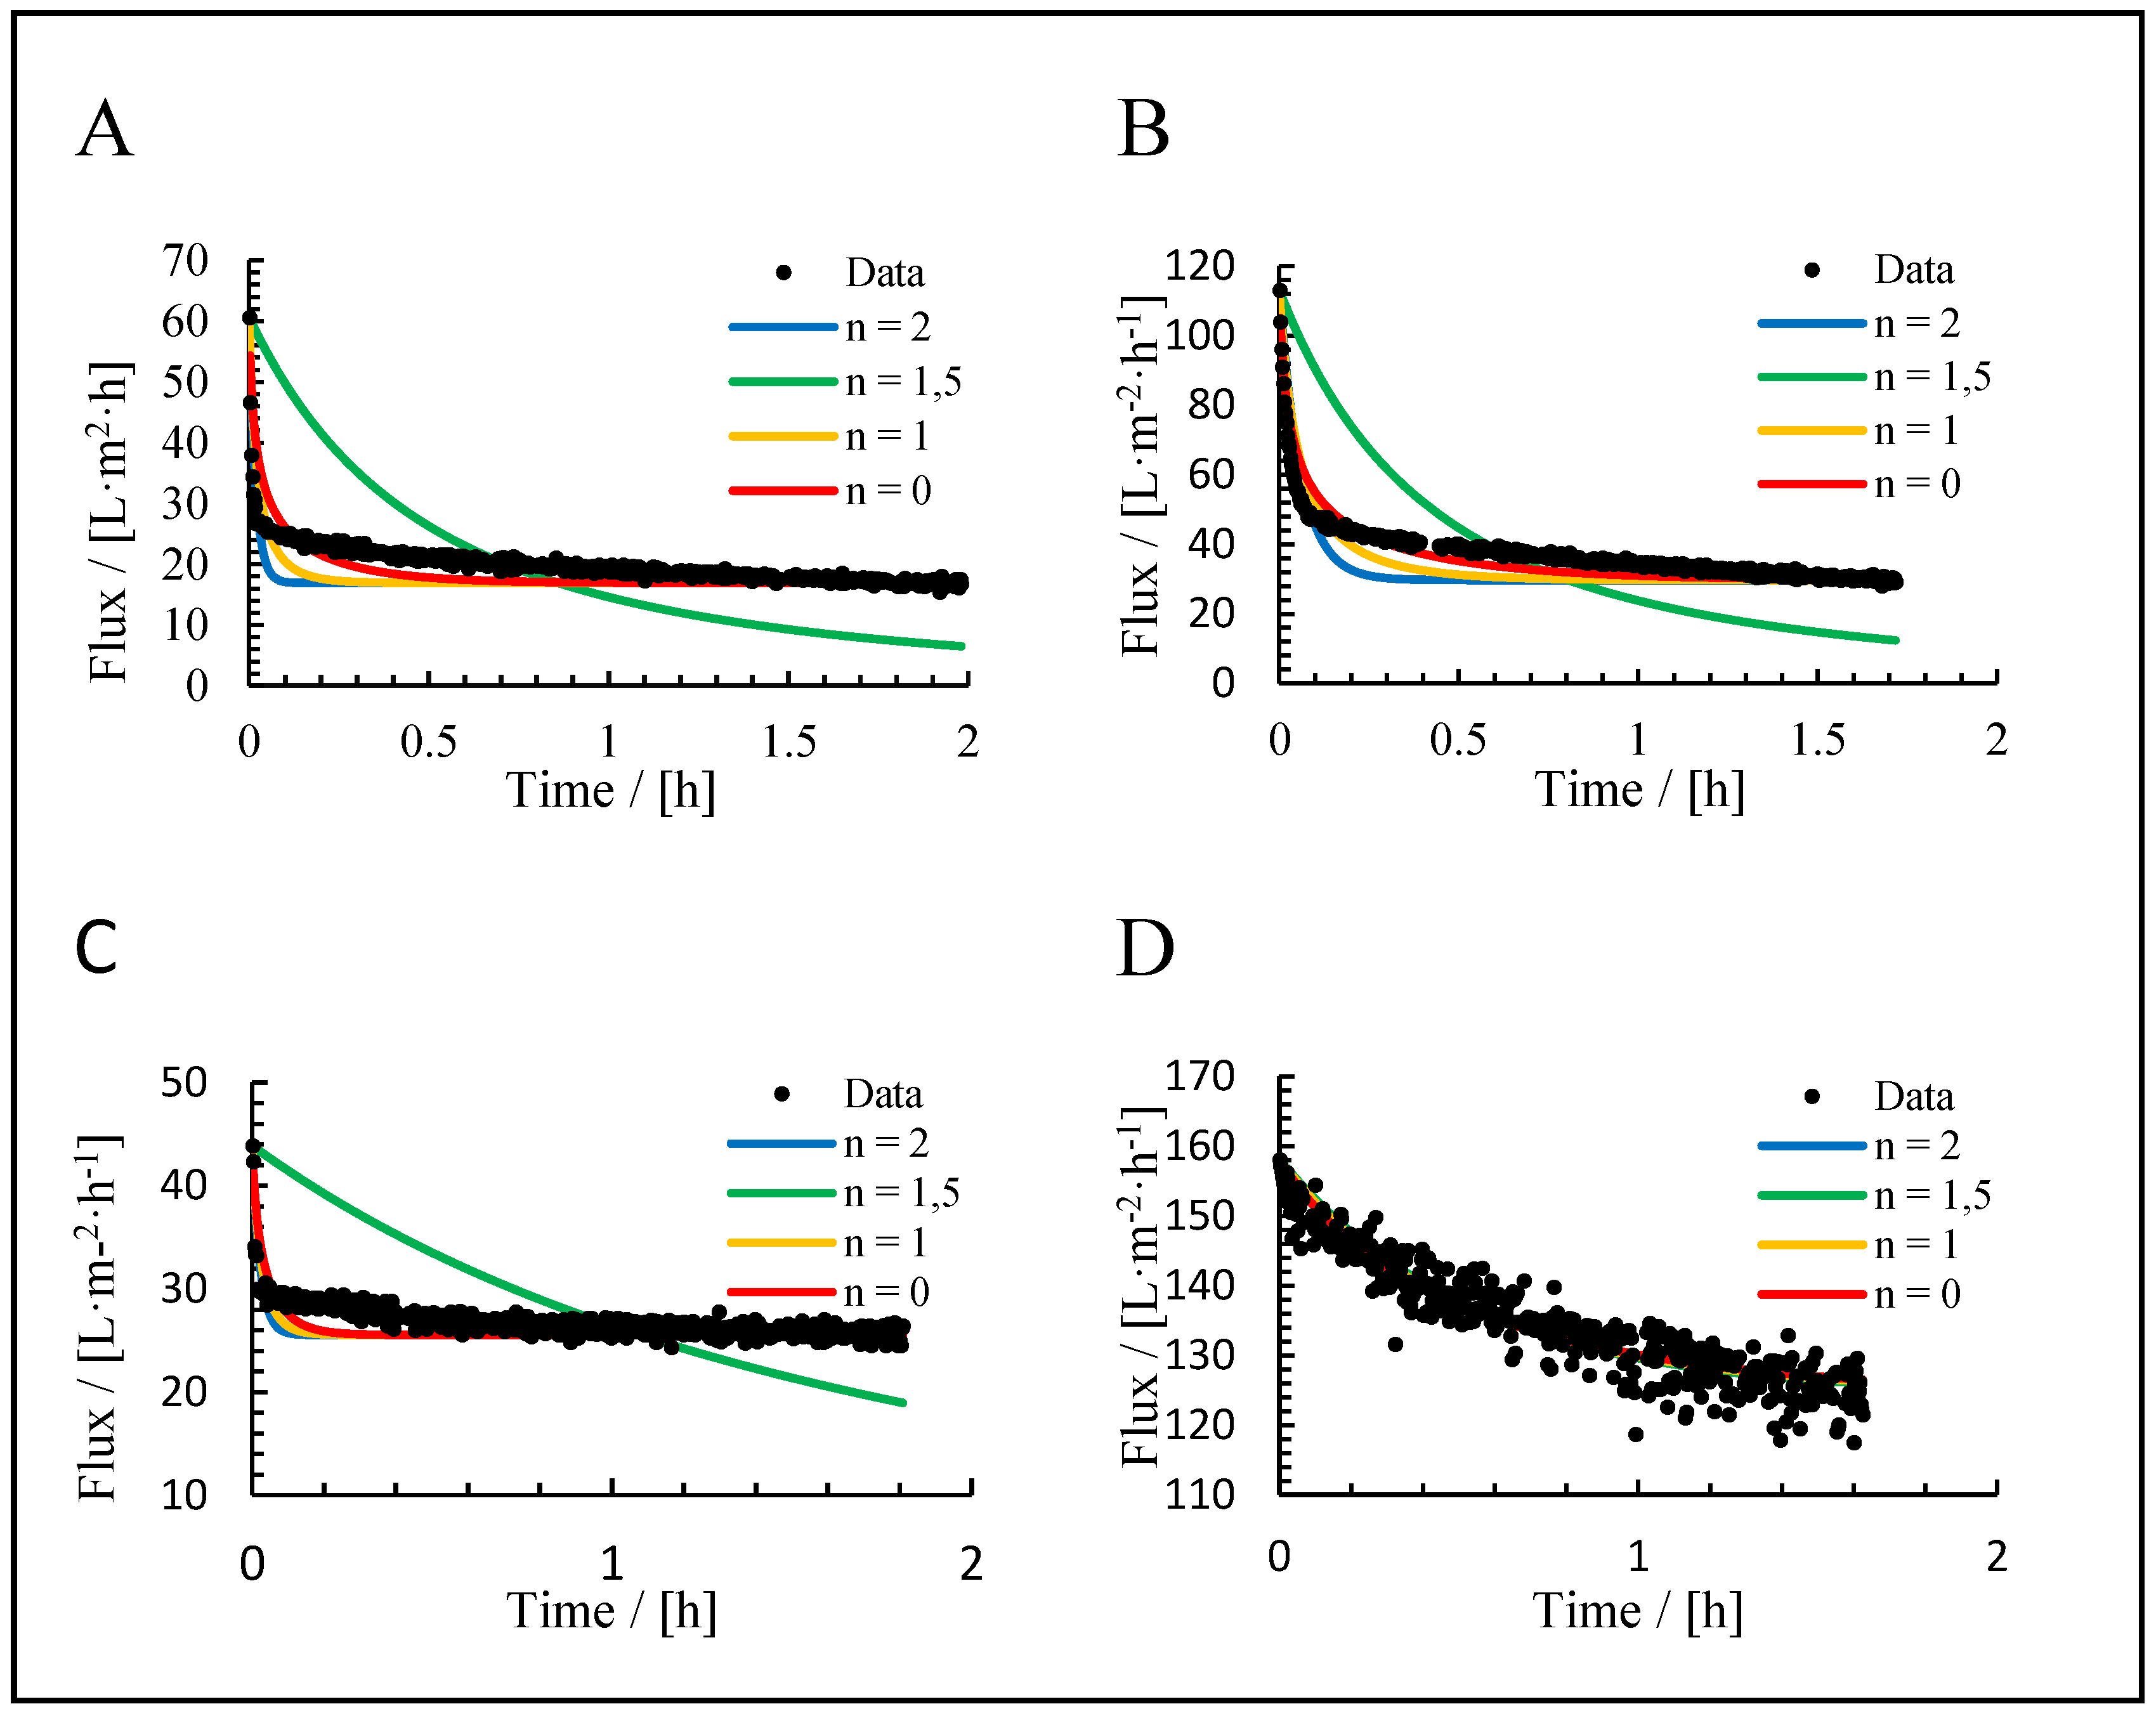
Figure 10.
Filtration fit curves using Hermias’s non-adapted laws: (A) culture broth, (B) = cells, (C) = supernatant, (D) = medium.
Figure 10.
Filtration fit curves using Hermias’s non-adapted laws: (A) culture broth, (B) = cells, (C) = supernatant, (D) = medium.
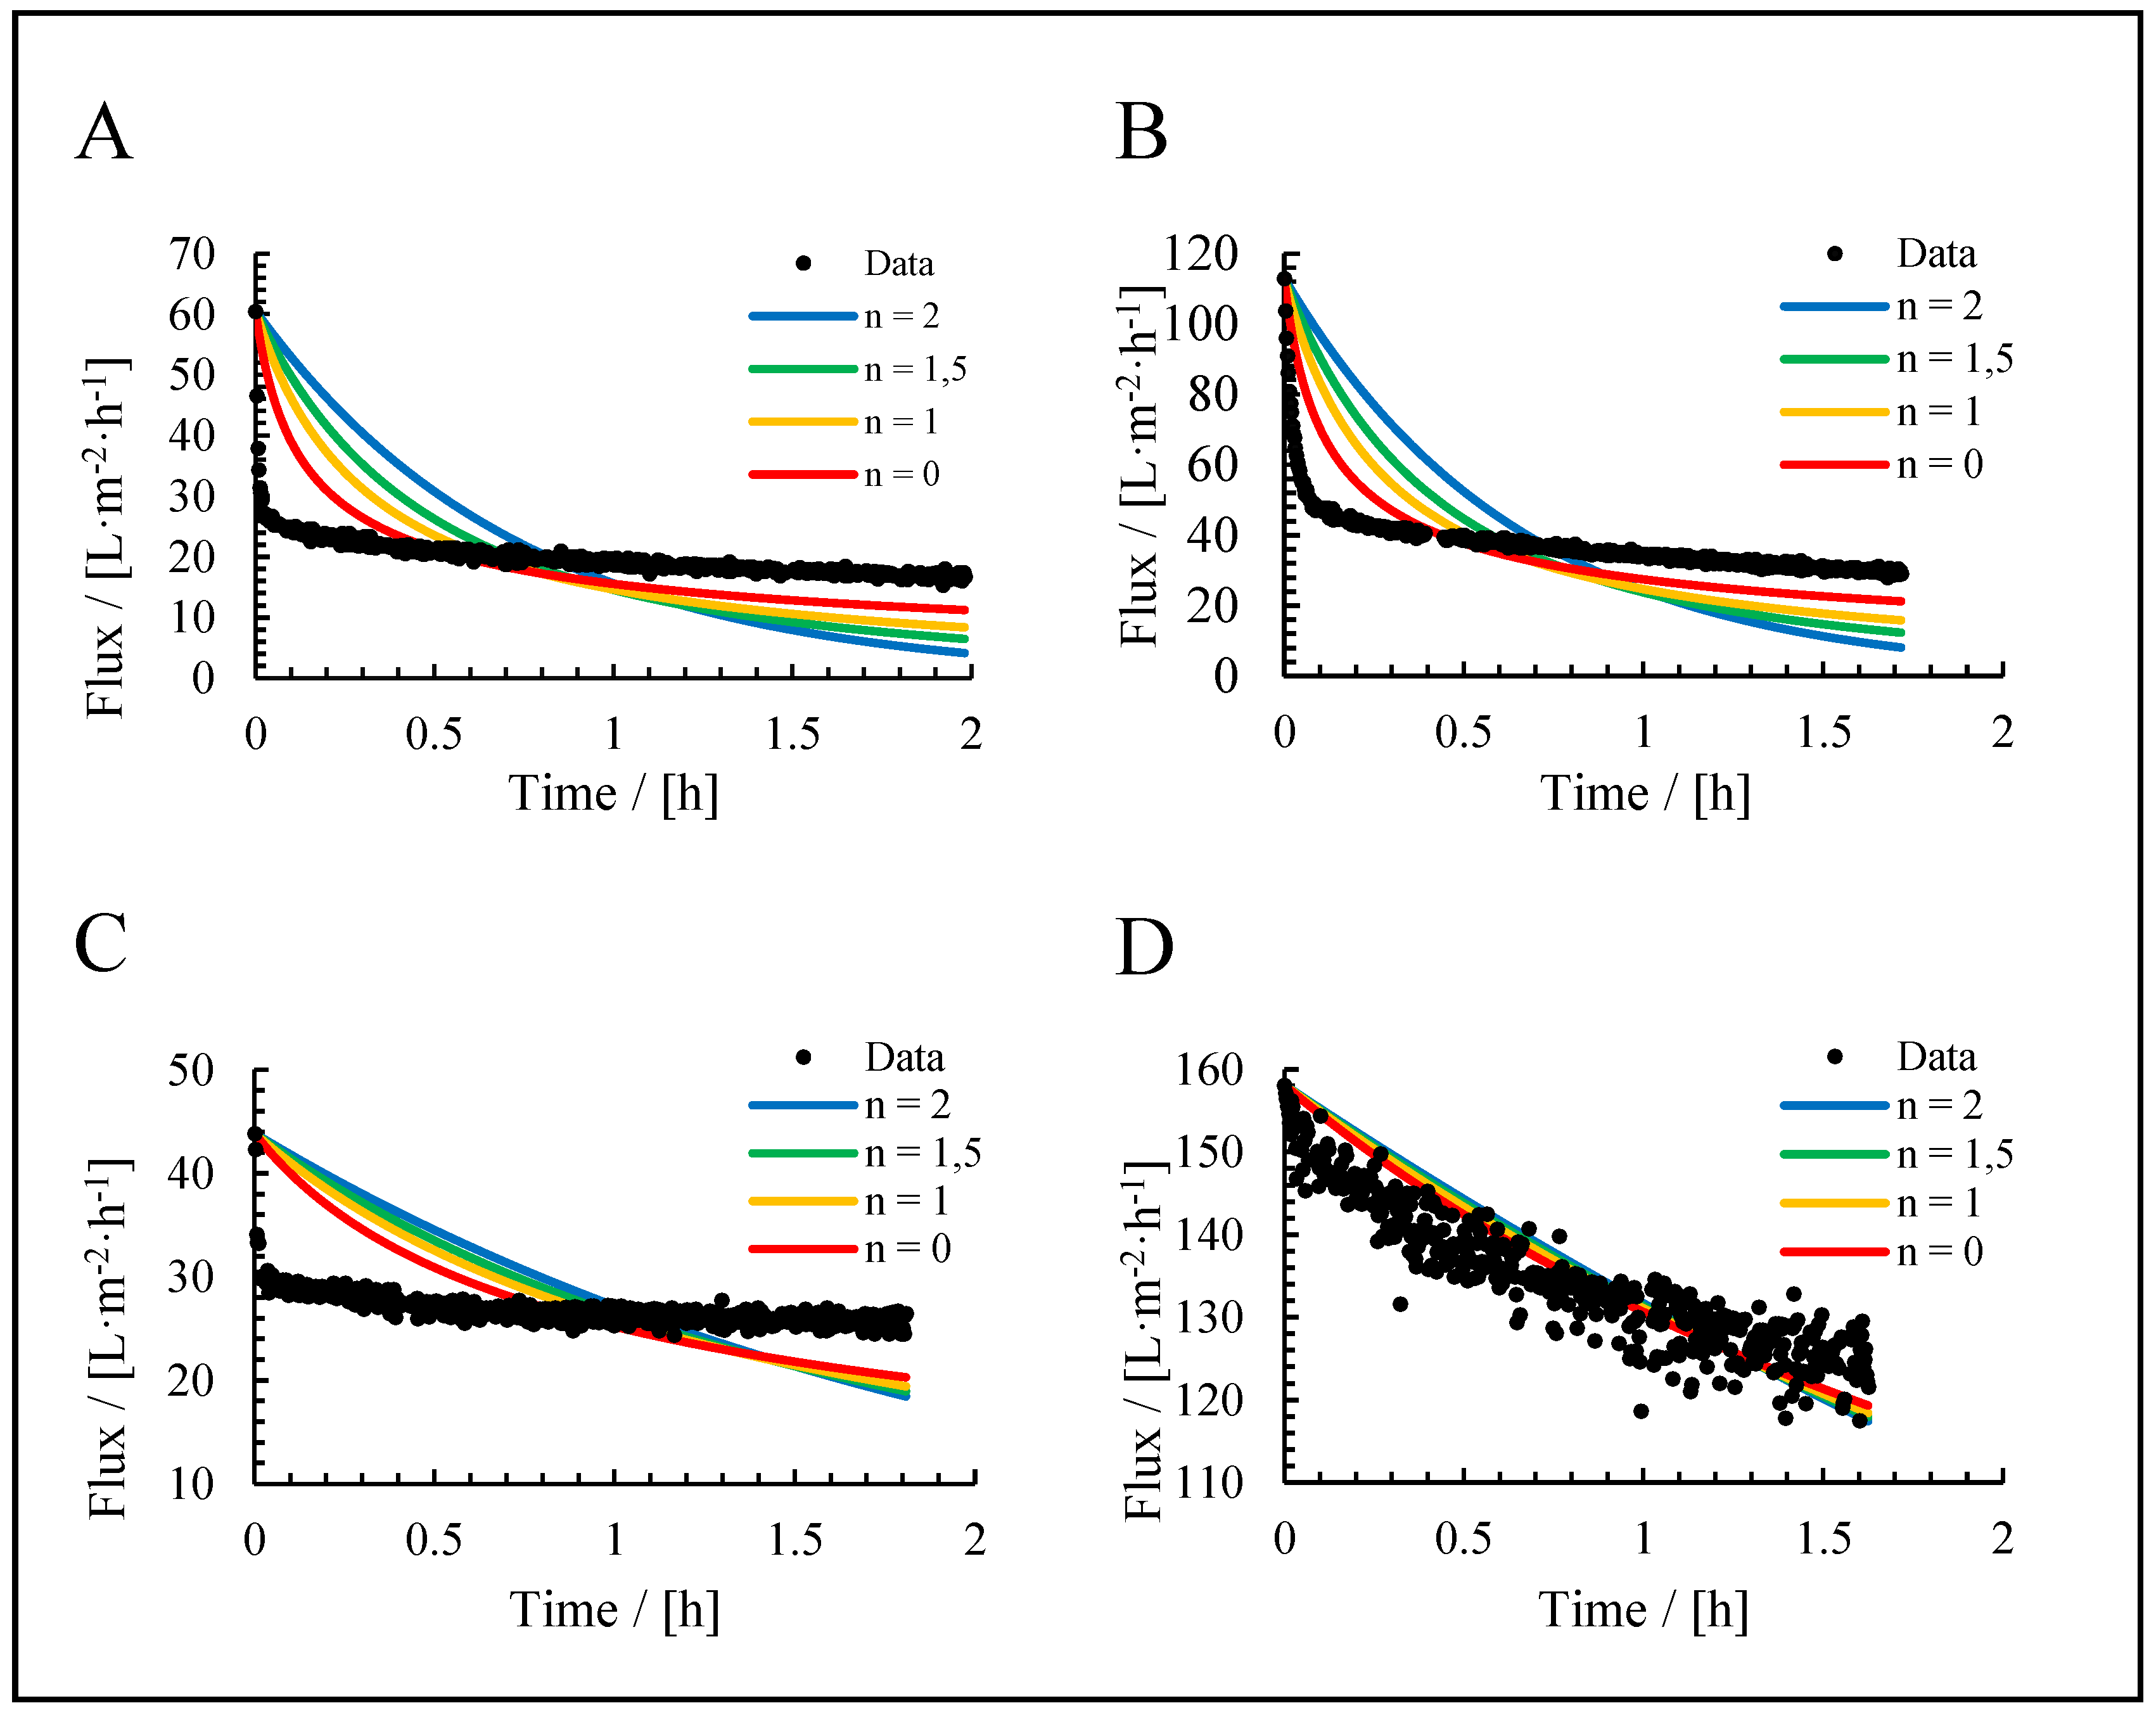

Table 1.
Hermia’s laws for dead-end filtration.
| Mechanism | n | Equation | |
| Complete blocking | 2 | 12 | |
| Standard blocking | 1.5 | 13 | |
| Intermediate blocking | 1 | 14 | |
| Cake deposition | 0 | 15 |
Table 2.
Hermia’s laws for cross-flow filtration.
| Mechanism | n | Equation | |
| Complete blocking | 2 | 17 | |
| Standard blocking | 1.5 | 18 | |
| Intermediate blocking | 1 | 19 | |
| Cake deposition | 0 | 20 |
Table 3.
R2 values representing fits of Hermia’s laws adapted for cross-flow filtration (the highest values, implicating the best of the fits, are underlined).
Table 3.
R2 values representing fits of Hermia’s laws adapted for cross-flow filtration (the highest values, implicating the best of the fits, are underlined).
| Fit model | R2 of the fit | |||
| Culture broth | Cells | Supernatant | Medium | |
| Complete blocking | 0.53 | 0.81 | 0.50 | 0.88 |
| Standard blocking | 0.74 | 0.74 | 0.58 | 0.88 |
| Intermediate blocking | 0.61 | 0.88 | 0.53 | 0.88 |
| Cake filtration | 0.72 | 0.92 | 0.51 | 0.88 |
Table 4.
R2 values representing fits of Hermia’s laws for dead end filtration (the highest values, implicating the best of the fits, are underlined).
Table 4.
R2 values representing fits of Hermia’s laws for dead end filtration (the highest values, implicating the best of the fits, are underlined).
| Fit model | R2 of the fit | |||
| Culture broth | Cells | Supernatant | Medium | |
| Complete blocking | 0.71 | 0.69 | 0.56 | 0.86 |
| Standard blocking | 0.74 | 0.74 | 0.58 | 0.87 |
|
Intermediate blocking |
0.31 | 0.14 | 0.30 | 0.87 |
| Cake filtration | 0.88 | 0.88 | 0.71 | 0.88 |
Disclaimer/Publisher’s Note: The statements, opinions and data contained in all publications are solely those of the individual author(s) and contributor(s) and not of MDPI and/or the editor(s). MDPI and/or the editor(s) disclaim responsibility for any injury to people or property resulting from any ideas, methods, instructions or products referred to in the content. |
© 2025 by the authors. Licensee MDPI, Basel, Switzerland. This article is an open access article distributed under the terms and conditions of the Creative Commons Attribution (CC BY) license (http://creativecommons.org/licenses/by/4.0/).
Copyright: This open access article is published under a Creative Commons CC BY 4.0 license, which permit the free download, distribution, and reuse, provided that the author and preprint are cited in any reuse.


