
Submitted:
03 February 2025
Posted:
04 February 2025
You are already at the latest version
Abstract
Reverse osmosis concentrate (ROC) treatment is critical for enhancing water recovery, especially in regions facing water scarcity. The high concentrations of total dissolved solids (TDS), hardness (Ca2+ and Mg2+) and silica, present significant challenges for ROC treatment due to their high scaling potential. Developing effective pretreatment strategies, such as ion exchange (IX) and activated alumina (AA), to mitigate scaling is essential for improving water recovery. This study investigates the effectiveness of dif-ferent ion exchange (IX) resins and activated alumina (AA) in removing hardness and silica from brackish water ROC, through batch isotherm studies, continuous column experiments, regeneration, impact of operating conditions, model simulation, and pre-liminary costs analysis. The ROC is characterized by TDS 12,445 mg/L, Ca²⁺ 847 mg/L, Mg²⁺ 212 mg/L, and silica 160 mg/L. Hardness removal was evaluated using two types of strong acid cation (SAC) IX resins and silica removal using three types of strong base anion (SBA) IX resins and three types of AA. While IX was effective in removing hardness and silica during the initial stages of column experiments, hardness breakthrough occurred at 17–33 bed volumes (BV) for SAC and 5 BV for silica using SBA, due to their high con-centrations in ROC. In contrast, AA demonstrated superior and sustained silica removal, reducing silica concentration in ROC by up to 65% and maintaining performance for up to 800 BV without reaching saturation. Model simulation of a secondary RO treating ROC after the IX and AA pretreatment indicated an additional water recovery of ~70% using antiscalants. While this study demonstrates the potential for achieving higher water recovery, significant challenges remain, including limited capacity of IX resins for ROC treatment, which necessitates frequent regeneration and adds operational costs, as well as the restricted regeneration capacity of AA. These findings emphasize the critical need for developing advanced materials and optimized strategies to enhance the efficiency of ROC treatment processes.
Keywords:
silica removal
; ion exchange
; activated alumina
; hardness removal
; desalination
1. Introduction
Water scarcity is a critical challenge, especially in arid regions with low rainfall, high temperatures, and elevated evaporation rates. Nontraditional water sources, such as brackish water, have become valuable resources for desalination to offset freshwater demands [1,2]. Reverse osmosis (RO) has drastically transformed the desalination industry over the past several decades, now representing over 80% of the capacity for brackish water desalination [3]. Its widespread adoption is driven by its affordability, energy efficiency, and straightforward operation [3]. Despite its benefits, brackish water RO desalination generates significant volumes of brine or RO concentrate (ROC) for disposal, which ranges from 10% to 60% of the feedwater depending on the water quality [4,5,6]. The limited water recovery is associated with elevated concentrations of scale-forming ions in brackish water ROC, including calcium, magnesium, carbonate, sulfate, and silica coupled with salinity levels that range from 5 to 15 g/L total dissolved solids (TDS) [2,5,7,8,9].
Common ROC disposal methods used in the U.S. include surface water discharge (45%), sewer discharge (25%), deep well injection (17%), land application (7%), and evaporation ponds (4%), depending on ROC quality, geographical location, and regulations [6,10]. While regulatory frameworks are designed to ensure the ROC discharges meet quality standards when disposed by land application, surface water discharge or sewer discharge, uncertainties remain about potential environmental risks. These concerns are amplified by factors such as mismanagement, inadequate monitoring, or the cumulative effects over time, particularly in regions with limited dilution capacity or sensitive ecosystem [11]. Evaporation ponds are practical in arid and semi-arid regions with abundant solar energy, but their requirement for large land areas limits their use in densely populated urban areas [5,6]. On the other hand, deep well injection requires appropriate geologic conditions and carries potential risks such as groundwater contamination and increased susceptibility to earthquakes [6,12].
Efforts to increase water recovery and minimize the concentrate volume for disposal face significant challenges due to the high scaling potential of ROC. This is primarily caused by the sparingly soluble minerals such as calcium, magnesium, and silica, which can precipitate as magnesium hydroxide, calcium carbonate, magnesium carbonate, calcium sulfate, and silicates. These precipitates reduce membrane permeability, increase energy consumption, and result in frequent chemical cleaning or membrane failure [13,14]. Various technologies, including chemical precipitation, coagulation, softening, and advanced filtration, have been explored to remove these scaling-causing minerals. These approaches have limitations such as the need for substantial chemical additions, pH adjustments, sludge generation, and high costs [15,16,17,18,19,20,21,22,23]. Addressing these limitations requires innovative pretreatment methods to reduce the scaling potential of ROC and enable higher water recovery.
Different strategies have been developed to minimize the impacts associated with inland ROC management and disposal, including:
- Developing high-recovery and ultra-high pressure, primary desalination processes to minimize ROC volume and potentially achieve near to zero liquid discharge (ZLD). This approach increases water recovery for brackish water desalination, minimizes brine volume, and reduces brine disposal costs and environmental impacts. Examples of high recovery desalination systems include low salt rejection RO [24,25], closed circuit reverse osmosis (CCRO) [26,27], electrodialysis metathesis [28,29], and high-pressure spiral wound RO elements that can operate up to 120 bar and concentrate brine up to ~120,000 mg/L TDS [30,31].
- Treating the ROC directly. For existing facilities, it may be more practical to treat the ROC directly (such as using the high recovery processes in strategy 1 as secondary or tertiary desalination processes) rather than retrofitting the facility with high-recovery processes, although the goal of minimizing the concentrate volume is the same as in strategy 1. The selected ROC treatment technologies should consider technically feasible, cost-effective, and energy-efficient processes in existing and planned desalination facilities.
- Valorization of ROC. Instead of concentrating the ROC and disposing of the solids, valorization aims to recover valuable resources for a circular economy by finding beneficial uses for the extracted compounds. For example, the development of an integrated treatment train using selective electrodialysis (SED), electrodialysis brine concentrator (EDBC), and bipolar membrane electrodialysis (BPED) to convert ROC to low-salinity water for irrigation and acids and caustic streams for industrial uses [32].
A literature review has identified technologies with high selectivity for removing hardness and silica, such as ion exchange (IX) and activated alumina (AA), as promising alternative approaches (Table 1). These methods provide several advantages including no chemical addition during treatment, no pH adjustment required, no sludge generation, and regenerability of the media [33]. IX has been reported to have a LCOW of $1.49/m3 [16], but according to our knowledge the LCOW for AA has not been reported yet. The application of IX and AA for ROC treatment has been limited, and further research is required to evaluate their effectiveness in reducing scaling potential [34].
Cation and anion exchange resins can be used for softening and demineralization applications. The functional group in strong acid cation (SAC) resins used in softening is sulphonate, while the mobile ion is sodium. The exchange reaction can be written as shown in Equations (1) and (2) [35], where R represents the resin polymer structure. The ion affinity in cation exchange resins follows the .
Silica can be removed by strong base anion (SBA) resins in the hydroxide (OH-) form when it is present in its anionic forms H3SiO4- and H2SiO42- [36] (Equations (3) and (4)), while the exchange reaction can be written in Equation (5) [35,37]. The ion affinity in anion exchange resins follows the order of .
In contrast to SBA that is effective for silica removal at high pH conditions, AA has been evaluated to remove dissolved silica due to its high adsorption capacity and selectivity for silica species [38]. The orthosilicic acid (H4SiO4 or Si(OH)4) can attach to the OH- groups in the surface of the hydrated AA, as shown in Figure 1 [39,40]. The AA has been reported to show an improved performance under a pH range of 8.0 - 8.5 and contrary to SBA, ions such as SO42–, F–, HCO3–, and NO3– showed no significant effect on AA [38,41,42].
This present research aims to address the critical knowledge gap by exploring the effectiveness of AA and IX resins as pretreatment methods for the removal of hardness and silica from ROC, to reduce its scaling potential for further membrane treatment to achieve ZLD and brine valorization (Figure 2).
2. Materials and Methods
2.1. Water Source
The ROC was collected from the Kay Bailey Hutchinson Desalination Plant (KBHDP) in El Paso, Texas, and characterized for major ions, total hardness, alkalinity, pH, and electrical conductivity, as shown in Table 2. Major ions were determined using an ion chromatograph (IC, ICS-2100, Dionex, Sunnyvale, CA). Dissolved organic carbon concentration (DOC) was measured using a carbon analyzer (Shimadzu TOC-V, Kyoto, Japan). The total hardness was calculated from Ca2+ and Mg2+ concentrations. The alkalinity was measured by titration to a pH 4.6 endpoint using sulfuric acid (0.02 N) as titrant and methyl orange as indicator. Silica concentration was determined following the procedure described in Hach method #8185 and samples were analyzed using a spectrophotometer (DR6000; Hach Company, Loveland, CO, USA). The pH and the electrical conductivity (EC) were measured using a pH meter and a conductivity meter, respectively.
2.2. Ion Exchange Resins
2.2.1. Experimental Procedure
For silica removal, the two IX resins selected for testing were recommended by the manufacturers: including AmberLite™ IRA402 Cl (denoted as SRIX-1) and Purolite® A504P (designated as SRIX-2). Both SRIX-1 and SRIX-2 were preconditioned to change their ionic form from Cl- to OH- using 1 M NaOH for 48 h, which is typically used for silica removal [42]. The three selected IX resins for hardness removal were recommended by the manufacturers due to their high total exchange capacity, including AmberLite™ IRC83 H (denoted as HRIX-1), Purolite® SSTPPC60 (denoted as HRIX-2, which was also previously tested by Thomson, et al. [46] for desalination pilot testing), and ResinTech WACG (denoted as HRIX-3). HRIX-1 and HRIX-3 were preconditioned to change the ionic form from H+ to Na+ using 1 M NaOH for 48 h to prevent acidification during operation. The primary physical and chemical properties and recommended operational conditions of the IX resins used are listed in Table 3.
Isotherm studies were conducted at IX resin doses of 2.5, 5, 25, 50 and 100 g/L. 250 mL polyethylene bottles with 200 mL of a mixture of ROC and resins were placed in a shaker (200 RPM) for 24 h. The batch test was conducted at room temperature (~25 ºC), while the pH was kept at 8.5. Water samples were taken from each bottle after 24 h for water quality analysis.
Based on the results of batch experiments, SRIX-2 and HRIX-2 were selected to evaluate silica and hardness removal, respectively, in column experiments. Both resins were soaked in DI water for 24 hours to attain their final size before column filling. Glass wool was placed at the bottom of 50 mL burettes to avoid loss of resin. Column operation was divided into service cycles, which consisted of column operation until resin saturation, backwash, regeneration, and DI water rinse. Feedwater was pumped down-flow through the burette. The ROC pH was adjusted to 4.5 for the silica removal column operation using SRIX-2 to avoid polymerization [18], while it was kept at 8.5 for the hardness removal using HRIX-2. The columns were operated until resin saturation to determine the breakthrough curve. Backwash was conducted, when necessary, for a duration of 5 min to prevent the accumulation of particles in the burette. Regeneration was applied using 2% NaOH solution for SRIX-2 [37], and 8% NaCl solution for HRIX-2 [33,48]. After regeneration, the column was rinsed using a DI water volume of 5 BV. Multiple effluent samples were taken during column operation and regeneration to develop breakthrough and regeneration curves. The operating parameters for column testing are summarized in Table 4.
Experimental results for the performance of all the IX resins were adjusted to the linearized equation of Langmuir model (Equation (6)). This model is applicable to monolayer sorption onto homogeneous surface with a finite number of identical sites [49].
where, Ce is the equilibrium concentration of silica (mg/L) or hardness (mg/L as CaCO3) in solution, qe is the amount of adsorbed silica (mg SiO2/g of resin) or hardness (mg CaCO3/g of resin) at equilibrium, qmax is the maximum amount of monolayer silica (mg SiO2/g of resin) or hardness (mg CaCO3/g of resin) adsorption, KL is the Langmuir constant, related to the affinity of the adsorbate to the binding sites. Both qmax and KL are calculated from the intercept and slope values, respectively (Table 6 and Table 8).
2.3. Silica Removal by Activated Alumina
2.3.1. Experimental Procedure
In this study, three types of AA (CPN, DD-6 and DD-2) manufactured by BASF were evaluated at bench scale for silica removal from the ROC. CPN was denoted as AA-1, DD-6 was denoted as AA-2, and DD-2 was denoted as AA-3. AA-1 is a granular adsorbent suitable for a wide range of adsorption applications for impurities removal. AA-2 is known as a peroxide grade alumina and has an exceptionally high surface area of alumina developed specifically for service in hydrogen peroxide production. AA-3 is a calcinated and rehydrated alumina powder that has been proven for many catalyst applications. The chemical composition of AA is shown in Table 5.
2.3.2. Batch and Column Testing Using Activated Alumina
For the batch adsorption experiments, different concentrations of each AA type (2.5, 5, 25, 50 and 100 g/L) were added to 250 mL polyethylene bottles with 200 mL of ROC. The pH was not adjusted, and the test was conducted at room temperature (~25 ºC). Water samples were taken from each bottle after 24 h for water quality analysis. Experimental results for the performance of the different AA tested were adjusted to the linearized equation of Langmuir model (Equation (6)).
Based on the results of batch experiments, AA-1 and AA-2 were selected to evaluate silica removal in column experiments. The column preparation and the service cycle operation of the columns were conducted as described in Table 4. Regeneration or elution experiments were divided into two studies: regeneration in batch and regeneration in column. For regeneration in batch, 1 gram of AA previously used for adsorption experiments was added to 50 mL of regenerant and placed in a shaker. Various regenerants were tested including NaOH [36,42,50,51,52], H2SO4 [7,50,51], and HCl [53,54] under different conditions of concentration, temperature, and contact time.
Additionally, AA-2 was used to test the adsorption capacity with synthetic high salinity water. These experiments were performed in batch and the synthetic high salinity water was prepared by dissolving lab grade Na2SiO3 in DI water to mimic the silica concentration in ROC of 160 mg/L. Then lab grade NaCl was added to achieve brine solutions with concentrations of 5, 10 and 20% (w/v). Different concentrations of AA-2 (2.5, 5, 25, 50 and 100 g/L) were added to 250 mL polyethylene bottles with 200 mL of the 5, 10 and 20% NaCl solutions. The pH (~ 9.5) in the synthetic high salinity water was not adjusted, and the test was conducted at room temperature (~25 ºC). Water samples were taken from each bottle after 24 h to evaluate the silica concentration. Results were adjusted to the linearized equation of Langmuir model (Equation (6)).
2.4. Modeling Methodology
The effluents from both column operation processes using AA to remove silica (using AA-2) and IX resins to remove hardness (using HRIX-2) were characterized to obtain the major cations and anions, as well as hardness, alkalinity, and silica concentrations. This data was grouped into two pretreatment trains: ROC treated only by AA (denoted as AA effluent) and ROC treated by AA and IX (denoted as AA + IX effluent); both effluents concentrations were compared to the initial ROC concentrations (Table 2) to develop an empirical model to study the influence of ROC pre-treatment on overall water recovery. Initially, the water stability was analyzed using OLI Studio 12.0 as shown in Table S1 (Supplementary Information, SI), following the methodology proposed by Lencka, et al. [55]. Experimentally obtained alkalinity concentration was amended according to the pH of the solution, and the hardness of the solution was subsequently calculated according to the Ca2+ and Mg2+ concentrations. The charge imbalance was neutralized by increasing the concentrations of either Na+ or Cl-, depending on whether cations or anions were dominant when calculating the change of the solution. These ions were selected due to their abundance in the solution and the negligible impact on the pre-treatment process. The adjustments made to the Na+ or Cl- concentrations during the charge balancing process resulted in changes of less than 40 mg/L from their original concentrations. After establishing a stable water profile, the effect of the pretreatment on water recovery was investigated by simulating a high recovery brackish water RO system at 30 °C and 100 gallons per minute (GPM, or 378.5 liters per minute) using AdvisorCi [56]. The present study investigates the compounds that form scales under three different recovery levels using two antiscalants, namely VitecTM 7400 and VitecTM 1070. In addition to experimentally obtained water quality data, 11 different synthetically modeled water types prepared using OLI Studio 12.0 (SI, Table S2) were tested under the same conditions using Avista AdvisorCi to evaluate the water recovery.
The maximum water recovery at various silica (SiO₂) and hardness concentrations was modeled using a second-degree polynomial regression (Equation (7)). The water recovery values obtained from Avista AdvisorCi and the predictions from the regression model showed good agreement, with a mean squared error of 0.463 and R2 of 0.97, indicating close alignment between the predicted and actual values (SI, Figure S3). This model was developed utilizing the SciPy libraries in Python [57]. A regression model was also employed to estimate treatment costs, providing further insights into the effects of pre-treatment.
where y is the water recovery (in %) using high recovery brackish water RO, x1 is the SiO2 concentration (in mg/L), and x2 is the hardness of the RO feed solution (in mg/L as CaCO3).
The tecno-economic analysis was conducted utilizing the data available in the WaterTAP (Table S3) [58]. The levelized cost of water (LCOW) was calculated by considering the operational, capital, and regeneration costs associated with IX and AA treatment processes. The calculation framework follows a systematic approach, beginning with the estimation of the total water volume processed per day derived from the flow rate. Various treatment fractions for AA and IX are considered to evaluate different operational scenarios. Water quality parameters, such as silica and hardness concentrations, are computed based on the proportion of water treated by each process. The total cost is calculated by integrating multiple cost elements, including operational costs for IX and AA, regeneration costs associated with the IX system, capital expenditures for treatment infrastructure, and reverse osmosis (RO) processing costs. Additionally, disposal costs are factored in based on the fraction of water that is not recovered. The total cost is expressed as a function of these factors using the equation:
The net cost was obtained by taking the difference between the total cost and the revenue generated via RO permeate in potable water use.
3. Results
3.1. Silica Removal by Ion Exchange Resins
3.1.1. Isotherm Experiments
Experimental results for the performance of SRIX-1 and SRIX-2 were adjusted to the linearized equation of Langmuir model. Both qmax and KL are calculated from the intercept and slope values (SI, Figure S1a), respectively (Table 6). SRIX-2 demonstrated a higher maximum adsorption capacity (qmax of 19.65 mg/g) compared to SRIX-1, which reflects its superior ability to capture silica from the ROC. The Langmuir constant KL of 0.0101 further indicates a relatively strong affinity between SRIX-2 and silica in the ROC.

Table 6.
Langmuir parameters for IX and AA isotherm experiments for silica removal.
| IX resin | AA using ROC | AA-2 using high salinity synthetic water | ||||||
|---|---|---|---|---|---|---|---|---|
| SRIX-1 | SRIX-2 | AA-1 | AA-2 | AA-3 | 5% NaCl | 10% NaCl | 20% NaCl | |
| qmax (mg/g) | 12.44 | 19.65 | 625.00 | 322.58 | 238.10 | 312.5 | 357.14 | 294.12 |
| KL | 0.0231 | 0.0101 | 0.0012 | 0.0025 | 0.0016 | 0.0004 | 0.0004 | 0.003 |
3.1.2. Continuous Column Testing OF Silica Removal From ROC
Based on the batch experimental results, SRIX-2 was selected for continuous-flow column testing to evaluate the impact of empty bed contact time and regeneration effectiveness.
The results for three service cycles (#1, #2, and #3) are shown in Figure 3, where CO and R stand for column operation and regeneration, respectively. Silica breakthrough was measured after three bed volumes (BV) for CO #1 and #2, with full resin saturation after 5 BV. However, CO#3 shows silica breakthrough after 1 BV.
The ionic form of SRIX-2 was initially changed from Cl- to OH- using a 1 M NaOH solution, therefore the pH of ROC that was previously adjusted to 4.5, increased to ~10-13 during the first two BV of the CO. However, the pH quickly decreased to ~7 at BV 5; this could suggest the change of the resin’s ionic form to OH- was not fully achieved. Figure 3a shows silica removal declined as the pH decreased. Silicic acid (H3SiO4–) has a pKa of 9.84, therefore at pH < 9, the dominant silica specie in water is orthosilicic acid (Si(OH)4), which is a neutral compound that does not participate in the ion exchange process [36,49]. In the past, silica removal using SBA resins has also been reported to be affected by the competition of other ions in water, like SO42- and Cl- [38,59], which have high concentrations in ROC (Table 2).
Additionally, the elution was drastically reduced after R #1 (practically no silica elution during R #2 and #3), which suggests SRIX-2 loses its removal capacity after one operation cycle. Low regeneration efficiency in anion exchange resins is attributed to the polymerization of H3SiO4– when it binds to the OH⁻ ion in the resin bead; this polymerization transforms H3SiO4– into dimeric and polymeric species, which are more challenging to desorb during regeneration compared to monomeric species [37].
In summary, at pH lower than the orthosilicic acid (H4SiO4) pKa of 9.84, silica is present in the non-ionized form which causes low silica selectivity for IX in ROC. An alternative to increase the performance of SBA resins could be to adjust the pH>9.8 which will cause operational costs to increase.
3.2. Silica Removal by Activated Alumina
3.2.1. Isotherm Experiments
The experimental results for the performance of the three different AA were fitted to the linearized equation of Langmuir model (Equation (6)) (SI, Figure S2). Both qmax and KL were calculated from the intercept and slope values, respectively (Table 6).
Among the activated alumina tested, AA-1 showed the highest adsorption capacity (qmax = 625 mg/g), indicating its strong potential for removing large amounts of silica from ROC. This makes AA-1A ideal for high-salinity environments where silica concentrations are particularly high. AA-2, with a moderate capacity (qmax = 322.58 mg/g) also demonstrated the highest affinity (KL = 0.0025) for silica. This suggests that AA-2 could be more effective in systems with shorter contact times, where quick adsorption is critical. AA-3 had the lowest capacity (qmax = 238.1 mg/g) and affinity, making it less efficient than AA-1 and AA-2. Both AA-1 and AA-2 were selected for column experiments following the methodology described in Table 4.
The experiments using synthetic high salinity water achieved a qmax of 312.5, 357.14 and 294.12 using the 5%, 10%, and 20% NaCl solution, respectively (Table 6). The results did not show a significant effect on the adsorption capacity of AA-2 for the ROC with TDS of ~12 g/L (~1.2%). These findings suggest that the AA could be used as a silica adsorbent under high salinity environments, e.g. seawater ROC or brine concentrator effluents.
Additional adsorption experiments were conducted to saturate AA-1 and AA-2 and test the effect of different regeneration conditions. The results for the regeneration/elution batch experiments are shown in Table 7.
The highest adsorption capacity of 59 mg SiO2/g AA was obtained with AA-2 (7 batches of 1 h, at ambient temperature, adsorbent dose of 10 g/L and magnetic stirrer of 350 RPM). This value is similar to 50 mg/g reported by Sanciolo, et al. [42] after 5 batches. Bouguerra, et al. [41] evaluated the effect of pH, adsorbent dose, temperature, and another ions competition using synthetic water (silica concentration of 50 mg/L). According to their results, the maximum silica removal of 90% was achieved at 2.5 g of AA. In comparison, Sanciolo, et al. [42] conducted batch experiments using ROC (silica concentration of 160 mg/L), achieving 71.9% of silica removal when AA was added at a dose of 10 g/L, for 60 min, under the temperature of 20 °C.
The regeneration of AA-1 was evaluated in batches of 1 h using NaOH (2%, 8%, and 10%), H2SO4 (0.1 N) and a combined batch between 2% NaOH and 0.1 N H2SO4. The highest regeneration percentage (10.1%) was achieved after three batches of H2SO4, followed by the combined batch between 2% NaOH and 0.1 N H2SO4 with a regeneration efficiency of 4.5%. Several studies [36,42,50,51,52] have reported partial (70-90%) or full regeneration using NaOH, however in this study, NaOH did not produce silica elution.
Additionally, regeneration for AA-2 was tested using NaOH (2%, 6%, and 8%), H2SO4 (0.1 N), a combined batch between 2% NaOH and 0.1 N H2SO4 [7] (with DI water rinse between the base and acid) and HCl (0.05, 0.1 and 1 N). In this case, NaOH was tested under different temperatures (25 and 50 °C) and contact time (1, 12 and 24 h) to evaluate the effect on silica elution. However, no regeneration was achieved. 0.1 N H2SO4 experiment and the combined batch between 2% NaOH and 0.1 N H2SO4 showed a regeneration of 10.4% and 5.3%, respectively. Different concentrations of HCl were tested, where 1 N HCl obtained the highest percentage removal of 19.8%. Some other conditions were evaluated for regeneration using HCl, such as different contact time and temperature, where the highest regeneration percentages were 22.8% after three 12 h batches and 26.6% after three 1 h batches at 60 °C. Nevertheless, such conditions are difficult to provide in a continuous column operation, therefore 0.1 N HCl (which achieved a slightly higher regeneration percentage of 10.7% compared to 0.1 N H2SO4) and 1 N HCl were selected as regenerants for the column operation. Although some studies in literature have reported AA was successfully regenerated using NaOH and H2SO4 [7,36,38], our experimental procedure did not achieve regeneration during the treatment of brackish water ROC. As mentioned before, the polymerization of H3SiO4– hinders the complete elution due to longer molecules that are more challenging to desorb [37].
3.2.2. Continuous Column Testing of Silica Removal from ROC
For this experiment, results for the column operation using AA-1 and AA-2 are shown in Figure 4. Figure 4a shows silica breakthrough starting after 37 BV and an average silica concentration in effluent remained at 58 mg/L (average removal of 65%) between 200 and 1200 BV using AA-1. Instead, silica breakthrough using AA-2 started at 45 BV with an average silica concentration in effluent of 60 mg/L and SiO2 removal of 45.3%. Due to the long duration of the column experiments, both columns were stopped at 870 BV. The final silica concentration in the effluent was 88 mg/L (removal 45% and adsorption capacity 217.5 mg/g) for AA-1, and 108 mg/L (removal 32% and adsorption capacity 148.2 mg/g) for AA-2. However, according to the qmax values, the saturation point for AA-1 and AA-2 is at 2500 BV and 1894 BV. Sasan, et al. [47] conducted a column experiment using calcinated hydrotalcite and powder AA as media, which was operated over 100 h with an average silica adsorption capacity of 34 mg/g. To the best of our knowledge, there are no other reported studies using AA in continuous column experiments. After column operation was concluded, regeneration using 1N and 0.1N HCl solutions was applied to AA-2.
Before testing using the 1N HCl solution for regeneration, 0.1N HCl was tested for 11 BV; however, the regeneration percentage achieved was negligible (<1% elution). The results of column regeneration using 1N HCl for AA-2 are shown in Figure 5.
After 80 BV, the regeneration percentage achieved was 16%. Compared to the results from silica removal using IX resins (Figure 3), both column operations of AA-1 and AA-2 were significantly longer, which can be attributed to higher capacity and major affinity for neutral silica species [36,42]. Nevertheless, regeneration was not easily achieved. For example, considering the regeneration follows a linear behavior, it would take 496 L of 1 N HCl to accomplish a full regeneration for 1 L of resin under the same operational conditions. These results show that while AA effectively removes silica from ROC, its regeneration remains a challenge for treating the ROC from the KBHDP. At pH 8.5 and saturation level, silica in KBHDP ROC can exist as polymerized colloidal silica. These long chains of individual silica molecules exhibit virtually no charged ionic character and cannot be easily removed during regeneration. In addition, colloidal silica can be associated with Ca and Mg in ROC to form complex inorganic compounds, which cause lower adsorption selectivity and difficulty in regeneration. Further refinement of regeneration techniques or alternative approaches is needed to enhance the efficiency and viability of AA in industrial settings.
3.3 Hardness Removal by IX Resins
3.3.1. Isotherm Experiments
The experimental results for hardness removal by HRIX-1, HRIX-2 and HRIX-3 were fitted to the linearized equation of Langmuir model. Both qmax and KL are calculated from the intercept and slope values (SI, Figure S1b), respectively (Table 8).
Table 8.
Langmuir parameters for IX isotherm experiments for hardness removal.
| IX resin | |||
| HRIX-1 | HRIX-2 | HRIX-3 | |
| qmax (mg/g) | 133.33 | 129.87 | 101.01 |
| qmax (eq/L) | 3.23 | 3.12 | 1.56 |
| KL | 0.0019 | 0.0012 | 0.0013 |
HRIX-1 showed the highest qmax of 133.33 mg/g and KL of 0.0019 compared to HRIX-2 and HRIX-3, which reflects a stronger interaction between IX resin surface and the hardness concentration in ROC. The qmax (eq/L) values using HRIX-1, HRIX-2, HRIX-3 correspond to 68.1%, 68.4%, and 37.1%, respectively, of the total exchange capacity reported by the product data sheet of each resin (Table 3). Both HRIX-2 and HRIX-3 were preconditioned to change their ionic form from H+ to Na+. HRIX-3 is commercially available in the ionic form of Na+, of which total exchange capacity is reported as 2 eq/L. To our knowledge, HRIX-1 is not available in Na+ ionic form. HRIX-1 and HRIX-2 were selected for column experiments following the methodology described in Table 4.
3.3.2. Continuous Column Testing of Hardness Removal from ROC
Figure 6a and 6b show the column operation results of HRIX-1 and HRIX-2 to compare the hardness breakthrough in terms of BV. Hardness was completely removed from ROC until hardness breakthrough started at 19 BV for HRIX-1 and 11 BV for HRIX-2; the IX resin was fully saturated at 33 BV for HRIX-1 and 17 BV for HRIX-2. The adsorption capacity was 98.25 g CaCO3/L resin and 65.32 g CaCO3/L resin for HRIX-1 and HRIX-2, respectively.
On the other hand, pH remained slightly basic and without high variability for HRIX-2, while HRIX-1 presented pH values slightly acidic. This could be due to incomplete preconditioning of its ionic form from H+ to Na+. Figure 6c and 6d show the regeneration curve is broader for HRIX-1 than HRIX-2, which means the regeneration efficiency is lower. Both columns were fully regenerated after 20 and 17 BV, respectively.
HRIX-2 was selected to repeat column experiments because it does not require preconditioning, with a broader pH operation range (Table 3), and a shorter regeneration curve (equal to lower chemical demand) compared to HRIX-1.
The results in Figure 7 show the averages for three service cycles using HRIX-2. Figure 7a shows hardness breakthrough started after 10 BV, and the resin was fully saturated after 17 BV, which is consistent with Figure 6b. The total capacity of the resin was 65.63 g CaCO3/L resin when it was completely saturated. The regeneration curve (Figure 7b) showed more variability between cycles, with a complete regeneration after 15 BV.
Thomson, et al. [46] conducted column experiments to determine if the TDS concentration affects the column operation performance of a SAC. Three different TDS concentrations were tested including low, medium and high corresponding to 5,900, 28,800 and 52,600 mg/L, respectively. The BV to saturation reduced drastically from 65 for the low TDS water to 6 for the high TDS brine. It was concluded that the divalent selectivity of the IX resin significantly decreases when the TDS in the feed is higher than 10,000 mg/L, compromising its performance. In our study, the TDS concentration of the ROC was 12,445 mg/L and the column saturation was quickly achieved (with an average 25 BV) using two different SAC resins (HRIX-1 and HRIX-2). This behavior in SAC resins is explained as the molecules in water are more “organized” when the TDS concentration increases, which makes it harder for polyvalent ions (such as Ca2+ and Mg2+) to move forward the resin beads, reducing its effectiveness [60]. On the other hand, Janson, et al. [44] tested three different WAC resins using a synthetic feed with TDS of 8,093 mg/L. The saturation in the columns was achieved at 1,922, 2,577 and 3,232 BV (average value of 2,577 BV), such values are significantly higher compared to the saturation point using SAC. However, even when the performance of WAC resins is less affected by high TDS in water; the hardness removal could be incomplete since WAC resins cannot remove noncarbonate hardness, contrary to the SAC resins that remove carbonate and noncarbonate hardness equally [44,60].
The column operation of SAC and WAC and the water chemistry (specifically TDS and hardness concentrations) reported in literature and obtained in this study (Table 1) were used to plot Figure 8. These data were used to compute the Pearson correlation coefficient between the TDS in the feed and the number of BV to saturation, finding a moderate negative correlation which implies that higher TDS concentrations lead to faster resin saturation.
3.4. Modeling Results and Preliminary Cost Analysis
The water stability analysis of the ROC and AA effluent demonstrated that, despite a slight decrease, the water maintained a density of 1.006 g/mL. However, the ionic strength of the solution increases by 0.004 mol/kg (m-based) because of the removal of 150 mg/L of SiO2. The density and ionic strength of the IX feed and IX effluent solutions do not differ significantly (less than 1%), which can be attributed to replacing Ca2+ and Mg2+ ions with Na+ ions during the IX process. The RO simulation conducted using Avista AdvisorCi illustrated silica in ROC, presented as Ca3Si2O6(OH)2.2H2O and Mg3Si2O5(OH)4, exhibit a higher scaling tendency, leading to maximum water recovery of 64%, and 4% using Vitec 7400 and 1070 respectively (Table 9).
Water recovery increases from 64% to 75% and from 4% to 75% utilizing Vitec 7400 and 1070, respectively, with the removal of 94% of silica, demonstrating that Vitec 7400 is more effective at preventing silica scaling than Vitec 1070 (Table 9). Despite this improvement, water recovery is still limited by gypsum scaling (CaSO4). An additional 5% increase in water recovery, reaching a total of 80%, can be achieved by removing 65% of hardness (as CaCO3), which leads to the scaling of silica species (Table 9).
The maximum water recovery using Vitec 7400 was used to develop the empirical model (Equation (7)). Analysis of water recovery at different silica and hardness concentrations (Figure 9) suggests that reducing hardness below 1000 mg/L (as CaCO3) can further enhance recovery. Additionally, a silica concentration below 50 mg/L is identified as the optimal condition for maximum water recovery. A notable decrease in water recovery is observed when hardness exceeds 2500 mg/L (as CaCO3) and silica exceeds 150 mg/L, indicating that recovery efficiency is significantly (~9%) compromised beyond these thresholds.
Using the available empirical water recovery model, a water treatment cost estimation (SI, Table S3) was performed by blending ROC, AA effluent, and IX effluent waters at different compositions (Figure 10a). The ROC feed water enters the system at a flow rate of 100 GPM (378.5 liters per minute), resulting in a treatment capacity of 0.144 MGD. For this analysis, the silica concentration in the AA effluent is set at 10 mg/L, and the hardness of the IX effluent is assumed to be 980 mg/L as CaCO3.
As expected, water recovery gradually increases as the proportion of water treated by AA and IX increases (Figure 9). Concurrently, when examining treatment costs at varying levels of pretreatment (SI, Figure S4a), a consistent relationship emerges between silica/hardness concentrations and total treatment cost. As the water recovery increases (Figure 9), the pretreatment cost increases linearly (Figure 10b). Hence, the lowest net costs are achieved when both AA and IX are maximized (Figure 10b), such that when the water recovery increased by 6% via treating the ROC with IX and AA, the estimated cost increases of $0.63/kgal and $0.21/kgal ($0.166 to 0.055/m3), respectively (Figure 10c). However, the revenue gained through additional RO permeate production—along with reduced ROC disposal costs and lower antiscalant dosing—offsets the expense of pretreatment (Figure 10b). As a result, treating ROC with IX and AA will reduce the levelized cost of ROP production by $0.73/kgal ($0.192/m3) after compensating for the pretreatment cost (Figure 10b). Overall, the pretreatment accounts for ~25% of total treatment costs, which remains cost-effective due to improved water recovery and the corresponding additional revenue from enhanced permeate production. Additionally, the IX demonstrates significant cost competitiveness with an LCOW of $0.17/m3, making it more economical compared to chemical precipitation at $1.38/m3 and coagulation at $0.87/m3 when treating ROC (estimated based on our previous studies using WaterTAP modeling).
4. Conclusions
The objective of the study was to evaluate the effectiveness of AA and IX resins as pretreatment methods for the removal of hardness and silica from brackish water ROC. The conclusions are enlisted below:
4.1. Silica removal by IX
- From the isotherm experiments using SBA, the highest qmax (19.65 mg/g) was achieved by SRIX-2.
- Silica removal stopped after 5 BV during the three service cycles of the column operation of SRIX-2, while silica elution was not achieved after the first regeneration.
- Silica removal decreased as the pH decreased due to the silica speciation in water. The dominant species of silica at pH <9 is orthosilicic acid (Si(OH)4), which is a neutral compound that does not participate in the ion exchange process.
- The low regeneration efficiency in SBA had been attributed to the polymerization of H3SiO4– when it binds to the OH⁻ ion in the resin bead, which makes it more challenging to desorb.
4.2. Silica removal by AA
- The different types of AA showed higher silica removal efficiency compared to SBA resins. AA-1 achieved the highest qmax = 625 mg/g in isotherm experiments using ROC.
- The impact of salinity on the AA-2 performance was minimal, as demonstrated by an average qmax of 321.25 mg/g across synthetic solutions with salinity levels 5–20% NaCl, which confirms its effectiveness as a silica adsorbent in high-salinity environments.
- The column experiments of AA-1 and AA-2 were paused at 870 BV without achieving saturation. The adsorption capacity values reached 217.5 mg/g and 148.2 mg/g for AA-1 and AA-2, respectively.
- Despite the higher silica removal and the longer column operation of AA compared to SBA, the regeneration of AA-2 was barely accomplished (~ 23% of regeneration) after multiple regeneration experiments using NaOH, H₂SO₄, and HCl at different concentrations.
4.3. Hardness removal by IX
- The isotherm experiments using the three types of SAC resins showed the highest qmax (133.33 mg/g) achieved by HRIX-1.
- During the column operation of HRIX-1 and HRIX-2, saturation was reached after 17-33 BV with an adsorption capacity of 98.25 g CaCO₃/L resin and 65.32 g CaCO₃/L resin for HRIX-1 and HRIX-2, respectively.
- The results of the three service cycles suing HRIX-2 were consistent, showing an average total capacity of 65.63 g CaCO₃/L resin and full saturation reached at 17 BV. There was not observed regeneration loss between cycles since regeneration was consistently completed after 15 BV. However, the frequent and high regenerant requirement (15-20 L/L of resin using 8% NaCl) makes it unfeasible for long-term and full-scale applications.
- The SAC performance showed a moderate negative correlation between TDS concentration and the number of BV to saturation (Figure 8). Higher TDS concentrations impact negatively resin performance due to reduced divalent ion selectivity.
4.4. Secondary RO modeling to calculate water recovery
- The empirical modeling results indicate that, even with the addition of Vitec 7400 antiscalant, the maximum water recovery is limited to 64% of the KBH ROC effluent in the absence of pretreatment.
- In the presence of AA, the water recovery increases to 75% by reducing the silica concentration to 10 mg/L.
- ROC water recovery can be further enhanced to 80% when the AA effluent is treated using IX, regardless of the antiscalant type used.
- The revenue generated from the additional RO permeate is capable of offsetting the capital and operational costs associated with the AA, IX, and secondary RO systems.
These findings suggest that IX resins and AA could provide promising pretreatment for ROC treatment. However, their scalability for large-scale implementation need to overcome the challenges such as high regeneration demands due to presence of high concentrations of hardness and silica as well as TDS. Future research should focus on alternative materials and methods that address the specific limitations identified in this study, including weak anion exchange resin, combining unit processes (e.g., chemical precipitation + IX) or integrating pretreatment approaches with resource recovery techniques. Due to low regeneration efficiency, the dispensed AA saturated with silica could be recycled and reused for other applications such as desiccant for moisture removal, in petroleum industry for air and gas purification. These recommendations emphasize the necessity of developing innovative and scalable solutions to improve water recovery and reduce environmental impacts associated with waste disposal.
Supplementary Materials
The following supporting information can be downloaded at the website of this paper posted on Preprints.org. Figure S1: (a) Isotherms of SRIX and (b) Isotherms of HRIX using ROC; Figure S2: Isotherms of AA using ROC and synthetic high salinity water; Table S1: The water quality profile obtained experimentally (Exp.) and the amended water profile generated using the OLI Studio 12.0 software (Model); Table S2: Synthetically prepared water profile with partial removal of SiO2 and hardness obtained from OLI Studio 12.0 software; Figure S3: The water recovery values obtained from Avista AdvisorCi (Actual water recovery) vs. the predictions from the regression model fitted using polynomial features (Eq (1)) are plotted in blue dots. The red line shows the perfect correlation (if the R2=1) between the predicted and actual values; Table S3: The cost estimation of the elements in the treatment train Figure 10A and the income obtained from selling ROP. For the cost analysis, ROC disposal cost and the cost of antiscalant were also included; Figure S4:(a) The total expenses and (b) the revenue generated by selling ROP when treating ROC feed with AA and IX at different volumes (MGD).
Author Contributions
Conceptualization, C.M-S., Z.S., P.S., P.X., and H.W.; methodology, C.M-S., Z.S., P.S., P.X., and H.W.; software, C.M-S., Z.S., P.S.; validation, C.M-S., Z.S., P.S., P.X., and H.W.; formal analysis, C.M-S., Z.S., P.S.; investigation, C.M-S., Z.S., P.S., P.X., and H.W.; resources, C.M-S., Z.S., P.S., P.X., and H.W.; data curation, C.M-S., Z.S., P.S.; writing—original draft preparation, C.M-S., Z.S., P.S., P.X., and H.W.; writing—review and editing, C.M-S., Z.S., P.S., P.X., and H.W.; visualization, C.M-S., P.S.; supervision, P.X. and H.W.; project administration, P.X. and H.W.; funding acquisition, P.X. and H.W. All authors have read and agreed to the published version of the manuscript.
Funding
This research was funded by the U.S. Bureau of Reclamation, grant number R21AC10338, and the National Alliance for Water Innovation (NAWI), funded by the U.S. Department of Energy, Office of Energy Efficiency and Renewable Energy (EERE), Industrial Efficiency and Decarbonization Office, under Funding Opportunity Announcement DE-FOA-0001905. The views expressed herein do not necessarily represent the views of the U.S. Department of Energy, U.S. Bureau of Reclamation, or the United States Government.
Data Availability Statement
Further data inquiries can be directed to the corresponding author.
Conflicts of Interest
The authors declare no conflicts of interest.
References
- Y. D. Ahdab and J. H. Lienhard, "Chapter 41 - Desalination of brackish groundwater to improve water quality and water supply," in Global Groundwater, A. Mukherjee, B. R. Scanlon, A. Aureli, S. Langan, H. Guo, and A. A. McKenzie Eds.: Elsevier, 2021, pp. 559-575.
- X. Xu et al., "Analysis of Brackish Water Desalination for Municipal Uses: Case Studies on Challenges and Opportunities," ACS ES&T Engineering, vol. 2, no. 3, pp. 306-322, 2022/03/11 2022. [CrossRef]
- S. K. Patel, P. M. Biesheuvel, and M. Elimelech, "Energy Consumption of Brackish Water Desalination: Identifying the Sweet Spots for Electrodialysis and Reverse Osmosis," ACS ES&T Engineering, vol. 1, no. 5, pp. 851-864, 2021/05/14 2021. [CrossRef]
- B. Tashtoush, W. e. Alyahya, M. Al Ghadi, J. Al-Omari, and T. Morosuk, "Renewable energy integration in water desalination: State-of-the-art review and comparative analysis," Applied Energy, vol. 352, p. 121950, 2023/12/15/ 2023. [CrossRef]
- S. Kum, X. Tang, and H. Liu, "Recovery of fresh water and minerals from inland brackish desalination brine via persulfate-based photochemical treatment and demineralization," Separation and Purification Technology, vol. 342, p. 126994, 2024/08/21/ 2024. [CrossRef]
- V. Felix, M. Hardikar, and K. L. Hickenbottom, "Concentrate circularity: A comparative techno-economic analysis of membrane distillation and conventional inland concentrate management technologies," Desalination, vol. 574, p. 117213, 2024/04/06/ 2024. [CrossRef]
- R. Bond and S. Veerapaneni, Zero liquid discharge for inland desalination. Awwa Research Foundation, 2007.
- Giwa, A.; Dufour, V.; Al Marzooqi, F.; Al Kaabi, M.; Hasan, S.W., "Brine management methods: Recent innovations and current status," Desalination, vol. 407, pp. 1-23, 2017/04/01/ 2017. [CrossRef]
- Panagopoulos, A. "Brine management (saline water & wastewater effluents): Sustainable utilization and resource recovery strategy through Minimal and Zero Liquid Discharge (MLD & ZLD) desalination systems," Chemical Engineering and Processing - Process Intensification, vol. 176, p. 108944, 2022/06/01/ 2022. [CrossRef]
- M. Mickley. US Municipal Desalination Plants. Available: https://www.multi-statesalinitycoalition.com/wp-content/uploads/2020-Mickley.pdf.
- CRS, "Desalination and Membrane Technologies: Federal Research and Adoption Issues," Congressional Research Service, 2015. [Online]. Available: https://crsreports.congress.gov/product/pdf/R/R40477.
- G. Oron, S. Appelbaum, and O. Guy, "Reuse of brine from inland desalination plants with duckweed, fish and halophytes toward increased food production and improved environmental control," Desalination, vol. 549, p. 116317, 2023/03/01/ 2023. [CrossRef]
- Matin, A.; Rahman, F.; Shafi, H.Z.; Zubair, S.M. "Scaling of reverse osmosis membranes used in water desalination: Phenomena, impact, and control; future directions," Desalination, vol. 455, pp. 135-157, 2019/04/01/ 2019. [CrossRef]
- P. Xu, T. Y. Cath, A. P. Robertson, M. Reinhard, J. O. Leckie, and J. E. Drewes, "Critical Review of Desalination Concentrate Management, Treatment and Beneficial Use," Environmental Engineering Science, vol. 30, no. 8, pp. 502-514, 2013. [CrossRef]
- Panagopoulos, A.; Haralambous, K.-J.; Loizidou, M. "Desalination brine disposal methods and treatment technologies - A review," Science of The Total Environment, vol. 693, p. 133545, 2019/11/25/ 2019. [CrossRef]
- Lugo, A. et al., "Technical, economic, energetic, and environmental assessment of pretreatment technologies for scaling and fouling minimization: Part I – Treatment of brackish water desalination brine," In progress, 2024.
- P. Sanciolo et al., "Enhancement of reverse osmosis water recovery using interstage calcium precipitation," Desalination, vol. 295, pp. 43-52, 2012/06/01/ 2012. [CrossRef]
- Y.-M. Park, K.-M. Yeon, and C.-h. Park, "Silica treatment technologies in reverse osmosis for industrial desalination: A review," Environmental Engineering Research, vol. 25, no. 6, pp. 819-829, 12 2020. [CrossRef]
- S. E. H. Comstock, T. H. Boyer, and K. C. Graf, "Treatment of nanofiltration and reverse osmosis concentrates: Comparison of precipitative softening, coagulation, and anion exchange," Water Research, vol. 45, no. 16, pp. 4855-4865, 2011/10/15/ 2011. [CrossRef]
- R. Ordóñez, A. Moral, D. Hermosilla, and Á. Blanco, "Combining coagulation, softening and flocculation to dispose reverse osmosis retentates," Journal of Industrial and Engineering Chemistry, vol. 18, no. 3, pp. 926-933, 2012/05/25/ 2012. [CrossRef]
- Pérez-González, A.; Urtiaga, A.M.; Ibáñez, R.; Ortiz, I. "State of the art and review on the treatment technologies of water reverse osmosis concentrates," Water Research, vol. 46, no. 2, pp. 267-283, 2012/02/01/ 2012. [CrossRef]
- Subramani, A.; Jacangelo, J.G. "Treatment technologies for reverse osmosis concentrate volume minimization: A review," Separation and Purification Technology, vol. 122, pp. 472-489, 2014/02/10/ 2014. [CrossRef]
- Subramani, A.; Cryer, E.; Liu, L.; Lehman, S.; Ning, R.Y.; Jacangelo, J.G. "Impact of intermediate concentrate softening on feed water recovery of reverse osmosis process during treatment of mining contaminated groundwater," Separation and Purification Technology, vol. 88, pp. 138-145, 2012/03/22/ 2012. [CrossRef]
- M. G. O'Connell, N. Rajendran, M. Elimelech, J. Gilron, and J. B. Dunn, "Water, Energy, and Cost: A Nexus Approach to Zero/Minimal Liquid Discharge Desalination Technologies," ChemRxiv, 2024. [CrossRef]
- Z. Wang, D. Feng, Y. Chen, D. He, and M. Elimelech, "Comparison of Energy Consumption of Osmotically Assisted Reverse Osmosis and Low-Salt-Rejection Reverse Osmosis for Brine Management," Environmental Science & Technology, vol. 55, no. 15, pp. 10714-10723, 2021/08/03 2021. [CrossRef]
- D. M. Warsinger, E. W. Tow, K. G. Nayar, L. A. Maswadeh, and J. H. Lienhard V, "Energy efficiency of batch and semi-batch (CCRO) reverse osmosis desalination," Water Research, vol. 106, pp. 272-282, 2016/12/01/ 2016. [CrossRef]
- K. G. Nayar and J. H. Lienhard V, "Brackish water desalination for greenhouse agriculture: Comparing the costs of RO, CCRO, EDR, and monovalent-selective EDR," Desalination, vol. 475, p. 114188, 2020/02/01/ 2020. [CrossRef]
- M. A. Cappelle, "High Recovery Inland Desalination: A Technical and Economic Performance Evaluation of Zero Discharge Desalination and Other Technologies," University of Texas at El Paso, 2018.
- T. L. Oddonetto et al., "Assessment of salt-free electrodialysis metathesis: A novel process for brine management in brackish water desalination using monovalent selective ion exchange membranes," Desalination, vol. 592, p. 118160, 2024/12/21/ 2024. [CrossRef]
- DuPont. "Product Data Sheet. DuPont™ XUS180808 Reverse Osmosis Element Ultra-High Pressure, High-Rejection, Reverse Osmosis Element for Industrial Water Purification." (accessed.
- Saltworks. "Applying Ultra-Hjigh Pressure Reverse Osmosis in Brine Management." https://www.saltworkstech.com/articles/applying-ultra-high-pressure-reverse-osmosis-in-brine-management/ (accessed.
- P. Xu. Concentrate Treatment and Chemical Production using Innovative Electrodialysis Processes for Near Zero-Waste Discharge. (2024). [Online]. Available: https://www.nawihub.org/wp-content/uploads/sites/16/2024/03/3.15-Pei-Xu-Concentrate-treatment-and-chemical-production-using-innovative-electrodialysis-processes-for-near-zero-waste-discharge.pdf.
- S. E. H. Comstock and T. H. Boyer, "Combined magnetic ion exchange and cation exchange for removal of DOC and hardness," Chemical Engineering Journal, vol. 241, pp. 366-375, 2014/04/01/ 2014. [CrossRef]
- M. Yaqub, M. N. Nguyen, and W. Lee, "Treating reverse osmosis concentrate to address scaling and fouling problems in zero-liquid discharge systems: A scientometric review of global trends," Science of The Total Environment, vol. 844, p. 157081, 2022/10/20/ 2022. [CrossRef]
- J. C. Crittenden, MWH's water treatment: Principles and design, third edition, 3rd ed. Hoboken, N.J: John Wiley & Sons, 2012.
- R. Miranda, I. Latour, and A. Blanco, "Silica Removal from a Paper Mill Effluent by Adsorption on Pseudoboehmite and γ-Al2O3," Water, vol. 13, no. 15, p. 2031, 2021. [Online]. Available: https://www.mdpi.com/2073-4441/13/15/2031.
- T. Chuuman et al., "Inhibition of Silicic Acid Elution during the Regeneration of Strong Base Anion Exchange Resin Column," Bulletin of the Chemical Society of Japan, vol. 92, no. 4, pp. 869-874, 2019. [CrossRef]
- N. A. Milne et al., "Chemistry of silica scale mitigation for RO desalination with particular reference to remote operations," Water Research, vol. 65, pp. 107-133, 2014/11/15/ 2014. [CrossRef]
- R. Iler, "Chemistry of silica: Solubility, polymerization, colloid and surface properties, and biochemistry Iler, RK," 1979.
- N. Mbedzi, "An investigation into the removal of aluminosilicates scaling species by activated alumina," University of Cape Town, 2010. [Online]. Available: http://hdl.handle.net/11427/5443.
- W. Bouguerra, M. Ben Sik Ali, B. Hamrouni, and M. Dhahbi, "Equilibrium and kinetic studies of adsorption of silica onto activated alumina," Desalination, vol. 206, no. 1, pp. 141-146, 2007/02/05/ 2007. [CrossRef]
- P. Sanciolo, N. A. Milne, K. Taylor, M. Mullet, and S. R. Gray, "Silica scale mitigation for high recovery reverse osmosis of groundwater for a mining process," Desalination, vol. 340, pp. 49-58, 2014.
- S. Salvador Cob et al., "Silica removal to prevent silica scaling in reverse osmosis membranes," Desalination, vol. 344, pp. 137-143, 2014/07/01/ 2014. [CrossRef]
- Janson, A. et al., "Evaluation of new ion exchange resins for hardness removal from boiler feedwater," Emergent Materials, vol. 1, no. 1, pp. 77-87, 2018/06/01 2018. [CrossRef]
- K. Dahmani, D. Kherroub, A. Boucherdoud, and B. Benaouda, "Removal of Ca(II) and Mg(II) hardness by ion exchange resins and soda ash for seawater pretreatment to reduce scale formation in evaporators multi-stage flash desalination," Desalination and Water Treatment, vol. 221, 05/25 2021. [CrossRef]
- Thomson, B.M.; Tandukar, S.; Shahi, A.; Lee, C.O.; Howe, K.J. "Mineral Recovery Enhanced Desalination (MRED) process: An innovative technology for desalinating hard brackish water," Desalination, vol. 496, p. 114761, 2020/12/15/ 2020. [CrossRef]
- K. Sasan, P. V. Brady, J. L. Krumhansl, and T. M. Nenoff, "Exceptional selectivity for dissolved silicas in industrial waters using mixed oxides," Journal of Water Process Engineering, vol. 20, pp. 187-192, 2017/12/01/ 2017. [CrossRef]
- Hayani, A.; Mountadar, S.; Tahiri, S.; Mountadar, M.M. "Softening of hard water by ion-exchange with strongly acidic cationic resin. Application to the brackish groundwater of the coastal area of El Jadida province (Morocco)," Journal of Materials and Environmental Science, vol. 7, pp. 3875–3884, 01/01 2016.
- M. Zaman, "Silica Characterization in Coal Seam Gas Water and Its Removal by Activated Alumina," 2016.
- S. Ghorai and K. K. Pant, "Investigations on the column performance of fluoride adsorption by activated alumina in a fixed-bed," Chemical Engineering Journal, vol. 98, no. 1, pp. 165-173, 2004/03/15/ 2004. [CrossRef]
- S. Ghorai and K. K. Pant, "Equilibrium, kinetics and breakthrough studies for adsorption of fluoride on activated alumina," Separation and Purification Technology, vol. 42, no. 3, pp. 265-271, 2005/04/01/ 2005. [CrossRef]
- H. Shemer, N. Melki-Dabush, and R. Semiat, "Removal of silica from brackish water by integrated adsorption/ultrafiltration process," Environmental Science and Pollution Research, vol. 26, no. 31, pp. 31623-31631, 2019/11/01 2019. [CrossRef]
- S. S. Tripathy, J.-L. Bersillon, and K. Gopal, "Removal of fluoride from drinking water by adsorption onto alum-impregnated activated alumina," Separation and Purification Technology, vol. 50, no. 3, pp. 310-317, 2006/07/15/ 2006. [CrossRef]
- S. S. Tripathy and A. M. Raichur, "Enhanced adsorption capacity of activated alumina by impregnation with alum for removal of As(V) from water," Chemical Engineering Journal, vol. 138, no. 1, pp. 179-186, 2008/05/01/ 2008. [CrossRef]
- M. M. Lencka, R. D. Springer, P. Wang, and A. Anderko, "Modeling Mineral Scaling in Oil and Gas Environments Up to Ultra High Pressures and Temperatures," in CORROSION 2018, 2018, vol. All Days, NACE-2018-10828.
- Advisor Ci online. [Online]. Available: https://avistamembranesolutions.com/resources/avista-advisorci-online-registration/.
- P. Virtanen et al., "SciPy 1.0: Fundamental algorithms for scientific computing in Python," Nature Methods, vol. 17, no. 3, pp. 261-272, 2020/03/01 2020. [CrossRef]
- c. WaterTAP. WaterTAP: An open-source water treatment model library [Online] Available: https://github.com/watertap-org/watertap.
- M. B. Sik Ali, B. Hamrouni, S. Bouguecha, and M. Dhahbi, "Silica removal using ion-exchange resins," Desalination, vol. 167, pp. 273-279, 2004/08/15/ 2004. [CrossRef]
- Clifford, D.; Sorg, T.J.; Ghurye, G.L. "ION EXCHANGE AND ADSORPTION OF INORGANIC CONTAMINANTS," in Water Quality & Treatment: A Handbook on Drinking Water, J. Edzwald Ed., 6th Edition ed. New York: McGraw-Hill Education, 1999.
Figure 1.
Silica adsorption in AA surface.
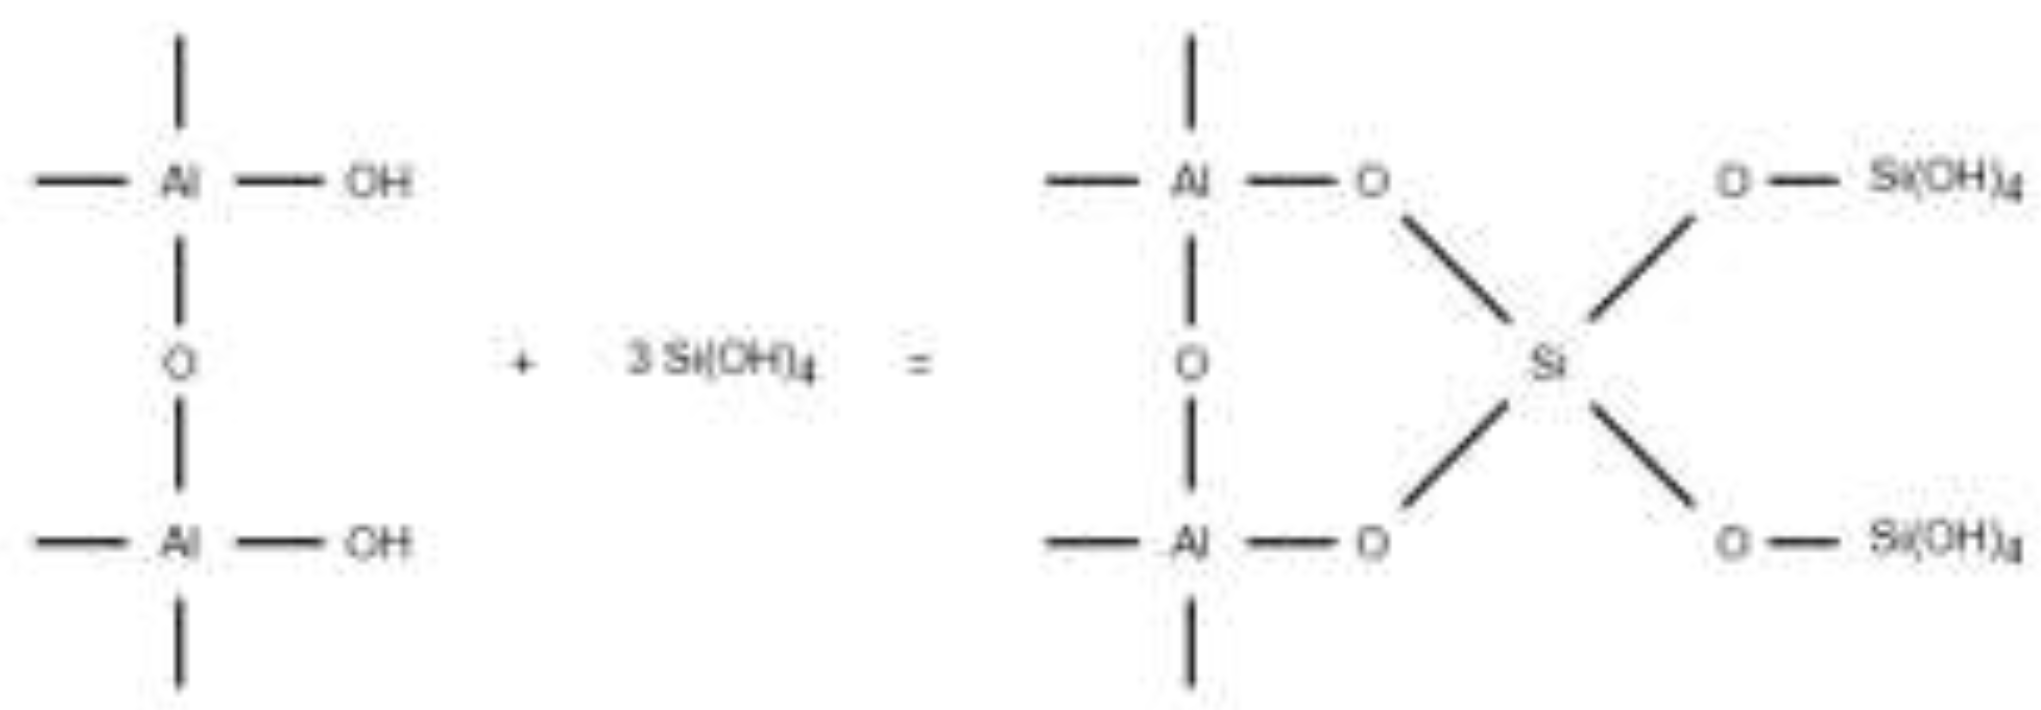
Figure 2.
Treatment scheme to reduce the scaling potential of ROC for ZLD and brine valorization.
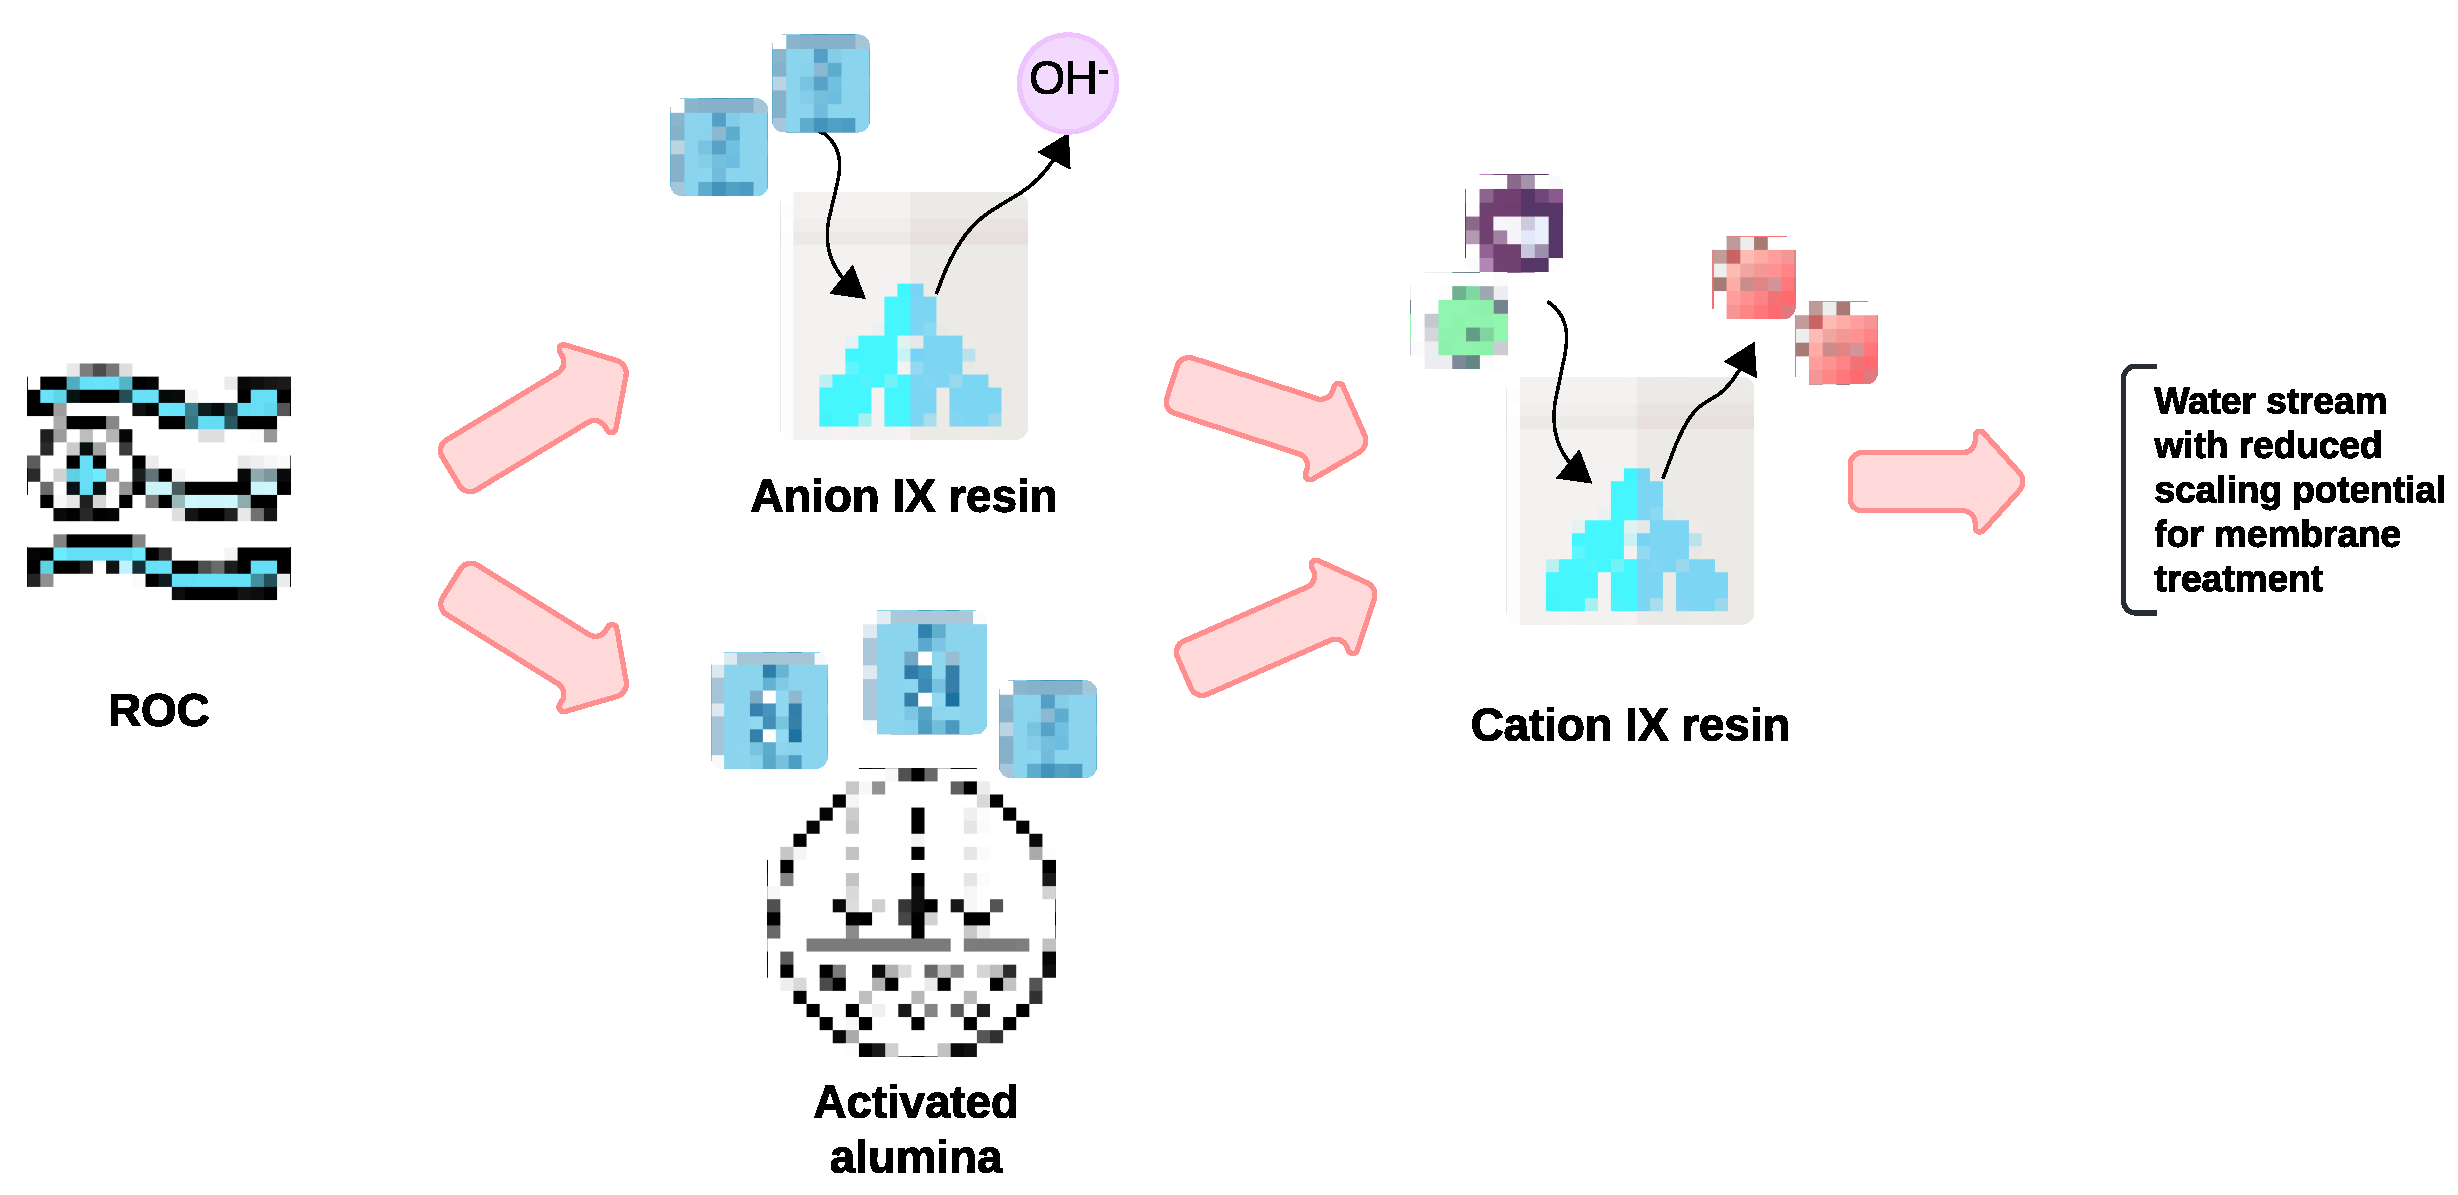
Figure 3.
Column operation for silica removal using SRIX-2: (a) breakthrough curve; (b) regeneration curve.
Figure 3.
Column operation for silica removal using SRIX-2: (a) breakthrough curve; (b) regeneration curve.
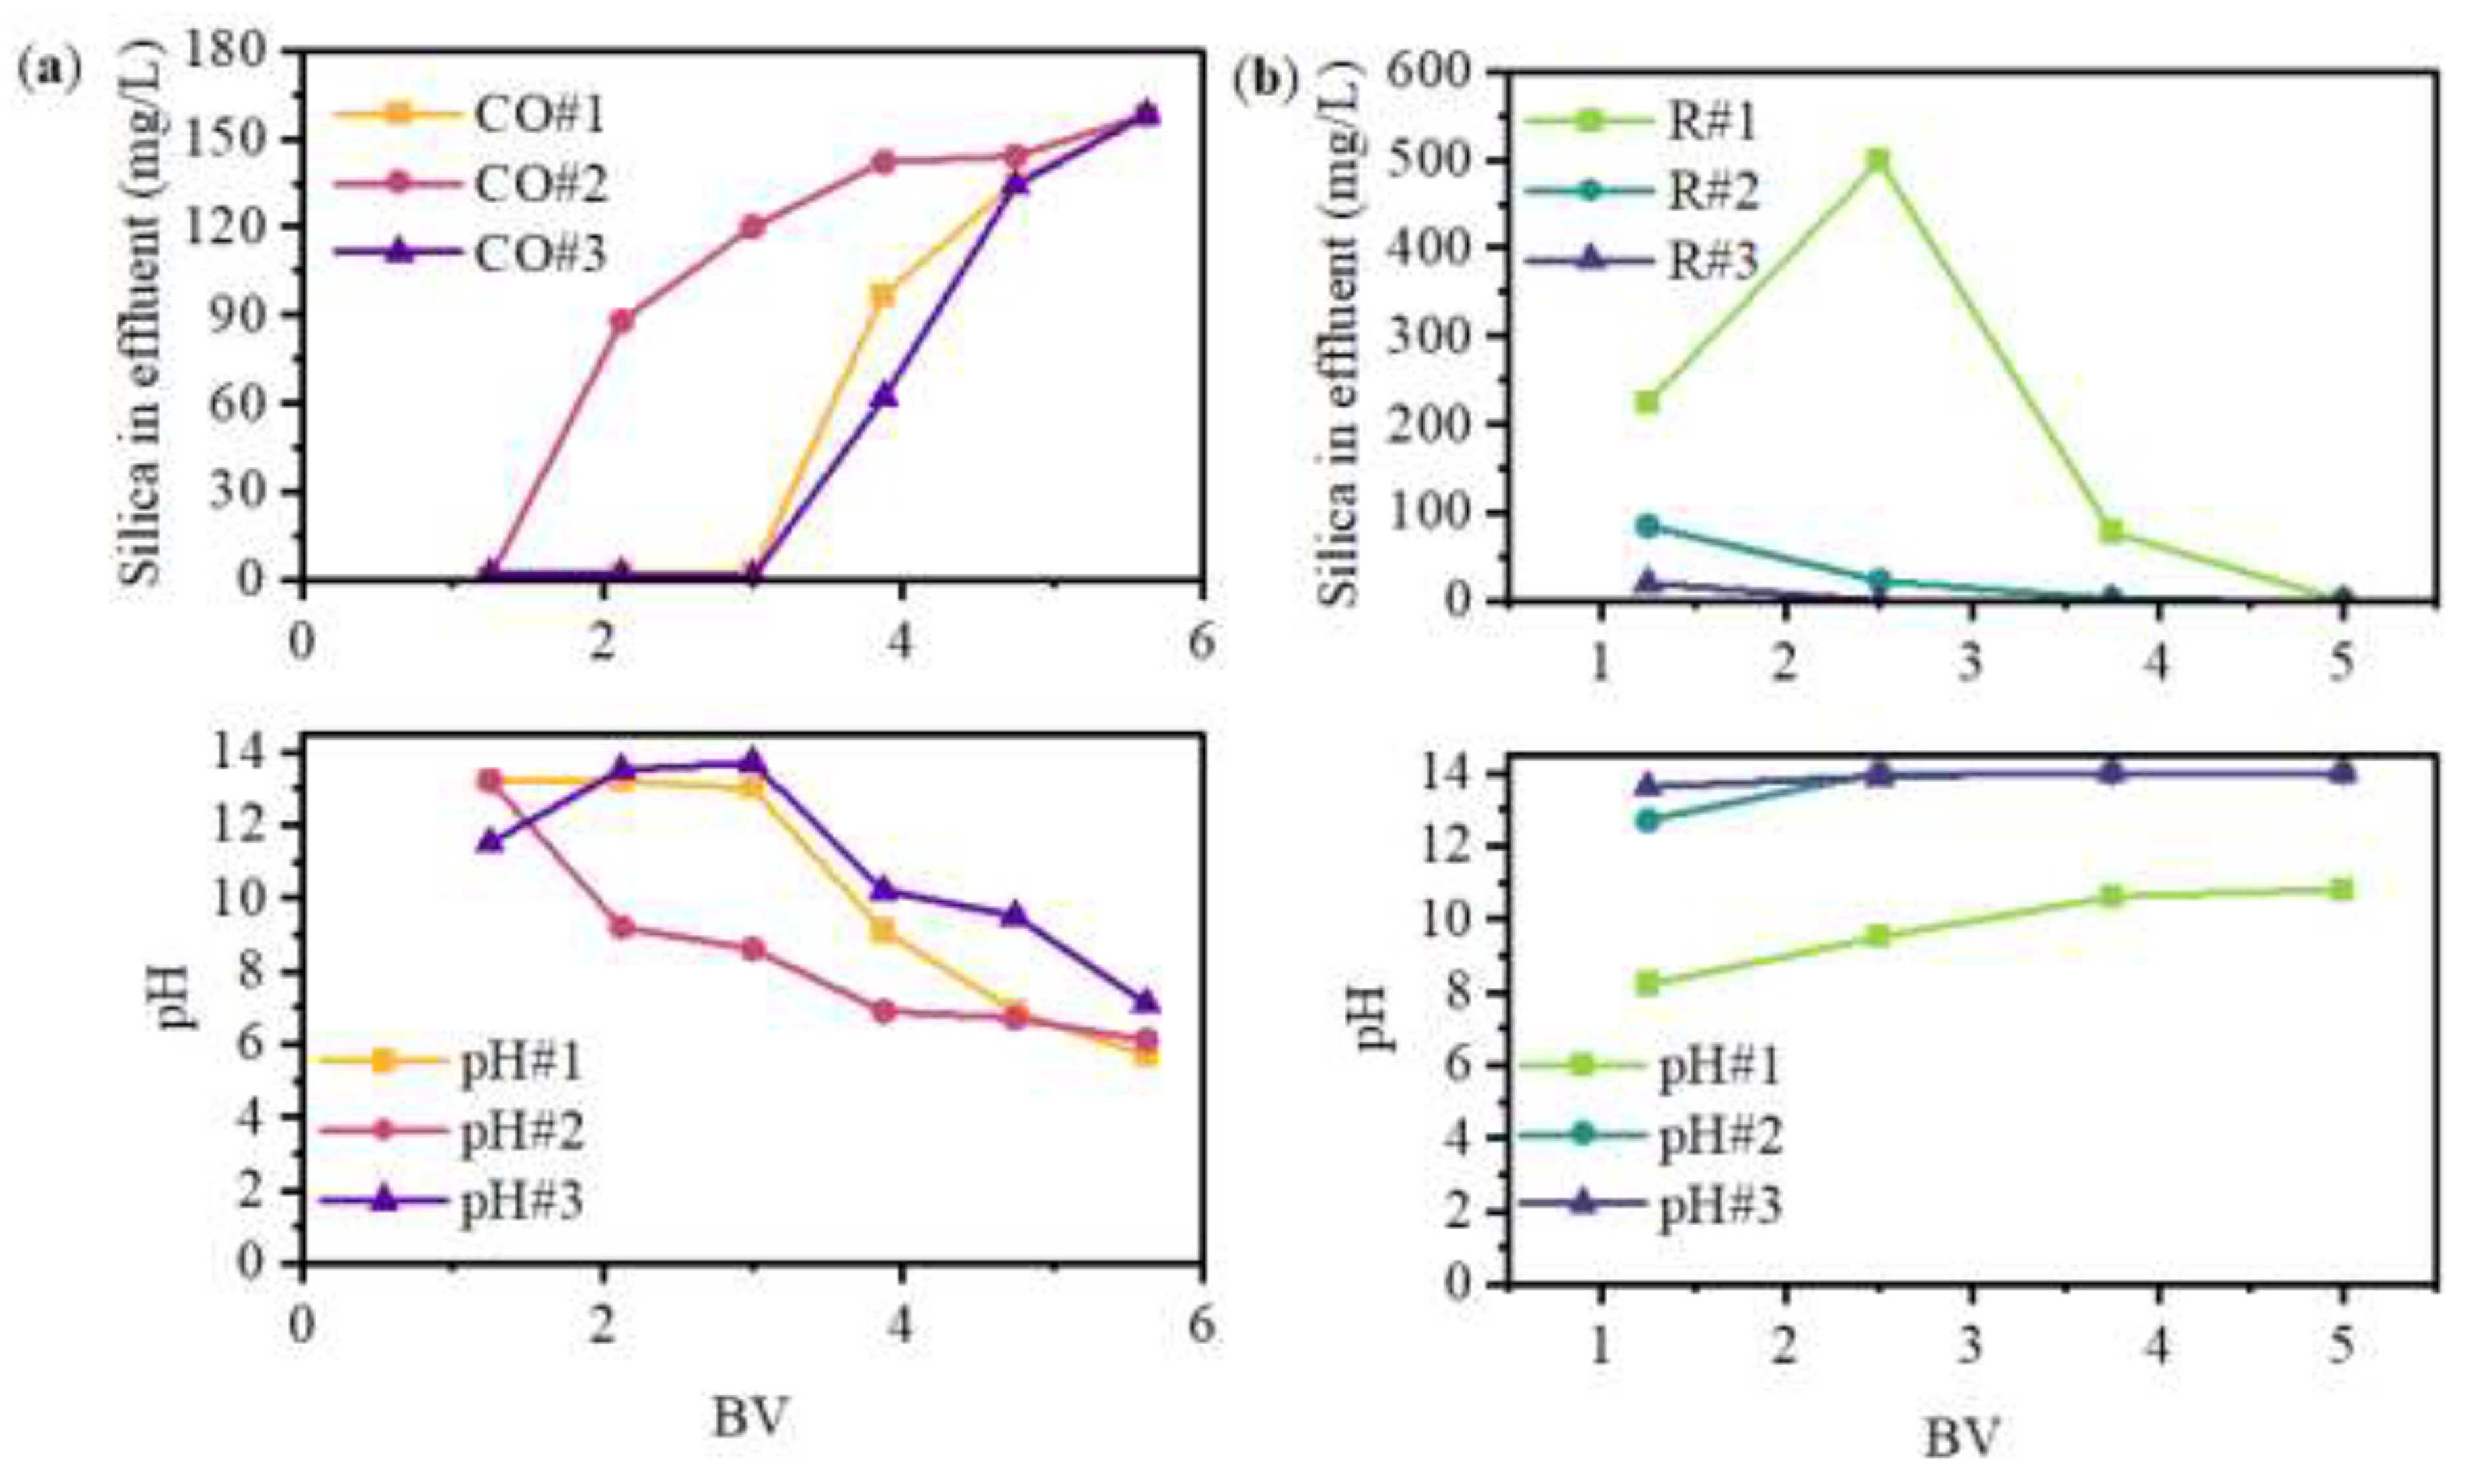
Figure 4.
Column operation for silica removal. a) results for AA-1; b) results for AA-2.
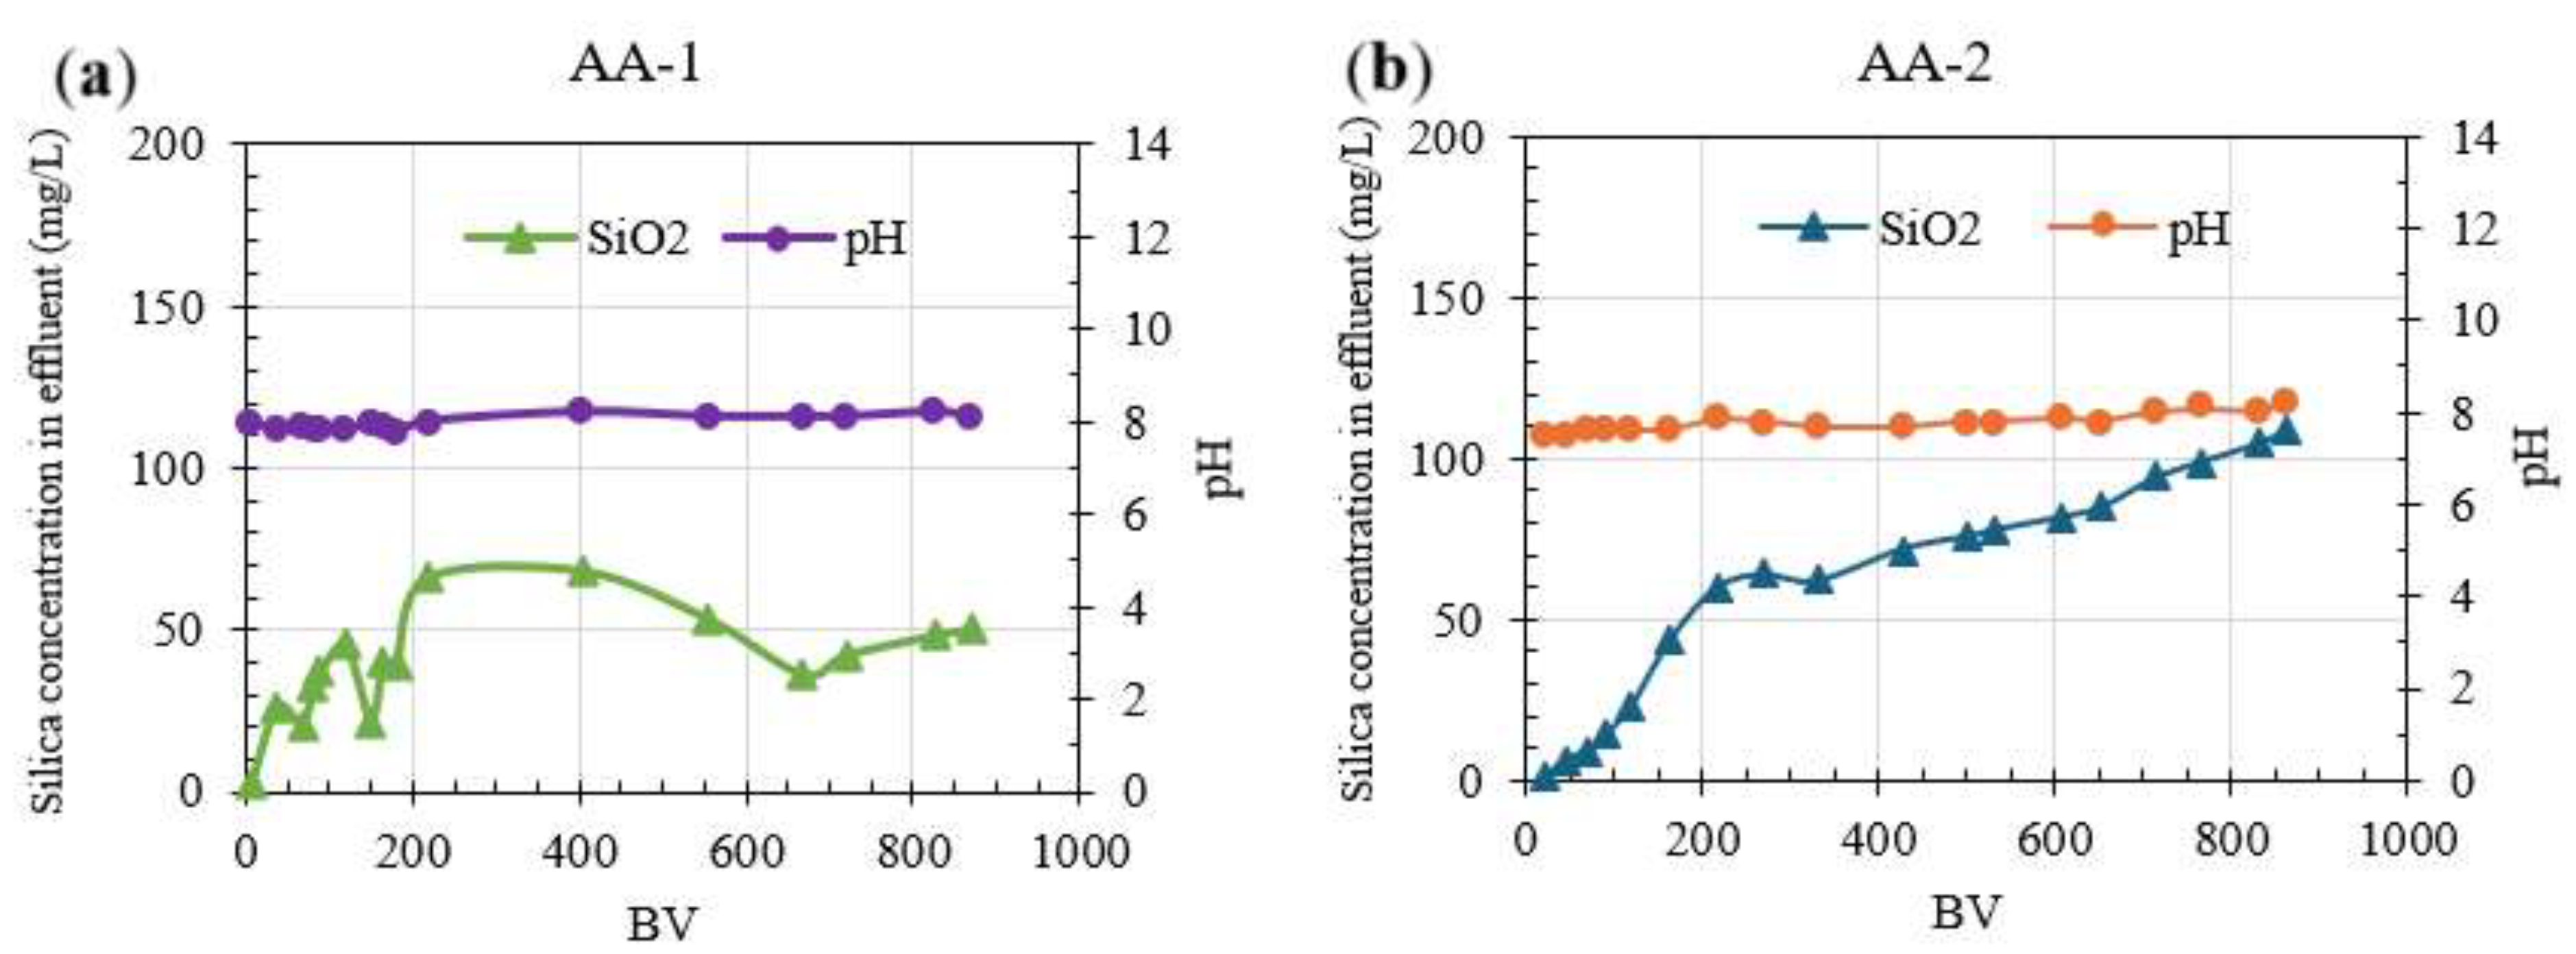
Figure 5.
Column regeneration for AA-2.
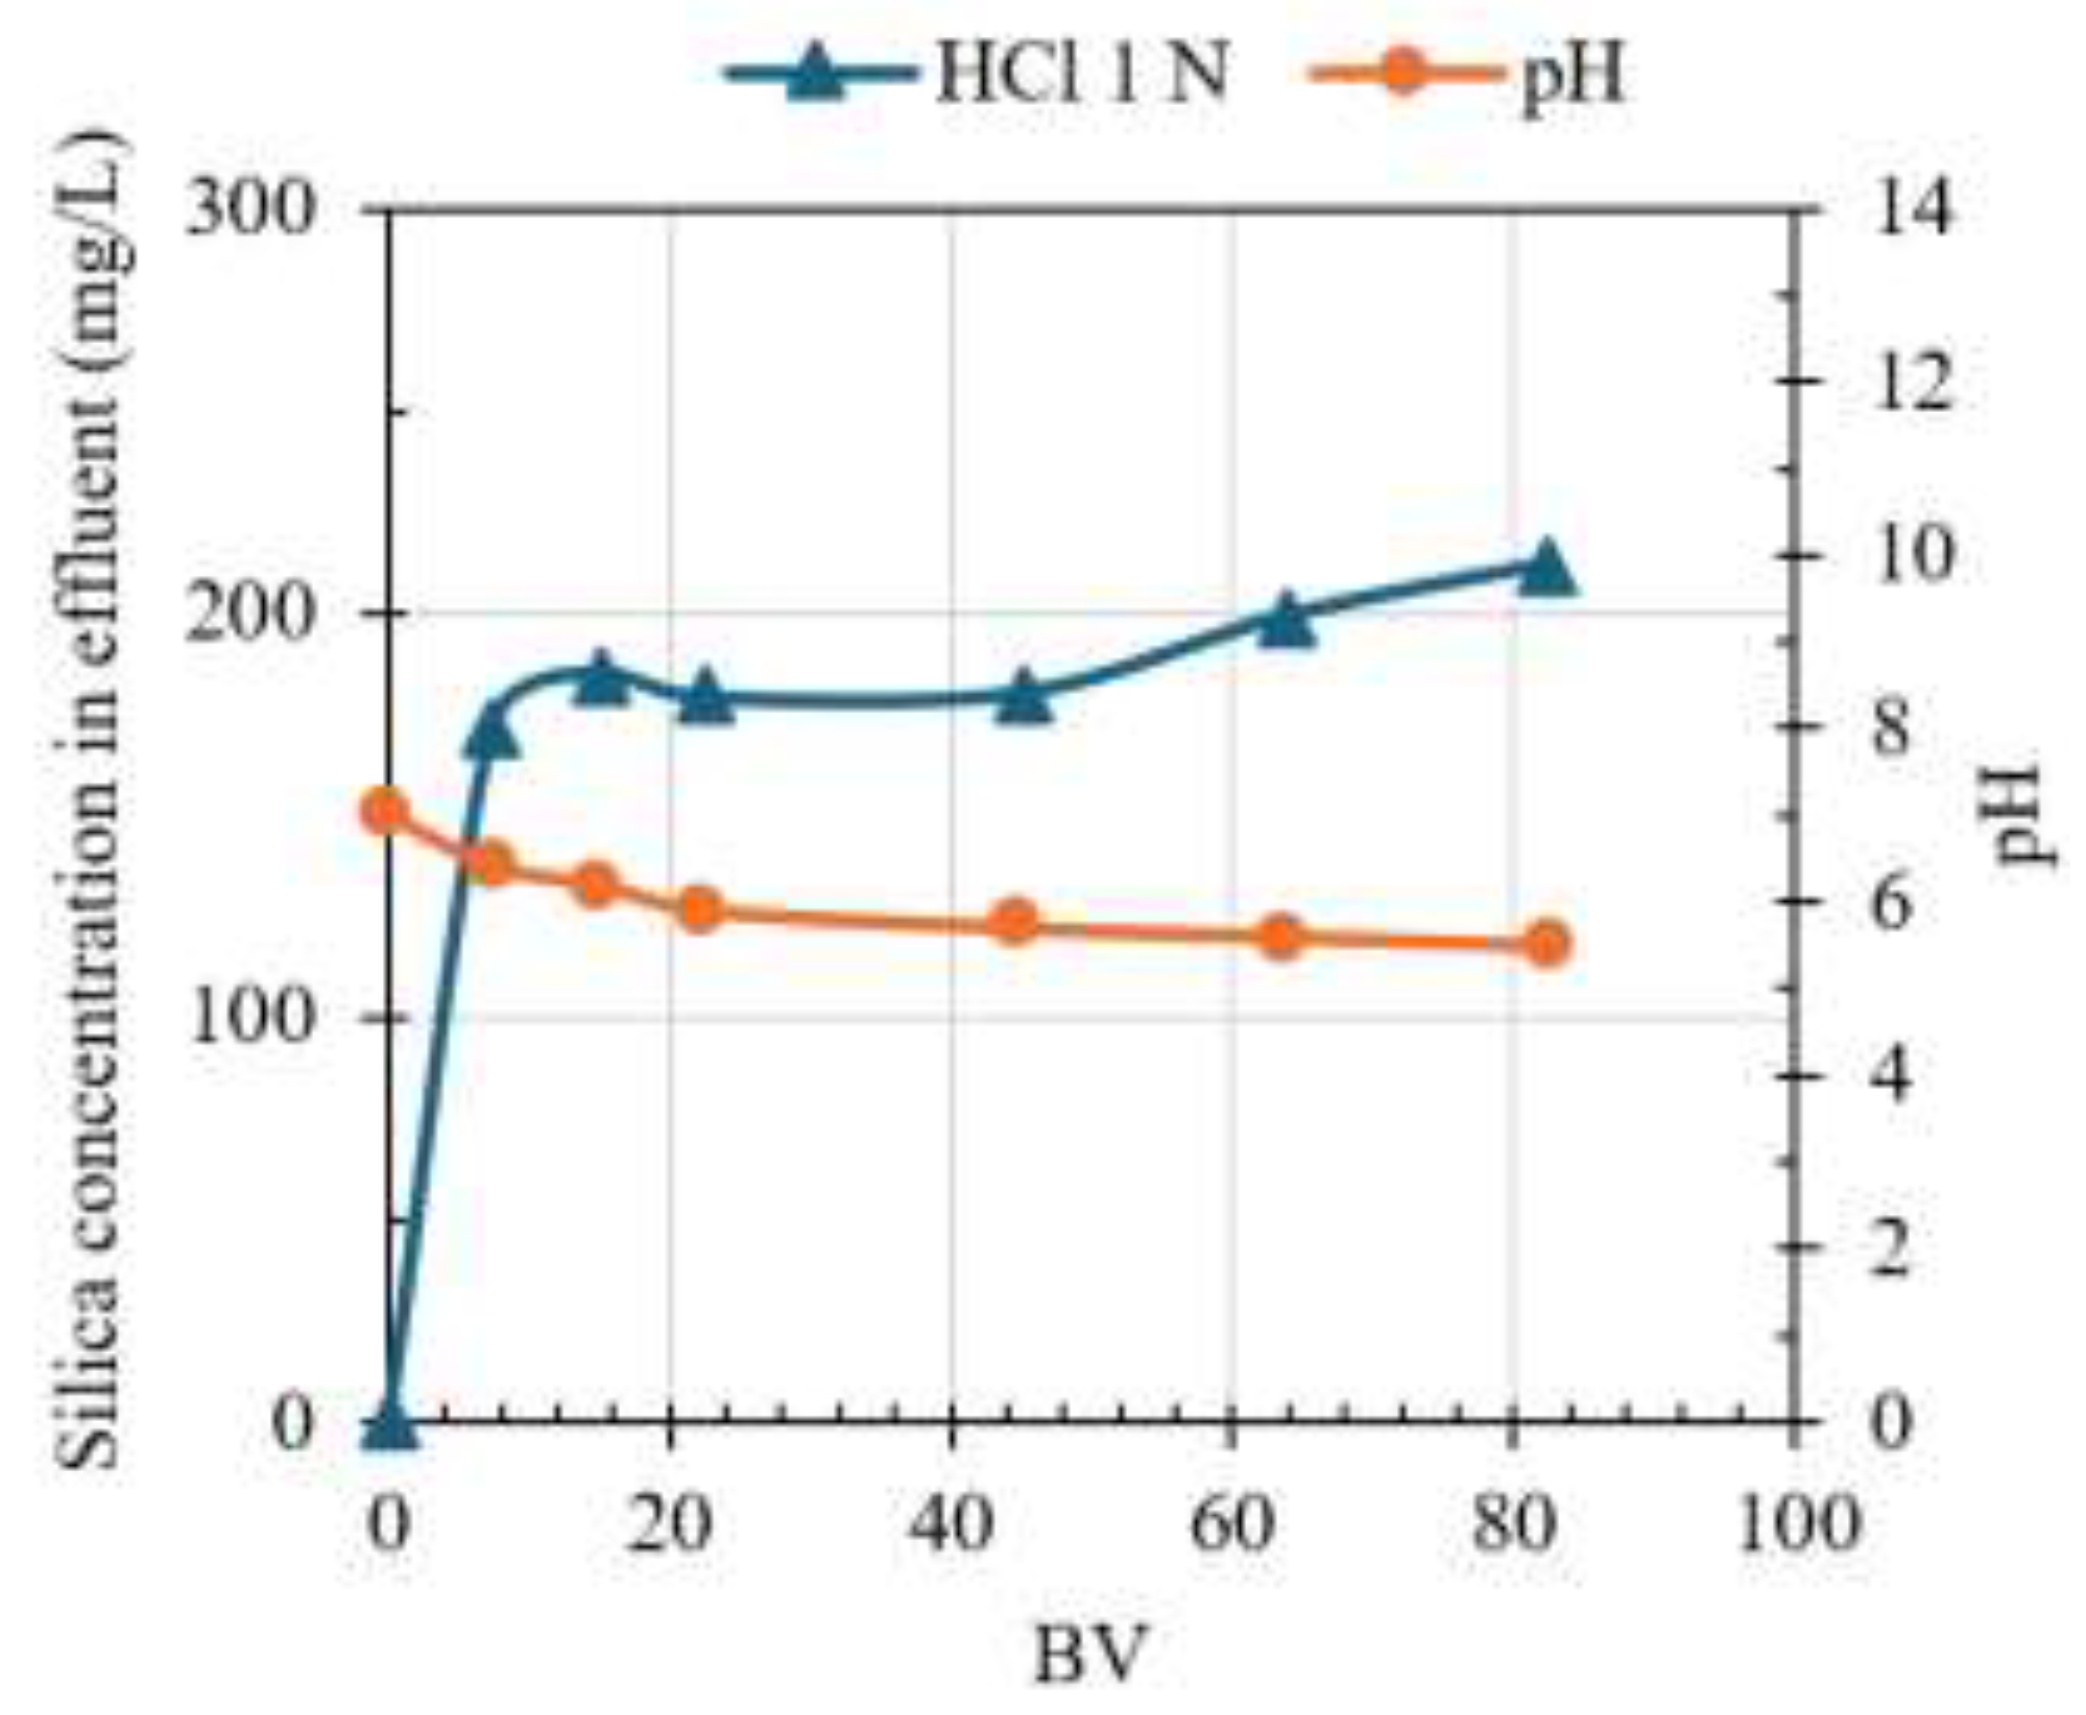
Figure 6.
Column operation of HRIX resins: (a) breakthrough of XRIX-1; (b) breakthrough of XRIX-2; (c) regeneration curve of HRIX-1; (d) regeneration curve of HRIX-2.
Figure 6.
Column operation of HRIX resins: (a) breakthrough of XRIX-1; (b) breakthrough of XRIX-2; (c) regeneration curve of HRIX-1; (d) regeneration curve of HRIX-2.
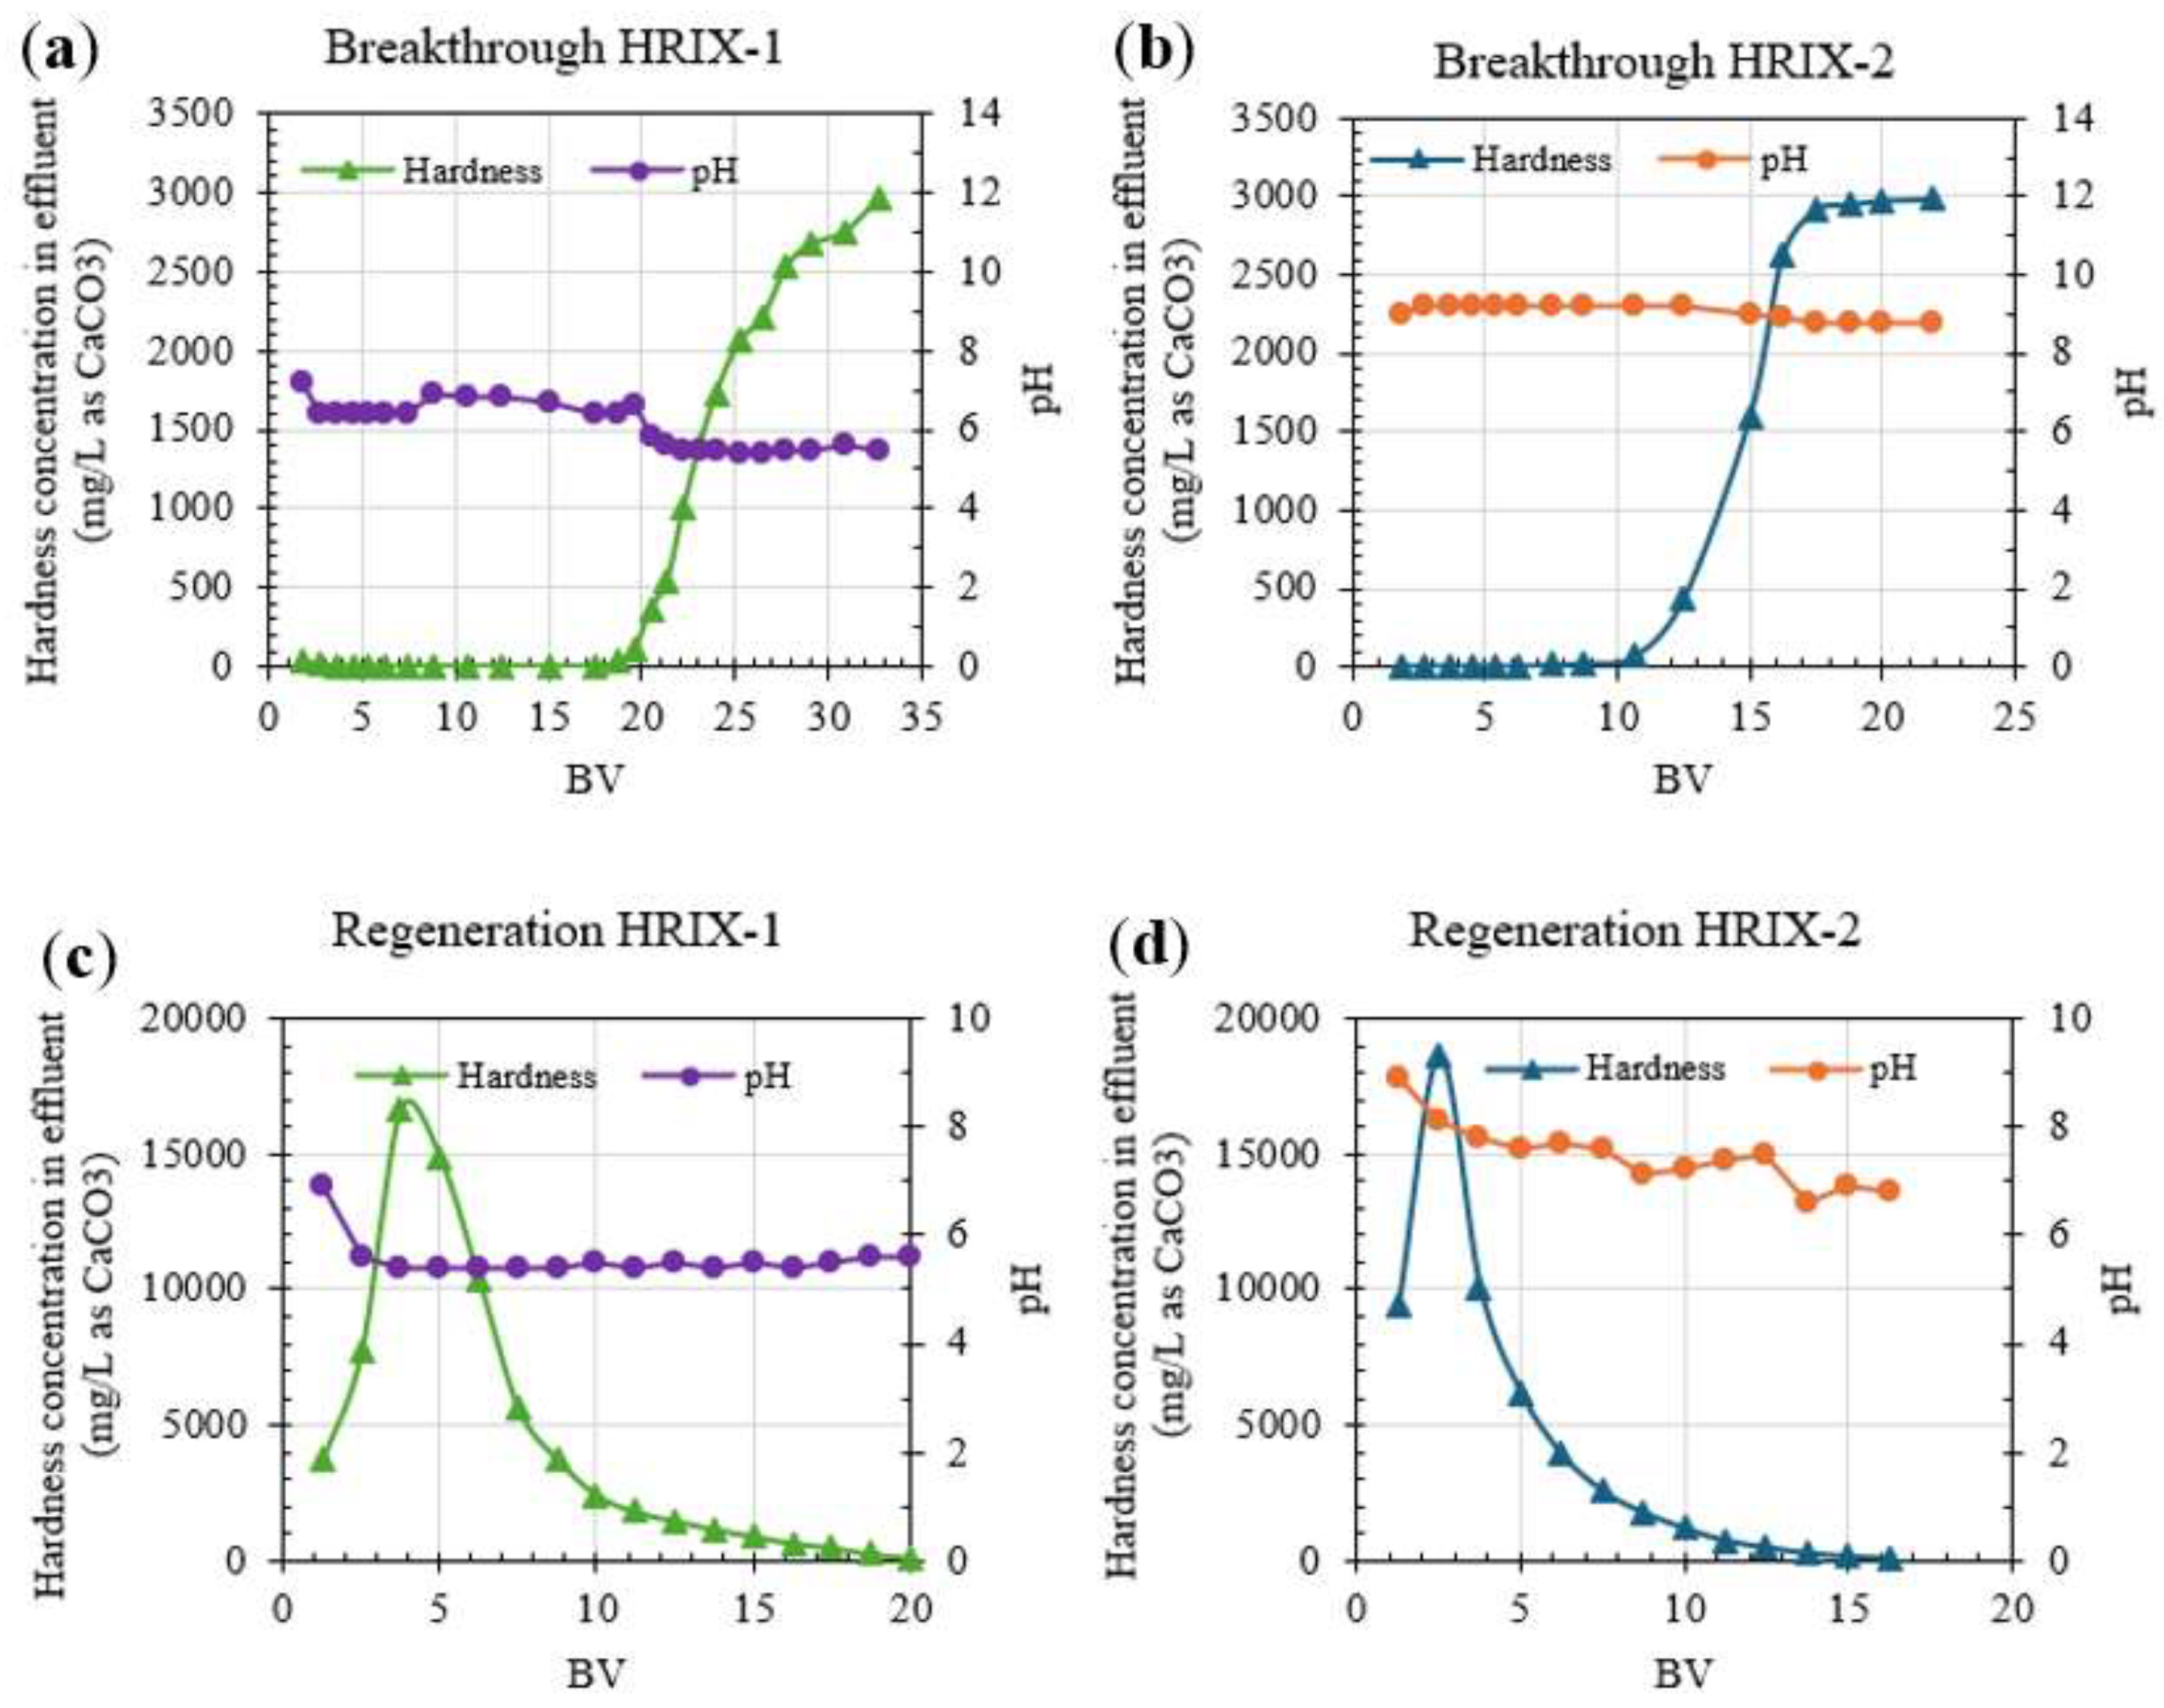
Figure 7.
Column operation for hardness removal using HRIX-2: (a) breakthrough curve; (b) regeneration curve.
Figure 7.
Column operation for hardness removal using HRIX-2: (a) breakthrough curve; (b) regeneration curve.
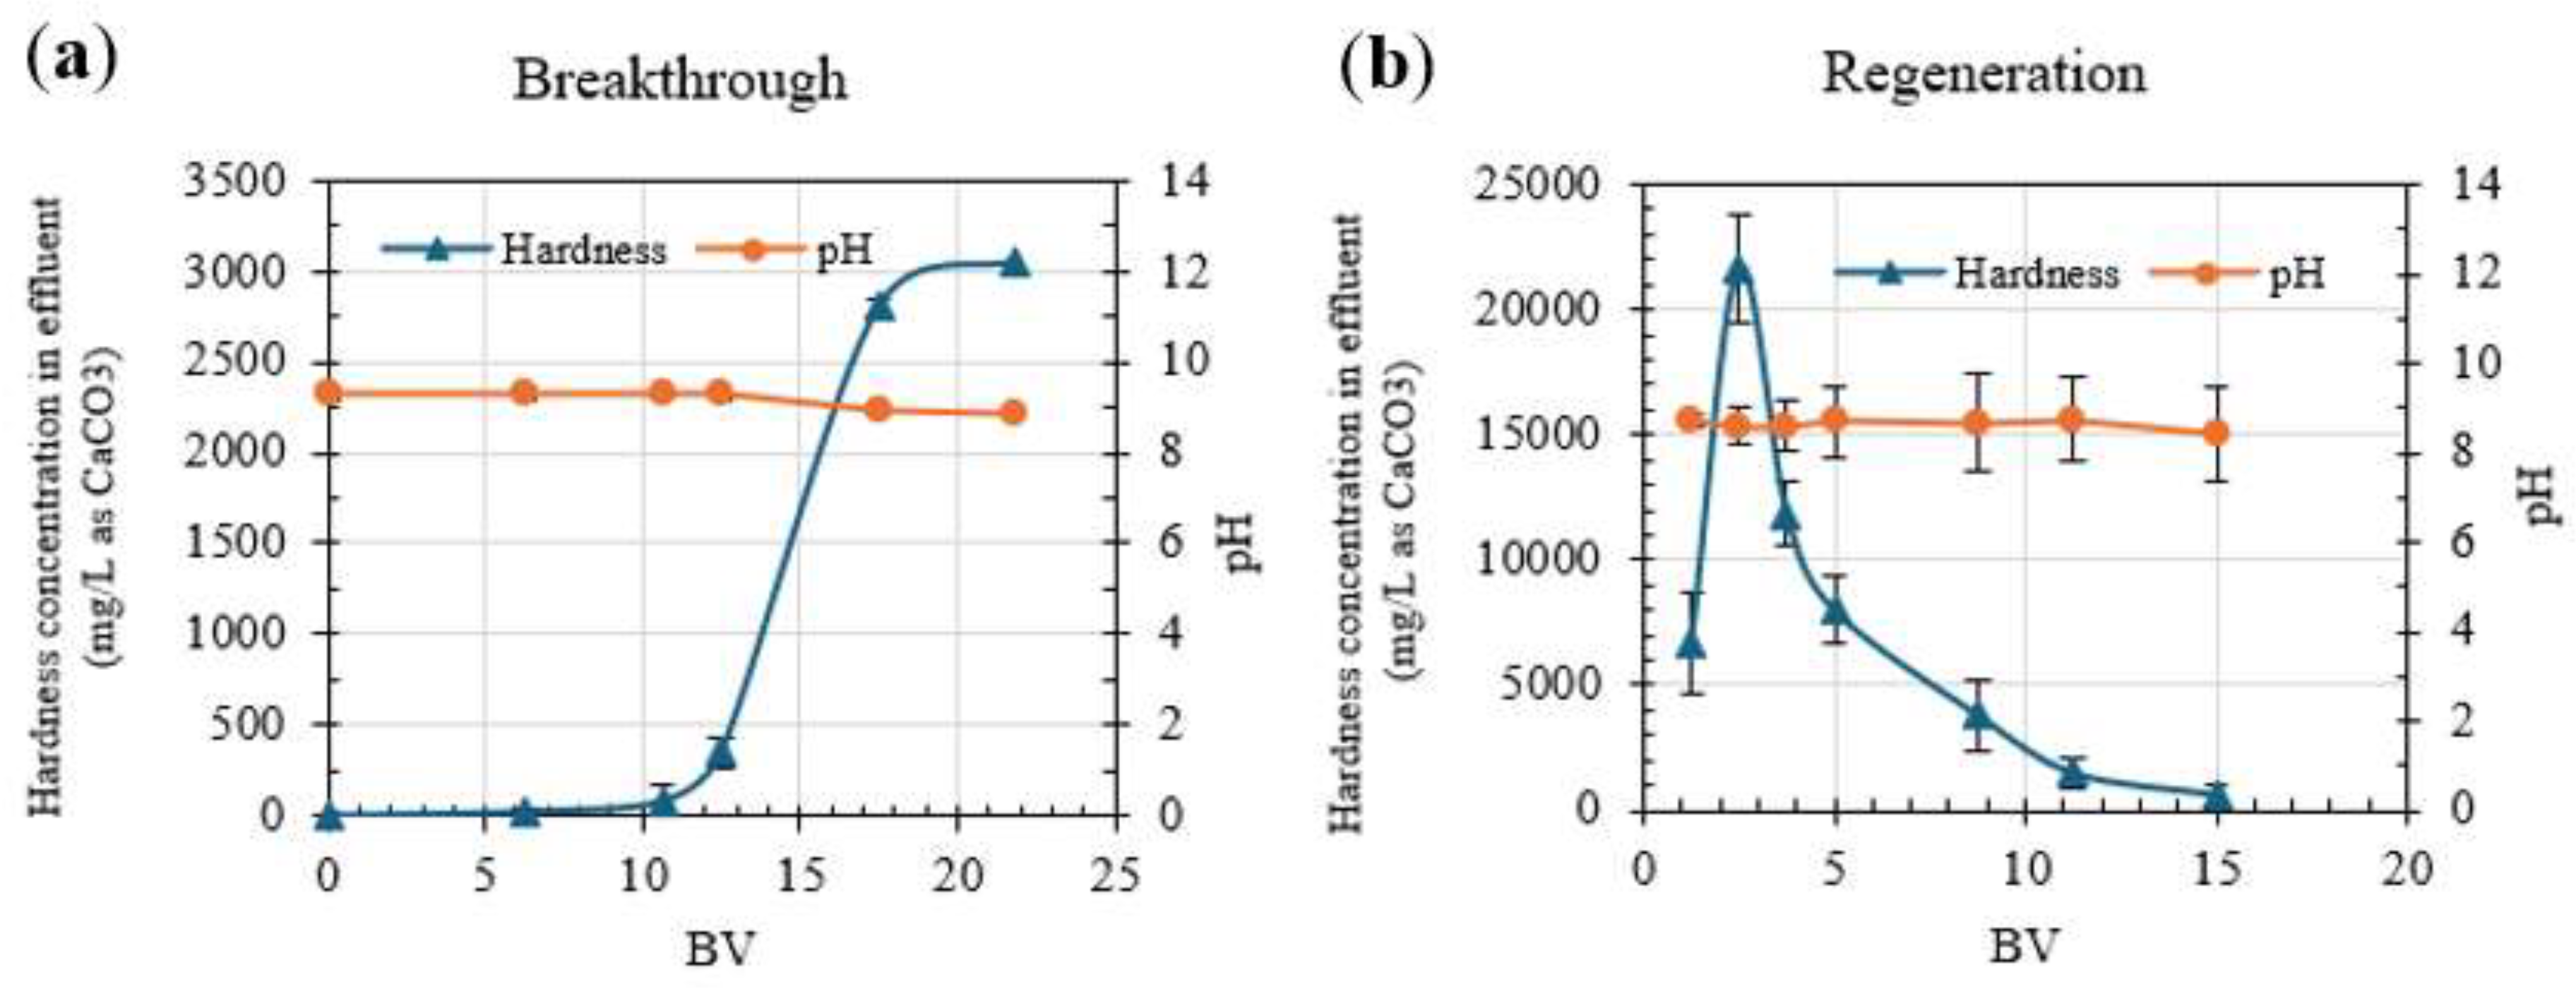
Figure 8.
Summative comparison of BV to column saturation as a function of TDS and hardness reported in literature (Table 1). (▲) data from [46]; (✕) average data of the HRIX-1 and HRIX-2 performance in this study; (●) average data of the column operation of three different WAC [44].
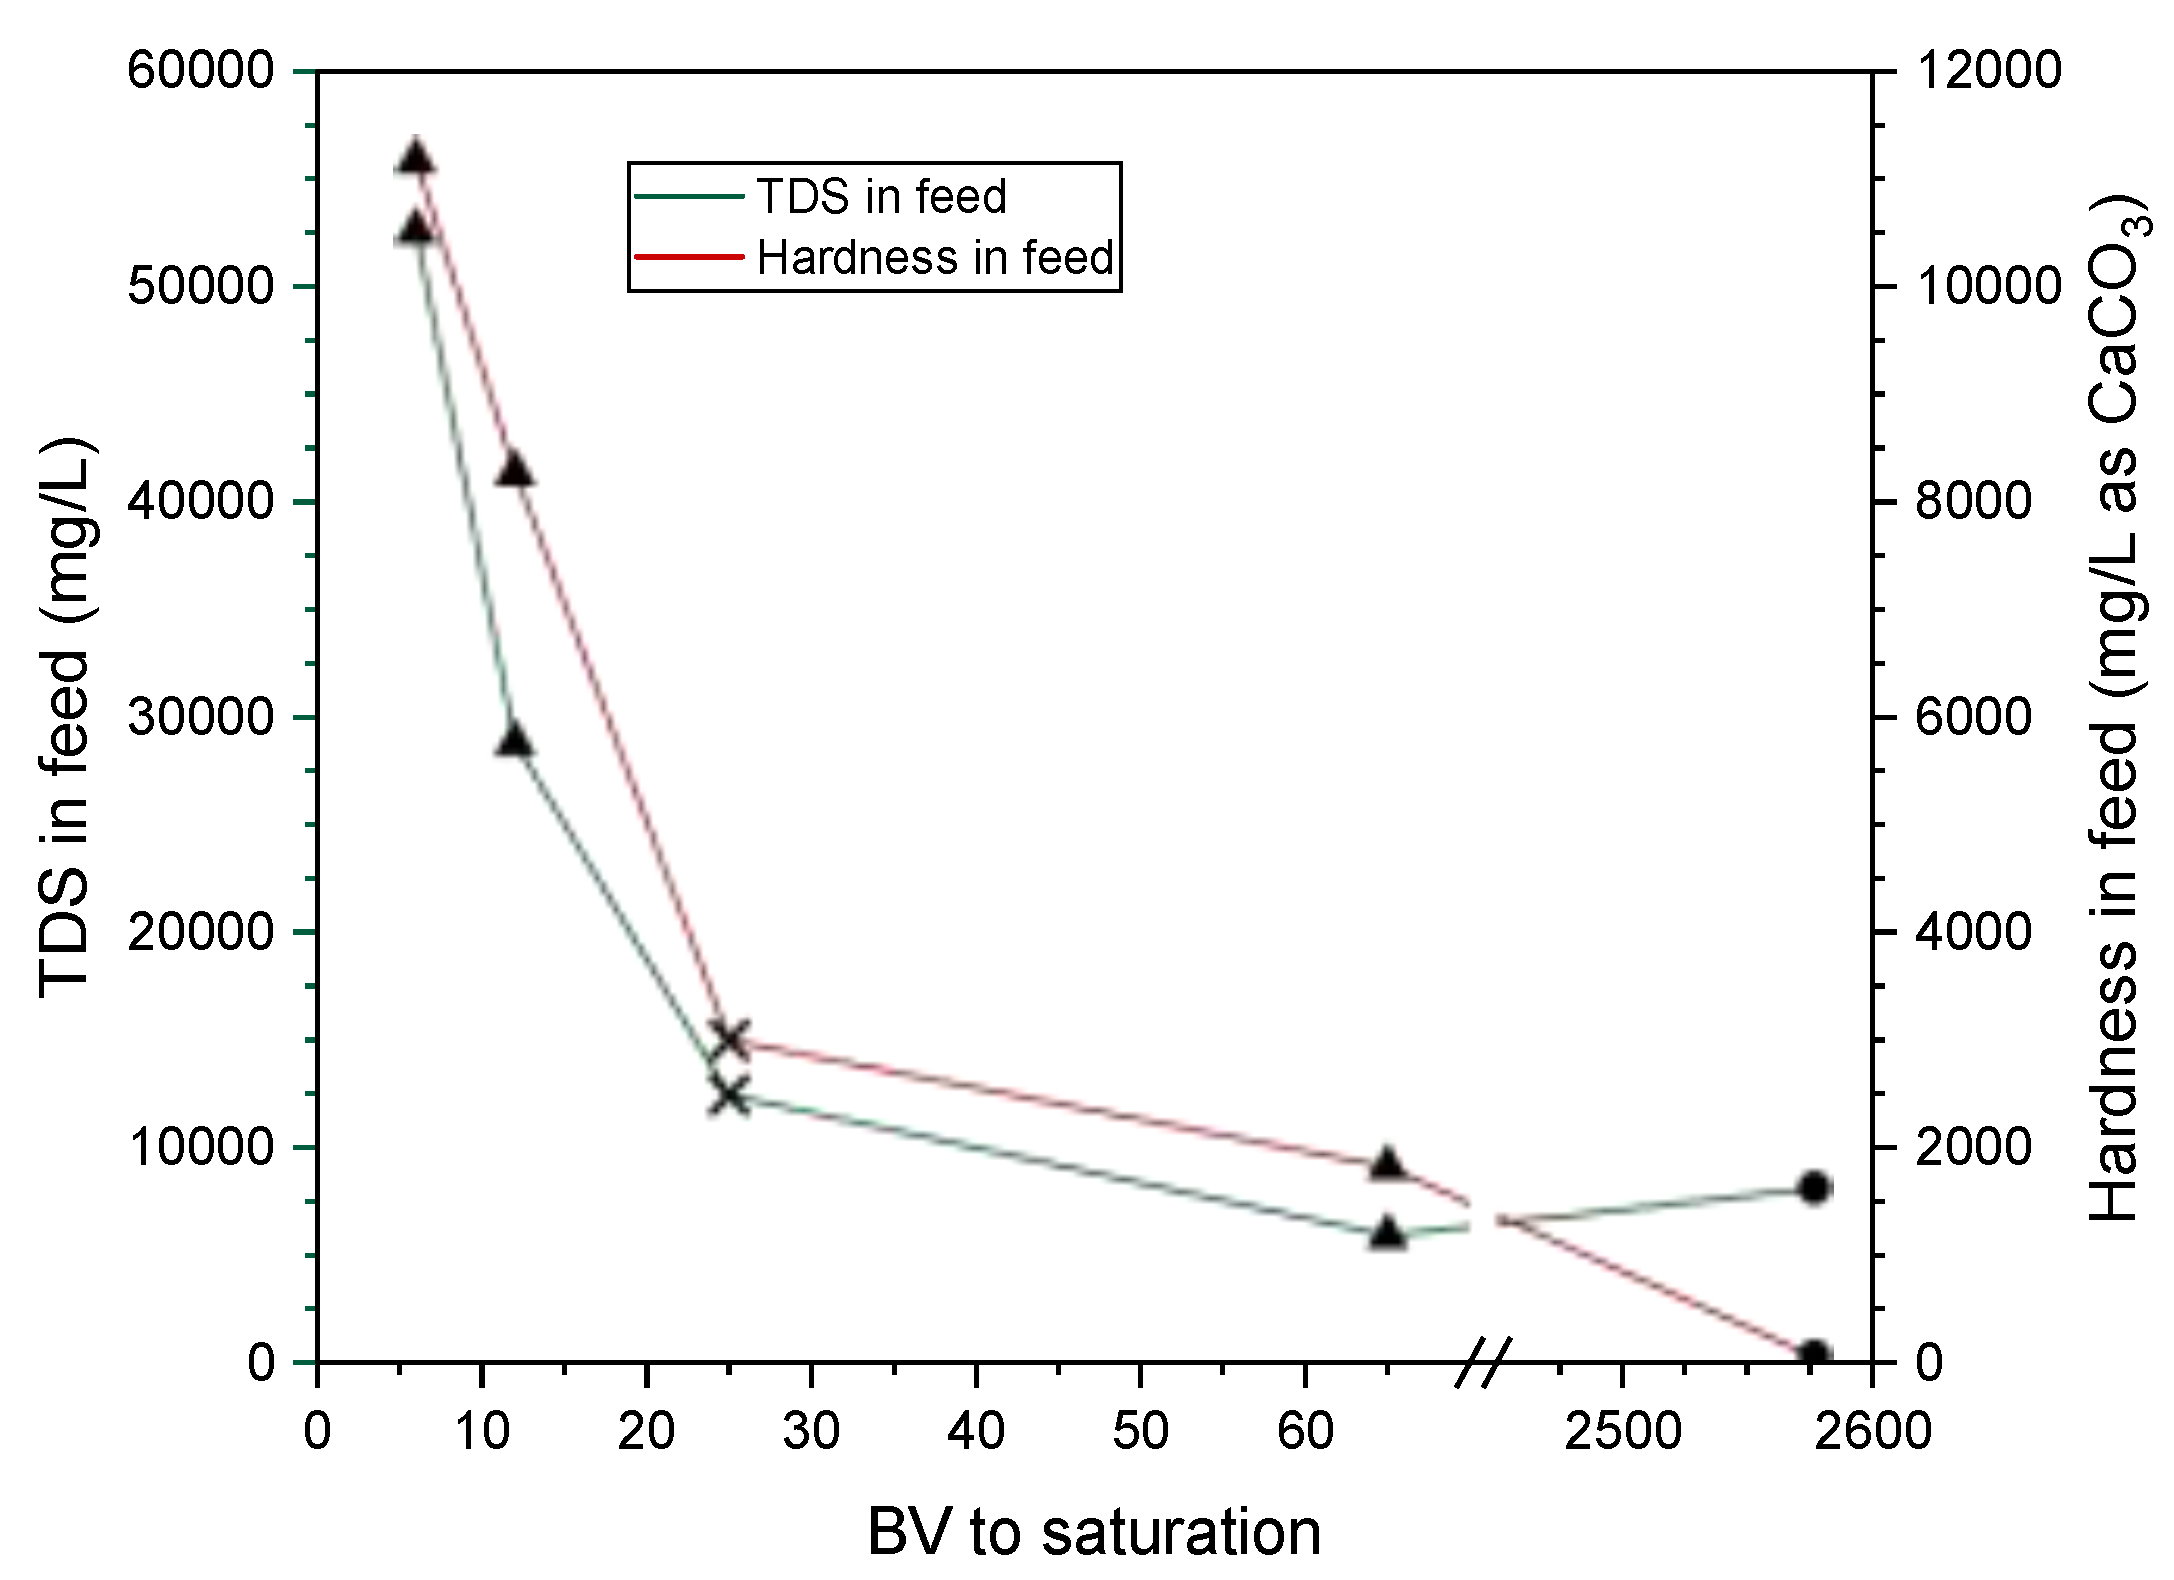
Figure 9.
Modeled water recovery (%) as a function of silica and hardness concentrations in a high recovery brackish water RO system, using empirical data and regression analysis (Eq. 7).
Figure 9.
Modeled water recovery (%) as a function of silica and hardness concentrations in a high recovery brackish water RO system, using empirical data and regression analysis (Eq. 7).
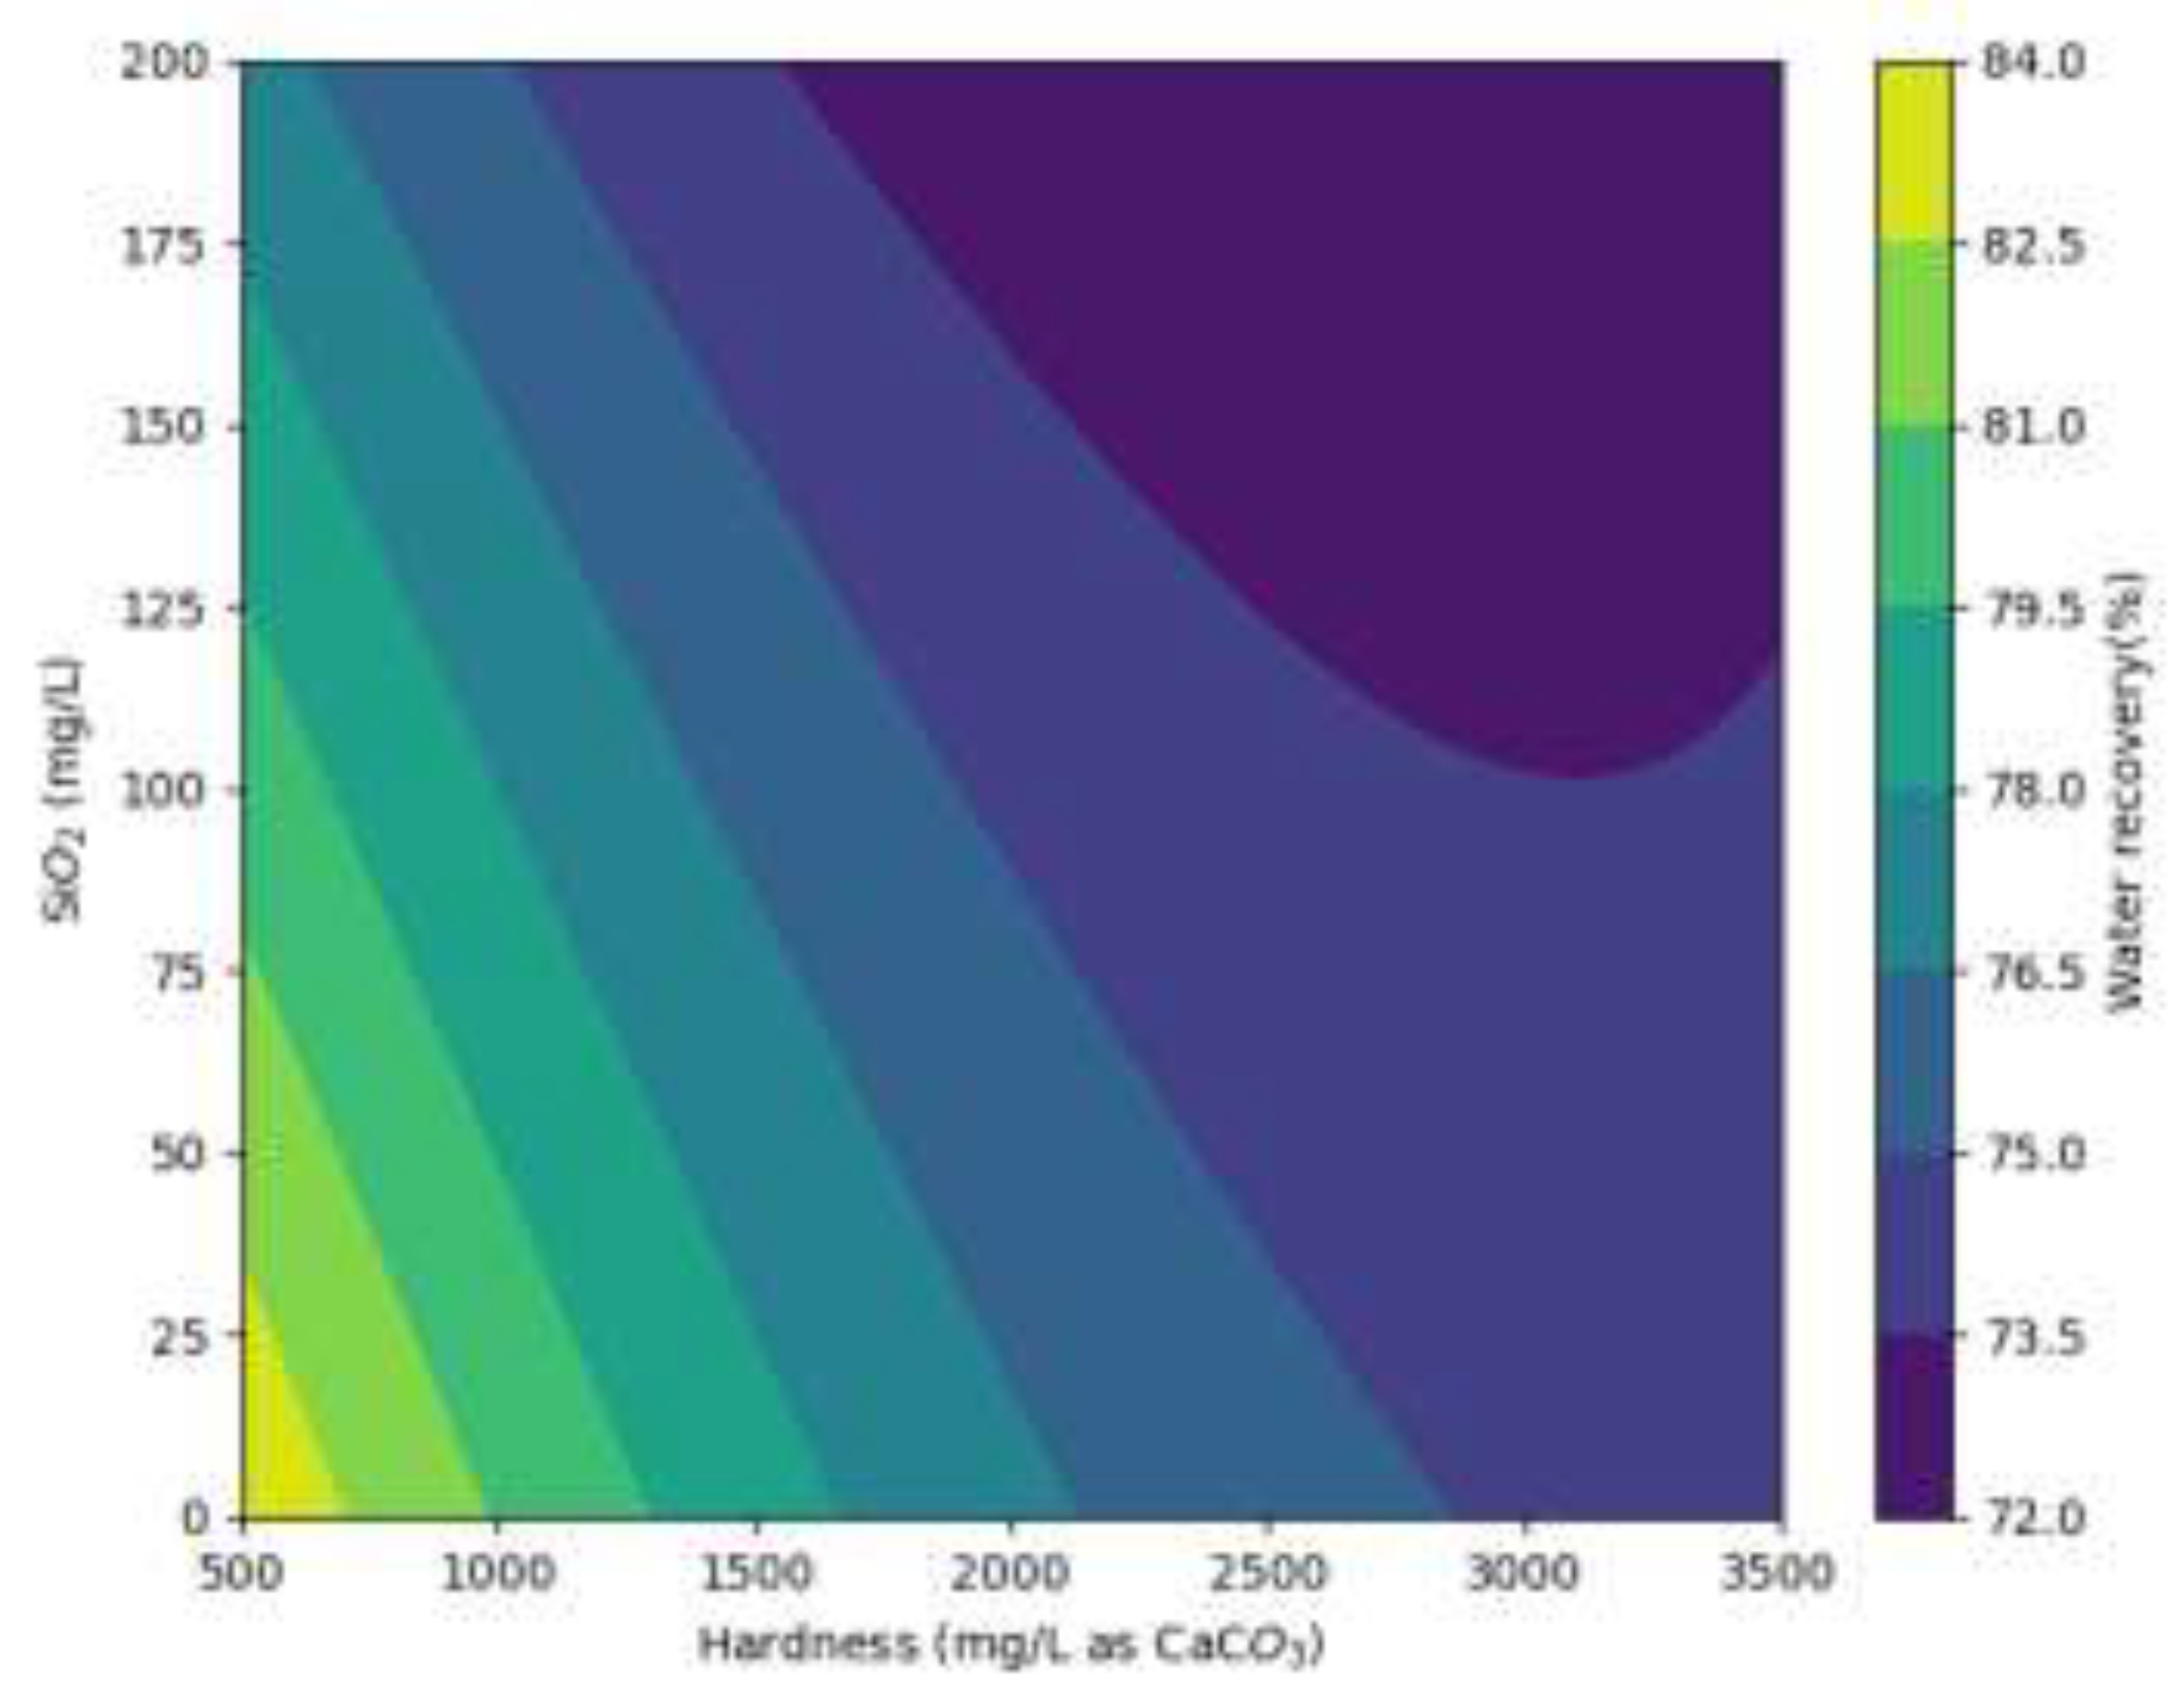
Figure 10.
(a) the treatment train for the ROC, which serves as the feed water, includes AA and IX pre-treatment stages before entering the secondary RO system. The feed water flows at a rate of 100 GPM and is either partially or fully treated using AA and IX prior to the secondary RO process. The treated water (RO permeate) is directed for potable use, while the ROC is discarded. (b) The net cost ($/kgal) by feeding different volumes (different flowrates) of ROC into AA and IX columns. (c) The capital, operational, and regeneration costs of IX and AA systems when RO feed water undergoes pretreatment.
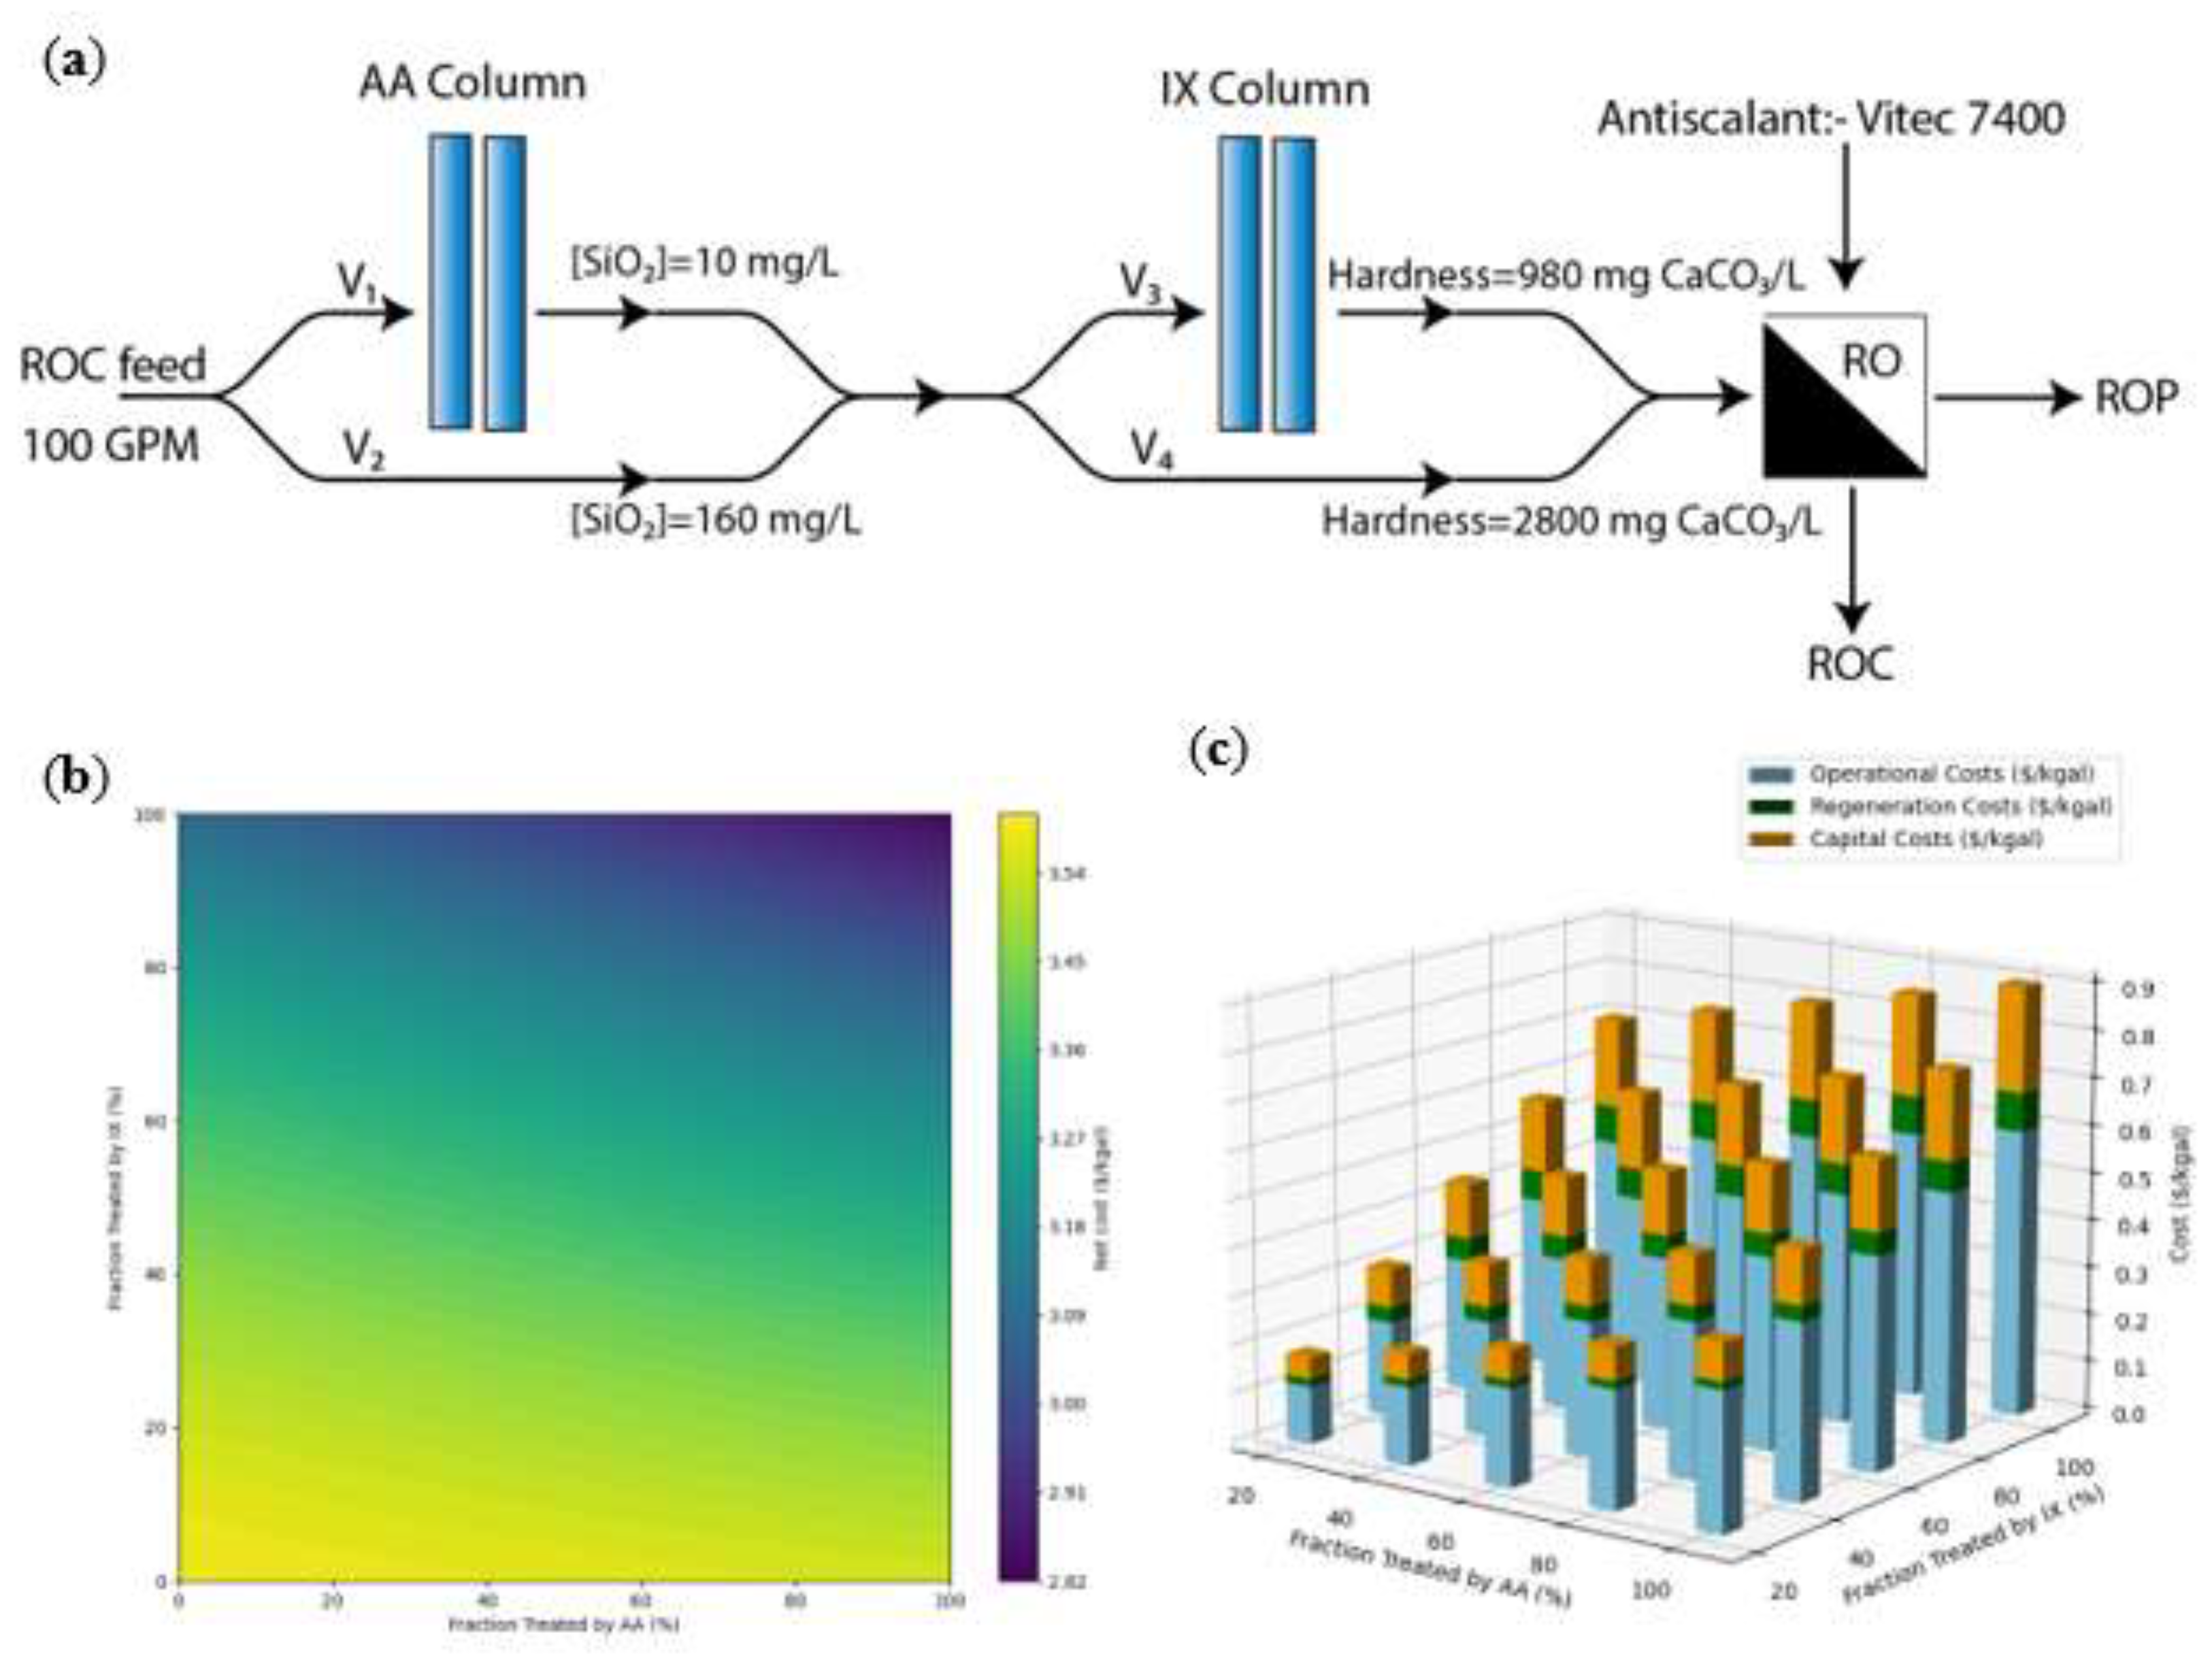
Table 1.
Silica and hardness removal by IX resins and AA reported in literature.
| Treatment | Water source | Concentration | Experimental procedure | Hardness results | Silica results | Regeneration results | Ref. |
|---|---|---|---|---|---|---|---|
| IX resin/SBA | Tap water | TDS = N/A Silica = 20 mg/L |
Bench scale column experiments: 100 mL of IX resin in a small column (18 cm x 5 cm) with Q = 55 mL/min | N/A | 94% average silica removal before breakthrough (at 50 BV) | N/A | [43] |
| BW ROC | TDS = 12445 mg/L Silica = 160 mg/L |
Bench scale isotherm experiments: IX resin concentrations of 2.5-100 g/L in 200 mL of ROC for 24 h | N/A | Langmuir constant: the maximum capacity (qmax) is 19.65 mg/g | N/A | This study | |
| Bench scale column experiments: 40 mL of IX resin in a 50 mL burette, Q = 8 mL/min (12 BV/h) | N/A | Saturation at 5 BV (0.2 L), with an operational capacity of 5.23 mg SiO2/g of resin | Regeneration in column: regeneration achieved at 5 BV (5 L/L of resin) using 2% NaOH (0.5 M) | ||||
| IX resin/ three types of WAC | Synthetic water | TDS = 8093 mg/L Hardness = 57.1 mg/L as CaCO3 |
Bench isotherm experimentsA | N/A | N/A | N/A | [44] |
| Bench scale column experiments: 22 mL of IX resin were poured into a small column (25 cm high) with Q = 7.5 mL/min (20 BV/h) | Saturation at 1922, 2577, and 3232 BV (70 L), total operational capacity of 2-4 meq/g of resin (100-200 mg CaCO3/g of resinB) | N/A | Regeneration in column: regeneration requirement of 2.3-3 meq HCl/meq adsorbed (3.88-4.97 L/L of resinB) using 5% HCl w/v (1.37 N) | ||||
| IX resin/SAC | Seawater ROC | TDS = 39.13 g/L Hardness = 4200 mg/L as CaCO3 |
Bench scale batch experiments: IX resin concentration of 10-60 mg/L in 1 L of seawater ROC for 60 min (contact time) | 8.23-41.24% hardness removal | N/A | Some regeneration results are reported (75 and 54% of Ca and Mg elution, respectively) using 15% HCl w/v (4.11 N)A | [45] |
| Synthetic water | TDS = 5900, 28800 and 52600 mg/L Hardness = 1818, 8266 and 11172 mg/L as CaCO3B |
Bench scale column experiments: glass columns (15 cm x 2.5 cm) with a Q = 10 mL/min and 5 min as contact time | Saturation at 65, 12, and 6 BV | N/A | Regeneration was conducted using 10% NaCl (1.71 M) at Q = 2.5 and 10 mL/min. No results were reported. | [46] | |
| BW ROC | TDS = 12445 mg/L Hardness = 3000 mg/L as CaCO3 |
Bench scale isotherm experiments: IX resin doses of 2.5-100 g/L in 200 mL of ROC for 24 h | Langmuir constant: maximum capacity (qmax): 133.33 mg/g | N/A | N/A | This study | |
| Bench scale column experiments: 40 mL of IX resin were poured into a 50 mL burette, Q = 8 mL/min (12 BV/h) | Saturation at 17 and 33 BV (0.68 and 1.32 L), total operational capacity of 65.63 and 98.25 g CaCO3/L of resin | N/A | Regeneration in column: regeneration was achieved at 15 and 20 BV (15 and 20 L/L of resin) using 8% NaCl (1.37 M) | ||||
| AA | BW ROC | TDS = 5800 mg/L Silica = 160 mg/L |
Bench scale batch experiments: AA dose 10 g/L, for 60 min (contact time) at 20 °C | N/A | 71.90% silica removal | Regeneration batches: 10 g AA (adsorption capacity of 50 mg/g) in 100 mL of 2% NaOH (0.5 M) achieved 80% of silica desorbed after 9 batches | [42] |
| Synthetic water | TDS = N/A Silica = 50 mg/L |
Bench scale isotherm experiments: AA dose 25 g/L in 100 mL of synthetic water at pH = 8-8.5 and 20 °C | N/A | Langmuir constant: maximum capacity (qmax): 7.943 mg/g Freundlich constant: adsorption capacity (K) 0.379 mg/g |
N/A | [41] | |
| Bench scale batch experiments: AA dose 5-25 g/L, for 30 min | N/A | ~42-90% silica removal | N/A | ||||
| Cooling tower water | TDS = N/A Silica = 100 mg/L |
Bench scale batch experiments: AA dose of 2 g/L in 50 mL of cooling tower water for 2 h at pH = 8.8 and 25 °C | N/A | 29% silica removal | N/A | [47] | |
| BW ROC | TDS = 12445 mg/L Silica = 160 mg/L |
Bench scale isotherm experiments: AA concentrations of 2.5-100 g/L in 200 mL of ROC for 24 h | N/A | Langmuir constant: maximum capacity (qmax) 625 mg/g | 26.6% regeneration efficiency after three 1 h batches using 0.1 N HCl | This study | |
| Bench scale column experiments: 40 mL of AA were poured into a 50 mL burette, Q = 8 mL/min (12 BV/h) | N/A | Column operation until 870 BV (34.8 L), with an adsorption capacity of 217.5 mg SiO2/g of AA | Regeneration in column: 16% of regeneration achieved after 80 BV (80 L/L of resin) using 1 N HCl |
AA = activated alumina; IX = ion exchange; WAC = weak acid cation exchange resin; SAC = strong acid cation exchange resin; N/A = not addressed; BV = bed volume; TDS = total dissolved solids; BW = brackish water; ROC = reverse osmosis concentrate; Q = flow rate; A = the conditions of the experiment are not specified; B = value calculated from provided data
Table 2.
Chemical characterization of ROC from KBHDP.
| Parameters | Unit | ROC |
|---|---|---|
| pH | - | 8.5 |
| Electrical conductivity (EC) | mS/cm | 18.8 |
| Dissolved organic carbon (DOC) | mg/L | 9.1 |
| Hardness (as CaCO3) | mg/L | 3000 |
| Alkalinity (as CaCO3) | mg/L | 350 |
| Silica (as SiO2) | mg/L | 160 |
| Lithium | mg/L | ND |
| Sodium | mg/L | 3,382 |
| Ammonium | mg/L | ND |
| Potassium | mg/L | 90.2 |
| Magnesium | mg/L | 211.67 |
| Calcium | mg/L | 846.7 |
| Fluoride | mg/L | 17.1 |
| Chloride | mg/L | 5634 |
| Nitrite | mg/L | 25.3 |
| Bromide | mg/L | 21.3 |
| Nitrate | mg/L | 15 |
| Sulfate | mg/L | 1,393 |
| Phosphate | mg/L | ND |
| Total dissolved solids (TDS) | mg/L | 12,445 |
ND = non detected.
Table 3.
Physicochemical properties and recommended operational conditions of IX resins for silica and hardness removal*.
Table 3.
Physicochemical properties and recommended operational conditions of IX resins for silica and hardness removal*.
| Physicochemical properties | Silica removal | Hardness removal | |||
|---|---|---|---|---|---|
| SRIX-1 | SRIX-2 | HRIX-1 | HRIX-2 | HRIX-3 | |
| Copolymer | Styrene-divinylbenzene | Polystyrene crosslinked with divinylbenzene | Crosslinked acrylic | Polystyrene crosslinked with divinylbenzene | Acrylic gel |
| Matrix | Gel | Macroporous | Macroporous | Gel | Gel |
| Type | SBA | SBA | WAC | SAC | WAC |
| Functional group | Trimethyl ammonium |
Quaternary Ammonium | Carboxylic acid | Sulfonic acid | Carboxylic acid |
| Ionic form as shipped | Cl- | Cl- | H+ | Na+ | H+ |
| Total exchange capacity | 1.2 eq/L (Cl- form) |
1.2 eq/L (Cl- form) |
≥ 4.7 eq/L (H+ form) |
≥ 4.56 eq/L (Na+ form) |
≥ 4.2 eq/L (H+ form) |
| Water retention capacity | 49-59% (Cl- form) | 50-60% (Cl- form) | 40 - 50% (H+ form) |
37 - 47% (Na+ form) |
43 - 60% (H+ form) |
| Particle diameter | 600 - 750 µm | 300 - 1200 µm | 500 - 700 µm | 650 ± 50 µm | 297 - 1190 µm |
| Temperature range | 5-100 ºC (41-212 ºF) | <100 °C (212 °F) | 5-120 ºC (41-248 ºF) |
<60 ºC (140 ºF) | <100 ºC (212ºF) |
| pH range | 1-14 | 1-14 | 6-14 | 1-14 | >7 |
*Adapted from the Product Data Sheet of each resin.
Table 4.
Service cycle operation of continuous column experiments.
| Service cycle | Resin bed volume (BV) |
Service flow rate (SFR) |
Flow rate (Q) | Empty Bed Contact Time (EBCT) |
| mL | BV/h | mL/min | min | |
| Column operation | 40 | 12 | 8 | 5 |
| Backwash | 40 | 75 | 50 | 0.8 |
| Regeneration | 40 | 12 | 8 | 5 |
| DI water rinse | 40 | 12 | 8 | 5 |
Table 5.
Typical chemical composition of activated alumina for silica removal*.
| Typical chemical composition, % | AA-1 | AA-2 | AA-3 |
|---|---|---|---|
| Al2O3 | 92 | 92 | - |
| SiO2 | 0.02 | 0.03 | < 0.02 |
| Fe2O3 | 0.03 | 0 | < 0.01 |
| Na2O | 0.3 | 0.35 | < 0.4 |
| Typical physical properties | |||
| Particle size, μm Surface area, m2/g |
600 315 |
300 380 |
600 275 |
| Packed bulk density, lb/ft3 (kg/m3) | 47 (752) | 40 (641) | - |
*Adapted from the Product Data Sheet of each AA.
Table 7.
Results summary of batch regeneration/elution experiments.
| AA | Silica adsorbed | Regenerant | Regenerant concentration |
# of batches | Temperature | Contact time | Regeneration/ elution |
|---|---|---|---|---|---|---|---|
| AA-1 | 23.5 mg/g | NaOH | 2, 8 and 10% | 3 | 25 °C | 1 h | 0 |
| H2SO4 | 0.1 N | 3 | 25 °C | 1 h | 10.1 % | ||
| NaOH/H2SO4 | NaOH 2% H2SO4 0.1 N |
1 | 25 °C | 1 h each | 4.5 % | ||
| AA-2 | 42 mg/g | NaOH | 2% | 1 | 25 °C | 1, 12 and 24 h | 0 |
| 50 °C | 1 h | 0 | |||||
| 6% | 1 | 25 °C | 1, 12 and 24 h | 0 | |||
| 50 °C | 1 h | 0 | |||||
| 8% | 1 | 25 °C | 1, 12 and 24 h | 0 | |||
| 50 °C | 1 h | 0 | |||||
| H2SO4 | 0.1 N | 3 | 25 °C | 1 h | 10.4 % | ||
| NaOH/H2SO4 | NaOH 2% H2SO4 0.1 N |
1 | 25 °C | 1 h each |
5.3 % | ||
| 59 mg/g | HCl | 0.05 N | 3 | 25 °C | 1 h | 2.9 % | |
| 0.1 N | 3 | 25 °C | 1 h | 10.7 % | |||
| 1 N | 3 | 25 °C | 1 h | 19.8 % | |||
| 33.3 mg/g | HCl | 0.1 N | 3 | 25 °C | 2 h | 9.6 % | |
| 3 h | 12.8 % | ||||||
| 12 h | 22.8 % | ||||||
| 40 °C | 1 h | 18.6 % | |||||
| 50 °C | 1 h | 22.9 % | |||||
| 60 °C | 1 h | 26.6 % |
Table 9.
Maximum RO water recovery with different silica and hardness concentrations using antiscalant Vitec 7400 and Vitec 1070 simulated with Avista AdvisorCi.
Table 9.
Maximum RO water recovery with different silica and hardness concentrations using antiscalant Vitec 7400 and Vitec 1070 simulated with Avista AdvisorCi.
| Maximum water recovery (%) with Vitec 7400 | ||||||
| Silica concentration (mg/L) | ||||||
| 10 | 37.5 | 75 | 112.5 | 160 | ||
| Hardness (mg/L as CaCO3) | 980 | 80 (AA+IX effluent) | − | − | − | − |
| 1417 | 79 | 78 | − | − | − | |
| 1882 | 77 | 76 | 75 | − | − | |
| 2336 | 76 | 74 | 72 | 68 | − | |
| 2800 | 75 (AA effluent) | 74 | 72 | 70 | 64 (ROC) | |
| Maximum water recovery (%) with Vitec 1070 | ||||||
| Silica concentration (mg/L) | ||||||
| 10 | 37.5 | 75 | 112.5 | 160 | ||
| Hardness (mg/L as CaCO3) | 980 | 80 (AA+IX effluent) | − | − | − | − |
| 1417 | 78 | 72 | − | − | − | |
| 1882 | 77 | 68 | 52 | − | − | |
| 2336 | 76 | 65 | 53 | 28 | − | |
| 2800 | 75 (AA effluent) | 64 | 53 | 30 | 4 (ROC) | |
Disclaimer/Publisher’s Note: The statements, opinions and data contained in all publications are solely those of the individual author(s) and contributor(s) and not of MDPI and/or the editor(s). MDPI and/or the editor(s) disclaim responsibility for any injury to people or property resulting from any ideas, methods, instructions or products referred to in the content. |
© 2025 by the authors. Licensee MDPI, Basel, Switzerland. This article is an open access article distributed under the terms and conditions of the Creative Commons Attribution (CC BY) license (http://creativecommons.org/licenses/by/4.0/).
Copyright: This open access article is published under a Creative Commons CC BY 4.0 license, which permit the free download, distribution, and reuse, provided that the author and preprint are cited in any reuse.


