Submitted:
04 February 2025
Posted:
05 February 2025
You are already at the latest version
Abstract
Inductively coupled plasma mass spectrometry (ICP-MS) is important in the biological and biochemical fields as it can quantify trace elements. Confocal laser Raman micros-copy (CLRM), a powerful tool for the compositional analysis of biological samples, or-ganic materials, and inorganic materials, can be used to analyze samples in aqueous solutions. Despite their analytical strength, the quantitative evaluation of proteins bound to mesoporous silica (SiO2) microspheres, which are promising candidates for drug delivery systems and vaccine carriers, has not been sufficiently explored. Therefore, we investigated the applicability of ICP-MS and CLRM to quantify lactoferrin (LF), a widely studied iron-containing protein bound to mesoporous SiO2 microspheres (SBA24). The bound LF amount was measured using ICP-MS, selectively monitoring iron derived from LF as a marker element, and CLRM. The results were compared with those obtained using a conventional bulk analysis technique. The amounts and trends of the signal intensities obtained using ICP-MS and CLRM agreed with each other and with the bulk analysis results. Our findings demonstrate that ICP-MS and CLRM are applicable for the quantitative evaluation of iron-containing proteins bound to SBA24. These methods offer a reliable platform for quantification of biomolecules on micro-particles and provide valuable insights for biomedical research and quality control in related industries.
Keywords:
iron-containing proteins
; quantification
; silica
; microsphere
; ICP-MS
; confocal laser Raman microscopy
1. Introduction
The design, synthesis, and testing of nano- and micron-sized particles are highly active research areas in materials science and therefore require the continuous development of analytical particle characterization techniques [1]. The primary particle properties include morphology, size, structure, composition, density, and porosity. Many studies have shown that among the various types of particles, porous particles have enhanced physicochemical properties and wide potential applications, including photocatalysis, drug delivery, photonic materials, batteries, absorbents, and fuel cells [2].
Porous silica (SiO2) particles find wide-scale applications as catalyst supports, adsorbents, molecular sieves, chemical sensors, and so on [3,4,5,6,7]. Some research (e.g., [8]) also found that mesoporous SiO2 (MPS) particles are very promising medical drug carriers. Owing to their unique properties, such as superior binding and adsorption, porous/mesoporous SiO2 particles have attracted considerable attention for various applications.
The binding/adsorption of nanoparticles (NPs) [9] or biomolecules, such as proteins [10], on porous microspheres has been extensively studied. For example, Kim et al. [9] produced mesoporous polymer microspheres with gold (Au) NPs inside their pores to observe the adsorption behavior of these NPs considering their surface functionality and porosity. Brunauer–Emmett–Teller (BET) experiments on Au/poly (ethylene glycol dimethacrylate-co-acrylonitrile) composite microspheres, used to measure the microsphere porosity, revealed that the adsorption of Au NPs into the pores kept the pore structure intact and made it more porous. Rafati et al. [10] used time-of-flight secondary ion mass spectrometry (ToF-SIMS) to investigate polymer microspheres for the controlled release of a therapeutic protein from an implantable scaffold. The ability of ToF-SIMS imaging to spatially image a polyvinyl alcohol (PVA) surfactant and protein adsorbed onto the surface of microspheres was demonstrated for the first time. Analytical techniques play a significant role in studying the properties of porous microspheres and in understanding the interactions between porous microspheres and NPs or biomolecules.
Inductively coupled plasma mass spectrometry (ICP-MS) is one of the most efficient, practical, and stable techniques of elemental analysis. ICP was used to ionize the atoms of the sample, which were then separated and identified based on their mass-to-charge ratios. It has been widely used for the analysis of metals and heteroatoms (e.g., P, S, Cl, Br, and I), particularly in the biological and biochemical fields, owing to its outstanding advantages of high sensitivity, low limit of detection, wide linear dynamic range, long-term stability, multi-element analysis capability, and high sample throughput [11,12]. For example, ICP-MS has been used to determine the target elemental composition of well-known iron (Fe)-iron-containing proteins such as lactoferrin (LF) and transferrin [13,14,15,16]. However, its applicability to the element-based quantification of Fe-containing proteins bound to mesoporous silica (SiO2) microspheres is unclear.
Confocal laser Raman microscopy (CLRM) can analyze the composition of samples from the Raman scattering spectrum generated by irradiating a sample with laser light [17,18,19,20,21]. Furthermore, because it can analyze samples in aqueous solutions, it has been used in recent years to analyze cultured cells and organic materials [17,18,19,20,21]. Additionally, its capability to provide spatially resolved chemical imaging allows detailed analysis of heterogeneous samples. However, CLRM is inherently limited by the weak intensity of Raman scattering, typically only a few thousand times the intensity of the incident laser light, which can pose challenges for certain samples. Similar to ICP-MS, the potential of CLRM for quantitative evaluation of Fe-containing proteins bound to mesoporous SiO2 microspheres remains underexplored.
In the present study, we investigated the applicability of ICP-MS and CLRM to the quantitative evaluation of LF bound to mesoporous SiO2 microspheres (SBA24) by measuring the amount of the bound LF using these techniques and comparing the results with those obtained by a bulk analysis technique used as a reference technique.
2. Results and Discussion
2.1. Element-Based Quantification of LF Bound to Mesoporous SiO2 Microspheres by ICP-MS
We quantitatively evaluated the effect of protein concentration on the adsorption of LF onto mesoporous SiO2 microspheres (SBA24) using ICP-MS based on a conventional calibration approach using an ion standard solution. The calibration curve for Fe standard solutions with a concentration range of 0–100 µg/L was established with a correlation coefficient (R2) of 1.000. The regression equation was y = 4015x + 1361 for 56Fe. As shown in Figure 1, the amount of the bound LF (0.27 mg/1 mg SBA24) at the 4-mg/mL protein was notably higher than that (0.14 mg/1 mg SBA24) at the 1-mg/mL protein: the proportion of LF adsorbed on the pores of SBA24 at the 4-mg/mL protein was approximately 27 wt% (by weight of SBA24), which was 1.9 times higher than that adsorbed to SBA24 at the 1-mg/mL protein (ca. 14 wt%). Moreover, we calculated the amount of the bound LF per particle using the number of particles (8.2 × 10⁷ particles) in 1 mg SBA24, which was calculated using the mean particle mass (1.2 × 10⁻⁸ mg) measured by single-particle ICP-MS (spICP-MS) in our previous study [22]. As shown in Supplementary Figure S1, the resultant values were 1.7 pg/particle at the 1-mg/mL protein and 3.3 pg/particle at the 4-mg/mL protein.
To demonstrate the limitations of the present ICP-MS technique, we estimated the limit of detection (LOD) and the limit of quantification (LOQ) as the ratio of 3σ and 10σ value of the blank signal to each of the isotopic sensitivity, respectively. The resultant LOD and LOQ were 0.0019 mg/1 mg SBA24 (corresponding to 0.19 wt% by weight of SBA24) and 0.0064 mg/1 mg SBA24 (0.64 wt%), respectively. Furthermore, we calculated the amount of bound LF per particle using the number of particles (8.2 × 10⁷ particles) in 1 mg SBA24, as described above. The resulting LOD and LOQ values were 0.024 pg/particle and 0.079 pg/particle, respectively. These results indicate that the present ICP-MS technique has LOD and LOQ for LF on the order of single micrograms per 1 mg SBA24 (i.e., tens of femtograms per particle), even though it can be influenced by multiple factors in the process of sample preparation and analysis.
2.2. Quantitative Evaluation of LF Bound to Mesoporous SiO2 Microspheres by Confocal Laser Raman Microscopy
The amount of LF bound to SBA24 was measured using CLRM. CLRM allows compositional analysis of samples by analyzing the Raman spectrum generated when a sample is irradiated with laser light [17,18,19,20]. In particular, during the analysis of biological samples, the positions of lipids and proteins in the biological sample can be identified from peaks in the Raman spectrum. Here, we analyzed the Raman spectrum when LF, a type of protein, was adsorbed onto SBA24 (Figure 2). Figures 2A and 2B show optical microscopy images of SBA24 with LF added at concentrations of 0–4 mg/mL. SBA24 with diameters of 3 µm to 5 µm were dispersed in the aqueous solution. However, optical microscopy images showed no structural changes in SBA24 due to the LF concentration.
Next, we performed Raman spectral mapping of the observation range shown in Figure 2B and obtained the average Raman spectrum within SBA24, as indicated by the arrow in Figure 2B (Figure 2C). To obtain the average Raman spectrum within the particle, the SBA24 area was masked (Supplementary Figure S2), and the average Raman spectrum within the mask was obtained. The Si peak at 1050 cm−1 has almost the same intensity at each LF concentration. However, differences due to concentration were observed in the protein Raman peak at 2900 cm−1 to 3000 cm−1 [21]. In addition, the spectrum of water from 3100 cm−1 to 3800 cm−1 showed intensity variations that were independent of LF concentration, which reflects the differences in the amount of water contained in the SBA24. Figure 2D shows a plot of the Raman spectrum of the protein enlarged from 2700 cm−1 to 3100 cm−1. When the LF concentration was 0 mg/mL, no peaks were observed (Figure 2D, gray line). In contrast, as the LF concentration increased from 2 mg/mL to 4 mg/mL, the peak around 2950 cm−1 increased (Figure 2D, red and blue lines).
Figure 3A shows the Raman spectrum map of the protein peak at 2939 cm−1. When the LF concentration was 0 mg/mL, no high-intensity areas were observed, and the image was almost noisy (Figure 3A, left side). When the LF concentration was 2 mg/mL, a small peak corresponding to LF incorporated into SBA24 was observed (Figure 3A, center). Furthermore, when the LF concentration was increased to 4 mg/mL, a region of strong protein peaks was observed within SBA24 (Figure 3A, right panel), indicating accumulation of LF within SBA24. Figure 3B shows a Raman spectrum map of the water peak at 3419 cm−1. In this map, the water peak of SBA24 was slightly reduced and appeared dark blue. This was due to the slightly reduced amount of water present within SBA24 compared to the surrounding water.
From the Raman spectrum map images of each LF concentration, 47–55 SBA24 particles were selected, and the Raman intensities of protein and water for each particle were obtained (Figures 3C and 3D). When the LF concentration was 0 mg/mL, the protein intensity was almost 0, but as the LF was increased to 2 mg/mL and 4 mg/mL, the Raman intensity also increased from 0.78 to 1.6 (Figure 3C). In contrast, the Raman peak intensity of water did not differ with concentration (Figure 3D). There was some variation in the spectral intensity, which was attributed to the variation in the water content of SBA24. To correct for this variation in the water content of SBA24, the ratio of the protein peak to the water peak was measured, and the LF concentration was compared (Figure 3E). This result was almost the same as that of the protein peak intensity, confirming that the effect of variation due to water content in SBA24 was small.
2.3. Quantification of LF Bound to Mesoporous SiO2 Microspheres by a Bulk Analysis Technique
The effect of protein concentration on the adsorption of LF onto SBA24 was quantitatively evaluated using a bulk analysis technique (used as a reference) (Figure 1). The amount of the bound LF (0.27 mg/1 mg SBA24) at the 4-mg/mL protein was notably higher than that (0.09 mg/1 mg SBA 24) at the 1-mg/mL protein: the proportion of LF adsorbed on the pores of SBA24 at the 4-mg/mL protein was approximately 27 wt% (by weight of SBA24), which was 3.0 times higher than that adsorbed to SBA24 at the 1-mg/mL protein (ca. 9 wt%).
2.4. Comparison of the Quantification Results Obtained from the Above-Mentioned Techniques
The amount of bound LF was measured using both ICP-MS and CLRM, and the results were compared with those obtained using bulk analysis (used as a reference technique). As shown in Figure 1, the amounts of bound LF obtained using ICP-MS and bulk analysis were within the analytical uncertainty. At the 4-mg/mL protein, for example, the amounts of the bound LF were (0.27 ± 0.16) mg/1 mg SBA24 and (0.27 ± 0.06) mg/1 mg SBA24, respectively, as the mean of three subsamples (n = 3) ± the corresponding standard deviation. Furthermore, the signal intensities obtained from the bound LF using CLRM (Figure 3) agreed well with those obtained using ICP-MS and bulk analysis (Figure 1). Thus, ICP-MS and CLRM are applicable to the quantitative evaluation of Fe-containing proteins bound to SBA24. These techniques have considerable potential for the quantitative evaluation of diverse biological objects, such as metalloproteins and lipids [23], bound to SBA24 in various application fields.
As shown in Figure 1, the amount of bound LF at 4-mg/mL protein was significantly higher than that at the 1-mg/mL protein. This suggests that the amount of protein binding depends considerably on LF concentration. Thus, LF-bound SBA24 can be easily prepared by successful binding of LF molecules to the pores. LF is positively charged under buffer conditions (pH 7.4) because its theoretical isoelectric point is 8.67; therefore, it is thought that LF adsorption to the negatively charged silica surface is facilitated by electrostatic interactions.
3. Materials and Methods
3.1. Materials
Mesoporous SiO2 microspheres (SBA24 with a pore diameter of 23.5–23.6 nm) were synthesized based on previously reported methods [24,25]. The dried SBA24 powder was stored at 20–25 ℃ in a sealed desiccator until further use. Dried LF powder (product code 123-04124) was purchased from FUJIFILM Wako Pure Chemical Corporation (Osaka, Japan). The 10× Tris-buffered saline (TBS) buffer (pH 7.4; product code 317-90175); Nippon Gene Corporation (Toyama, Japan) was diluted 10-fold with ultrapure water to prepare TBS. The solution was then used to suspend SBA 24 and dissolve LF.
For creating a calibration curve in ICP-MS, ion standard solutions of Fe with different concentrations of 0–100 µg/L in 2 % HNO3 and that of yttrium (Y) with a stock concentration of 125 µg/L in 2 % HNO3 were gravimetrically prepared from 1000 mg/L single-element standard solutions (Kanto Chemical Corporation, Tokyo, Japan). Nitric acid (HNO3) and hydrochloric acid (HCl) (ultrapure grade; Kanto Chemical Corporation) were used for the acid digestion of LF bound to SBA24 and to prepare solutions such as 2 % HNO3.
3.2. Sample Preparation
Approximately 1 mg of dried SBA24 powder was weighed in a tube. One milliliter of aqueous TBS buffer (pH 7.4) was added to the tube and rigorously vortexed twice for a few seconds each. The resultant suspension was gently rotated at 20–25 ℃ for 5 min. The SBA24 suspension was centrifuged at 12 000–19 000× g for 1 min at 20 ℃, and the remaining pellet was used as TBS-equilibrated SBA24 for further experiments.
LF was used as a representative Fe-containing protein for binding to SBA24. A bottle of LF stored in a refrigerator was left to stand for 15–30 min before being returned to 20–25 ℃. Appropriate amounts of LF (1 and 4 mg) were added to each tube. One milliliter of TBS was added to each tube, gently vortexed for 3 s, and slowly rotated for 30 min at 20–25 ℃ for complete dissolution. Thereafter, the resultant solution was centrifuged at 19 000× g for 5 min at 20 ℃. The supernatant (i.e., the dissolved protein fraction) was transferred to a new tube and used as the protein solution to prepare LF-bound SBA24.
The adsorption of LF onto the pores of SBA24 was performed by combining 1 mL of a protein solution containing LF (0, 1, and 4 mg) with 1 mg of TBS-equilibrated SBA24. The LF-SBA24 mixtures were gently agitated using a rotator for 10 min at 20 ℃ and centrifuged at 20 000 × g for 1 min at 20 ℃. After centrifugation, LF-bound SBA24 was rinsed twice with 1 mL of TBS for the subsequent quantitative evaluation of LF bound to SBA24 by ICP-MS and CLRM.
3.3. Element-Based Quantification of LF Bound to Mesoporous SiO2 Microspheres by ICP-MS
Element-based quantification of LF bound to SBA24 was performed by ICP-MS using Fe as a marker of LF. LF bound to SBA24 was subjected to acid digestion according to a previously reported method [26]. Briefly, LF-bound SBA24 was dispersed in TBS (1 mL). Three subsamples (approximately 0.3 g each) taken from each dispersion were accurately weighed into different tubes, and 2 mL of aqua regia (a mixture of HNO3 and HCl in a 1:3 ratio) was added to each tube. The tube was shaken vigorously and sonicated in a Branson Ultrasonic Bath (M5800H-J; Branson Ultrasonics Corporation, CT, USA) for 10 min at 20–25 ℃ to obtain a homogeneous dispersion. Thereafter, the sample was diluted to 10 mL with 2 % HNO3. The amount of Fe in the sample was determined using a quadrupole ICP-MS instrument (Agilent 7700x ICP-MS; Agilent Technologies, CA, USA) equipped with an ICP torch with an injector tube diameter of 2.5 mm, a conventional MicroMist nebulizer, and a Scott double-pass spray chamber cooled at 2 ℃ in combination with the Agilent Integrated Sample Introduction System (ISIS). The ICP-MS instrument was tuned daily using a tuning solution containing 1 µg/L each of Li, Co, Y, Ce, and Tl in 2 % HNO3 for optimum signal intensity and stability. The typical operating conditions of the ICP-MS instrument are listed in Table 1.
To determine the amount of Fe in the LF-bound SBA24 by ICP-MS, external calibration with internal standard correction was applied to compensate for physical interference, correct for variations in the instrument response as the analysis proceeded (signal drift), and calculate the analyte (Fe) concentrations of the samples [27]. For this purpose, Y with a monoisotopic mass of 89 was chosen as the internal standard element because it is usually not present at significant levels. The stock solution of Y (125 µg/L in 2 % HNO3) was added to each sample and calibration standard solution at the final concentration of approximately 1.2 µg/L. A calibration curve of Fe was composed of four concentration points (0 µg/L, 1 µg/L, 10 µg/L, and 100 µg/L in 2 % HNO3). The amount of Fe determined by ICP-MS with external calibration and internal standard correction was converted into the amount of LF using the percentage of Fe (0.029 %) as reported by the manufacturer.
3.4. Quantitative Evaluation of LF Bound to Mesoporous SiO2 Microspheres by Confocal Laser Raman Microscopy
Five microliters of the solution sample in which SBA24 was suspended was dropped onto a slide glass, and the top was sealed with a cover glass by sandwiching 5 µm-thick double-sided tape. The samples were observed under CLRM using a 532 nm Nd:YAG laser (alpha300R; WITec, Ulm, Germany). The spectra were acquired using a Peltier-cooled charge-coupled device detector (DV401-BV, Andor, UK) at 600 gratings/mm (UHTS 600; WITec). Raman data were analyzed using the WITec suite (version 5.0; Lab Co., Northampton, MA, USA) and MATLAB R2021a. For observation of MNT-1 cells, a 25 µm × 25 µm area at the cell center was scanned at 100 pixels × 100 pixels using a 50 × objective lens at laser intensities of 20 mW at 50 ms for each pixel. From the Raman map images of SBA24 with LF concentrations between 0 mg/mL and 4 mg/mL, 55 particles (0 mg/mL), 50 particles (2 mg/mL), and 47 particles (4 mg/mL) were picked, and the outline of each particle was manually masked. The average Raman spectrum within a particle was calculated by averaging the Raman spectra of each pixel contained within the mask and dividing it by the number of pixels in the mask.
3.5. Quantification of LF Bound to Mesoporous SiO2 Microspheres by a Bulk Analysis Technique
To quantify LF bound to SBA24 by bulk analysis, the adsorption of LF on the pores of SBA24 was performed by combining 1 mL of a protein solution containing LF (1 mg and 4 mg) with 1 mg of TBS-equilibrated SBA24. The LF-SBA24 mixtures were gently agitated using a rotator for 10 min at 20 ℃ and centrifuged for 1 min at 20 000 × g, and then the supernatant was recovered. To determine the amount of LF bound to SBA24, the protein concentration in the first supernatant was spectrophotometrically determined using a Pierce 660 nm Protein Assay (Thermo Fisher Scientific, Rockford, IL, USA). This assay utilizes a dye-metal complex that interacts with specific amino acid residues under acidic conditions, resulting in a detectable color change at 660 nm, which correlates with the protein concentration. The LF concentration was evaluated by measuring protein absorbance at 660 nm using an absorbance microplate reader (SpectraMax iD3; Molecular Devices, LLC., San Jose, CA, USA). The amount of LF adsorbed onto SBA24 was determined by subtracting the concentration of LF remaining in the supernatant from that before binding.
4. Conclusions
According to the results obtained in this study, ICP-MS and CLRM are applicable to the quantitative evaluation of Fe-containing proteins bound to mesoporous SiO2 microspheres. They have considerable potential for the quantitative evaluation of diverse biological objects, such as proteins and lipids [23], bound to mesoporous SiO2 microspheres in various fields, including drug delivery systems, sustained-release drugs administered in vivo, vaccine carriers, and biosensors.
The ICP-MS analysis revealed that the protein bound to SBA24 was 1.7–3.3 pg/particle, and CLRM successfully detected and quantitatively evaluated this protein. Colorimetric methods, such as bicinchoninic acid (BCA) protein assays, are simple to operate and widely used but have limited specificity, sensitivity, background noise resistance, and structural information. Although CLRM and ICP-MS generally offer superior performance, this study shows their applicability in quantifying proteins bound to microparticles, addressing their limitations, and providing complementary advantages for precise protein analysis.
In a previous study [22], we investigated the applicability of spICP-MS for the measurement of micrometer-sized SiO2 microspheres and the detection of Fe-containing proteins (i.e., LF and transferrin) bound to mesoporous SiO2 microspheres. Based on the results obtained, we conclude that spICP-MS is applicable to the particle size measurement of non-porous/mesoporous SiO2 microspheres and has considerable potential for element-based detection and qualification of proteins bound to mesoporous SiO2 microspheres in a variety of applications. In the near future, we will continue to investigate the potential of element-based quantification of proteins bound to mesoporous SiO2 microspheres.
Supplementary Materials
The following supporting information can be downloaded at the website of this paper posted on Preprints.org. Figure S1: Quantification results of the protein (LF) (in terms of amounts per particle) bound to mesoporous SiO2 microspheres by element-based ICP-MS analysis and bulk analysis (absorbance measurement) techniques using the number of particles (8.2 × 10⁷ particles) in 1 mg SBA24 (calculated with the mean particle mass of 1.2 × 10⁻⁸ mg determined by spICP-MS); Figure S2: Mask images for calculating the Raman spectrum of SBA24 particles. Images of each mask were used to calculate the Raman spectrum at LF concentrations of 0, 2, and 4 (mg/mL). The average value of the Raman spectrum for each pixel in the mask was calculated to obtain the result shown in Figure 2(C).
Author Contributions
Conceptualization, S.-i.M. (Shin-ichi Miyashita), S.-i.M. (Shun-ichi Matsuura), T.O. and E.F.; Methodology, S.-i.M. (Shun-ichi Matsuura), T.O. and E.F.; Validation, S.-i.M. (Shin-ichi Miyashita), S.-i.M. (Shun-ichi Matsuura) and T.O.; Formal analysis, S.-i.M. (Shun-ichi Matsuura) and T.O.; Investigation, S.-i.M. (Shin-ichi Miyashita), S.-i.M. (Shun-ichi Matsuura), T.O. and E.F.; Resources, S.-i.M. (Shin-ichi Miyashita), S.-i.M. (Shun-ichi Matsuura), T.O. and E.F.; Data curation, S.-i.M. (Shin-ichi Miyashita), S.-i.M. (Shun-ichi Matsuura) and T.O.; Writing and original draft preparation, S.-i.M. (Shin-ichi Miyashita); Writing, review, and editing, S.-i.M. (Shun-ichi Matsuura), T.O. and E.F.; Visualization, S.-i.M. (Shin-ichi Miyashita), S.-i.M. (Shun-ichi Matsuura) and T.O.; Supervision, E.F.; Project administration, E.F. All authors have read and agreed to the published version of the manuscript.
Funding
This study received no external funding.
Institutional Review Board Statement
Not applicable.
Informed Consent Statement
Not applicable.
Data Availability Statement
Data presented in this study are available upon request from the corresponding author. The data is not publicly available due to privacy concerns.
Acknowledgments
The authors thank Miho Iida for technical assistance.
Conflicts of Interest
The authors declare no conflict of interest.
Abbreviations
The following abbreviations are used in this manuscript:
| ICP-MS | Inductively coupled plasma mass spectrometry |
| CLRM | Confocal laser Raman microscopy |
| NPs | Nanoparticles |
| BET | Brunauer–Emmett–Teller |
| ToF-SIMS | Time-of-flight secondary ion mass spectrometry |
| PVA | Polyvinyl alcohol |
| spICP-MS | Single-particle ICP-MS |
| LOD | Limit of detection |
| LOQ | Limit of quantification |
References
- Mourdikoudis, S.; Pallares, R.M.; Thanh, N.T.K. Characterization Techniques for Nanoparticles: Comparison and Complementarity Upon Studying Nanoparticle Properties. Nanoscale. 2018, 10, 12871–12934. [CrossRef]
- Chang, H.; Jang, H.D. Controlled Synthesis of Porous Particles via Aerosol Processing and Their Applications. Adv. Powder Technol. 2014, 25, 32–42. [CrossRef]
- Yan, N.; Xiao, C.; Kou, Y. Transition Metal Nanoparticle Catalysis in Green Solvents. Coord. Chem. Rev. 2010, 254, 1179–1218. [CrossRef]
- Mondloch, J.E.; Bayram, E.; Finke, R.G. A Review of the Kinetics and Mechanisms of Formation of Supported-Nanoparticle Heterogeneous Catalysts. J. Mol. Cat. A Chem. 2012, 355, 1–38. [CrossRef]
- Sápi, A.; Dobó, D.G.; Sebők, D.; Halasi, G.; Juhász, K.L.; Szamosvölgyi, Á.; Pusztai, P.; Varga, E.; Kálomista, I.; Galbács, G.; et al. Silica-Based Catalyst Supports Are Inert, Are They Not?: Striking Differences in Ethanol Decomposition Reaction Originated From Meso- and Surface-Fine-Structure Evidenced by Small-Angle X-ray Scattering. J. Phys. Chem. C. 2017, 121, 5130–5136. [CrossRef]
- Kurdyukov, D.A.; Eurov, D.A.; Kirilenko, D.A.; Sokolov, V.V.; Golubev, V.G. Tailoring the Size and Microporosity of Stöber Silica Particles. Micropor. Mesopor. Mater. 2018, 258, 205–210. [CrossRef]
- Rodrigues, T.S.; da Silva, A.G.M.; Camargo, P.H.C. Nanocatalysis by Noble Metal Nanoparticles: Controlled Synthesis for the Optimization and Understanding of Activities. J. Mater. Chem. A. 2019, 7, 5857–5874. [CrossRef]
- Narayan, R.; Nayak, U.Y.; Raichur, A.M.; Garg, S. Mesoporous Silica Nanoparticles: A Comprehensive Review on Synthesis and Recent Advances. Pharmaceutics. 2018, 10, 118. [CrossRef]
- Kim, Y.-J.; Kim, J.-W.; Lee, J.-E.; Ryu, J.-H.; Kim, J.; Chang, I.-S.; Suh, K.-D. Synthesis and Adsorption Properties of Gold Nanoparticles Within Pores of Surface-Functional Porous Polymer Microspheres. J. Polym. Sci. A Polym. Chem. 2004, 42, 5627–5635. [CrossRef]
- Rafati, A.; Boussahel, A.; Shakesheff, K.M.; Shard, A.G.; Roberts, C.J.; Chen, X.; Scurr, D.J.; Rigby-Singleton, S.; Whiteside, P.; Alexander, M.R.; et al. Chemical and Spatial Analysis of Protein Loaded PLGA Microspheres for Drug Delivery Applications. J. Control. Release. 2012, 162, 321–329. [CrossRef]
- Leclercq, A.; Nonell, A.; Todolí Torró, J.L.; Bresson, C.; Vio, L.; Vercouter, T.; Chartier, F. Introduction of Organic/Hydro-organic Matrices in Inductively Coupled Plasma Optical Emission Spectrometry and Mass Spectrometry: A Tutorial Review. Part I. Theoretical Considerations. Anal. Chim. Acta. 2015, 885, 33–56. [CrossRef]
- Calderón-Celis, F.; Encinar, J.R. A Reflection on the Role of ICP-MS in Proteomics: Update and Future Perspective. J. Proteomics. 2019, 198, 11–17. [CrossRef]
- Gajda-Morszewski, P.; Poznańska, A.; Yus, C.; Arruebo, M.; Brindell, M. Encapsulation of Iron-Saturated Lactoferrin for Proteolysis Protection With Preserving Iron Coordination and Sustained Release. Nanomaterials (Basel). 2023, 13, 2524. [CrossRef]
- Pryshchepa, O.; Rafińska, K.; Gołębiowski, A.; Sugajski, M.; Sagandykova, G.; Madajski, P.; Buszewski, B.; Pomastowski, P. Synthesis and Physicochemical Characterization of Bovine Lactoferrin Supersaturated Complex With Iron (III) Ions. Sci. Rep. 2022, 12, 12695. [CrossRef]
- Volden, J.; Jørgensen, C.E.; Rukke, E.O.; Egelandsdal, B. Oxidative Properties of Lactoferrins of Different Iron-Saturation in an Emulsion Consisting of Metmyoglobin and Cod Liver Oil. Food Chem. 2012, 132, 1236–1243. [CrossRef]
- Majka, G.; Śpiewak, K.; Kurpiewska, K.; Heczko, P.; Stochel, G.; Strus, M.; Brindell, M. A High-Throughput Method for the Quantification of Iron Saturation in Lactoferrin Preparations. Anal. Bioanal. Chem. 2013, 405, 5191–5200. [CrossRef]
- Ichimura, T.; Chiu, L.D.; Fujita, K.; Kawata, S.; Watanabe, T.M.; Yanagida, T.; Fujita, H. Visualizing Cell State Transition Using Raman Spectroscopy. PLOS One. 2014, 9, e84478. [CrossRef]
- Kopec, M.; Imiela, A.; Abramczyk, H. Monitoring Glycosylation Metabolism in Brain and Breast Cancer by Raman Imaging. Sci. Rep. 2019, 9, 166. [CrossRef]
- Okada, T.; Iwayama, T.; Ogura, T.; Murakami, S.; Ogura, T. Structural Analysis of Melanosomes in Living Mammalian Cells Using Scanning Electron-Assisted Dielectric Microscopy With Deep Neural Network. Comp. Struct. Biotechnol. J. 2023, 21, 506–518. [CrossRef]
- Mastrangelo, R.; Okada, T.; Ogura, T.; Ogura, T.; Baglioni, P. Direct Observation of the Effects of Chemical Fixation in MNT-1 Cells: A SE-ADM and Raman Study. Proc. Natl Acad. Sci. U. S. A. 2023, 120, e2308088120. [CrossRef]
- Howell, N.K.; Arteaga, G.; Nakai, S.; Li-Chan, E.C. Raman Spectral Analysis in the C-H Stretching Region of Proteins and Amino Acids for Investigation of Hydrophobic Interactions. J. Agric. Food Chem. 1999, 47, 924–933. [CrossRef]
- Miyashita, S.I.; Ogura, T.; Matsuura, S.I.; Fukuda, E. Particle Size Measurement and Detection of Bound Proteins of Non-porous/Mesoporous Silica Microspheres by Single-Particle Inductively Coupled Plasma Mass Spectrometry. Molecules. 2024, 29, 1086. [CrossRef]
- Yang, Y.; Li, J. Lipid, Protein and Poly (NIPAM) Coated Mesoporous Silica Nanoparticles for Biomedical Applications. Adv. Colloid Interface Sci. 2014, 207, 155–163. [CrossRef]
- Matsuura, S.; Ikeda, T.; Hiyoshi, N.; Chiba, M.; Yamaguchi, A. Assemblies of Two Multimeric Enzymes Using Mesoporous Silica Microspheres Toward Cascade Reaction Fields. Biochem. Eng. J. 2022, 182, 108416. [CrossRef]
- Matsuura, S.I.; Baba, T.; Ikeda, T.; Yamamoto, K.; Tsunoda, T.; Yamaguchi, A. Highly Precise and Sensitive Polymerase Chain Reaction Using Mesoporous Silica-Immobilized Enzymes. ACS Appl. Mater. Interfaces. 2022, 14, 29483–29490. [CrossRef]
- Cava-Montesinos, P.; Cervera, M.L.; Pastor, A.; de la Guardia, M. Room Temperature Acid Sonication ICP-MS Multielemental Analysis of Milk. Anal. Chim. Acta. 2005, 531, 111–123. [CrossRef]
- Bulska, E.; Wagner, B. Quantitative Aspects of Inductively Coupled Plasma Mass Spectrometry. Philos. Trans. A Math. Phys. Eng. Sci. 2016, 374, 20150369. [CrossRef]
Figure 1.
Quantification results of the protein (LF) bound to mesoporous SiO2 microspheres (1 mg SBA24) by element-based ICP-MS analysis and bulk analysis (absorbance measurement). techniques.
Figure 1.
Quantification results of the protein (LF) bound to mesoporous SiO2 microspheres (1 mg SBA24) by element-based ICP-MS analysis and bulk analysis (absorbance measurement). techniques.
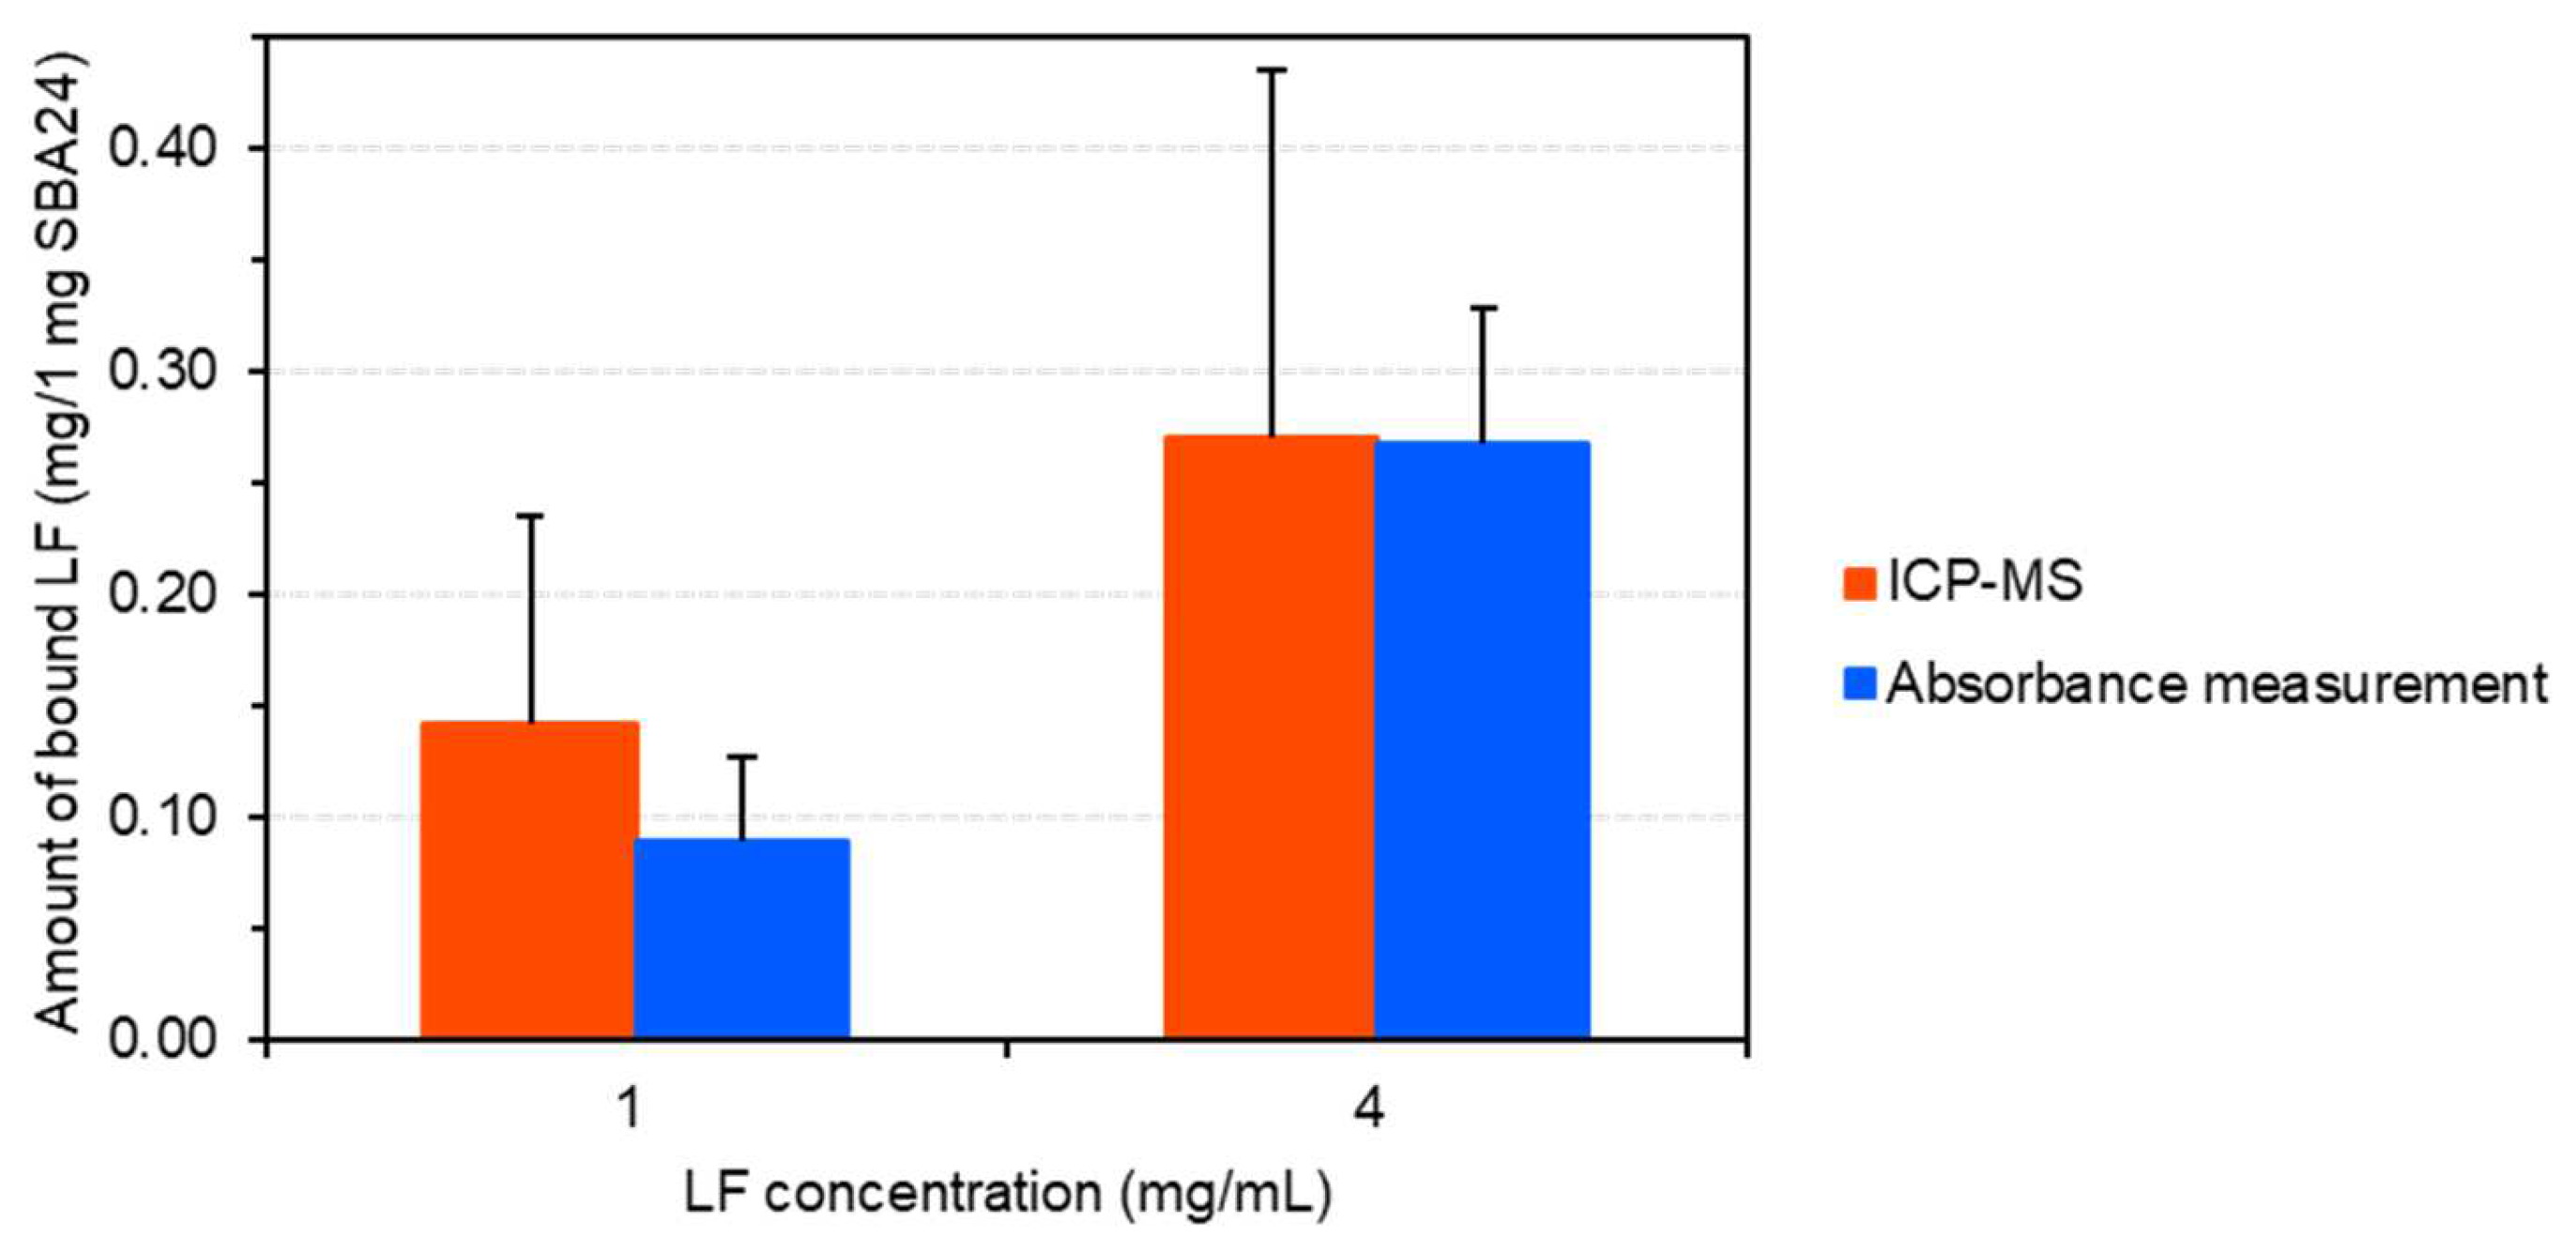
Figure 2.
Optical microscope images and Raman spectra of the SBA24 particles with different LF concentrations. (A) Images of SBA24 particles in solution at LF concentrations of 0, 2, and 4 (mg/mL). (B) Enlarged images of the center of each (A) image. (C) Raman spectrum of SBA24 particles indicated by the arrow in each (B) image. Spectral peaks of Si (1050 cm−1), water (3100 cm−1 to 3800 cm−1), and protein (2900 cm−1 to 3000 cm−1) can be clearly seen. (D) Enlarged Raman spectrum of the protein peak area. LF concentrations of 0 mg/mL are indicated by a black line, 2 mg/mL by a red line, and 4 mg/mL by a blue line. Scale bars, 10 µm in (A), 5 µm in (B).
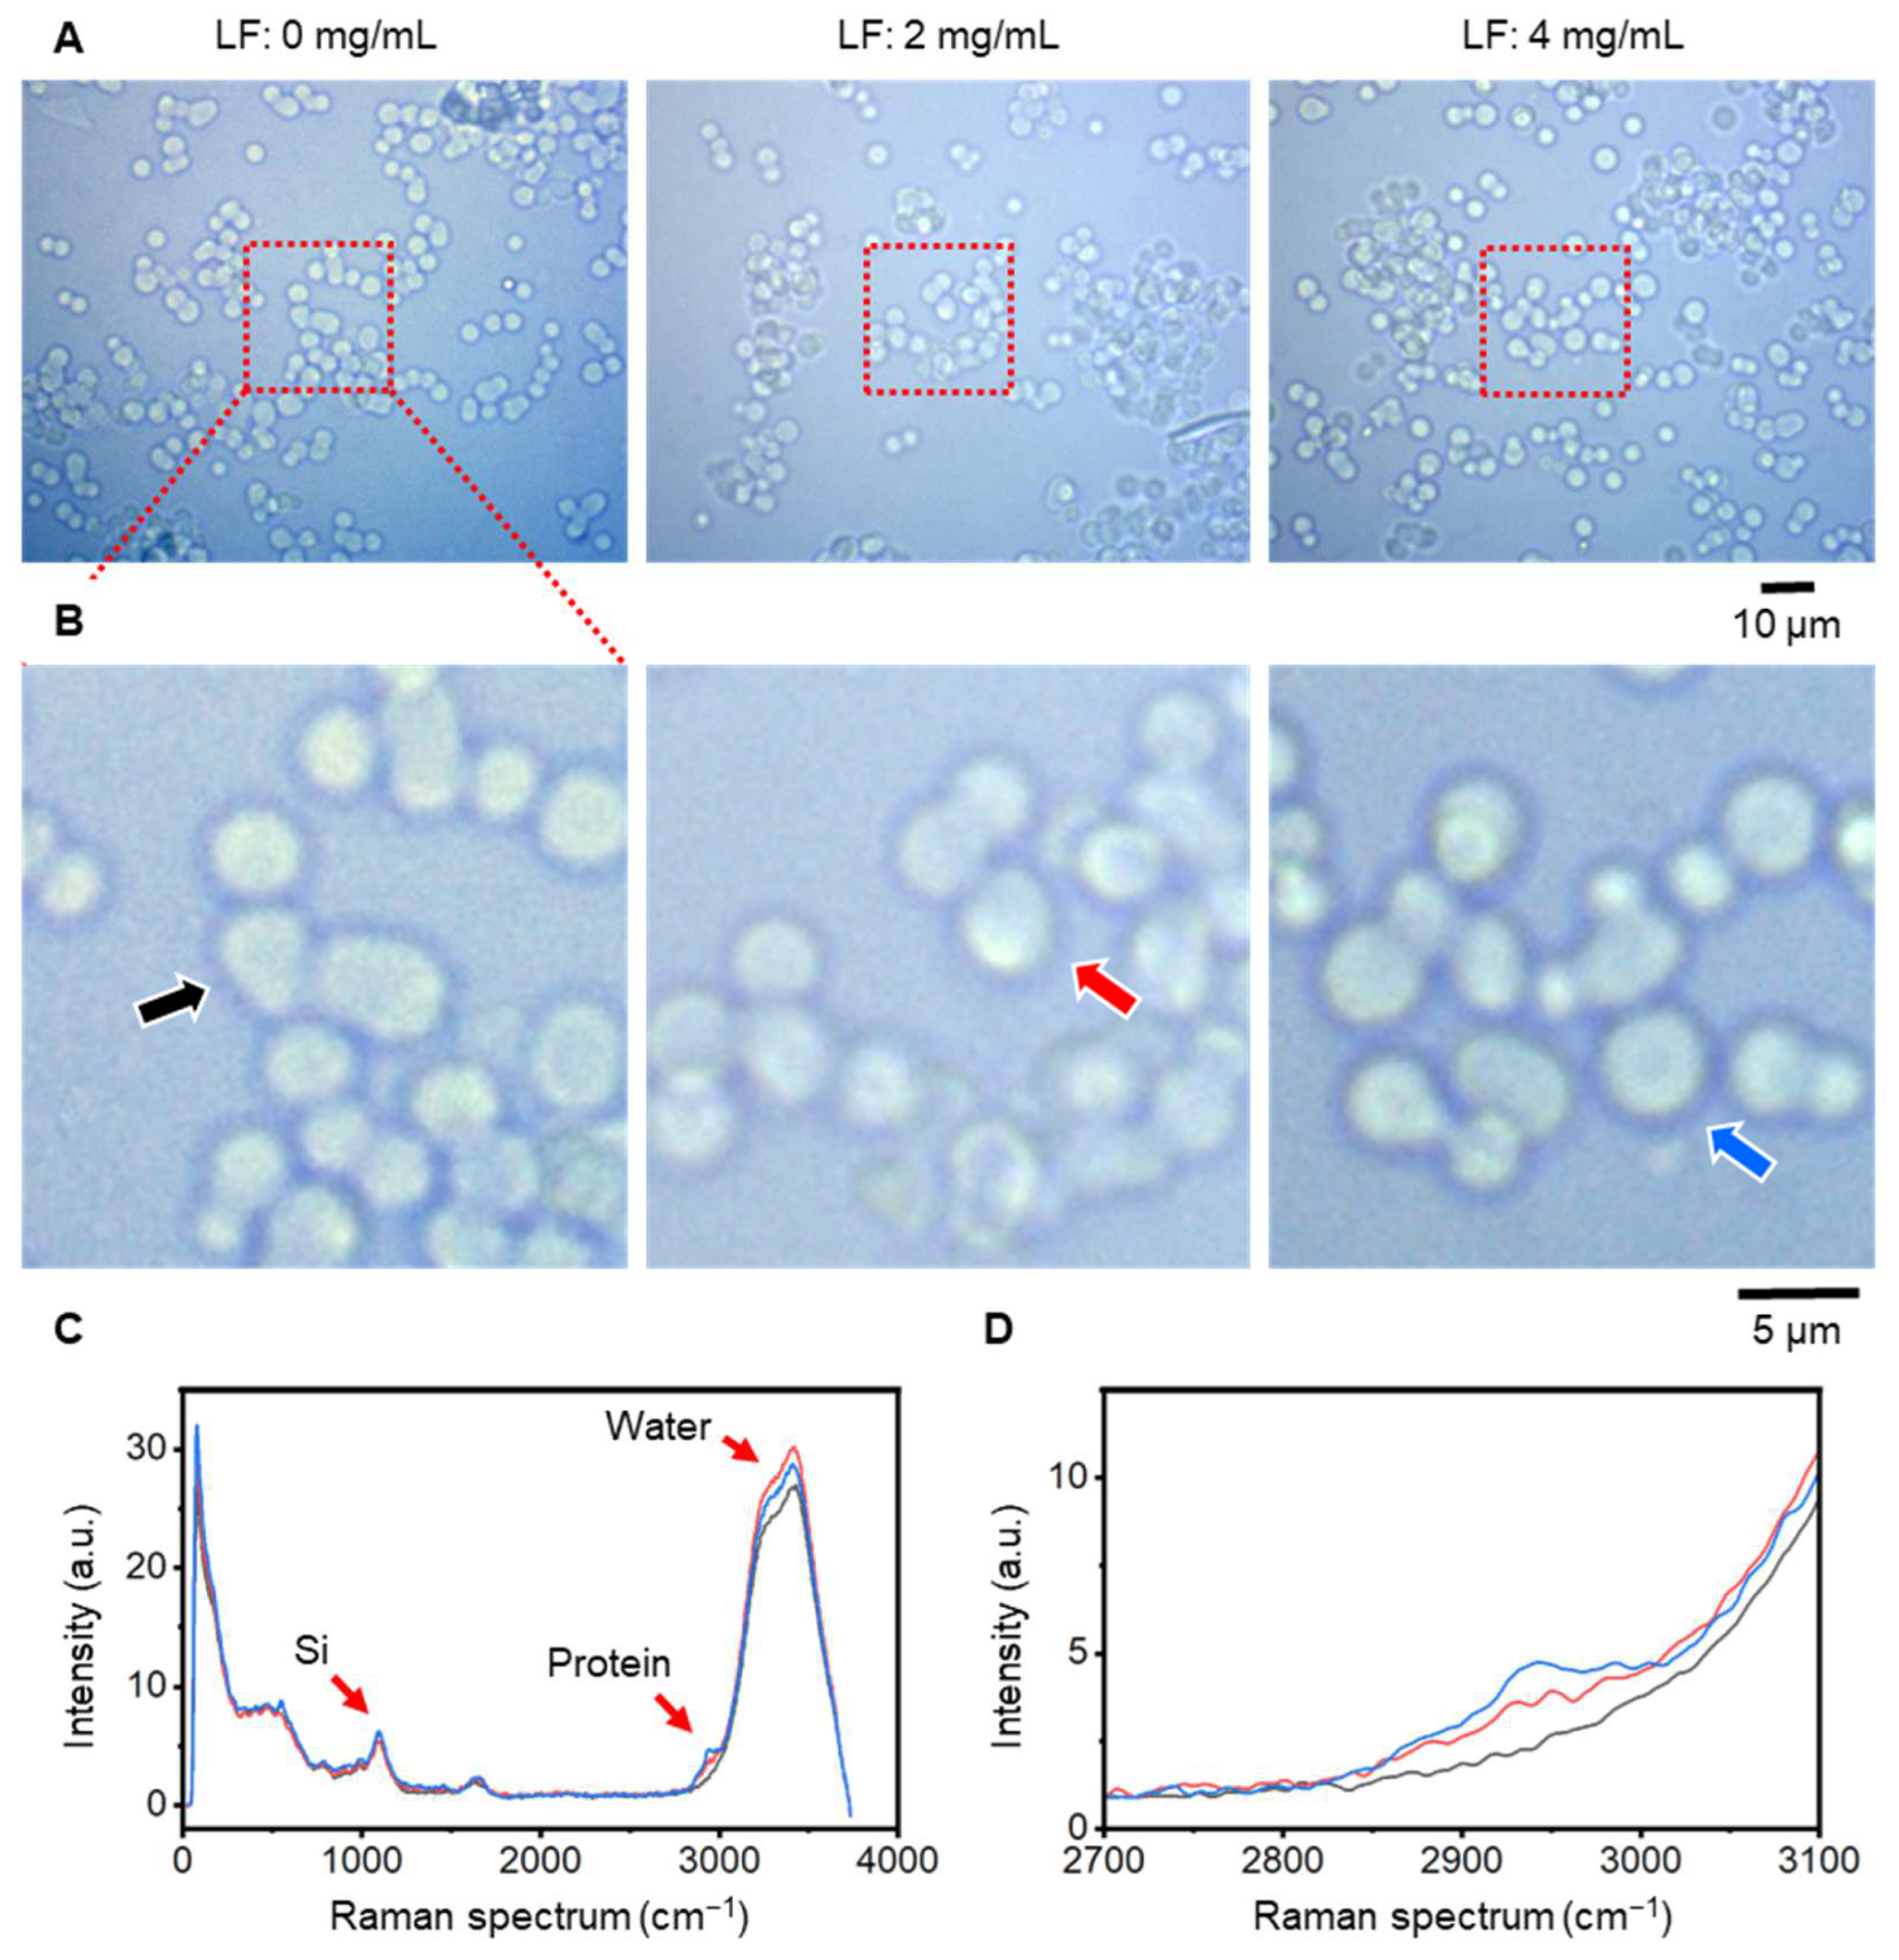
Figure 3.
Raman spectrum map of SBA24 particles at each LF concentration. (A) Raman map of the protein peak (2939 cm−1) at LF concentrations of 0, 2, and 4 (mg/mL). (B) Raman map of the water peak (3419 cm−1) at LF concentrations of 0, 2, and 4 (mg/mL). (C) Bar graph of the protein Raman peak (2939 cm−1) at each LF concentration. Blue dots indicate all data used in the calculation. (D) Bar graph of the water Raman peak at each LF concentration. (E) Bar graph of the ratio of Raman peak values of protein and water. Scale bars, 5 µm in (A) and (B).


Table 1.
Typical operating conditions of the ICP-MS instrument.
| Parameter | Setting |
|---|---|
| Plasma and sampling conditions | |
| RF power | 1550 W |
| Plasma gas flow rate | 15 L/min |
| Auxiliary gas flow rate | 0.90 L/min |
| Carrier (nebulizer) gas flow rate | 1.08 L/min |
| Nebulizer pump | 0.10 rps |
| Sampling position | 10.0 mm |
| Cell gas (He) flow rate | 5.0 mL/min |
| Data acquisition | |
| Scanning mode | Peak hopping |
| Data points | 3 points/peak |
| Dwell time | 0.6 s/point |
| Repetition | 10 times |
| Monitored isotope | 56Fe, 89Y |
Disclaimer/Publisher’s Note: The statements, opinions and data contained in all publications are solely those of the individual author(s) and contributor(s) and not of MDPI and/or the editor(s). MDPI and/or the editor(s) disclaim responsibility for any injury to people or property resulting from any ideas, methods, instructions or products referred to in the content. |
© 2025 by the authors. Licensee MDPI, Basel, Switzerland. This article is an open access article distributed under the terms and conditions of the Creative Commons Attribution (CC BY) license (http://creativecommons.org/licenses/by/4.0/).
Copyright: This open access article is published under a Creative Commons CC BY 4.0 license, which permit the free download, distribution, and reuse, provided that the author and preprint are cited in any reuse.


