Submitted:
31 January 2025
Posted:
03 February 2025
You are already at the latest version
Abstract
Background: obesity is a major contributor to cardiometabolic risks, including subclinical atherosclerosis and insulin resistance. This study investigates the roles of Trimethylamine N-oxide (TMAO) and resistin as obesity predictors, examining their associations with carotid intima-media thickness (CIMT) and metabolic parameters; Methods: sixty adults (18–71 years), spanning normal weight to obesity, were assessed for body mass index (BMI), waist-to-hip ratio (WHR), and waist circumference (WC). Body composition was measured using the TANITA BC-418 device, while subclinical atherosclerosis was evaluated via CIMT with the Aixplorer MACH 30 ultrasound system. Blood samples were analyzed for TMAO, resistin, and metabolic biomarkers; Results: TMAO, resistin, CIMT, fat mass, glucose, HbA1c, and lipid profiles significantly increased across BMI categories (p<0.001). TMAO correlated strongly with CIMT (r=0.674, p<0.001), indicating its role in subclinical atherosclerosis. Logistic regression identified TMAO (threshold 380; AUC=0.880, accuracy=91.7%) as a predictor of cardiometabolic risk. Resistin was associated with CIMT, WHR, and total cholesterol, inversely linked to LDL cholesterol (p=0.003). Less active participants exhibited higher TMAO (p=0.001) and resistin (p=0.02). Family histories of obesity and diabetes correlated with elevated TMAO, while resistin linked to shorter sleep duration and diabetes history, highlighting their importance in obesity-related cardiometabolic risks; Conclusions: TMAO is closely associated with abdominal fat, insulin resistance, and subclinical atherosclerosis, while resistin relates to lipid profiles and aging. Together, they provide a nuanced predictive model for obesity-related cardiometabolic risks, reinforcing their value in risk stratification and targeted management.
Keywords:
obesity
; carotid intima-media thickness
; resistin
; TMAO
; bioimpedance
; adipose tissue
Introduction
The escalating incidence of chronic metabolic disorders, with overweight, obesity, and diabetes serving as key contributing factors, has become a critical public health issue globally, affecting both industrialized and low- to middle-income countries [1,2]. The pervasive nature of these conditions underscores the urgent need for comprehensive strategies to mitigate their impact on population health [2,3]. Obesity is a multifaceted and insidious condition, marked by a range of associated complications. While genetic and epigenetic factors are established contributors to obesity, environmental variables (dietary habits, physical activity, and exposure to pollutants) are increasingly recognized as key drivers of its rising prevalence [4]. According to the World Health Organization and the US Centers for Disease Control, in 2016, 13% of adults aged 18 and older were classified as obese, while 39% were considered overweight [5,6]. The Lancet further projects that over 1 billion individuals worldwide will be affected by obesity as of 2022 [7]. Additionally, the global prevalence of overweight individuals has doubled since 1990, highlighting a significant and alarming trend.
Obesity has been linked to a wide spectrum of adverse health outcomes, including an elevated risk of cardiovascular diseases and the development of insulin resistance [8]. Beyond these well-established associations, obesity is also correlated with a significant increase in overall morbidity and mortality rates, contributing to a heightened susceptibility to various chronic conditions such as type 2 diabetes, certain cancers, respiratory disorders, ultimately leading to reduced life expectancy and diminished quality of life [8,9,10,11]. Consequently, an elevated BMI has been implicated in approximately 60% of global mortality, underscoring its significant contribution to the global burden of disease and its role as a critical determinant of adverse health outcomes [9]. Currently, BMI is regarded as a precise tool for assessing nutritional status at a population level, being the most frequently used instrument for this purpose [12,13,14]. Although BMI primarily reflects the amount of adipose tissue with generalized distribution and lacks the ability to provide detailed information, studies have demonstrated significant correlations between BMI values and cardiometabolic risk, as well as overall mortality risk [15,16]. Furthermore, regardless of BMI values, the percentage of adipose tissue may vary based on the individual's age and sex [17,18]. Moreover, our recent research highlighted that BMI determination among individuals with overweight and obesity exhibits superior accuracy in predicting this metabolic condition compared to models based solely on adiposity measurement [19]. Anthropometric parameters, particularly WC and WHR, are widely recognized as critical indicators of cardiometabolic risk and have been extensively studied for their role in the development of cardiometabolic diseases such as type 2 diabetes, hypertension, and cardiovascular disease [20]. WC is a direct measure of central obesity, reflecting abdominal fat accumulation, which is strongly associated with insulin resistance, dyslipidemia, and systemic inflammation, all of which contribute to the pathogenesis of cardiometabolic diseases [21]. Studies have shown that increased WC is a significant predictor of cardiometabolic outcomes, even in individuals with a normal BMI, highlighting its superiority over BMI in assessing cardiometabolic risk [22]. WHR, another anthropometric measure that compares the circumference of the waist to that of the hips, is a marker of fat distribution. A higher WHR, indicative of central adiposity relative to peripheral fat distribution, has been strongly linked to increased cardiometabolic risk and all-cause mortality [23]. Central fat accumulation, as measured by WHR, is associated with insulin resistance, impaired glucose metabolism, and dysregulated lipid profiles, factors that significantly increase the risk of type 2 diabetes and cardiovascular events [24]. Elevated WHR has been shown to independently predict cardiovascular risk, even after adjusting for traditional risk factors such as BMI, age, and smoking status, making it a valuable tool in clinical practice for identifying individuals at high cardiometabolic risk [25]. These parameters offer clinicians a practical and cost-effective means to assess and monitor cardiometabolic health, allowing for early intervention in individuals at risk of cardiometabolic diseases.
Arterial dysfunction is fundamentally driven by the process of atherosclerosis, which leads to the formation of atheromatous plaques and, subsequently, to cardiovascular events in both elderly populations as well as in younger adults and children [26]. Given the rising global incidence of these cardiovascular events, early detection of subclinical atherosclerosis in individuals with obesity may serve as an effective strategy for implementing appropriate management of vascular disorders. Consequently, screening for subclinical atherosclerosis has emerged as a significant challenge in clinical practice [27,28]. The accumulation of lipid deposits in the arterial walls, along with inflammation and immune cell infiltration, is a key driver of atherosclerosis [29]. LDL-c play a critical role in the lipid accumulation within the endothelial space [29,30]. An increased prevalence of atherosclerosis has been observed at arterial bifurcations, where blood flow is disrupted [13]. In conjunction with these mechanisms, obesity exacerbates the atherosclerotic process, thereby increasing the risk of subsequent complications. Impairment of nitric oxide production represents the earliest sign of vascular damage secondary to excess weight [4]. Chronic inflammation and subsequent disruption of nitric oxide (NO) homeostasis are further triggered by the presence of excess adipose tissue [14]. As a result, vascular vasodilation and elasticity are compromised, a condition further aggravated by insulin resistance, which is commonly associated with obesity [15]. Central abdominal fat is highlighted as a major risk factor for the development of atheromatous plaques [16,17,18].
CIMT has become a widely recognized and validated indicator for subclinical atherosclerosis, offering insight into the early stages of cardiovascular disease development, particularly in individuals with obesity [31,32]. This non-invasive assessment reflects early pathological changes in the arterial structure, serving as a marker for atherosclerotic progression and cardiovascular risk, even in the absence of overt clinical symptoms both in adults and children [33]. Obesity plays a central role in the pathogenesis of cardiometabolic diseases, and its relationship with CIMT underscores the mechanistic link between excess adiposity and vascular health. Increased CIMT in obese individuals is primarily driven by chronic low-grade inflammation, insulin resistance, and endothelial dysfunction, all of which contribute to the early development of atherosclerosis [34]. Adipose tissue, particularly visceral fat, acts as an active endocrine organ, secreting pro-inflammatory cytokines such as tumor necrosis factor-alpha (TNF-α), interleukin-6 (IL-6), and leptin, which promote vascular inflammation and oxidative stress. These inflammatory mediators directly affect the arterial wall by increasing the expression of adhesion molecules, thus facilitating the recruitment of leukocytes to the endothelium, and promoting the thickening of the intima and media layers of the carotid arteries [35]. Furthermore, obesity-induced insulin resistance exacerbates the risk of cardiometabolic disease by impairing endothelial function and increasing arterial stiffness, both of which contribute to elevated CIMT [36,37]. Insulin resistance, common in individuals with obesity, leads to reduced nitric oxide production and increased endothelin-1 activity, resulting in impaired vasodilation and a heightened state of vascular constriction. This endothelial dysfunction accelerates intima-media thickening, thus increasing cardiovascular risk [38]. In addition, obese individuals often exhibit dyslipidemia, characterized by elevated triglycerides, HDL-c, and an increase in small, LDL-c particles, which are particularly atherogenic. These lipid abnormalities further contribute to atherosclerosis by promoting lipid accumulation in the arterial walls, leading to plaque formation and increased CIMT [39]. The relationship between obesity and CIMT is particularly concerning in younger individuals. Studies show that even in asymptomatic adolescents and young adults with obesity, CIMT is significantly elevated compared to normal-weight peers, suggesting that obesity accelerates the vascular aging process and increases lifelong cardiovascular risk [40]. Moreover, central or visceral obesity has been found to have a stronger correlation with increased CIMT than subcutaneous fat, indicating that fat distribution plays a critical role in determining cardiovascular outcomes in obese individuals [41]. Normal CIMT values in healthy adults typically range from 0.5 to 0.9 mm, depending on age and sex, with values exceeding 1.0 mm often indicating subclinical atherosclerosis and an increased risk for cardiovascular events. However, in obese individuals, CIMT values are frequently elevated, even within populations without overt cardiovascular disease, reflecting the early onset of vascular damage [42]. A study by Yeboah et al. demonstrated that obesity independently predicts CIMT progression, even after adjusting for other cardiometabolic risk factors, underscoring the direct role of excess adiposity in arterial thickening [43]. As a result, CIMT is increasingly being used as a valuable tool for early detection of cardiovascular risk in obese patients, particularly those with additional risk factors such as hypertension or type 2 diabetes. Given the growing prevalence of obesity worldwide, the use of CIMT as a non-invasive marker of early atherosclerosis in this population has significant clinical relevance. Detecting increased CIMT in obese individuals allows for early intervention, including lifestyle modifications and pharmacological treatments aimed at reducing obesity-related inflammation, improving insulin sensitivity, and mitigating cardiovascular risk [44]. Additionally, tracking CIMT progression over time provides valuable information on the effectiveness of therapeutic interventions in slowing or reversing atherosclerotic changes in obese individuals [45].
TMAO is a metabolite produced in the liver from trimethylamine (TMA), which is generated by gut microbiota through the metabolism of dietary nutrients such as choline, phosphatidylcholine, and L-carnitine [46]. Recent research has highlighted the pivotal role of TMAO in the pathophysiology of cardiometabolic diseases, particularly in promoting cardiovascular disease and contributing to the risk of cardiometabolic disorders. Elevated plasma TMAO levels have been shown to accelerate atherosclerosis by enhancing the deposition of cholesterol in the arterial wall and promoting pro-inflammatory signaling in vascular endothelial cells, which results in increased plaque formation and plaque instability [47]. Additionally, TMAO has been found to impair reverse cholesterol transport, a process crucial for reducing excess cholesterol from peripheral tissues to the liver for excretion, further exacerbating the development of atherosclerotic lesions [48]. Beyond its direct impact on cardiovascular health, TMAO has been implicated in the progression of insulin resistance, which is a fundamental component of metabolic syndrome and type 2 diabetes [49]. Insulin resistance induced by TMAO is thought to occur through the activation of inflammatory pathways and oxidative stress, impairing insulin signaling and glucose metabolism [50]. TMAO also influences bile acid metabolism by modulating bile acid pool composition and farnesoid X receptor (FXR) signaling, which can alter lipid homeostasis and contribute to dyslipidemia, another key factor in cardiometabolic risk [51]. Importantly, elevated TMAO levels have been strongly correlated with an increased incidence of major adverse cardiovascular events, such as myocardial infarction, stroke, and heart failure, even when accounting for traditional cardiovascular risk factors [52]. The identification of TMAO as an independent predictor of cardiovascular risk underscores its potential utility as a biomarker for early detection and risk stratification in individuals with or at risk of cardiometabolic diseases [53]. Given the growing body of evidence linking TMAO to various pathways involved in cardiometabolic dysfunction, therapeutic strategies aimed at reducing TMAO levels or modulating gut microbiota composition are being explored as novel interventions to mitigate cardiometabolic risk and improve cardiovascular outcomes [54].
Resistin, a pro-inflammatory adipokine primarily secreted by immune cells in humans, plays a critical role in the development of cardiometabolic diseases such as type 2 diabetes, atherosclerosis, and hypertension [55]. Elevated circulating resistin levels have been closely linked to insulin resistance, as resistin impairs insulin signaling in hepatocytes and adipocytes, leading to increased hepatic glucose production and reduced glucose uptake in peripheral tissues, contributing to hyperglycemia and metabolic syndrome [56]. Resistin also promotes systemic inflammation by stimulating the production of inflammatory cytokines, including TNF-α, IL-6, and IL-1β, which further exacerbate insulin resistance and drive the development of type 2 diabetes [57]. In cardiovascular disease, resistin has been implicated in promoting endothelial dysfunction by enhancing the expression of vascular adhesion molecules such as ICAM-1 (intercellular adhesion molecule-1) and VCAM-1 (vascular cell adhesion molecule-1), which facilitate the recruitment of leukocytes to the endothelium, thus accelerating the progression of atherosclerosis [58]. Moreover, resistin induces vascular smooth muscle cell proliferation and migration, contributing to the instability of atherosclerotic plaques, which increases the risk of myocardial infarction and stroke [59]. Studies have demonstrated a strong association between elevated plasma resistin levels and the occurrence of major adverse cardiovascular events, including coronary artery disease, heart failure, and mortality, highlighting its potential as a biomarker for cardiovascular risk stratification [60]. Resistin also plays a role in the development of hypertension by promoting vasoconstriction and increasing arterial stiffness, further contributing to the cardiometabolic burden [61]. Given its involvement in both metabolic and cardiovascular pathophysiology, resistin represents a promising target for therapeutic strategies aimed at reducing cardiometabolic risk by modulating inflammatory pathways and improving insulin sensitivity [62].
The aim of this observational prospective study is to comprehensively analyze the independent determinants of circulating TMAO and resistin levels in individuals with obesity, and to investigate their associations with CIMT and a broad spectrum of metabolic parameters, including BMI, bioimpedance parameters, lipid profile abnormalities, glycemic control: fasting blood glucose (FBG), HbA1c, and insulin resistance by homeostasis model assessment-estimated insulin resistance (HOMA-IR). This study seeks to elucidate the mechanistic pathways linking TMAO and resistin with obesity-induced vascular alterations and metabolic dysregulation, specifically focusing on their potential contributions to subclinical atherosclerosis, as indicated by CIMT, and the overall cardiometabolic risk profile in this population.
Materials and Methods
The prospective observational study was conducted in the endocrinology unit from October 2023 to June A total of 60 adult participants were enrolled, comprising 13 males (21.62%) and 47 females (78.48%), with ages ranging from 18 to 71 years and a mean age of 37.30 ± 14.82 years. The participants sought to evaluate their nutritional status and initiate a personalized nutrition plan aimed at long-term lifestyle optimization. All participants provided informed consent. The study adhered to the ethical standards of the Helsinki Declaration and was approved by the Scientific Research Ethics Committee (CECS) of the “Victor Babeș” University of Medicine and Pharmacy Timișoara (No. 69/03.10.2022).
Following the assessment of nutritional status, the cohort was divided into study groups based on the severity of excess body weight, specifically: the normal weight group or control group (BMI between 18.5-24.9 kg/m²), the overweight group (BMI between 25-29.9 kg/m²), and the obesity group (BMI over 30 kg/m²). The latter group was further classified according to the severity of obesity: grade I (BMI between 30-34.9 kg/m²), grade II (BMI between 35-39.9 kg/m²), and grade III (BMI over 40 kg/m²). Additionally, the control group included participants with normal weight who had no additional cardiometabolic risk factors, were non-smokers, had no personal or family history of cardiometabolic disease, and did not consume alcohol.
Additionally, subgroups were created based on the reference values for TMAO, specifically a threshold of 380 mcg/L, as defined by the laboratory where the analysis was performed. Consequently, subjects were divided into a high cardiometabolic risk group, characterized by TMAO levels exceeding this threshold, and a group with no added risk, defined by optimal TMAO levels below 380 mcg/L.
2.Patient Inclusion and Exclusion Criteria
- Inclusion criteria: Patients over the age of 18, both male and female, with varying degrees of excess body weight, who voluntarily presented to our medical unit for the purpose of implementing an individualized hypocaloric dietary program aimed at weight loss and achieving ideal body weight. Participants had a family medical history, primarily in first-degree relatives, of metabolic and cardiovascular diseases. Both smokers and non-smokers were included, with the requirement that participants had maintained a varied diet over the past six months, including fish, meat, grains, and eggs. The control group consisted of individuals with optimal weight, without personal or family history of cardiometabolic diseases. For the final selection, only subjects who agreed to complete a comprehensive anamnesis, clinical, and nutritional evaluation and provided written informed consent were included.
- Exclusion criteria: Children and adolescents, individuals following a vegetarian, vegan, or gluten-exclusion diet, individuals taking dietary supplements containing choline, or those who had used antibiotics or probiotics within 2 months prior to serum TMAO determination. Subjects diagnosed with secondary causes of obesity, regardless of etiology, were excluded, as were individuals who had undergone nutritional interventions for weight loss in the past 12 months, used anti-obesity medications within the last 16 weeks, or had undergone metabolic surgery in the past 5 years. Additionally, individuals with psychiatric disorders and those with impaired kidney function or chronic kidney disease: eGFR (estimated glomerular filtration rate) < 90 ml/min/1.73 m², CKD-EPI (Chronic Kidney Disease Epidemiology Collaboration) were excluded from the study.
2.Patient Complete Evaluation
Before any procedures included in the study were conducted, each patient was fully informed regarding the details of the research, including the clinical and paraclinical examinations. No procedures were implemented until the informed consent form was thoroughly explained, accepted, and signed. A comprehensive anamnesis was performed during the initial consultation, covering demographic data, family medical history (specifically first-degree relatives with excess body weight), personal cardiometabolic history, dietary habits and behavioral factors. Additionally, each participant underwent a full clinical examination at the initial visit. The non-invasive methods used in our investigation included bilateral ultrasonographic measurement of carotid intima-media thickness and bioelectrical impedance analysis (BIA) to estimate segmental body composition. The initial evaluation of the study included the following parameters:
2.2.Sociodemographic and Behavioral Characteristics
As a result of conducting a comprehensive anamnesis, the following variables related to the participants' daily routine were included in this section:
Smoking status: classified as positive if the individual has smoked at least one cigarette per day for a minimum duration of one year.
Sleep pattern: Sleep duration was evaluated for each participant, with a nightly duration of less than 7 hours categorized as sleep deprivation or an inadequate sleep schedule [63].
Activity engagement level: To be classified outside the sedentary category, participants were required to engage in sustained physical activity for a minimum of 30 minutes per day or 150 minutes per week, exceeding the combined threshold of active and basal activity levels.
Alcohol intake: Participants self-reported their alcohol intake, measured in units, where one unit was equivalent to 10 mL of pure ethanol. The following definitions were used: two units corresponded to a pint or can of beer, one unit to a 25 mL shot of spirits, and one unit to a standard 175 mL glass of wine. Participants consuming more than two units of alcohol per day were categorized as "excessive drinkers," while those who had never consumed alcohol were classified as "abstainers" [64].
2.2.Nutritional Assessment
The nutritional status of each participant was evaluated using BMI, a commonly employed and cost-efficient metric. BMI was calculated based on the formula: BMI = weight (kg)/height² (m²) [65,66]. Additionally, other anthropometric parameters such as WC and WHR were measured for each participant.
Body weight assessment: Body weight was measured using a mechanically certified scale with metrological validation, capable of recording up to 200 kg. Participants were instructed to maintain an upright posture on the scale while lightly clothed.
Height assessment: Height was measured using a calibrated, wall-mounted stadiometer. Participants were instructed to stand in an upright position on the platform, barefoot, to ensure precise measurement.
2.Personal and Family Medical History
2.3.Family Medical History and Conditions
A comprehensive assessment of family medical history, specifically targeting cardiometabolic disorders, was conducted for each participant. Key conditions of interest, particularly in first-degree relatives, included obesity, type 2 diabetes and cardiovascular diseases, including essential hypertension, acute myocardial infarction and stroke.
2.3.Medical History and Health Conditions
A structured evaluation of each participant’s personal medical history was conducted through targeted questioning, supported by medical records provided during the initial consultation for verification. This process facilitated the exclusion of specific conditions. The primary focus was on cardiovascular and metabolic disorders, including diagnosed essential hypertension or antihypertensive treatment, prediabetes, type 2 diabetes, metabolic syndrome, lipid profile modifications, asymptomatic hyperuricemia and vitamin D status.
2.Laboratory Assay
Blood samples were obtained within one week following the physical examination, with collection times standardized between 7:30 and 8:30 a.m. Participants adhered to a fasting period of at least 12 hours prior to sample collection. All serum parameter analyses were conducted in an accredited laboratory to ensure accuracy and compliance with standard protocols. Serum TMAO concentrations were measured using liquid chromatography-mass spectrometry (LC-MS). The reference values for serum TMAO were defined as follows: normal (<270 μg/L), borderline (≥270 μg/L to <380 μg/L), and elevated (≥380 μg/L). At this stage, serum resistin levels were also measured, with reference values stratified by gender as follows: for women, optimal values ranged between 3.7-13.6 ng/mL, and for men, the optimal range was 3.3-11.7 ng/mL. Additional serum parameters measured included the lipid panel: TC (mg/dL), LDL-c (mg/dL), high-density lipoprotein cholesterol (HDL-c) (mg/dL), TG (mg/dL), uric acid (mg/dL), glycated hemoglobin (HbA1c) (%), HOMA-IR, FBG (mg/dL) and vitamin D levels. Additionally, TSH, FT4 and liver enzymes: AST and ALT were measured.
2.Bioimpedance Measurement Parameters
All participants in the study underwent an initial assessment of their nutritional status through bioimpedance analysis using the Tanita Body Composition Analyzer BC-418 MA III (T5896, Tokyo, Japan). This analysis specifically targeted the quantification and distribution of adipose tissue. A comprehensive evaluation of total body composition was conducted utilizing a constant high-frequency electrical current (50 kHz, 500 μA) and employing a tetra-polar, eight-point tactile electrode system. Participants were instructed to stand in an upright position and maintain contact with the analyzer’s handles, ensuring appropriate connection with the eight electrodes, two for each foot and hand [67]. During the bioelectrical impedance analysis, a low-level electrical current was applied to the body, and impedance—characterized as the opposition to the flow of this current—was measured. This impedance reflects the body's resistance and reactance, providing insight into various components of body composition, such as fat mass, lean tissue, and total body water [68]. The entire procedure was completed in approximately three minutes, with the results systematically documented and subsequently explained to each participant. Previous research has shown that, in clinical environments, the Tanita Body Fat Monitor exhibits an accuracy margin within ±5% when compared to the reference standard for body composition assessment, dual-energy x-ray absorptiometry (DXA) [69,70,71]. This degree of accuracy supports the device's reliability as a practical tool for body composition evaluation in both research and clinical settings [72]. Additionally, Tanita reports that its method is the most accessible and convenient for predicting body composition with accuracy. The parameters measured by this technique were classified into the following categories: percentage of adipose tissue (%), percentage of trunk adipose mass (%), fat-free mass (kg), percentage of muscle tissue (%), basal metabolic rate (BMR), and percentage of total body water (%).
2.Carotid Intima-Media Thickness Assessment
The Aixplorer MACH 30 ultrasound system (SuperSonic Imagine, Aix-en-Provence, France) was used to conduct an ultrasonographic assessment of carotid intima-media thickness. A certified and highly experienced sonographer conducted carotid ultrasonography on each participant included in the study. The procedure involved carefully positioning each subject to ensure optimal visualization of the carotid artery and applying a conductive gel to facilitate sound wave transmission. The sonographer then meticulously scanned the carotid arteries, using appropriate transducer settings based on individual anatomical characteristics, such as neck structure and adipose tissue distribution: SL 18-5 (5-18 MHz) or SL 10-2 (2-10 MHz). The CIMT values were automatically computed by the advanced software embedded within the ultrasound system (SuperSonic Imagine, Aix-en-Provence, France). This software analyzes the ultrasound images in real-time, providing precise measurements of the intima-media thickness without requiring manual calculation, ensuring both accuracy and efficiency in the evaluation process. The ultrasound images were captured during the end-diastolic phase, identified by the occurrence of the R wave on the electrocardiogram, ensuring consistency in arterial relaxation and minimizing variability in measurements [73]. For each participant, six separate CIMT measurements were taken, with three measurements performed on both the left and right carotid arteries. The measurements were carefully averaged to produce a mean CIMT value, which was subsequently used for analysis in the study. This approach helped to enhance the precision and reliability of the data by accounting for natural variations in arterial thickness across different locations and ensuring that the final CIMT value represented an accurate reflection of each patient's vascular status. To obtain optimal visualization of the right and left common carotid arteries, the subject is positioned in a supine position and instructed to extend their neck backward as far as comfortably possible, enhancing exposure of the cervical region. Additionally, the examiner carefully chooses the most suitable ultrasound transducer, ensuring the correct frequency range is used to maximize image clarity and resolution for accurate assessment of the CIMT. The scanning procedure begins with a transverse approach, starting at the clavicle and moving upward along the neck to identify the carotid bulb and the bifurcation of the common carotid artery into the internal and external carotid arteries. Once the carotid bulb is located, the examiner transitions to longitudinal scanning, allowing for a detailed assessment of the arterial walls and more precise measurement of the CIMT along the length of the artery. This systematic approach ensures thorough visualization of both the structure and flow characteristics within the carotid arteries. In this section, the carotid bulb is visualized on the left side of the ultrasound screen. Measurements are taken from the posterior wall of the carotid artery, specifically 1 to 2 cm distal to the carotid bulb. This location is chosen to avoid the geometrical irregularities of the bulb itself and to obtain accurate and consistent CIMT values from a more uniform segment of the arterial wall [74,75]. At end-diastole, the image is frozen, and the software automatically measures the CIMT in the examiner's selected region of interest, ensuring consistency and precision [76,77].
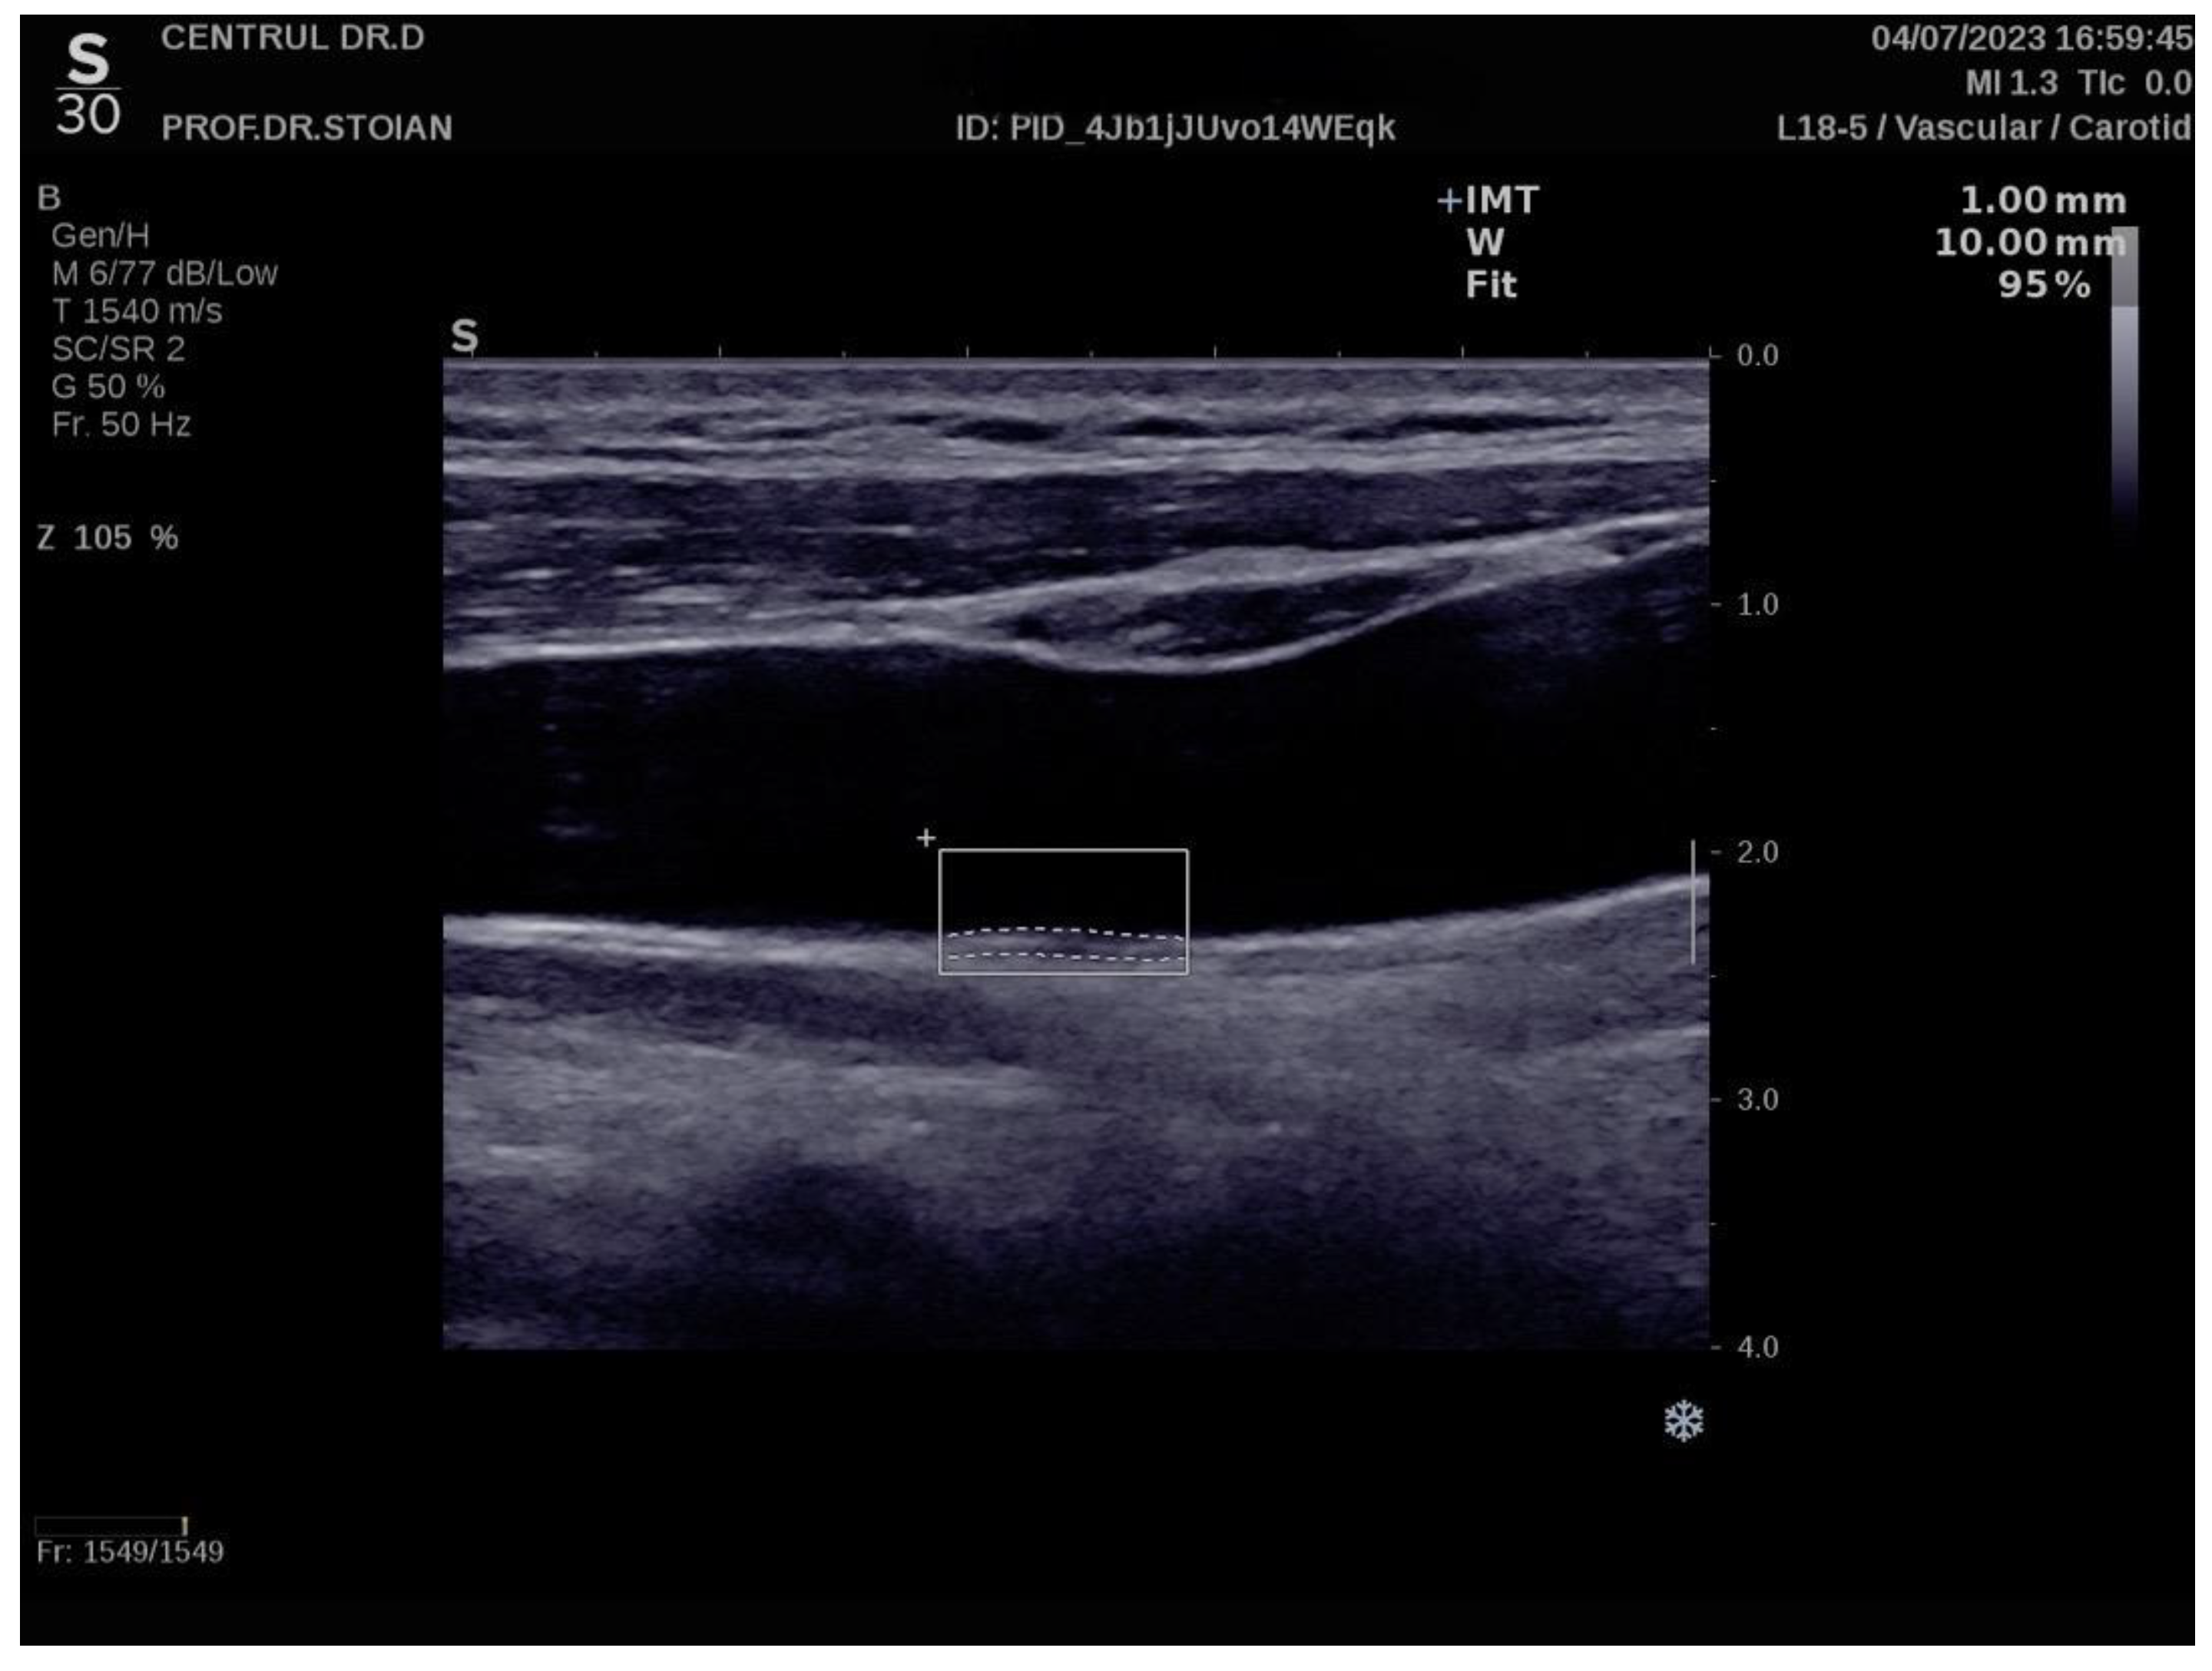
Figure 6 illustrates an example of CIMT evaluation for the left carotid artery obtained using this method in a normoweight subject, whose CIMT value falls within optimal limits. In contrast, Figure 7 depicts an elevated also left CIMT value of 1 mm, observed in a patient with grade II obesity. It is important to note that personal data of the evaluated subjects are not displayed to ensure confidentiality.
Figure.
Example of a normal left CIMT measurement in a normoweight patient using the Aixplorer MACH 30 ultrasound system.
Figure.
Example of a normal left CIMT measurement in a normoweight patient using the Aixplorer MACH 30 ultrasound system.
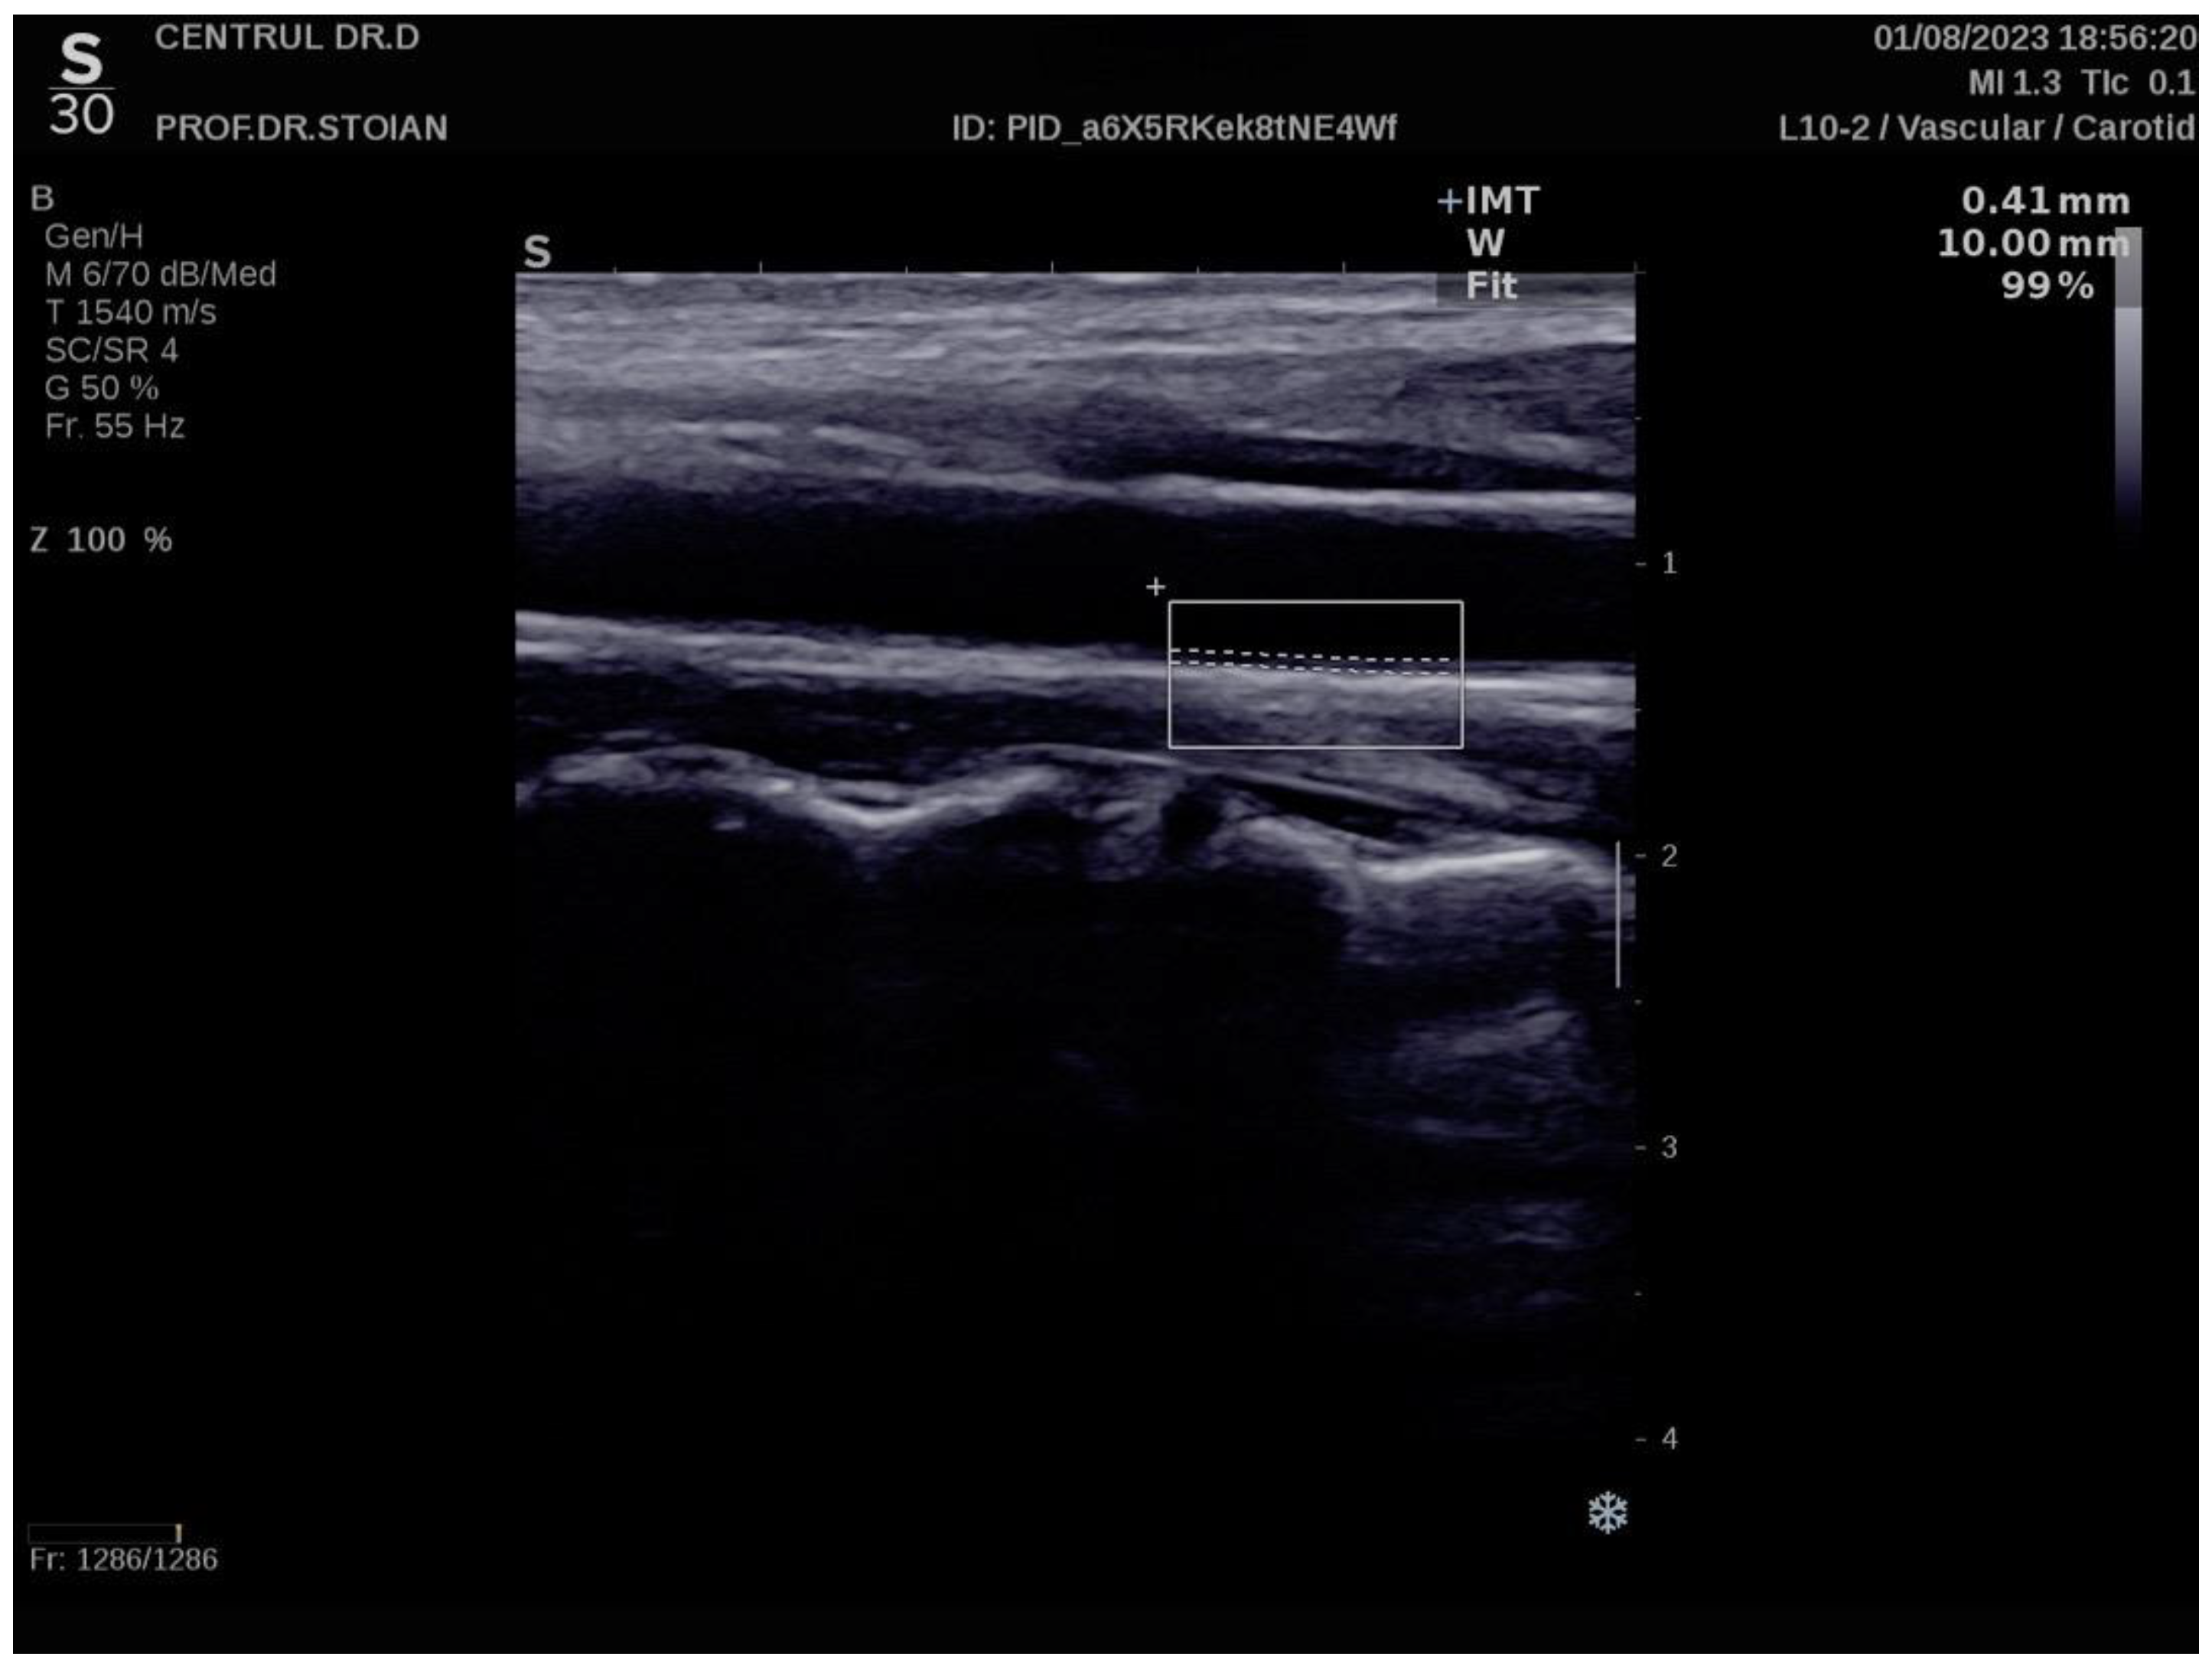
Figure.
Example of a high value of left CIMT measurement in a subject with obesity grade II using the Aixplorer MACH 30 ultrasound system.
Figure.
Example of a high value of left CIMT measurement in a subject with obesity grade II using the Aixplorer MACH 30 ultrasound system.
2.Statistical Analysis
In this study, we employed a variety of statistical tools to analyze the data and draw meaningful conclusions. The normality of numerical variables was assessed using the Shapiro-Wilk test, which revealed that all variables followed a non-Gaussian distribution. Consequently, non-parametric methods were applied throughout the analysis. Numerical variables were summarized as medians with interquartile ranges (IQR), while categorical variables were presented as proportions. To compare differences across multiple groups, the Kruskal-Wallis test was used. For comparisons between two groups, the Mann-Whitney U test was employed. Correlation analyses were conducted using Spearman's correlation for TMAO, while Kendall's tau was applied for resistin due to the presence of many tied ranks. The effect size was evaluated using Cohen’s criteria, which classifies the strength of the association as small (around 0.1), medium (around 0.3), or large (around 0.5).
To identify significant independent predictors of TMAO and resistin levels, we used multiple linear regression analysis. Model performance was evaluated based on the Akaike Information Criterion (AIC), adjusted R-squared. For assessing cardiometabolic risk, multiple logistic regression was applied, with model performance evaluated using Nagelkerke’s R-squared and AUROC (Area Under the Receiver Operating Characteristic Curve) parameters. The interaction between TMAO and resistin in predicting insulin resistance and obesity was analyzed using logistic regression with interaction plots to visualize the effects. The results of the analyses are presented in tables and graphs. A p-value of less than 0.05 was considered statistically significant, with a 95% confidence interval. All data processing and analyses were conducted using R software (R Core Team, 2024).
Results
3.Impact of BMI on TMAO, Resistin, and Associated Physiological and Metabolic Parameters
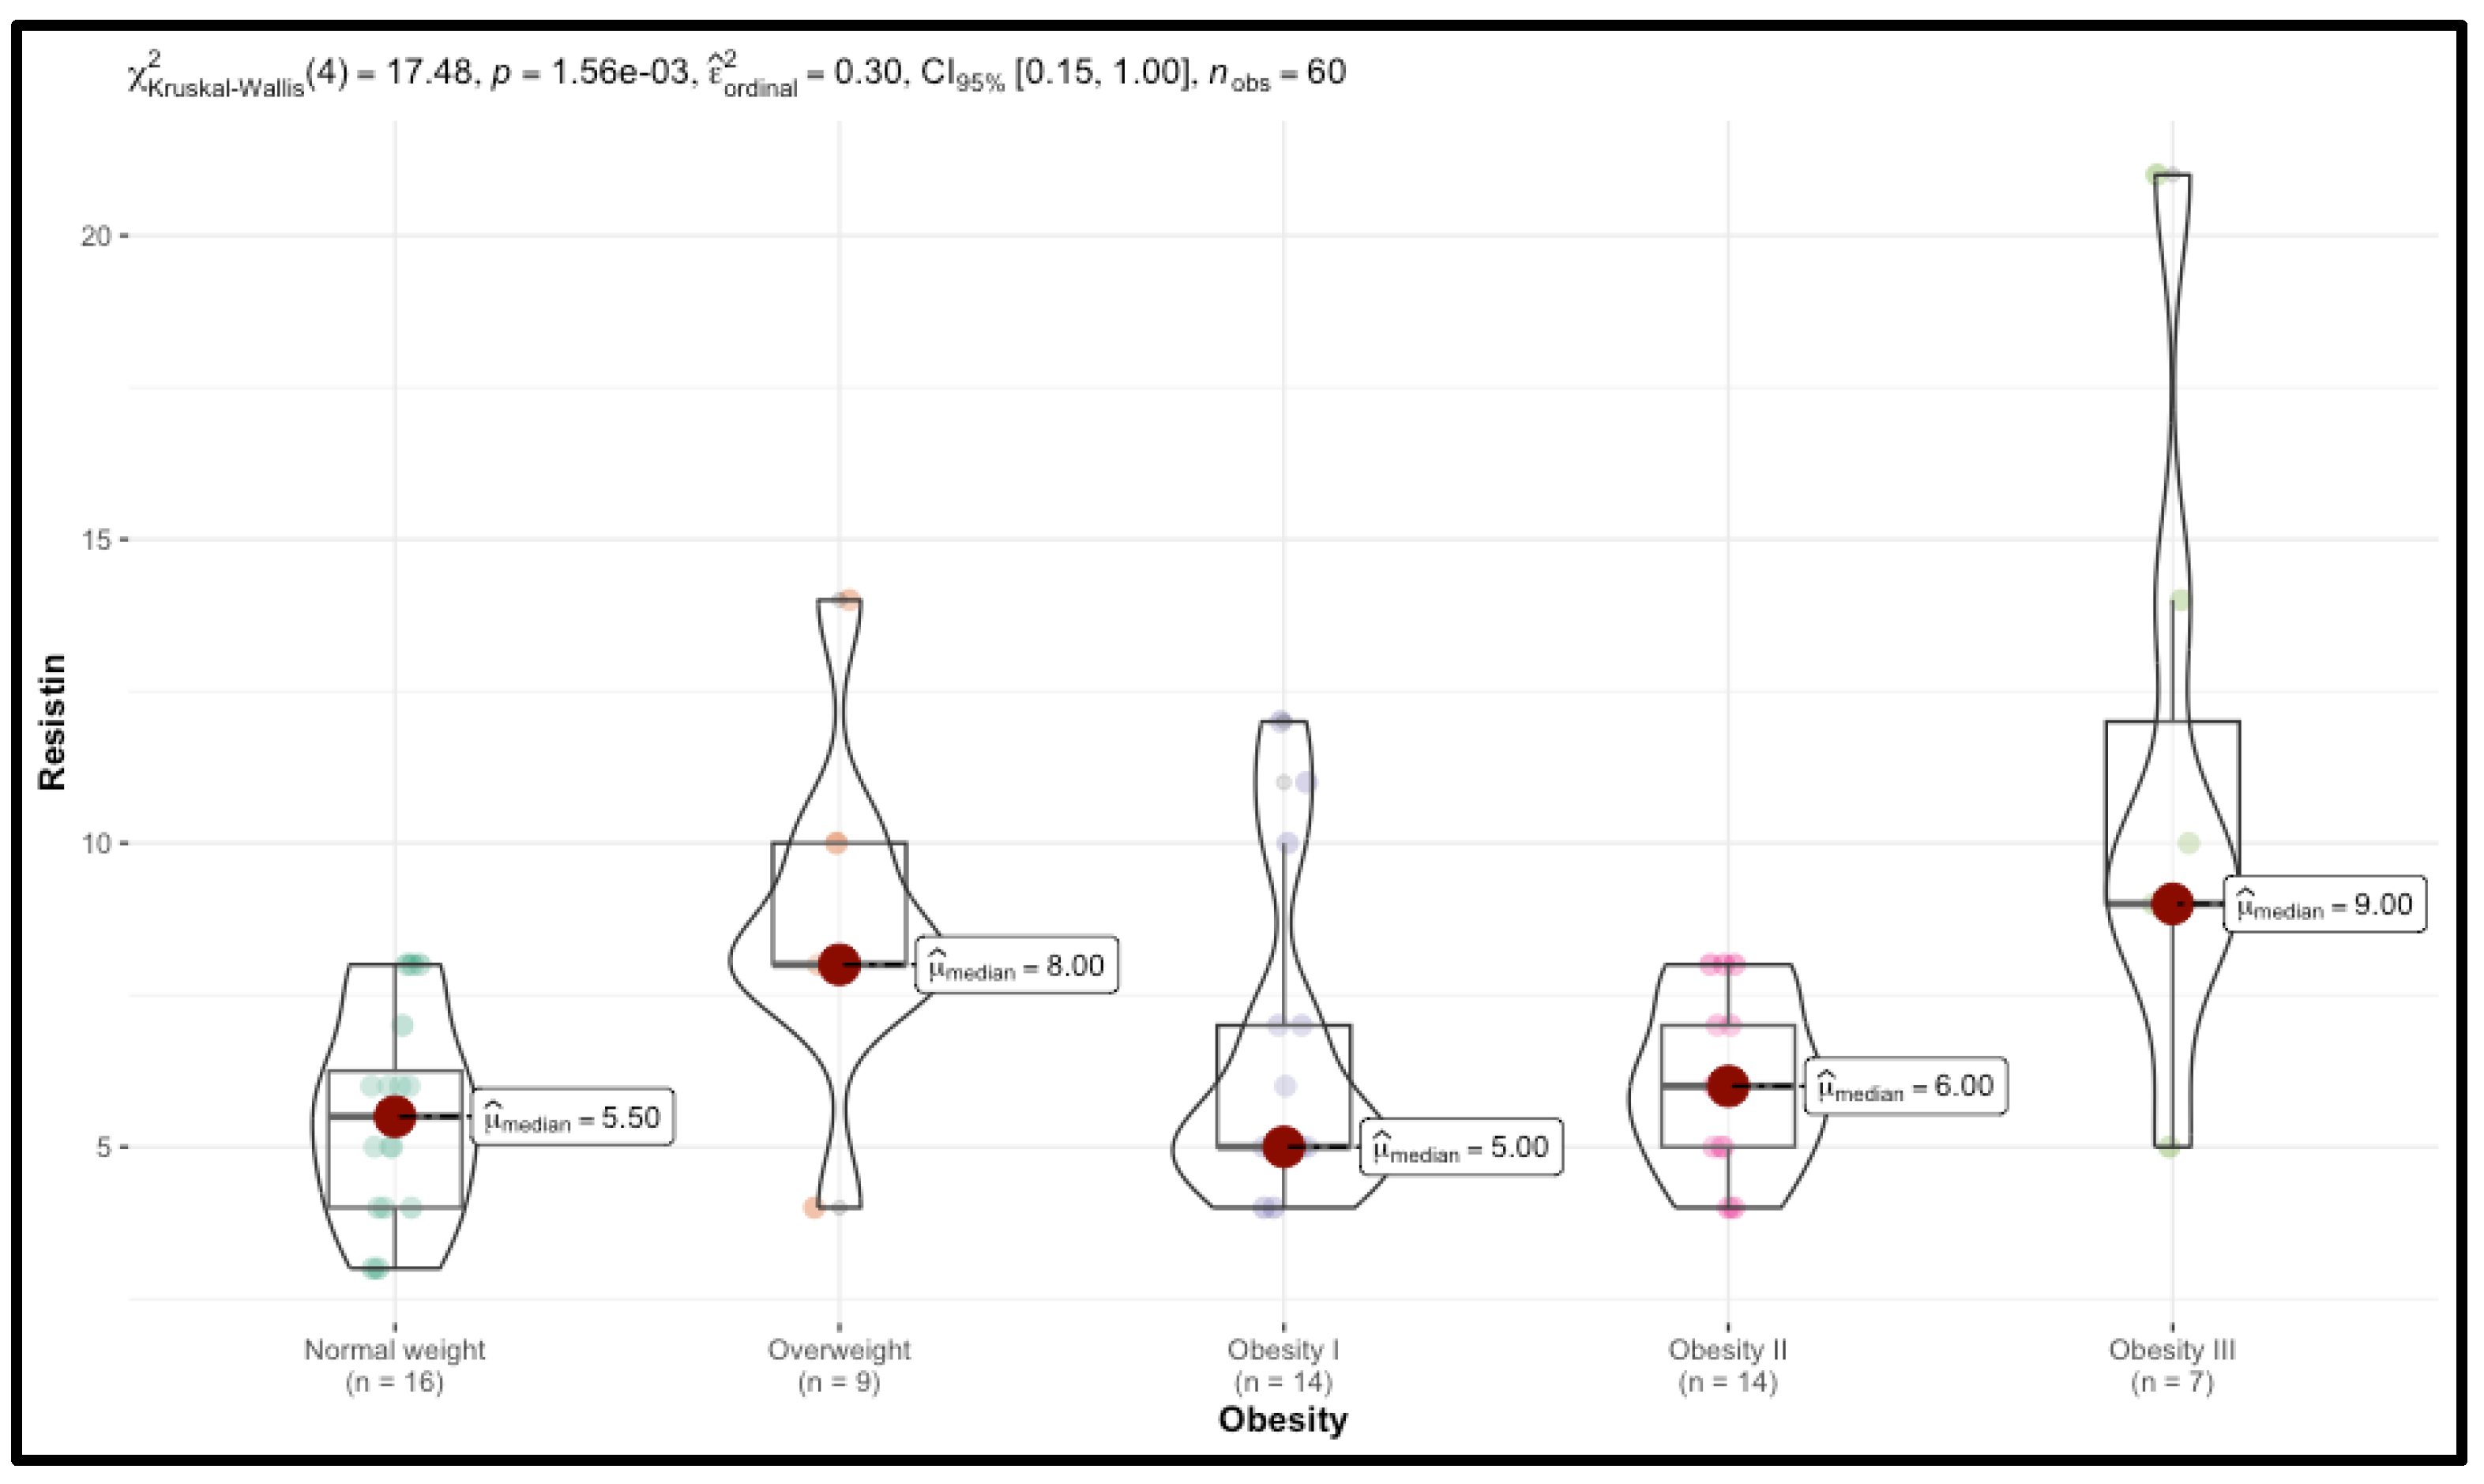
Significant trends were observed, particularly in TMAO and resistin levels, which increased with BMI. Median TMAO levels rose from 122.00 in the Normal group to 254.00 in Obesity III (p<0.001), while resistin levels increased from 5.50 to 9.00 (p=0.001), suggesting a potential link between higher BMI, TMAO, and resistin, potentially impacting metabolic health. CIMT also increased with BMI, indicating elevated cardiovascular risk in obese individuals, with right CIMT values rising from 0.60 in the control group to 0.88 in obesity stage III (p<0.001). Additionally, BIA showed a significant increase in both total body fat and trunk fat mass, correlating with obesity levels (p<0.001). In contrast, fat-free mass was higher in the normal group, indicating a decline in lean mass with increasing obesity (p=0.03). Muscle mass and hydration status also decreased with higher levels of obesity (p<0.001). Changes in several biological markers were observed. FBG increased significantly from 80.00 mg/dL in the control group to 114.00 mg/dL in the obesity III group (p<0.001). Lipid profiles showed a significant deterioration, with TC and LDL-c increasing (p<0.001) and HDL-c decreasing (p=0.01), particularly in the obesity III group. Triglycerides and uric acid levels did not exhibit significant differences across BMI categories, indicating a weaker association with BMI in this cohort. Liver function markers, AST and ALT also showed significant increases across BMI categories (p<0.001). Serum vitamin D levels decreased progressively with higher BMI, with statistically significant differences between groups (p<0.001). Thyroid function, measured by TSH and FT4, did not differ significantly across BMI categories. Detailed results are presented in Table 1, Figure 1, and Figure 2.

Table.
Comparison of Demographic, Metabolic, and Anthropometric Variables Across BMI Categories.
| Variable | Normal (N=16) | Overweight (N=9) | Obesity I (N=14) | Obesity II (N=14) | Obesity III (N=7) | p-value |
|---|---|---|---|---|---|---|
| Age | 28.00 (23.75 - 33.50) | 28.00 (24.00 - 32.00) | 33.50 (26.00 - 44.75) | 41.00 (26.00 - 54.50) | 51.00 (35.50 - 62.00) | 0.19 |
| TMAO | 122.00 (103.75 - 146.75) | 269.00 (192.00 - 363.00) | 253.50 (172.50 - 545.25) | 334.50 (208.75 - 394.75) | 254.00 (238.50 - 363.00) | < 0.001 |
| Resistin | 5.50 (4.00 - 6.25) | 8.00 (8.00 - 10.00) | 5.00 (5.00 - 7.00) | 6.00 (5.00 - 7.00) | 9.00 (9.00 - 12.00) | 0.001 |
| CIMT right | 0.60 (0.56 - 0.68) | 0.72 (0.71 - 0.84) | 0.79 (0.71 - 0.93) | 0.73 (0.65 - 0.81) | 0.88 (0.85 - 0.91) | < 0.001 |
| CIMT left | 0.60 (0.52 - 0.65) | 0.67 (0.65 - 0.89) | 0.75 (0.69 - 0.87) | 0.70 (0.62 - 0.79) | 0.87 (0.80 - 0.90) | < 0.001 |
| WC | 87.00 (77.75 - 89.00) | 91.00 (88.00 - 96.00) | 105.50 (98.25 - 114.25) | 120.50 (116.25 - 123.00) | 136.00 (130.50 - 146.50) | < 0.001 |
| WHR | 0.83 (0.82 - 0.86) | 0.87 (0.87 - 0.90) | 0.97 (0.90 - 1.10) | 1.23 (1.12 - 1.40) | 1.80 (1.70 - 1.90) | < 0.001 |
| Fat mass | 29.50 (26.75 - 37.25) | 38.50 (37.00 - 40.00) | 42.00 (39.55 - 43.75) | 46.75 (44.00 - 49.50) | 47.00 (42.55 - 49.50) | < 0.001 |
| Fat free mass | 59.00 (46.00 - 67.00) | 45.00 (44.00 - 51.00) | 51.00 (48.50 - 53.75) | 52.00 (50.00 - 54.00) | 58.00 (55.00 - 68.00) | 0.03 |
| Trunk fat | 25.50 (22.75 - 35.25) | 38.00 (34.00 - 39.00) | 41.00 (38.25 - 42.00) | 45.00 (41.25 - 48.75) | 43.00 (40.50 - 47.00) | < 0.001 |
| Muscle mass | 70.00 (60.00 - 74.00) | 58.00 (57.00 - 60.00) | 55.00 (54.00 - 57.75) | 50.00 (47.25 - 53.75) | 51.00 (48.50 - 54.50) | < 0.001 |
| RBM | 1591.00 (1456.75 - 2026.25) | 1383.00 (1361.00 - 1568.00) | 1638.00 (1535.00 - 1685.25) | 1644.50 (1543.00 - 1764.00) | 1874.00 (1728.00 - 2101.00) | 0.03 |
| Body water | 55.50 (45.83 - 60.25) | 45.00 (44.00 - 46.00) | 43.00 (41.00 - 44.00) | 39.00 (38.00 - 41.00) | 39.00 (37.10 - 42.00) | < 0.001 |
| FBG | 80.00 (76.75 - 90.50) | 91.00 (87.00 - 100.00) | 95.00 (89.00 - 107.50) | 101.50 (98.50 - 110.00) | 114.00 (103.50 - 150.00) | < 0.001 |
| HbA1c | 5.00 (4.80 - 5.15) | 5.40 (5.40 - 5.70) | 5.65 (5.40 - 6.25) | 5.75 (5.53 - 5.88) | 6.00 (5.75 - 7.00) | < 0.001 |
| HOMA-IR | 1.85 (1.35 - 2.23) | 2.20 (2.00 - 3.00) | 3.75 (2.42 - 4.88) | 4.85 (4.60 - 5.85) | 8.00 (4.60 - 10.30) | < 0.001 |
| TC | 139.00 (111.75 - 153.25) | 210.00 (182.00 - 220.00) | 208.00 (175.50 - 241.50) | 195.00 (147.75 - 206.00) | 212.00 (173.50 - 238.50) | < 0.001 |
| LDLc | 84.00 (76.75 - 91.25) | 132.00 (96.00 - 153.00) | 138.00 (102.75 - 176.50) | 122.50 (97.75 - 137.50) | 115.00 (111.00 - 133.50) | < 0.001 |
| HDLc | 57.00 (51.00 - 61.00) | 49.00 (44.00 - 58.00) | 49.00 (43.00 - 58.00) | 46.50 (37.50 - 51.25) | 38.00 (35.00 - 46.50) | 0.01 |
| Triglycerides | 90.00 (83.50 - 102.25) | 121.00 (77.00 - 190.00) | 99.00 (79.00 - 145.75) | 107.00 (91.75 - 171.00) | 109.00 (102.00 - 192.50) | 0.23 |
| Uric acid | 4.00 (3.00 - 6.00) | 5.00 (4.00 - 6.00) | 5.00 (4.10 - 6.00) | 5.00 (5.00 - 6.00) | 6.00 (4.70 - 6.80) | 0.25 |
| Vitamin D | 31.50 (23.75 - 34.25) | 27.00 (24.00 - 29.00) | 22.00 (19.25 - 24.00) | 21.00 (18.00 - 24.25) | 19.00 (13.80 - 23.00) | < 0.001 |
| TSH | 2.90 (2.08 - 3.40) | 1.70 (1.10 - 2.40) | 2.70 (2.01 - 3.45) | 2.40 (1.72 - 3.40) | 3.00 (2.10 - 4.00) | 0.28 |
| FT4 | 10.50 (8.93 - 14.00) | 11.00 (9.30 - 12.40) | 13.40 (11.00 - 14.38) | 11.50 (9.48 - 13.23) | 15.00 (13.00 - 15.50) | 0.07 |
| AST | 14.50 (11.00 - 20.25) | 28.00 (21.00 - 48.00) | 27.00 (21.00 - 35.75) | 25.50 (20.75 - 35.00) | 30.00 (23.50 - 35.00) | < 0.001 |
| ALT | 14.00 (12.00 - 20.25) | 26.00 (22.00 - 55.00) | 32.50 (24.00 - 42.50) | 28.00 (23.50 - 37.50) | 29.00 (21.50 - 44.00) | < 0.001 |
Abbreviations: TMAO -Trimethylamine N-oxide, CIMT - Carotid Intima-Media Thickness, WC - Waist Circumference, WHR - Waist-Hip Ratio, RBM - Resting Basal Metabolism, FBG - Fasting Blood Glucose, HOMA-IR - Homeostasis Model Assessment of Insulin Resistance, LDLc - Low-Density Lipoprotein Cholesterol, HDLc - High-Density Lipoprotein Cholesterol, TSH - Thyroid-Stimulating Hormone, FT4 - Free Thyroxine (Free T4), AST - Aspartate Aminotransferase, ALT - Alanine Aminotransferase, TC - Total Cholesterol, p-value - Kruskal-Wallis test result, N - number of individuals.
Figure.
Distribution of TMAO Levels Across Different BMI Categories.
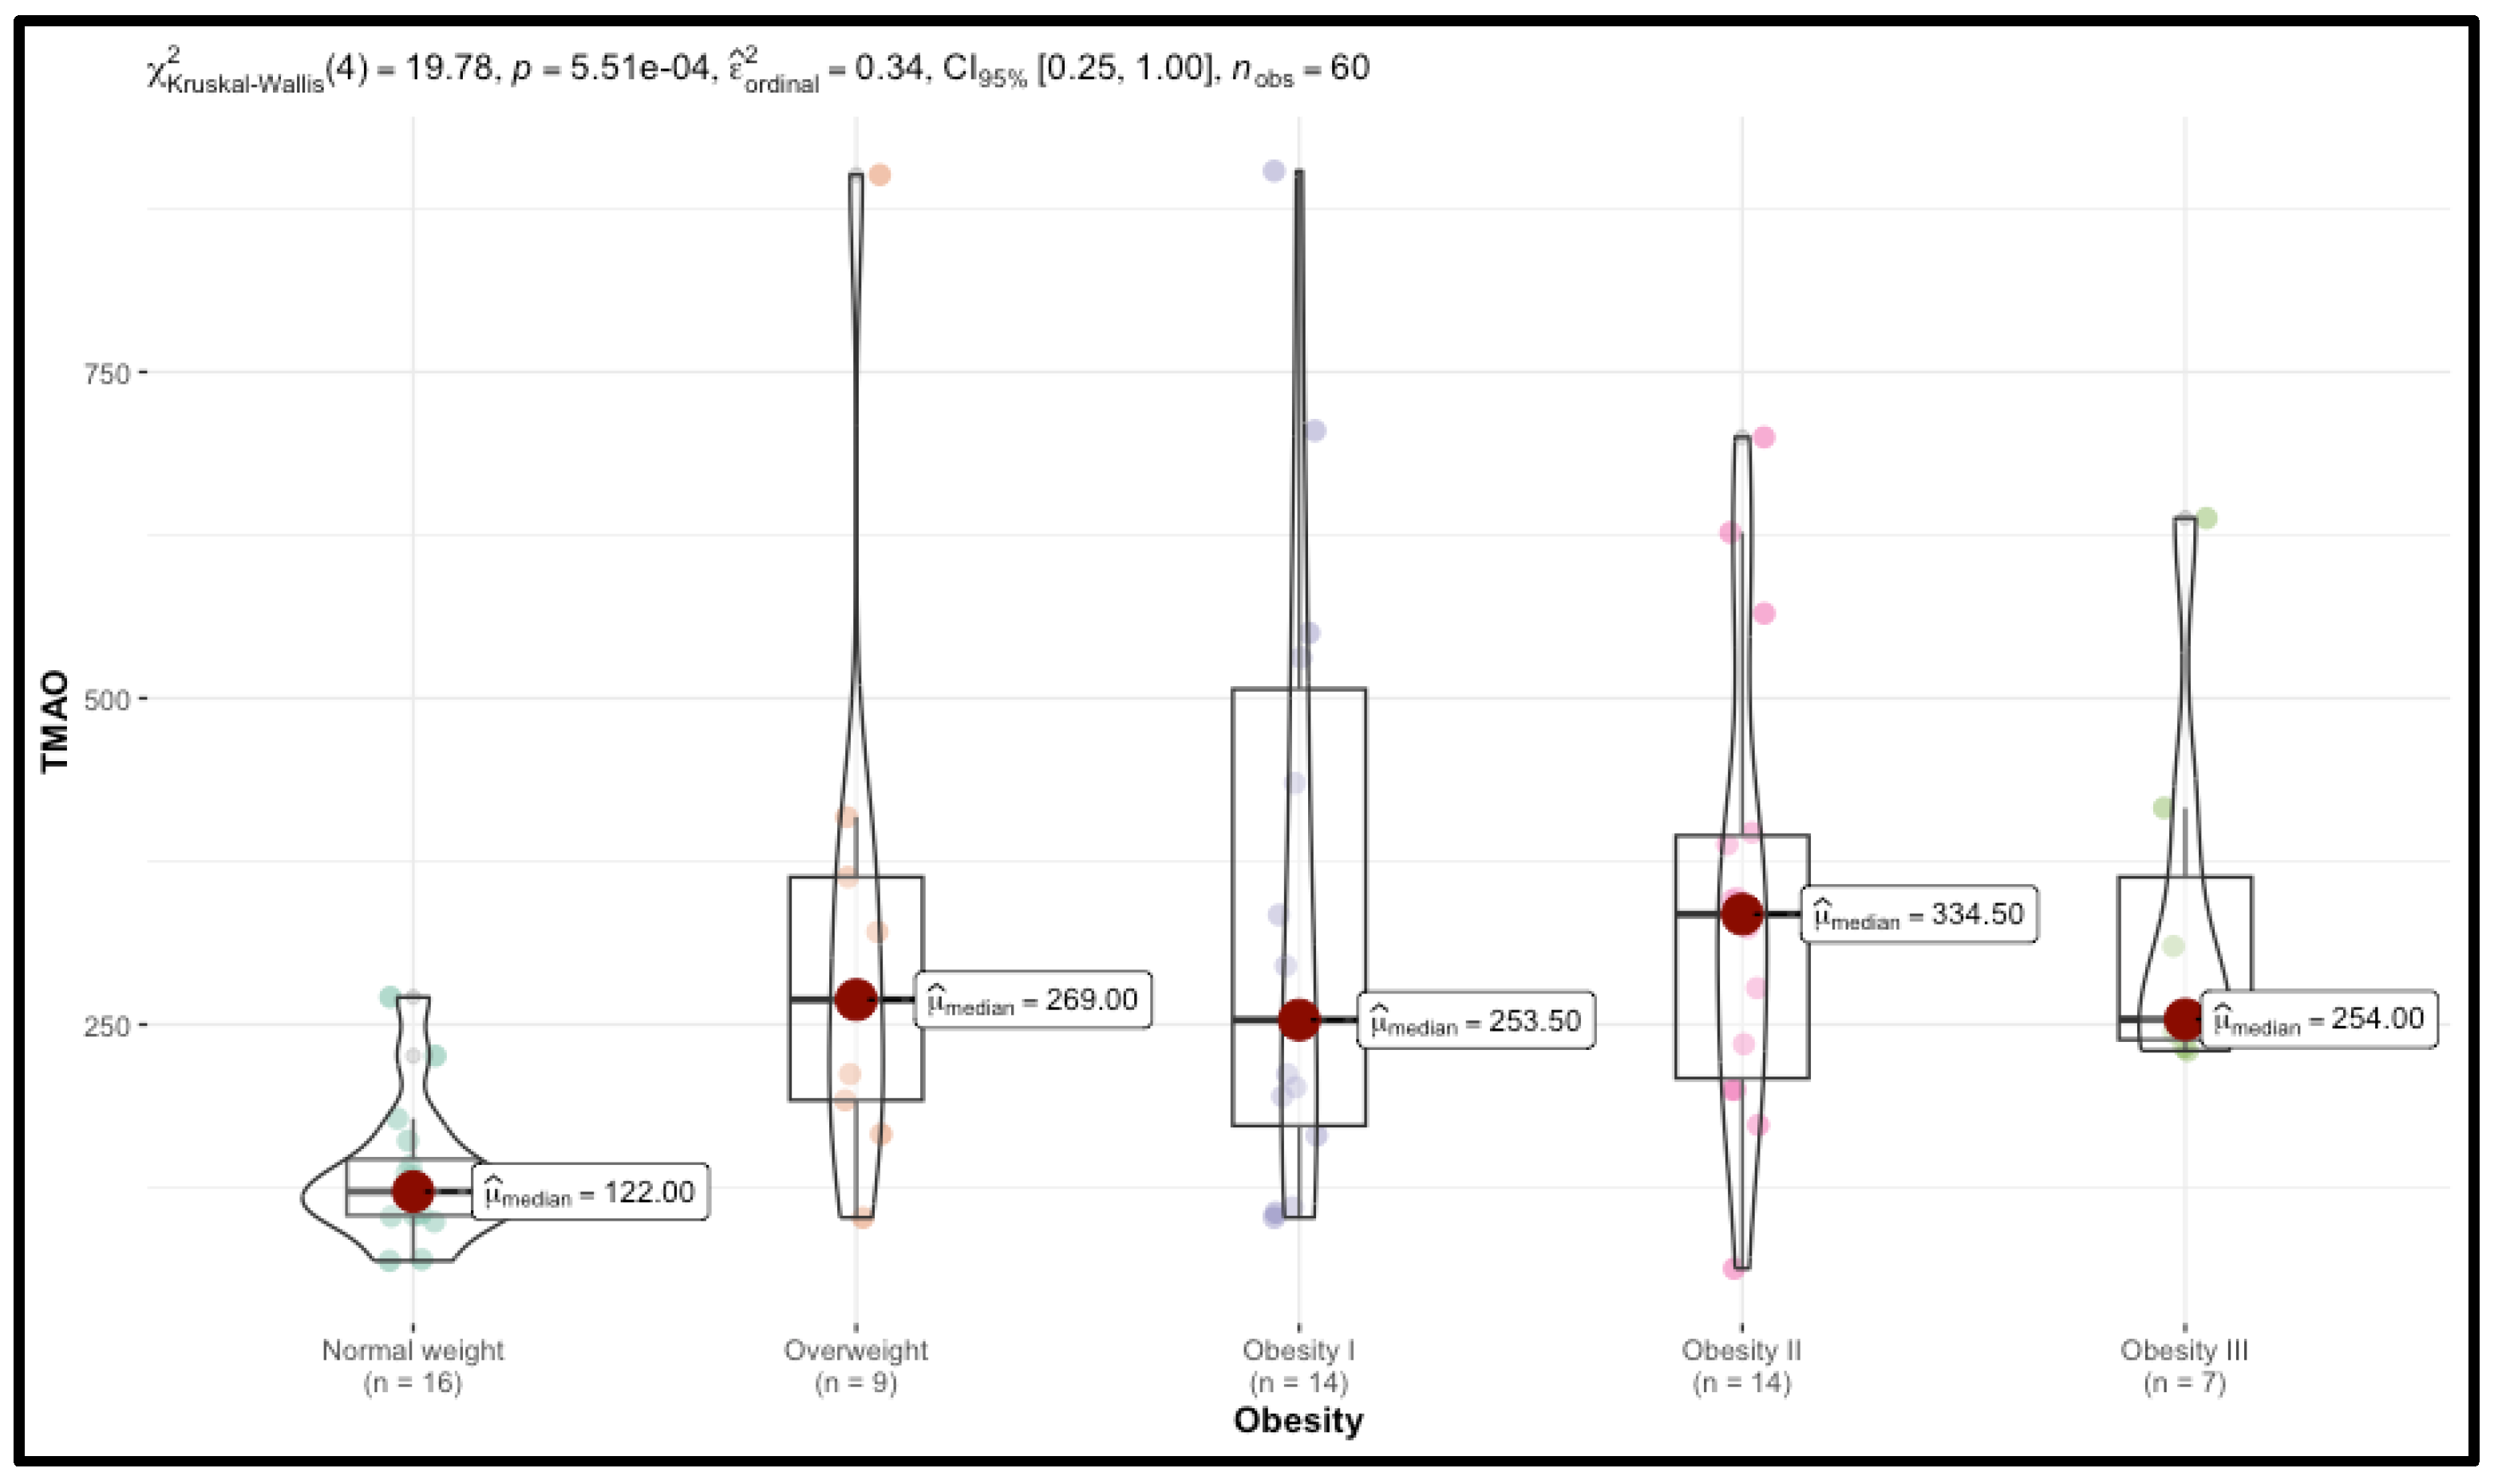
Figure.
Distribution of Resistin Levels Across Different BMI Categories.
The study explored the associations between TMAO and resistin levels with various demographic, behavioral, and health-related factors, yielding several significant outcomes. Gender did not demonstrate a significant influence on TMAO (p=0.73) or resistin levels (p=0.33), with comparable median values across males and females. Neither alcohol consumption nor smoking status had a significant effect on TMAO (p=0.68) or resistin (p=0.15). However, shorter sleep duration was significantly associated with elevated resistin levels (p=0.04), while TMAO levels remained unchanged (p=0.91). Physical activity showed a strong inverse correlation with both biomarkers, with lower levels of activity being associated with significantly higher TMAO (p=0.001) and resistin (p=0.02) levels. Furthermore, significant associations were identified between TMAO and a FMH of obesity (p=0.03) and diabetes (p=0.01), while resistin was significantly associated with a family history of diabetes (p=0.04). These findings are summarized in Table 2.
Table.
Associations of TMAO and Resistin Levels with Demographic, Behavioral, and Health Variables.
| Variable | Class (N) | TMAO | p-value | Resistin | p-value |
|---|---|---|---|---|---|
| Sex | M (13) | 233.00 (123.00 - 321.00) | 0.73 | 8.00 (5.00 - 9.00) | 0.33 |
| F (47) | 226.00 (150.50 - 355.00) | 6.00 (5.00 - 8.00) | |||
| Smoker | Yes (17) | 200.00 (110.00 - 363.00) | 0.68 | 8.00 (6.00 - 8.00) | 0.15 |
| No (43) | 230.00 (153.50 - 346.00) | 6.00 (5.00 - 8.00) | |||
| FMH Obesity | Yes (30) | 286.50 (200.50 - 406.00) | 0.03 | 7.00 (5.00 - 8.00) | 0.12 |
| No (30) | 172.00 (118.75 - 270.50) | 6.00 (5.00 - 8.00) | |||
| FMH Diabetes | Yes (22) | 302.50 (209.75 - 414.25) | 0.01 | 7.50 (6.00 - 9.75) | 0.04 |
| No (38) | 193.50 (118.75 - 318.25) | 6.00 (5.00 - 8.00) | |||
| FMH CV | Yes (24) | 286.50 (198.75 - 410.75) | 0.02 | 6.00 (5.00 - 8.25) | 0.71 |
| No (36) | 196.00 (116.00 - 316.00) | 6.00 (5.00 - 8.00) | |||
| Alcohol | Yes (7) | 200.00 (106.50 - 348.50) | 0.61 | 6.00 (5.00 - 9.50) | 0.89 |
| No (53) | 230.00 (142.00 - 347.00) | 6.00 (5.00 - 8.00) | |||
| Sleep< 7h/night | Yes (28) | 229.50 (132.75 - 351.00) | 0.91 | 7.00 (5.75 - 10.00) | 0.04 |
| No (32) | 221.00 (140.00 - 355.75) | 5.50 (5.00 - 8.00) | |||
| PA<150min/week | Yes (40) | 273.50 (194.25 - 400.00) | 0.001 | 7.50 (5.00 - 9.00) | 0.02 |
| No (20) | 138.00 (104.50 - 215.50) | 5.50 (4.75 - 6.25) | |||
| Lipid profile modifications | Yes (33) | 310.00 (202.00 - 416.00) | 0.001 | 6.00 (5.00 - 8.00) | 0.67 |
| No (27) | 161.00 (114.00 - 234.00) | 6.00 (5.00 - 8.00) | |||
| Diabetes status | Diabetes (9) | 269.00 (192.00 - 324.00) | 0.04 | 8.00 (6.00 - 10.00) | 0.26 |
| Prediabetes (11) | 388.00 (269.50 - 579.00) | 6.00 (5.00 - 8.00) | |||
| Normal (40) | 200.00 (122.50 - 288.75) | 6.00 (5.00 - 8.00) | |||
| Insulin resistance | Yes (47) | 244.00 (175.50 - 392.50) | 0.01 | 7.00 (5.00 - 8.00) | 0.05 |
| No (13) | 121.00 (105.00 - 212.00) | 5.00 (4.00 - 6.00) | |||
| Vitamin D status | Deficit (17) | 278.00 (200.00 - 363.00) | 0.08 | 6.00 (5.00 - 10.00) | 0.30 |
| Insufficiency (27) | 230.00 (172.00 - 416.00) | 7.00 (5.00 - 8.00) | |||
| Optimal (16) | 128.50 (108.75 - 244.00) | 5.50 (4.00 - 7.25) | |||
| Right vascular impairment | Yes (48) | 261.50 (194.25 - 400.00) | < 0.001 | 7.00 (5.00 - 8.25) | 0.07 |
| No (12) | 104.50 (91.75 - 134.50) | 5.50 (4.75 - 6.00) | |||
| Left vascular impairment | Yes (49) | 254.00 (192.00 - 397.00) | < 0.001 | 7.00 (5.00 - 8.00) | 0.16 |
| No (11) | 105.00 (100.50 - 129.50) | 6.00 (5.00 - 6.00) |
Abbreviations: FMH - Family Medical History, CV - Cardiovascular, PA - Physical Activity, TMAO - Trimethylamine N-oxide, p-value - Mann-Whitney U test result, N - number of individuals.
3.Correlation Analysis of TMAO and Resistin with Cardiometabolic Risk Factors
The analysis revealed significant correlations between TMAO levels and various metabolic health parameters, as demonstrated by the Spearman correlation coefficients. TMAO levels showed a moderate positive correlation with WHR (ρ=0.463, p<0.001), suggesting a robust association between elevated TMAO and central adiposity, a recognized risk factor for metabolic and cardiovascular pathologies. In the same context, moderate correlations were observed between TMAO levels and BMI (ρ=0.508, p<0.001), highlighting the association with generalized obesity in addition to abdominal obesity. Furthermore, TMAO levels were correlated with liver enzymes ALT (ρ=0.56, p<0.001) and AST (ρ=0.480, p<0.001), suggesting that TMAO could serve as a potential marker for liver dysfunction in individuals with overweight and obesity. Furthermore, TMAO was moderately correlated with HbA1c (ρ=0.442, p<0.001), indicating that higher TMAO levels are associated with poorer glycemic regulation over time. A similar moderate positive correlation was observed between TMAO and the HOMA-IR (ρ=0.461, p<0.001), implicating a relationship between elevated TMAO concentrations and increased insulin resistance. Collectively, these findings suggest that elevated TMAO levels are strongly associated with key metabolic dysregulations, including impaired glucose metabolism and insulin resistance, both of which are central features of metabolic syndrome. TMAO levels showed moderate correlations with LDL-c (ρ=0.428, p<0.001) and TC (ρ=0.499, p<0.001), suggesting a potential link between TMAO and dyslipidemia, which contributes to a higher cardiovascular risk.
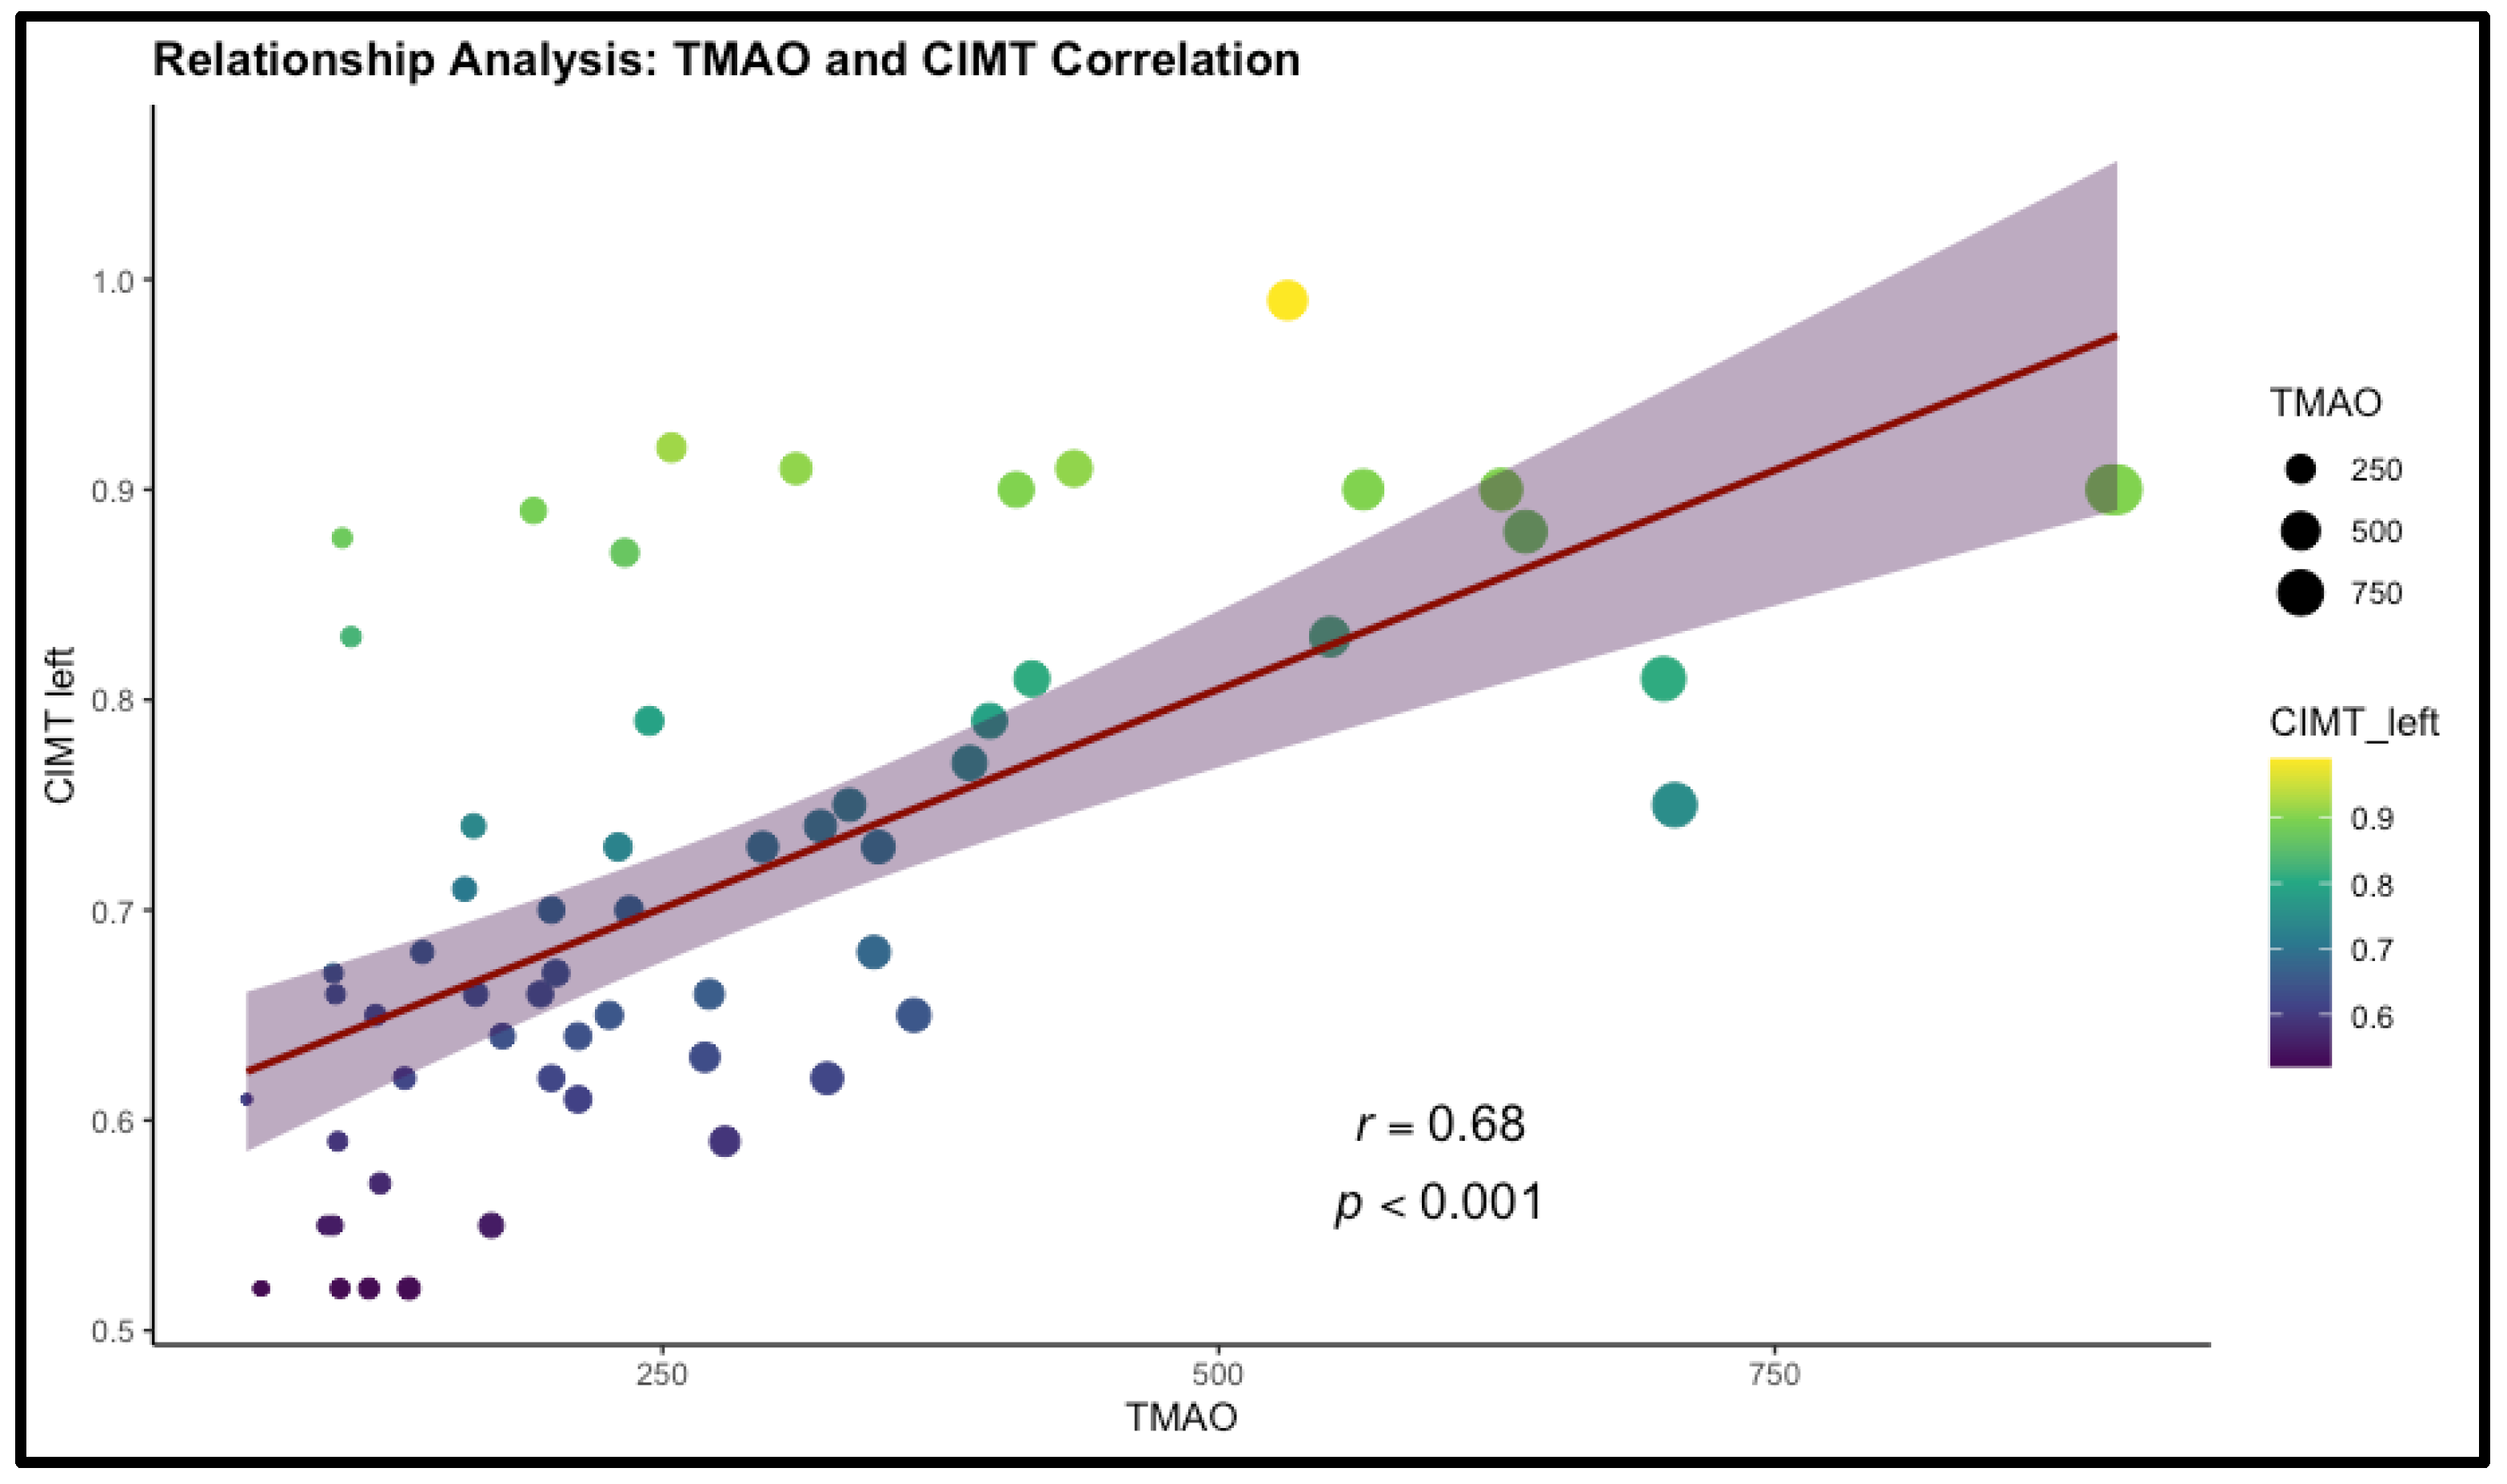
The strongest correlations were observed between TMAO levels and CIMT on both the right (ρ=0.674, p<0.001) and left (ρ=0.680, p<0.001) sides. These strong associations indicate that higher TMAO levels are closely linked to increased carotid artery thickness, a key indicator of subclinical atherosclerosis. This underscores the potential role of TMAO as a significant biomarker for cardiovascular risk. Therefore, these findings underscore the potential of this biomarker as a valuable predictor for the development of cardiometabolic pathologies. The detailed results are presented in Table 3 and Figure 3.
Table.
Spearman's Correlation and Effect Size of TMAO Levels with Various Health Indicators.
| Variable | ) | p-value |
|---|---|---|
| WHR | 0.463 | <0.001 |
| HBA1c | 0.442 | <0.001 |
| HOMA-IR | 0.461 | <0.001 |
| LDL-c | 0.428 | <0.001 |
| CIMT right | 0.674 | <0.001 |
| CIMT left | 0.680 | <0.001 |
| BMI | 0.508 | <0.001 |
| TC | 0.499 | <0.001 |
| ALT | 0.56 | <0.001 |
| AST | 0.480 | <0.001 |
Abbreviations: TMAO -Trimethylamine N-oxide, CIMT - Carotid Intima-Media Thickness, WHR - Waist-Hip Ratio, HOMA-IR - Homeostasis Model Assessment of Insulin Resistance, LDL-c - Low-Density Lipoprotein Cholesterol, AST - Aspartate Aminotransferase, ALT - Alanine Aminotransferase, BMI - Body Mass Index, p-value - Spearman's rank-order correlation test result.
Figure.
Correlation Between TMAO Levels and Left Carotid Intima-Media Thickness (CIMT).
The analysis demonstrates a statistically significant positive correlation between resistin levels and CIMT on both sides. Specifically, the correlation between resistin and left CIMT is τ=0.317 (p<0.001), while for right CIMT, it is τ=0.336 (p<0.001). These positive correlations indicate that elevated resistin levels are associated with increased carotid artery thickness bilaterally, suggesting a potential link between resistin and subclinical atherosclerosis. The results are presented in Table 4.
Table.
Kendall's Correlation and Effect Size of Resistin Levels with Various Health Indicators.
| Variable | p-value | |
|---|---|---|
| CIMT left | 0.317 | <0.001 |
| CIMT right | 0.336 | <0.001 |
Abbreviations: CIMT - Carotid Intima-Media Thickness, p-value - Kendall's tau test result.
3.Significant Independent Predictors of TMAO Levels
A multiple linear regression analysis was performed to identify significant predictors of TMAO levels. The model demonstrated a strong explanatory power, with an adjusted R² value of 0.483, indicating that approximately 48.3% of the variance in TMAO levels is explained by the predictors included in the model. The regression analysis identified right CIMT, trunk fat mass, abdominal circumference, and smoking status as significant predictors of TMAO levels. The strong positive association between TMAO and right CIMT underscores TMAO's potential as a biomarker for cardiovascular risk, particularly in relation to subclinical atherosclerosis. Furthermore, the associations with body composition parameters, such as trunk fat and abdominal circumference, in conjunction with smoking status, suggest that TMAO levels are influenced by both adiposity and lifestyle behaviors. Both cardiovascular factors, such as right CIMT, and metabolic factors, such as trunk fat measured by bioimpedance, were positively correlated with serum TMAO levels. Right CIMT was a significant predictor of TMAO, with an estimate of 1090.09 (CI: 766.08–1414.10, p < 0.001), indicating that each unit increase in right CIMT is associated with a 1090.09 unit increase in TMAO levels. Additionally, trunk fat was positively associated with TMAO levels, with an estimate of 9.11 (CI: 2.74–15.49, p=0.006), suggesting a link between increased trunk fat and higher TMAO concentrations. These findings indicate a multifactorial relationship between TMAO, cardiovascular risk factors, and metabolic health. The results are presented in Table 5.
Table.
Significant independent predictors of TMAO levels.
| Predictors | Estimates | CI | p-value |
|---|---|---|---|
| CIMT right | 1090.09 | 766.08 – 1414.10 | <0.001 |
| WC | -4.35 | -7.29 – -1.40 | 0.005 |
| Trunk fat | 9.11 | 2.74 – 15.49 | 0.006 |
| Smoker [Yes] | -94.55 | -179.88 – -9.23 | 0.031 |
| R2 adjusted | 0.483 |
Abbreviations: CIMT - Carotid Intima-Media Thickness, WC - Abdominal Circumference, CI - 95% Confidence Interval, p-value - t-test's result.
3.Assessing Cardiometabolic Risk Using TMAO: Logistic Regression Analysis
The logistic regression analysis presented in Table 6 evaluates the predictors of high cardiometabolic risk. In this analysis, the threshold value for TMAO was utilized to classify participants into two groups: those with high cardiometabolic risk and those without elevated cardiometabolic risk. The model's capacity to explain the variability in cardiometabolic risk is indicated by a Nagelkerke R² value of 0.475, suggesting that the model accounts for approximately 47.5% of the variance in the outcome. From a laboratory analysis perspective, TC emerged as a significant predictor of high cardiometabolic risk, with an odds ratio (OR) of 1.03 (95% CI: 1.01–1.05, p=0.015). This indicates that for each unit increase in TC, the likelihood of being classified in the high-risk group increases by 3%. Additionally, FT4 was inversely associated with high cardiometabolic risk, with an OR of 0.72 (95% CI: 0.52–0.95, p=0.029), indicating that higher FT4 levels are associated with a 28% reduction in the odds of being classified as high risk. Furthermore, AST showed a positive association with high cardiometabolic risk, with an OR of 1.10 (95% CI: 1.03–1.20, p=0.010), suggesting that for each unit increase in AST, the odds of being in the high-risk group increase by 10%. Elevated AST levels are commonly indicative of liver stress or damage, which may be linked to broader metabolic dysfunctions contributing to increased cardiometabolic risk.
Table.
Assessing cardiometabolic risk using TMAO.
| Predictors | Odds Ratios | CI | p-value |
|---|---|---|---|
| TC | 1.03 | 1.01 – 1.05 | 0.015 |
| FT4 | 0.72 | 0.52 – 0.95 | 0.029 |
| AST | 1.10 | 1.03 – 1.20 | 0.010 |
| R2 Nagelkerke | 0.475 |
Abbreviations: TMAO -Trimethylamine N-oxide, FT4 - Free Thyroxine (Free T4), AST - Aspartate Aminotransferase, CI - 95% Confidence Interval, p-value - Wald's test result, TC- Total Cholesterol.
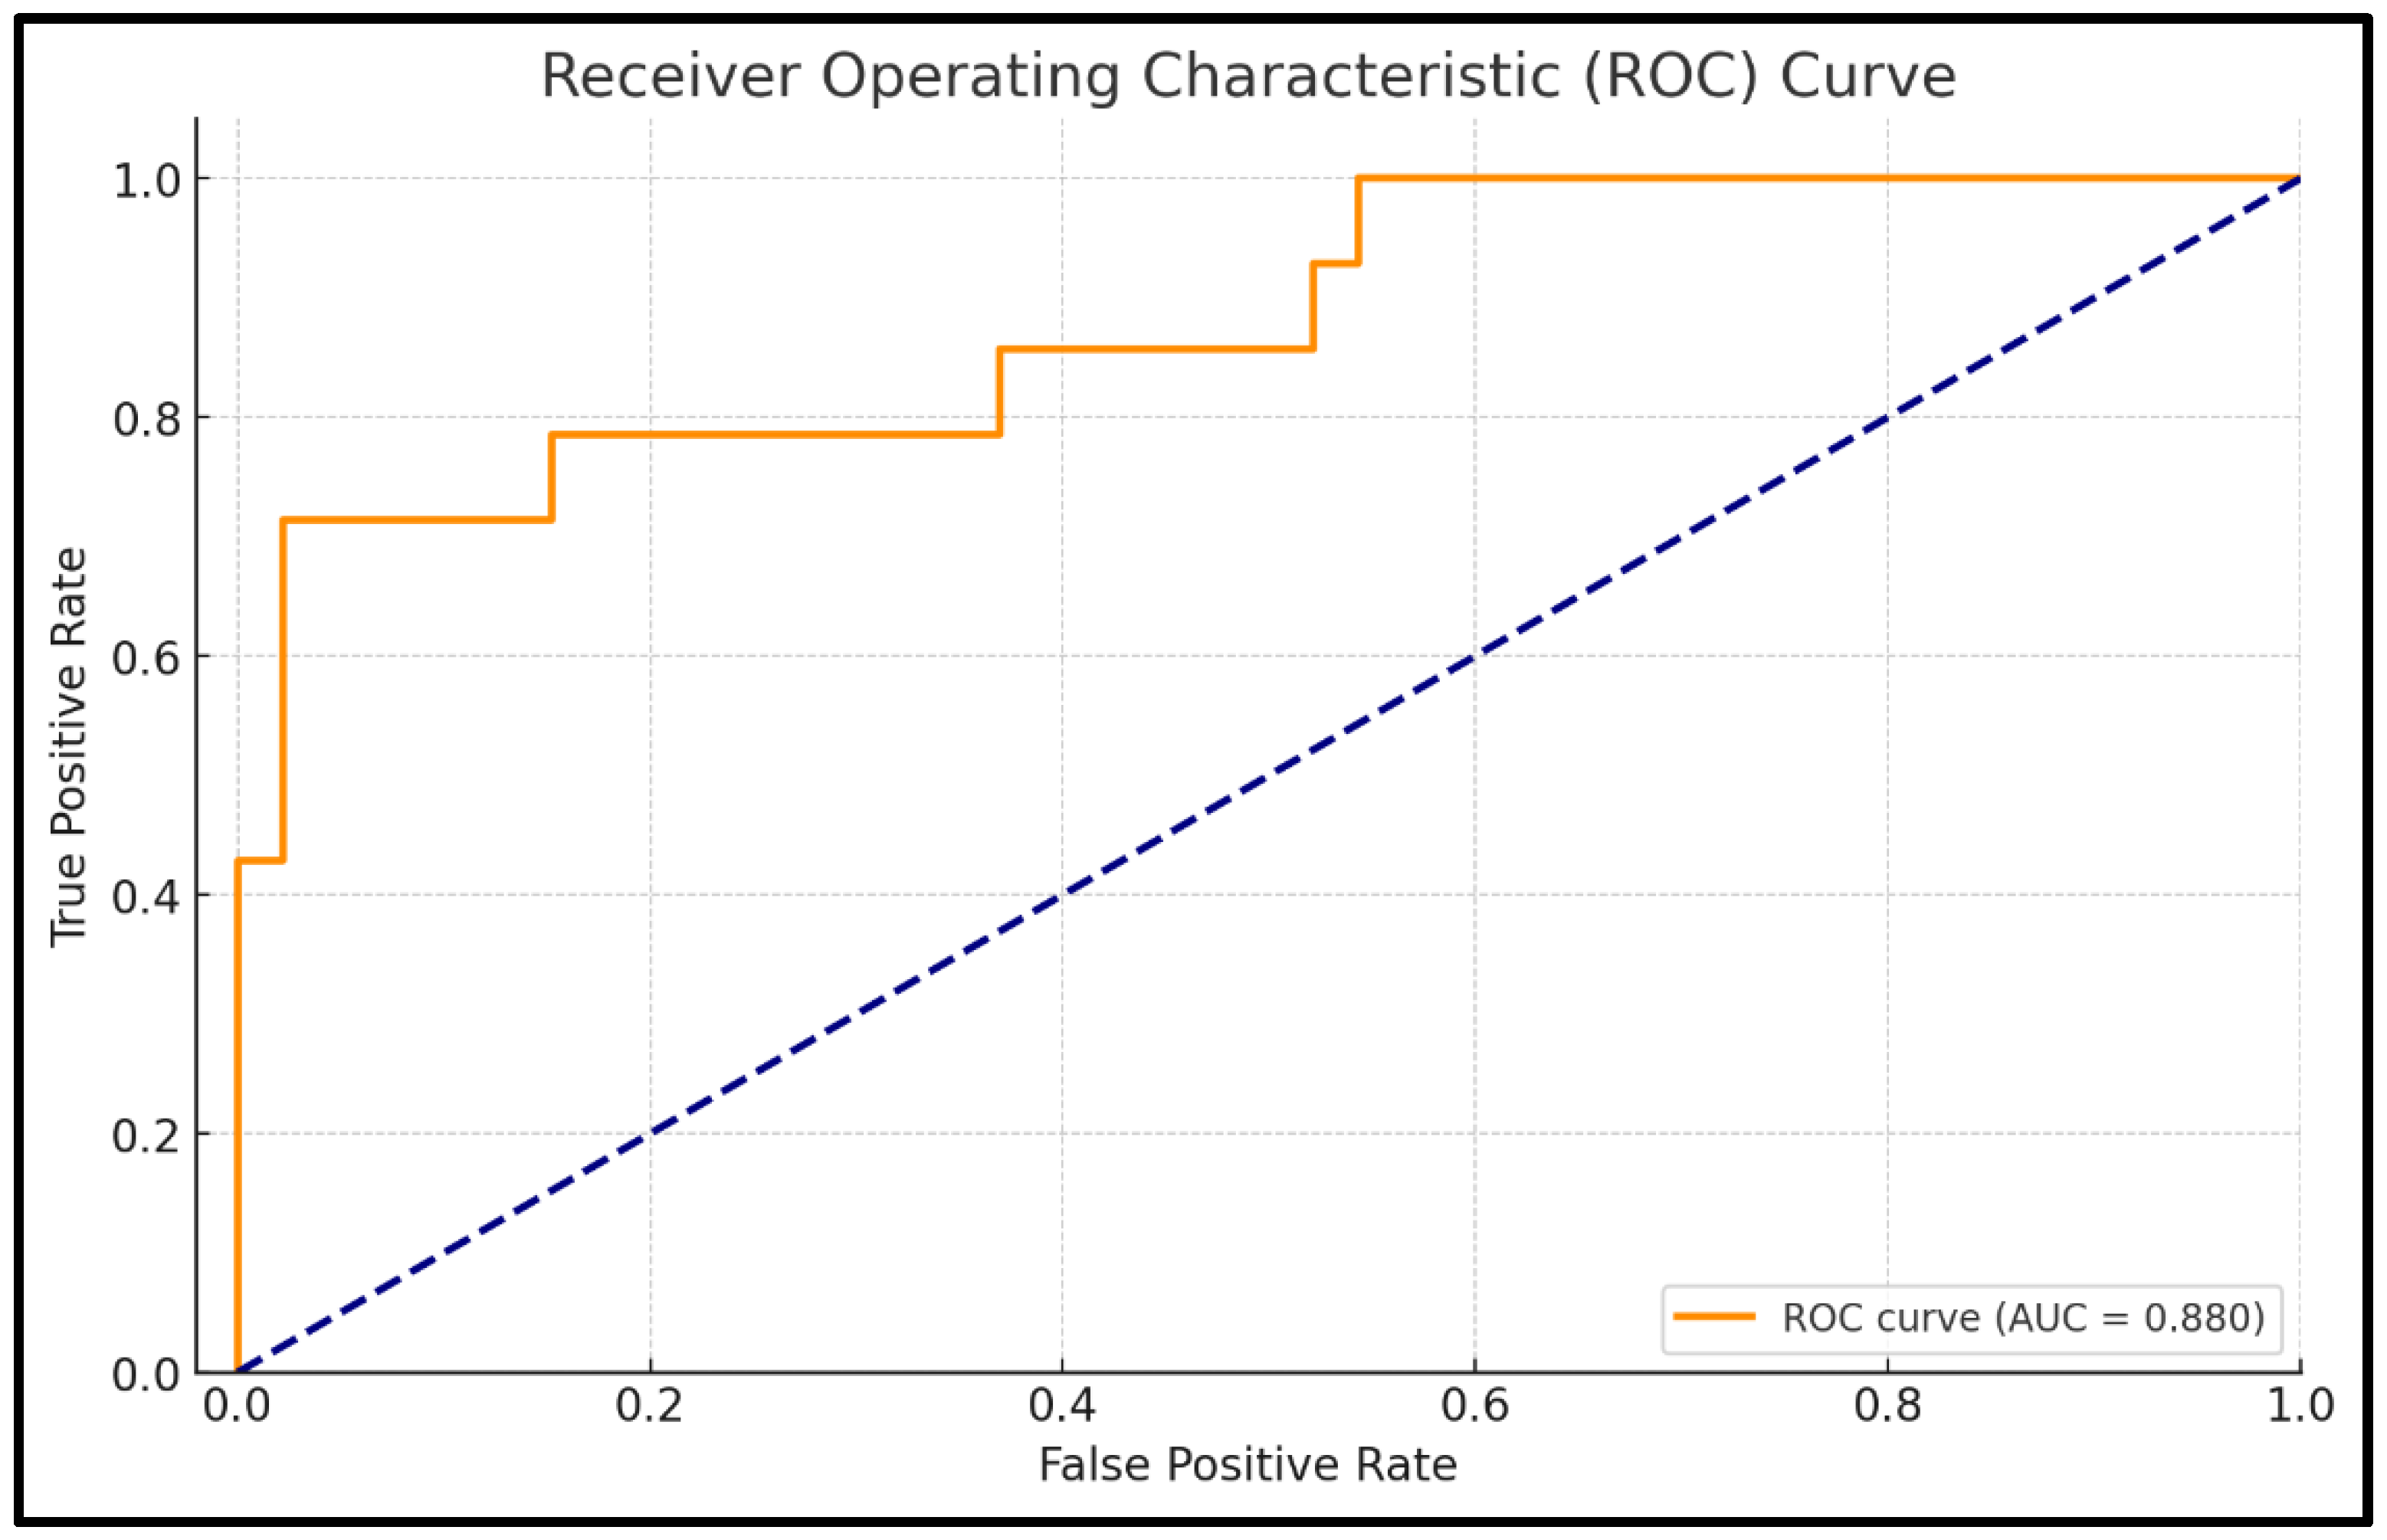
The ROC analysis evaluates the predictive performance of the logistic regression model for cardiometabolic risk based on TMAO levels. The AUC is 0.880, indicating excellent discrimination, meaning the model has an 88% likelihood of accurately distinguishing between high-risk and non-risk patients. The model achieves an accuracy of 91.7%, reflecting its strong capacity to correctly classify patients into the appropriate risk categories.
Specificity is notably high at 97.8%, demonstrating the model’s effectiveness in correctly identifying patients without high cardiometabolic risk, minimizing false positives. Sensitivity, which reflects the model's ability to identify high-risk patients, is 71.4%. The confidence interval for the AUC (0.768–0.992) highlights the reliability of the model, with the narrow interval indicating consistent performance across different samples. The p-value of <0.001 confirms that the model's discriminatory ability is statistically significant and not due to chance. Full details are presented in Table 7 and Figure 4.
Table.
ROC Parameters for TMAO-Based Cardiometabolic Risk Prediction Model.
| ROC Parameters | Value |
|---|---|
| AUC | 0.880 |
| Accuracy | 0.917 |
| Specificity | 0.978 |
| Sensitivity | 0.714 |
| CI | 0.768 - 0.992 |
| p-value | < 0.001 |
Abbreviations: TMAO -Trimethylamine N-oxide, AUC - Area Under the ROC Curve, ROC - Receiver Operating Characteristics, CI - 95% Confidence Interval, p-value - DeLong's test result.
Figure 4.
ROC Curve for TMAO-Based Cardiometabolic Risk Prediction Model.
3.Significant Independent Predictors of Resistin Levels
The multiple linear regression analysis identified several significant predictors of resistin levels, with the model accounting for 44.3% of the variance, as indicated by the adjusted R² value of 0.Positive associations were observed between resistin levels and several evaluated parameters, including left CIMT, WHR and TC. Specifically, left CIMT was positively associated with resistin, with an estimated coefficient of 10.63 (CI: 4.42–16.84, p=0.001), indicating that for each unit increase in left CIMT, resistin levels rise by 10.63 units. This strong positive association suggests that elevated resistin levels are linked to greater carotid artery thickness, reinforcing resistin’s potential role as a biomarker for cardiovascular health. From an anthropometric perspective, WHR showed a significant positive association with resistin levels, with an estimate of 3.11 (CI: 1.01–5.21, p=0.004). This finding implies that higher WHR, indicative of central obesity, is correlated with increased resistin levels. The association highlights the link between central fat distribution and elevated resistin, potentially contributing to the insulinresistance profile associated with obesity. However, no positive association was found between resistin and trunk fat percentage quantified using bioelectrical impedance analysis. Regarding biological markers, total cholesterol exhibited a small but significant positive association with resistin levels, with an estimated coefficient of 0.04 (CI: 0.01–0.06, p=0.019), suggesting that as total cholesterol increases, resistin levels rise slightly. In contrast, LDL-c demonstrated a significant negative association with resistin, with an estimate of -0.06 (CI: -0.09– -0.02, p=0.003). The results are summarized in Table 8.
Table 8.
Significant independent predictors of resistin levels.
| Predictors | Estimates | CI | p-value |
|---|---|---|---|
| Age | -0.08 | -0.13 – -0.04 | <0.001 |
| CIMT left | 10.63 | 4.42 – 16.84 | 0.001 |
| WHR | 3.11 | 1.01 – 5.21 | 0.004 |
| TC | 0.04 | 0.01 – 0.06 | 0.019 |
| LDL-c | -0.06 | -0.09 – -0.02 | 0.003 |
| R2 adjusted | 0.443 |
Abbreviations: CIMT - Carotid Intima-Media Thickness, WHR - Waist-Hip Ratio, LDL-c - Low-Density Lipoprotein Cholesterol, TC-Total cholesterol, CI - 95% Confidence Interval, p-value - t-test's result.
3.Interaction Between TMAO and Resistin in Predicting Obesity Risk
The logistic regression model in Table 9 evaluates TMAO, resistin, and their interaction as predictors of obesity (defined by BMI), explaining 32.1% of the variance, as indicated by a Nagelkerke R² of 0.TMAO is a significant predictor of obesity (OR: 1.02, CI: 1.01–1.04, p=0.003), with each unit increase in TMAO associated with a 2% rise in obesity risk, supporting its role as a biomarker for metabolic health. Resistin is also a significant predictor (OR: 1.93, CI: 1.19–3.39, p=0.012), with each unit increase nearly doubling obesity risk (93% increase), emphasizing its link to inflammation and metabolic dysfunction. The interaction between TMAO and resistin is significant (OR: 1.00, CI: 1.00–1.00, p=0.010), suggesting their combined effect on obesity is more complex than their individual effects. This indicates that TMAO’s relationship with obesity may be influenced by resistin levels, or vice versa, highlighting a potential interplay between these biomarkers in obesity risk. Results are shown in Table 9.
Table 9.
Interaction Between TMAO and Resistin for Predicting Obesity Risk.
| Predictors | Odds Ratios | CI | p-value |
|---|---|---|---|
| TMAO | 1.02 | 1.01 – 1.04 | 0.003 |
| Resistin | 1.93 | 1.19 – 3.39 | 0.012 |
| TMAO × Resistin | 1.00 | 1.00 – 1.00 | 0.010 |
| R2 Nagelkerke | 0.321 |
Abbreviations: TMAO -Trimethylamine N-oxide, CI - 95% Confidence Interval, p-value - Wald's test result.
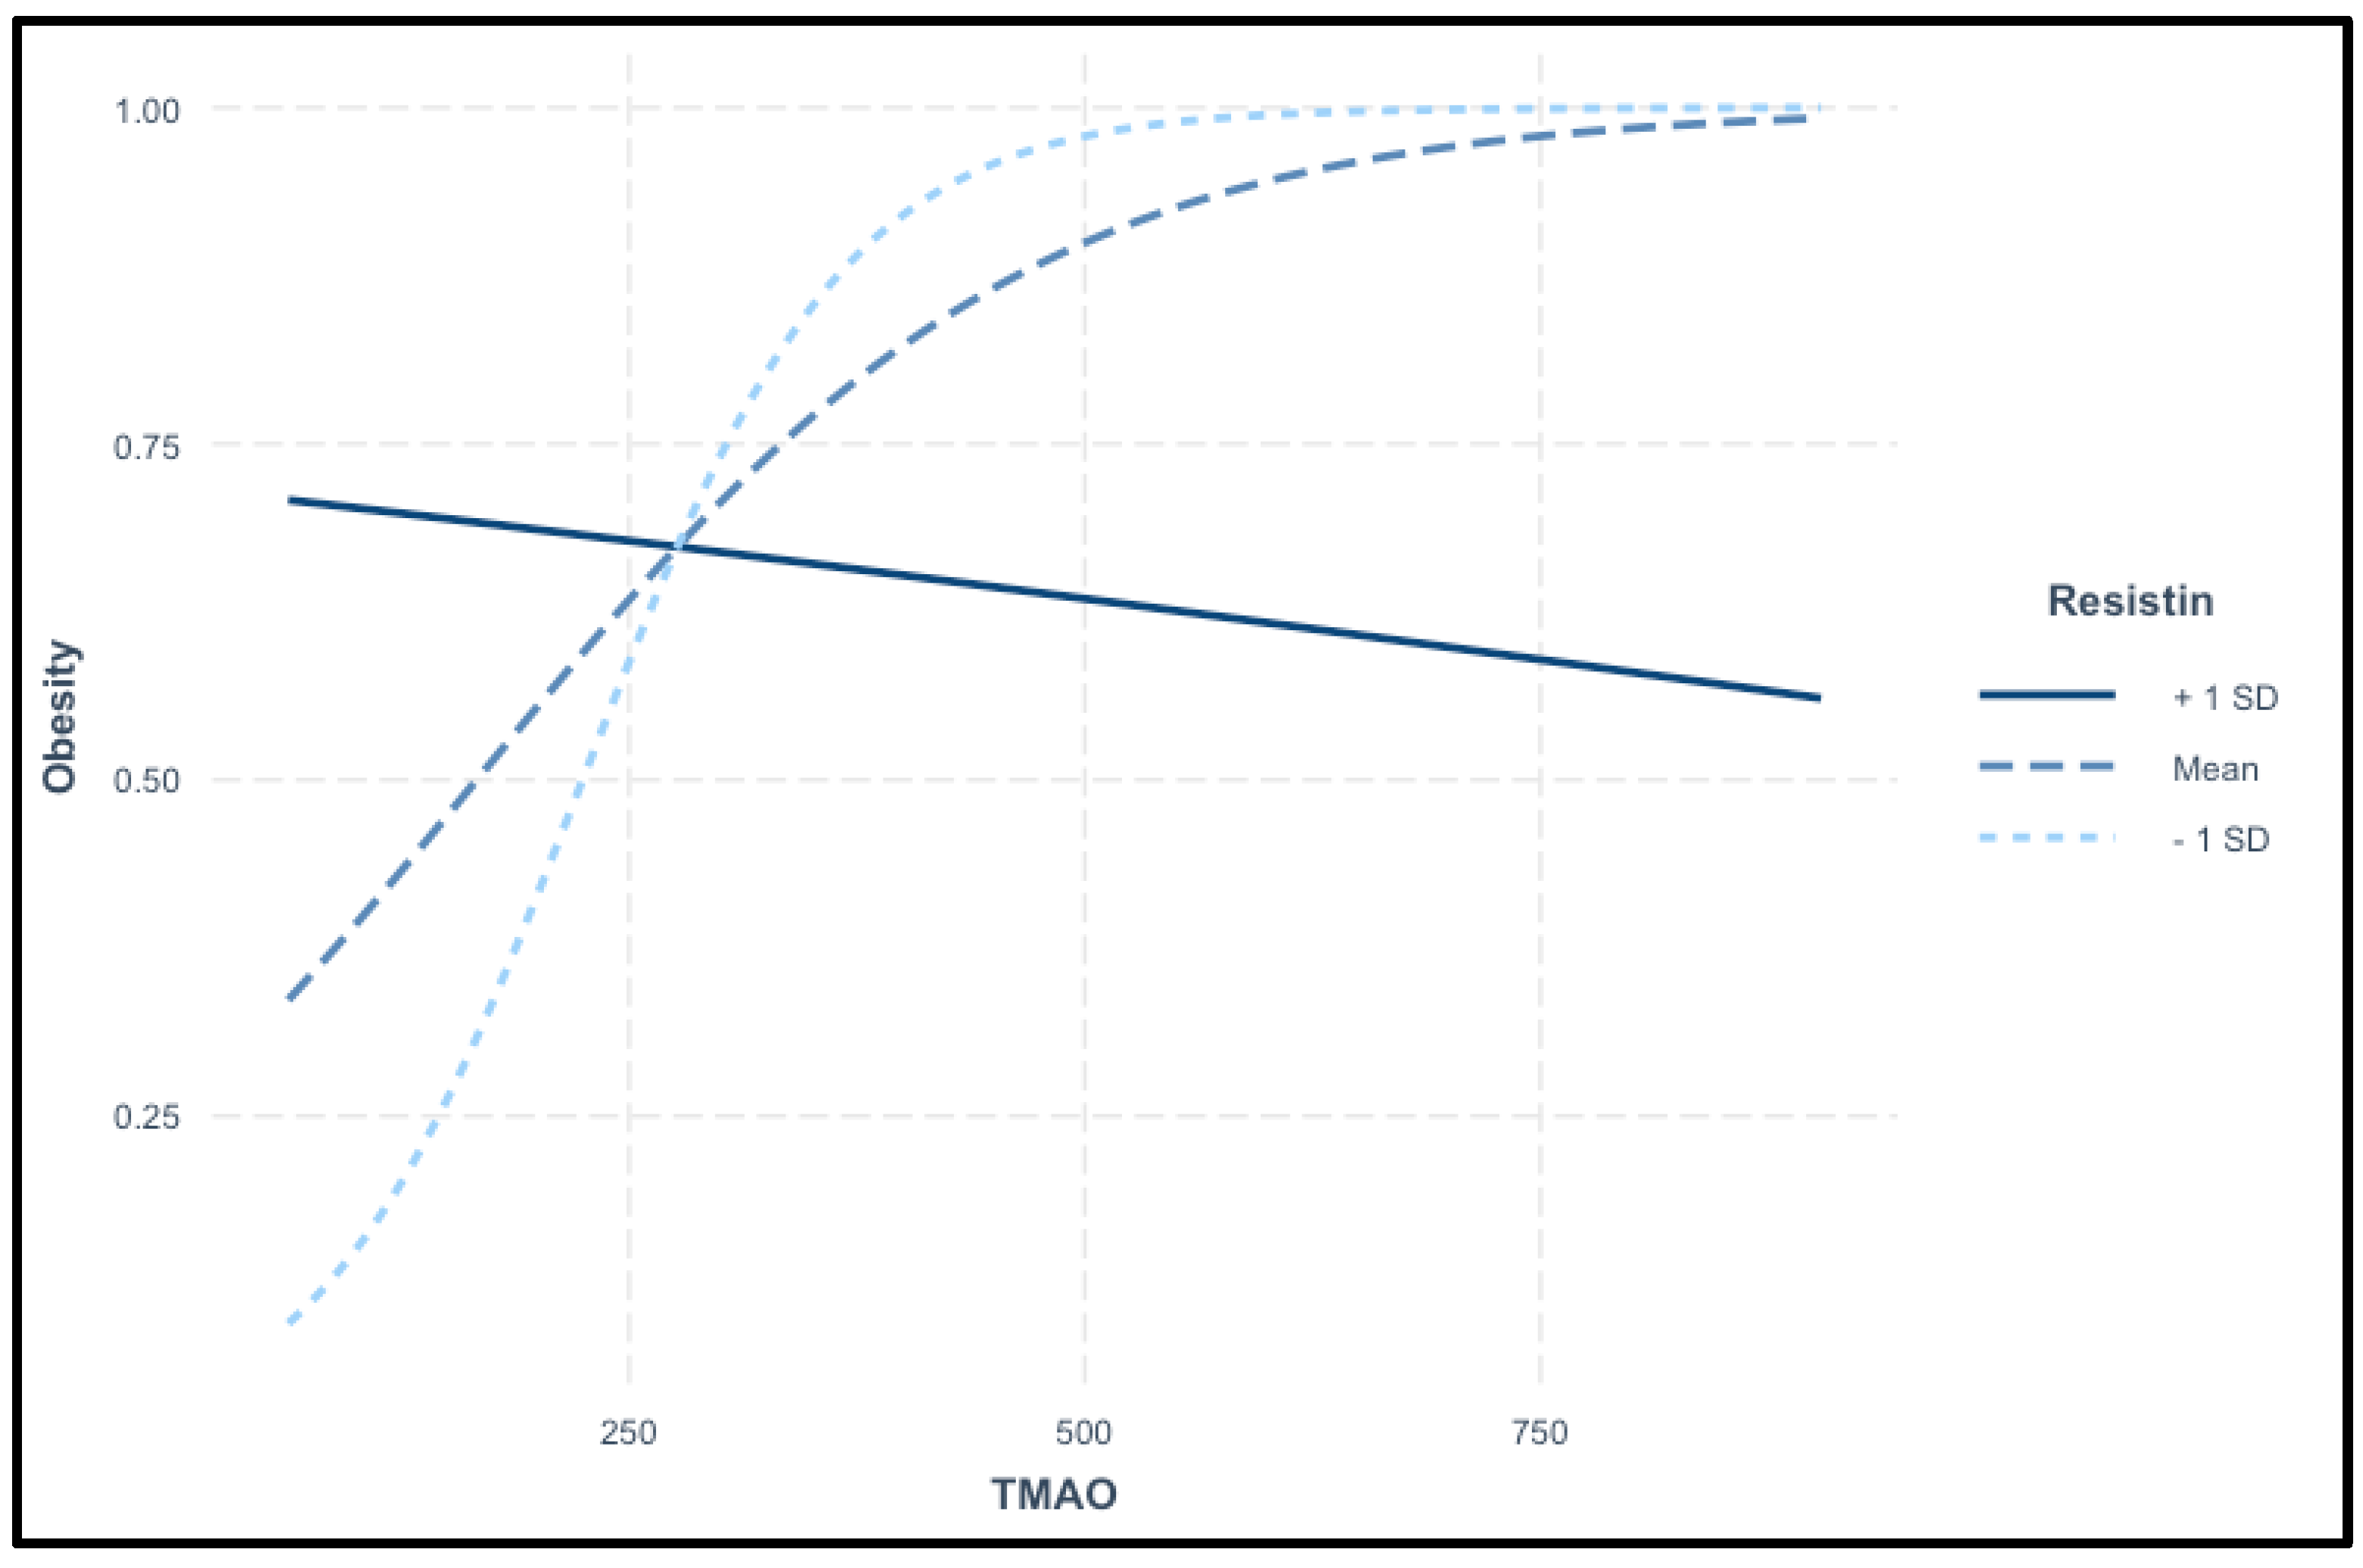
The interaction plot in Figure 5 demonstrates the variation in the relationship between TMAO levels and the probability of obesity across different resistin levels. TMAO serves as the primary predictor, while resistin acts as a moderating variable. The plot displays three distinct lines: the solid line represents high resistin (+1 SD), the dashed line represents average resistin (mean), and the dotted line represents low resistin (-1 SD). At elevated resistin levels (+1 SD), the solid line indicates a decrease in the probability of obesity with increasing TMAO levels. This suggests a potential modifying effect, where high resistin alters the expected relationship, resulting in a reduced likelihood of obesity despite higher TMAO levels. This finding implies a complex interaction between TMAO and resistin in influencing obesity risk. In contrast, at average resistin levels, the dashed line demonstrates a typical positive association between TMAO and obesity, where the probability of obesity increases as TMAO levels rise. This suggests that at average resistin levels, TMAO is associated with a heightened risk of obesity, consistent with previous findings. The dotted line, representing low resistin levels (-1 SD), shows a pronounced increase in the probability of obesity with rising TMAO levels. This indicates that at low resistin levels, TMAO has a strong positive effect on obesity risk, with higher TMAO levels significantly elevating the likelihood of obesity. This plot reveals a complex interaction between TMAO and resistin in predicting obesity. While TMAO generally increases obesity risk, this effect is modulated by resistin levels. Specifically, high resistin levels may attenuate or even reverse the impact of TMAO on obesity, indicating a non-linear relationship between these biomarkers. This highlights the importance of assessing both TMAO and resistin together when evaluating obesity risk.
Figure.
Interaction of TMAO and Resistin in Predicting Obesity.
The logistic regression model in Table 10 assesses the risk of insulin resistance using resistin, TMAO, and their interaction as predictors. The model explains 36.5% of the variance in insulin resistance risk (Nagelkerke R²=0.365), indicating a moderately strong predictive ability. Resistin is a significant predictor of insulin resistance, with an OR of 2.85 (CI: 1.57–5.98, p=0.002), meaning that each unit increase in resistin nearly triples the odds of being insulin-resistant, with an increase of 185%. TMAO is also a significant predictor, with an OR of 1.03 (CI: 1.01–1.05, p=0.005), suggesting that each unit increase in TMAO raises the odds of insulin resistance by 3%. The interaction between resistin and TMAO is statistically significant (OR: 1.00, CI: 0.99–1.00, p = 0.004), indicating a complex relationship where the effects of resistin on insulin resistance may be modified by TMAO levels, or vice versa. This suggests that the relationship between these biomarkers and insulin resistance is potentially synergistic or antagonistic, rather than simply additive.
Table 10.
Interaction of Resistin and TMAO in predicting insulin resistance.
| Predictors | Odds Ratios | CI | p-value |
|---|---|---|---|
| Resistin | 2.85 | 1.57 – 5.98 | 0.002 |
| TMAO | 1.03 | 1.01 – 1.05 | 0.005 |
| Resistin × TMAO | 1.00 | 0.99 – 1.00 | 0.004 |
| R2 Nagelkerke | 0.365 |
Abbreviations: TMAO -Trimethylamine N-oxide, CI - 95% Confidence Interval, p-value - Wald's test result.
The interaction analysis reveals a complex relationship between resistin, TMAO, and insulin resistance. When TMAO levels are high, there is an inverse relationship, where increasing resistin levels are associated with a lower probability of insulin resistance, suggesting a potential protective or diminished effect of resistin. At average TMAO levels, insulin resistance risk remains relatively stable across different resistin levels, indicating minimal impact of resistin in this context. However, at low TMAO levels, the probability of insulin resistance rises sharply as resistin increases, indicating that resistin strongly contributes to insulin resistance risk when TMAO is low. These findings highlight the complex interaction between biomarkers in predicting insulin resistance, where their effects are not simply additive but interconnected.
Discussion
The present study conducted a detailed examination of the associations between TMAO and resistin levels and a range of demographic, behavioral, and health-related factors. This analysis identified multiple significant relationships, providing insights into how these biomarkers correlate with specific population characteristics and health behaviors. Zhuang Z et al. had shown that TMAO levels can vary significantly by gender, with some studies indicating that males may have higher circulating TMAO levels compared to females, potentially due to differences in gut microbiota composition and dietary patterns between sexes [78]. Contrary to these results, in our research gender did not have a significant effect on both TMAO and resistin levels, as comparable median values were observed in both males and females. Additionally, family history of obesity and diabetes has been associated with elevated TMAO levels, suggesting a genetic or environmental predisposition that may influence TMAO metabolism and its impact on cardiometabolic risk factors [79]. These findings highlight that both gender and family history are important factors in understanding individual variations in TMAO levels and their potential implications for disease risk [80]. Similarly, in the present study, it was observed that both TMAO and resistin levels were significantly higher in participants with a family history of obesity, diabetes, or cardiovascular disease, indicating a potential genetic influence on these biomarkers.
Studies indicate that smoking is associated with elevated TMAO levels, likely due to its impact on gut microbiota composition and increased oxidative stress, which may enhance TMAO production and contribute to cardiovascular risk [81]. Similarly, elevated resistin levels observed in smokers have been associated with heightened endothelial dysfunction, thereby increasing the risk of cardiovascular disease [82]. However, our research demonstrated that smoking status showed no significant impact on these two biomarkers. Alcohol consumption has been linked to increased resistin and TMAO levels in other studies, potentially through inflammatory pathways, liver stress, and gut microbiota disruption, all of which elevate cardiovascular risk [83,84,85]. In contrast, the present study found no significant effect of alcohol consumption on TMAO or resistin levels. Evidence links sleep duration with resistin and TMAO levels, with shorter sleep associated with elevated resistin, likely due to inflammatory and metabolic changes [86]. Reduced sleep has also been tied to increased TMAO, potentially through gut microbiota alterations [87]. However, in our research, shorter sleep correlated with higher resistin, while TMAO levels remained unaffected.
This research provides a comprehensive analysis of both resistin and the gut-derived metabolite, serum TMAO associations with early vascular changes, such as subclinical atherosclerosis, assessed through CIMT. Additionally, the study identifies independent predictors of these biomarkers in adults with overweight and obesity, offering insights into their potential roles in the development of cardiometabolic dysfunction and early vascular alterations within this population.
Obesity is a well-established risk factor for the development of insulin resistance, which plays a central role in the pathogenesis of subclinical atherosclerosis [88,89]. Endothelial dysfunction is a key factor in the onset of atherosclerosis, arising from oxidative and nitrosative stress, inflammation, arterial hypertension, and aging, with the primary consequence of this pathophysiological process being the narrowing of the arterial lumen [90,91]. Vascular impairment is observed among individuals with overweight, though its presence is not consistent across all cases, and the severity of vascular damage varies significantly between subjects. Aging-related vascular changes include the substitution of elastic fibers with collagen, degradation of smooth muscle fibers, calcium deposition, and a decline in viscoelastic properties, all of which compromise arterial elasticity [90,92]. Subclinical atherosclerosis, characterized by thickening of the arterial walls, can be detected using measures such as CIMT and has been shown to be significantly elevated in individuals with obesity and insulin resistance [93]. CIMT measurement allows for the evaluation of early arterial wall changes before clinical manifestations of atherosclerosis, providing a preventive approach for identifying individuals at increased cardiovascular risk [94]. Studies have shown that an increased CIMT is strongly associated with traditional cardiovascular risk factors, including hypertension, dyslipidemia, and obesity, suggesting that CIMT can reflect the cumulative impact of these factors on arterial health [44]. Furthermore, longitudinal studies demonstrate that elevated CIMT is predictive of future cardiovascular events, including myocardial infarction and stroke, underscoring its potential in risk stratification and early intervention strategies [95]. The use of this non-invasive marker to detect early structural and functional changes in the arterial walls may serve as an effective preventive tool for individuals with overweight and obesity, facilitating the identification of vascular alterations before the onset of clinical symptoms.
In terms of cardiovascular health, the current study identified strong correlations between both right and left CIMT and serum TMAO levels, indicating an elevated likelihood of subclinical atherosclerosis in patients with obesity who exhibit higher TMAO levels. Moreover, right CIMT was identified as a highly significant predictor of TMAO, underscoring a robust association between carotid arterial wall thickness and this biomarker. These findings suggest an enhanced role for TMAO in cardiovascular risk assessment. Additionally, moderate correlations were observed between TMAO and both LDL-c and TC, suggesting a contributory role for TMAO in dyslipidemia development, and thereby, a potential amplification in the risk of cardiovascular pathologies. From the perspective of evaluating insulin resistance through the determination of serum resistin levels, bilateral CIMT demonstrated a positive correlation with elevated serum resistin concentrations. Considering that CIMT is a well-established marker of subclinical atherosclerosis and, by extension, an indicator of cardiovascular risk, these findings suggest that resistin may play a significant role in cardiovascular pathology. Furthermore, resistin could potentially serve as a biomarker for cardiovascular disease risk assessment.
TMAO has gained attention for its role in adipose tissue dysfunction and its associations with obesity, where it appears to influence key metabolic and inflammatory pathways. Elevated levels of TMAO have been linked to increased adiposity, with research suggesting that TMAO may contribute to insulin resistance in adipose tissue by enhancing inflammatory signaling pathways and promoting oxidative stress within adipocytes [96]. Heianza Y et al. demonstrated that high circulating TMAO levels are positively correlated with visceral fat deposition and markers of obesity, suggesting that TMAO may contribute to the progression of obesity and related cardiometabolic disorders [97]. Furthermore, Schugar RC et al. demonstrated that TMAO can interfere with lipid metabolism in adipocytes by impairing lipid storage processes and altering lipolysis, resulting in abnormal fat accumulation and exacerbation of obesity-related metabolic disturbances [98]. Given these findings, TMAO is emerging as both a biomarker and a potential mechanistic factor in the metabolic alterations associated with adipose tissue dysfunction in obesity, highlighting its relevance in the study of obesity and metabolic health [99]. From another perspective, TMAO has emerged as a key metabolite linking gut microbiota to the pathogenesis of atherosclerosis, with mounting evidence supporting its role in promoting vascular dysfunction and plaque formation. Elevated TMAO levels are associated with increased expression of inflammatory cytokines and adhesion molecules in endothelial cells, which facilitate leukocyte adhesion and vascular inflammation, critical processes in the development of atherosclerotic plaques [100]. TMAO also impairs reverse cholesterol transport by inhibiting bile acid synthesis, leading to increased cholesterol deposition within the arterial wall and contributing to plaque formation [101]. Furthermore, TMAO has been shown to enhance platelet reactivity and thrombosis, thereby elevating the risk of arterial occlusion and adverse cardiovascular events [102]. Studies have demonstrated that high TMAO levels correlate positively with CIMT, suggesting that TMAO plays a role in the early stages of atherosclerotic disease progression [103]. Considering these findings, TMAO has gained attention as a potential biomarker for cardiovascular risk stratification and as a therapeutic target to mitigate atherosclerosis and related complications [104].
In our research, TMAO was correlated with markers of obesity, insulin resistance, subclinical atherosclerosis, and liver health, suggesting its potential value as a parameter in these conditions. Moderate correlations were identified between TMAO and BMI, as well as WHR, highlighting its potential association with central adiposity. Additionally, TMAO's role in insulin resistance was evidenced by its correlation with both HOMA-IR and HbA1c, reinforcing its significance in type 2 diabetes mellitus among individuals with excess body weight. Furthermore, TMAO demonstrated a cardiovascular role through its moderate correlations with TC and LDL-c levels. Its involvement in liver function was underscored by a moderate correlation with hepatic enzyme levels. Notably, trunk fat percentage, as determined by bioelectrical impedance analysis, was positively associated with TMAO levels, indicating that higher percentages of central adiposity correspond to increased serum TMAO concentrations. This finding emphasizes the relevance of TMAO measurement in individuals with central obesity. WC, trunk fat percentage by bioimpedance, CIMT and smoking status were identified as significant predictors of TMAO levels in individuals with excess weight, underscoring the critical importance of these parameters in clinical practice and the management of these patients.
Resistin is an adipokine that has garnered significant attention for its role in obesity related inflammation and its implications for cardiovascular diseases. Primarily secreted by macrophages in human adipose tissue, resistin contributes to adipose tissue dysfunction by promoting chronic low-grade inflammation, which is a hallmark of obesity [105]. In individuals with obesity, elevated resistin levels have been associated with insulin resistance, as resistin can interfere with insulin signaling pathways, further exacerbating metabolic dysfunction within adipose tissue [106]. Recent studies indicate that resistin levels are positively correlated with inflammatory markers, including interleukin-6 (IL-6) and C-reactive protein (CRP), suggesting its role in perpetuating the inflammatory environment associated with obesity [107]. In addition to its metabolic effects, resistin has significant cardiovascular implications, particularly in the development of subclinical atherosclerosis. Resistin induces endothelial dysfunction by increasing the expression of adhesion molecules such as vascular cell adhesion molecule-1 (VCAM-1) and intercellular adhesion molecule-1 (ICAM-1), which facilitate leukocyte adhesion and migration into the arterial wall, contributing to the early stages of atherogenesis [108]. Elevated circulating resistin levels have also been linked to increased CIMT, indicating that resistin may play a role in the early vascular changes that precede overt cardiovascular events [109]. Recent evidence from longitudinal studies supports that higher resistin concentrations are associated with an increased risk of major adverse cardiovascular events, including myocardial infarction and stroke, further highlighting the clinical relevance of resistin in cardiovascular risk stratification [110]. Thus, resistin serves as a critical link between obesity, adipose tissue inflammation, and cardiovascular disease, emphasizing its potential as a biomarker and therapeutic target for reducing obesity-related cardiovascular risk.
In our study, similar to the biomarker TMAO, serum resistin levels were also associated with CIMT, predominantly on the left carotid side, further reinforcing the role of resistin in cardiovascular diseases. From a laboratory investigation perspective, an unexpected negative association was observed between LDL-c and resistin, despite a positive correlation between total cholesterol and this biomarker. The inverse relationship between these two serum parameters is somewhat counterintuitive, suggesting that the sample size of the study cohort may have been insufficient to yield definitive results. Additionally, a positive correlation was observed between WHR, an indicator of central obesity, and resistin, underscoring its potential utility in identifying insulin resistance in individuals with abdominal adiposity. These findings highlight the multifaceted role of resistin in metabolic and cardiovascular pathologies, suggesting its relevance as a biomarker in clinical practice.
The synergistic effects of TMAO and resistin in individuals with obesity may amplify inflammatory pathways, leading to increased arterial stiffness and early structural changes reflected in CIMT measurements [78]. Additionally, both biomarkers are independently associated with insulin resistance, which further promotes vascular dysfunction by impairing nitric oxide availability and exacerbating endothelial dysfunction [79]. A recent meta-analysis suggests that high circulating levels of TMAO and resistin are positively correlated with CIMT in individuals with obesity, indicating that they may serve as valuable predictors for early cardiovascular risk [80]. Together, TMAO and resistin provide a mechanistic link between metabolic dysfunction in obesity and the development of atherosclerosis, positioning these markers as potential targets for early intervention to mitigate cardiovascular risk.
In our study, both TMAO and resistin were identified as significant predictors of obesity. Furthermore, the interaction between these two biomarkers among individuals with obesity was found to be statistically significant, suggesting that their association is more intricate than their individual effects alone. This implies that TMAO and resistin may function synergistically to influence the risk of developing obesity. Moreover, a noteworthy observation was made regarding the dynamic interplay between these biomarkers: the relationship between TMAO and obesity appears to be modulated by serum levels of resistin, and vice versa. This highlights the importance of considering both biomarkers concurrently for a comprehensive prediction of obesity risk. These findings underscore the necessity of further investigation into the mechanistic pathways linking TMAO and resistin to obesity, which may provide valuable insights for improved risk stratification and potential therapeutic strategies.
Our study successfully validated the primary hypothesis, confirming the relationship between the two biomarkers, TMAO and resistin, and cardiometabolic pathology, as well as their association with CIMT, metabolic markers, and body composition parameters assessed through bioimpedance analysis in overweight and obese individuals. Furthermore, the research demonstrated the significance of combining these parameters to improve the predictive accuracy for obesity. Additionally, this study provided further insights by identifying various correlations between TMAO, resistin, laboratory investigations, anthropometric parameters, and electrical bioimpedance, a technique employed to quantify adipose tissue mass. Despite the promising findings, there are notable limitations associated with the assessment of TMAO, resistin, and CIMT in individuals with obesity. First, the small sample size represents a significant constraint of this study. Second, CIMT measurements require the use of advanced technology and specific equipment, as well as strict adherence to procedural guidelines, including appropriate conditions and the involvement of a certified clinician with expertise in this field. Moreover, the determination of TMAO and resistin in laboratory settings involves additional costs, which may pose challenges for broader application. Nonetheless, the study highlights the critical role of these biomarkers in predicting excessive weight and underscores the potential for their combined use to enhance risk stratification and clinical decision-making in obesity management.
Conclusions
This study highlights the critical role of TMAO as a key metabolic mediator that bridges elevated BMI with a broad spectrum of metabolic dysregulations and cardiovascular pathologies. The findings demonstrate a strong and consistent association between circulating TMAO levels and central adiposity, emphasizing its involvement in the underlying mechanisms of obesity-induced metabolic derangements. Additionally, the contribution of TMAO to atherosclerotic progression is evidenced by its significant correlations with CIMT, a well-established surrogate marker of subclinical atherosclerosis. Moreover, this study underscores the complementary role of resistin as a biomarker that provides further insights into the intricate and multifaceted relationships among obesity, metabolic dysregulation, and cardiovascular risk. Resistin's involvement in inflammatory pathways and its association with obesity-related cardiovascular complications underscores its relevance in the pathophysiology of these conditions. Together, TMAO and resistin emerge as crucial biomarkers that enhance our understanding of the complex interplay between excess adiposity, metabolic imbalances, and cardiovascular dysfunction. These findings underscore the importance of incorporating these biomarkers into risk assessment frameworks, with potential applications in stratifying at-risk individuals and developing targeted therapeutic strategies to mitigate obesity-related metabolic and cardiovascular complications.
Author Contributions
.
Funding
This research was funded by “VICTOR BABES” UNIVERISTY OF MEDICINE AND PHARMACY TIMISOARA.
Institutional Review Board Statement
Informed consent was obtained from all subjects involved in the study.” The study adhered to the ethical standards of the Helsinki Declaration and was approved by the Scientific Research Ethics Committee (CECS) of the “Victor Babeș” University of Medicine and Pharmacy Timișoara (No. 69/03.10.2022).
Informed Consent Statement
Informed consent was obtained from all subjects involved in the study. Written informed consent has been obtained from the patient(s) to publish this paper.
Acknowledgments
This research was funded by “VICTOR BABES” UNIVERISTY OF MEDICINE AND PHARMACY TIMISOARA.
Conflicts of Interest
The authors declare no conflicts of interest.
Abbreviations
The following abbreviations are used in this manuscript:
| TMAO | Trimethylamine N-oxide; |
| CIMT | Carotid Intima-Media Thickness; |
| WC | Waist Circumference; |
| WHR | Waist-Hip Ratio; |
| RBM | Resting Basal Metabolism; |
| FBG | Fasting Blood Glucose; |
| HOMA-IR | Homeostasis Model Assessment of Insulin Resistance; |
| LDLc | Low-Density Lipoprotein Cholesterol; |
| HDLc | High-Density Lipoprotein Cholesterol; |
| TSH | Thyroid-Stimulating Hormone; |
| FT4 | Free Thyroxine (Free T4); |
| AST | Aspartate Aminotransferase; |
| ALT | Alanine Aminotransferase; |
| TC | Total Cholesterol; |
| p-value | Kruskal-Wallis test result; |
| N | number of individuals; |
| FMH | Family Medical History; |
| CV | Cardiovascular; |
| PA | Physical Activity; |
| CI | 95% Confidence Interval; |
| AUC | Area Under the ROC Curve; |
| ROC | Receiver Operating; |
References
- Amerikanou C, Kleftaki SA, Valsamidou E, Tzavara C, Gioxari A, Kaliora AC. Dietary patterns, cardiometabolic and lifestyle variables in Greeks with obesity and metabolic disorders. Nutrients. 2022 Nov 28;14(23):5064. [CrossRef] [PubMed] [PubMed Central]
- Cefalu WT, Rodgers GP. COVID-19 and metabolic diseases: A heightened awareness of health inequities and a renewed focus for research priorities. Cell Metab. 2021 Mar;33(3):473–8. [CrossRef] [PubMed]
- Guan L, Li T, Wang X, Yu K, Xiao R, Xi Y. Predictive roles of basal metabolic rate and body water distribution in sarcopenia and sarcopenic obesity: The link to carbohydrates. Nutrients. 2022 Sep 21;14(19):3911. [CrossRef] [PubMed] [PubMed Central]
- Koenen M, Hill MA, Cohen P, Sowers JR. Obesity, adipose tissue, and vascular dysfunction. Circ Res. 2021 Apr 2;128(7):951-68. [CrossRef] [PubMed] [PubMed Central]
- World Health Organization. Obesity and overweight [Internet]. Geneva: World Health Organization; 2021 Jun 9 [cited 2024 Jan 4]. Available from: www.who.int/en/news-room/fact-sheets/detail/obesity-and-overweight.
- Centers for Disease Control and Prevention. Adult Obesity Prevalence Maps [Internet]. Atlanta (GA): Centers for Disease Control and Prevention; 2023 Mar 17 [cited 2024 Jan 4]. Available from: www.cdc.gov/obesity/data/prevalence-maps.html.
- NCD Risk Factor Collaboration (NCD-RisC). Worldwide trends in underweight and obesity from 1990 to 2022: a pooled analysis of 3663 population-representative studies with 222 million children, adolescents, and adults. Lancet. 2024;403(10431):1027-50. [CrossRef]
- Hubert HB, Feinleib M, McNamara PM, Castelli WP. Obesity as an independent risk factor for cardiovascular disease: a 26-year follow-up of participants in the Framingham Heart Study. Circulation. 1983;67(5):968-77.
- NCD Risk Factor Collaboration (NCD-RisC). Rising rural body-mass index is the main driver of the global obesity epidemic in adults. Nature. 2019 May;569(7755):260-4. [CrossRef]
- Peters U, Dixon AE, Forno E. Obesity and asthma. J Allergy Clin Immunol. 2018 Apr;141(4):1169-79. [CrossRef] [PubMed] [PubMed Central]
- Pati S, Irfan W, Jameel A, Ahmed S, Shahid RK. Obesity and cancer: A current overview of epidemiology, pathogenesis, outcomes, and management. Cancers (Basel). 2023 Jan;15(2):485. [CrossRef]
- Salmón-Gómez L, Catalán V, Frühbeck G, Gómez-Ambrosi J. Relevance of body composition in phenotyping the obesities. Rev Endocr Metab Disord. 2023;24:809–23. [CrossRef]
- Blundell JE, Dulloo AG, Salvador J, Frühbeck G. Beyond BMI: Phenotyping the obesities. Obes Facts. 2014;7:322–8. doi: 10.1159/PMID: [PubMed].
- Khattak ZE, Zahra F. Evaluation of patients with obesity. In: StatPearls [Internet]. Treasure Island (FL): StatPearls Publishing; Available from: https://www.statpearls.com.
- Prospective Studies Collaboration, Whitlock G, Lewington S, Sherliker P, Clarke R, Emberson J, Halsey J, Qizilbash N, Collins R, Peto R. Body-mass index and cause-specific mortality in 900,000 adults: collaborative analyses of 57 prospective studies. Lancet. 2009 Mar 28;373(9669):1083-96. [CrossRef] [PubMed] [PubMed Central]
- Flegal KM, Ioannidis JPA, Doehner W. Flawed methods and inappropriate conclusions for health policy on overweight and obesity: the Global BMI Mortality Collaboration meta-analysis. J Cachexia Sarcopenia Muscle. 2019 Feb;10(1):9-13. [CrossRef] [PubMed] [PubMed Central]
- de Oliveira BR, Magalhães EIdS, Bragança MLBM, Coelho CCNdS, Lima NP, Bettiol H, Barbieri MA, Cardoso VC, dos Santos AM, Horta BL, et al. Performance of body fat percentage, fat mass index, and body mass index for detecting cardiometabolic outcomes in Brazilian adults. Nutrients. 2023;15(15):2974. doi: 10.3390/nuPMID: [PubMed]; PMCID: [PubMed Central].
- Ho-Pham LT, Campbell LV, Nguyen TV. More on body fat cutoff points. Mayo Clin Proc. 2011;86(6):584. [CrossRef]
- Pescari D, Mihuta MS, Bena A, Stoian D. Comparative analysis of dietary habits and obesity prediction: body mass index versus body fat percentage classification using bioelectrical impedance analysis. Nutrients. 2024;16(19):3291. [CrossRef]
- Neeland IJ, Ross R, Després JP, et al. Visceral and ectopic fat, atherosclerosis, and cardiometabolic disease: A position statement. Lancet Diabetes Endocrinol. 2019;7(9):715-25. [CrossRef]
- Lee CM, Huxley RR, Wildman RP, et al. Indices of abdominal obesity are better discriminators of cardiovascular risk factors than BMI: A meta-analysis. J Clin Epidemiol. 2018;61(7):646-53. [CrossRef]
- Stefan N, Schick F, Häring HU. Causes, characteristics, and consequences of metabolically unhealthy normal weight in humans. Cell Metab. 2017;26(2):292-300. [CrossRef]
- Yusuf S, Hawken S, Ounpuu S, et al. Obesity and the risk of myocardial infarction in 27,000 participants from 52 countries: A case-control study. Lancet. 2018;366(9497):1640-9. [CrossRef]
- Lear SA, James PT, Ko GT, et al. Appropriateness of waist circumference and waist-to-hip ratio cutoffs for different ethnic groups. Eur J Clin Nutr. 2019;63(1):42-9. [CrossRef]
- Zhang C, Rexrode KM, van Dam RM, et al. Abdominal obesity and the risk of all-cause, cardiovascular, and cancer mortality: Sixteen years of follow-up in US women. Circulation. 2008;117(13):1658-67. [CrossRef]
- Zieske AW, Malcom GT, Strong JP. Natural history and risk factors of atherosclerosis in children and youth: The PDAY study. Pediatr Pathol Mol Med. 2002;21:213–37. [CrossRef]
- Singh SS, Pilkerton CS, Shrader CD, Frisbee SJ. Subclinical atherosclerosis, cardiovascular health, and disease risk: Is there a case for the Cardiovascular Health Index in the primary prevention population? BMC Public Health. 2018;18:1–11. [CrossRef]
- Del Giorno R, Maddalena A, Bassetti S, Gabutti L. Association between alcohol intake and arterial stiffness in healthy adults: A systematic review. Nutrients. 2022;14(6):1207. [CrossRef]
- Hansson GK, Hermansson A. The immune system in atherosclerosis. Nat Immunol. 2011;12(3):204–12. [CrossRef]
- Brown MS, Goldstein JL. Lipoprotein metabolism and the pathogenesis of atherosclerosis. N Engl J Med. 1986;314(8):512–7. [CrossRef]
- Kuriyan R. Body composition techniques. Indian J Med Res. 2018;148:648–58. [CrossRef]
- Ahmed U, Anwar M, Farhan F, et al. Association of carotid intima-media thickness with obesity-related cardiovascular risk factors: A population-based study. Appl Sci. 2021;11(22):10721. [CrossRef]
- López-López L, Corrales-Medina F, Rueda-Clausen CF. Carotid intima-media thickness as a marker of early atherosclerosis in adults and children: A comprehensive review. Ultrasound J. 2021;13(1):18. [CrossRef]
- Thakur M, Kumari P, Sharma M, et al. Mechanistic link between obesity, vascular health, and carotid intima-media thickness: Insights into cardiometabolic disease pathogenesis. In: Advances in Obesity and Cardiovascular Research. Springer; 2023. p. 367–85. [CrossRef]
- Tchernof A, Després JP. Pathophysiology of human visceral obesity: An update. Eur Heart J. 2013;29(24):2959–64. [CrossRef]
- Kozakova M, Palombo C. Obesity, insulin resistance, and increased arterial stiffness: Relation to carotid intima-media thickness and subclinical atherosclerosis. Front Physiol. 2015;6:231. [CrossRef]
- Frühbeck G, Toplak H, Woodward E, et al. Obesity: The gateway to cardiometabolic risk. Lancet Diabetes Endocrinol. 2019;7(9):634–46. [CrossRef]
- Galis ZS, Sukhova GK, Lark MW, Libby P. Increased expression of matrix metalloproteinases and matrix-degrading activity in vulnerable regions of human atherosclerotic plaques. J Clin Invest. 1994;94(6):2493–503. [CrossRef]
- Oda N, Imamura S, Fujita T, et al. The association between low HDL cholesterol levels and coronary atherosclerosis in hypercholesterolemic patients: The impact of small, dense LDL cholesterol. J Am Coll Cardiol. 2020;62(1):120–7. [CrossRef]
- Koskinen J, Magnussen CG, Sabin MA, et al. Youth obesity, arterial stiffness, and increased adult CIMT: The cardiovascular risk in Young Finns Study. J Am Coll Cardiol. 2020;75(11):1321–9. [CrossRef]
- Yoo TW, Sung KC, Rhee EJ, et al. Relation of carotid intima-media thickness with visceral fat area and insulin resistance in healthy individuals. Int J Cardiol. 2021;246:144–9. [CrossRef]
- Bots ML, Baldassarre D, Simon A, et al. Carotid intima-media thickness and coronary atherosclerosis: Weak or strong relations? Eur Heart J. 2017;38(42):3071–3. [CrossRef]
- Yeboah J, McClelland RL, Polonsky TS, et al. Obesity, metabolic syndrome, and progression of atherosclerosis: The Multi-Ethnic Study of Atherosclerosis. J Clin Endocrinol Metab. 2019;104(8):3312–20. [CrossRef]
- Stein JH, Korcarz CE, Hurst RT, et al. Use of carotid ultrasound to identify subclinical vascular disease and evaluate cardiovascular disease risk: A consensus statement from the American Society of Echocardiography Carotid Intima-Media Thickness Task Force. J Am Soc Echocardiogr. 2019;21(2):93–111. [CrossRef]
- Piepoli MF, Hoes AW, Agewall S, et al. European guidelines on cardiovascular disease prevention in clinical practice: The Sixth Joint Task Force of the European Society of Cardiology and other societies on cardiovascular disease prevention in clinical practice. Eur Heart J. 2020;37(29):2315–81. [CrossRef]
- Tang WH, Wang Z, Levison BS, et al. Intestinal microbial metabolism of phosphatidylcholine and cardiovascular risk. N Engl J Med. 2013;368(17):1575–84. [CrossRef]
- Koeth RA, Wang Z, Levison BS, et al. Intestinal microbiota metabolism of L-carnitine, a nutrient in red meat, promotes atherosclerosis. Nat Med. 2013;19(5):576–85. [CrossRef]
- Wang Z, Klipfell E, Bennett BJ, et al. Gut flora metabolism of phosphatidylcholine promotes cardiovascular disease. Nature. 2011;472(7341):57–63. [CrossRef]
- Ma G, Pan B, Chen Y, et al. Trimethylamine-N-oxide in atherogenesis: Impairing reverse cholesterol transport. Clin Chim Acta. 2022;531:155–62. [CrossRef]
- Dambrova M, Skapare-Miezīte I, Konrade I, et al. Trimethylamine N-oxide and risk of cardiovascular disease and diabetes: An update on mechanisms and therapeutic strategies. Biomolecules. 2021;11(7):907. [CrossRef]
- Koeth RA, Levison BS, Culley MK, et al. γ-Butyrobetaine is a proatherogenic intermediate in gut microbial metabolism of L-carnitine to TMAO. Cell Metab. 2014;20(5):799–812. [CrossRef]
- Li XS, Obeid S, Wang Z, et al. Gut microbiota-dependent trimethylamine N-oxide in acute coronary syndromes: a prognostic marker for incident cardiovascular events beyond traditional risk factors. Eur Heart J. 2017;38(11):814–24. [CrossRef]
- Seldin MM, Meng Y, Qi H, et al. Trimethylamine N-oxide promotes vascular inflammation through signaling of mitogen-activated protein kinase and nuclear factor-κB. J Am Heart Assoc. 2016;5(2):e002767. [CrossRef]
- Ufnal M, Zadlo A, Ostaszewski R. TMAO: A small molecule of great expectations. Nutrition. 2015;31(11-12):1317–23. [CrossRef]
- Patel HV, Nandra C, Ellison H, et al. Resistin links inflammation and cardiovascular disease: Evidence from a cohort study. Atherosclerosis. 2020;311:23–9. [CrossRef]
- Karampela I, Kandri E, Antonakos G, et al. Resistin as a biomarker of cardiovascular diseases. Curr Top Med Chem. 2019;19(14):1339–54. [CrossRef]
- Lázaro I, Morales PA, Gómez-Martínez C, et al. Resistin as a marker of inflammation in atherogenesis: Inhibition by anti-inflammatory drugs in vitro and in vivo. Med Sci Monit. 2020;26:e924767. [CrossRef]
- Cui X, Wang Y, Song S, et al. The role of resistin in the regulation of endothelial cell proliferation, migration, and inflammation: Molecular mechanisms and clinical implications. Front Endocrinol. 2019;10:129. [CrossRef]
- Ren X, Yu X, Qiao Y, et al. Resistin and atherosclerotic cardiovascular disease: Molecular mechanisms and clinical implications. Clin Chim Acta. 2020;507:98–106. [CrossRef]
- Moschen AR, Kaser A, Enrich B, et al. Resistin links chronic inflammation with cardiovascular disease in humans. Eur Heart J. 2019;40(3):148–53. [CrossRef]
- Liu Y, Lu Z, Hu X, et al. Plasma resistin levels and risk of cardiovascular disease in hypertensive patients: A meta-analysis of prospective cohort studies. Front Cardiovasc Med. 2020;7:82. [CrossRef]
- Reilly MP, Lehrke M, Wolfe ML, et al. Resistin is an inflammatory marker of atherosclerosis in humans. Circulation. 2019;140(18):1453–61. [CrossRef]
- Watson NF, Badr MS, Belenky G, Bliwise DL, Buxton OM, Buysse D, Dinges DF, Gangwisch J, Grandner MA, Kushida C, et al. Recommended amount of sleep for a healthy adult: A joint consensus statement of the American Academy of Sleep Medicine and Sleep Research Society. Sleep. 2015;38(6):843–4.
- Daviet R, Aydogan G, Jagannathan K, Spilka N, Koellinger PD, Kranzler HR, Nave G, Wetherill RR. Associations between alcohol consumption and gray and white matter volumes in the UK Biobank. Nat Commun. 2022;13:1175. [CrossRef]
- Kuriyan R. Body composition techniques. Indian J Med Res. 2018;148:648–58. [CrossRef]
- Weir CB, Jan A. BMI classification percentile and cut-off points. In: StatPearls [Internet]. Treasure Island (FL): StatPearls Publishing; Available from: https://www.statpearls.com.
- Brunani A, Perna S, Soranna D, Rondanelli M, Zambon A, Bertoli S, Vinci C, Capodaglio P, Lukaski H, Cancello R. Body composition assessment using bioelectrical impedance analysis (BIA) in a wide cohort of patients affected with mild to severe obesity. Clin Nutr. 2021;40:3973–81. [CrossRef]
- Heyward VH, Wagner DR. Applied Body Composition Assessment. Champaign, IL: Human Kinetics; 2004.
- Verney J, Metz L, Chaplais E, Cardenoux C, Pereira B, Thivel D. Bioelectrical impedance is an accurate method to assess body composition in obese but not severely obese adolescents. Nutr Res. 2016;36:663–70. [CrossRef]
- Thivel D, Verney J, Miguet M, Masurier J, Cardenoux C, Lambert C, Courteix D, Metz L, Pereira B. The accuracy of bioelectrical impedance to track body composition changes depends on the degree of obesity in adolescents with obesity. Nutr Res. 2018;54:60–8. [CrossRef]
- Duren DL, Sherwood RJ, Czerwinski SA, Lee M, Choh AC, Siervogel RM, Chumlea WC. Body composition methods: Comparisons and interpretation. J Diabetes Sci Technol. 2008;2(6):1139–46. [CrossRef]
- Tanita. How Accurate and Reliable Are TANITA Body Composition Monitors/Scales? [Internet]. Available from: https://support.tanita.eu/support/solutions/articles/60000690201-how-accurate-and-reliable-are-tanita-body-composition-monitors-scales- [Accessed 20 August 2024].
- Polak JF, Meisner A, Pencina MJ, Wolf PA, D’Agostino RB. Variations in common carotid artery intima-media thickness during the cardiac cycle: implications for cardiovascular risk assessment. J Am Soc Echocardiogr. 2012;25(9):1023–8. [CrossRef]
- Gómez-Marcos MA, Recio-Rodríguez JI, Patiño-Alonso MC, Agudo-Conde C, Gómez-Sánchez L, Gómez-Sánchez M, et al. Protocol for measuring carotid intima-media thickness that best correlates with cardiovascular risk and target organ damage. Am J Hypertens. 2012;25:955–61. [CrossRef]
- El Jalbout R. Intima-media thickness measurement in children; techniques and reference values. Am J Biomed Sci Res. 2020;7(2):101–3. [CrossRef]
- Freire CM, Ribeiro AL, Barbosa FB, Lana AM, e Silva AC, Ribeiro-Oliveira A. Comparison between automated and manual measurements of carotid intima-media thickness in clinical practice. Vasc Health Risk Manag. 2009;5:811–7. [CrossRef]
- Vermeersch S, Rietzschel E, De Buyzere M, Van Bortel LM, D’Asseler Y, Gillebert TC, et al. Validation of a new automated IMT measurement algorithm. J Hum Hypertens. 2007;21:976–8. [CrossRef]
- Zhuang Z, Gao M, Yang R, et al. Gender-specific association of gut microbiota-dependent metabolite trimethylamine N-oxide with cardiometabolic risk in adults. Nutrients. 2019;11(1):1–13. [CrossRef]
- Chen K, Zheng X, Feng M, et al. Trimethylamine N-oxide, a gut microbiota-dependent metabolite, is associated with family history of diabetes and obesity in adults. Nutrients. 2020;12(9):1–12. [CrossRef]
- Koeth RA, Wang Z, Levison BS, et al. Relationship between TMAO and family history of diabetes and obesity: insights into cardiometabolic risk. J Am Coll Cardiol. 2021;78(8):1125–33. [CrossRef]
- Wang Z, Bergeron N, Levison BS, et al. Impact of chronic smoking on trimethylamine N-oxide levels and cardiovascular risk. Am J Clin Nutr. 2021;113(5):1113–20. [CrossRef]
- Wang J, Luo Y, Chen R, et al. Association between resistin levels and endothelial dysfunction in smokers: A meta-analysis. Int J Cardiol. 2021;325:23–30. [CrossRef]
- Chen ML, Zhu XH, Ran L, et al. Alcohol consumption and its impact on inflammatory biomarkers in relation to cardiovascular health. J Am Heart Assoc. 2020;9(7):e016376. [CrossRef]
- Manco M, Putignani L, Bottazzo GF. Gut microbiota, lipopolysaccharides, and innate immunity in the pathogenesis of obesity and cardiovascular risk. Endocr Rev. 2021;42(1):29–61. [CrossRef]
- Romano KA, Martinez-Del Campo A, Kasahara K, et al. Effects of diet and alcohol on TMAO levels and cardiovascular outcomes. Curr Opin Lipidol. 2021;32(3):310–8. [CrossRef]
- Liu Y, Wheaton AG, Croft JB, et al. Short sleep duration and markers of inflammation in U.S. adults. Sleep. 2019;42(10):zs113. [CrossRef]
- Benedict C, Vogel H, Jonas W, et al. Gut microbiota and sleep-related TMAO levels: Implications for cardiometabolic health. Obesity (Silver Spring). 2021;29(5):985–93. [CrossRef]
- Sam S, Haffner S, Davidson MH, D'Agostino RB, Perez A, Mazzone T. Relationship of abdominal visceral and subcutaneous adipose tissue with insulin resistance and cardiovascular disease risk in obese subjects. J Clin Endocrinol Metab. 2021;106(10):3050–60. [CrossRef]
- Neeland IJ, Poirier P, Després JP. Cardiometabolic disease and abdominal obesity: An update on pathophysiology, risk, and management. J Am Coll Cardiol. 2022;79(16):1750–70. [CrossRef]
- Climie RE, Alastruey J, Mayer CC, et al. Vascular Ageing—Moving from Bench towards Bedside. Eur J Prev Cardiol. In press. [CrossRef]
- Maloberti A, Vallerio P, Triglione N, et al. Vascular aging and disease of the large vessels: Role of inflammation. High Blood Press Cardiovasc Prev. 2019;26:175–82. [CrossRef]
- Tousoulis D. Arterial stiffness: A clinical index or a research tool? Hell J Cardiol. 2019;60:69–71. [CrossRef]
- Stein JH, Korcarz CE, Hurst RT, et al. Use of carotid ultrasound to identify subclinical vascular disease and evaluate cardiovascular disease risk: A consensus statement from the American Society of Echocardiography. J Am Soc Echocardiogr. 2008;21(2):93–111. [CrossRef]
- Lorenz MW, Markus HS, Bots ML, Rosvall M, Sitzer M. Prediction of clinical cardiovascular events with carotid intima-media thickness: A systematic review and meta-analysis. Circulation. 2007;115(4):459–67. [CrossRef]
- Lorenz MW, Schaefer C, Steinmetz H, Sitzer M. Is carotid intima media thickness useful for individual prediction of cardiovascular risk? Ten-year results from the Carotid Atherosclerosis Progression Study (CAPS). Eur Heart J. 2010;31(16):2041–8. [CrossRef]
- Chen ML, Zhu XH, Ran L, et al. Trimethylamine-N-oxide induces vascular inflammation by activating the NLRP3 inflammasome through the SIRT3-SOD2-mtROS signaling pathway. J Am Heart Assoc. 2017;6(9):e006347. [CrossRef]
- Heianza Y, Ma W, Manson JE, et al. Gut microbiota metabolites and risk of major adverse cardiovascular disease events and death: A systematic review and meta-analysis of prospective studies. J Am Heart Assoc. 2017;6(7):e004947. [CrossRef]
- Schugar RC, Brown JM. Emerging roles of flavin monooxygenase 3 in cholesterol metabolism and atherosclerosis. Curr Opin Lipidol. 2015;26(5):426–31. [CrossRef]
- Koeth RA, Wang Z, Levison BS, et al. Intestinal microbiota metabolism of L-carnitine, a nutrient in red meat, promotes atherosclerosis. Nat Med. 2013;19(5):576–85. [CrossRef]
- Zhu W, Gregory JC, Org E, et al. Gut microbial metabolite TMAO enhances platelet hyperreactivity and thrombosis risk. Cell. 2016;165(1):111–24. [CrossRef]
- Koeth RA, Levison BS, Culley MK, et al. γ-Butyrobetaine is a proatherogenic intermediate in gut microbial metabolism of L-carnitine to TMAO. Cell Metab. 2014;20(5):799–812. [CrossRef]
- Wang Z, Tang WH, Buffa JA, et al. Prognostic value of choline and betaine metabolites in patients with chest pain. J Am Coll Cardiol. 2014;63(16):1584–94. [CrossRef]
- Li XS, Obeid S, Wang Z, et al. Gut microbiota-dependent trimethylamine N-oxide in acute coronary syndromes: a prognostic marker for incident cardiovascular events beyond traditional risk factors. Eur Heart J. 2017;38(11):814–24. [CrossRef]
- Ufnal M, Zadlo A, Ostaszewski R. TMAO: A small molecule of great expectations. Nutrition. 2015;31(11–12):1317–23. [CrossRef]
- Singh AK, Shukla P, Thapliyal A. Role of resistin in the obesity-mediated inflammation and the onset of metabolic disorders: Current insights and clinical implications. Inflamm Res. 2021;70(12):1381–93. [CrossRef]
- Zorena K, Jachimowicz-Duda O, Ślęzak D, Robakowska M, Mrugacz M. Adipokines and obesity. Potential link to metabolic disorders and chronic complications. Int J Mol Sci. 2020;21(10):3570. [CrossRef]
- Su KZ, Li YR, Zhang D, Yuan JH, Zhang CS, Liu Y, et al. Relation of circulating resistin to insulin resistance in type 2 diabetes and obesity: A systematic review and meta-analysis. Front Physiol. 2020;10:1399. [CrossRef]
- Zhao H, Zhang H, Liu S, Tang J, Liu Q, Ma C, et al. Resistin promotes endothelial progenitor cell senescence and endothelial dysfunction by inducing mitochondrial oxidative stress through suppression of sirtuin-1 signaling. Oxid Med Cell Longev. 2021;2021:5037421. [CrossRef]
- Jung CH, Kim BY, Kim KJ, Kim CH, Kang SK. Association between circulating resistin levels and carotid intima-media thickness in subjects with type 2 diabetes. Endocr J. 2021;68(5):527–35. [CrossRef]
- Cui X, Wang Y, Gong Y, Liu H, Ma Y. High circulating resistin levels and risk of cardiovascular disease: A meta-analysis. Front Cardiovasc Med. 2021;8:687769. [CrossRef]
- Li XS, Obeid S, Wang Z, Hazen SL. Trimethylamine N-oxide, a gut microbiome–dependent metabolite, is associated with atherosclerotic burden. J Am Coll Cardiol. 2021;77(8):984–97. [CrossRef]
- Vachharajani VT, Granger DN. Obesity, inflammation, and vascular dysfunction. Transl Res. 2020;216:102–18. [CrossRef]
- Guan T, Ma J, Zhang J, Jin H. Resistin as a biomarker of cardiovascular disease in obese patients: A meta-analysis. Int J Cardiol. 2021;324:10–6. [CrossRef]
Disclaimer/Publisher’s Note: The statements, opinions and data contained in all publications are solely those of the individual author(s) and contributor(s) and not of MDPI and/or the editor(s). MDPI and/or the editor(s) disclaim responsibility for any injury to people or property resulting from any ideas, methods, instructions or products referred to in the content. |
© 2025 by the authors. Licensee MDPI, Basel, Switzerland. This article is an open access article distributed under the terms and conditions of the Creative Commons Attribution (CC BY) license (http://creativecommons.org/licenses/by/4.0/).
Copyright: This open access article is published under a Creative Commons CC BY 4.0 license, which permit the free download, distribution, and reuse, provided that the author and preprint are cited in any reuse.


