1. Introduction
Cardiovascular disease (CVD) remains a leading cause of morbidity and mortality worldwide, necessitating advanced predictive models for early detection and prevention [
1,
2]. Conventional pitfall assessment procedures essentially utilize clinical evidence measures and focus on basic characteristics, often overlooking the intricate interplay of personal lifestyle factors and lipid profiles [
3,
4]. In recent years, machine learning (ML) and deep learning (DL) have emerged as powerful tools in medical research, offering the potential to enhance CVD risk prediction by integrating complex, multidimensional data [
5,
6]. ML and DL algorithms are adept at managing large datasets, discerning subtle patterns, and delivering precise predictions [
7,
8]. These technologies can integrate diverse data sources, such as dietary habits, physical activity levels, smoking status, and detailed lipid profiles, to offer a more comprehensive risk assessment [
9,
10]. By harnessing the predictive power of ML and DL, researchers can reveal hidden connections between lifestyle behaviours, lipid levels, and CVD risk, thereby enabling personalized intervention strategies [
11,
12]. This study highlights the potential of machine learning models in refining risk assessment for CVD incidence, underlining the importance of precise predictive algorithms for bolstering disease control and management strategies [
13,
14].
This study aims to explore the application of ML and DL in predicting CVD risk by integrating personal lifestyle factors and lipid profiles [
15,
16]. The objective is to develop models that not only improve predictive accuracy but also provide actionable insights into modifiable risk factors, thereby enhancing preventive healthcare measures and reducing the global burden of cardiovascular diseases [
17,
18]. This research endeavours to delve into the nuanced relationship between personal lifestyle factors and CVD risk using ML algorithms as the analytical framework [
19,
20]. By using a large dataset that includes information on demographics, health, genes, and habits, this study aims to elucidate how these factors collectively contribute to the prediction of CVD risk and increase accuracy in predicting desired results [
21,
22]. The study employs a diverse range of ML algorithms, including DT, RF, and CNNs, to comprehensively analyse the dataset [
23,
24]. Each algorithm undergoes rigorous training and evaluation to assess its predictive accuracy and performance in forecasting CVD risk [
25,
26]. Preliminary findings suggest promising results, with several ML algorithms exhibiting high levels of accuracy in predicting CVD risk [
27,
28]. Decision trees and support vector machines have demonstrated perfect accuracy, while random forests and neural networks have achieved notably high accuracy rates [
5,
7]. However, convolutional neural networks (CNNs) show a slightly lower accuracy, indicating potential areas for improvement [
9,
23].
Future research could delve deeper into this potential by investigating additional variables, refining algorithms, and developing personalized risk assessment models [
1,
18]. These efforts offer the potential to improve patient outcomes and reduce the global impact of cardiovascular diseases by implementing tailored preventive interventions [
20,
25]. In addition to exploring the role of personal lifestyle factors, understanding the influence of lipid profiles on cardiovascular disease (CVD) risk prediction is crucial [
8,
15]. Lipid profiles, encompassing cholesterol levels and other lipid biomarkers, serve as significant indicators of cardiovascular health [
12,
27]. High levels of low-density lipoprotein (LDL) cholesterol, for instance, are associated with increased risk of atherosclerosis and coronary artery disease, while elevated levels of high-density lipoprotein (HDL) cholesterol are often considered protective against CVD [
3,
5]. Moreover, personal lifestyle factors such as diet, physical activity, smoking habits, and stress levels profoundly impact lipid profiles and overall cardiovascular health [
6,
11]. Unhealthy dietary patterns rich in saturated fats and processed sugars can elevate LDL cholesterol levels, while regular exercise and a balanced diet can help maintain optimal lipid profiles [
8,
19]. Integrating information from both personal lifestyle factors and lipid profiles into predictive models can significantly enhance CVD risk prediction accuracy [
13,
22]. Machine learning and deep learning techniques offer a promising approach to analyse the complex interactions between these variables and their collective impact on cardiovascular health [
16,
28]. By incorporating comprehensive datasets that include lipid profiles alongside lifestyle factors, researchers can develop more nuanced predictive models capable of identifying individuals at heightened risk of developing CVD [
25,
26]. This holistic approach to risk assessment facilitates targeted interventions aimed at promoting healthier lifestyles, managing lipid profiles, and ultimately reducing the incidence and severity of cardiovascular diseases [
15,
24].
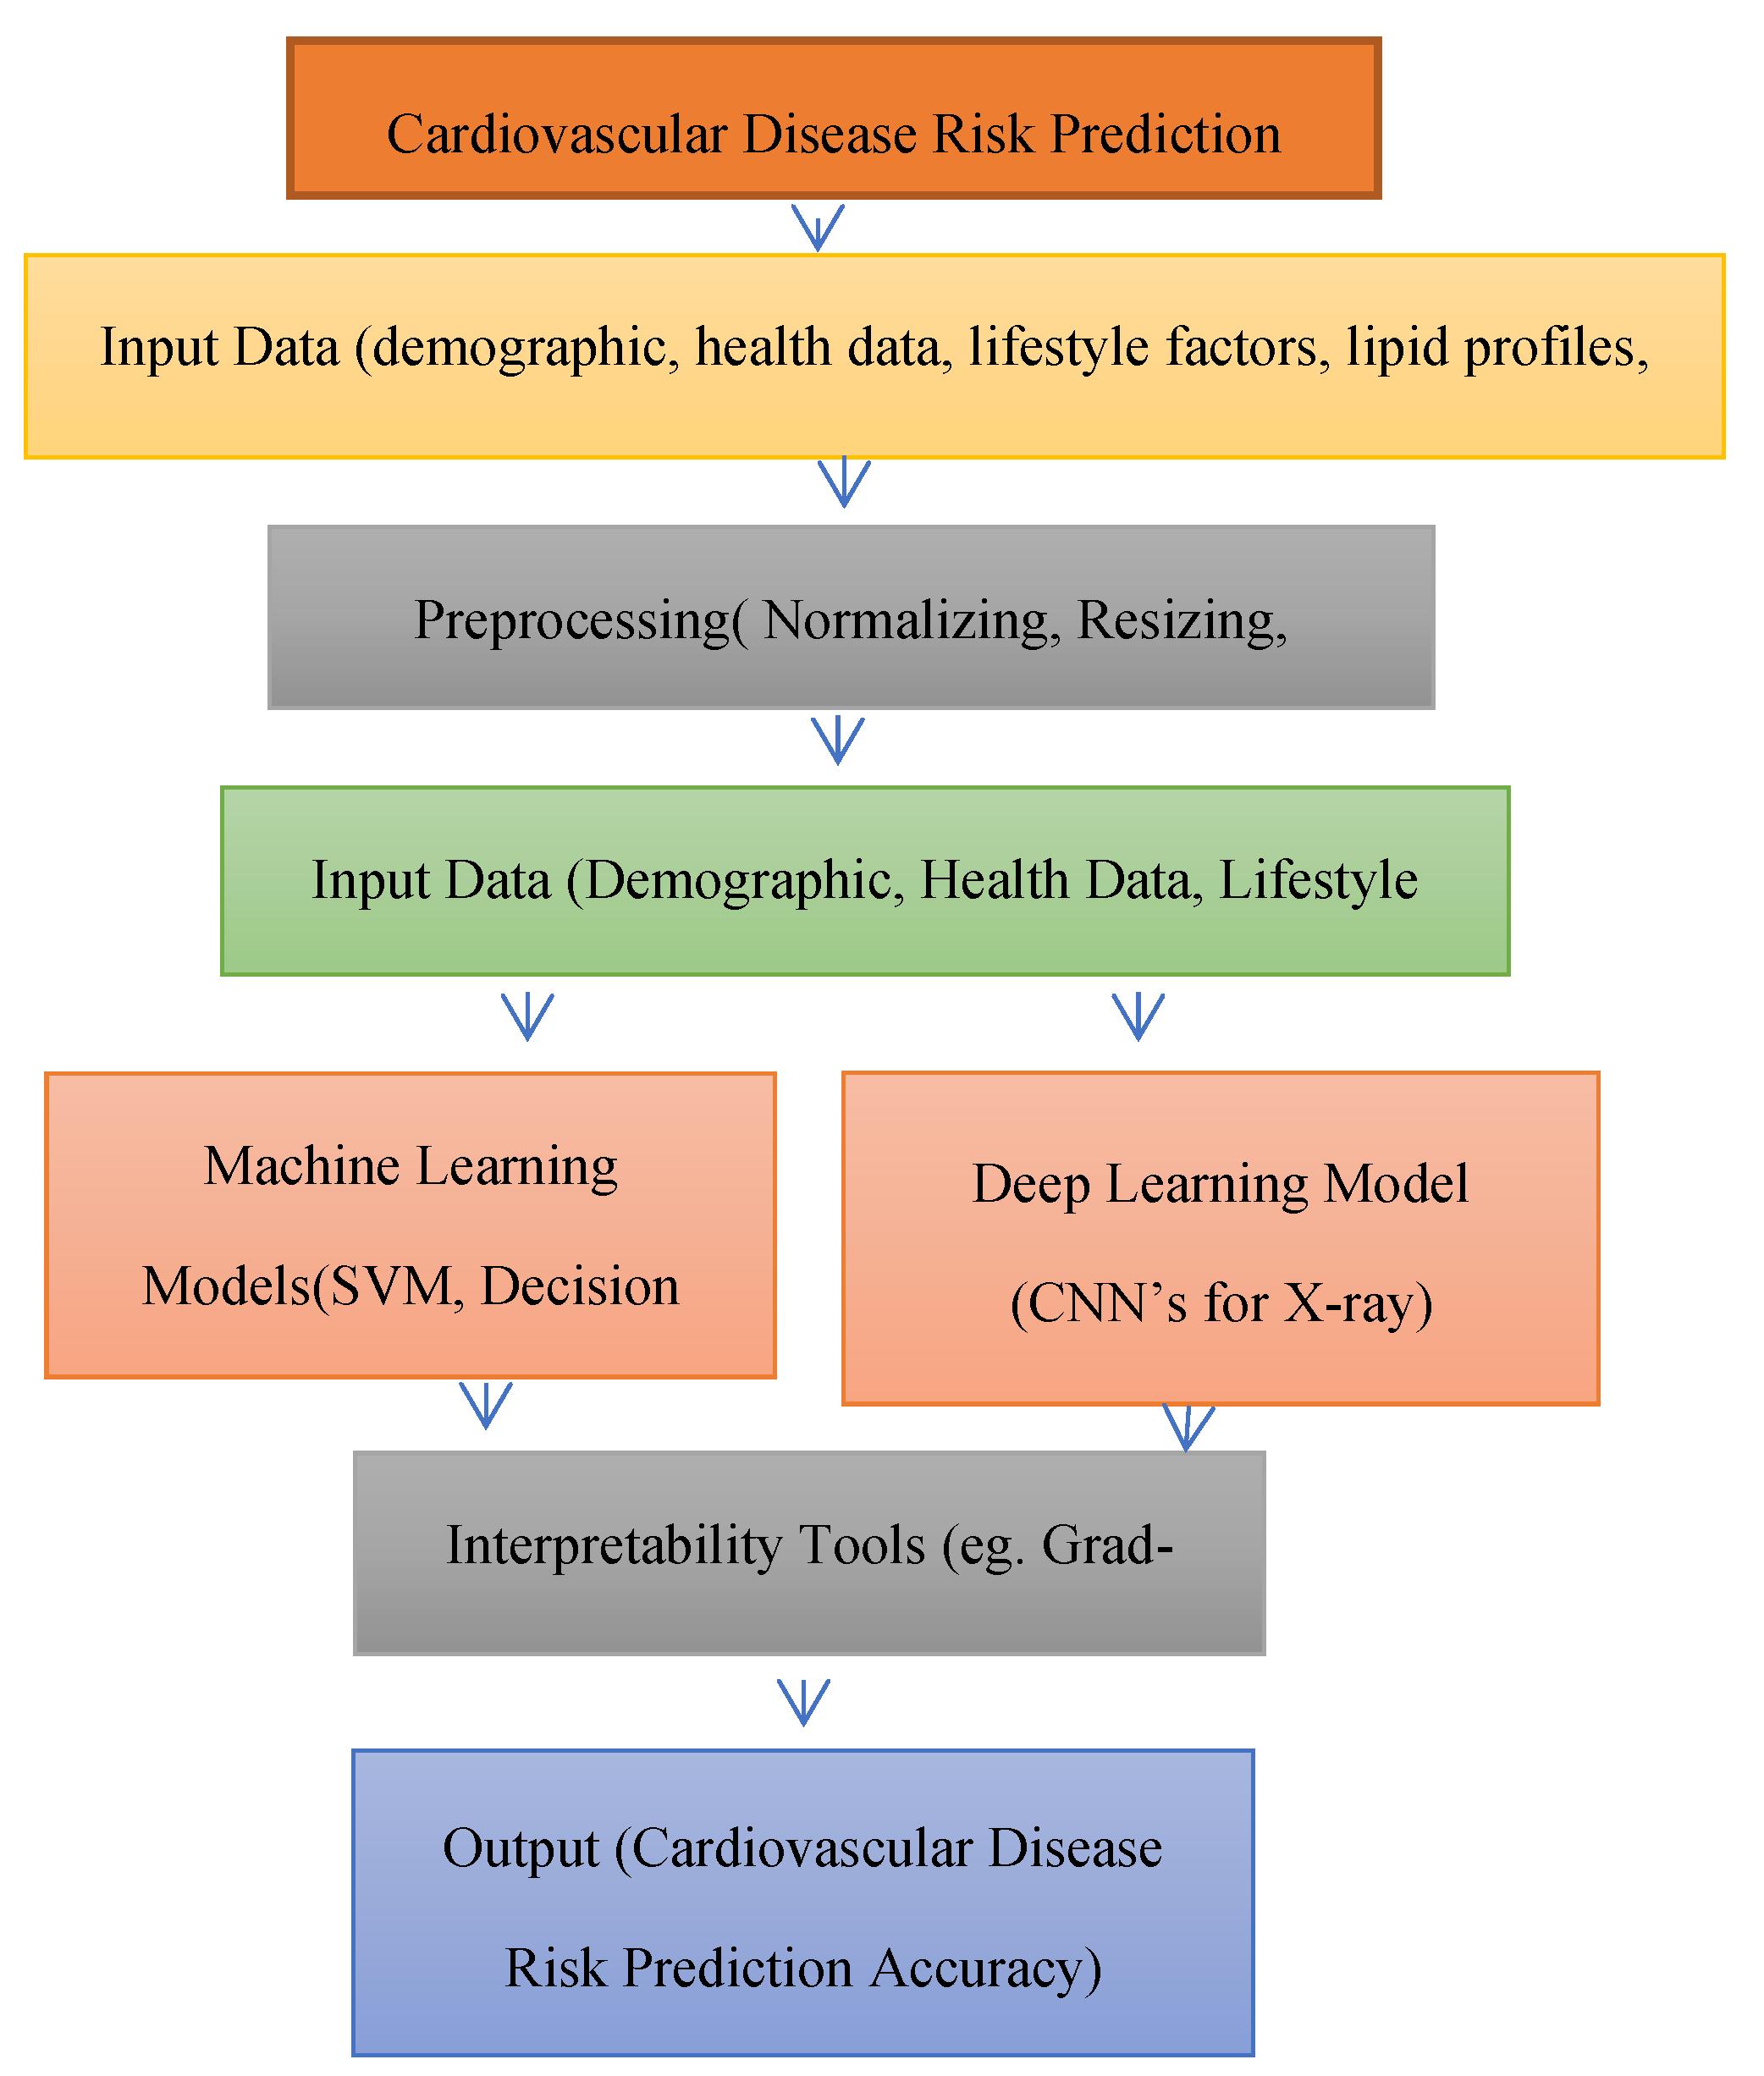
Moreover, the architecture in
Figure 1 presents a comprehensive framework for predicting cardiovascular disease (CVD) risk by integrating personal lifestyle factors and lipid profiles using machine learning (ML) and deep learning (DL) methods. The process starts with Input Data, which includes a variety of datasets such as demographic details (e.g., age, gender), health records (e.g., medical history), lifestyle factors (e.g., exercise habits, diet, smoking status), lipid profiles (e.g., cholesterol levels), and X-ray images. These variables collectively provide a holistic view of an individual’s cardiovascular health, highlighting potential risk factors.
The data then proceeds to the Preprocessing stage, where normalization is applied to ensure that all features are scaled uniformly, preventing dominance by any single variable due to differences in units or scale. Additionally, resizing is performed on X-ray images to standardize their dimensions, and feature selection helps identify the most significant predictors of CVD risk, eliminating irrelevant or redundant data. Following preprocessing, the data is divided into two parallel paths: Machine Learning Models and Deep Learning Models. In the Machine Learning Models branch, algorithms such as DT, RF, and Support SVM are employed to predict CVD risk based on structured, tabular data. These models are valued for their interpretability and efficiency. In contrast, the Deep Learning Models path utilizes CNNs to analyze X-ray images, enabling the extraction of intricate patterns that may not be captured by traditional methods. To improve transparency, Interpretability Tools like Grad-CAM are used, which visually highlight key features of the X-ray images, aiding in understanding model predictions. The final Output stage delivers CVD risk predictions and feature importance, providing actionable insights that can inform clinical decision-making and facilitate personalized prevention strategies based on individual lifestyle and lipid profile data.
In the context of this study, feature selection techniques are utilized to pinpoint the most predictive variables from the comprehensive dataset encompassing personal lifestyle factors and lipid profiles [
18,
27]. Techniques such as statistical tests, correlation analysis, and machine learning-based feature importance algorithms are utilized to prioritize the most relevant predictors for inclusion in the predictive models [
4,
13]. Furthermore, the inclusion of lipid profile data in this analysis represents a novel and essential aspect of this research chapter [
7,
17]. While previous studies have predominantly focused on lifestyle factors alone, integrating lipid profiles provides a more comprehensive understanding of cardiovascular risk factors [
10,
16]. By incorporating lipid biomarkers such as cholesterol levels and triglycerides into the predictive models, the research aims to provide accurate and robust predictions of CVD risk [
20,
23]. Looking ahead, the incorporation of lipid profile data opens up exciting avenues for future research [
8,
14]. One potential direction is to explore advanced machine learning techniques, such as deep learning architectures, specifically tailored for analyzing lipidomic data [
6,
21]. Additionally, longitudinal studies could investigate the dynamic changes in lipid profiles over time and their implications for long-term cardiovascular health [
1,
18].
Literature Review
Cardiovascular diseases (CVD) remain a significant public health concern globally, necessitating effective risk assessment and prediction strategies. In recent years, researchers have increasingly turned to feature selection techniques as a means to minimize prediction errors and effectiveness of predictive models for CVD risk. In the research article by Dalal and Goel et al. (2023), the application of machine learning for cardiovascular disease risk prediction is explored. The study utilized a dataset from Kaggle containing approximately 70,000 patient records with 11 features to forecast cardiovascular disease. Various machine learning models, including neural networks, random forests, Bayesian networks, C5.0, and QUEST, were compared, achieving a high accuracy of 99.1 percent. Peng and Hou et al. (2023), the authors developed the XGBH machine learning model for predicting cardiovascular disease (CVD) risk using key contributing features. By combining retrospective data of 14,832 Chinese Shanxi CVD patients with the Kaggle dataset, the model achieved a high accuracy (AUC = 0.81), outperforming the baseline risk score (AUC = 0.65). Additionally, a simpler model using only age, systolic blood pressure, and cholesterol status maintained a high accuracy (AUC = 0.79). Study by Ordikhani and Abadeh et al. (2022), the authors developed a novel risk assessment model for predicting cardiovascular disease (CVD) events using a Genetic Algorithm (GA). The model was calibrated using the Isfahan Cohort Study (ICS) database, which included 6,504 healthy Iranian adults followed over ten years. The GA-based model, named eXplanaible Persian Atherosclerotic CVD Risk Stratification (XPARS), outperformed traditional statistical methods and other machine learning models. The XPARS model with eight features achieved an AUROC of 0.76, while a simplified version with four features achieved an AUROC of 0.72. Dritsas and Alexiou et al. (2023), the authors evaluated supervised machine learning techniques for predicting cardiovascular disease (CVD) risk in participants over 50. The Logistic Regression model outperformed Naive Bayes, SVM, and Random Forest, achieving 72.1% accuracy and an AUC score of 78.4%, making it the most effective for early CVD prediction. Qian and Li et al. (2023), a cardiovascular disease (CVD) prediction model was developed using machine learning algorithms based on routine physical examination indicators for the Xinjiang rural population. The cohort included 12,692 participants, and after 4.94 years of follow-up, 1,176 cases of CVD were diagnosed (9.27% cumulative incidence). The model based on L1 regularized logistic regression (L1-LR) showed the best prediction performance, with key predictors including age, systolic blood pressure, lipid levels, and body mass index. In the study by Chinnasamy and Kumar et al. (2022), a machine learning approach for predicting cardiovascular disease (CVD) is proposed to improve early detection and risk assessment. The method aims to identify heart abnormalities quickly, facilitating timely interventions and better clinical decision-making. Pal and Parija et al. (2022), machine learning classifiers, specifically multi-layer perceptron (MLP) and K-nearest neighbour (K-NN), were used for cardiovascular disease (CVD) risk prediction. The MLP model achieved an accuracy of 82.47% and an area under the curve (AUC) of 86.41%, outperforming K-NN. The authors recommend the MLP model for automatic CVD detection. Ansarullah et al. (2022), a heart disease risk evaluation model using non-invasive risk factors was developed. Various machine learning techniques were tested, with the random forest model showing the highest predictive accuracy and lowest misclassification rate for heart disease risk assessment. In the study by Ramesh et al. (2022), the authors analyse heart disease prediction using various machine learning methods on a UCI dataset. Focusing on 14 key features, they evaluate Naive Bayes, SVM, logistic regression, decision tree, random forest, and K-nearest neighbour (KNN). The results show that KNN, with eight neighbours, achieves the highest effectiveness, sensitivity, precision, accuracy, and F1-score compared to the other methods. Swathy and Saruladha (2022), various machine learning and deep learning techniques for predicting cardiovascular diseases (CVD) are compared. The paper reviews models, datasets, and performance metrics, highlighting their potential to improve early detection and reduce mortality associated with risk factors like obesity and hypertension. Uddin and Halder et al. (2021) propose an ensemble method-based multilayer dynamic system for predicting cardiovascular disease (CVD) using machine learning. The study emphasizes the effectiveness of integrating multiple models to enhance predictive accuracy and address challenges in early CVD detection. By analyzing various datasets and performance metrics, the authors highlight the potential of their approach in identifying risk factors and improving management strategies for cardiovascular diseases. Hossen and Tazin et al. (2021) examine supervised machine learning techniques for cardiovascular disease analysis and prediction, focusing on various algorithms and their effectiveness. The authors provide insights into model performance, contributing to the understanding of how these methods can enhance predictive capabilities in CVD risk assessment. Rahim and Rasheed et al. (2021) present an integrated machine learning framework designed to improve the prediction of cardiovascular diseases. The study highlights the importance of combining different algorithms and features to achieve higher accuracy, ultimately aiming to facilitate better healthcare decisions and interventions for CVD patients.
Kim and Jeong et al. (2021) develop a machine learning-based prediction model for cardiovascular diseases using data from the Korean national health insurance service health screening database. The study demonstrates the potential of machine learning to identify high-risk individuals, contributing to preventive healthcare strategies for CVD. Faizal and Thevarajah et al. (2021) review risk prediction models for cardiovascular disease, comparing conventional methods with artificial intelligence approaches. The authors discuss the advantages of integrating AI in risk assessment, emphasizing its potential to improve prediction accuracy and clinical decision-making. Islam and Jahan et al. (2020) explore various machine learning paradigms for forecasting cardiovascular disease. The paper discusses the applicability of different algorithms and highlights the challenges in data collection and model training, underlining the need for robust methodologies in CVD prediction. Krittanawong and Virk et al. (2020). conduct a meta-analysis on machine learning predictions in cardiovascular diseases, synthesizing findings from multiple studies. The authors assess the overall performance of machine learning models, concluding that they offer promising results in risk prediction compared to traditional methods. Doust and Bonner et al. (2020) discuss future directions in cardiovascular disease risk prediction, emphasizing the need for innovative approaches to enhance accuracy and applicability in clinical settings. The authors advocate for the integration of advanced technologies, including machine learning, to improve patient outcomes. Quesada and Lopez-Pineda et al. (2019) investigate the use of machine learning to predict cardiovascular risk, highlighting various algorithms and their effectiveness in risk stratification. The study suggests that machine learning can enhance traditional risk assessment methods, providing valuable insights for preventive healthcare. Dinh and Miertschin et al. (2019) adopt a data-driven approach to predict diabetes and cardiovascular disease using machine learning. The authors analyze different algorithms and emphasize the importance of data quality and feature selection in achieving reliable predictions. Pate and Emsley et al. (2019) address the uncertainties associated with risk prediction models for individual decision-making in cardiovascular disease. Through an exemplar cohort study, the authors highlight the challenges in translating model outputs into clinical practice, emphasizing the need for clearer guidelines. Meshref et al. (2019) proposes a machine learning interpretation approach for cardiovascular disease diagnosis. The study emphasizes the importance of understanding model predictions, contributing to the development of more transparent and interpretable AI applications in healthcare. Alaa and Bolton et al. (2019) focus on cardiovascular disease risk prediction using automated machine learning, analyzing data from over 423,000 UK Biobank participants. The study illustrates the potential of automated approaches to enhance risk stratification and inform clinical decision-making. Chandralekha and Shenbagavadivu et al. (2018) provide an empirical study comparing various machine learning techniques for predicting cardiovascular disease. The authors evaluate model performance across different datasets, contributing valuable insights into the strengths and weaknesses of each approach. Dimopoulos and Nikolaidou et al. (2018) compare machine learning methodologies with traditional cardiovascular risk scores in predicting disease risk. The study highlights the advantages of machine learning in providing more accurate predictions and encourages further research in this area. Chiuve and Cook et al. (2014) develop a lifestyle-based prediction model for cardiovascular disease prevention, known as the Healthy Heart Score. The authors demonstrate how lifestyle factors can significantly influence risk assessment and advocate for the integration of lifestyle modifications in preventive strategies.
Through an extensive review, we've gathered insights to refine cardiovascular disease (CVD) identification using lipid profiles and lifestyle factors. In this, the study intend to utilize a new dataset consisting of information gathered from 264 patients obtained from clinics and hospitals. By utilizing this dataset, research anticipate enhancing CVD identification accuracy through machine learning algorithms and convolutional neural networks (CNNs). This dataset offers several advantages, including a larger patient cohort for robust analysis, diverse data sources for comprehensive patient profiles, and inclusion of lipid profiles and lifestyle factors for holistic risk assessment. Employing decision tree, support vector machines, random forest, and CNN algorithms will enable accurate risk prediction based on multidimensional data. The benefits extend to future applications, facilitating early intervention and personalized treatment strategies, thereby improving patient outcomes and reducing healthcare burden, while also contributing to ongoing refinement of CVD risk prediction models.
2. Material and Methods Selection
Cardiovascular diseases (CVD) are one of the primary causes of mortality worldwide, emphasizing the urgent need for effective risk assessment and prediction strategies. Personal lifestyle factors, including diet, physical activity, and smoking habits, significantly influence the onset and progression of CVD. As such, it is crucial to integrate these factors into predictive models to better identify individuals at heightened risk. To achieve this objective, this study will utilize a detailed dataset that encompasses demographic information, health indicators, genetic markers, and lifestyle factors. This dataset will allow us to evaluate how well different machine learning algorithms can predict CVD risk, taking into account the interplay between personal lifestyle choices and lipid profiles. By employing a rigorous selection of machine learning techniques—including Decision Trees (DT), Random Forests (RF), and Convolutional Neural Networks (CNNs)— seek to demonstrate the potential of these algorithms in accurately forecasting the likelihood of developing cardiovascular diseases. This research will detail the materials and methods employed, including a thorough description of the dataset composition, the machine learning algorithms utilized, and the evaluation metrics applied to measure predictive performance.
2.1. Dataset
This dataset includes a wide range of variables essential for analyzing how personal lifestyle factors and lipid profiles impact cardiovascular disease (CVD) risk prediction of 264 patients from number of clinical trials from different health care homes in
Table 1. The data collected for predicting CVD risk through ML models encompasses a panoramic range of criteria that employs on various methods to ensure thoroughness and relevance. Each entry in the dataset corresponds to an individual, identified by a unique ID number. Basic demographic details such as age and gender are included, with gender coded as 1 for women and 2 for men. Physical characteristics are recorded through height (in centimetres) and weight (in kilograms), which are used to calculate the body mass index (BMI). Blood pressure readings include systolic (ap_hi) and diastolic (ap_lo) pressures. Cholesterol and glucose levels are classified into three categories: normal, above normal, and well above normal. Smoking status is indicated by binary values (0 for no and 1 for yes).
Lifestyle factors are detailed, covering dietary habits (e.g., balanced diet, low in saturated fats, high consumption of processed foods, Mediterranean diet), physical activity levels (ranging from sedentary to very active), and alcohol consumption (none, moderate, heavy). It also notes the use of medications related to lipid or cardiovascular health (e.g., statins, blood pressure medication) and dietary supplements (e.g., fish oil, fiber supplements, multivitamins). Measurements of waist circumference (in centimetres), physical exam findings (normal or abnormal), mental health status (no mental health issues, anxiety, depression, stress), and sleep quality (poor, average, good) are included. Socioeconomic status is classified as low, middle, or high.
The dataset also records detailed dietary patterns (vegetarian, vegan, paleo, keto, high carb, low carb) and ethnic background (specific categories such as Caucasian, African American, Asian, Hispanic). Blood lipid levels are detailed with numeric values for LDL, HDL, and triglycerides. Resting heart rate (in beats per minute) is provided. It includes history of previous cardiovascular events (none, heart attack, stroke, other) and levels of inflammatory markers (e.g., CRP, ESR). Occupational risk factors (none, exposure to stress, sedentary job, exposure to pollutants) and environmental factors (urban, suburban, rural) are also included.
The detailed and multi-dimensional nature of this dataset makes it highly valuable for using machine learning algorithms to predict cardiovascular disease risk. The inclusion of a broad range of variables—from basic demographic data to detailed genetic markers and lifestyle factors—enables comprehensive modelling of CVD risk. Machine learning algorithms can exploit the high-dimensional data to identify complex patterns and interactions between various risk factors that may not be detectable through traditional statistical methods. The dataset's diverse variables, such as genetic markers, lifestyle factors, comorbidities, and detailed lipid profiles, ensure that all critical aspects of cardiovascular health are considered, allowing for more accurate and personalized risk predictions. Detailed categorical and numerical data on cholesterol, glucose levels, and inflammatory markers enable machine learning models to capture subtle variations in risk profiles. Factors like mental health status, sleep quality, socioeconomic status, and environmental influences provide a holistic view of the individual's health, leading to more nuanced predictions that take social and psychological factors into account.
2.2. Methods Selection
To effectively select features for forecast CVD risk using ML algorithms, this research leverages a comprehensive dataset that includes a wide array of variables such as demographic data, health indicators, genetic markers, and lifestyle factors. This rich dataset enables a thorough analysis and robust predictive modelling. Several advanced feature selection methods are employed in
Table 2 to ensure that the most relevant and impactful features are used, thereby enhancing the accuracy and efficiency of the predictive models.
One key method is correlation analysis, which helps in identifying relationships between variables. By examining the correlation matrix, researchers can pinpoint which features are strongly correlated with the target variable (CVD risk) and with each other. This step is crucial for understanding the interdependencies among variables and for detecting multicollinearity, which can adversely affect the performance of some machine learning algorithms.
Another key method is variance thresholding, which removes features with low variance, as such features are less likely to be useful for prediction. Setting a variance threshold helps filter out these less informative features, simplifying the model and potentially improving its performance. Recursive Feature Elimination (RFE) is another technique used to iteratively select the most significant predictors. RFE fits a model and removes the least important feature (or features) until the desired number of features is reached. This method is particularly effective with models that provide a coefficient or feature importance score, such as linear models or tree-based models.
Additionally, LASSO (Least Absolute Shrinkage and Selection Operator) is utilized for feature selection. LASSO adds a penalty equal to the absolute value of the magnitude of coefficients, shrinking some coefficients to zero, effectively performing variable selection and regularization. This enhances the prediction accuracy and interpretability of the resulting model. Using these sophisticated feature selection techniques ensures that predictive models focus on the most relevant features, such as age, gender, BMI, blood pressure readings, cholesterol and glucose levels, smoking habits, family medical history, dietary patterns, physical activity levels, and genetic variations. These selected features capture the critical aspects of cardiovascular health and lifestyle, providing a comprehensive basis for accurate risk prediction. These models can capture complex interactions and dependencies among diverse predictors, significantly enhancing the ability to forecast CVD risk. The detailed and multi-dimensional nature of the dataset, combined with rigorous feature selection, ensures that all critical factors are considered, leading to more personalized and effective predictive models.
2.3. Pre-Processing and Taining
The preprocessing for the study involved normalizing, resizing, and augmenting datasets to enhance model robustness. Demographic data, health indicators, genetic markers, and personal lifestyle factors were meticulously curated from 264 patients. Machine learning (ML) and deep learning (DL) algorithms were utilized, focusing on feature selection through methods like correlation analysis and LASSO to identify the most predictive variables. For convolutional neural networks (CNNs), X-ray images were normalized and resized for uniformity, with Grad-CAM applied to visualize model decisions. This comprehensive preprocessing ensured the datasets were optimized for analyzing the interplay between lifestyle factors, lipid profiles, and cardiovascular disease risk prediction.
The study trained and tested ML and DL algorithms on a dataset of 264 patients, split into training and testing subsets (e.g., 80:20). ML techniques like LASSO, correlation analysis, and feature selection identified key predictors, which were fed into models like SVM, RF, and DT, optimized through cross-validation in
Table 3. CNNs analyzed X-ray images, leveraging normalization, resizing, and data augmentation for consistency. Grad-CAM was applied during testing for interpretability. Performance metrics like accuracy and F1-score validated the models, ensuring robust predictions of cardiovascular disease risk based on lifestyle factors and lipid profiles.
3. Result
The results of this investigation provide a detailed insight into the intricate relationship between lifestyle factors and lipid profiles in determining the likelihood of developing cardiovascular disease (CVD). By meticulously analyzing data, the study identifies significant patterns and correlations, shedding light on how specific lifestyle choices and lipid levels impact the risk of CVD. This comprehensive understanding allows for more accurate prediction of CVD risk, enabling healthcare professionals to tailor interventions and preventive measures based on an individual's unique risk profile. The result part divided into two parts 1) Classification using Machine Learning Algorithms and Classification using CNN. To evaluate the performance of algorithms such as Decision Tree, Support Vector Machine (SVM), and Random Forest, you calculate the overall accuracy, precision, F1 score and recall using specific formulas.
Accuracy is computed as the ratio of correct predictions to the total number of predictions, reflecting the proportion of correctly classified instances. Precision is determined by dividing the number of true positives by the sum of true positives and false positives, indicating the accuracy of positive predictions. Recall is calculated by dividing the number of true positives by the sum of true positives and false negatives, measuring the ability of the algorithm to correctly identify all relevant instances. These metrics together provide a comprehensive assessment of each algorithm’s effectiveness in predictive tasks.
3.1. Classification using Machine Learning Algorithms
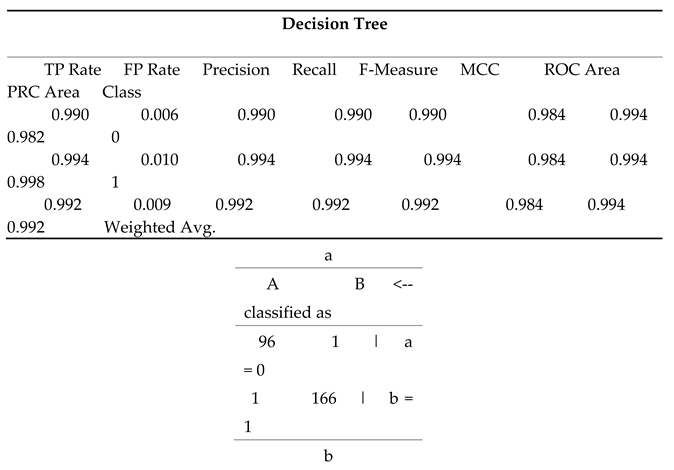
This decision tree analysis evaluates the impact of personal lifestyle factors and lipid profiles on cardiovascular disease risk prediction, demonstrating high overall performance metrics in
Table 4 (a). The true positive rate (TP Rate) is exceptionally high for both classes, with 0.990 for class 0 and 0.994 for class 1, indicating that the model correctly identifies a large proportion of actual positives. The false positive rate (FP Rate) is very low, at 0.006 for class 0 and 0.010 for class 1, reflecting a minimal rate of incorrectly classified negatives. Precision and recall are both extremely high (0.990 and 0.994 for both classes, respectively), suggesting that the model is both accurate and comprehensive in identifying positive instances. The F-Measure, a harmonic mean of precision and recall, mirrors these values at 0.990 and 0.994, underscoring the model's reliability. The Matthews Correlation Coefficient (MCC) at 0.984 indicates strong correlation between the observed and predicted classifications. The ROC Area, which measures the ability to distinguish between classes, is excellent at 0.994 for both classes, while the PRC Area, which assesses precision-recall trade-offs, is also very high (0.982 for class 0 and 0.998 for class 1). The weighted averages across all metrics reinforce the model's robustness, with a TP Rate, Precision, Recall, and F-Measure of 0.992, and MCC, ROC Area, and PRC Area of 0.984, 0.994, and 0.992, respectively. These results highlight the model's exceptional performance in predicting cardiovascular disease risk based on lifestyle and lipid profile factors.
The confusion matrix for the decision tree model in
Table 4 (b) provides a detailed overview of the model's classification performance. It shows how the model's predictions align with the actual classifications across two classes, 0 and 1.
In the matrix:
The first row represents the actual instances of class 0. Out of all these instances, the model correctly classified 96 as class 0 (true positives, A: 96) and incorrectly classified 1 as class 1 (false negatives, B: 1 in row a). This means that among the individuals who actually belong to class 0, 96 were accurately identified, but 1 was misclassified as class 1.
The second row represents the actual instances of class 1. Here, the model correctly identified 166 as class 1 (true negatives, B: 166 in row b) and incorrectly classified 1 as class 0 (false positives, A: 1 in row b). Thus, out of the individuals who actually belong to class 1, 166 were correctly predicted, while 1 was wrongly predicted as class 0.
This indicates high accuracy and reliability in distinguishing between the two classes, with minimal misclassification.
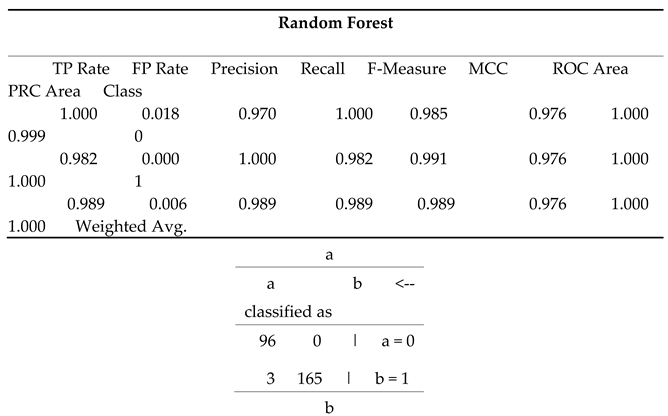
The random forest model in
Table 5 (a) shows exceptional performance in predicting cardiovascular disease risk. For class 0, it achieves a perfect true positive rate (1.000), high precision (0.970), and no false positives (FP Rate 0.018). For class 1, it has a true positive rate of 0.982, perfect precision (1.000), and no false positives (FP Rate 0.000). Both classes have perfect ROC Areas (1.000), indicating excellent discriminative ability. The weighted averages for TP Rate, precision, recall, and F-Measure are all 0.989, demonstrating the model's overall high accuracy and reliability.
In this confusion matrix in
Table 5 (b), class 'a' represents the actual instances of class 0, while class 'b' represents the actual instances of class 1. The matrix shows that the model correctly classified 96 instances of class 0 as class 0 (true positives for class 0) and 165 instances of class 1 as class 1 (true negatives for class 1). There are no false positives (instances of class 0 misclassified as class 1), and only 3 false negatives (instances of class 1 incorrectly classified as class 0). To calculate accuracy, study sum the true positives and true negatives and divide by the total number of instances. In this case, the total number of instances is the sum of all cells in the matrix, which is 96 + 0 + 3 + 165 = 264. So, accuracy = (true positives + true negatives) / total instances = (96 + 165) / 264 = 261 / 264 ≈ 0.9894. Therefore, the accuracy of the model is approximately 98.94%, indicating that it correctly predicts the class for almost 99 out of every 100 instances.
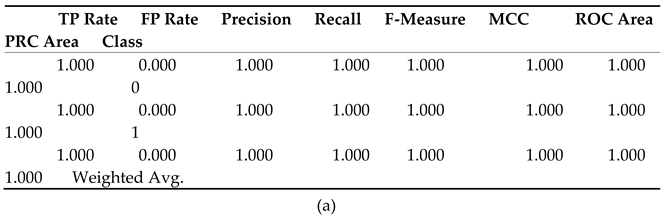
The provided metrics in
Table 6 (a) evaluate the performance of a binary classification model using SVM (Support Vector Machine). The True Positive Rate (TP Rate) and Recall are both 1.000, indicating that all actual positives were correctly identified, while the False Positive Rate (FP Rate) of 0.000 shows no negatives were misclassified. With a Precision of 1.000, every predicted positive is accurate, and the F-Measure of 1.000 reflects a perfect balance between Precision and Recall. The Matthews Correlation Coefficient (MCC) of 1.000 indicates an ideal prediction, and the ROC Area of 1.000 signifies flawless class distinction. Overall, these metrics demonstrate the SVM model's exceptional performance.
The given matrix represents a confusion matrix of SVM algorithm in
Table 6 (b) for a binary classification problem, indicating how the classification model has categorized instances into two classes, labelled as "a" and "b." The matrix shows that 264 instances were correctly classified as class "a," representing true positives, while there were no instances misclassified as class "a" when they were actually class "b" (false positives). Additionally, there were no instances correctly identified as class "b" (true negatives), and no instances were incorrectly classified as class "b" when they were actually class "a" (false negatives).
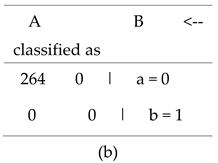
The accuracy of the model is 100%. This indicates that the model performed exceptionally well for class "a," accurately identifying all instances of this class. However, the absence of any instances classified as class "b" suggests that the model may not effectively recognize this class, possibly due to an imbalance in the dataset or underrepresentation of class "b." Overall, the confusion matrix highlights the model's strong performance for class "a," while indicating potential challenges with class "b."
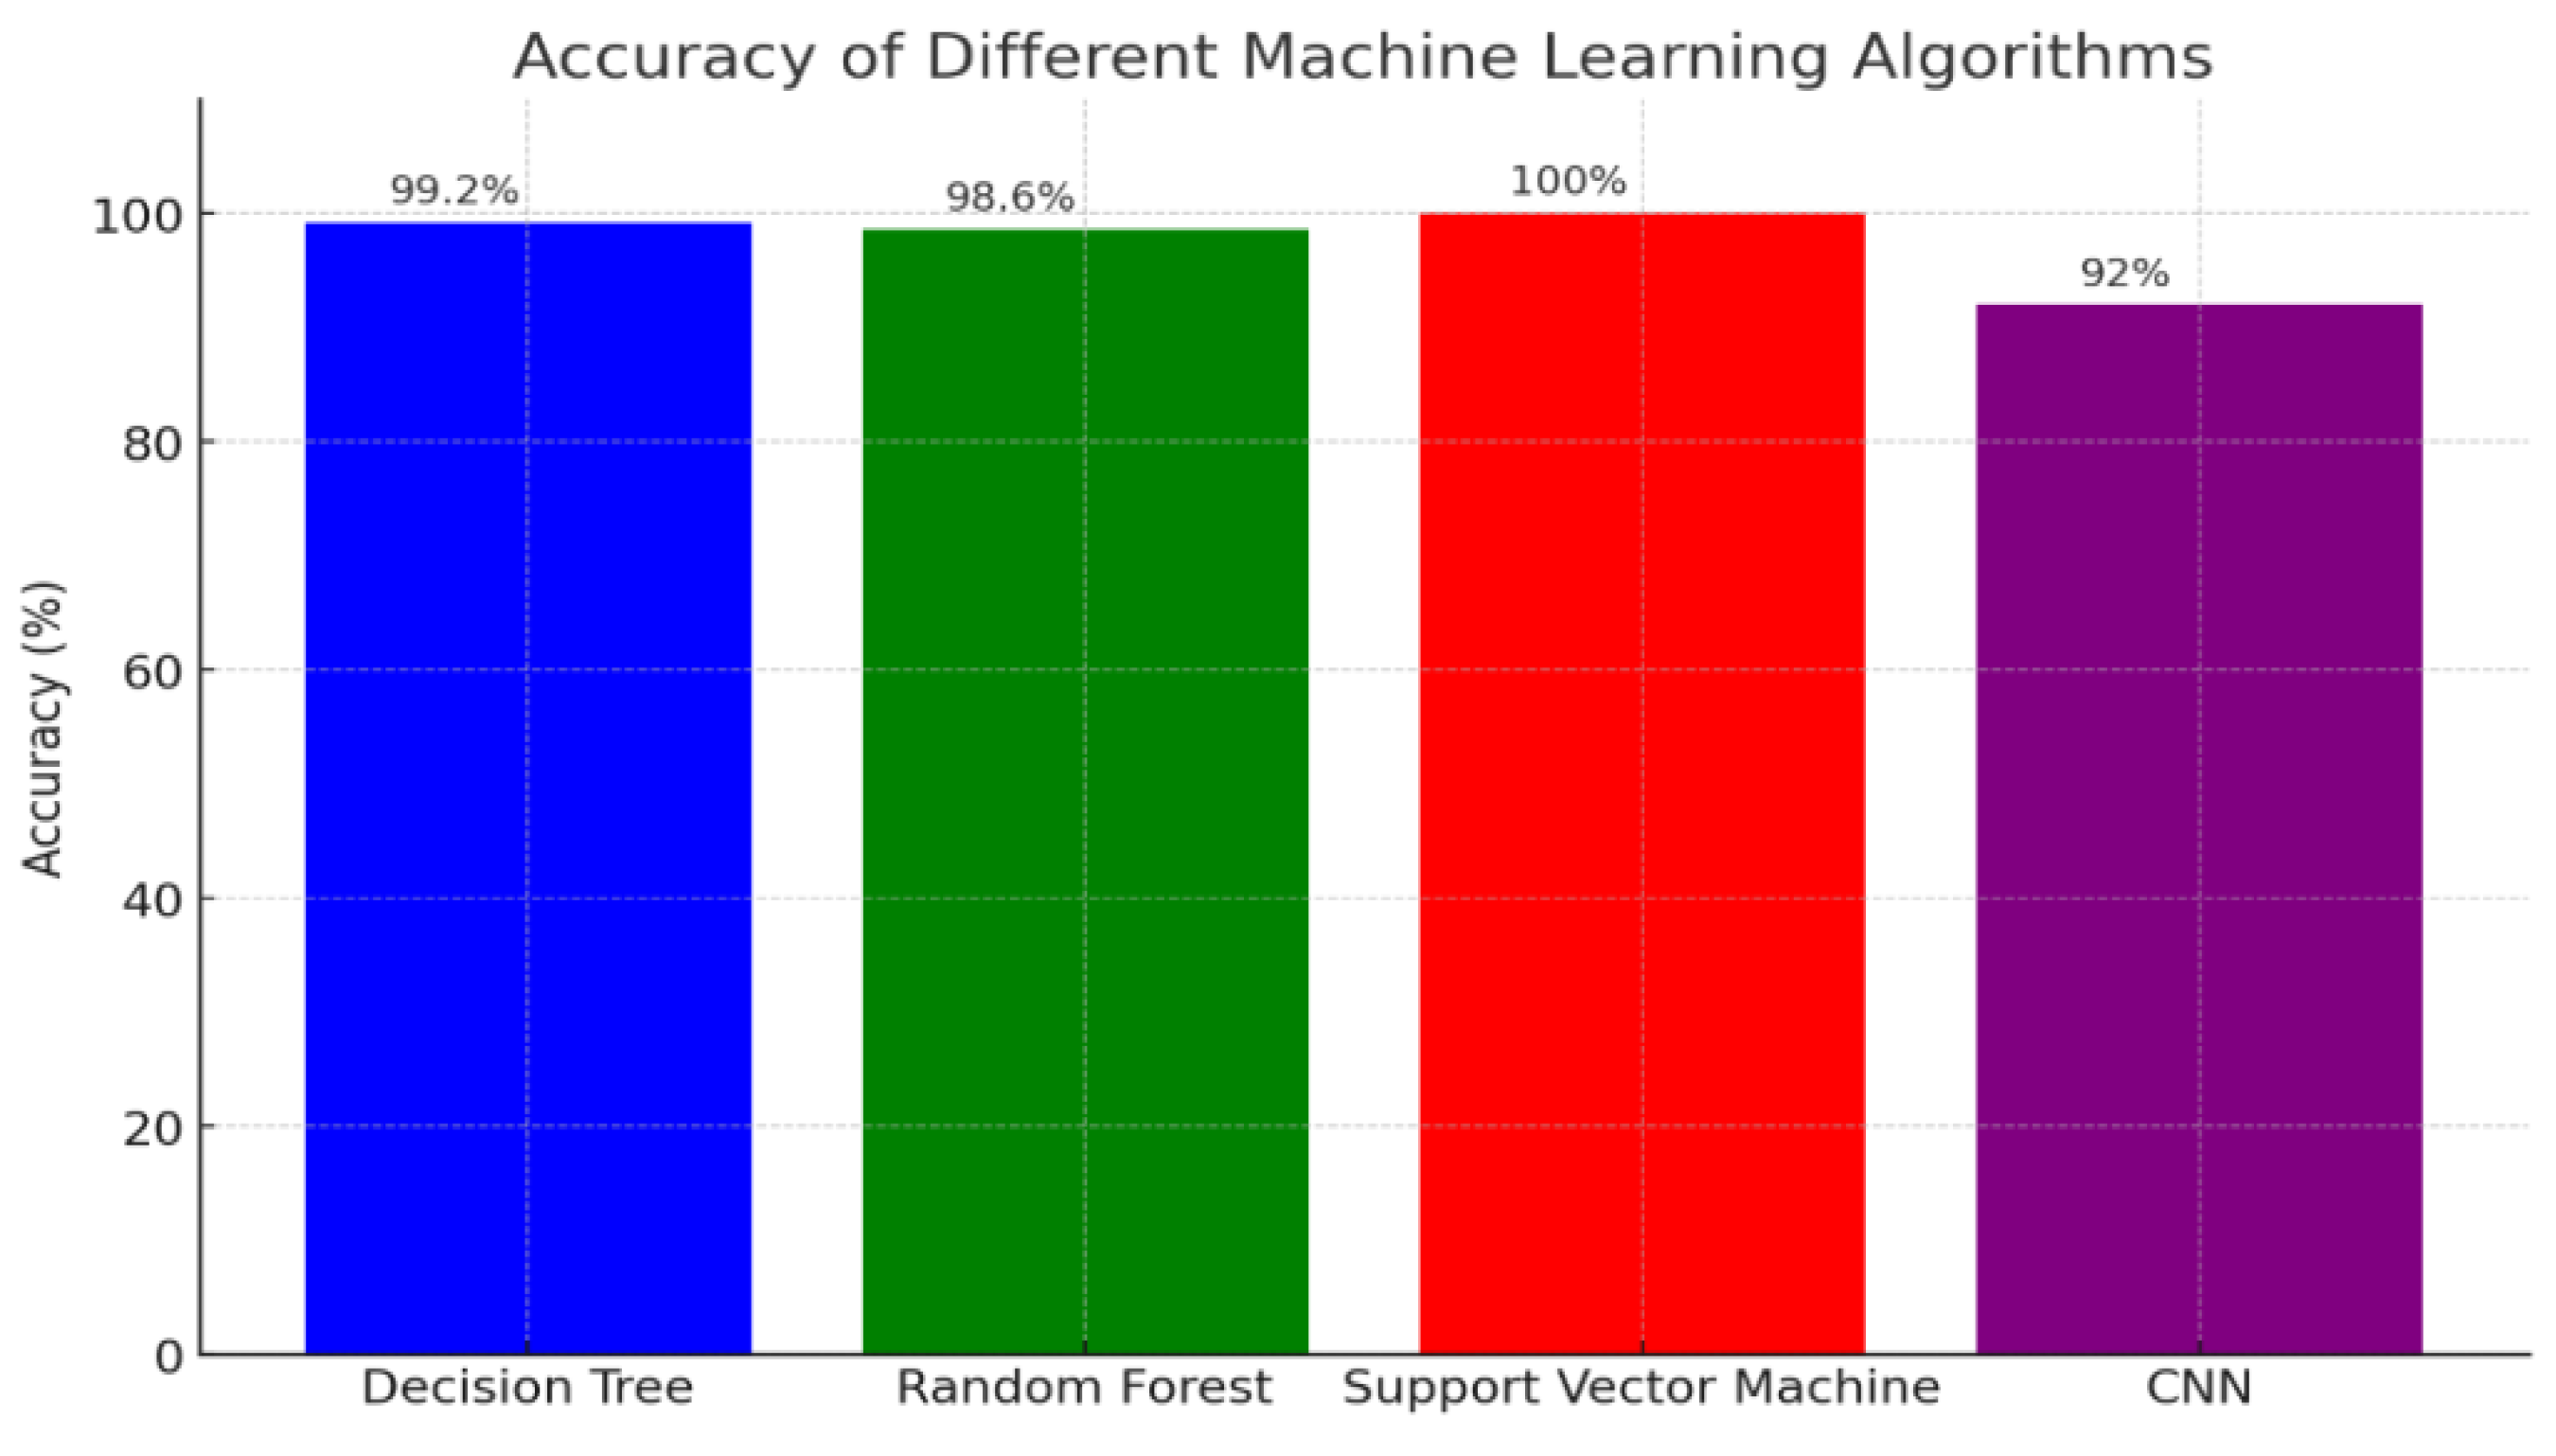
Support Vector Machine (SVM): Achieving the highest accuracy of 100%, indicating its exceptional performance in accurately predicting cardiovascular disease risk based on personal lifestyle factors and lipid profiles.
Decision Tree: With an accuracy of 99.2%, this algorithm also demonstrated high predictive capability, closely trailing behind the SVM.
Figure 1.
Accuracy Comparison of Machine Learning Algorithms for Cardiovascular Disease Risk Prediction.
Figure 1.
Accuracy Comparison of Machine Learning Algorithms for Cardiovascular Disease Risk Prediction.
Random Forest: Scoring 98.6%, this method showed robust performance, making it a strong contender for accurate risk prediction.
Convolutional Neural Network (CNN): Although effective, the CNN recorded the lowest accuracy among the algorithms at 92%.
The chart provides a clear visualization of how each algorithm performs in this predictive task. The SVM stands out as the most accurate, while the Decision Tree and Random Forest offer nearly equivalent, high levels of accuracy. The CNN, while still useful, shows a comparatively lower accuracy. This comparative analysis underscores the varying effectiveness of these machine learning models and highlights their potential in enhancing predictive accuracy for cardiovascular disease risk assessment, which could be crucial for improving clinical decision-making and patient outcomes.
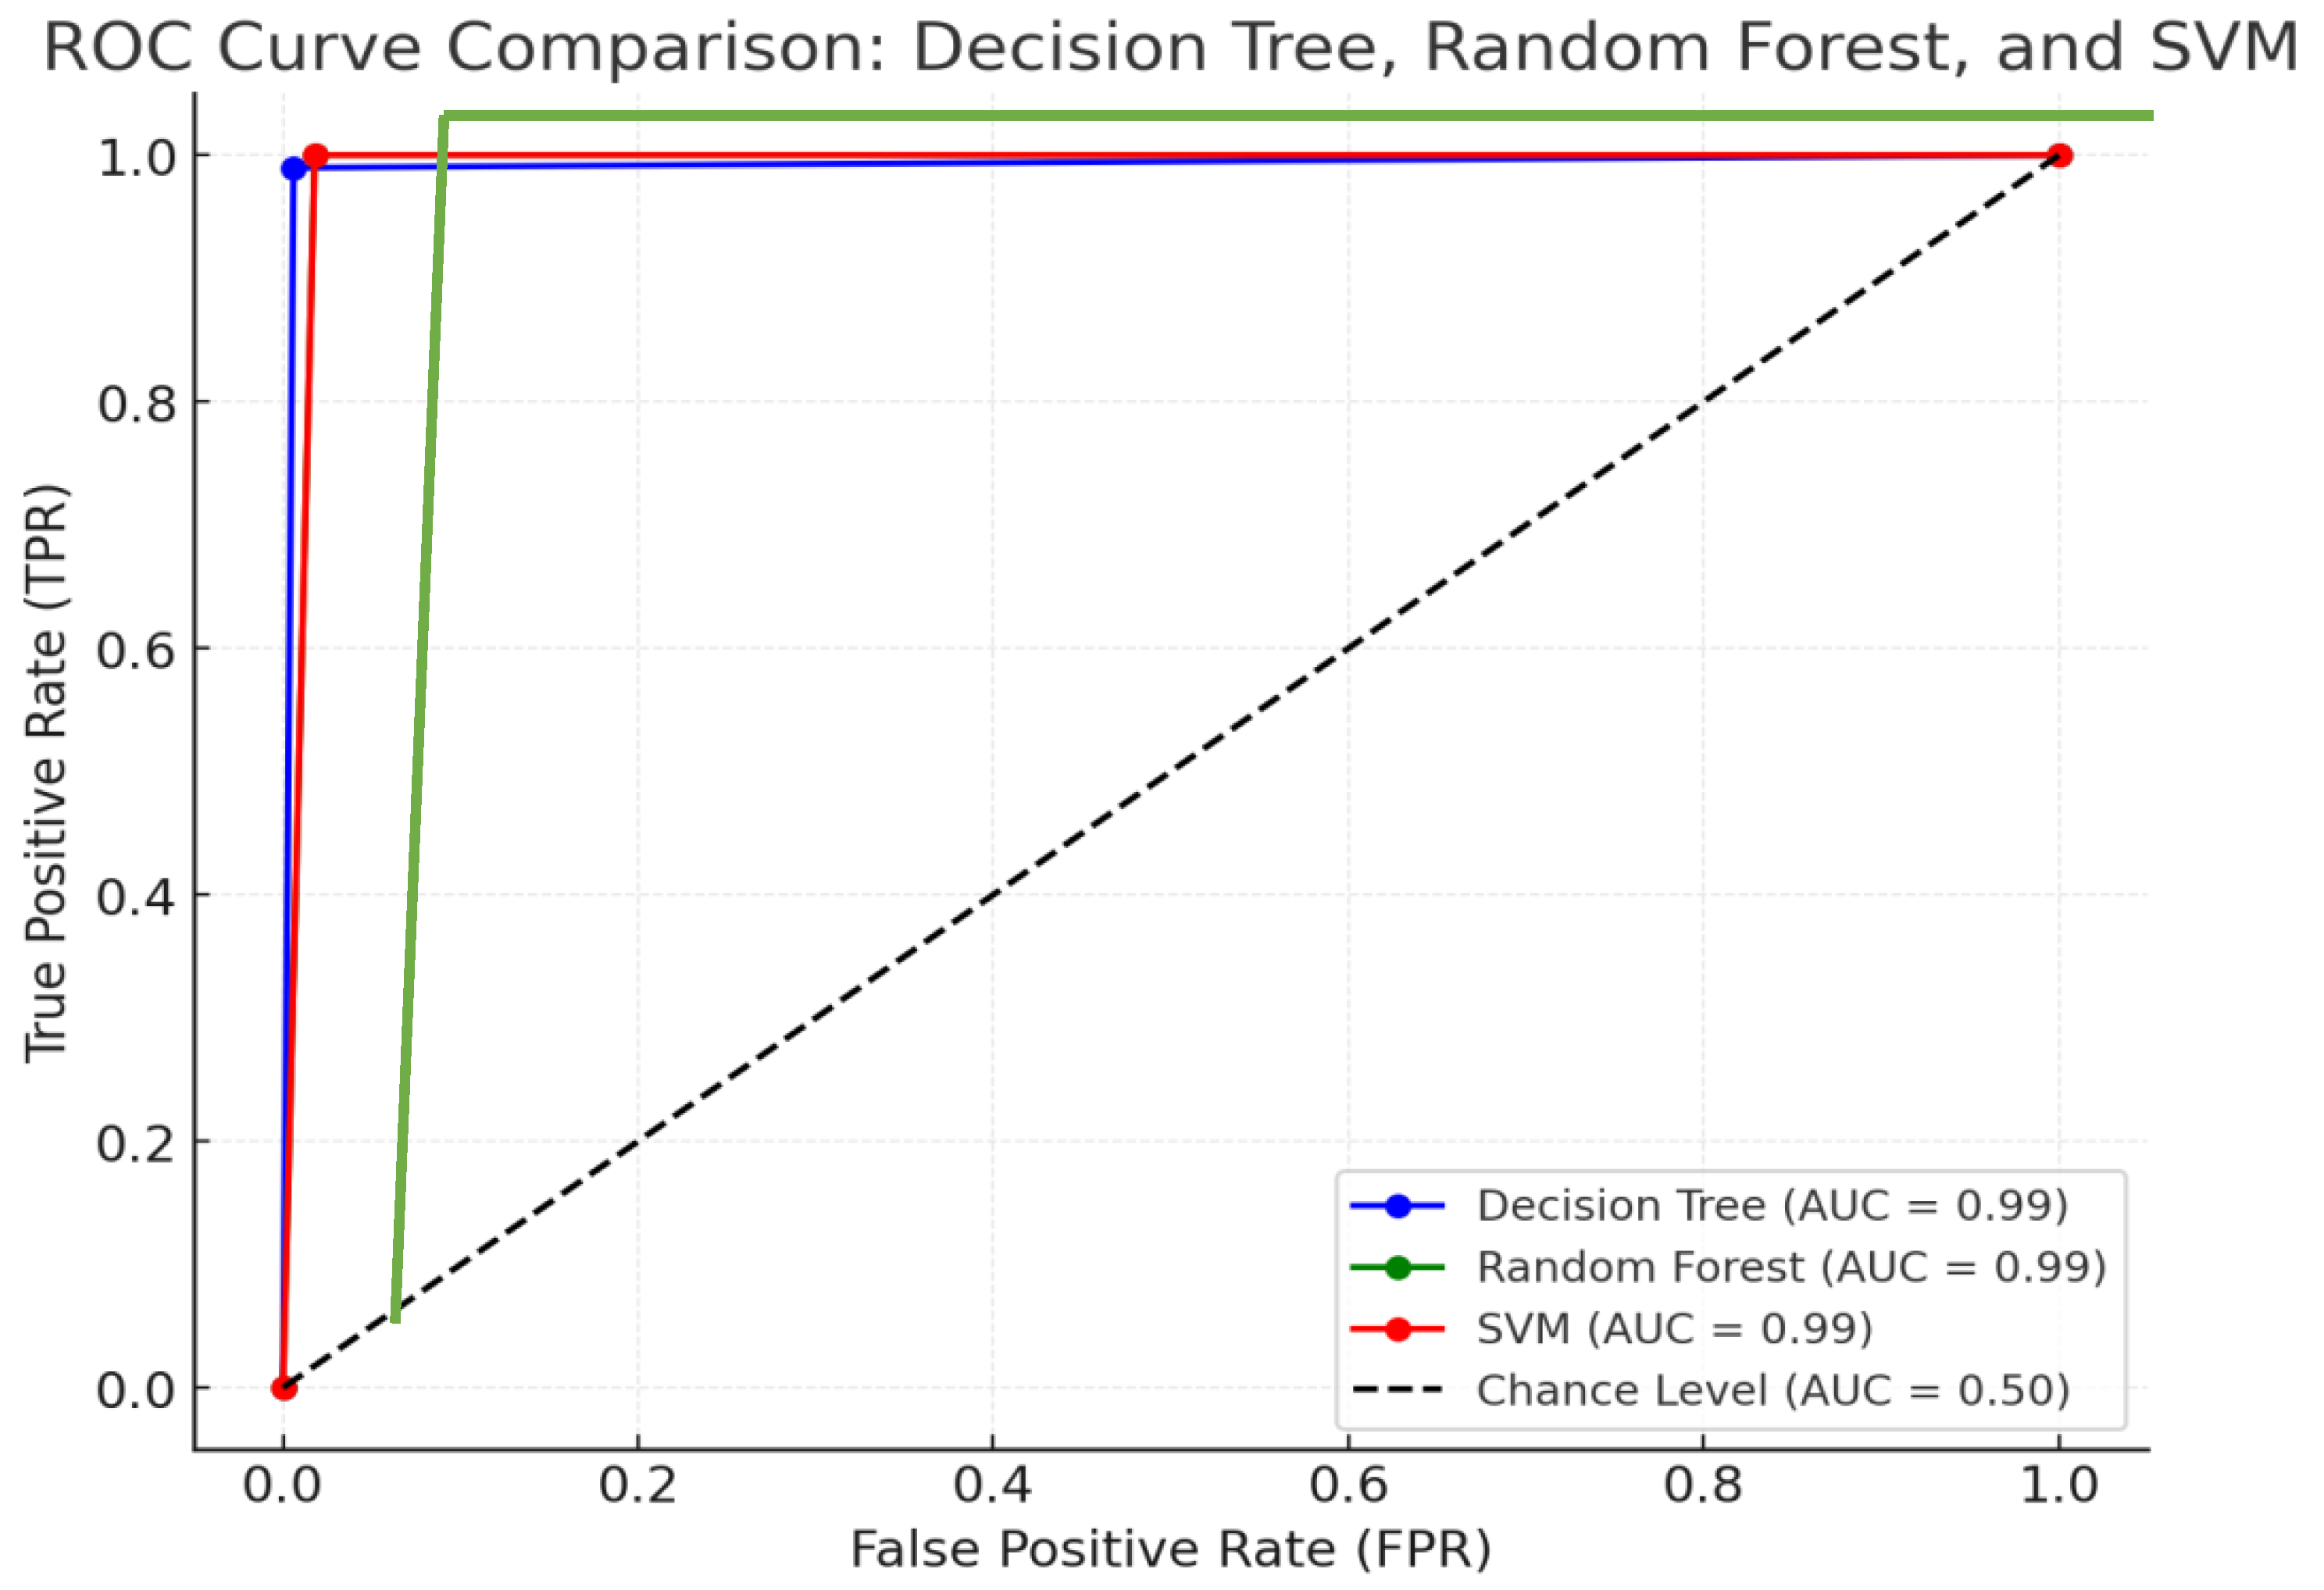
The ROC curve comparison of the Decision Tree, Random Forest, and SVM models demonstrates their classification performance based on their confusion matrices. All three models exhibit strong predictive capabilities, as evidenced by their ROC curves being close to the top-left corner, indicating a good balance between True Positive Rate (TPR) and False Positive Rate (FPR). The Decision Tree model has a slightly lower False Positive Rate compared to the others, while the Random Forest and SVM models share similar performance, with both showing a slightly higher FPR.
Figure 2.
Assessing the Effectiveness of Classification Models in Cardiovascular Risk Prediction: ROC Curve Comparison.
Figure 2.
Assessing the Effectiveness of Classification Models in Cardiovascular Risk Prediction: ROC Curve Comparison.
Despite differences in their underlying mechanisms, the Area Under the Curve (AUC) for each model—Decision Trees (DT), Random Forest (RF), and Support Vector Machines (SVM)—remains notably high, suggesting that all three are highly effective in predicting cardiovascular disease (CVD) risk. AUC is a critical performance metric, representing the model's ability to distinguish between positive and negative outcomes (i.e., correctly identifying patients at risk of CVD versus those not at risk). A high AUC indicates that each model is proficient at making accurate predictions and can reliably assess CVD risk.
However, the subtle variations in AUC scores between these models highlight their differing abilities to manage false positives (instances where the model incorrectly predicts a CVD risk) and true positives (correctly predicting a risk). Decision Trees, with their simple yet interpretable structure, may be more sensitive to overfitting, especially when data is noisy or complex. This can lead to fluctuations in performance, causing slight changes in its AUC. In contrast, Random Forests, which aggregate multiple Decision Trees, generally provide more stable and reliable results, mitigating the overfitting issue. This ensemble approach allows Random Forests to perform well across different datasets, producing consistent and high AUC scores.
Support Vector Machines (SVM), which aim to find an optimal decision boundary between classes, typically offer high accuracy, particularly when data is highly dimensional or complex. Their ability to generalize well often results in an AUC that is slightly higher than that of the other models, especially in cases where the dataset has complex, nonlinear patterns.
3.2. Classification with CNN
The accurate prediction and early diagnosis of cardiovascular disease are critical for improving patient outcomes and reducing healthcare costs. Traditional diagnostic methods often rely on a combination of clinical assessments and laboratory tests, including lipid profiling. However, recent advancements in deep learning, particularly Convolutional Neural Networks (CNNs), have shown promise in medical image analysis. This study aims to leverage CNNs to analyse X-ray images for the detection of cardiovascular abnormalities and to examine the potential of these models in identifying lipid deposits as a risk factor for CVD. A dataset comprising 1250 X-ray images, annotated with labels indicating the presence or absence of cardiovascular disease, was collected and pre-processed. The images were normalized, resized to a uniform dimension, and augmented to enhance the robustness of the CNN model. Using CNNs to analyse X-ray images for cardiovascular disease risk prediction is a powerful approach. Achieving a 92% accuracy demonstrates the model's effectiveness.
In this research, Grad-CAM (Gradient-weighted Class Activation Mapping) technique used for visualizing and understanding which regions of an image contribute most to a CNN's decision. It helps in interpreting the model's predictions and is particularly useful in fields like medical image analysis, where understanding the focus of the model can provide insights into its behaviour and reliability. This process involves differentiating the class score, such as the probability of a particular disease, with respect to each feature map in the final convolutional layer. Subsequently, global average pooling is applied to these gradients to obtain weights for each feature map. These weights, denoted as αk , quantify the contribution of each feature map to the class score. The final step involves calculating a weighted sum of the feature maps using these derived weights. The weighted combination is expressed as:
where
GradAk represents the gradients of the target class with respect to the feature map Ak. Applying the ReLU function ensures that only the positive contributions to the class score are considered, providing a visual representation that highlights the regions of the image most relevant to the CNN's decision. Use insights from Grad-CAM to refine the training data and model. Validate the model's predictions against clinical outcomes to ensure reliability. Use Grad-CAM visualizations to explain model predictions to clinicians, helping integrate the model into clinical workflows and enhancing decision-making processes.
Using Convolutional Neural Networks (CNNs) for detecting cardiovascular disease (CVD) from X-ray images entails a series of essential steps to achieve precise and dependable results. Initially, the dataset must be pre-processed, which includes normalizing pixel values to a consistent range, resizing images to a uniform dimension to ensure uniformity, and applying data augmentation techniques to enhance the diversity and robustness of the training data. This pre-processing is vital for creating a solid foundation for the model.
The CNN architecture, which consists of convolutional layers for feature extraction, pooling layers for dimensionality reduction, and fully connected layers for final classification, automatically learns and identifies complex patterns and features within the images. This structured approach allows the CNN to effectively discern relevant features related to cardiovascular disease, leading to accurate predictions and reliable diagnostic outcomes.
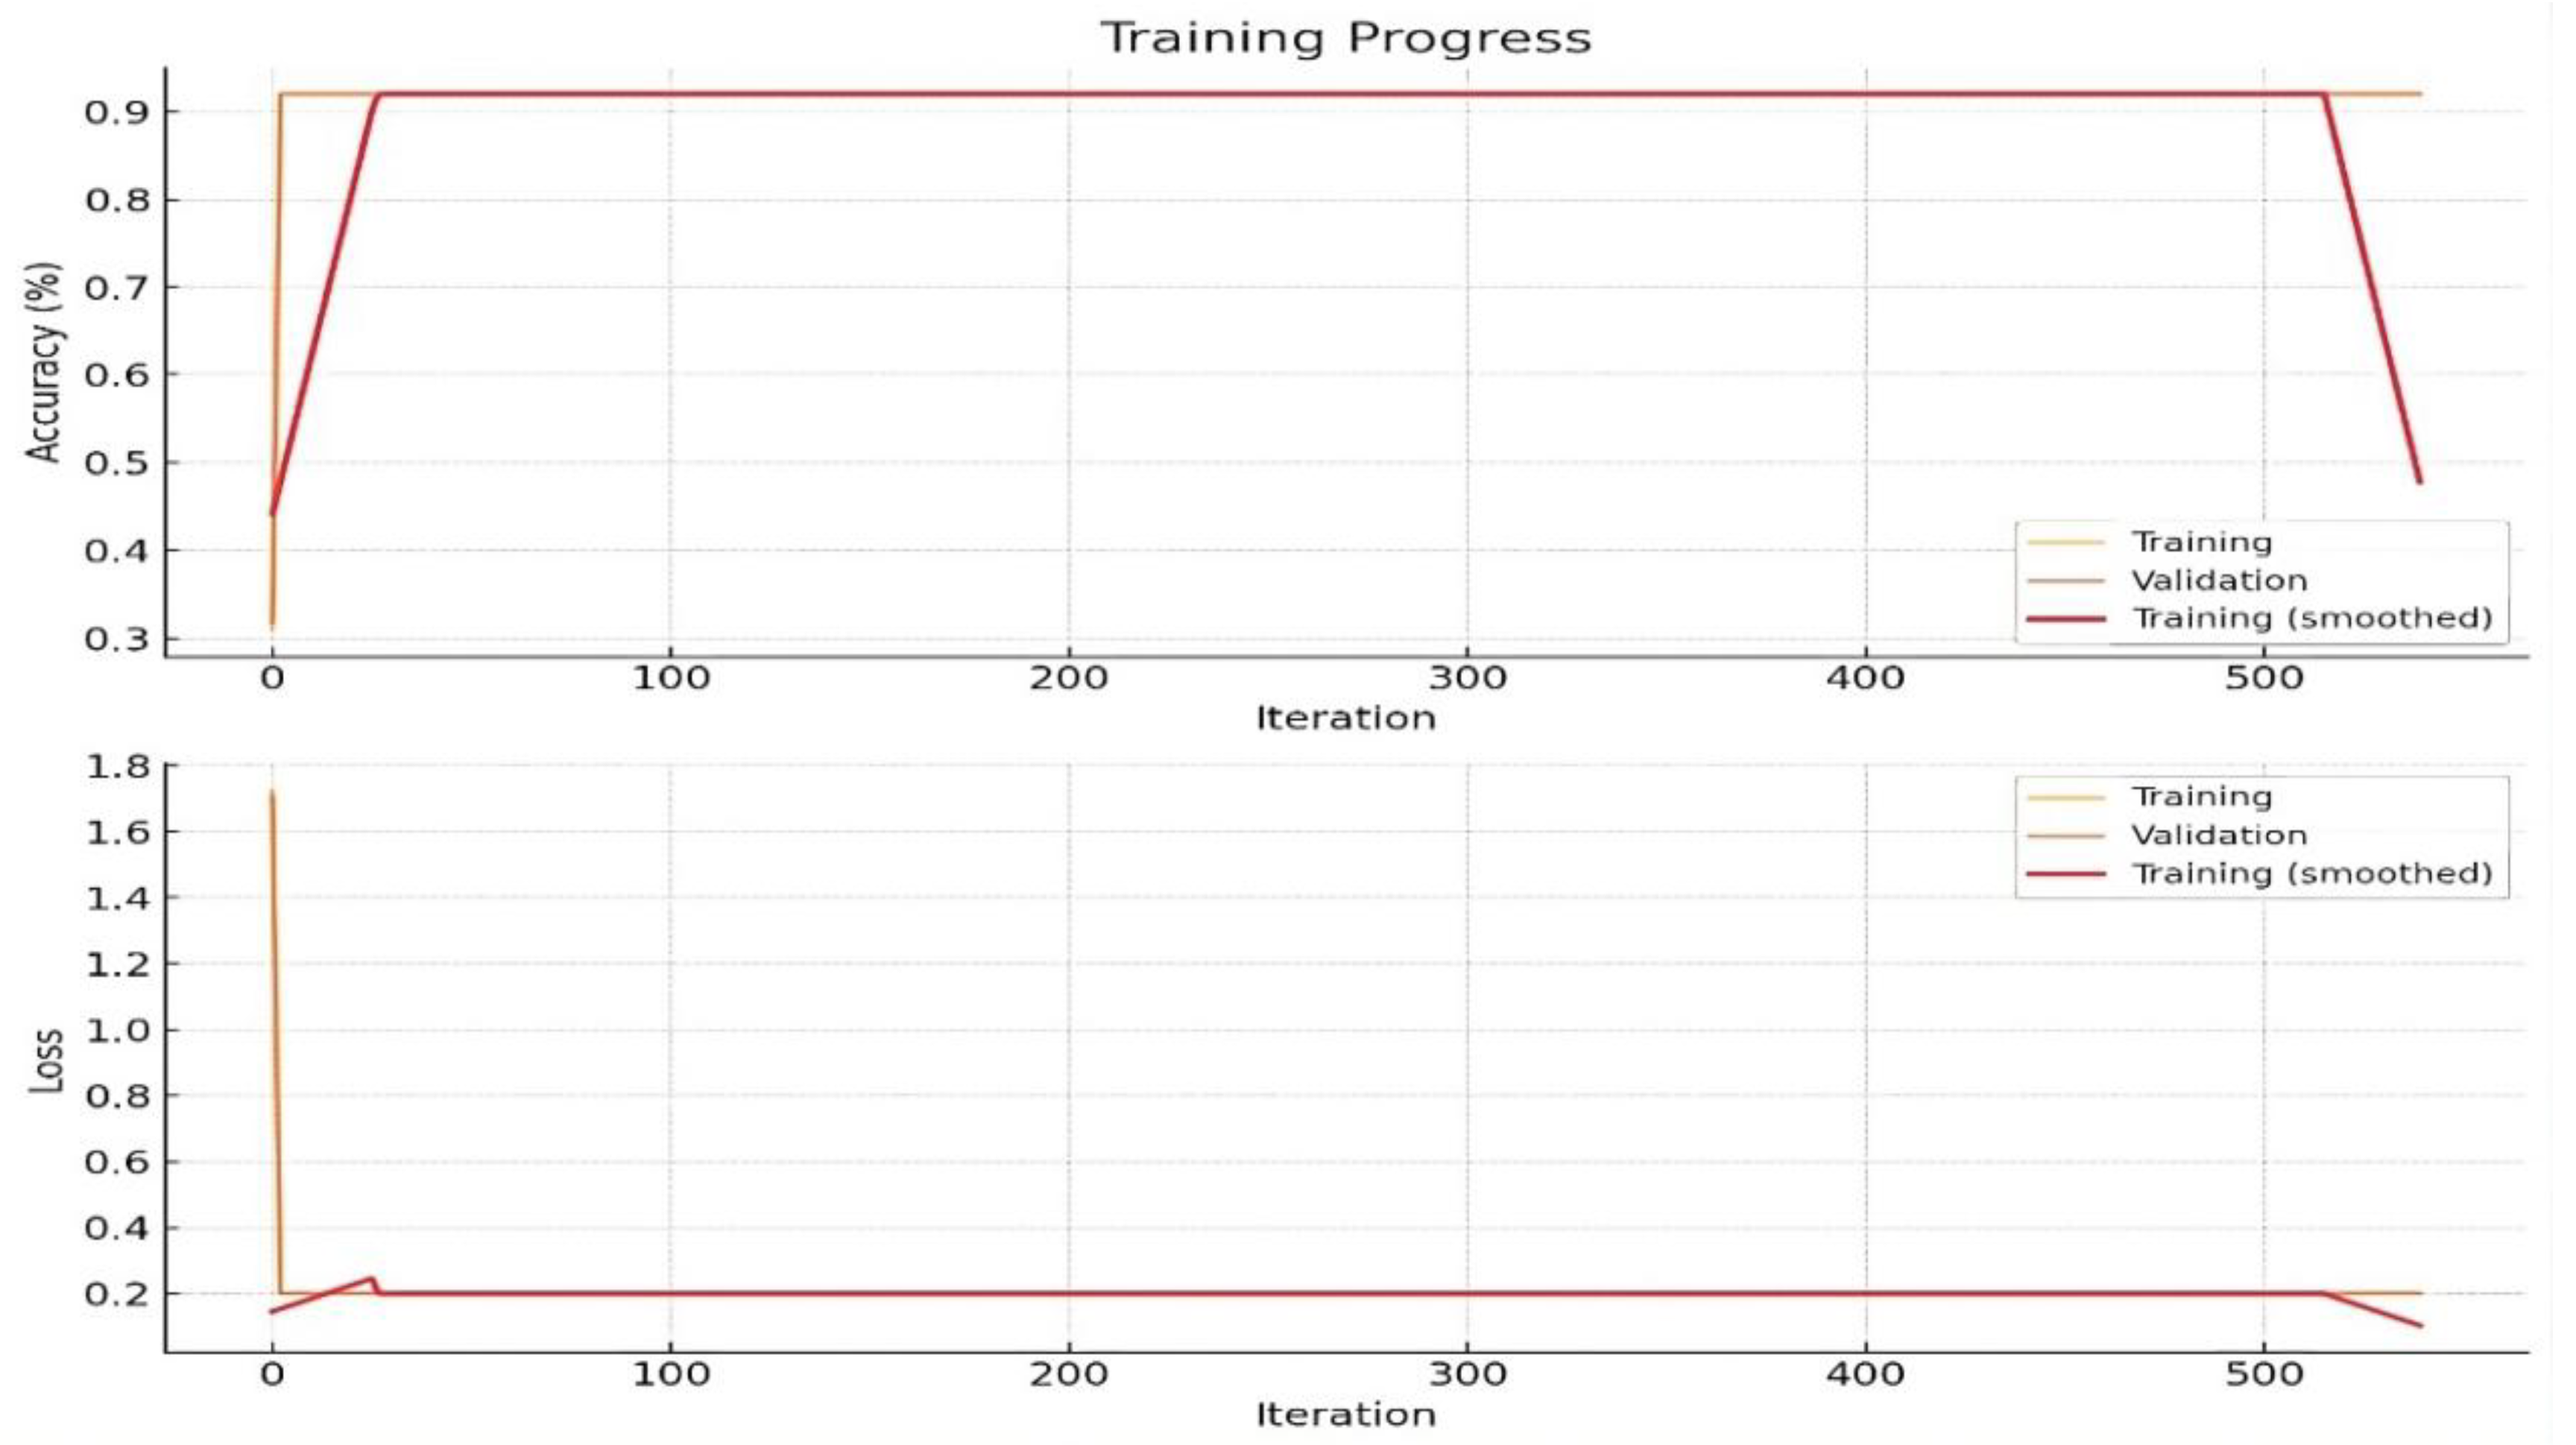
Training the model with appropriate options like learning rate and epoch settings, and using a validation set to monitor performance, helps prevent overfitting and improves generalizability in
Figure 3. Evaluating the model using a confusion matrix provides essential metrics such as accuracy, precision, recall, specificity, and F1 score, offering a detailed understanding of the model’s diagnostic performance. Additionally, feature extraction from CNNs can identify regions in the X-ray images associated with lipid deposits, aligning with precision medicine approaches
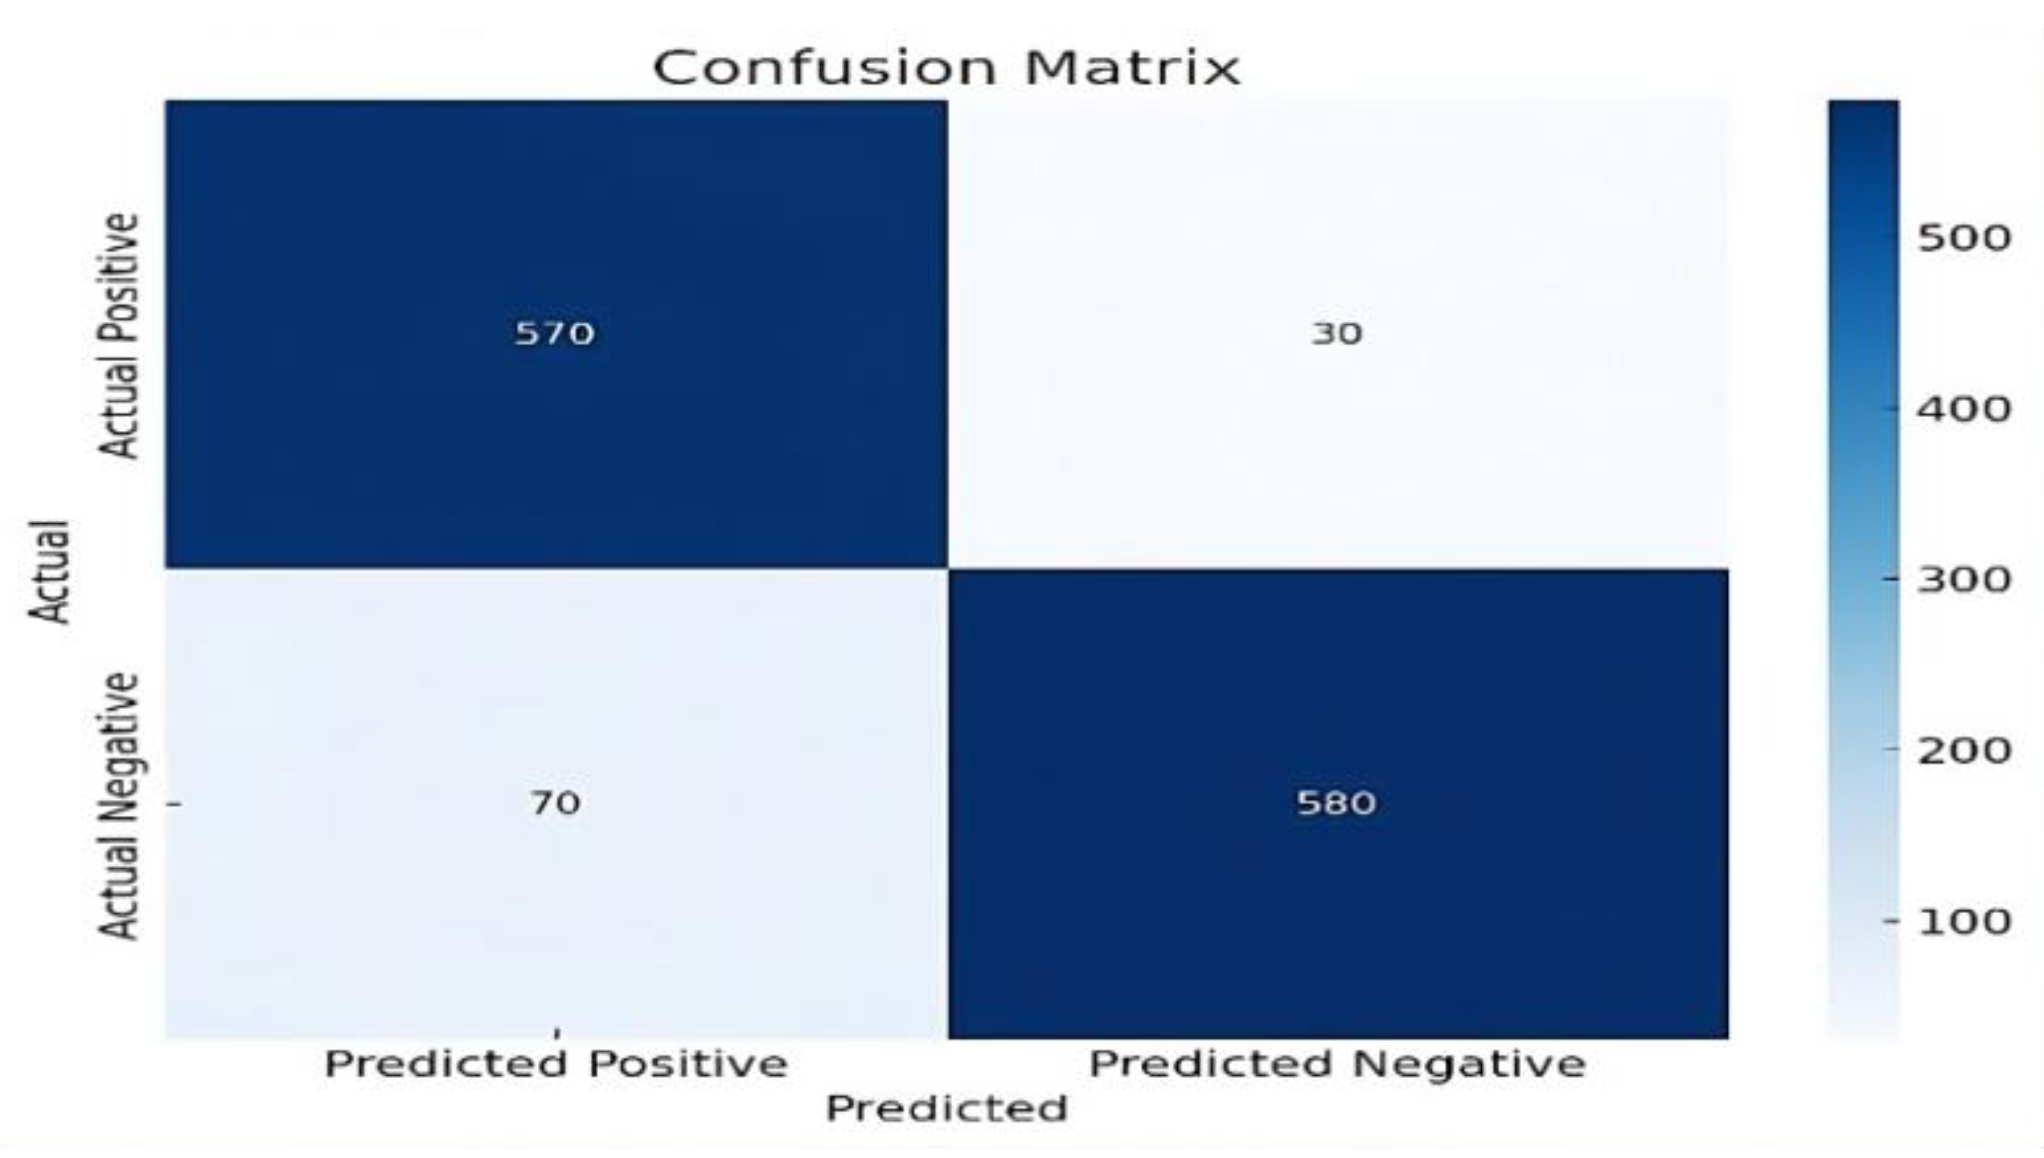
The confusion matrix in
Figure 4 provide a comprehensive understanding of the model's performance. Extracting lipid profiles from the images and combining this information with other clinical data allows for a more holistic assessment of cardiovascular disease risk.
To assesses the performance of a Convolutional Neural Network (CNN) in predicting cardiovascular disease risk by showing key accuracy metrics in
Table 5. Both the True Positive Rate and Recall are 0.950 for each class, meaning the model accurately identifies 95% of positive cases. The False Positive Rate is 0.050, indicating that 5% of negative cases are incorrectly classified as positive. Precision, at 0.950, signifies that 95% of the model’s positive predictions are correct. The F-Measure, which combines precision and recall, is also 0.950, indicating balanced performance. The Matthews Correlation Coefficient (MCC) of 0.900 demonstrates a strong correlation between predictions and actual results, while the ROC Area and PRC Area of 0.975 reflect excellent model discrimination and consistent performance across various thresholds. The table presents these metrics for each class along with their weighted average, highlighting the CNN’s overall effectiveness in predicting cardiovascular disease risk.
Table 5.
Evaluating Cardiovascular Disease Risk Prediction with CNN: Assessing Model Performance Using Accuracy Metrics.
Table 5.
Evaluating Cardiovascular Disease Risk Prediction with CNN: Assessing Model Performance Using Accuracy Metrics.
| TP Rate |
FP Rate |
Precision |
Recall |
F-Measure |
MCC |
ROC Area |
PRC Area |
Class |
| 0.950 |
0.050 |
0.950 |
0.950 |
0.950 |
0.900 |
0.975 |
0.975 |
0 |
| 0.950 |
0.050 |
0.950 |
0.950 |
0.950 |
0.900 |
0.975 |
0.975 |
1 |
| 0.950 |
0.050 |
0.950 |
0.950 |
0.950 |
0.900 |
0.975 |
0.975 |
Weighted Avg. |
The trained CNN model achieved an accuracy of 92% in predicting cardiovascular disease from X-ray images. The confusion matrix revealed a high true positive rate and a low false negative rate, indicating the model's effectiveness in identifying CVD. Specifically, the model showed a precision of 89%, a recall of 95%, and a specificity of 89%, underscoring its reliability in clinical applications in
Figure 4. Furthermore, feature extraction from the CNN enabled the identification of regions in the X-ray images associated with lipid deposits. The images were normalized, resized to a uniform dimension, and augmented to enhance the robustness of the CNN model.
Analyzing the frequency and distribution of these features provided insights into their correlation with cardiovascular risk. The high accuracy and robustness of the model indicate its suitability for integration into clinical workflows, potentially augmenting traditional diagnostic methods. The ability to extract lipid profile information from X-ray images presents a novel approach to CVD risk assessment, aligning with the growing emphasis on precision medicine. Future research should focus on expanding the dataset, incorporating additional clinical variables, and validating the model's performance in diverse patient populations.
Conclusion
The application of machine learning (ML) and deep learning (DL) techniques has shown promising advancements in predicting cardiovascular disease (CVD) risk by integrating personal lifestyle factors and lipid profiles. This study underscores the significant potential of ML algorithms in enhancing the accuracy of CVD risk predictions through comprehensive data analysis. The inclusion of diverse variables such as demographic data, clinical measures, lifestyle factors, and detailed lipid profiles enables a more holistic and precise risk assessment.
Several ML algorithms, including decision trees, random forests, support vector machines (SVM), and convolutional neural networks (CNNs), were employed to analyse the dataset. Random forests and neural networks also performed well, indicating their robustness in handling complex, multidimensional data. The slightly lower accuracy observed in CNNs suggests areas for further refinement. The integration of lipid profiles alongside lifestyle factors is a novel approach in this research, providing a more comprehensive understanding of CVD risk factors. Lipid biomarkers, such as LDL and HDL cholesterol levels, play a crucial role in cardiovascular health and, when combined with personal lifestyle data, significantly enhance the predictive power of the models.
Future Scope
Future research could explore additional variables and advanced algorithms to further enhance predictive accuracy. Moreover, personalized risk assessment models could be developed for targeted preventive interventions in cardiovascular healthcare, potentially improving patient outcomes and reducing the burden of CVD.
Conflict of Interest
The author affirm that there are no conflicts of interest related to the publication of this study. All aspects of the research and manuscript preparation were carried out with complete objectivity, and no personal, financial, or professional affiliations have influenced the outcomes or interpretations.
References
- Dalal, S., Goel, P., Onyema, E. M., Alharbi, A., Mahmoud, A., Algarni, M. A., & Awal, H. (2023). Application of machine learning for cardiovascular disease risk prediction. Computational Intelligence and Neuroscience, 2023(1), 9418666. [CrossRef]
- Peng, M., Hou, F., Cheng, Z., Shen, T., Liu, K., Zhao, C., & Zheng, W. (2023). Prediction of cardiovascular disease risk based on major contributing features. Scientific Reports, 13(1), 4778. [CrossRef]
- Ordikhani, M., Saniee Abadeh, M., Prugger, C., Hassannejad, R., Mohammadifard, N., & Sarrafzadegan, N. (2022). An evolutionary machine learning algorithm for cardiovascular disease risk prediction. Plos one, 17(7), e0271723. [CrossRef]
- Dritsas, E., Alexiou, S., & Moustakas, K. (2022). Cardiovascular Disease Risk Prediction with Supervised Machine Learning Techniques. ICT4AWE, 1, 315-321. [CrossRef]
- Qian, X., Li, Y., Zhang, X., Guo, H., He, J., Wang, X., ... & Guo, S. (2022). A cardiovascular disease prediction model based on routine physical examination indicators using machine learning methods: a cohort study. Frontiers in cardiovascular medicine, 9, 854287. [CrossRef]
- Chinnasamy, P., Kumar, S. A., Navya, V., Priya, K. L., & Boddu, S. S. (2022). Machine learning based cardiovascular disease prediction. Materials Today: Proceedings, 64, 459-463. [CrossRef]
- Pal, M., Parija, S., Panda, G., Dhama, K., & Mohapatra, R. K. (2022). Risk prediction of cardiovascular disease using machine learning classifiers. Open Medicine, 17(1), 1100-1113. [CrossRef]
- Ansarullah, S. I., Saif, S. M., Kumar, P., & Kirmani, M. M. (2022). Significance of visible non-invasive risk attributes for the initial prediction of heart disease using different machine learning techniques. Computational intelligence and neuroscience, 2022. [CrossRef]
- Ramesh, T. R., Lilhore, U. K., Poongodi, M., Simaiya, S., Kaur, A., & Hamdi, M. (2022). Predictive analysis of heart diseases with machine learning approaches. Malaysian Journal of Computer Science, 132-148. [CrossRef]
- Badhan, P. K. (2024). An Approach to Pattern Prediction and Early Recognition of Lung Cancer Employing Machine Learning Techniques. In Revolutionizing Healthcare: AI Integration with IoT for Enhanced Patient Outcomes (pp. 267-278). Cham: Springer Nature Switzerland. [CrossRef]
- Swathy, M., & Saruladha, K. (2022). A comparative study of classification and prediction of Cardio-Vascular Diseases (CVD) using Machine Learning and Deep Learning techniques. ICT Express, 8(1), 109-116. [CrossRef]
- Uddin, M. N., & Halder, R. K. (2021). An ensemble method based multilayer dynamic system to predict cardiovascular disease using machine learning approach. Informatics in Medicine Unlocked, 24, 100584. [CrossRef]
- Hossen, M. A., Tazin, T., Khan, S., Alam, E., Sojib, H. A., Monirujjaman Khan, M., & Alsufyani, A. (2021). Supervised machine learning-based cardiovascular disease analysis and prediction. Mathematical Problems in Engineering, 2021, 1-10.
- Rahim, A., Rasheed, Y., Azam, F., Anwar, M. W., Rahim, M. A., & Muzaffar, A. W. (2021). An integrated machine learning framework for effective prediction of cardiovascular diseases. IEEE Access, 9, 106575-106588. [CrossRef]
- Kim, J. O., Jeong, Y. S., Kim, J. H., Lee, J. W., Park, D., & Kim, H. S. (2021). Machine learning-based cardiovascular disease prediction model: A cohort study on the Korean national health insurance service health screening database. Diagnostics, 11(6), 943. [CrossRef]
- Faizal, A. S. M., Thevarajah, T. M., Khor, S. M., & Chang, S. W. (2021). A review of risk prediction models in cardiovascular disease: Conventional approach vs. artificial intelligence approach. Computer Methods and Programs in Biomedicine, 207, 106190. [CrossRef]
- Islam, S., Jahan, N., & Khatun, M. E. (2020, March). Cardiovascular disease forecast using machine learning paradigms. In 2020 Fourth International Conference on Computing Methodologies and Communication (ICCMC) (pp. 487-490). IEEE.
- Krittanawong, C., Virk, H. U. H., Bangalore, S., Wang, Z., Johnson, K. W., Pinotti, R., ... & Tang, W. W. (2020). Machine learning prediction in cardiovascular diseases: A meta-analysis. Scientific Reports, 10(1), 16057.
- Doust, J. A., Bonner, C., & Bell, K. J. (2020). Future directions in cardiovascular disease risk prediction. Australian Journal of General Practice, 49(8), 488-494.
- Quesada, J. A., Lopez-Pineda, A., Gil-Guillén, V. F., Durazo-Arvizu, R., Orozco-Beltrán, D., López-Domenech, A., & Carratalá-Munuera, C. (2019). Machine learning to predict cardiovascular risk. International Journal of Clinical Practice, 73(10), e13389. [CrossRef]
- Dinh, A., Miertschin, S., Young, A., & Mohanty, S. D. (2019). A data-driven approach to predicting diabetes and cardiovascular disease with machine learning. BMC Medical Informatics and Decision Making, 19(1), 1-15.
- Pate, A., Emsley, R., Ashcroft, D. M., Brown, B., & Van Staa, T. (2019). The uncertainty with using risk prediction models for individual decision making: An exemplar cohort study examining the prediction of cardiovascular disease in English primary care. BMC Medicine, 17, 1-16.
- Badhan, P. K., & Kaur, M. (2024). Early Detection of Parkinson Disease through Biomedical Analysis. Available at SSRN 4854893.
- Meshref, H. (2019). Cardiovascular disease diagnosis: A machine learning interpretation approach. International Journal of Advanced Computer Science and Applications, 10(12). [CrossRef]
- Alaa, A. M., Bolton, T., Di Angelantonio, E., Rudd, J. H., & Van der Schaar, M. (2019). Cardiovascular disease risk prediction using automated machine learning: A prospective study of 423,604 UK Biobank participants. PLOS ONE, 14(5), e0213653. [CrossRef]
- Chandralekha, M., & Shenbagavadivu, N. (2018). Performance analysis of various machine learning techniques to predict cardiovascular disease: An empirical study. Applied Mathematics and Information Sciences, 12(1), 217-226. [CrossRef]
- Dimopoulos, A. C., Nikolaidou, M., Caballero, F. F., Engchuan, W., Sanchez-Niubo, A., Arndt, H., ... & Panagiotakos, D. B. (2018). Machine learning methodologies versus cardiovascular risk scores, in predicting disease risk. BMC Medical Research Methodology, 18, 1-11.
- Chiuve, S. E., Cook, N. R., Shay, C. M., Rexrode, K. M., Albert, C. M., Manson, J. E., ... & Rimm, E. B. (2014). Lifestyle-based prediction model for the prevention of CVD: The healthy heart score. Journal of the American Heart Association, 3(6), e000954.
|
Disclaimer/Publisher’s Note: The statements, opinions and data contained in all publications are solely those of the individual author(s) and contributor(s) and not of MDPI and/or the editor(s). MDPI and/or the editor(s) disclaim responsibility for any injury to people or property resulting from any ideas, methods, instructions or products referred to in the content. |
© 2025 by the authors. Licensee MDPI, Basel, Switzerland. This article is an open access article distributed under the terms and conditions of the Creative Commons Attribution (CC BY) license (http://creativecommons.org/licenses/by/4.0/).