Submitted:
31 January 2025
Posted:
03 February 2025
You are already at the latest version
Abstract
Evaluation of water absorption in concrete is regarded as an important indicator for assessing the causes of its deterioration and durability. Traditionally adopted methods for durability assessment in concrete materials, however, lack in providing real-time monitoring of the absorption process and that about the material deformability at surfaces (volumetric changes) caused by swelling in cement hydrates (i.e. C-S-H). In this study, a one-dimensional water absorption test was performed on small-size mortar specimens of three different strengths, and their top (flattened) surface was continuously monitored for volume changes by utilizing surface strain gauges along with DICM. After the water absorption test, the same specimens were tested for mechanical properties such as compressive strength and Young’s modulus. Moreover, the water absorption characteristics, like depth/rate, were evaluated in DICM by tracing changes of waterfront positions with the progression of strains during the water absorption process in mortars. Additionally, the surface strain gauges confirmed the accuracy of strains evaluated by DICM. The absorption characteristics obtained from observations in DICM were correlated with the mechanical properties and expansion strain of the test specimens. The results indicated that the durability properties were not only related to the water absorption rate but also to the mechanical properties and volume changes due to saturation.
Keywords:
water absorption
; DICM
; strain
; expansion
; concrete materials
1. Introduction
Concrete is the most widely used material in the construction industry, and its worldwide consumption stands second after water [1]. On the other hand, all the concrete structures experience durability-related damages and performance degradations even before reaching their design service life, which are caused by chemical and/or physical factors, such as freeze-thaw cycles, carbonation, sulfate/chloride attack, etc. [2,3,4,5]. Water is usually involved in the entire process of these degradations, which is directly involved in all kinds of physical deteriorations, and as a carrier of aggressive ions, it is indirectly involved in the chemical deteriorations of concrete materials/structures [6]. Therefore, water transport in concrete materials is regarded as a representative descriptor to reflect the durability of concrete structures [6], therefore, it’s crucial to evaluate water transport characteristics in concrete materials and their impact on several physical factors from the perspective of concrete durability.
Water transport in concrete materials is strongly influenced by the pore volume fractions (i.e., porosity) and the pores interconnectivity [7,8,9] and has been extensively evaluated, by considering mainly three modes, including capillary absorption [2,9,10,11,12,13,14], diffusion [15,16] and penetration or permeability [17]. Moreover, among these modes, the capillary absorption (also known as sorptivity) is the most commonly used to investigate the water transport capacity in the concrete materials. It is the ability of the concrete materials to take up the water under capillary suction and has been regarded as an important indicator for assessing the causes of deteriorations in concrete materials and devising strategies to control their rate in concrete structures [14,18,19].
Water absorption tests are most extensively conducted to assess the durability of concrete materials [20] by adopting procedures laid out in ASTM C1585 [21]. In this method, the rate of water absorption (sorptivity) in unsaturated concrete materials is determined by repeatedly performing gravimetric measurements during the water absorption process, and a water content versus t0.5 plot is obtained, which describes the absorption process as primary (rapid) and secondary (slow) rates of absorption in cement-based concrete materials. The rapid rate of absorption is controlled by capillary absorption, which is further influenced by pore volume fraction and its distribution and dictates the durability of the concrete materials. Whereas the slow rate is associated with the total porosity in the matrix and fails to provide sufficient information related to durability [14,22]. Repeated mass measurements for eight days, especially for the initial six hours, make this method laborious and time-consuming. Apart from this, it lacks in providing information about the spatial distribution of water in saturated regions of concrete [23] and also it did not provide any information about deformations at the specimen surface as reported in some recent studies [24] which is primarily caused by swelling of the cement hydrates, i.e., C-S-H during the water absorption process as reported in studies [24,25,26,27,28].
Moreover, the commonly used methods to visualize capillary absorption and quantify the water content profiles in concrete materials include nuclear magnetic resonance (NMR) and electrical technology, as well as X-ray computed tomography (XCT), etc. But all of these methods have their own limitations, like the NMR method, which is highly sensitive to water molecules [27,29] and its results can easily be affected by factors such as hydrogen in the calcium-silicate-hydrate (C-S-H) gel; therefore, obtaining spatial distribution information about water through NMR results can be suspicious. Similarly, the electrical technology tools like electrical impedance tomography (EIT) [30], electrical resistance tomography (ERT) [31], and electrical impedance spectroscopy (EIS) [32] are used to visualize or evaluate the water absorption in concrete with the changes in the electrical parameters. However, various factors such as chloride content, metal composition, and temperature can affect the test results. Moreover, neutron imaging offers visualization of water penetration by detecting neutron beam absorption in concrete specimens, and this technique is particularly suitable for testing hydrogen atoms. However, it cannot measure specific ions like paramagnetic ions in Additionally, it relies on a high-energy source typically available only in synchrotron radiation beamlines, which limits the widespread adoption of this method.
Based on the above discussion, it can be stated that despite the limitations in accuracy of measurements for quantifying water content in concrete materials, all the methods traditionally adopted to evaluate the water absorption characteristics are either laborious, time-consuming, sensitive to concrete qualities, or demand special arrangements. Moreover, they are unable to provide detailed/precise information on possible volume changes caused by deformations in concrete materials (due to swelling in cement hydrates) and cannot provide visualization of water progression altogether. On the other hand, the Digital Image Correlation Method (DICM), being a robust non-destructive strain measurement technique, can evaluate the concrete deformations with high accuracy and reliability and provide strain visualization in the form of strain contours/maps over the regions of interest [33,34,35,36,37]. Owing to its efficiency in engineering evaluations, DICM has emerged as the most popular tool among researchers, especially in the past decade [35,38,39] and its use is continuously expanding, not only in mechanical testing [34,40,41,42,43,44] but also in non-destructive evaluations of concrete, for example corrosion evaluation [45], shrinkage in cement-based concrete materials [46] etc. Recently, one of the studies by Dzaye et al. [47] also applied DICM on freshly poured mortars and succeeded in quantifying settlement and shrinkage after validation of DIC results through traditional approaches (LVDTs). More specifically, in their pilot study, Igarashi et al. [48], utilized DICM to evaluate the deformations in concrete caused by swelling of C-S-H during water absorption after drying up to 105 °C and succeeded in visualizing the progression of strains at the surface of specimens in the mortar parts of the concrete. However, this study was not supported by any validation of strain calculated in DICM, for example, by strain gauges, etc., like [47], and the effect of surface contrast changes in saturated regions was neglected as pointed out in the author’s previous study [49]. On the other hand, ensuring good contrast and producing high-quality speckle patterns for tracing and matching are strongly recommended to yield precise results in DIC [33,36,38,39,50,51]. Moreover, in the past, many researchers, e.g., [16,52,53] have also reported the relationship between mechanical properties and water absorption characteristics determined by traditional methods (described above). But in these, the evaluated water absorption characteristics included certain assumptions and lacked proper evidence of phenomena during the water absorption process. Moreover, accurate prediction of the service life of the concrete structures is an everlasting challenge among researchers because of the involvement of various factors and complexities in the assessment methods.
Therefore, in this context, the research presented in this paper encompasses the relationship between the water absorption characteristics, deformability during absorption (evaluated by real-time monitoring by the simply set Digital Image Correlation Method (DICM)), and the mechanical properties of mortars from three different strengths. At first, a one-dimensional water absorption test was conducted on small-size rectangular specimens of mortars. Throughout the absorption process, the top (flat) surface of the specimen was monitored for strain development by utilizing surface strain gauges, altogether with capturing the digital images for DICM. All the specimens were then tested under compression to determine their mechanical properties (i.e., compressive strength, fcm’ and Young’s modulus, Em). Accordingly, the validation of strain measurements in DICM was investigated while accounting for the effects of contrast changes in images. At the end, the water absorption characteristics, like absorption depth/rate and material deformability (strains), were evaluated through observations in DICM and correlated with the mechanical properties of the same specimens.
2. Experimental Outlines
The following sections describe the details of all experimental procedures adopted in this research with some improvements in test setup used in our previous study [49].
2.1. Materials and Mix Proportions
The test specimens of mortars with three different strengths (categorized as low, medium, and high quality) based on varying water-to-cement (W/C) ratios were prepared by using high early strength cement for low and medium strength mortars and ordinary Portland cement (OPC) for high strength mortars. Two types of commercially available chemical admixtures were used in preparing the mortar mixes: an air-entraining agent (AE) in low- and medium-quality concrete and the superplasticizer (SSP-104) in high-strength mortars to maintain consistency. The details of each mixed proportion are outlined in Table 1.
2.2. Test Specimens
This study involved small-size rectangular specimens from three different strengths with nominal dimensions of Length (L) = 150 mm, Width (W) = 100 mm, and thickness/Height (H) = 50 mm. Six specimens in total (two from each strength case) were cast. Table 2 presents the details of each specimen’s measured dimensions, ages at curing, testing (for water absorption and compression), and the compression test results of each test specimen.
Irrespective of the differences in mix compositions and the curing conditions/ages, the presence of initial moisture content in the cement-based materials has considerable influence on their water absorption characteristics [2], and it can lead to misunderstanding of actual absorption behavior and the absorption rates, etc. [2,8,13,21,22,54,55]. On the other hand, the exact drying temperature and technique are still debated among researchers [8,56,57]. However, the test investigation conducted by Zhutovsky et al. 2019 [22] considering oven drying of specimens at 60 °C until gaining constant weight was found to be more appropriate with the assumption that rigorous drying could result in better correlation with transport properties in concrete materials. Therefore, in present research, all the test specimens were oven dried at 60 °C for two days with the assumption to obtain completely dried specimens with preserved microstructure before conducting the water absorption test.
While preparations were made, each specimen was passed through a systematic procedure under controlled conditions that included the following steps:
- Seal all surfaces of the specimen by applying silicone except for one longer side/edge (to allow water penetration) and the top face (to be used for DICM), where masking tape was applied to avoid traces of silicone while its application on other sides sealed them against water penetration.
- Cut the masking tape only at designated positions on the planner face at the marked points to attach the strain gauges which also served as guides for positioning of gauges in a particular direction at intended points, as illustrated in Figure 1. The face for DICM was divided into two halves, i.e., the painted side (P) and the unpainted side (NP), over which eight general-purpose surface strain gauges with a gauge length of 10 mm were attached. Moreover, the arrangement of gauges was kept identical on both halves in the x- and y-axes with respect to the direction of water penetration.
- After the attachment of surface strain gauges, the specimen was placed in a glass chamber and kept there for approximately 24 h. Afterwards, the half face was coated with matte-type white spray paint to decrease the influence of color change and to achieve good quality speckles for DICM, and the other half face was left unpainted to differentiate between DICM measurements during the water absorption process. It’s worth mentioning that matte-type white spray paint was used for coating the layer because its layer did not make any thin film over the surface, and also it does not affect the deformation measurements in DICM (for details readers may consult [46,58]).
2.3. Test Methods
2.3.1. Water Absorption Test
In this study, a one-dimensional water absorption test was performed on ~50 mm thick mortar specimens by adopting a test configuration allowing horizontal water penetration into concrete materials, where the absorption rate is independent of gravitational effects; rather, it is governed by hydrostatic forces and the unsaturated capillary flow in porous media of the concrete materials [13]. Indeed, a constant water depth was always maintained with specimen thickness throughout the test, as indicated in the elevation of Figure 3. Two kinds of data (i.e., recording of surface strains and capturing pictures from the top face) were acquired during the whole water absorption test/process, which lasted for 160 h (i.e., 9600 min) with respect to the specimen’s first contact with water.
2.3.2. Description of Digital Image Correlation Method (DICM)
The DIC analysis was performed by involving one high-grade charged-coupled device (CCD) camera with a maximum resolution of 6000 × 4000 pixels and one pair of LED lights. The precision and reliability of the measurements in DICM strongly depend on the imaging system set-up (e.g., light source and fixing of the camera with respect to the specimen’s flattened surface for deformation measurements), test specimen surface, etc. [38,60,61]. Therefore, a specialized test setup was established as shown in Figure 3, where the camera was mounted perpendicularly at ~340 mm, focusing on the top of the flat surface of the specimen (i.e., the xy-plane) inside a water container placed over a rigid/stable camera stand. GOM Correlate 2019 software v2.0.1 package was used as a correlation tool. This system allowed for non-contact and full-field strain measurement on the full DICM face of the specimen.
2.3.3. Uni-axial Compression Test
All the mortar specimens were tested under uniaxial compression along their longer length (L) after completing one-dimensional water absorption tests on them. In order to determine the deformations in the mortar specimens during the compression test, two strain gauges were attached to the left and right sides of the specimen at their middle length, and their average strain was used in stress-strain plots for each specimen. The Young’s modulus of each specimen was then determined as the initial slope on the stress-strain curve below 30% of peak stress of each specimen. Compression test results are presented in Table 2; it is observed that both the specimens in each strength category depicted consistent results. Moreover, as an average of two specimens in each category, medium and high-strength mortars exhibited 40.54% and 100.12% higher compressive strengths than low-strength mortars, respectively. Similarly, the Young’s modulus in medium and high strength mortars was also 16.87% and 62.32%, respectively, higher than in low strength mortars.
3. Determination of strain development during water absorption using surface strain gauges
3.1. Strain development along x-axis and y-axis directions
Figure 4 shows the measurements of strains on the surface of the specimens (in the xy-plane) recorded by surface strain gauges in specimen-1 (solid line) and specimen-2 (dashed lines) during water absorption in relation to the wetting duration (t in minutes) for three strength cases. In these figures, the blue and red lines show the average values of strains recorded by gauges on the P and NP sides at position-1 (near the surface in contact with water, ref. Figure 1) in the x-axis and y-axis directions, respectively. Similarly, the green and grey lines show the average values of strains recorded by gauges on the P and NP sides at position-2 (at the middle of the width of the specimen, ref. Figure 1) in the x-axis and y-axis directions, respectively. Note that the strains in the x and y directions indicate deformation caused by water absorption in the directions perpendicular and parallel to the water penetration direction, respectively.
Surface strain gauges at position-1 started recording the deformations at the surfaces of the specimens immediately after contact with water, but those at position 2 delayed in all strength cases. This phenomenon corresponds to the fact that water ingress has an instant effect on the volume changes in concrete materials owing to the hygroscopic nature of the cement hydrates (i.e., the C-S-H gel), which results in expansion as illustrated in studies like [28,48]. Further, the volume changes observed on the small-size rectangular specimens in this study are consistent with the findings of past research conducted by Alderete et al. 2019 [24].
It is observed that x-axis direction strain in all cases has a gradual rise with the wetting duration, which in fact corresponds to the progressive increase in the level of saturation (and resulted expansion), indicating the water ingress rate within the mortars. In each case, the maximum expansion strains along the x-axis (at position -1) corresponded well to the strength of mortars; for example, the low-strength mortar experienced a maximum strain (average of two specimens) of 0.054% after 9600 min of water absorption, being the largest of the other two strengths, medium and high, which experienced maximum (average of two specimens) expansion strains of 0.045% and 0.029%, respectively, along their x-axis. Similarly, in the same direction at position-2, the maximum strains (average of two specimens) were 0.042%, 0.016%, and 0.005% in low, medium, and high-strength mortars, respectively.
However, these specimens in their y-axis (at position-1) initially experienced compressive strains reaching a maximum value of -0.0087%, -0.0090%, and -0.0179% in low, medium, and high-strength mortars, respectively, and at position-2 in the same direction, low, medium, and high-strength mortars experienced (average strains of two specimens) -0.008%, -0.004%, and -0.004%, respectively. The occurrence of compressive strains along the y-axis is commonly observed in all cases, which can be attributed to the bending deformation in the third axis (i.e., vertical) direction caused as part of isotropic three-dimensional volumetric expansion resulting from the internal swelling reaction of cement hydrates owing to the saturation [24,62]. Detailed behavior is discussed comprehensively in the succeeding section as a mechanism of strain development.
3.2. Water absorption depth determined by grey scale
During the one-dimensional water absorption test, it was observed that the surface color was changed at the saturated area of water in the unpainted part. This observation implies that the water absorption process will be determined easily and briefly by catching the border of the color change part. In this image data, each pixel worked as an independent detector and was assigned a grey level according to the surface contrast/color during the water absorption process, i.e., the saturated parts have lower grey values compared to the unsaturated part owing to the darkened texture on the unpainted (NP) side part of the specimen surface as indicated in past studies like [16,63]. The images were imported into ImageJ software, where the grey levels were converted to 8-bit data.
Figure 5 shows the original pictures (upper row) taken after 120, 180, 480, and 1080 min of the water absorption process in low-strength mortars, with dashed yellow lines indicating the region of interest (ROI) at each time interval. To better visualize the variations in greyscale values in the saturated region, the averaged greyscale values were plotted along the y-axis (solid red line in lower graphs) with the water penetration side being at 0 mm. It is necessary to note that these greyscale values were averaged within smaller dimensions of ROI and varied along the y-axis, and also the shaded regions (red and grey) in the lower graphs mark the widths of the gauges placed in the y-axis direction at positions 1 and 2, respectively.
A clear difference in the greyscale values in the saturated and unsaturated regions is observed, i.e., varying grey values in the saturated part are noticed, whereas in the unsaturated part it seems almost constant. The grey value distribution profiles formed a triangular shape within the saturated regions. The water depth (waterfront) was estimated from these profiles by identifying the point where the red curve (representing the grey value at a specific point along the y-axis) intersected the horizontal blue line (identified as a threshold greyscale value determined from the maximum grey value in the captured images of the mortar specimen). It was discovered that the triangular region expanded with increasing wetting durations, indicating the progressive movement of the waterfront and increased saturation over time.
3.3. Three-Dimensional Deformation Behavior during Water Absorption
Figure 6 presents the schematic illustration of the possible volumetric changes occurring in the mortar samples during the first 1080 min of the water absorption test in order to discuss strain development. In this figure, the isometric deformation states of the mortar specimens are considered at stages I, II, III, and IV after 120, 180, 480, and 1080 min after starting the water absorption test, respectively. The axis strain versus wetting duration plot represents the x-axis and y-axis strains recorded by surface strain gauges installed at position-1 in the low-quality specimen. Additionally, the water absorption depth determined on the NP side of the same specimen by considering changes in grey values is plotted. As highlighted in Section 3.1, the mortar specimen undergoes isotropic three-dimensional volumetric expansion resulting from the internal swelling reaction of cement hydrates. In these figures, dashed grey lines indicate the magnified deformed shape of the sample from the top view and side view (ref. geometry). The blue lines in figures showing top and side views indicate the waterfront at a particular stage (judged based on changes in grey values at the surface on the NP side, ref. Figure 5).
Observations made at each stage are explained below:
- At Stage-I: The waterfront reached the y-axis gauge at position-1 as shown by the red mark in top view, indicating expansion in the saturated part of the specimen, and the specimen experienced the expansion along the x, y, and z-axis. Since the portion below the gauge is still unsaturated, this part exhibited contraction due to small bending occurring in z-axis direction. However, the positive strain in the x-axis is observed owing to the uniform expansion.
- At stage-II: The half of the y-axis strain gauge is covered in the saturated part (indicating positive strain) and half unsaturated (negative strain occurs due to contraction as a result of bending deformation), so both the strains balance each other, and the y-axis strain gets neutralized, but at the same time, the x-axis strain continues showing a gradual increase due to continued expansion.
- At stage-III: The moment when the full underneath part of y-axis gauge is saturated and the maximum possible deformations along y-axis has been reached. There was a rapid increase in the y-axis strain just before reaching this stage, e.g., when water progressed through its gauge, but soon after the full part below the y-axis strain gauge gets saturated, and the stabilized condition in expansion is achieved.
- At stage-IV: The water penetration increases resulting in more progressed volumetric changes in the specimen.
4. Implementation of DICM to Evaluate Strain Development during water penetration
4.1. Spatial distribution of strain during water absorption in low quality mortars
4.1.1. Variation of strain along x-axis
In Figure 7 the variations in the x-axis strains on the painted (P) and unpainted (NP) sides of the low-strength mortar specimen obtained by DICM are given at t = 120, 480, and 1440 min. The results of low-strength mortar were selected to validate DICM because the water absorption and strain development are emphasized rather than other cases. The two horizontal section lines are created at gauge positions 1 (red) and 2 (black) as indicated in the full field strain map of x-axis strain considered at t = 1440 min in order to check the variations in x-axis strain measurements in DICM. The strain distribution along the full length of these lines is given in Figure 7a.
It is pertinent to mention that these plots are considered without any treatment (post-processing like smoothening, etc.), enabling a realistic overview/judgement over the strain calculations in the software. The large variations in strains by DICM are observed in the NP region of the specimens. It is notable that these large variations are observed only at position-1 owing to the water penetration and increased degree of saturation with increased wetting duration but at position 2 P and NP side have similar strains tendencies, which are clearly due to no change in the greyscale value.
It is observed that an unpainted surface shows high strain intensity with large variation in water-saturated regions compared to the painted side surface, the strain gauges, however, depicted almost similar responses on both sides. Figure 5 reveals that the surface image contrast is changed with the increase in the saturation, and there would be high chances of loss/mixing of distinct patterns in the target image, which could lead to errors in strain calculations in DIC software because in DIC, tracking is based on greyscale values of these distinct patterns, and certain correlation criteria shall be met between the reference image and the target image for accurate calculations [51,64,65]. Since greyscale is clearly changing between reference and target images in the saturated part. Therefore, the strains shown by DIC software on the NP side contain high error, are considered unrealistic/pseudo strains and can be regarded as unnatural.
4.1.2. Variation of strain along y-axis
Figure 8 shows the variations in the y-axis strains on the painted (P) and unpainted (NP) sides of the low-strength mortar specimen at t = 120, 480, and 1440 min in the low-strength mortar specimen. These variations are taken as an average of three lines on each side (P and NP) as indicated in the full field strain map of y-axis strains at t = 1440 min. The strain distribution along the full length of these lines (i.e., the width of the specimen) is reproduced in Figure 8b, where the black line shows average strain along three lines on the NP side and the red line shows average strain along three lines on the P side. In a similar manner as for x-axis strains in Section 4.1.1, these plots are considered without any treatment of data from DIC software. Moreover, Figure 8 highlights the strain distributions along the y-axis on the NP side, which also exhibited large variations in data compared to those on the P side at the same time interval in the saturated part.
4.2. Strain recorded by surface strain gauges vs. strains by DICM (Pɛ_DICM vs. Pɛ_gauges)
Figure 9 showcases the measurements of strains on the surface of the mortar specimens (in the xy-plane) recorded by surface strain gauges (solid line) and calculated in DICM (dashed lines) during water absorption in relation to the wetting duration (t is reported in minutes) for three strength cases. The strain gauge results on the painted side are considered for comparison. Moreover, the strains by DICM shown in Figure 9 were obtained as an average of strain values within the length equal to that of the gauge (i.e., 10 mm) over the section lines drawn parallel to the installed surface strain gauges. It can be observed that strains calculated in DICM were found to be in good agreement with those measured by surface strain gauges, which confirmed the verification of the application of DICM during the water absorption test. It was further observed that the results slightly included out-of-plane displacement caused by the bending effect owing to three-dimensional isotropic deformations during the water absorption. However, it was expected that the effect was negligible owing to the very small size of the test specimen, and the out-of-plane displacement occurred only for the initial times, and overall behavior can be evaluated.
4.3. Evaluating water absorption characteristics by DICM
4.3.1. Comparison of progression of full field deformations in y-Axis direction
Figure 10 presents the strain distributions along the y-axis on DIC faces on the paint side of low, medium, and high-strength mortar specimens obtained after 2D-DIC analysis on pictures during the water absorption process. The picture, which is taken after a few seconds of contact with water, is considered as reference/undeformed image (i.e., t = 0 min), and those taken at later times during water absorption are considered deformed images caused by water absorption. The mechanism explained in Figure 6 can be understood through these strain maps as well. Additionally, the strain distributions show that areas with positive strain intensities progressively increase as wetting durations increase in the direction of water absorption, and the swelling of hydrates directly correlates with longer saturation times.
The marked white horizontal lines on the strain maps indicate the progression of water absorption and hence the position of the waterfront after the time of the continued water absorption process. Interestingly, it was observed through these maps that, at the same time, they not only indicate the progression of water during the absorption process but also the level of deformations experienced by different mortars depending on their pore fractions and support to distinguish between different strength/quality states of concrete materials.
4.3.2. Comparison of progression of full field deformations in y-axis direction
From strain distributions along the x and y-axis recorded by gauges (Figure 9), it was observed that the progression of the y-axis strain is prominent during one-dimensional water absorption because the water movement is also predominantly along the y-axis. Therefore, the water absorption depth in this study is determined by considering strain plots along the y-axis. Figure 11 explains the procedure to determine the water absorption depth in a low-strength mortar specimen at t = 120 min. Moreover, at first the mean value of y-axis strains was calculated along six equally spaced lines drawn along the width (W) i.e., y-axis on the painted side starting at 0 mm (near water). Thereafter, one moving average line was determined from these lines to determine the water depth. As stated earlier in Section 3.1, the strain value suddenly changes from tension to a small compression value at the waterfront, and the water penetration depth is defined by this change point.
Figure 12 shows the mean value of y-axis strain (in all six specimens) plotted as a moving average along the y-axis at different time intervals considered with respect to the specimen’s initial contact with water. As the wetting duration increases, a shift to the right in the strain distribution curves in all cases was observed, which confirmed the progressive increase in the swelling of cement hydrates and hence the increased water absorption. It was further observed that the lower the strength was, the higher the tendency of shifting towards the right was, signifying the higher water absorption rate. All the specimens experienced negative (compressive) strains in their unsaturated parts owing to the degree of saturation achieved in the saturated part. It was also noticed that in the low-strength mortars, the tendency in the shift of these strain curves was higher, and the absorption was higher, indicating more swelling in the saturated part and consequently more compressive strain at the farther points from the water was observed as compared to the medium and high-strength cases.
The water absorption depths determined by observations on variations in greyscale at the unpainted part and the strain distributions in DICM at the painted part are plotted in Figure 13 as a function of time of water absorption, i.e., 9600 min. The solid and dashed lines show the results of the water absorption depths determined by observations in DICM and greyscale in specimen-1 (red lines) and specimen-2 (green line) of each strength, respectively. It is observed that both the specimens in each strength case depicted similar water absorption characteristics in each strength case, either determined by greyscale variations or by the observations in DICM.
Two distinct stages of water absorption can be clearly observed: an initial rapid rate of absorption followed by a slower rate. The later stage approaches a plateau due to the increased saturation level, which reduces the connectivity of capillary pores. This reduction is attributed to the refinement of the microstructure in cement-based materials, resulting from the formation of new hydration products (e.g., C-S-H or any hygroscopic) through the rehydration of unhydrated cement paste [28,62]. These test observations adequately correlate with the findings from the previous studies that utilized the gravimetric measurements [2,13,22,54,66,67].
Moreover, DICM resulted in higher water absorption depths compared to those determined by greyscale imaging at the same time, using the NP side of the same image. However, this difference was small during the initial few hours. The said mechanical behavior is attributed to the fact that DICM can capture even very small deformations at any saturation level during the absorption process, whereas the greyscale imaging may not distinguish color changes in the relatively less saturated parts (which are expected at the waterfront). Another reason could be that the paint side protected the surface from the immediate drying, while the NP side was directly exposed to the air, potentially affecting the moisture at the waterfront.
Results reported in Figure 13 and Table 3 show the water penetration depths at increasing wetting durations with respect to the specimen’s first contact with water. A clear difference between the absorption behaviors of the mortars with different mix compositions (i.e., w/c ratios) or their strength states is observed; e.g., water absorption depth in low-strength mortar (i.e., w/c = 0.65 in this study) was always significantly higher than the other two strength cases owing to its more porous media than the other two strengths. More specifically, it can be observed that after 360 min (6 h), the water penetrated the low-strength mortar to a depth over 25 mm, which progressively increased to even more than 40 mm after 1440 min (24 h). It can be understood that even within the first 24 h of contact, water crosses the limit of the minimum recommended concrete cover thickness, i.e., 38 mm for mild exposure conditions of the retaining structures ACI 318-19 [68]. The water penetration depth continued for about 9600 min (160 h) and eventually reached about 60 mm.
Although for the medium-strength mortar, the water penetration depth is smaller than that of low-strength mortar, which initially was about 20 mm after 360 min (6 h) of absorption process and 40 mm after 2880 min (48 h) crossing the reference value of cover thickness in design and eventually reached about 50 mm after 9600 min. For the high-strength mortar, the water penetrated about 20 mm after 1440 min (24 h). However, water does not penetrate to that much extent afterwards and eventually stays at about 25 mm. Moreover, these displayed behaviors/trends water penetration depth are similar to the results obtained through gravimetric measurements in accordance with ASTM C1585 [21], during water absorption process in cement-based materials i.e., the initially rapid rate of absorption (calculated as the slope of the best-fit regression line for points on the obtained curve up to the first 6 h) and then the slow rate of absorption (calculated as the slope after 48 h), with a transition period between these two stages.
Figure 14 illustrates the relationship between water absorption depth (d), as determined by DICM, and the square root of time (t0.5) for all the test specimens.
In this plot, the slope of the best-fit lines passing through all the points up to 44.5 min0.5 defines the rapid/primary rate of absorption (I1) and beyond this point, defines the slow/secondary rate of absorption (I2) in all strength cases. Like in Figure 15b, I1 and I2 in specimen-1 of low-strength mortar were determined as 0.988 mm/min0.5 and 0.230 mm/min0.5 before and after the deviation point (i.e., 44.5 min0.5) with regression coefficients (R2) of 0.9568 and 0.9043, respectively. Similarly, by adopting the same procedure, the absorption rates (i.e., I1 and I2) in all the test specimens were determined. It shall be noted that in M-0.55-2, the deviation point was at 60.0 min0.5 instead of 44.5 min0.5, as commonly observed for all other cases, which can be attributed to the apparent change in the strains in DICM [39], which may have occurred during the water absorption test.
Table 4 summarizes the primary and secondary rates of absorption for all the mortar specimens determined from Figure 15 with the corresponding regression coefficients (R2). According to [69], R2 > 0.85 indicates an excellent correlation between the fitted parameters. In this study, all the specimens exhibited excellent linear correlations, particularly in the primary rate of absorption, which varied between 0.9560 and 0.9867, resulting in very close values between each specimen of a strength category. In contrast, lower correlation coefficients were observed for I2 which ranged between 0.5776 and 0.9512. As an average of the two specimens in each strength category in the primary rate of absorption, the medium- and high-strength mortars exhibited 30.14% and 59.78% lower initial water absorption rates compared to the low-strength mortars. On the other hand, the secondary rates of absorption corresponded well with the absorption depth with very close values in each specimen except for M-0.55-2, which also confirms that curing of medium and low strength after 78 days did not affect the primary absorption behavior in the mortars.
5. Relationship between water absorption characteristics and the compressive properties of concretes of different strengths
5.1. Relationship between Rate of Water Absorption (I) and the Mechanical Properties
The water absorption rates (I1 and I2) in mortars of different strengths are plotted against their mechanical properties, namely, compressive strength f′cm (blue line) and Young’s modulus Em (red line), as shown in Figure 15a and Figure 15b, respectively. A decreasing trend is observed in these relationships, clearly highlighting that the water absorption in mortars is strongly related to their compressive properties. This highlights that the specimens with higher water absorption rates (e.g., low strength) tend to have lower compressive strength and Young’s modulus. In general, the correlations of both f′cm and Em with the absorption rates depicted the consistent behaviors. However, these differ between the rates of absorption, i.e., primary (Figure 15a) and secondary (Figure 15b), for the same specimens. For instance, the linear relationship of f′cm and I1 in Figure 15a shows a higher decreasing slope of −0.0133 from low-strength to high-strength mortars than that in the case of I2, which was lower as to be -0.005 in Figure 15b. This phenomenon can be attributed to the fact that slow absorption rate (i.e., I2) is more significant in high-strength mortars than in the low- and medium-strength ones owing to the reduced potentials of capillary pores to take more water [10,70].
5.2. Relationship between Maximum Developed Strain along x-axis (i.e., ɛxx) in Fully Saturated Regions and the Mechanical Properties
Figure 16a,b show the relationship between the maximum expansion strain (ɛxx-1) and the mechanical properties, i.e., compressive strength, f′cm, and the Young’s modulus, Em, of mortars after 2160 min and 9600 min of water absorption process, respectively. The expansion strain (ɛxx-1) is defined as the strain obtained by DICM at position-1 of gauges; the x-axis strains in all specimens of low, medium, and high-strength mortars at position-1 are considered because it is deemed that at this point maximum possible expansion due to saturation has occurred in all strength categories. It is examined from Figure 16a,b that the deformability of the mortars during the water absorption process tends to reduce with increased compressive strength, (f′cm) and the Young’s modulus (Em). Similar to the relationship of compressive properties with rate of water absorption (shown in Figure 16), a higher linear correlation is achieved in these relations, which emphasizes a strong dependence of the strain generation on the microstructural condition of the mortars.
Moreover, from Figure 15b and Figure 16b, it is observed that the rate of absorption and the deformability even during slow absorption processes are also directly proportional to each other. Therefore, understanding either of these factors could assist in estimating the likelihood of a potential deterioration process in concrete material.
6. Conclusions
In this study, a one-dimensional water absorption test was conducted on rectangular mortar specimens from three different strengths (categorized as low, medium, and high), and the characteristics, including water absorption depth/rate and the strain generation at the flat surface of the mortar specimens, were evaluated by utilizing DICM. The relationships between these characteristics and the mechanical properties of the same specimen yielded good correlations. The main conclusions can be drawn as follows:
- Water ingress has an instant effect on the volume changes (expansion) in the cement-based materials owing to the hygroscopic nature of the cement hydrates (i.e., the C-S-H). Moreover, the continuous monitoring/evaluation of strains at specimens’ surface during the water absorption process indirectly provides physical evidence of such internal swelling phenomenon in concrete materials during the process of water absorption.
- DICM is an effective method to evaluate the volumetric changes in concrete materials by evaluating the strains at the specimen surfaces during the water absorption process. However, the calculations in DICM are strongly influenced by the changes in the contrast of the image within the saturated regions of the test specimen surfaces and result in pseudo strains. Therefore, applying DICM with water absorption in concrete materials requires their surface to be coated with matte-type spray paints first and then enhanced by speckling to achieve good test results.
- The deformability and the water absorption depth/rate in concrete materials are directly related to each other and depend on their mix compositions. The progression in surface strains measured in DICM provided more reliable evaluations of water ingress rates into the mortars, thereby indicating the closest boundary between primary and secondary liquid water absorption processes. The water absorption depths and the tendencies in expansion strains in saturated parts were different for specimens of three different strengths. However, in all three strengths, the depth (d) vs. square root time (t0.5) curves deviated from a linear relationship after the same time, i.e., 1980 min, resulting in highlighting that the largest strains occur within the primary absorption period, after which strains progress slowly owing to the slow water absorption in the secondary absorption period.
- Concrete materials with lower w/c ratios (high strength) experience lower water absorption rates. On the other hand, mortars with lower strengths will allow more rapid water penetration and other liquids or ions owing to the presence of more pore fractions. Moreover, the primary and secondary absorption rates showed almost linear relationships with mechanical properties such as compressive strength and the Young’s modulus of mortars.
- The volume changes in mortars due to water absorption at the saturated part have a clear relationship with the mechanical properties. The results indicated that the evaluated durability properties related to water permeation not only relate to the water absorption rate but also to the compressive strength, Young’s modulus, and the volume change due to saturation.
- In this study, DICM was employed to determine the water absorption characteristics in ordinary mortar specimens with simply set test arrangements. The test results yielded excellent relationships between mechanical properties and water absorption characteristics, which are good indicators for assessment of the durability in concrete materials. Although some limitations incurred, like out-of-plane bending, can affect the accuracy of the measurements. In the future, the established framework will be extended in various aspects by improving the precision in tackling with the out-of-plane bending and will be involved in the evaluation of absorption characteristics in slices cut from core samples of an existing structure, checking the durability of materials designed/proposed for sustainable constructions and so on.
Author Contributions
Conceptualization, M.U. and H.N.; methodology, M.U. and H.N.; formal analysis, M.U.; investigation, M.U. and H.N.; resources, M.U., H.N. and T.M.; data curation, M.U.; writing—original draft preparation, M.U.; writing—review and editing, H.N., M.S.K. and G.I.; visualization, H.N. and G.I.; supervision, H.N.; project administration, M.U. All authors have read and agreed to the published version of the manuscript.
Funding
Not applicable.
Institutional Review Board Statement
Not applicable.
Informed Consent Statement
Not applicable.
Data Availability Statement
The original contributions presented in the study are included in the article, further inquiries can be directed to the corresponding author.
Acknowledgments
This study was conducted at the concrete laboratory (Laboratory-MRL: http://concrete-lab.civil.nagoya-u.ac.jp/en/index.html), Nagoya University, Japan. M.Usman (1st author) acknowledged the received funding by the Japanese government (Monbukagakusho: MEXT) scholarship.
Conflicts of Interest
The authors declare no conflicts of interest.
References
- P.K. Mehta, P.J.M. Monteiro. Concrete: Microstructure, Properties, Materials. 4th ed. New York: The McGraw-Hill Companies Inc; 2014.
- Castro J, Bentz D, Weiss J. Effect of sample conditioning on the water absorption of concrete. Cem Concr. Compos. 2011;33(8):805–813. [CrossRef]
- Sabir BB, Wild S, O’farrell M. A water sorptivity test for mortar and concrete. Materials and Structures/Matriaux et Constructions. 1998.
- Maltais Y, Samson E, Marchand J. Predicting the durability of Portland cement systems in aggressive environments—Laboratory validation. Cem Concr Res. 2004;34(9):1579–1589. [CrossRef]
- Khanzadeh Moradllo M, Sudbrink B, Ley MT. Determining the effective service life of silane treatments in concrete bridge decks. Constr Build Mater. 2016;116:121–127.
- Mendes A, Sanjayan JG, Gates WP, et al. The influence of water absorption and porosity on the deterioration of cement paste and concrete exposed to elevated temperatures, as in a fire event. Cem Concr Compos. 2012;34(9):1067–1074. [CrossRef]
- Hearn N, Hooton R, Mills R. Pore Structure and Permeability. Significance of Tests and Properties of Concrete and Concrete-Making Mate rials. 100 Barr Harbor Drive, PO Box C700, West Conshohocken, PA 19428-2959: ASTM International; p. 240-240–23.
- Espinosa RM, Franke L. Influence of the age and drying process on pore structure and sorption isotherms of hardened cement paste. Cem Concr Res. 2006;36(10):1969–1984. [CrossRef]
- Krus M, Hansen KK, Kiinzel HM. Porosity and liquid absorption of cement paste. Materials and Structures/Mat~riaux et Constructions.
- Hanžič L, Ilić R. Relationship between liquid sorptivity and capillarity in concrete. Cem Concr Res. 2003;33(9):1385–1388. [CrossRef]
- Norman R. Physics and Thermodynamics of Capillary. Ind Eng Chem. 1970;62(6):32–56.
- Hong S, Yao W, Guo B, et al. Water distribution characteristics in cement paste with capillary absorption. Constr Build Mater. 2020;240. [CrossRef]
- Hall C. Water sorptivity of mortars and concretes: a review. 1989. [CrossRef]
- Martys NS, Ferraris CF. Capillary transport in mortars and concrete. Cement and concrete research. 1997 gg1;27(5):747-60. [CrossRef]
- Hall C. Anomalous diffusion in unsaturated flow: Fact or fiction? Cem Concr Res. 2007. p. 378–385.
- Zhang SP, Zong L. Evaluation of Relationship between Water Absorption and Durability of Concrete Materials. Advances in Materials Science and Engineering. 2014;2014:1–8. [CrossRef]
- Zheng F, Hong S, Hou D, et al. Rapid visualization and quantification of water penetration into cement paste through cracks with X-ray imaging. Cem Concr Compos. 2022;125. [CrossRef]
- Dias WPS. Reduction of concrete sorptivity with age through carbonation. [CrossRef]
- Khanzadeh Moradllo M, Ley MT. Quantitative measurement of the influence of degree of saturation on ion penetration in cement paste by using X-ray imaging. Constr Build Mater. 2017;141:113–129.
- Henkensiefken R, Castro J, Bentz D, et al. Water absorption in internally cured mortar made with water-filled lightweight aggregate. Cem Concr Res. 2009;39(10):883–892. [CrossRef]
- ASTM C1585. Test Method for Measurement of Rate of Absorption of Water by Hydraulic-Cement Concretes. West Conshohocken, PA: ASTM International; 2020. Available from: http://www.astm.org/cgi-bin/resolver.cgi?C1585-20.
- Zhutovsky S, Douglas Hooton R. Role of sample conditioning in water absorption tests. Constr Build Mater. 2019;215:918–924. [CrossRef]
- Van Belleghem B, Montoya R, Dewanckele J, et al. Capillary water absorption in cracked and uncracked mortar—A comparison between experimental study and finite element analysis. Constr Build Mater. 2016;110:154–162. [CrossRef]
- Alderete NM, Villagrán Zaccardi YA, De Belie N. Physical evidence of swelling as the cause of anomalous capillary water uptake by cementitious materials. Cem Concr Res. 2019;120:256–266. [CrossRef]
- L. Tang NL-O, P.A.M. Basheer. Resistance of Concrete to Chloride Ingress: Testing and Modelling. London and New York: CRC Press; 2012.
- Fries N, Dreyer M. An analytic solution of capillary rise restrained by gravity. J Colloid Interface Sci. 2008;320(1):259–263. [CrossRef]
- Muller ACA, Scrivener KL, Gajewicz AM, et al. Use of bench-top NMR to measure the density, composition and desorption isotherm of C-S-H in cement paste. Microporous and Mesoporous Materials. 2013;178:99–103.
- Huang L, Tang L, Dong Z, et al. Effect of curing regimes on composition and microstructure of blended pastes: Insight into later-age hydration mechanism. Cem Concr Res. 2025;189:107785. [CrossRef]
- Wyrzykowski M, McDonald PJ, Scrivener KL, et al. Water Redistribution within the Microstructure of Cementitious Materials due to Temperature Changes Studied with 1H NMR. Journal of Physical Chemistry C. 2017;121(50):27950–27962. [CrossRef]
- Rymarczyk T. New methods to determine moisture areas by electrical impedance tomography. International Journal of Applied Electromagnetics and Mechanics. 2016;52(1–2):79–87. [CrossRef]
- Smyl D, Rashetnia R, Seppänen A, et al. Can Electrical Resistance Tomography be used for imaging unsaturated moisture flow in cement-based materials with discrete cracks? Cem Concr Res. 2017;91:61–72.
- Dong B, Gu Z, Qiu Q, et al. Electrochemical feature for chloride ion transportation in fly ash blended cementitious materials. Constr Build Mater. 2018;161:577–586. [CrossRef]
- Bigger R, Blaysat B, Boo C, et al. A Good Practices Guide for Digital Image Correlation [Internet]. Jones E, Iadicola M, editors. 2018. Available from: http://idics.org/guide/.
- Oats RC, Dai Q, Head M. Digital Image Correlation Advances in Structural Evaluation Applications: A Review. Practice Periodical on Structural Design and Construction. 2022;27(4). [CrossRef]
- Bogusz P, Krasoń W, Pazur K. Application of Digital Image Correlation for Strain Mapping of Structural Elements and Materials. Materials. 2024;17(11). [CrossRef]
- Mousa MA, Yussof MM, Hussein TS, et al. A Digital Image Correlation Technique for Laboratory Structural Tests and Applications: A Systematic Literature Review. Sensors. Multidisciplinary Digital Publishing Institute (MDPI); 2023. [CrossRef]
- Pan B, Qian K, Xie H, et al. Two-dimensional digital image correlation for in-plane displacement and strain measurement: A review. Meas Sci Technol. 2009;20(6). [CrossRef]
- Khoo SW, Karuppanan S, Tan CS. A review of surface deformation and strain measurement using two-dimensional digital image correlation. Metrology and Measurement Systems. Polish ACAD Sciences Committee Metrology and Res Equipment; 2016. p. 461–480. [CrossRef]
- Pan B, Qian K, Xie H, et al. Two-dimensional digital image correlation for in-plane displacement and strain measurement: A review. Meas Sci Technol. 2009;20(6). [CrossRef]
- Peters WH, Ranson WF. Digital imaging techniques in experimental stress analysis [Internet]. 1982. Available from: http://spiedl.org/terms.
- Pan B, Li K. A fast digital image correlation method for deformation measurement. Opt Lasers Eng. 2011;49(7):841–847. [CrossRef]
- Zhong FQ, Indurkar PP, Quan CG. Three-dimensional digital image correlation with improved efficiency and accuracy. Measurement (Lond). 2018;128:23–33. [CrossRef]
- Huang Y, He X, Wang Q, et al. Deformation field and crack analyses of concrete using digital image correlation method. Frontiers of Structural and Civil Engineering. 2019;13(5):1183–1199. [CrossRef]
- Huang Y, He X, Wang Q, et al. Deformation field and crack analyses of concrete using digital image correlation method. Frontiers of Structural and Civil Engineering. 2019;13(5):1183–1199. [CrossRef]
- Yudan Jiang, Zuquan Jin, Tiejun Zhao, et al. Strain Field of Reinforced Concrete under Accelerated Corrosion by Digital Image Correlation Technique. Journal of Adv Conc Tech. 2017;15:290–299. [CrossRef]
- Bertelsen IMG, Kragh C, Cardinaud G, et al. Quantification of plastic shrinkage cracking in mortars using digital image correlation. Cem Concr Res. 2019;123. [CrossRef]
- Dzaye ED, Tsangouri E, Spiessens K, et al. Digital image correlation (DIC) on fresh cement mortar to quantify settlement and shrinkage. Archives of Civil and Mechanical Engineering. 2019;19(1):205–214. [CrossRef]
- Ogawa Keigo, Hashimoto Chihiro, Go Igarashi, et al. Time-dependent strain distribution of mortar in concrete during water uptake monitored by digital image correlation method. Cement Science and Concrete Technology. 2023;77(1):222–230.
- M.Usman, H.Nakamura, T.Miura. Application of Digital Image Correlation (DIC) Method to Evaluate the Water Absorption in Different Qualities of Concrete. In: R. Henry, A. Palermo, editors. fib Symposium 2024 11-13 November 2024, New Zealand. Christchurch; 2024. p. 1105–1114.
- Reu P. All about speckles: Contrast. Exp Tech. 2015;39(1):1–2.
- Pan B, Xie H, Wang Z. Equivalence of digital image correlation criteria for pattern matching. 2010. [CrossRef]
- Basheer L, Cleland DJ. Durability and water absorption properties of surface treated concretes. Mater Struct. 2011;44(5):957–967. [CrossRef]
- Baghabra Al-Amoudi OS, Al-Kutti WA, Ahmad S, et al. Correlation between compressive strength and certain durability indices of plain and blended cement concretes. Cem Concr Compos.2009;31(9):672–676. [CrossRef]
- Zhuang S, Wang Q, Zhang M. Water absorption behaviour of concrete: Novel experimental findings and model characterization. Journal of Building Engineering. 2022;53. [CrossRef]
- Snoeck D, Velasco LF, Mignon A, et al. The influence of different drying techniques on the water sorption properties of cement-based materials. Cem Concr Res. 2014;64:54–62. [CrossRef]
- Wu Z, Wong HS, Buenfeld NR. Influence of drying-induced microcracking and related size effects on mass transport properties of concrete. Cem Concr Res. 2015;68:35–48. [CrossRef]
- Beaudoin JJ, Tamtsia BT. Effect of Drying Methods on Microstructural Changes in Hardened Cement Paste: an A. C. Impedance Spectroscopy Evaluation. Journal of Advanced Concrete Technology. 2004;2(1):113-20. [CrossRef]
- Szalai S, Fehér V, Kurhan D, et al. Optimization of Surface Cleaning and Painting Methods for DIC Measurements on Automotive and Railway Aluminum Materials. Infrastructures (Basel). 2023;8 (2):27. [CrossRef]
- Miura T, Sato K, Nakamura H. The role of microcracking on the compressive strength and stiffness of cracked concrete with different crack widths and angles evaluated by DIC. Cem Concr Compos. 2020;114:103768. [CrossRef]
- Schreier H, Orteu J-J, Sutton MA. Image Correlation for Shape, Motion and Deformation Measurements. Boston, MA: Springer US; 2009. [CrossRef]
- Sutton MA, Turner JL, Bruck HA, et al. Full.field Representation of Discretely Sampled Surface Deformation for Displacement and Strain Analysis. 1991 (6);31:168-77. [CrossRef]
- Igarashi GO, Maruyama Ippei. A pilot study on a microscopic technique for observing the swelling behaviour of mortar during re-absorption of water. Annual conference of JSCE (in Japanese). 2023. p. 602.
- Zheng F, Jiang R, Dong B, et al. Visualization and quantification of water penetration in cement pastes with different crack sizes. Constr Build Mater. 2022;341. [CrossRef]
- Reu PL. A Realistic Error Budget for Two Dimension Digital Image Correlation.
- Dong YL, Pan B. A Review of Speckle Pattern Fabrication and Assessment for Digital Image Correlation. Exp Mech. 2017;57(8):1161–1181. [CrossRef]
- Hong S, Yao W, Guo B, et al. Water distribution characteristics in cement paste with capillary absorption. Constr Build Mater. 2020; (4);240:117767. [CrossRef]
- Kelham S. A water absorption test for concrete. Magazine of Concrete Research. 1988 Jun;40(143):106-10. [CrossRef]
- ACI committee 318. Building Code Requirements for Structural Concrete. USA: American Concrete Institute; 2019.
- Montgomery DC, Elizabeth A. Peck, G. Geoffrey Vining. Introduction to linear regression analysis. 6th ed. New York: John Wiley & Sons; 2021.
- Taylor SC, Hoff WD, Wilson MA, et al. Anomalous water transport properties of Portland and blended cement-based materials. [CrossRef]
| 1 | Designations will be used in plots, M (Mortar) – W/C ratio – specimen number |
| 2 | Properties will be used for correlation with water absorption characteristics |
Figure 1.
Flat surface (xy-plane with nominal dimensions) of the test specimen showing white-painted (P) and Un-Painted (NP) halves and the positioning of surface strain gauges with respect to water penetration direction.
Figure 1.
Flat surface (xy-plane with nominal dimensions) of the test specimen showing white-painted (P) and Un-Painted (NP) halves and the positioning of surface strain gauges with respect to water penetration direction.

Figure 2.
Specimen preparation for DICM with one dimensional water absorption test.
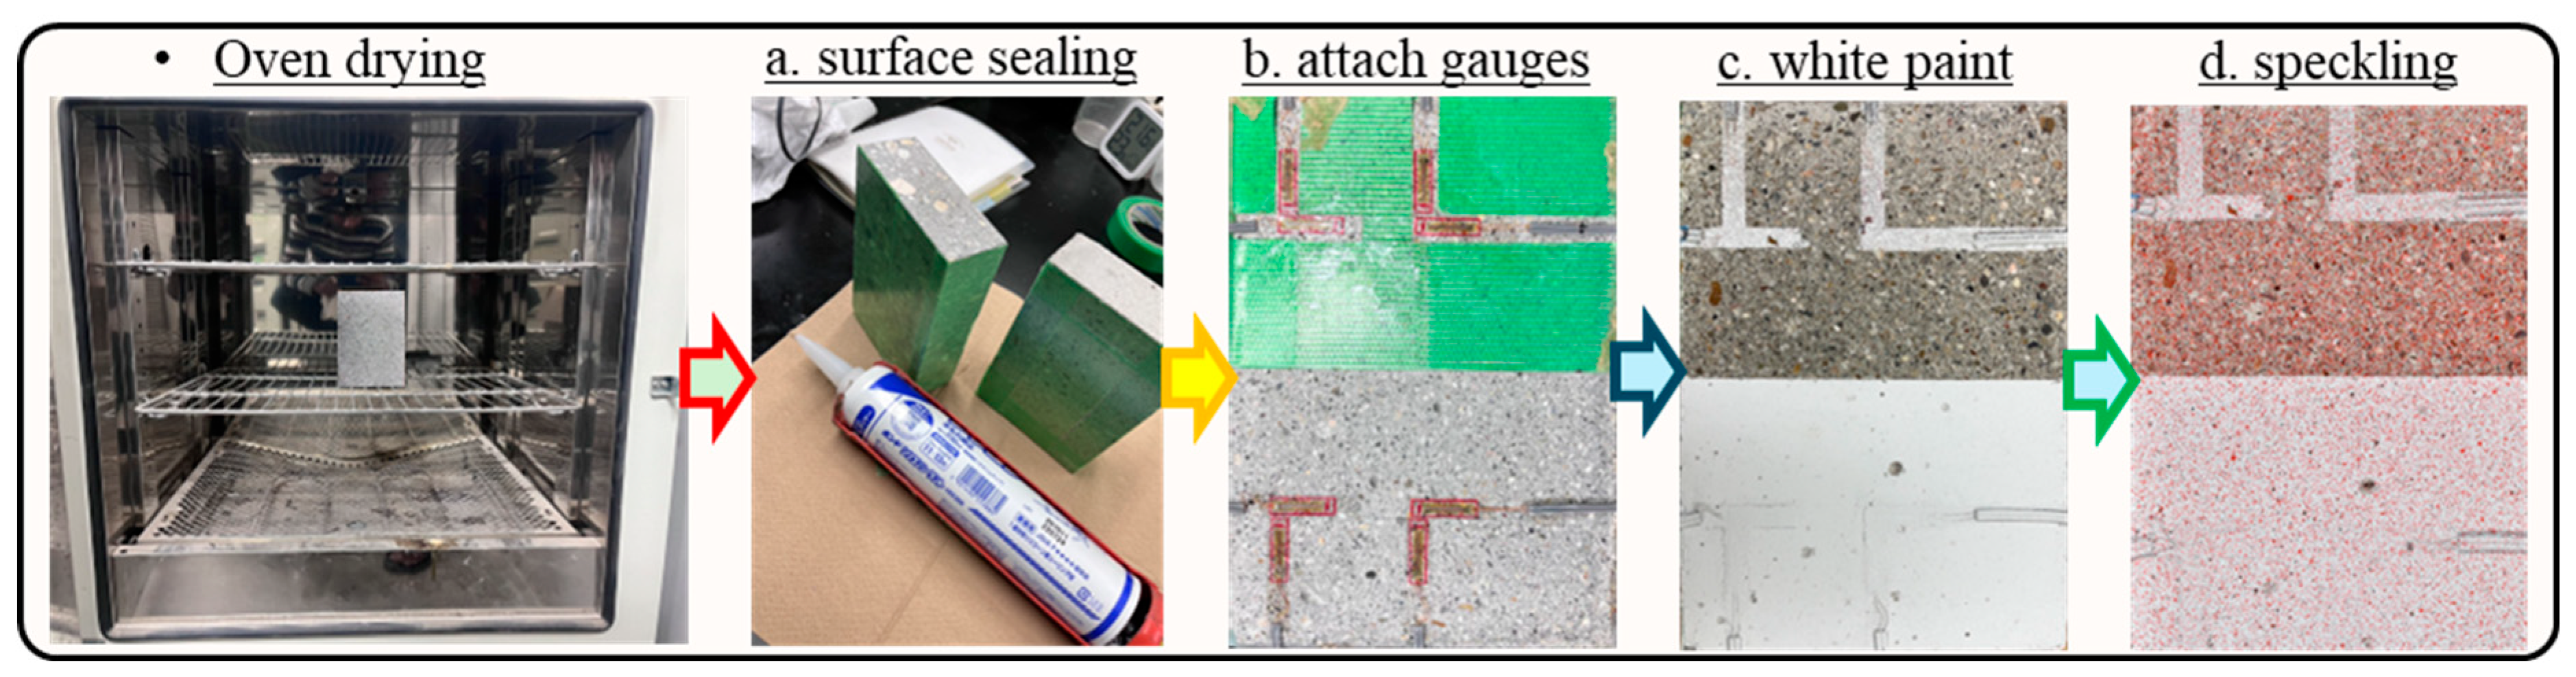
Figure 3.
Setup for one-dimensional water test and DICM adopted in this study.
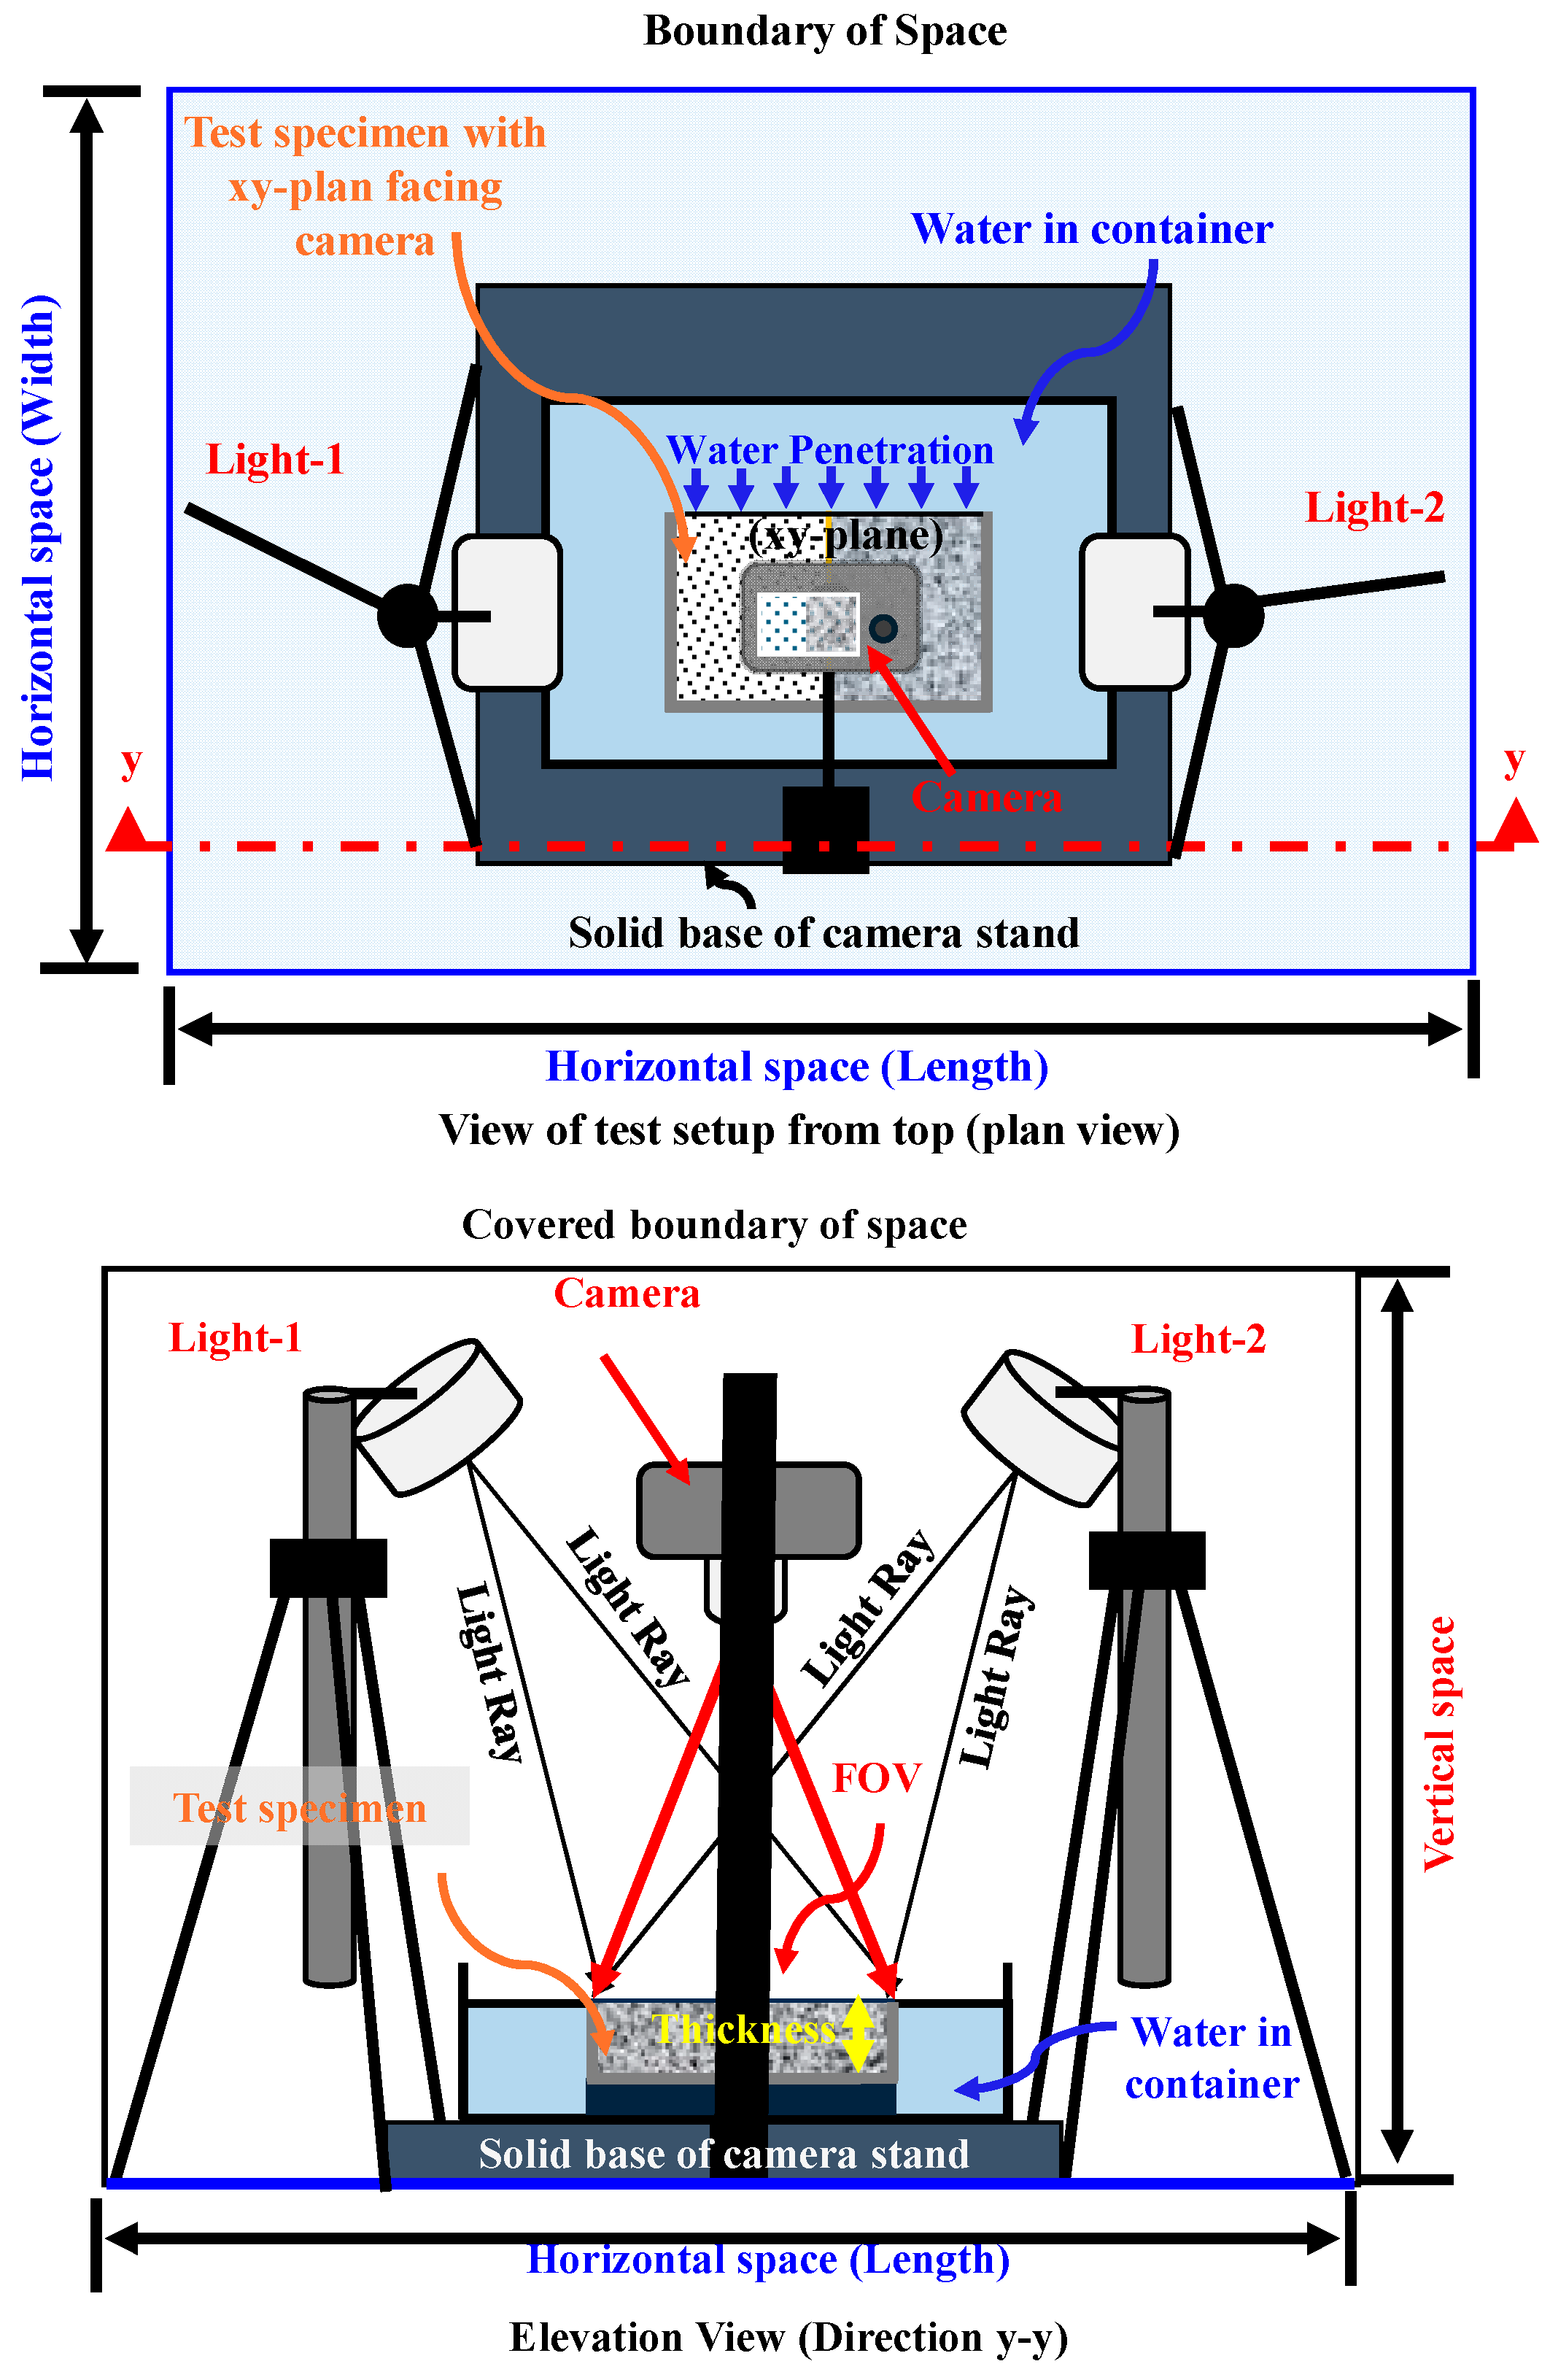
Figure 4.
Development of surface strains measured as average of gauges applied on P and NP side at respective position and in x/y directions in (a). low: w/c = 0.65; (b). medium: w/c = 0.55; and (c). high: w/c = 0.30, strength mortars.
Figure 4.
Development of surface strains measured as average of gauges applied on P and NP side at respective position and in x/y directions in (a). low: w/c = 0.65; (b). medium: w/c = 0.55; and (c). high: w/c = 0.30, strength mortars.
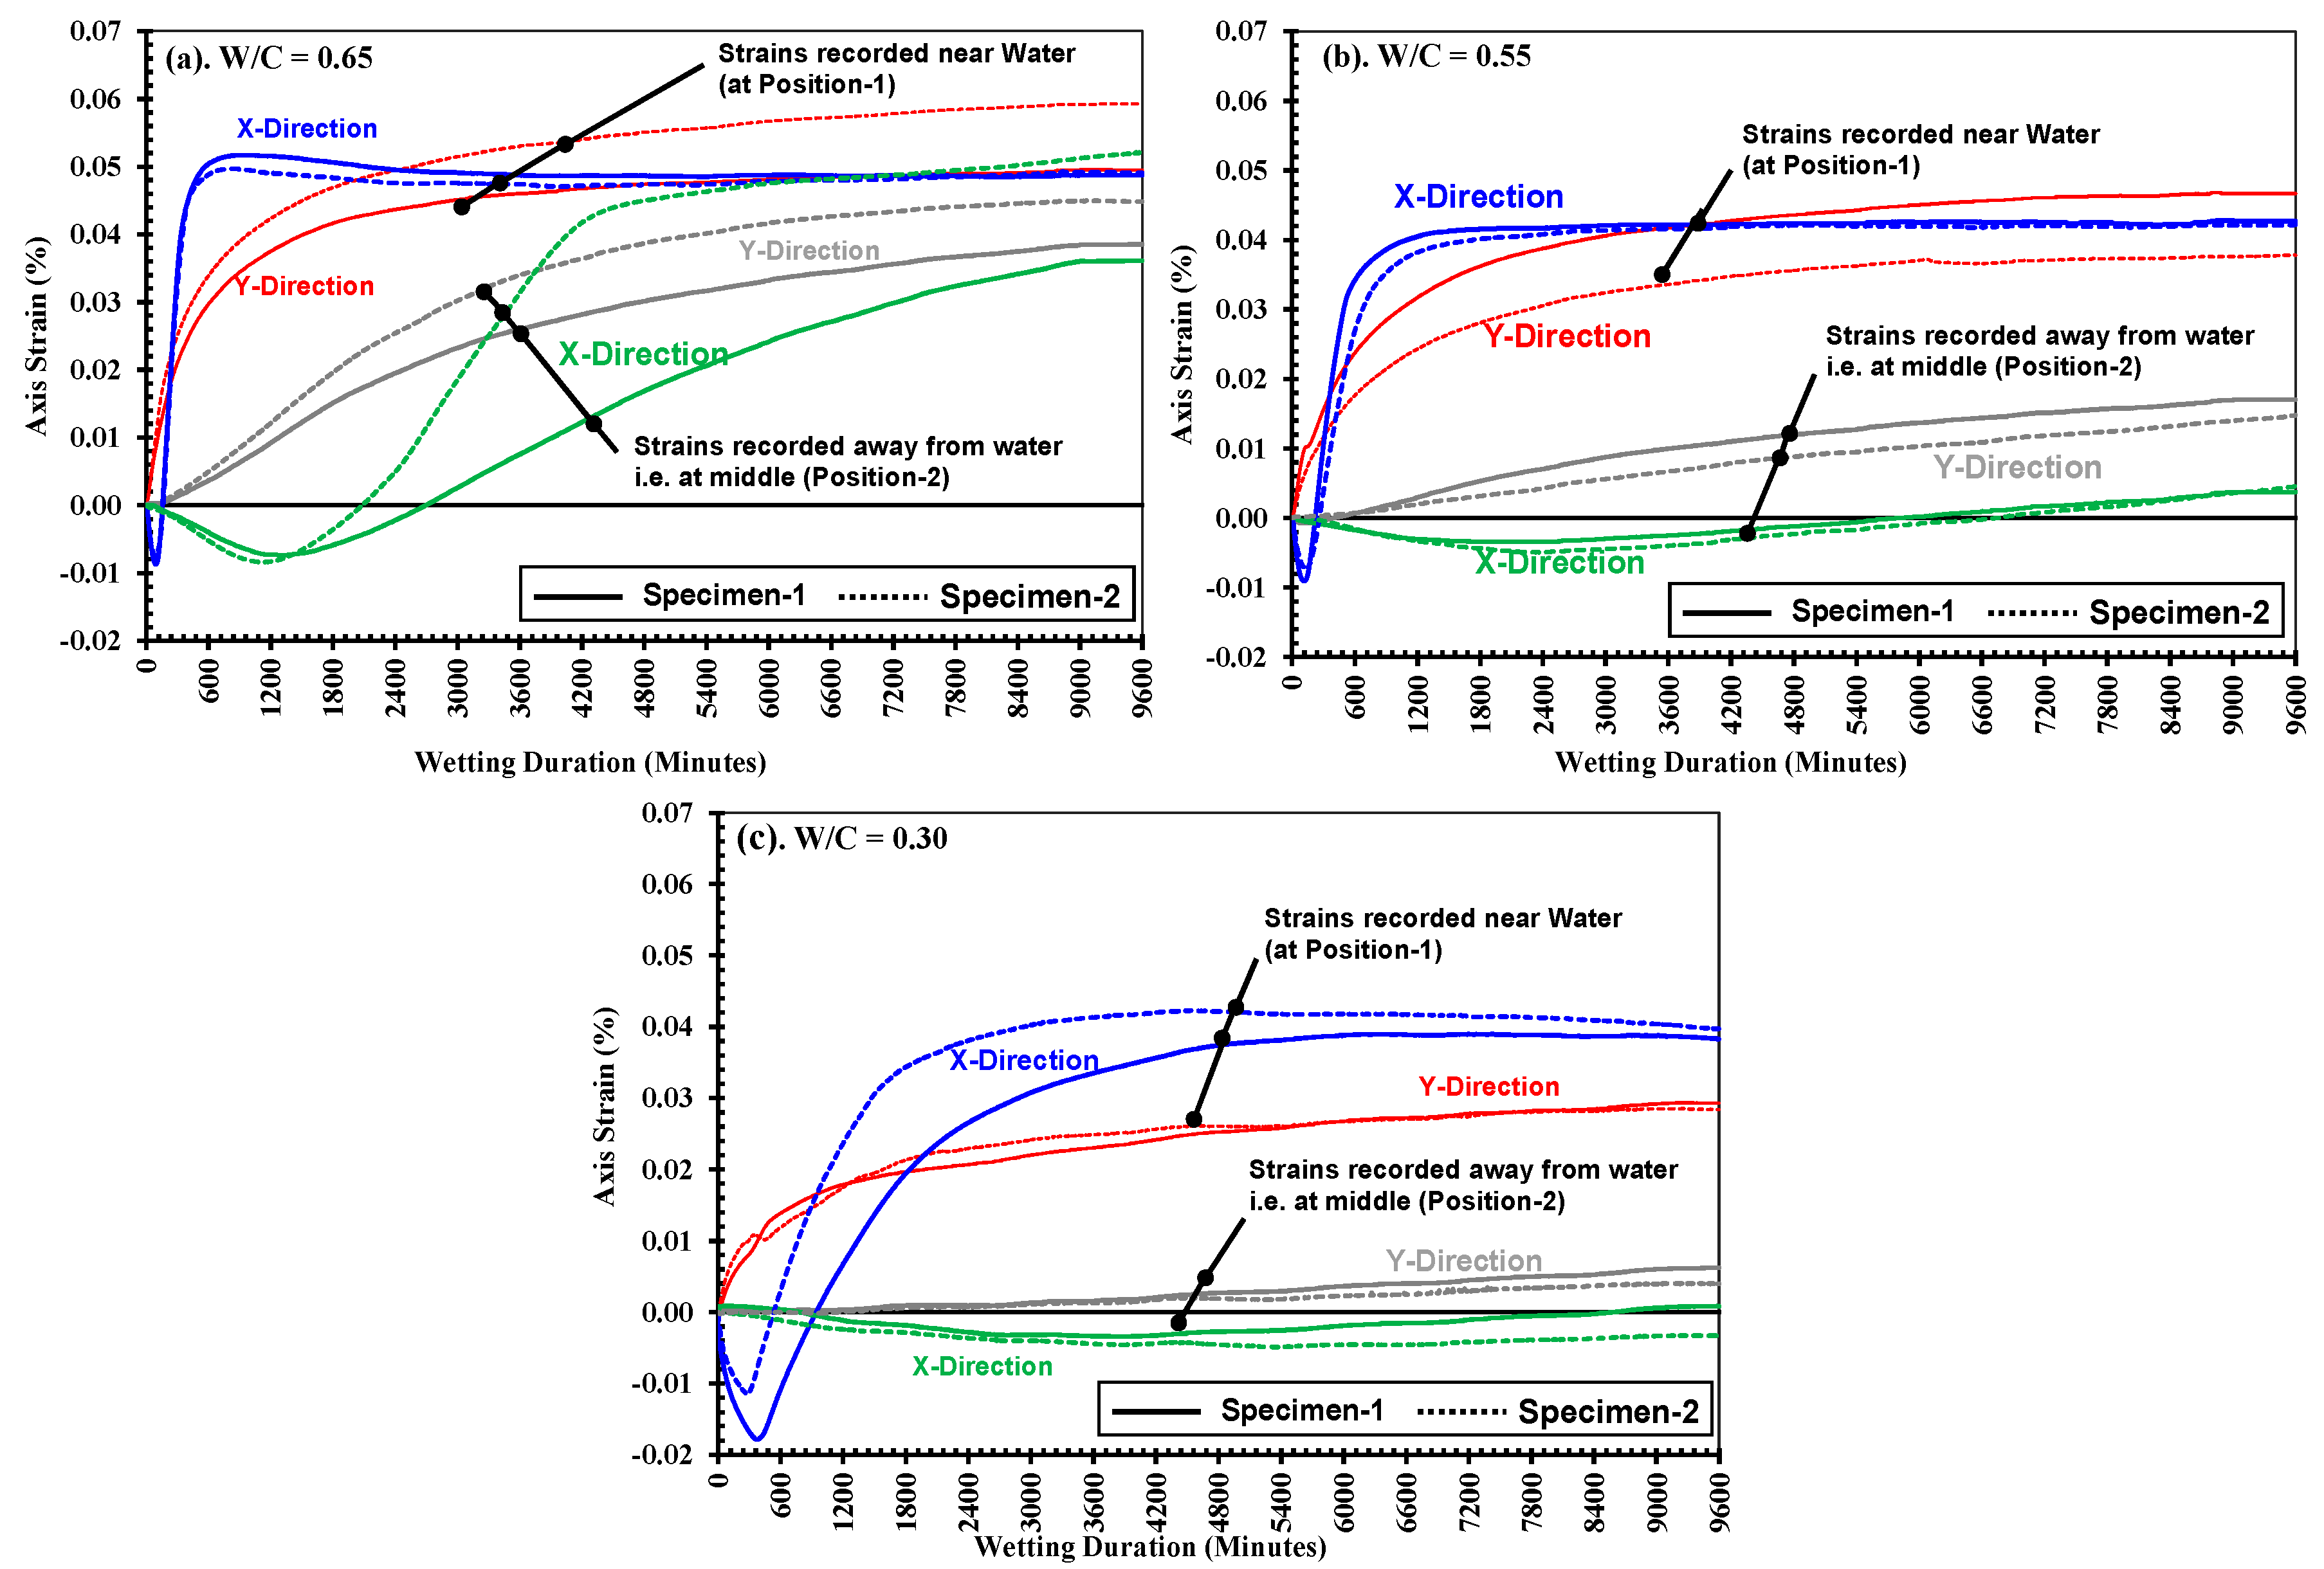
Figure 5.
Variations in grey scale along the width of the specimen differentiating the saturated and unsaturated parts on the Un- Painted (NP) side in low strength mortars (w/c = 0.65) for various times of water absorption.
Figure 5.
Variations in grey scale along the width of the specimen differentiating the saturated and unsaturated parts on the Un- Painted (NP) side in low strength mortars (w/c = 0.65) for various times of water absorption.
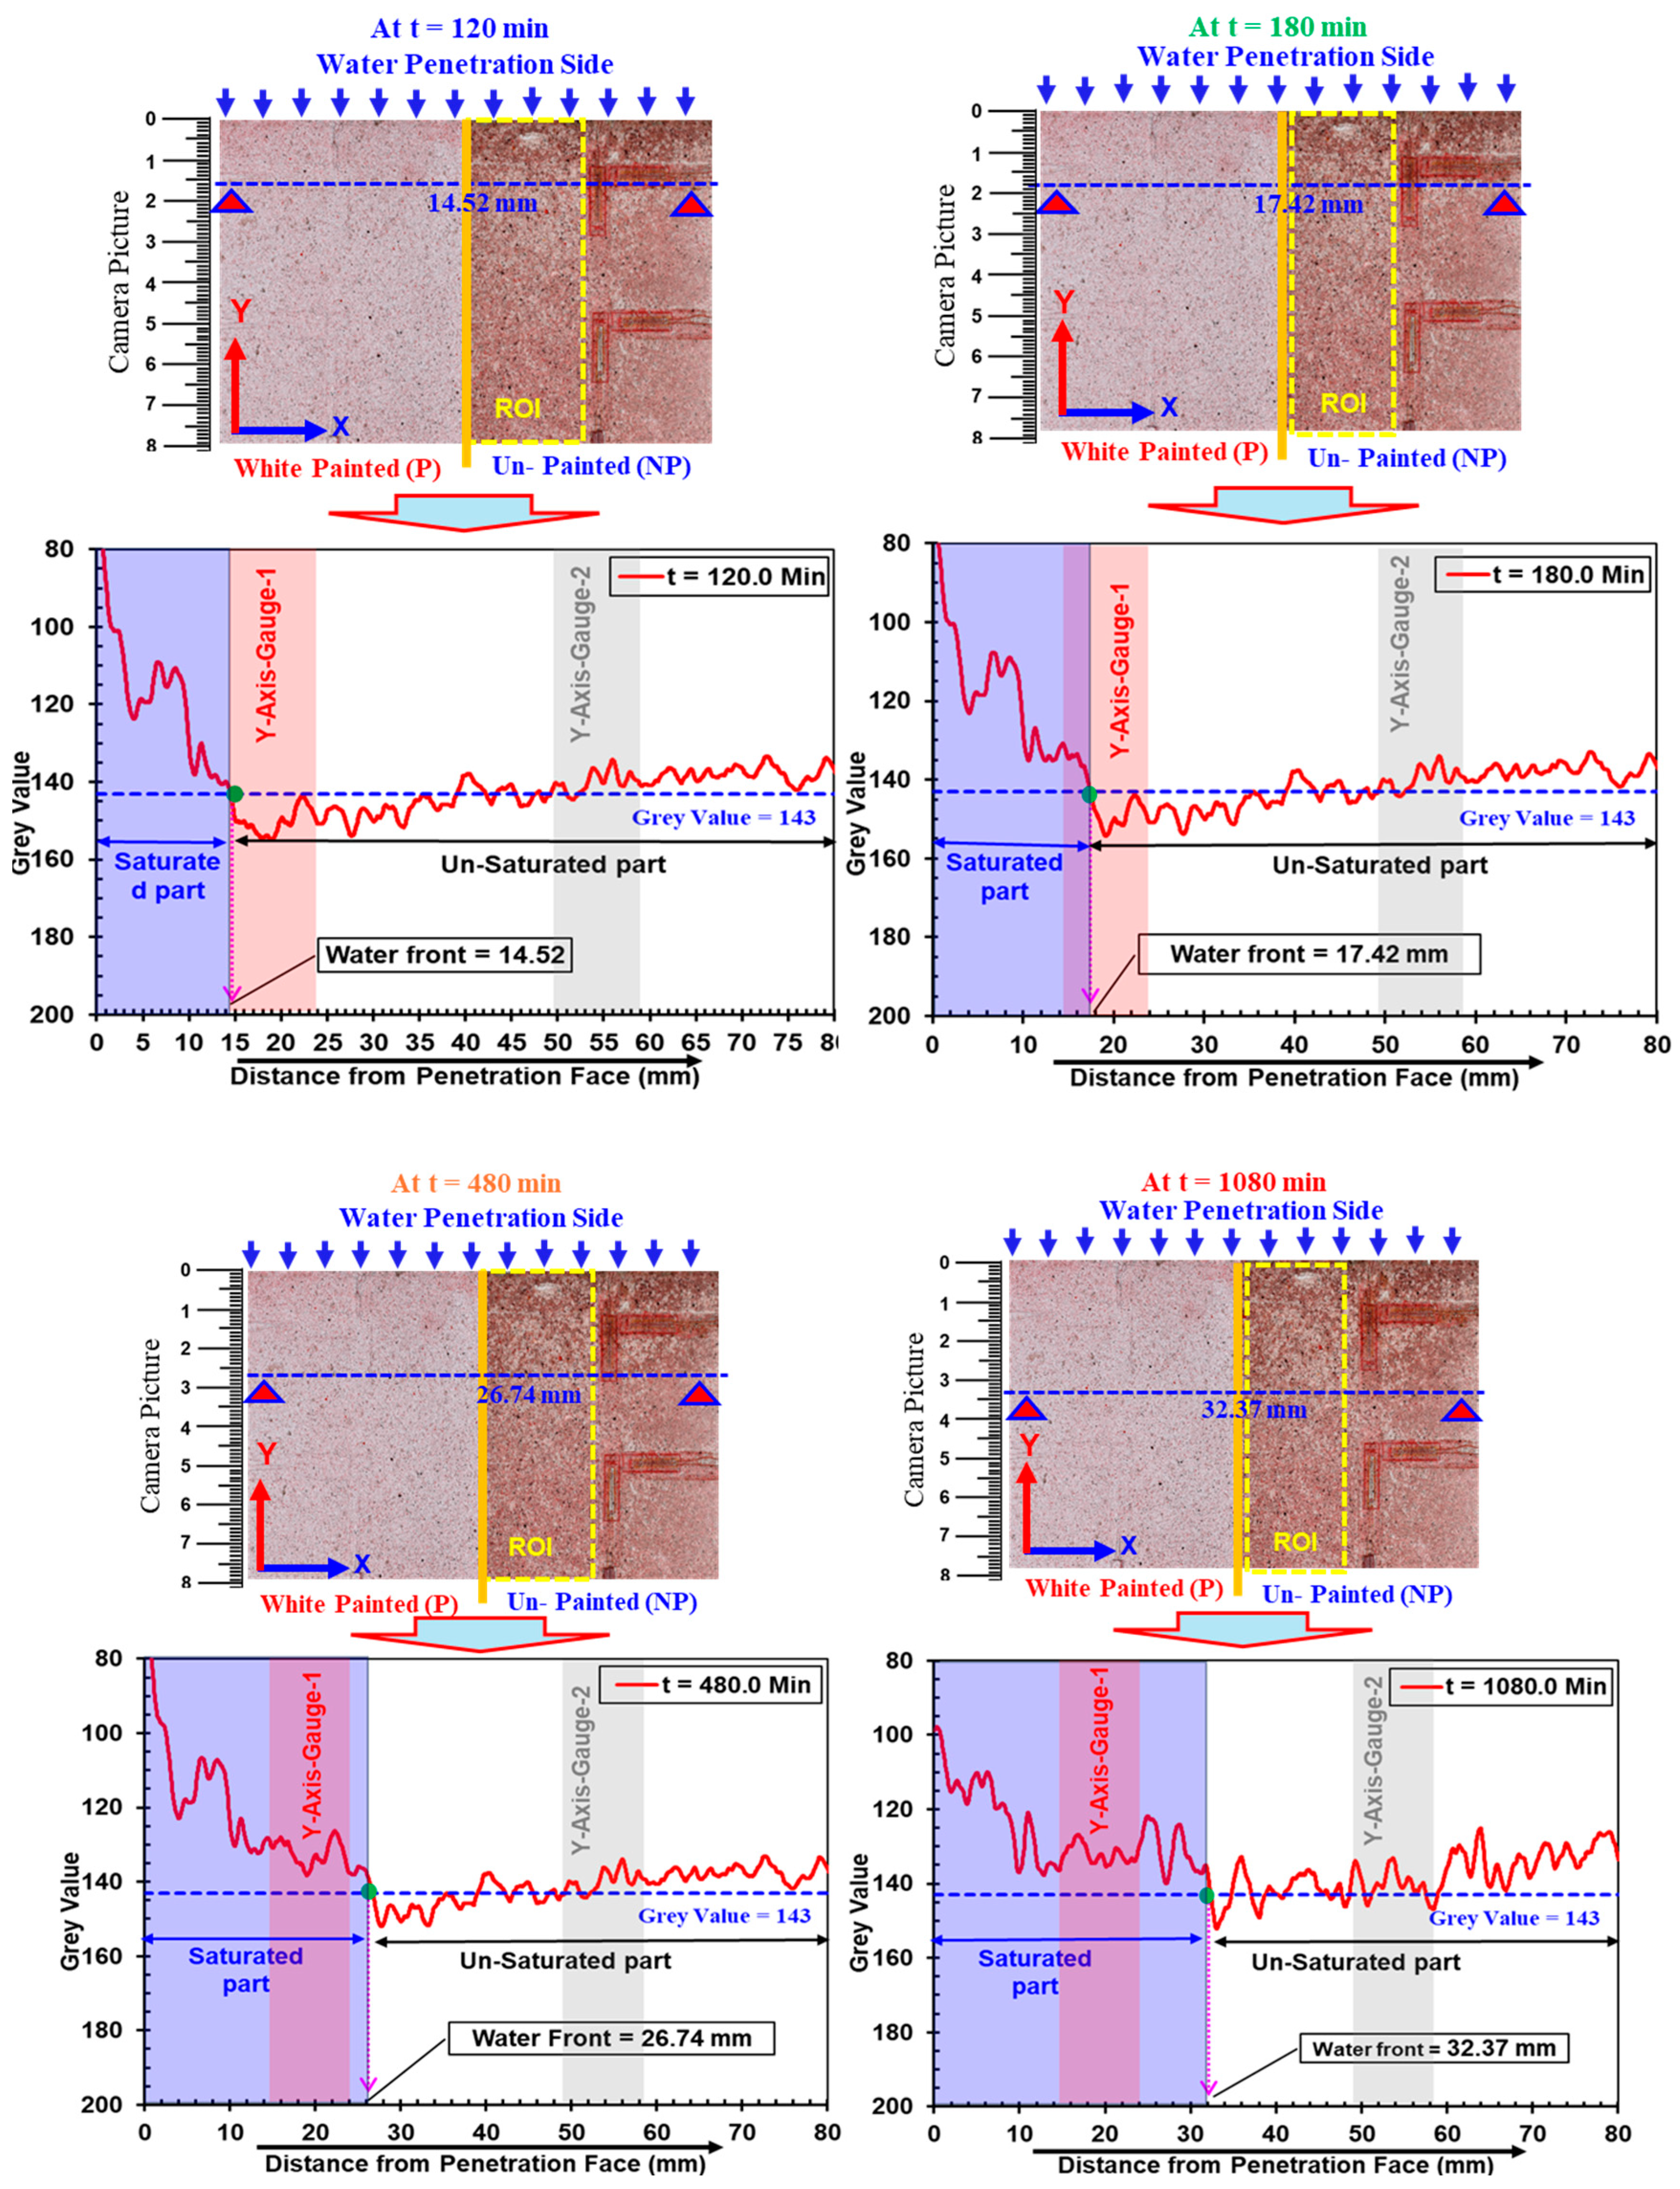
Figure 6.
Schematic representation of volumetric changes resulted from water absorption in mortar specimens.
Figure 6.
Schematic representation of volumetric changes resulted from water absorption in mortar specimens.
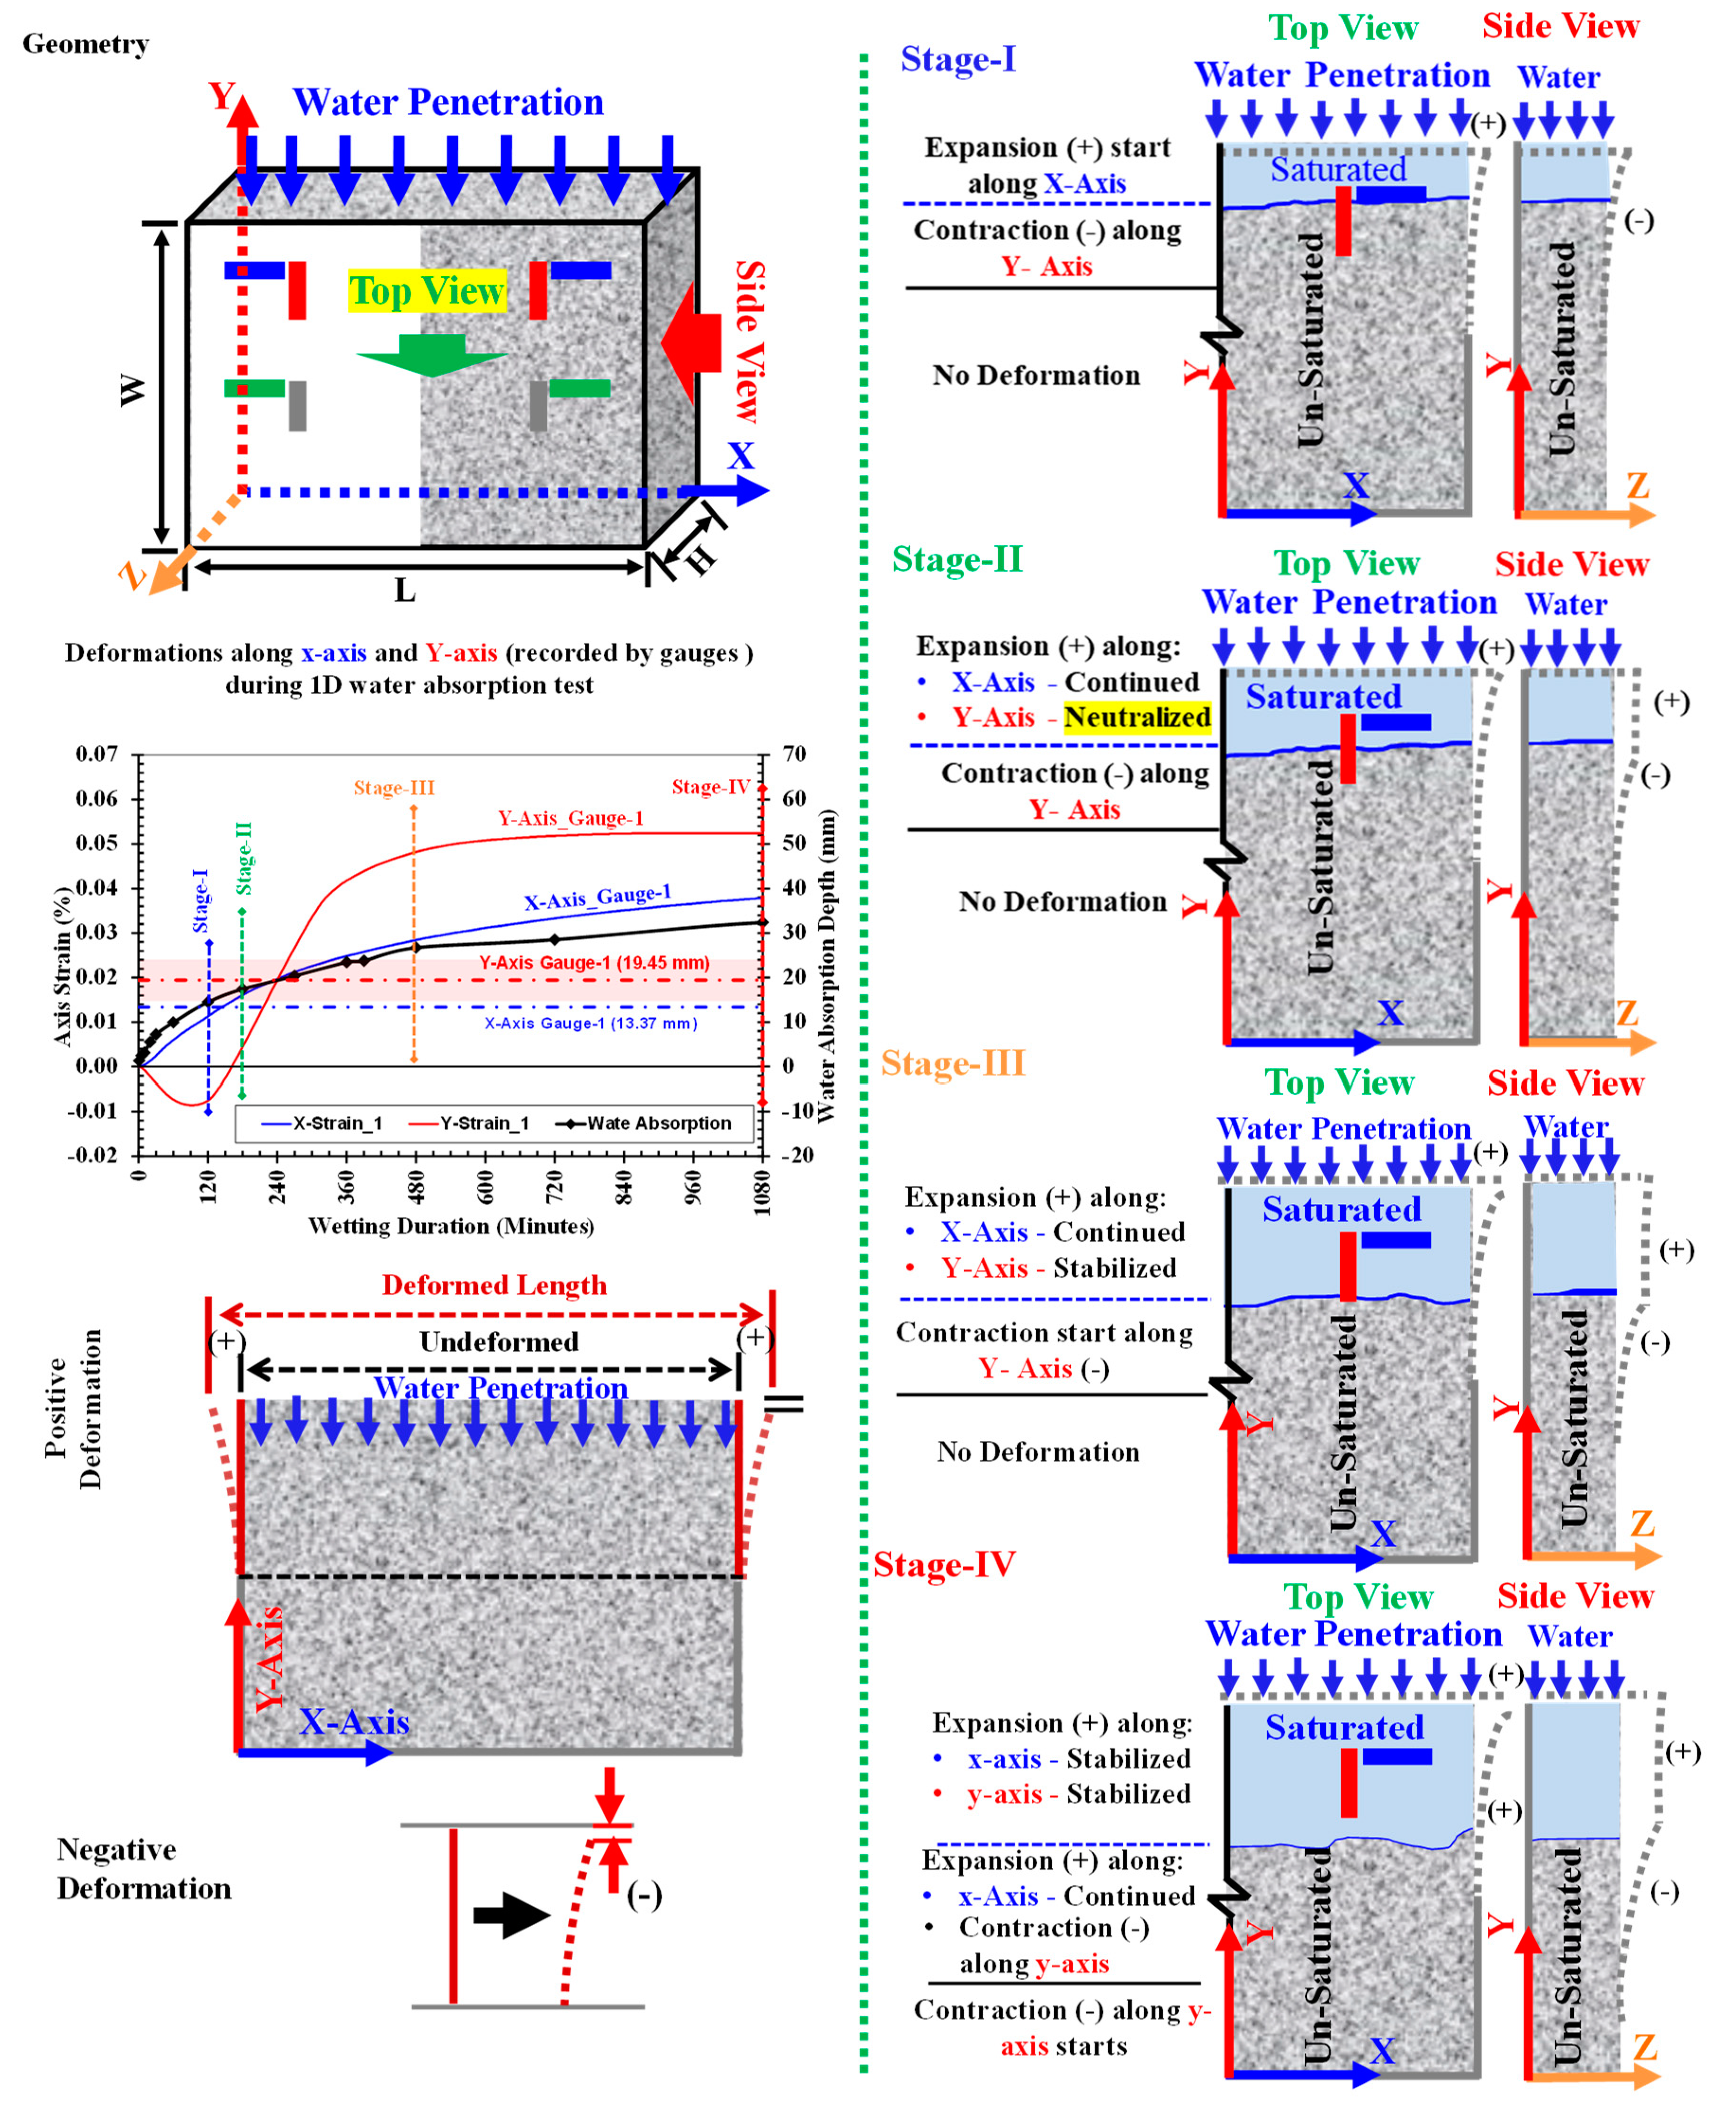
Figure 7.
Plots of x-axis strain variations in low strength mortars (w/c: 0.65) on painted and un-painted side, at position-1 and 2 with increasing wetting durations (a) left: Strains recorded by gauges in x-axis; right: Illustration of reference lines along x-axis at which strains are plotted, (b) X-axis strain distribution in DICM along line-1 and 2 after 120 min, 480 min and 1440 min of water absorption.
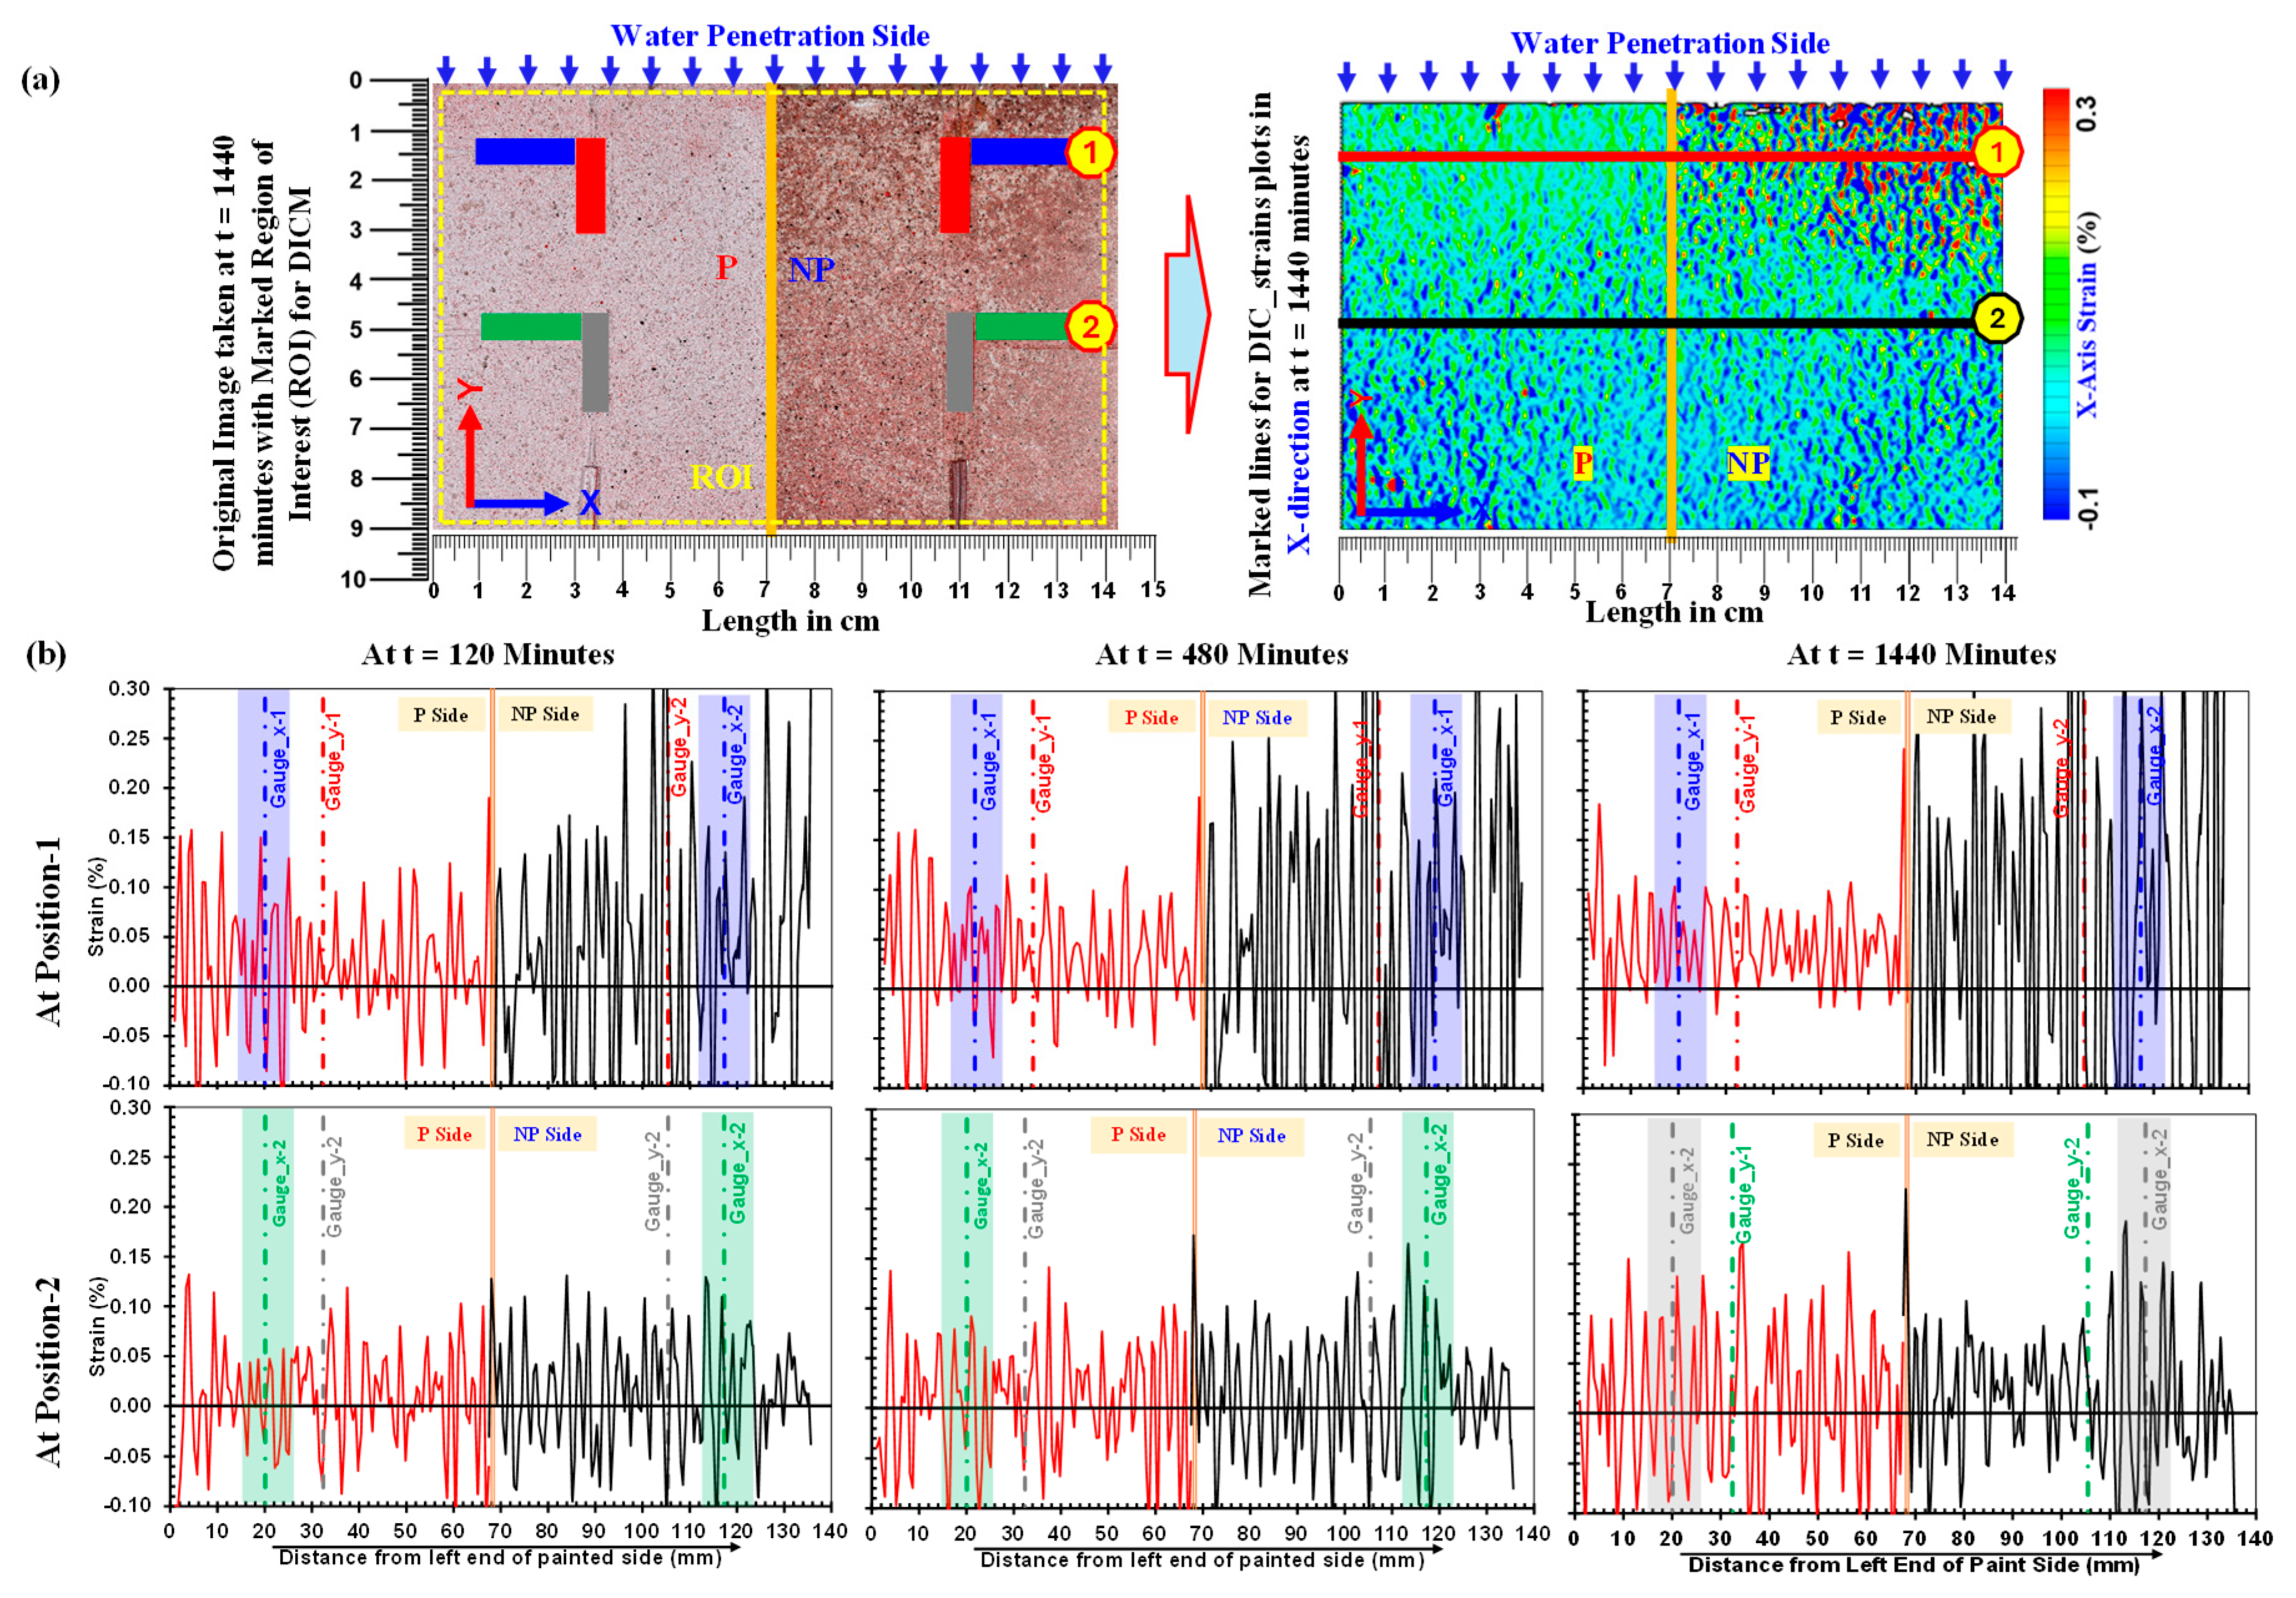
Figure 8.
Plots of y-axis strain variations in low strength mortars (w/c: 0.65) on paint and No paint side, at position-1 and position-2 with increasing wetting durations (a) Illustration of reference lines along y-axis at which y-axis strains are plotted, (b). y-axis strain distribution in DICM along y-axis at P and NP side after 120 min, 480 min and 1440 min of water absorption.
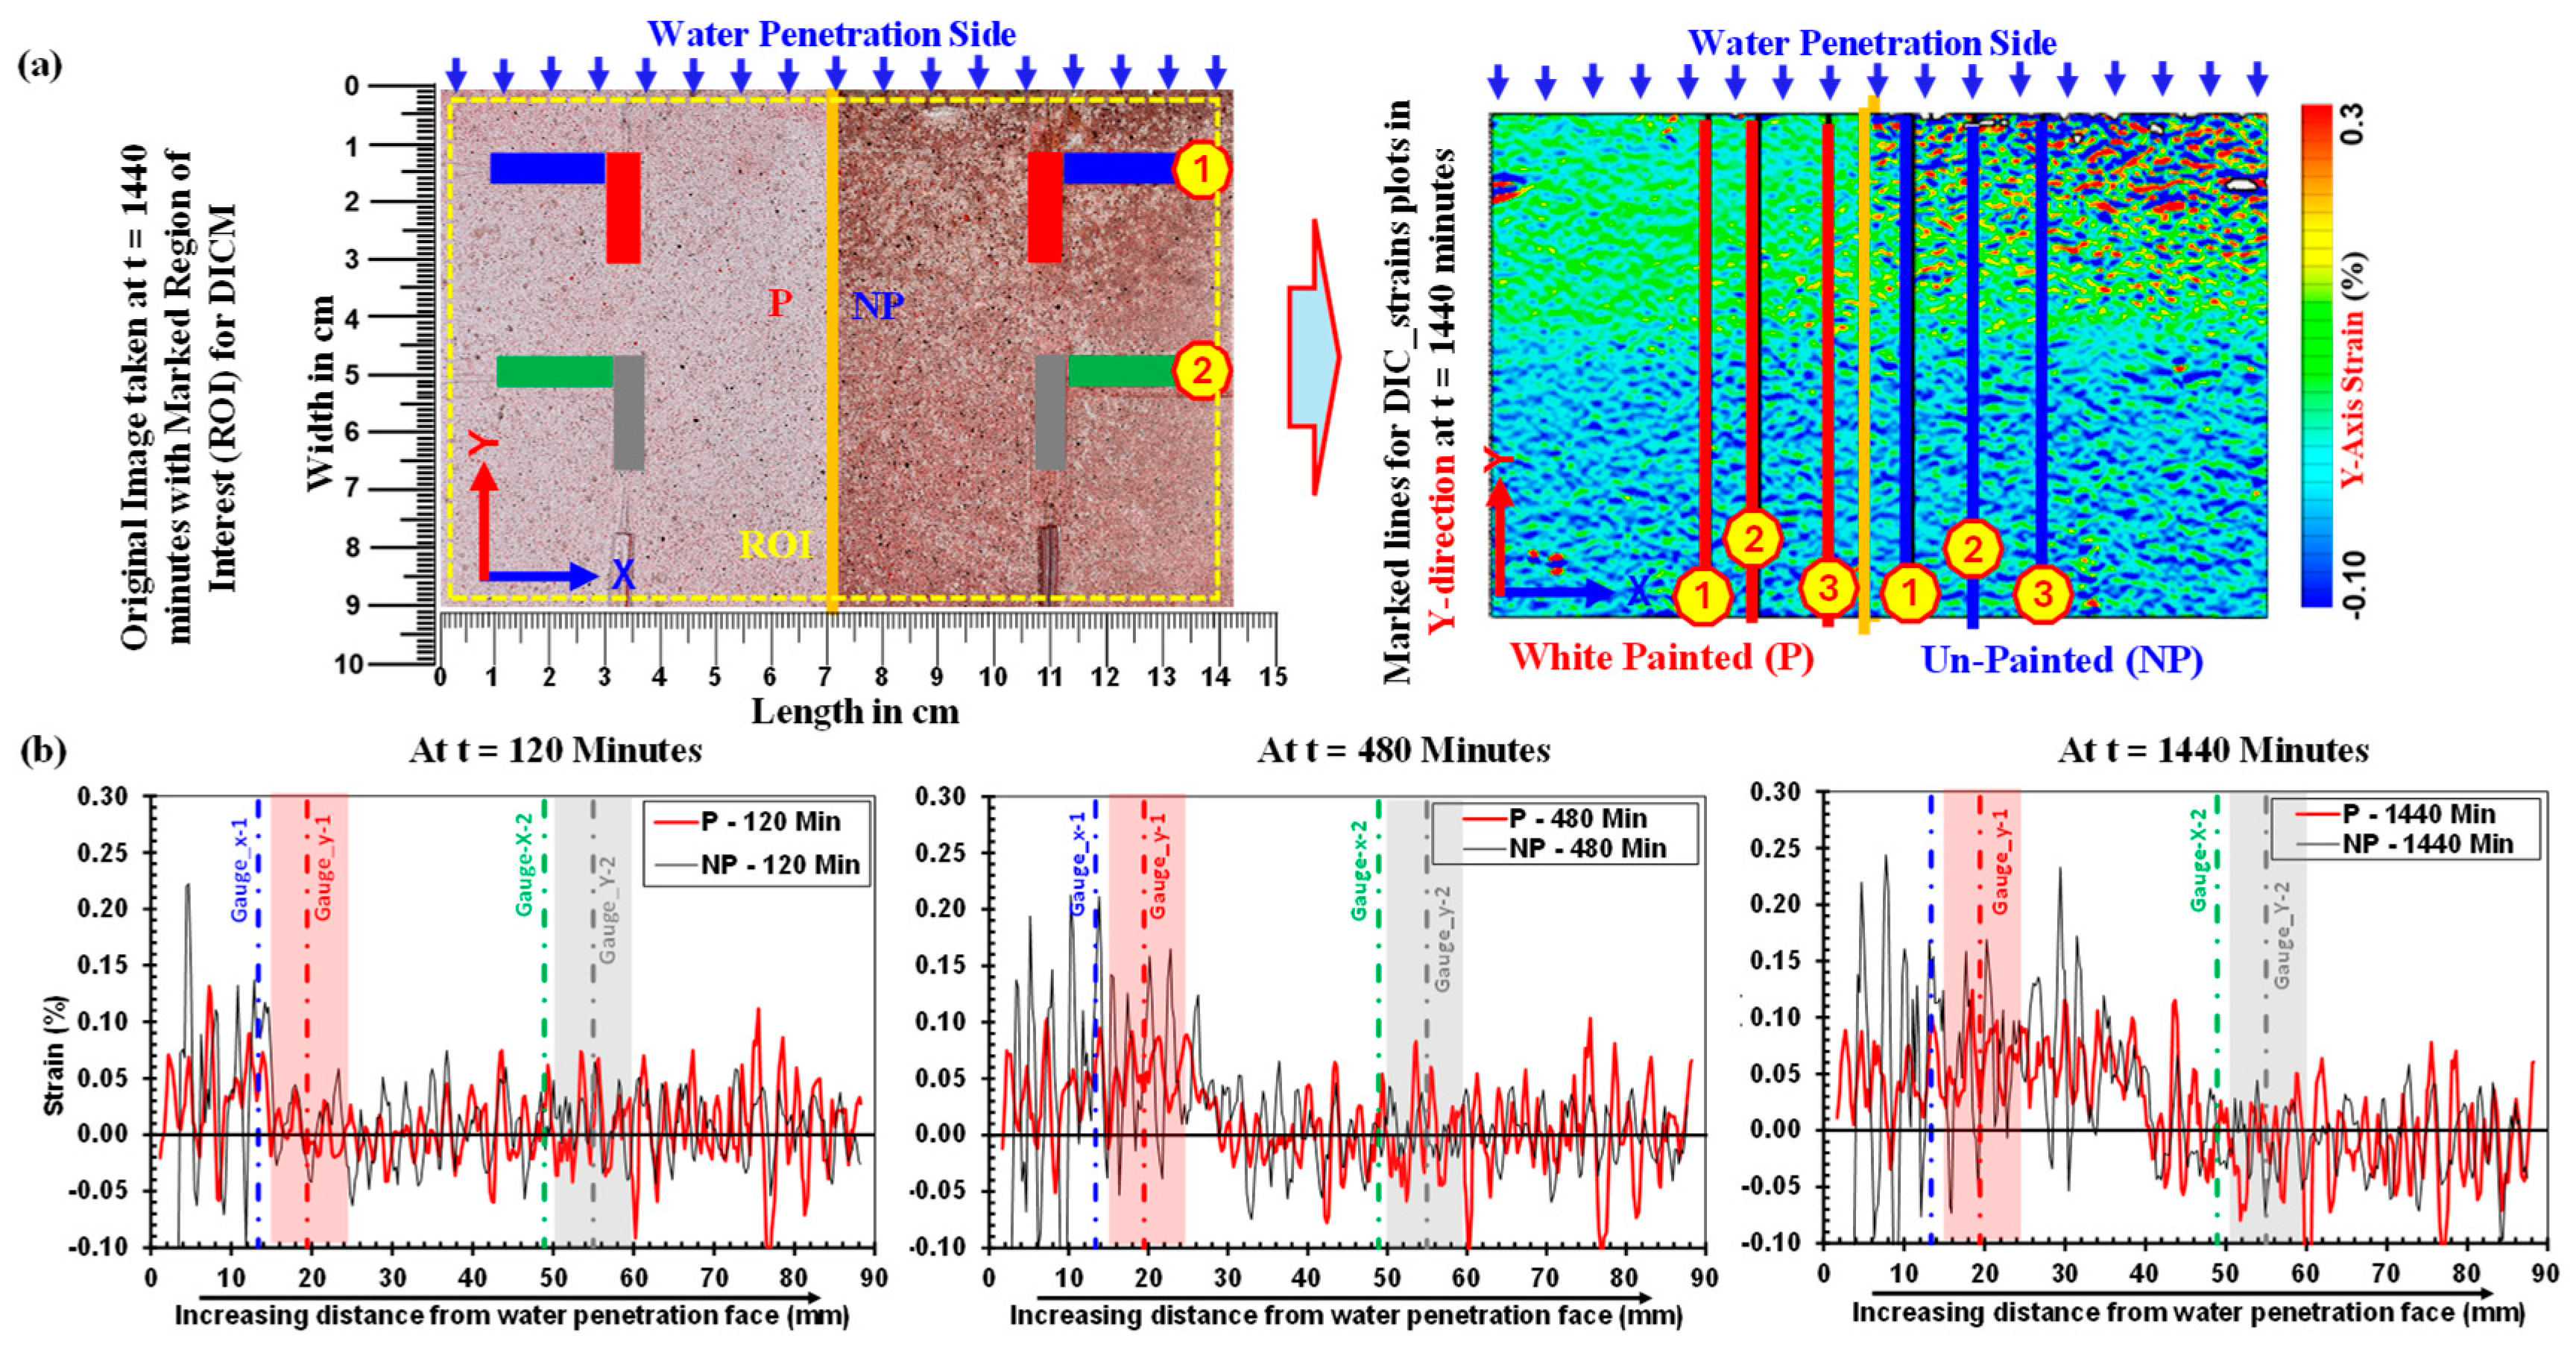
Figure 9.
Comparison of average strains calculated in DICM with the strains recorded by surface strain gauges during water absorption in (a). low: w/c = 0.65; (b). medium: w/c = 0.55 and (c). high: w/c = 0.30, strength mortars.
Figure 9.
Comparison of average strains calculated in DICM with the strains recorded by surface strain gauges during water absorption in (a). low: w/c = 0.65; (b). medium: w/c = 0.55 and (c). high: w/c = 0.30, strength mortars.
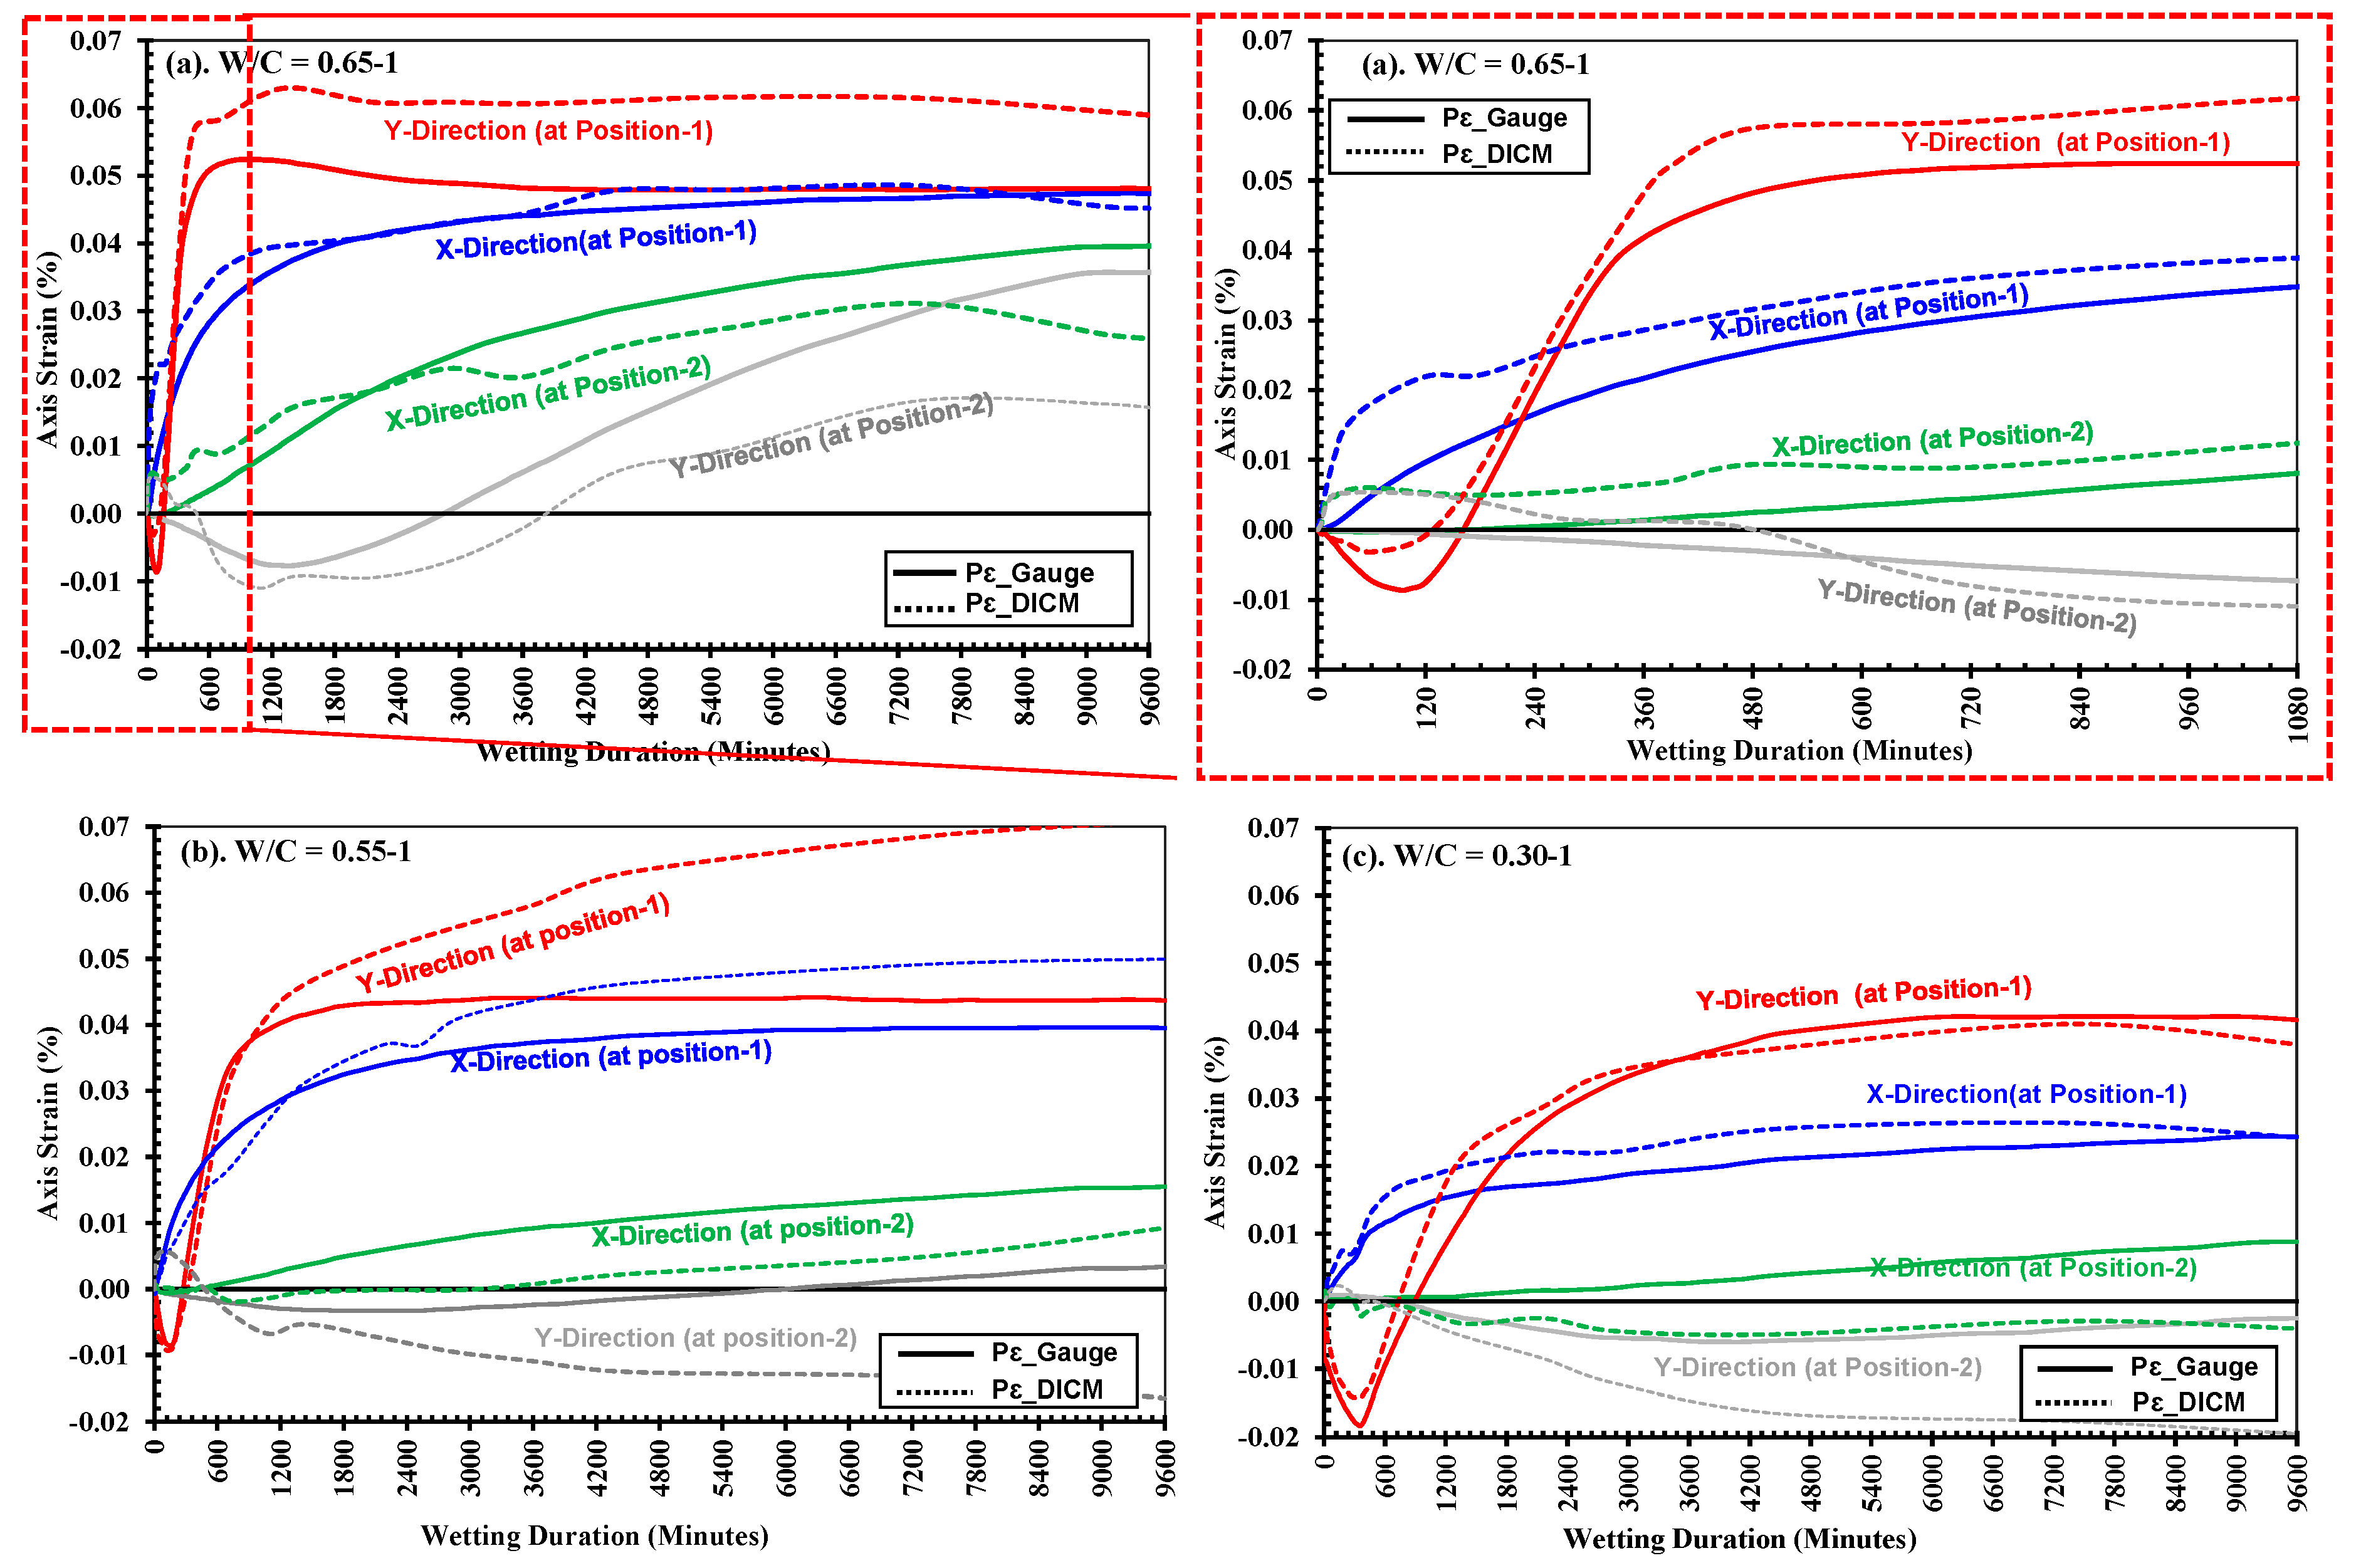
Figure 10.
Comparison of full field strain distribution along y-axis with increasing wetting durations with reference to state just before starting water absorption in (a). low: W/C = 0.65; (b). medium: W/C = 0.55; and (c). high: W/C = 0.30 strength mortars.
Figure 10.
Comparison of full field strain distribution along y-axis with increasing wetting durations with reference to state just before starting water absorption in (a). low: W/C = 0.65; (b). medium: W/C = 0.55; and (c). high: W/C = 0.30 strength mortars.
Figure 11.
Definition of calculating the depth of water penetration with respect to penetration face by employing strain distribution along the y-axis using DICM.
Figure 11.
Definition of calculating the depth of water penetration with respect to penetration face by employing strain distribution along the y-axis using DICM.
Figure 12.
Distribution of strain by DICM along y-axis on paint side of the specimens in (a). low: w/c = 0.65; (b). medium: w/c = 0.55; and (c). high, w/c = 0.30 strength mortars. Note: Points on each line in these graphs crossing threshold strain corresponds to water penetration depth at that time.
Figure 13.
Comparison of water penetration depths with increasing wetting durations determined by DICM and by variations in greyscale in (a). low: w/c = 0.65; (b). medium: w/c = 0.55; and (c). high, w/c = 0.30 strength mortars.
Figure 13.
Comparison of water penetration depths with increasing wetting durations determined by DICM and by variations in greyscale in (a). low: w/c = 0.65; (b). medium: w/c = 0.55; and (c). high, w/c = 0.30 strength mortars.
Figure 14.
Relationship between the water absorption depth (d) determined by DICM and the square root of wetting time in (a) low: w/c = 0.65; medium: w/c = 0.55; and high: w/c = 0.30 strength mortars, and (b) Determination of absorption rates in low strength mortars specimen 1 (I1: slope of best fit line up to 1980 min; I2: slope of best fit line after 2160 min of starting absorption.
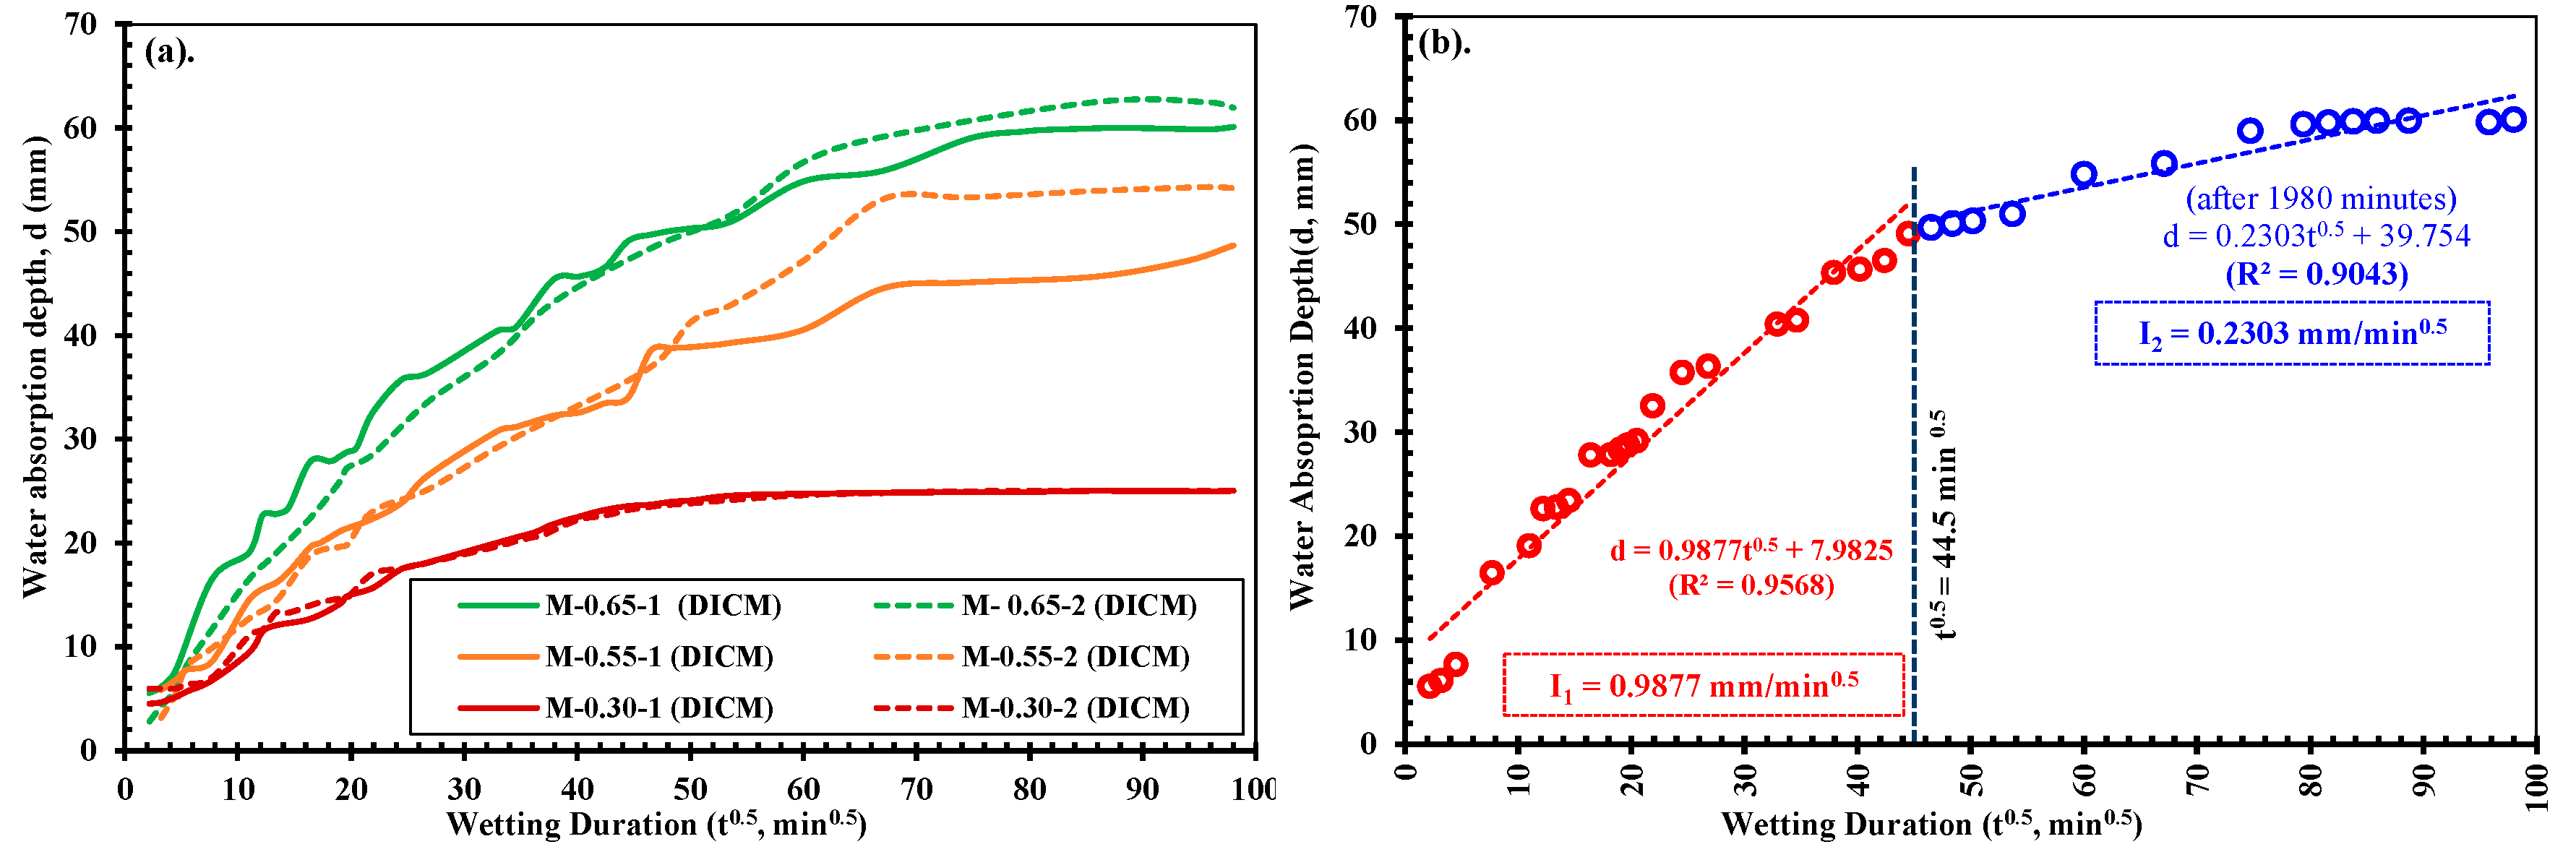
Figure 15.
Relationships of Mechanical properties (f′cm and Em) of different strength mortars with primary (I1) and secondary (I2) rates of absorptions determined in this study by observations in DICM: (a) (f′cm and Em) vs. I1; (b) (f′cm and Em) vs. I2.
Figure 15.
Relationships of Mechanical properties (f′cm and Em) of different strength mortars with primary (I1) and secondary (I2) rates of absorptions determined in this study by observations in DICM: (a) (f′cm and Em) vs. I1; (b) (f′cm and Em) vs. I2.
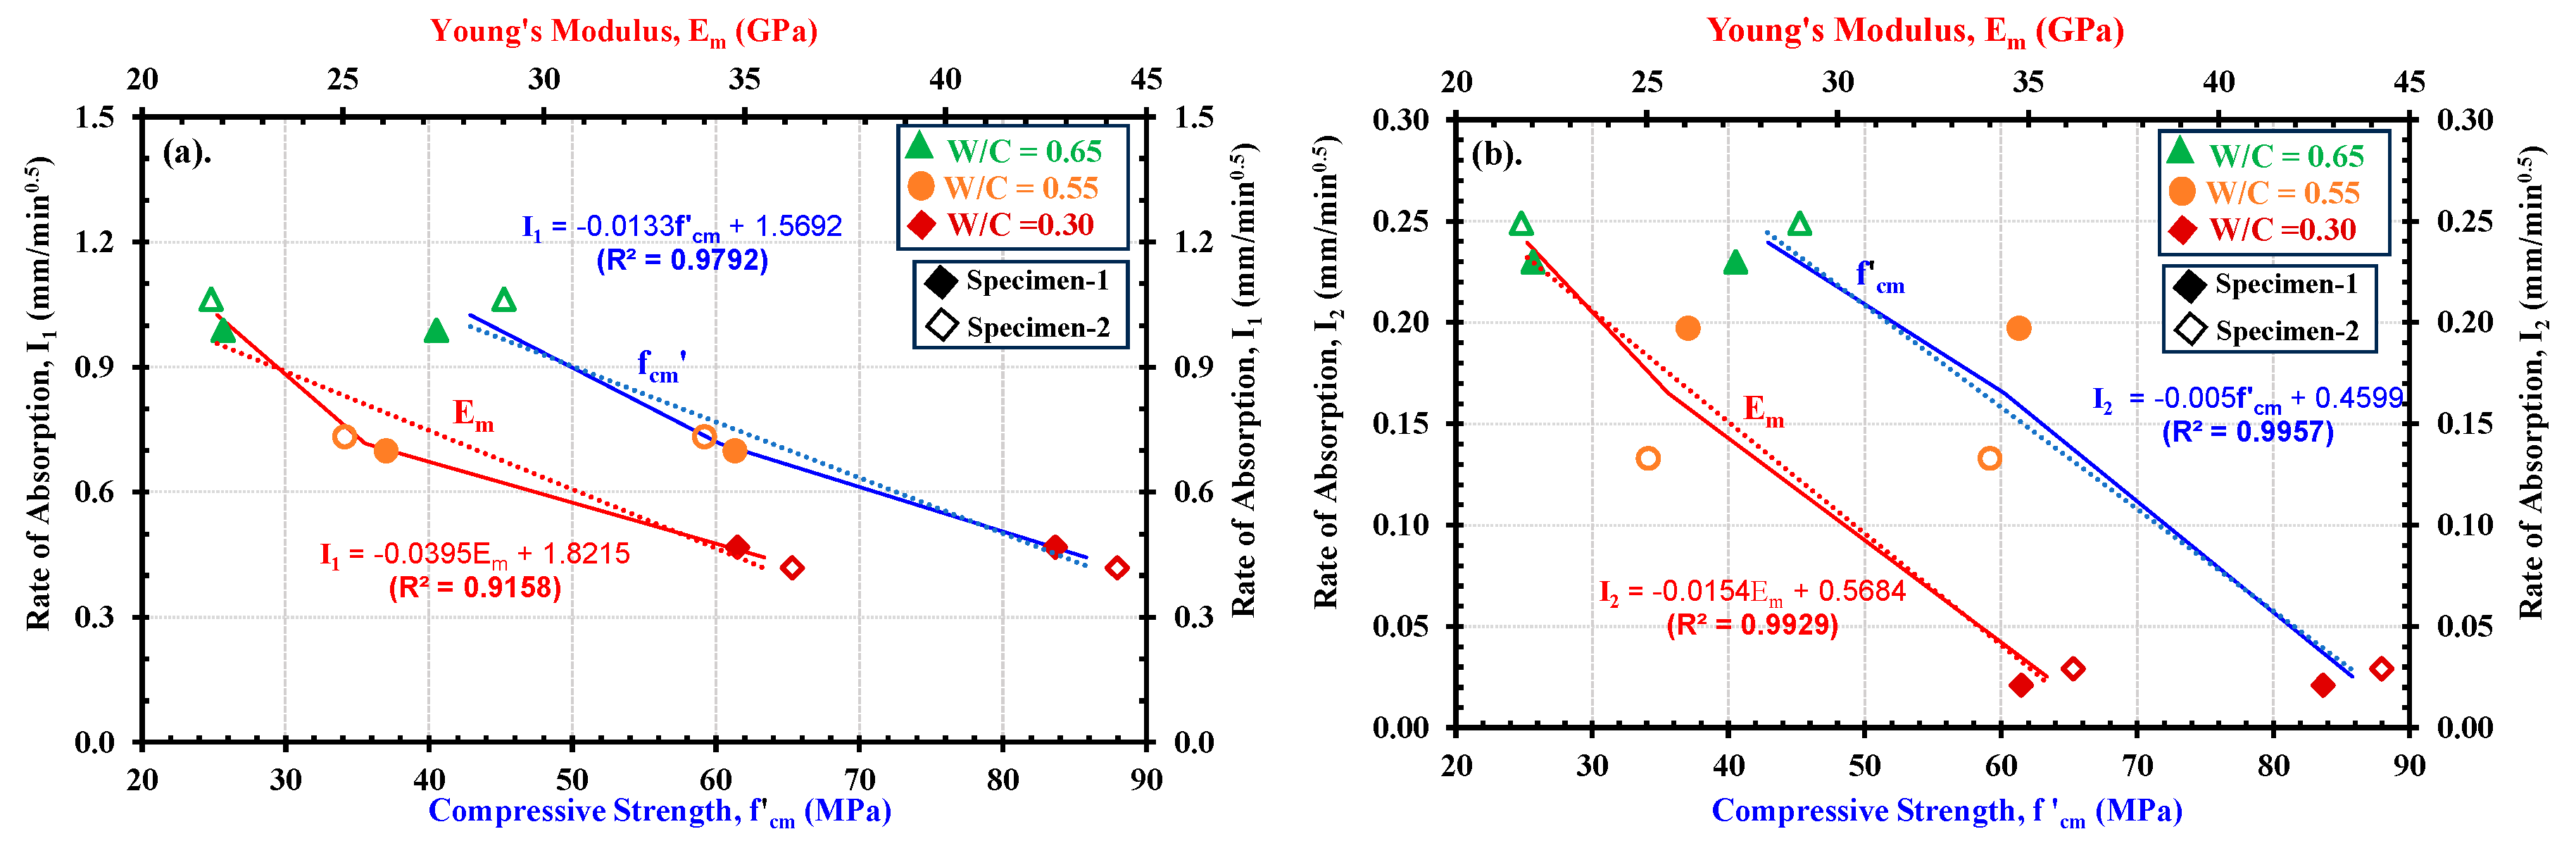
Figure 16.
Relationship between mechanical properties (f′cm and Em) and the strain along x-axis in fully saturated part: (a) at 2160 min (beginning of slow absorption); and (b) at 9600 min (Absorption test stopped).
Figure 16.
Relationship between mechanical properties (f′cm and Em) and the strain along x-axis in fully saturated part: (a) at 2160 min (beginning of slow absorption); and (b) at 9600 min (Absorption test stopped).
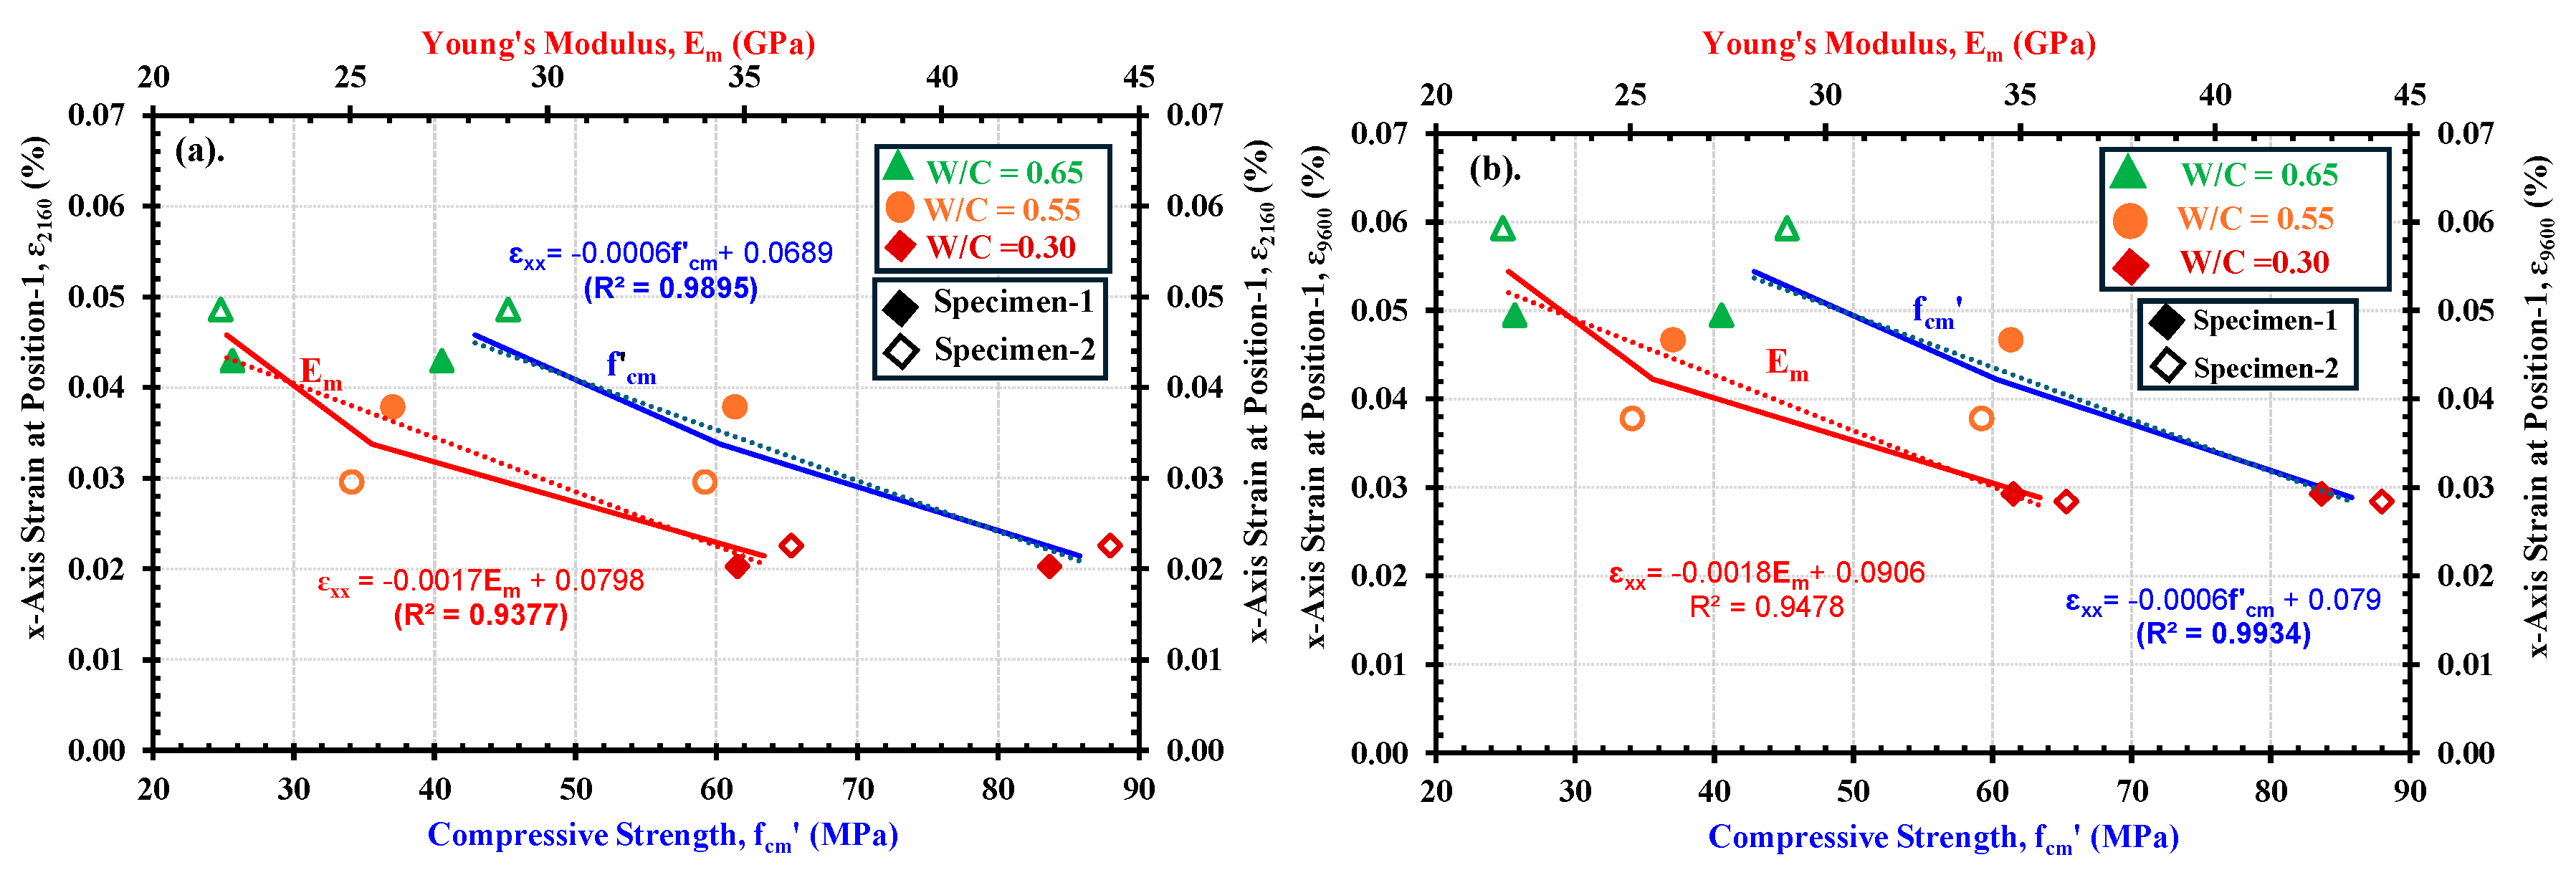

Table 1.
Mix proportions of the test specimens corresponding to various target strengths.
| Strength Category |
W/C | Contents Unit Weights (kg/m3) | ||||
|---|---|---|---|---|---|---|
| W | C | S | AE | SSP-104 | ||
| Low | 0.65 | 295 | 454 | 1135 | 5.35 | - |
| Medium | 0.55 | 295 | 535 | 1339 | 5.35 | - |
| High | 0.30 | 165 | 555 | 709 | - | 3.05 |
W; water, C: cement, S; Sand, AE; Air Entrainment agent, SSP; Superplasticizer.
Table 2.
Details of test specimens and their mechanical properties.
| Strength | Designation1[1] | Dimensions in mm (L x W x H) |
Age (days) | Mechanical properties[2] | |||
|---|---|---|---|---|---|---|---|
| Curing | WA | CT | fcm’ (MPa) | Em (GPa) | |||
| Low | M-0.65-1 M-0.65-2 |
152.5 × 100.8 × 50.3 151.6 × 101.7 × 50.2 |
76 145 |
89 157 |
124 174 |
40.52 45.24 |
22.02 21.72 |
| Medium | M-0.55-1 M-0.55-2 |
151.4 × 102.4 × 50.2 152.6 × 102.1 × 50.6 |
78 145 |
102 157 |
281 231 |
61.33 59.21 |
26.08 25.04 |
| High | M-0.30-1 M-0.30-2 |
153.3 × 100.5 × 50.4 151.3 × 100.2 × 50.0 |
32 32 |
42 49 |
56 84 |
83.66 87.97 |
34.82 36.18 |
Table 3.
Water absorption depths evaluated by DICM at different exposure times.
| Strength | Specimen | Depth Before Deviation (mm) | |||
|---|---|---|---|---|---|
| t = 360 min | t = 1440 min | t = 2880 min | t = 9600 min | ||
| Low | M-0.65-1 M-0.65-2 |
28.33 25.91 |
45.38 43.20 |
51.00 51.68 |
60.09 61.97 |
| Medium | M-0.55-1 M-0.55-2 |
21.11 19.63 |
32.24 32.05 |
39.29 43.01 |
48.68 54.21 |
| High | M-0.30-1 M-0.30-2 |
14.10 14.64 |
21.80 21.20 |
24.54 24.15 |
25.01 25.03 |
Table 4.
Water absorption rates in mortars of different strengths evaluated by DICM.
| Strength | Specimen | Depth Before Deviation (mm) | Rate of Absorptions (mm/min0.5) | |||
|---|---|---|---|---|---|---|
| I1 | R2 | I2 | R2 | |||
| Low | M-0.65-1 M-0.65-2 |
49.09 46.50 |
0.988 1.063 |
0.9568 0.9766 |
0.230 0.249 |
0.9043 0.8447 |
| Medium | M-0.55-1 M-0.55-2 |
34.02 47.22 |
0.699 0.733 |
0.9604 0.9867 |
0.197 0.133 |
0.9512 0.5776 |
| High | M-0.30-1 M-0.30-2 |
23.53 23.15 |
0.468 0.418 |
0.9729 0.9560 |
0.021 0.030 |
0.7336 0.7838 |
Disclaimer/Publisher’s Note: The statements, opinions and data contained in all publications are solely those of the individual author(s) and contributor(s) and not of MDPI and/or the editor(s). MDPI and/or the editor(s) disclaim responsibility for any injury to people or property resulting from any ideas, methods, instructions or products referred to in the content. |
© 2025 by the authors. Licensee MDPI, Basel, Switzerland. This article is an open access article distributed under the terms and conditions of the Creative Commons Attribution (CC BY) license (http://creativecommons.org/licenses/by/4.0/).
Copyright: This open access article is published under a Creative Commons CC BY 4.0 license, which permit the free download, distribution, and reuse, provided that the author and preprint are cited in any reuse.


