
Submitted:
30 January 2025
Posted:
03 February 2025
You are already at the latest version
Abstract
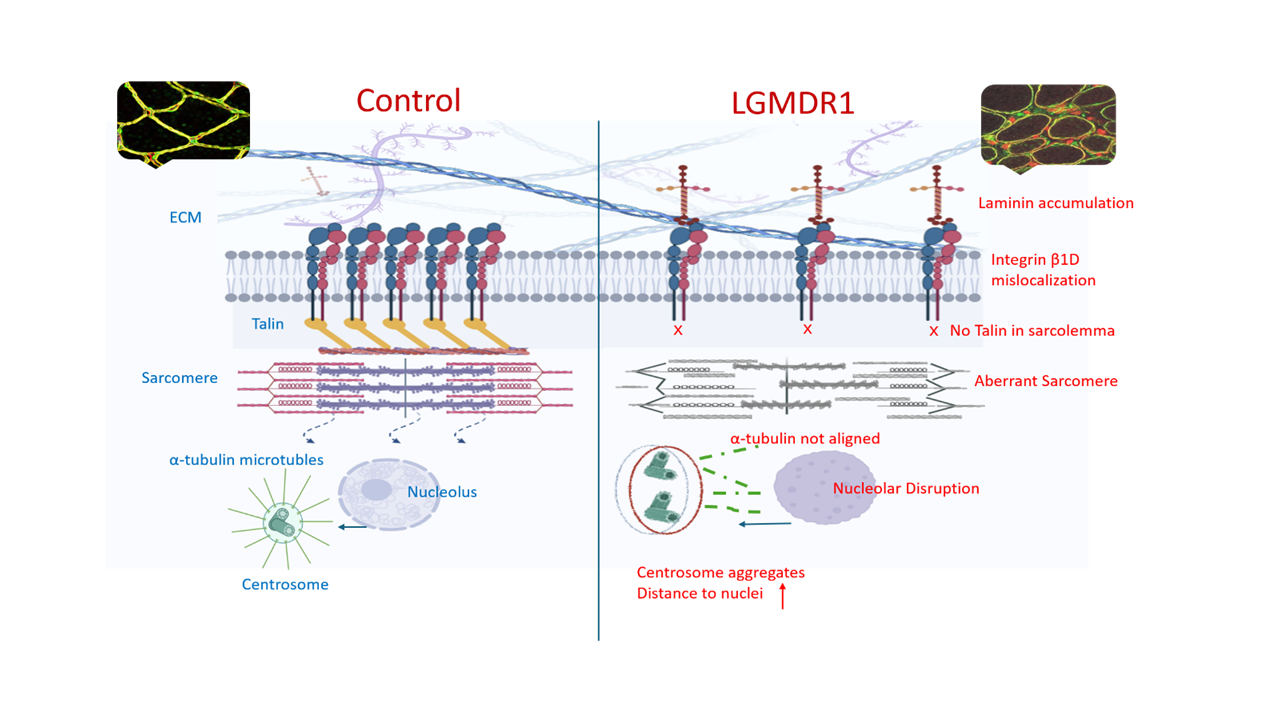
Limb–girdle muscular dystrophy R1 (LGMDR1) is characterized by progressive proximal muscle weakness due to mutations in the CAPN3 gene. Little is known about calpain 3 (CAPN3) function in muscle, but its loss results in aberrant sarcomere formation. Human muscle structure was analyzed in this study, with observed integrin β1D isoform (ITGβ1D) mislocalization, a lack of talin 1 (TLN1) in the sarcolemma, and the irregular expression of Focal Adhesion Kinase (FAK) in LGMDR1 muscles suggesting a lack of integrin activation with an altered sarcolemma, extracellular matrix (ECM) assembly and signaling pathway deregulation, which may cause frailty in LGMDR1 muscle fibers. Additionally, altered nuclear morphology, centrosome distribution and microtubule organization have been found in muscle cells derived from LGMDR1 patients.
Keywords:
limb-girdle muscular dystrophy LGMDR1
; calpain 3
; integrin β1
; costamere
1. Introduction
Limb-girdle muscular dystrophy R1-calpain 3 related is one of the most common autosomal recessive limb–girdle muscular dystrophies. It is characterized by progressive proximal muscle weakness. For most patients, onset occurs in adolescence, and patients usually lose independent ambulation after around 20 years of progression [1,2].
Although CAPN3, a muscle-specific protease, was first described in 1989 [3], its function in muscle is still not completely understood. However, it has been reported that a lack of CAPN3 alters several structures and signaling pathways in the skeletal muscle. This protein binds to titin, a gigantic protein that spans from the M- to Z-lines of the muscle sarcomere [4,5]. The loss of CAPN3 results in aberrant sarcomere formation [6] and alterations in the expression of several genes in LGMDR1 patients’ muscles [7].
The costamere is a morphological structure in striated muscles aligned with myofibril Z-discs [8]. It may participate in the assembly and stabilization of sarcomeres [8,9,10]. Costamere components showed altered expression in LGMDR1 patients at both the gene level, like in ITGB1BP2 and ANOS1, and the protein level, like in melusin or the integrin β1D isoform (ITGβ1D) [7,11].
Another important cellular component is the centrosome, a non-membranous organelle composed of two centrioles. The centrosome is the main microtubule-organizing center (MTOC) in proliferating cells [12]. Moreover, the centrosome contains a pair of centrioles where the microtubule minus ends anchor [13,14]. Specifically, in muscle cells, the centrosomes are distributed with a perinuclear localization [15,16]. Notably, a perinuclear distribution of CAPN3 has been suggested [17], and Winter and colleagues [18] showed that it is a functional constituent of the centrosomes in mice myoblasts. Furthermore, ITGβ1D regulates the integrity of the centrosome [19].
Centrioles are crucial for the formation of the primary cilium, that is, a microtubule-based sensory organelle required for signal transduction during development and adult tissue homeostasis [20,21,22]. To control cellular functions, changes in the extracellular environment are detected by the cilium, and it transmits signaling information to the cell. Hedgehog, Wnt, Notch, and mTOR signaling pathways are among the principal signaling pathways coordinated by the primary cilium that regulate developmental processes and organ functions [23,24,25,26]. These signaling pathways are required for correct cellular homeostasis, yet the Wnt and mTOR signaling pathways appear altered in LGMDR1 patients [27].
On the other hand, the nucleus shows a tight connection to the centrosome [20]. Ding and colleagues [28] showed that CAPN3 is recruited by Def (Digestive-organ expansion factor) into the nucleolus to form the Def-CAPN3 complex. Although the nucleus has not been analyzed in depth in LGMDR1, CAPN3, which contains a nuclear translocation signal within its amino acid sequence [3], has been suggested to be implicated in nuclear function [17,18,29].
In this work, we report the mislocalization of costamere proteins in LGMDR1 myofibers, swollen vascular vessels in the LGMDR1 muscle, and a dispersed distribution of talin 1 in muscle cells and their nuclei. Furthermore, we describe for the first time altered morphology of nuclei and nucleoli, as well as clusters of centrosomes and aberrant mitotic spindles in LGMDR1 muscle cells. As ITGβ1D is common among all these pathological features, we propose that it takes the spotlight in future therapeutic strategies.
2. Materials and Methods
The LGMDR1 muscle samples used in this study came from our historical patients’ series. All patients presented two mutations in the CAPN3 gene (Table 1 and Table 2). Healthy patients who had surgery for bone fractures provided the control muscles, and muscle biopsies were obtained during the surgery. The Ethics Committee on the Use of Human Subjects in Research at Donostia University Hospital authorized the forms that were used to seek informed consent from each participant, who signed voluntarily prior to the collection of muscle samples.
2.1. Primary Human Skeletal Muscle Culture
Human muscle samples were cultured in a monolayer as previously described (Askanas 1975). Myoblasts and non-myogenic cells were purified by sorting primary cultures through immunomagnetic selection based on the early cell surface marker CD56 (Milteny Biotec). Myoblasts (CD56+) and non-myogenic cells (CD56-) were seeded at 2,500-3,000 cells/cm2 in proliferation medium. This medium contained 10% FBS (Gibco), DMEM (Gibco), M-199 (Lonza), insulin (Sigma-Aldrich), L-Glutamin (Gibco), penicillin/streptomycin (Gibco) and growth factors (Peprotech). Myotubes were obtained through the replacement of the proliferation medium in CD56+ 100% confluent cultures, for one containing 2% FBS and without growth factors. Myotube cultures were maintained for 15 days. The medium was changed every two days during the culturing process.
2.2. Immunofluorescence on Muscle Sections
The detection of costamere proteins was performed in 7 µm skeletal muscle cryosections. Tissue fixation was performed using 4% PFA (Electron Microscopy Science) for 5 min at room temperature (RT). Incubation for 6 min with pure frozen methanol (-20ºC) was used to permeabilize muscle sections. Then, blocking solution [5% BSA IgGfree (Leica Biosystem), 2% goat serum (Abcam), 0.025% Tween20 (Sigma Aldrich)] was added for 2h at RT. Primary antibody incubation was performed overnight at 4oC at the indicated dilutions (Table S1—Supplementary), and 1:400 diluted fluorescent secondary antibodies were added at RT for 2 h, protected from light (Table S2—Supplementary). The incubation of 1:30 diluted anti-dystrophin (Santa Cruz Biotechnology) or laminin (Novus Biologicals) labeled with AlexaFluor647 for 1 hr under light-protected conditions was used to delimitate the subsarcolemmal region of the muscle fiber. Nuclei were counterstained with Hoechst (Thermofisher Scientific).
To determine the vascular endothelium association of costamere proteins, as well as the number of blood vessels, following the above-described protocol, ulex-biotin marker (Vector Laboratories, Newark, CA) was added to the primary antibody solution in a 1:333 dilution. Afterwards, avidin-AF488 (Invitrogen, Waltham, MA) was added to the secondary antibody solution in a 1:2000 dilution.
2.3. Immunofluorescence on Cell Culture
CD56- cells and myoblasts were cultured in an optical µ-Plate 96 Well 3D (Ibidi) and myotubes in an optical µ-Plate 96 Well Square (Ibidi) coated with 0.5% and 0.1% gelatin (Sigma), respectively. Cells were fixed with 4% PFA (Electron Microscopy Science) for 5 min at RT. After several PBS washes, the cells were permeabilized and blocked with blocking solution [0.3%Triton-X (Sigma-Aldrich) and 5% goat serum (Abcam) in PBS] for 2 h at RT. Primary antibodies were diluted in blocking buffer and incubated overnight at 4oC (Table S1—Supplementary Materials). Well plates were washed with a washing solution [0.025% Tween20 (Sigma Aldrich) in PBS], and fluorescent secondary antibodies were added and incubated for 2 h at RT (Table S2—Supplementary). Hoechst (Thermofisher Scientific) was used to stain the nuclear regions of cells by incubating cells for 3 min at RT. After several washes with the washing solution, a storage solution [0.1%Sodium Azide (Sigma Aldrich) in PBS] was added to preserve the cells until microscopy analysis.
Here, specific primary antibodies were used to detect cellular structures. Anti-γ-tubulin antibody was used to detect centrosome location/structure, since this protein is enriched in centrosomes [30,31]. The study of the primary cilium was performed after immunodetection with anti-Arl13b, an abundant protein in this cell structure [32] (Table S1—Supplementary Materials).
2.4. Wound-Healing (WH) Assay in CD56- Cells
Cells were seeded in an optical µ-Slide 8 Well (Ibidi) coated with 0.5% gelatin (Sigma) until confluence was reached. A wound was made using a 200 µl pipette tip, and cells were fixed with 4% PFA (Electron Microscopy Science) 6 h later. Centrosome orientation analysis was performed after immunostaining with α- and γ- tubulin antibodies, as described above (Table S1—Supplementary Materials).
2.5. Confocal Microscopy Analysis and Statistics
Images of muscle sections and cells were digitally captured with a Confocal Microscope LSM900 (Zeiss) and ZenBlue3.0 software. The processing or analysis of these images was performed using Image J (v1.53t).
-Protein quantification of costamere proteins in the sarcoplasm of muscle fibers: Fiber segmentation and quantification of the fluorescence intensity (average fluorescence intensity within the fiber) corresponding with a direct proportion of protein expression was performed. Different amounts of fibers were analyzed for each protein: 150-240 fibers per control/patient group for ITGβ1D analysis; 65-200 fibers per control/patient group for TLN1; 40-80 fibers per control/patient group for vinculin (VCL); 140-400 fibers per control/patient group for Focal Adhesion Kinase (FAK); and 55-160 fibers per group for Integrin Linked Kinase (ILK). The statistical significance was assessed using an unpaired T-test after the elimination of outliers by the Rout method (Q=1%).
-Blood vessel quantification in skeletal muscle: Blood vessels of 450-890 fibers (after fiber segmentation) were analyzed per group. The cross-sectional area (CSA) was calculated to normalize the blood vessel number.
-Nuclear morphology analysis in cells and skeletal muscle tissue sections: Nucleus segmentation and shape descriptor (circularity, roundness, aspect ratio, area and perimeter) analyses were performed. Overall, 800-1000 nuclei were analyzed per group for CD56- cells, 700-1000 nuclei per group for myoblasts, 180-200 nuclei for myotubes and 500-700 nuclei for skeletal muscle sections. Only laminin-delimitated myonuclei, were considered for the analysis of skeletal muscle nuclei. Statistical significance was assessed using an unpaired T-test after the elimination of outliers via the Rout method (Q=1%).
-Centrosome–nucleus distance in skeletal muscle cells: The centrosome–nucleus distance was assessed using antibodies against ϒ-tubulin. Overall, 100 CD56- cells and 150 myoblasts were analyzed per group. The statistical significance was assessed using an unpaired T-test after the elimination of outliers via the Rout method (Q=1%).
-Quantification of cytoskeletal α-tubulin in muscle cells: α-tubulin fluorescence intensity was normalized to the cell number. For CD56- cells, 250 controls and 500 in patients were assessed; for myoblasts, there were 500 in controls and 1200 in patients. The statistical significance was assessed using an unpaired T-test after the elimination of outliers via the Rout method (Q=1%).
-Centrosome positioning assessment in CD56- cells: The number of cells with a misoriented centrosome after a WH assay was assessed. The statistical significance was assessed using an unpaired T-test.
- Quantification of ciliated myoblasts: The number of ciliated cells was measured. The statistical significance was assessed using an unpaired T-test.
3. Results
3.1. Costamere Proteins Are Fiber-Type-Dependent and Also Present in the Endothelial Tissue
For a better understanding of the distribution of costamere proteins in healthy skeletal muscle, we studied ILK, VCL, ITGB1D, FAK, TLN1, and α- and β-parvin due to their established role in costamere formation and/or maintenance [33,34,35,36,37,38]. ILK, VCL, ITGβ1D and TLN1 were localized at the sarcolemma and sarcoplasm of the muscle fiber. FAK was the only protein that did not show sarcolemmal expression (Figure 1A). A protein expression analysis of ILK, TLN1 and FAK, which showed clear sarcoplasmic distribution, also demonstrated fiber-type specific expression (Figure 1). A higher sarcoplasmic expression of TLN1 and FAK proteins was observed in type I or slow fibers. By contrast, ILK showed a predominant sarcoplasmic expression in type II or fast fibers (Figure 1).
Contrary to previous proteins, α-parvin and β-parvin showed localization close to the blood vessels in muscle tissue, with no expression in other regions of the muscle fiber (Figure 2). Therefore, after double-staining with β-parvin and ulex, a vascular endothelial marker, the expression of these proteins in the blood vessels of muscle tissue was confirmed (Figure 2). Finally, as ILK, TLN1, FAK, and VCL were also expressed outside the muscle fiber, double-staining was performed with ulex, and the vascular endothelial expression of these proteins was also confirmed (Figure 3).
3.2. Abnormal Distribution of ITGβ1D and TLN1 in LGMDR1 Patients’ Muscle
We demonstrate that ITGβ1D is expressed in both the sarcolemma and cytoplasm in control muscles. However, the expression of ITGβ1D in the sarcolemma is patchy, with discontinuous labeling (Figure 4). TLN1, which was preferentially expressed in type I fibers in the control and in patients, was highly expressed in the cytoplasm of patients’ fibers. Moreover, while its localization in the sarcolemma was clear in the control muscles, it was absent in the sarcolemma of the patients’ muscles fibers (Figure 5 and Figure 6). Accordingly, when ITGβ1D and TLN1 were analyzed together, they showed clear co-localization in control muscles that was not observed in the LGMDR1 patients (Figure 7). Patient 18-38110, who had a strikingly benign phenotype, presented good muscle structure. Accordingly, almost normal ITGβ1D and TLN1 distributions were observed with the co-localization of these proteins in some areas of the sarcolemma (Figure 6 and Figure 7).
We next verified the expression of VCL, which did not show preferential expression in any fiber type in the control or in patients; it showed more in blood vessels in LGMDR1 muscle fibers (Figure 8).
On the other hand, FAK localized predominantly in type I fibers in both controls and patients, but its expression was consistently higher in LGMDR1 patients´ samples (Figure 9). Furthermore, some type I fibers showed low FAK expression in LGMDR1 muscles (Figure 9A). Finally, ILK appeared to be predominantly expressed in type II fibers in both control and LGMDR1 muscles (Figure 1 and Figure 10). Specifically, its sarcoplasmic and sarcolemmal expression was significantly higher in both types of muscle fibers from the LGMDR1 patient compared to healthy controls (Figure 10 and Figure 11). Finally, the co-localization of ILK and dystrophin was observed, but a higher level of expression of the dystrophin itself was clear.
3.3. Abnormal Blood Vessel Morphology in LGMDR1 Patients’ Muscles
Muscle function is strictly related to the vascular composition of skeletal muscle fibers [39]. Since costamere proteins are also expressed in smooth muscle, their expression and morphology in skeletal muscle fibers were analyzed.
The quantification of blood vessels showed a higher number of vessels in LGMDR1 patients. When the number of blood vessels was normalized to the number of muscle fibers, this difference disappeared, but when it was normalized to the CSA, LGMDR1 patients showed a higher ratio. Moreover, an abnormal and swollen morphology of the vessels was observed in LGMDR1 patients’ muscles (Figure 12).
3.4. TLN1 Localizes in the Nucleolus in CD56-, Myoblasts, Myotubes, and Muscle
After tissue analysis, we proceeded to analyze primary cultured cells from muscle biopsies. Specifically, TLN1 appeared to be nuclearly expressed in the non-myogenic CD56- cells. Though with low sarcoplasmic expression, TLN1 displayed a nuclear distribution both in control and patient samples (Figure 13). To be precise, TLN1 is expressed at the nucleolar localization, found in the dark part of the Hoechst [40]. To better confirm this localization, double-staining with an anti-nucleolin antibody was performed in myoblasts and myotubes, confirming the specific nucleolar distribution of TLN1 (Figure 14). Strikingly, while LGMDR1 myoblasts presented nucleolar disruption, characterized by the dispersion of nucleolar material throughout the nucleoplasm, LGMDR1 myotubes did not present such disruption (Figure 15). Finally, we also confirmed the nucleolar expression of TLN1 in muscle sections from both controls and LGMDR1 patients, with no differences (Figure 16).
3.5. Nuclear-Abnormal Morphology in LGMDR1 Patients
Obtained results, together with the morphological abnormalities found in myoblast nuclei from the Capn3KO mice [18], led to the morphological study of primary cells and muscle nuclei in controls and LGMDR1 patients. The nuclei of LGMDR1 patients’ CD56- cells showed significantly lower circularity and roundness (Figure 17A-B). In terms of area, perimeter and aspect ratio (AR), CD56- nuclei did not show significant differences. Despite a clear higher percentage trend to nuclear blebs in patients’ CD56- cells, no statistical differences were observed (Figure 17A-B). Related to myoblast nuclei, LGMDR1 myoblasts showed a bigger area, perimeter and AR, but they presented a lower circularity and roundness. No differences were observed in nuclear bleb percentage (Figure 17C-D). By contrast, the nuclei of LGMDR1 myotubes presented a smaller area, perimeter and AR, while circularity and roundness were higher in patients’ myotube nuclei. Although an increasing trend was observed in the percentage nuclear blebs in LGMDR1 myotubes, it did not reach statistical significance (Figure 17E and F).
These analyses were also performed for muscle fiber nuclei of controls and LGMDR1 patients in tissue sections. A bigger area, perimeter and AR were observed in the myonuclei of LGMDR1 muscle fibers, while showing a lower circularity and roundness (Figure 18).
3.6. Centrosome Organization Is Impaired in LGMDR1 Cells
Since the integrin β1 tail could regulate centrosome function [41] and centrosome reduction has been seen during myoblast differentiation [15,16,42,43], its distribution was analyzed only in proliferating CD56- cells and myoblasts of controls and LGMDR1 patients. Clustered centrosomes were found in LGMDR1 CD56- cells (Figure 19), while centrosome aggregates were not found in myoblasts (data not shown). Since the centrosome displays a key role in the nuclear structure and its location is along the skeletal muscle cells [15,44,45], the distance between the centrosome and the nucleus was measured in myoblasts and CD56- cells.
An increased distance between these two organelles was observed in LGMDR1 muscle cells: 42% and 51% higher in myoblasts and CD56- cells, respectively (Figure 20). Due to the impaired location of the centrosomes, α-tubulin immunolabelling was performed. More randomly organized microtubules and a reduced amount of protein was observed in LGMDR1 patient-derived CD56- cells and myoblasts (Figure 21 and Figure 22).
Finally, wound-healing in vitro analysis was performed to establish whether the centrosomes showed an appropriate orientation during this process. Centrosomes in LGMDR1 patients’ CD56- cells showed a disoriented localization after the wound-healing assay, although this difference was not statistically significant (Figure 23).
3.7. Aberrant Mitosis in LGMDR1 CD56- Cells
Since centrosomes regulate the proper positioning of the bipolar spindle [46], mitotic divisions in the primary cells of LGMDR1 patients and controls were analyzed. Mitotic spindle abnormalities were not observed in LGMDR1 myoblasts. However, aberrant mitotic spindles were found in the CD56- cells of LGMDR1 patients (Figure 24).
Due to the relationship between ciliogenesis, centrosomes, and cell cycle regulation, the primary cilium was studied in LGMDR1 and control myoblasts. We found a reduction in the number of ciliated cells in LGMDR1 myoblasts compared to the controls (Figure 25).
4. Discussion
In this work, we analyzed costamere protein distribution in healthy muscle and LGMDR1 patients’ muscles.
4.1. Fiber Type Distribution in Healthy Muscle
The biological meaning of fiber-type specificity of costamere proteins in muscle is not yet well established, but some studies have shown fiber-type distribution [37,47,48]. Our study revealed that ITGβ1D, TLN, ILK and FAK presented fiber-type specificity in healthy muscles, while VCL was expressed in all myofibers. However, we found some discordance with previous work regarding some of these proteins. In this study, we demonstrate that TLN1 shows predominantly fiber-type-I distribution, whereas Andresen and colleagues described a lack of fiber-type specificity of this protein in human muscle [48]. Though different factors (i.e., different muscles examined) could explain this discrepancy, further analysis will be required. Conversely, while we found no fiber type specificity for ITGβ1D, it has been reported to be predominantly expressed in mouse type II fibers [47]. Regarding these data, it is not surprising to find differences in protein distribution among human and animal muscles.
On the other hand, FAK presented a non-sarcolemmal distribution, contrary to what was observed for the rest of the proteins in healthy muscles. In patients, the expression of FAK was reduced in some type I fibers, whereas it was present in all type I fibers in the controls, suggesting that it may also affect muscle fiber development (Figure 9). Indeed, FAK, a non-receptor tyrosine kinase, activates several anti-apoptotic and cell growth pathways by translating the transduction signals carried by integrins across the cytoplasmic membrane [49].
Finally, costamere proteins were found in the microvasculature of the skeletal muscle (ITGβ1D, ILK, TLN1, FAK, VCL, and α- and β-parvins) since they are part of the dense plaques of the observed smooth muscle [50,51,52,53]. Though α- and β-parvins have been described at the sarcolemma in mouse [47] and human muscle fibers [54,55], in our study, they were only expressed in the vascular endothelium. Numerous isoforms of parvin coexist to allow for the formation of different complexes. This might impart distinct functions to each complex [56], and the isoforms we detected may only participate in blood vessels.
4.2. Vascular Endothelium Alteration in LGMDR1
Cells of the vascular endothelium that detect changes, such as tension or pressure in blood flow, activate inflammatory pathways, recruiting leukocytes. Consequently, these cells produce or degrade the ECM and secrete cytokine/chemokines [57]. This could occur in early stages of LGMDR1, when patients show inflammatory changes associated with the presence of eosinophils in the muscle [58], as well as the overexpression of IL-32 [7].
We observed abnormal and swollen vessel morphology in LGMDR1 muscle. ILK, TLN1, FAK, VCL and α- and β-parvins are essential in mechanosensing and determining vasculature morphogenesis [59]. Therefore, the swollen morphology observed may have been caused by an altered distribution of these proteins in the LGMDR1 muscle vessels. In dermatomyositis, an autoimmune disease with an abnormal immune reaction to the vascular endothelium, the number of muscle capillaries per muscle fiber is reduced. Dilatation is also observed to compensate for the loss of capillaries [60,61]. This compensatory mechanism could also explain our observations in LGMDR1, although further studies are required.
4.3. Implication of Altered ITGβ1D Distribution in LGMDR1
Integrins are transmembrane glycoprotein receptors that regulate numerous intracellular signals and biological functions: a) they control myoblast fusion and the migration and assembly of ECM [62,63]; b) they are critical for changes in multiple nuclear components, nuclear regulation and epigenetic changes [64,65,66,67]; and c) they regulate centrosome function, spindle formation and cytokinesis [41].
a) Impaired structure and function of muscle fiber
Integrin activation is essential for normal skeletal muscle development [62,63]. The ITGβ1A isoform is replaced by the ITGβ1D isoform in muscle fiber maturation under normal physiological conditions [68]. This replacement has been shown to be altered in the myotubes of C3KO mice [69] and LGMDR1 patients’ myotubes [11].
The fact that we observed a discontinuous pattern of ITGβ1D labeling on the membrane (Figure 4) suggests that one of its main functions, assembling the ECM, is not occurring properly. ECM remodeling and inflammation are closely related in a variety of biological and pathological processes [70,71,72]. ECM remodeling is brought on by inflammation, and inflammatory processes are modulated by ECM proteins [73]. The two major receptors of fibronectin and collagen/laminin, α5β1 and α2β1, respectively, share the β1 subunit and are implicated in inflammatory signaling [73,74,75]. Thus, the observed accumulation of laminin in the LGMDR1 patient (Figure 5B) could be due to the altered distribution of ITGβ1D. Moreover, it has been reported that canonical Wnt signaling plays a fundamental role in membrane trafficking, causing focal adhesion (FA) proteins’ endocytosis and the elimination of the β1 integrin from the membrane of the cell [76]. FRZB, a Wnt signaling pathway inhibitor, is overexpressed in LGMDR1 patients [11], suggesting that the deregulation of this pathway may be one of the responsible factors contributing to the observed patchy pattern of ITGβ1D in the LGMDR1 muscle fiber. Different signaling pathways may control the interactions between sarcoplasmic proteins and the sarcoplasmic tail of α or β integrin to regulate their activation [77]. TLN1 binds to β integrin sarcoplasmic domains for activation [78,79]. Moreover, when integrin binds to the ECM, Tyrosine (Tyr) phosphorylation of paxillin and FAK occurs, allowing for cell–ECM interaction [80,81]. It has been reported that β1 integrin and FAK are required for myoblast differentiation [82,83]. Furthermore, AKT, PI3K, and mTOR have been documented as the downstream targets of FAK [84]. Finally, previous studies have shown that mTOR expression is also downregulated in LGMDR1 patients´ muscles [27].
Together, the observed ITGβ1D mislocalization, the lack of TLN1 in the sarcolemma and the irregular expression of FAK in LGMDR1 muscles suggest a lack of integrin activation with an altered sarcolemma, ECM assembly and signaling pathway deregulation, which may cause the frailty of the LGMDR1 muscle fibers.
b) Nuclear alterations in muscle and cells
The arrangement of molecular complexes in the sarcoplasm and nucleus can be altered by cell surface receptors [64]. Moreover, costameres are linked to the actin cytoskeleton, and nuclear deformations can result as a consequence of intra- and extracellular forces [67]. It has been suggested that the nucleus can detect applied forces, which may regulate transcriptional activity [85,86]. There is increasing evidence that integrins are critical for changes in nuclear structure, nuclear regulation and epigenetic changes [64,65,66,67]. Therefore, the abnormal nuclear morphology observed in LGMDR1 cells may be a consequence of altered ITGβ1D distribution. Moreover, alterations in nuclear morphology are also related to chromatin rearrangement, and possibly to gene expression changes [65]. The nucleolar expression of TLN1, as well as its association with chromatin and gene expression regulation, has been described in breast epithelial cells [87]. The impaired distribution of TLN1 showed nucleolar disruption in LGMDR1 patients’ myoblasts. Nucleolar disruption is a morphological alteration of the nucleolus derived from cellular stress, presenting dispersion of the nuclear structure [88]. The inhibition of mTOR and metabolic stress are among the factors that cause nucleolar stress [89,90]. In fact, reduced expression and phosphorylation of mTOR and altered expression of proteins involved in the metabolic process have been found in LGMDR1 muscle [27,91], suggesting a possible cause for the observed nucleolar disruption.
c) Centrosome alterations in muscle cells
Reverte and colleagues demonstrated that the integrin β1 tail can regulate centrosome function, spindle formation and cytokinesis [41]. While microtubules control integrin activity and adhesion site remodeling, integrins stimulate microtubule nucleation, growth, and stabilization [92]. Thus, abnormal integrin distribution may be the cause of the increased centrosome–nucleus distance observed in LGMDR1 patients (Figure 20). An increased centrosome–nucleus distance has also been described in fibroblasts from Duchene Muscular Dystrophy (DMD), Emery–Dreifuss, and Charcot–Marie–Tooth syndrome patients [93]. The centrosome is a complex organelle involved in microtubule nucleation and anchoring [13]. α- and β-tubulins are the major components of microtubules and ɣ-tubulin promotes microtubule nucleation [14,94]. Since ɣ-tubulin showed mislocalization in LGMDR1 cells, in consequence, α-tubulin does not polymerize properly, forming the anomalous microtubules observed in LGMDR1 cells. Moreover, it has been reported that the activation of CAPN3 results in the proteolysis of β-tubulin in mouse lenses [95], suggesting that CAPN3 may even play a role in microtubule structure organization in the muscle.
Centrosomes play a key role in chromosome instability, and they precisely maintain correct chromosome segregation during mitosis and cell polarity regulation [96]. The observed aberrant mitosis is a consequence of the altered centrosomes and microtubules structures in LGMDR1 cells. Aneuploidies and trisomies were found in primary cells and muscles from LGMDR1 patients [29], which could be due to the observed alterations. Furthermore, the implication of the centrosomes in nuclear architecture and their function in the nuclear movement during myogenic differentiation are also known [15,44]. This could explain the clustered myonuclei observed in LGMDR1 myotubes [11].
Furthermore, centrosomes form the basal body of primary cilia, which are cellular sensory antennas that function as a hub for different signaling pathways [25], including Wnt and mTOR pathways, which are dysregulated in LGMDR1 patients [27]. The reduced ciliogenesis found in LGMDR1 myoblasts (Figure 25) may further link integrin and centrosome dysfunction with the signaling impairment previously identified in this disease.
In this work, we demonstrate the importance of the correct distribution of ITGβ1D in the muscle. This was observed in the patient with the very benign phenotype (18-38110). This muscle presented areas of ITGβ1D and TLN1 co-localization in the sarcolemma (Figure 8), suggesting that the presence of the ITGβ1D is key to the preservation of myofiber structure and function.
In summary, ITGβ1D is a highly relevant molecule that brings together structural organization and the transmission of cellular signaling through its involvement in the composition of the costamere, the ECM, and the regulation of centrosome integrity, with all of these structures being essential for the survival of the muscle fiber. Thus, muscle fiber formation in response to strain or signaling of any kind is important. It may provide a physical structure for the transmission of mechanical signals to the nucleus for the direct control of gene transcription and adaptation.
According to the involvement of ITGβ1D in a large number of cellular functions, this protein could be considered a good therapeutic target. Indeed, previous in vitro studies have shown that positive outcomes from LGMDR1 myotubes treated with either siFRZB or Tideglusib include an increase in ITGβ1D expression [11,27], therefore suggesting that this is an affordable therapy for the preservation of muscle fiber structure.
Supplementary Materials
The following supporting information can be downloaded at the website of this paper posted on Preprints.org.
Funding
This study has been funded by Instituto de Salud Carlos III (ISCIII) through the project “PI21/00047” and co-funded by the European Union. It has been funded also by Department of Health of the Government of the Basque Country (project ref 2021111022) and Association Française contre les Myopathies (AFM 24743). This work was, in part, supported by the Center for Networked Biomedical Research on Neurodegenerative Diseases (CIBERNED: CB06/05/1126 to Andrea Valls, Jenita Immanuel, Sonia Alonso-Martin, Roberto Fernández-Torrón, Adolfo López de Munain, and Amets Sáenz) and GENE (Association of Neuromuscular diseases of Gipuzkoa).
Acknowledgments
The authors would like to thank the patients and the healthy controls.
References
- Fardeau, M.; Hillaire, D.; Mignard, C.; Feingold, N.; Feingold, J.; Mignard, D.; De Ubeda, B.; Collin, H.; Tomé, F.M.S.; Richard, I.; et al. Juvenile Limb-Girdle Muscular Dystrophy Clinical, Histopathological and Genetic Data from a Small Community Living in the Reunion Island. Brain 1996, 119, 295–308. [CrossRef]
- Urtasun, M.; Sáenz, A.; Roudaut, C.; Poza, J.J.; Urtizberea, J.A.; Cobo, A.M.; Richard, I.; García Bragado, F.; Leturcq, F.; Kaplan, J.C.; et al. Limb-Girdle Muscular Dystrophy in Guipuzcoa (Basque Country, Spain). Brain 1998, 121, 1735–1747. [CrossRef]
- Sorimachi, H.; Imajoh-Ohmi, S.; Emori, Y.; Kawasaki, H.; Ohno, S.; Minami, Y.; Suzuki, K. Molecular Cloning of a Novel Mammalian Calcium-Dependent Protease Distinct from Both m- and μ-Types. Specific Expression of the MRNA in Skeletal Muscle. Journal of Biological Chemistry 1989, 264, 20106–20111. [CrossRef]
- Sorimachi, H.; Toyama-Sorimachi, N.; Saido, T.C.; Kawasaki, H.; Sugita, H.; Miyasaka, M.; Arahata, K.; Ishiura, S.; Suzuki, K. Muscle-Specific Calpain, P94, Is Degraded by Autolysis Immediately after Translation, Resulting in Disappearance from Muscle. J Biol Chem 1993, 268, 10593–10605.
- Sorimachi, H.; Kinbara, K.; Kimura, S.; Takahashi, M.; Ishiura, S.; Sasagawa, N.; Sorimachi, N.; Shimada, H.; Tagawa, K.; Maruyama, K.; et al. Muscle-Specific Calpain, P94, Responsible for Limb Girdle Muscular Dystrophy Type 2A, Associates with Connectin through IS2, a P94-Specific Sequence. Journal of Biological Chemistry 1995, 270, 31158–31162. [CrossRef]
- Kramerova, I.; Kudryashova, E.; Tidball, J.G.; Spencer, M.J. Null Mutation of Calpain 3 (P94) in Mice Causes Abnormal Sarcomere Formation in Vivo and in Vitro. Hum Mol Genet 2004, 13, 1373–1388. [CrossRef]
- Sáenz, A.; Azpitarte, M.; Armañanzas, R.; Leturcq, F.; Alzualde, A.; Inza, I.; García-Bragado, F.; De la Herran, G.; Corcuera, J.; Cabello, A.; et al. Gene Expression Profiling in Limb-Girdle Muscular Dystrophy 2A. PLoS One 2008, 3. [CrossRef]
- Pardo, J. V; Siliciano, J.D.; Craig, S.W. A Vinculin-Containing Cortical Lattice in Skeletal Muscle: Transverse Lattice Elements (“costameres”) Mark Sites of Attachment between Myofibrils and Sarcolemma. Proc Natl Acad Sci U S A 1983, 80, 1008–1012. [CrossRef]
- Danowski, B.A.; Imanaka-Yoshida, K.; Sanger, J.M.; Sanger, J.W. Costameres Are Sites of Force Transmission to the Substratum in Adult Rat Cardiomyocytes. J Cell Biol 1992, 118, 1411–1420. [CrossRef]
- Trimarchi, F.; Favaloro, A.; Fulle, S.; Magaudda, L.; Puglielli, C.; Di Mauro, D. Culture of Human Skeletal Muscle Myoblasts: Timing Appearance and Localization of Dystrophin-Glycoprotein Complex and Vinculin-Talin-Integrin Complex. Cells Tissues Organs 2006, 183, 87–98. [CrossRef]
- Jaka, O.; Casas-Fraile, L.; Azpitarte, M.; Aiastui, A.; López de Munain, A.; Sáenz, A. FRZB and Melusin, Overexpressed in LGMD2A, Regulate Integrin Β1D Isoform Replacement Altering Myoblast Fusion and the Integrin-Signalling Pathway. Expert Rev Mol Med 2017, 19. [CrossRef]
- Pickett-Heaps, J.D. Preprophase Microtubule Bands in Some Abnormal Mitotic Cells of Wheat. J Cell Sci 1969, 4, 397–420. [CrossRef]
- Bornens, M. Centrosome Composition and Microtubule Anchoring Mechanisms. Curr Opin Cell Biol 2002, 14, 25–34. [CrossRef]
- O’Toole, E.; Greenan, G.; Lange, K.I.; Srayko, M.; Müller-Reichert, T. The Role of γ-Tubulin in Centrosomal Microtubule Organization. PLoS One 2012, 7, e29795. [CrossRef]
- Tassin, A.M.; Maro, B.; Bornens, M. Fate of Microtubule-Organizing Centers during Myogenesis in Vitro. J Cell Biol 1985, 100, 35–46. [CrossRef]
- Bugnard, E.; Zaal, K.J.M.; Ralston, E. Reorganization of Microtubule Nucleation during Muscle Differentiation. Cell Motil Cytoskeleton 2005, 60, 1–13. [CrossRef]
- de Andrade Rosa, I.; Corrêa, S.; Costa, M.L.; Mermelstein, C. The Scaffolding Protein Calpain-3 Has Multiple Distributions in Embryonic Chick Muscle Cells and It Is Essential for the Formation of Muscle Fibers. Tissue Cell 2020, 67, 101436. [CrossRef]
- Winter, L.; Kustermann, M.; Ernhofer, B.; Hoger, H.; Bittner, R.E.; Schmidt, W.M. Proteins Implicated in Muscular Dystrophy and Cancer Are Functional Constituents of the Centrosome. Life Sci Alliance 2022, 5, 1–16. [CrossRef]
- Peng, H.; Ong, Y.M.; Shah, W.A.; Holland, P.C.; Carbonetto, S. Integrins Regulate Centrosome Integrity and Astrocyte Polarization Following a Wound. Dev Neurobiol 2013, 73, 333–353. [CrossRef]
- Barker, A.R.; McIntosh, K. V; Dawe, H.R. Centrosome Positioning in Non-Dividing Cells. Protoplasma 2016, 253, 1007–1021. [CrossRef]
- Satir, P. Landmarks in Cilia Research from Leeuwenhoek to US. Cell Motil 1995, 32, 90–94. [CrossRef]
- Satir, P.; Christensen, S.T. Overview of Structure and Function of Mammalian Cilia. Annu Rev Physiol 2007, 69, 377–400. [CrossRef]
- Yuan, S.; Li, J.; Diener, D.R.; Choma, M.A.; Rosenbaum, J.L.; Sun, Z. Target-of-Rapamycin Complex 1 (Torc1) Signaling Modulates Cilia Size and Function through Protein Synthesis Regulation. Proceedings of the National Academy of Sciences 2012, 109, 2021–2026. [CrossRef]
- Rosengren, T.; Larsen, L.J.; Pedersen, L.B.; Christensen, S.T.; Møller, L.B. TSC1 and TSC2 Regulate Cilia Length and Canonical Hedgehog Signaling via Different Mechanisms. Cellular and Molecular Life Sciences 2018, 75, 2663–2680. [CrossRef]
- Anvarian, Z.; Mykytyn, K.; Mukhopadhyay, S.; Pedersen, L.B.; Christensen, S.T. Cellular Signalling by Primary Cilia in Development, Organ Function and Disease. Nat Rev Nephrol 2019, 15, 199–219. [CrossRef]
- Jin, X.; Mohieldin, A.M.; Muntean, B.S.; Green, J.A.; Shah, J. V.; Mykytyn, K.; Nauli, S.M. Cilioplasm Is a Cellular Compartment for Calcium Signaling in Response to Mechanical and Chemical Stimuli. Cellular and Molecular Life Sciences 2014, 71, 2165–2178. [CrossRef]
- Rico, A.; Guembelzu, G.; Palomo, V.; Martínez, A.; Aiastui, A.; Casas-fraile, L.; Valls, A.; de Munain, A.L.; Sáenz, A. Allosteric Modulation of GSK-3β as a New Therapeutic Approach in Limb Girdle Muscular Dystrophy R1 Calpain 3-related. Int J Mol Sci 2021, 22. [CrossRef]
- Ding, F.; Huang, D.; Wang, M.; Peng, J. An 86 Amino Acids Motif in CAPN3 Is Essential for Formation of the Nucleolus-Localized Def-CAPN3 Complex. Biochem Biophys Res Commun 2022, 623, 66–73. [CrossRef]
- Schmidt, W.M.; Uddin, M.H.; Dysek, S.; Moser-Thier, K.; Pirker, C.; Höger, H.; Ambros, I.M.; Ambros, P.F.; Berger, W.; Bittner, R.E. DNA Damage, Somatic Aneuploidy, and Malignant Sarcoma Susceptibility in Muscular Dystrophies. PLoS Genet 2011, 7, e1002042. [CrossRef]
- Teixidó-Travesa, N.; Roig, J.; Lüders, J. The Where, When and How of Microtubule Nucleation – One Ring to Rule Them All. J Cell Sci 2012. [CrossRef]
- Tovey, C.A.; Conduit, P.T. Microtubule Nucleation by γ-Tubulin Complexes and Beyond. Essays Biochem 2018, 62, 765–780. [CrossRef]
- Caspary, T.; Larkins, C.E.; Anderson, K. V The Graded Response to Sonic Hedgehog Depends on Cilia Architecture. Dev Cell 2007, 12, 767–778. [CrossRef]
- Mansour, H.; de Tombe, P.P.; Samarel, A.M.; Russell, B. Restoration of Resting Sarcomere Length After Uniaxial Static Strain Is Regulated by Protein Kinase Cε and Focal Adhesion Kinase. Circ Res 2004, 94, 642–649. [CrossRef]
- Ervasti, J.M. Costameres: The Achilles’ Heel of Herculean Muscle. Journal of Biological Chemistry 2003, 278, 13591–13594. [CrossRef]
- Hodges, B.L.; Kaufman, S.J. Developmental Regulation and Functional Significance of Alternative Splicing of NCAM and 7 1 Integrin in Skeletal Muscle. BAM-PADOVA 1996, 6, 437–448.
- Pardo, J. V; Siliciano, J.D.; Craig, S.W. Vinculin Is a Component of an Extensive Network of Myofibril-Sarcolemma Attachment Regions in Cardiac Muscle Fibers. J Cell Biol 1983, 97, 1081–1088. [CrossRef]
- Anastasi, G.; Cutroneo, G.; Rizzo, G.; Arco, A.; Santoro, G.; Bramanti, P.; Vitetta, A.G.; Pisani, A.; Trimarchi, F.; Favaloro, A. Sarcoglycan and Integrin Localization in Normal Human Skeletal Muscle: A Confocal Laser Scanning Microscope Study. European Journal of Histochemistry 2004, 48, 245–252.
- Pardo, J. V; D’Angelo Siliciano, J.; Craig, S.W. A Vinculin-Containing Cortical Lattice in Skeletal Muscle: Transverse Lattice Elements ('costameres’) Mark Sites of Attachment between Myofibrils and Sarcolemma. Proc Natl Acad Sci U S A 1983, 80, 1008–1012. [CrossRef]
- Korthuis, R.J. Skeletal Muscle Circulation. Colloquium Series on Integrated Systems Physiology: From Molecule to Function 2011, 3, 1–144. [CrossRef]
- Di Tomaso, M.V.; Liddle, P.; Lafon-Hughes, L.; Laura, A.; Folle, G. Chromatin Damage Patterns Shift According to Eu/ Heterochromatin Replication. In The Mechanisms of DNA Replication; InTech, 2013.
- Reverte, C.G.; Benware, A.; Jones, C.W.; LaFlamme, S.E. Perturbing Integrin Function Inhibits Microtubule Growth from Centrosomes, Spindle Assembly, and Cytokinesis. Journal of Cell Biology 2006, 174, 491–497. [CrossRef]
- Ng, D.C.H.; Ho, U.Y.; Grounds, M.D. Cilia, Centrosomes and Skeletal Muscle. Int J Mol Sci 2021, 22, 1–16. [CrossRef]
- Park, R.S.; Légier G., M.F.; Cartwright, J.; Goldstein, M.A. Perinuclear Microtubules in Postnatal Rat Heart. J Morphol 1984, 179, 13–19. [CrossRef]
- Espigat-Georger, A.; Dyachuk, V.; Chemin, C.; Emorine, L.; Merdes, A. Nuclear Alignment in Myotubes Requires Centrosome Proteins Recruited by Nesprin-1. J Cell Sci 2016, 129, 4227–4237. [CrossRef]
- Roman, W.; Gomes, E.R. Nuclear Positioning in Skeletal Muscle. Semin Cell Dev Biol 2018, 82, 51–56. [CrossRef]
- Khodjakov, A.; Cole, R.W.; Oakley, B.R.; Rieder, C.L. Centrosome-Independent Mitotic Spindle Formation in Vertebrates. Current Biology 2000, 10, 59–67. [CrossRef]
- Mathes, S.; Vanmunster, M.; Bloch, W.; Suhr, F. Evidence for Skeletal Muscle Fiber Type-Specific Expressions of Mechanosensors. Cellular and Molecular Life Sciences 2019, 76, 2987–3004. [CrossRef]
- Andresen, B.; de Marees, M.; Schiffer, T.; Bloch, W.; Suhr, F. Skeletal Muscle Fiber Type-Specific Expressions of Mechanosensors Integrin-Linked Kinase, Talin, and Vinculin and Their Modulation by Loading and Environmental Conditions in Humans. FASEB Journal 2022, 36, 1–19. [CrossRef]
- Graham, Z.A.; Gallagher, P.M.; Cardozo, C.P. Focal Adhesion Kinase and Its Role in Skeletal Muscle. J Muscle Res Cell Motil 2015, 36, 305–315. [CrossRef]
- Turner, C.E.; Kramarcy, N.; Sealock, R.; Burridge, K. Localization of Paxillin, a Focal Adhesion Protein, to Smooth Muscle Dense Plaques, and the Myotendinous and Neuromuscular Junctions of Skeletal Muscle. Exp Cell Res 1991, 192, 651–655. [CrossRef]
- Draeger, A.; Amos, W.B.; Ikebe, M.; Small, J. V The Cytoskeletal and Contractile Apparatus of Smooth Muscle: Contraction Bands and Segmentation of the Contractile Elements. Journal of Cell Biology 1990, 111, 2463–2473. [CrossRef]
- Javerzat, S.; Franco, M.; Herbert, J.; Platonova, N.; Peille, A.-L.; Pantesco, V.; De Vos, J.; Assou, S.; Bicknell, R.; Bikfalvi, A.; et al. Correlating Global Gene Regulation to Angiogenesis in the Developing Chick Extra-Embryonic Vascular System. PLoS One 2009, 4, e7856. [CrossRef]
- Sit, B.; Gutmann, D.; Iskratsch, T. Costameres, Dense Plaques and Podosomes: The Cell Matrix Adhesions in Cardiovascular Mechanosensing. J Muscle Res Cell Motil 2019, 40, 197–209. [CrossRef]
- Yamaji, S.; Suzuki, A.; Sugiyama, Y.; Koide, Y.I.; Yoshida, M.; Kanamori, H.; Mohri, H.; Ohno, S.; Ishigatsubo, Y. A Novel Integrin-Linked Kinase-Binding Protein, Affixin, Is Involved in the Early Stage of Cell-Substrate Interaction. Journal of Cell Biology 2001, 153, 1251–1264. [CrossRef]
- Matsuda, C.; Kameyama, K.; Tagawa, K.; Ogawa, M.; Suzuki, A.; Yamaji, S.; Okamoto, H.; Nishino, I.; Hayashi, Y.K. Dysferlin Interacts with Affixin (β-Parvin) at the Sarcolemma. J Neuropathol Exp Neurol 2005, 64, 334–340. [CrossRef]
- Sepulveda, J.L.; Gkretsi, V.; Wu, C. Assembly and Signaling of Adhesion Complexes. In; 2005; pp. 183–225.
- Budatha, M.; Zhang, J.; Schwartz, M.A. Fibronectin-Mediated Inflammatory Signaling Through Integrin A5 in Vascular Remodeling. J Am Heart Assoc 2021, 10. [CrossRef]
- Krahn, M.; Goicoechea, M.; Hanisch, F.; Groen, E.; Bartoli, M.; Pécheux, C.; Garcia-Bragado, F.; Leturcq, F.; Jeannet, P.Y.; Lobrinus, J.A.; et al. Eosinophilic Infiltration Related to CAPN3 Mutations: A Pathophysiological Component of Primary Calpainopathy? Clin Genet 2011, 80, 398–402. [CrossRef]
- Pitter, B.; Werner, A.-C.; Montanez, E. Parvins Are Required for Endothelial Cell–Cell Junctions and Cell Polarity During Embryonic Blood Vessel Formation. Arterioscler Thromb Vasc Biol 2018, 38, 1147–1158. [CrossRef]
- Dalakas, M.C. Immunopathogenesis of Inflammatory Myopathies. Ann Neurol 1995, 37, 74–86. [CrossRef]
- Thompson, C.; Piguet, V.; Choy, E. The Pathogenesis of Dermatomyositis. British Journal of Dermatology 2018, 179, 1256–1262. [CrossRef]
- Palecek, S.P.; Schmidt, C.E.; Lauffenburger, D.A.; Horwitz, A.F. Integrin Dynamics on the Tail Region of Migrating Fibroblasts. J Cell Sci 1996, 109, 941–952. [CrossRef]
- Schwander, M.; Leu, M.; Stumm, M.; Dorchies, O.M.; Ruegg, U.T.; Schittny, J.; Müller, U. Β1 Integrins Regulate Myoblast Fusion and Sarcomere Assembly. Dev Cell 2003, 4, 673–685. [CrossRef]
- Maniotis, A.J.; Chen, C.S.; Ingber, D.E. Demonstration of Mechanical Connections between Integrins, Cytoskeletal Filaments, and Nucleoplasm That Stabilize Nuclear Structure. Proc Natl Acad Sci U S A 1997, 94, 849–854. [CrossRef]
- Thomas, C.H.; Collier, J.H.; Sfeir, C.S.; Healy, K.E. Engineering Gene Expression and Protein Synthesis by Modulation of Nuclear Shape. Proc Natl Acad Sci U S A 2002, 99, 1972–1977. [CrossRef]
- Zhang, X.; Cook, P.C.; Zindy, E.; Williams, C.J.; Jowitt, T.A.; Streuli, C.H.; MacDonald, A.S.; Redondo-Muñoz, J. Integrin A4β1 Controls G9a Activity That Regulates Epigenetic Changes and Nuclear Properties Required for Lymphocyte Migration. Nucleic Acids Res 2015, 44, 3031–3044. [CrossRef]
- Zwerger, M.; Ho, C.Y.; Lammerding, J. Nuclear Mechanics in Disease. Annu Rev Biomed Eng 2011, 13, 397–428. [CrossRef]
- Belkin, A.M.; Zhidkova, N.I.; Balzac, F.; Altruda, F.; Tomatis, D.; Maier, A.; Tarone, G.; Koteliansky, V.E.; Burridge, K. Β1D Integrin Displaces the Β1A Isoform in Striated Muscles: Localization at Junctional Structures and Signaling Potential in Nonmuscle Cells. Journal of Cell Biology 1996, 132, 211–226. [CrossRef]
- Kramerova, I.; Kudryashova, E.; Wu, B.; Spencer, M.J. Regulation of the M-Cadherin-β-Catenin Complex by Calpain 3 during Terminal Stages of Myogenic Differentiation. Mol Cell Biol 2006, 26, 8437–8447. [CrossRef]
- Papageorgiou, A.P.; Heymans, S. Interactions between the Extracellular Matrix and Inflammation during Viral Myocarditis. Immunobiology 2012, 217, 503–510. [CrossRef]
- Gaudet, A.D.; Popovich, P.G. Extracellular Matrix Regulation of Inflammation in the Healthy and Injured Spinal Cord. Exp Neurol 2014, 258, 24–34. [CrossRef]
- Bollyky, P.L.; Bogdani, M.; Bollyky, J.B.; Hull, R.L.; Wight, T.N. The Role of Hyaluronan and the Extracellular Matrix in Islet Inflammation and Immune Regulation. Curr Diab Rep 2012, 12, 471–480. [CrossRef]
- Yun, S.; Budatha, M.; Dahlman, J.E.; Coon, B.G.; Ryan, T.; Langer, R.; Anderson, D.G.; Baillie, G.; Martin, A. Inflammatory Signalling. 2017, 18, 1043–1053.
- Yurdagul, A.; Green, J.; Albert, P.; McInnis, M.C.; Mazar, A.P.; Orr, A.W. A5Β1 Integrin Signaling Mediates Oxidized Low-Density Lipoprotein-Induced Inflammation and Early Atherosclerosis. Arterioscler Thromb Vasc Biol 2014, 34, 1362–1373. [CrossRef]
- Orr, A.W.; Ginsberg, M.H.; Shattil, S.J.; Deckmyn, H.; Schwartz, M.A. Matrix-Specific Suppression of Integrin Activation in Shear Stress Signaling. Mol Biol Cell 2006, 17, 4686–4697. [CrossRef]
- Tejeda-Muñoz, N.; Morselli, M.; Moriyama, Y.; Sheladiya, P.; Pellegrini, M.; De Robertis, E.M. Canonical Wnt Signaling Induces Focal Adhesion and Integrin Beta-1 Endocytosis. iScience 2022, 25, 104123. [CrossRef]
- Hynes, R.O. Integrins. Cell 2002, 110, 673–687. [CrossRef]
- Calderwood, D.A.; Zent, R.; Grant, R.; Rees, D.J.G.; Hynes, R.O.; Ginsberg, M.H. The Talin Head Domain Binds to Integrin β Subunit Cytoplasmic Tails and Regulates Integrin Activation. Journal of Biological Chemistry 1999, 274, 28071–28074. [CrossRef]
- Tadokoro, S.; Shattil, S.J.; Eto, K.; Tai, V.; Liddington, R.C.; De Pereda, J.M.; Ginsberg, M.H.; Calderwood, D.A. Talin Binding to Integrin β Tails: A Final Common Step in Integrin Activation. Science (1979) 2003, 302, 103–106. [CrossRef]
- Hu, Y.L.; Lu, S.; Szeto, K.W.; Sun, J.; Wang, Y.; Lasheras, J.C.; Chien, S. FAK and Paxillin Dynamics at Focal Adhesions in the Protrusions of Migrating Cells. Sci Rep 2014, 4, 1–7. [CrossRef]
- Bellis, S.L.; Miller, J.T.; Turner, C.E. Characterization of Tyrosine Phosphorylation of Paxillin in Vitro by Focal Adhesion Kinase. Journal of Biological Chemistry 1995, 270, 17437–17441. [CrossRef]
- Boppart, M.D.; Mahmassani, Z.S. Integrin Signaling: Linking Mechanical Stimulation to Skeletal Muscle Hypertrophy. Am J Physiol Cell Physiol 2019, 317, C629–C641. [CrossRef]
- Hour, T.C.; Lan Nhi, N.T.; Lai, I.J.; Chuu, C.P.; Lin, P.C.; Chang, H.W.; Su, Y.F.; Chen, C.H.; Chen, Y.K. Kaempferol-Enhanced Migration and Differentiation of C2C12 Myoblasts via ITG1B/FAK/Paxillin and IGF1R/AKT/MTOR Signaling Pathways. Mol Nutr Food Res 2024, 68, 1–14. [CrossRef]
- Zhu, W.; Wu, C.; Liu, Z.; Zhao, S.; Cheng, X.; Huang, J. SULF1 Regulates Malignant Progression of Colorectal Cancer by Modulating ARSH via FAK/PI3K/AKT/MTOR Signaling. Cancer Cell Int 2024, 24, 1–19. [CrossRef]
- Guilak, F.; Tedrow, J.R.; Burgkart, R. Viscoelastic Properties of the Cell Nucleus. Biochem Biophys Res Commun 2000, 269, 781–786. [CrossRef]
- Rowat, A.C.; Lammerding, J.; Herrmann, H.; Aebi, U. Towards an Integrated Understanding of the Structure and Mechanics of the Cell Nucleus. BioEssays 2008, 30, 226–236. [CrossRef]
- Silva, A.J. Da; Hästbacka, H.S.E.; Puustinen, M.C.; Pessa, J.C.; Goult, B.T.; Jacquemet, G.; Henriksson, E.; Sistonen, L. A Subpopulation of Talin 1 Resides in the Nucleus and Regulates Gene Expression. bioRxiv preprint 2022, 2022.03.15.484419.
- Rubbi, C.P.; Milner, J. Disruption of the Nuclear Organisation of P53 in Response to DNA Stress. Embo 2003, 22, 6068–6077.
- Yang, K.; Yang, J.; Yi, J. Nucleolar Stress: Hallmarks, Sensing Mechanism and Diseases. Cell Stress 2018, 2, 125–140. [CrossRef]
- Goudarzi, K.M.; Nistér, M.; Lindström, M.S. MTOR Inhibitors Blunt the P53 Response to Nucleolar Stress by Regulating RPL11 and MDM2 Levels. Cancer Biol Ther 2014, 15, 1499–1514. [CrossRef]
- Rico, A.; Valls, A.; Guembelzu, G.; Azpitarte, M.; Aiastui, A.; Zufiria, M.; Jaka, O.; López de Munain, A.; Sáenz, A. Altered Expression of Proteins Involved in Metabolism in LGMDR1 Muscle Is Lost in Cell Culture Conditions. Orphanet J Rare Dis 2023, 18, 315. [CrossRef]
- LaFlamme, S.E.; Mathew-Steiner, S.; Singh, N.; Colello-Borges, D.; Nieves, B. Integrin and Microtubule Crosstalk in the Regulation of Cellular Processes. Cellular and Molecular Life Sciences 2018, 75, 4177–4185. [CrossRef]
- Taranum, S.; Vaylann, E.; Meinke, P.; Abraham, S.; Yang, L.; Neumann, S.; Karakesisoglou, I.; Wehnert, M.; Noegel, A.A. LINC Complex Alterations in DMD and EDMD/CMT Fibroblasts. Eur J Cell Biol 2012, 91, 614–628. [CrossRef]
- Oakley, B.R. An Abundance of Tubulins. Trends Cell Biol 2000, 10, 537–542. [CrossRef]
- Joseph, R.; Robinson, M.L.; Lambert, L.; Srivastava, O.P. Lens-Specific ΒA3/A1-Conditional Knockout Mice: Phenotypic Characteristics and Calpain Activation Causing Protein Degradation and Insolubilization. PLoS One 2023, 18, 1–24. [CrossRef]
- Piemonte, K.M.; Anstine, L.J.; Keri, R.A. Centrosome Aberrations as Drivers of Chromosomal Instability in Breast Cancer. Endocrinology (United States) 2021, 162, 1–14. [CrossRef]
Figure 1.
Costamere proteins distribution in skeletal muscle sections of healthy control muscles. (A) Immunofluorescence representative images of ILK, VCL, ITGβ1D, FAK and TLN1 (green), MYHC I (red), DYS (white) in control muscle fibers. Hoechst (blue) as nuclear marker. Scale bars: 50 μm. (B) Fluorescence intensity quantification of costamere proteins (N=2). Error bars represent Standard Error of the Mean (SEM). ***p<0.001, ****p<0.0001.
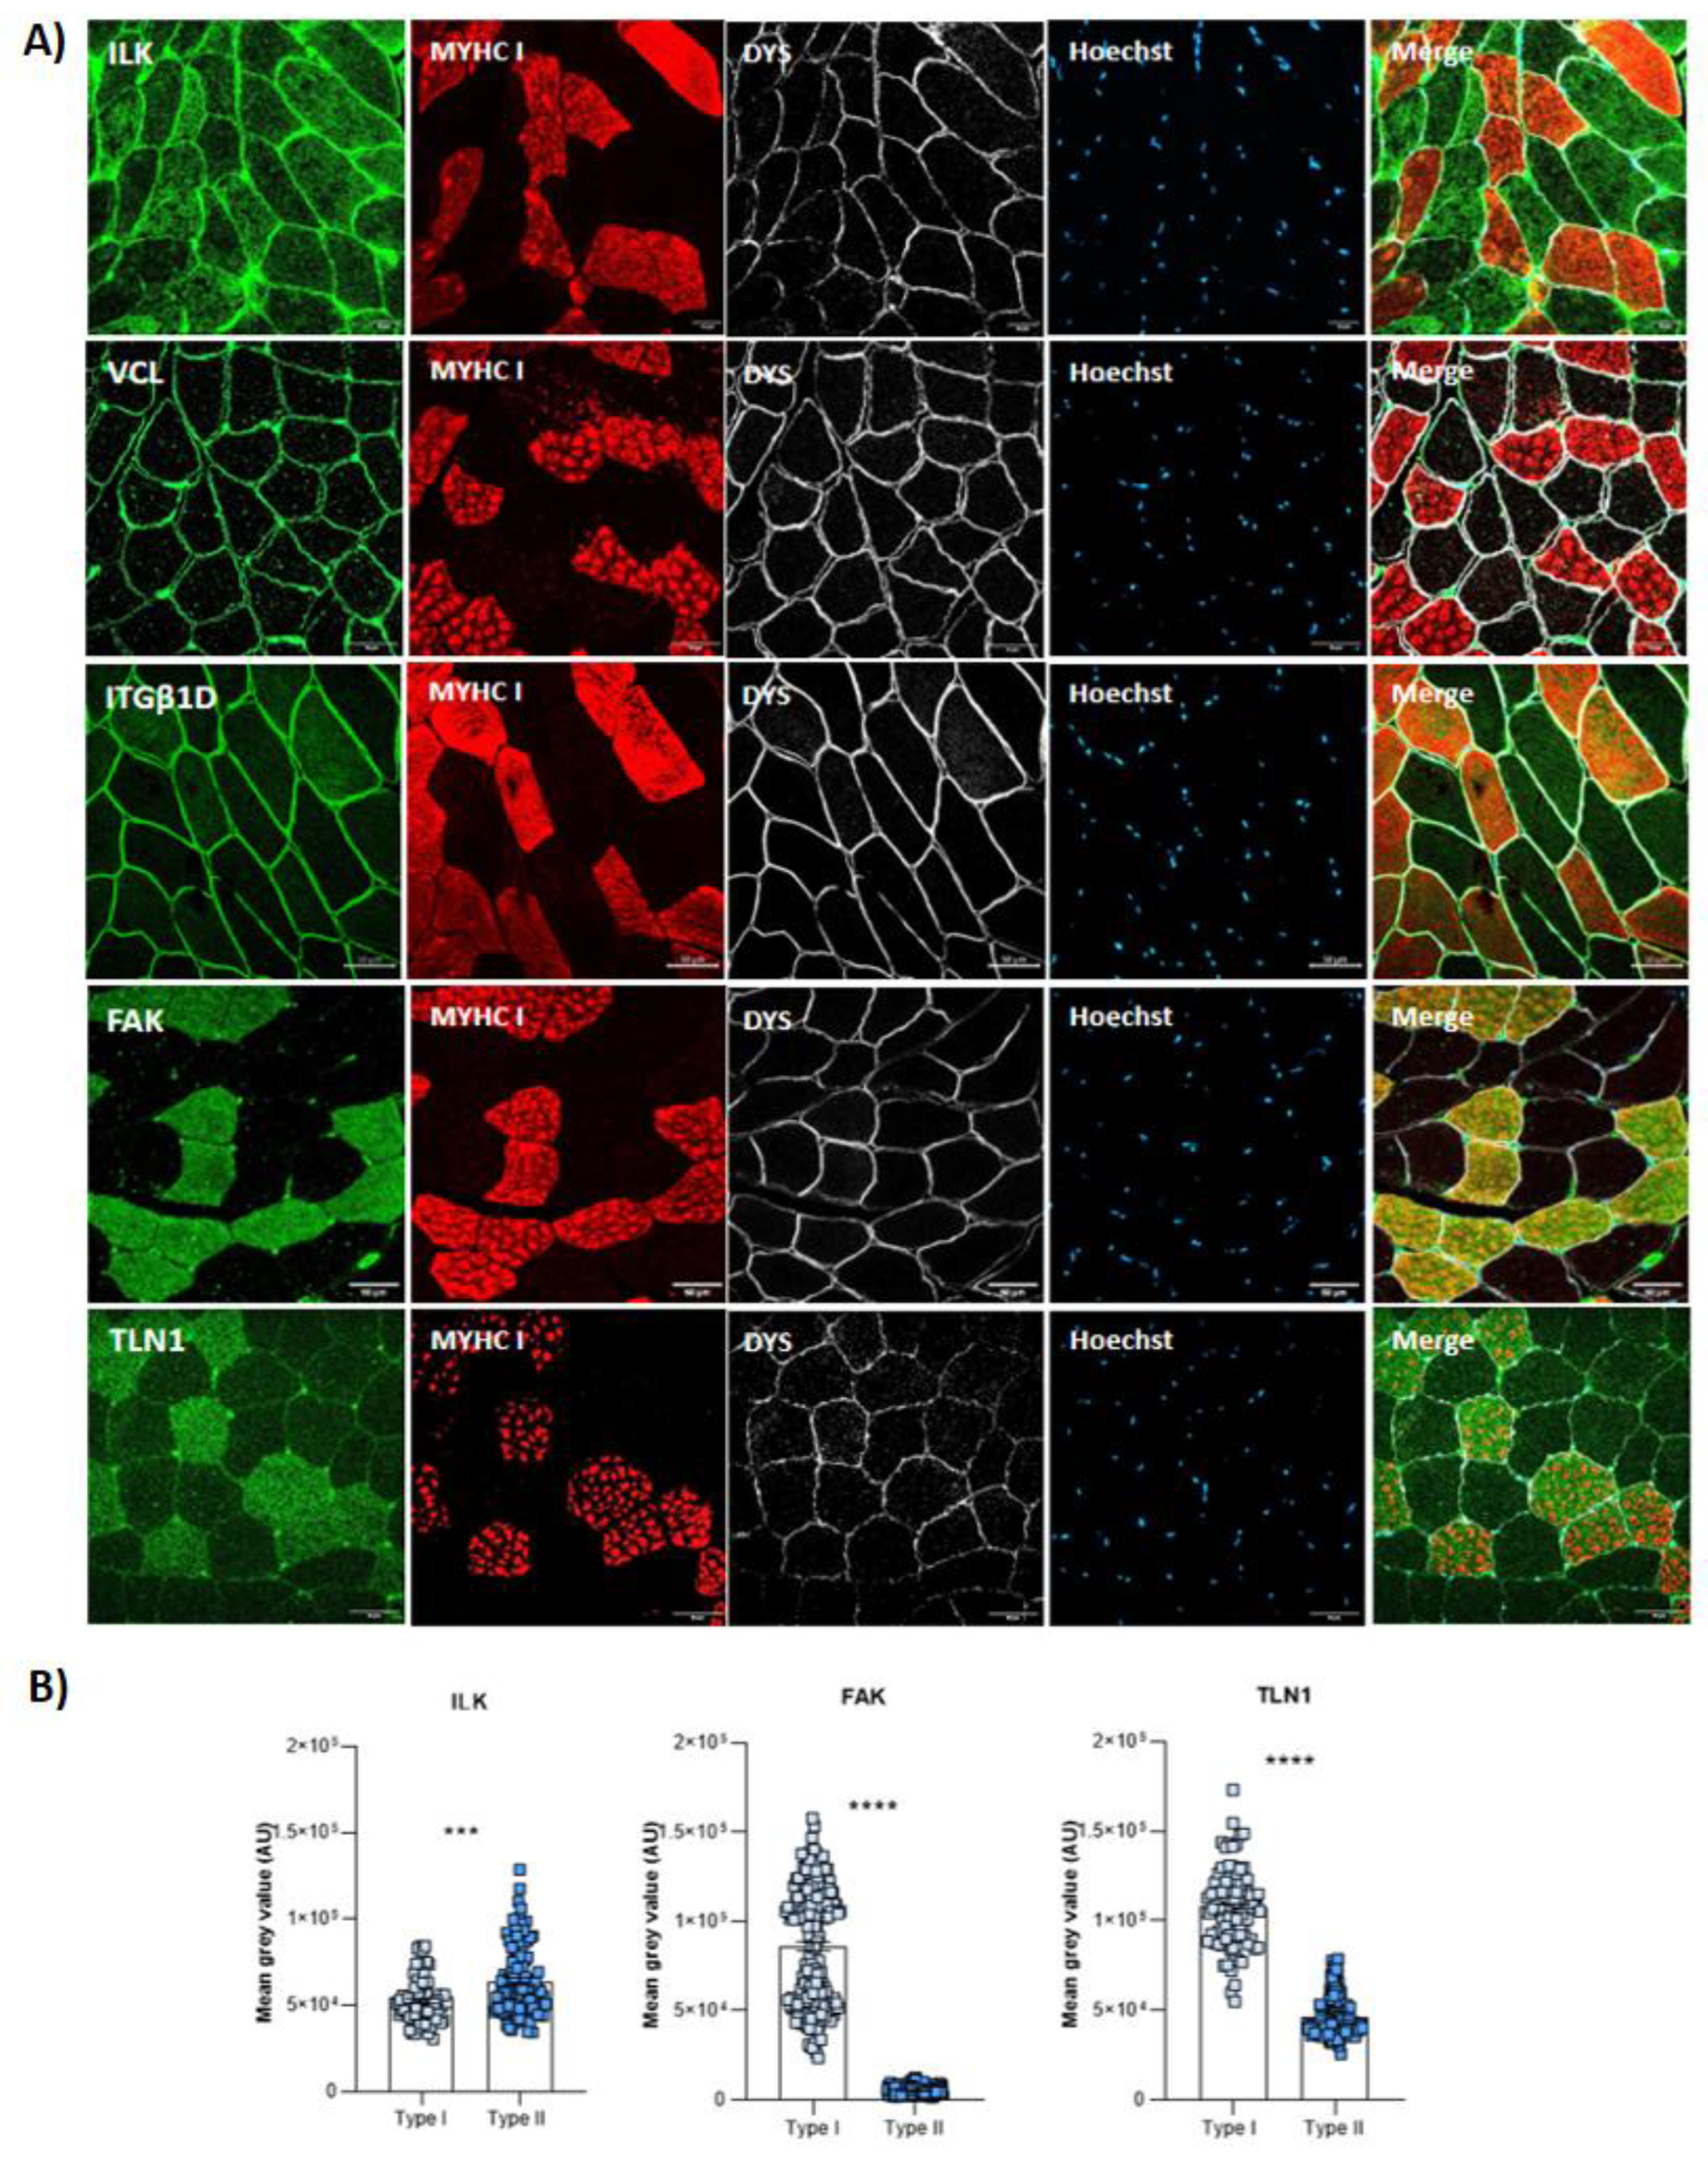
Figure 2.
Distribution of α- and β -parvins in the muscle fiber (A) and vascular endothelial distribution of β -parvin (B) in healthy control muscles. Ulex as vascular endothelium marker. Scale bars: 30 μm (A and B upper panel) and 10 μm (B lower panel). (A) α- and β -parvins (green), dystrophin (red), Hoechst (blue) (B) β -parvin (red), ulex (green), Hoechst (blue), dystrophin (white).
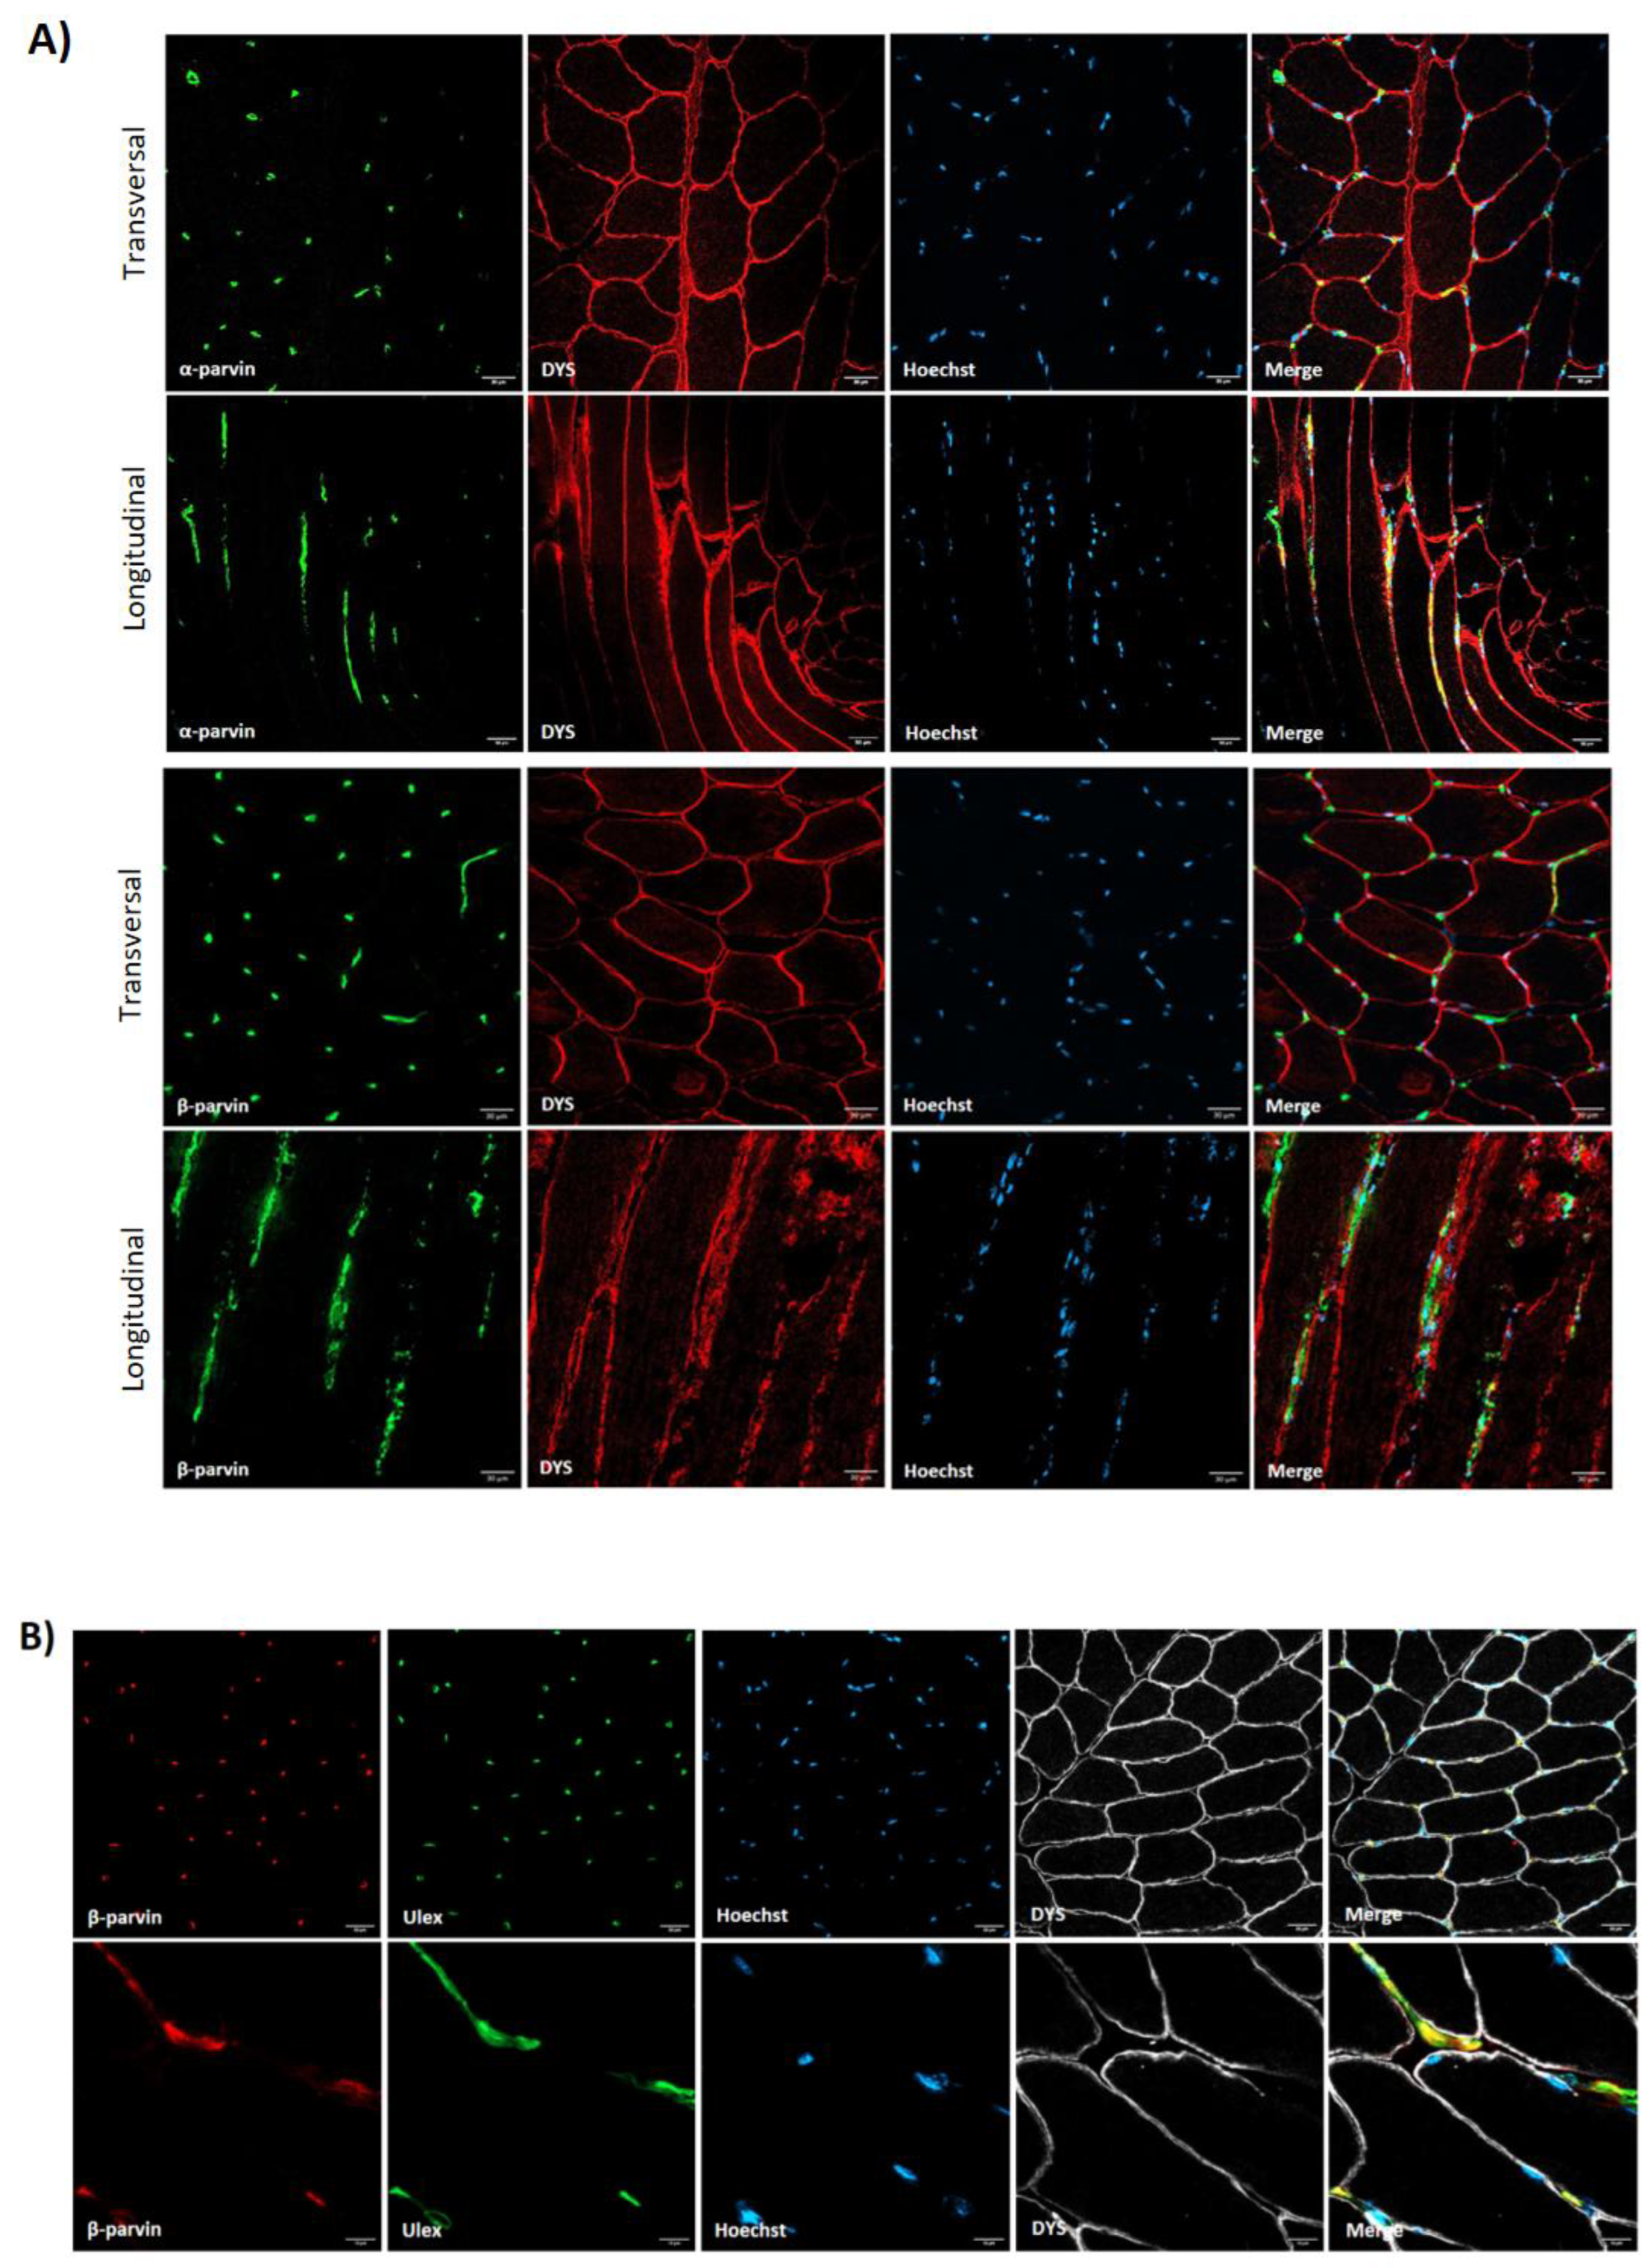
Figure 3.
Ulex and costamere proteins co-staining in healthy control muscle. Scale bars: 50 µm. Ulex (geen), ILK, VCL, FAK and TLN1 (red), dystrophin (white).
Figure 3.
Ulex and costamere proteins co-staining in healthy control muscle. Scale bars: 50 µm. Ulex (geen), ILK, VCL, FAK and TLN1 (red), dystrophin (white).
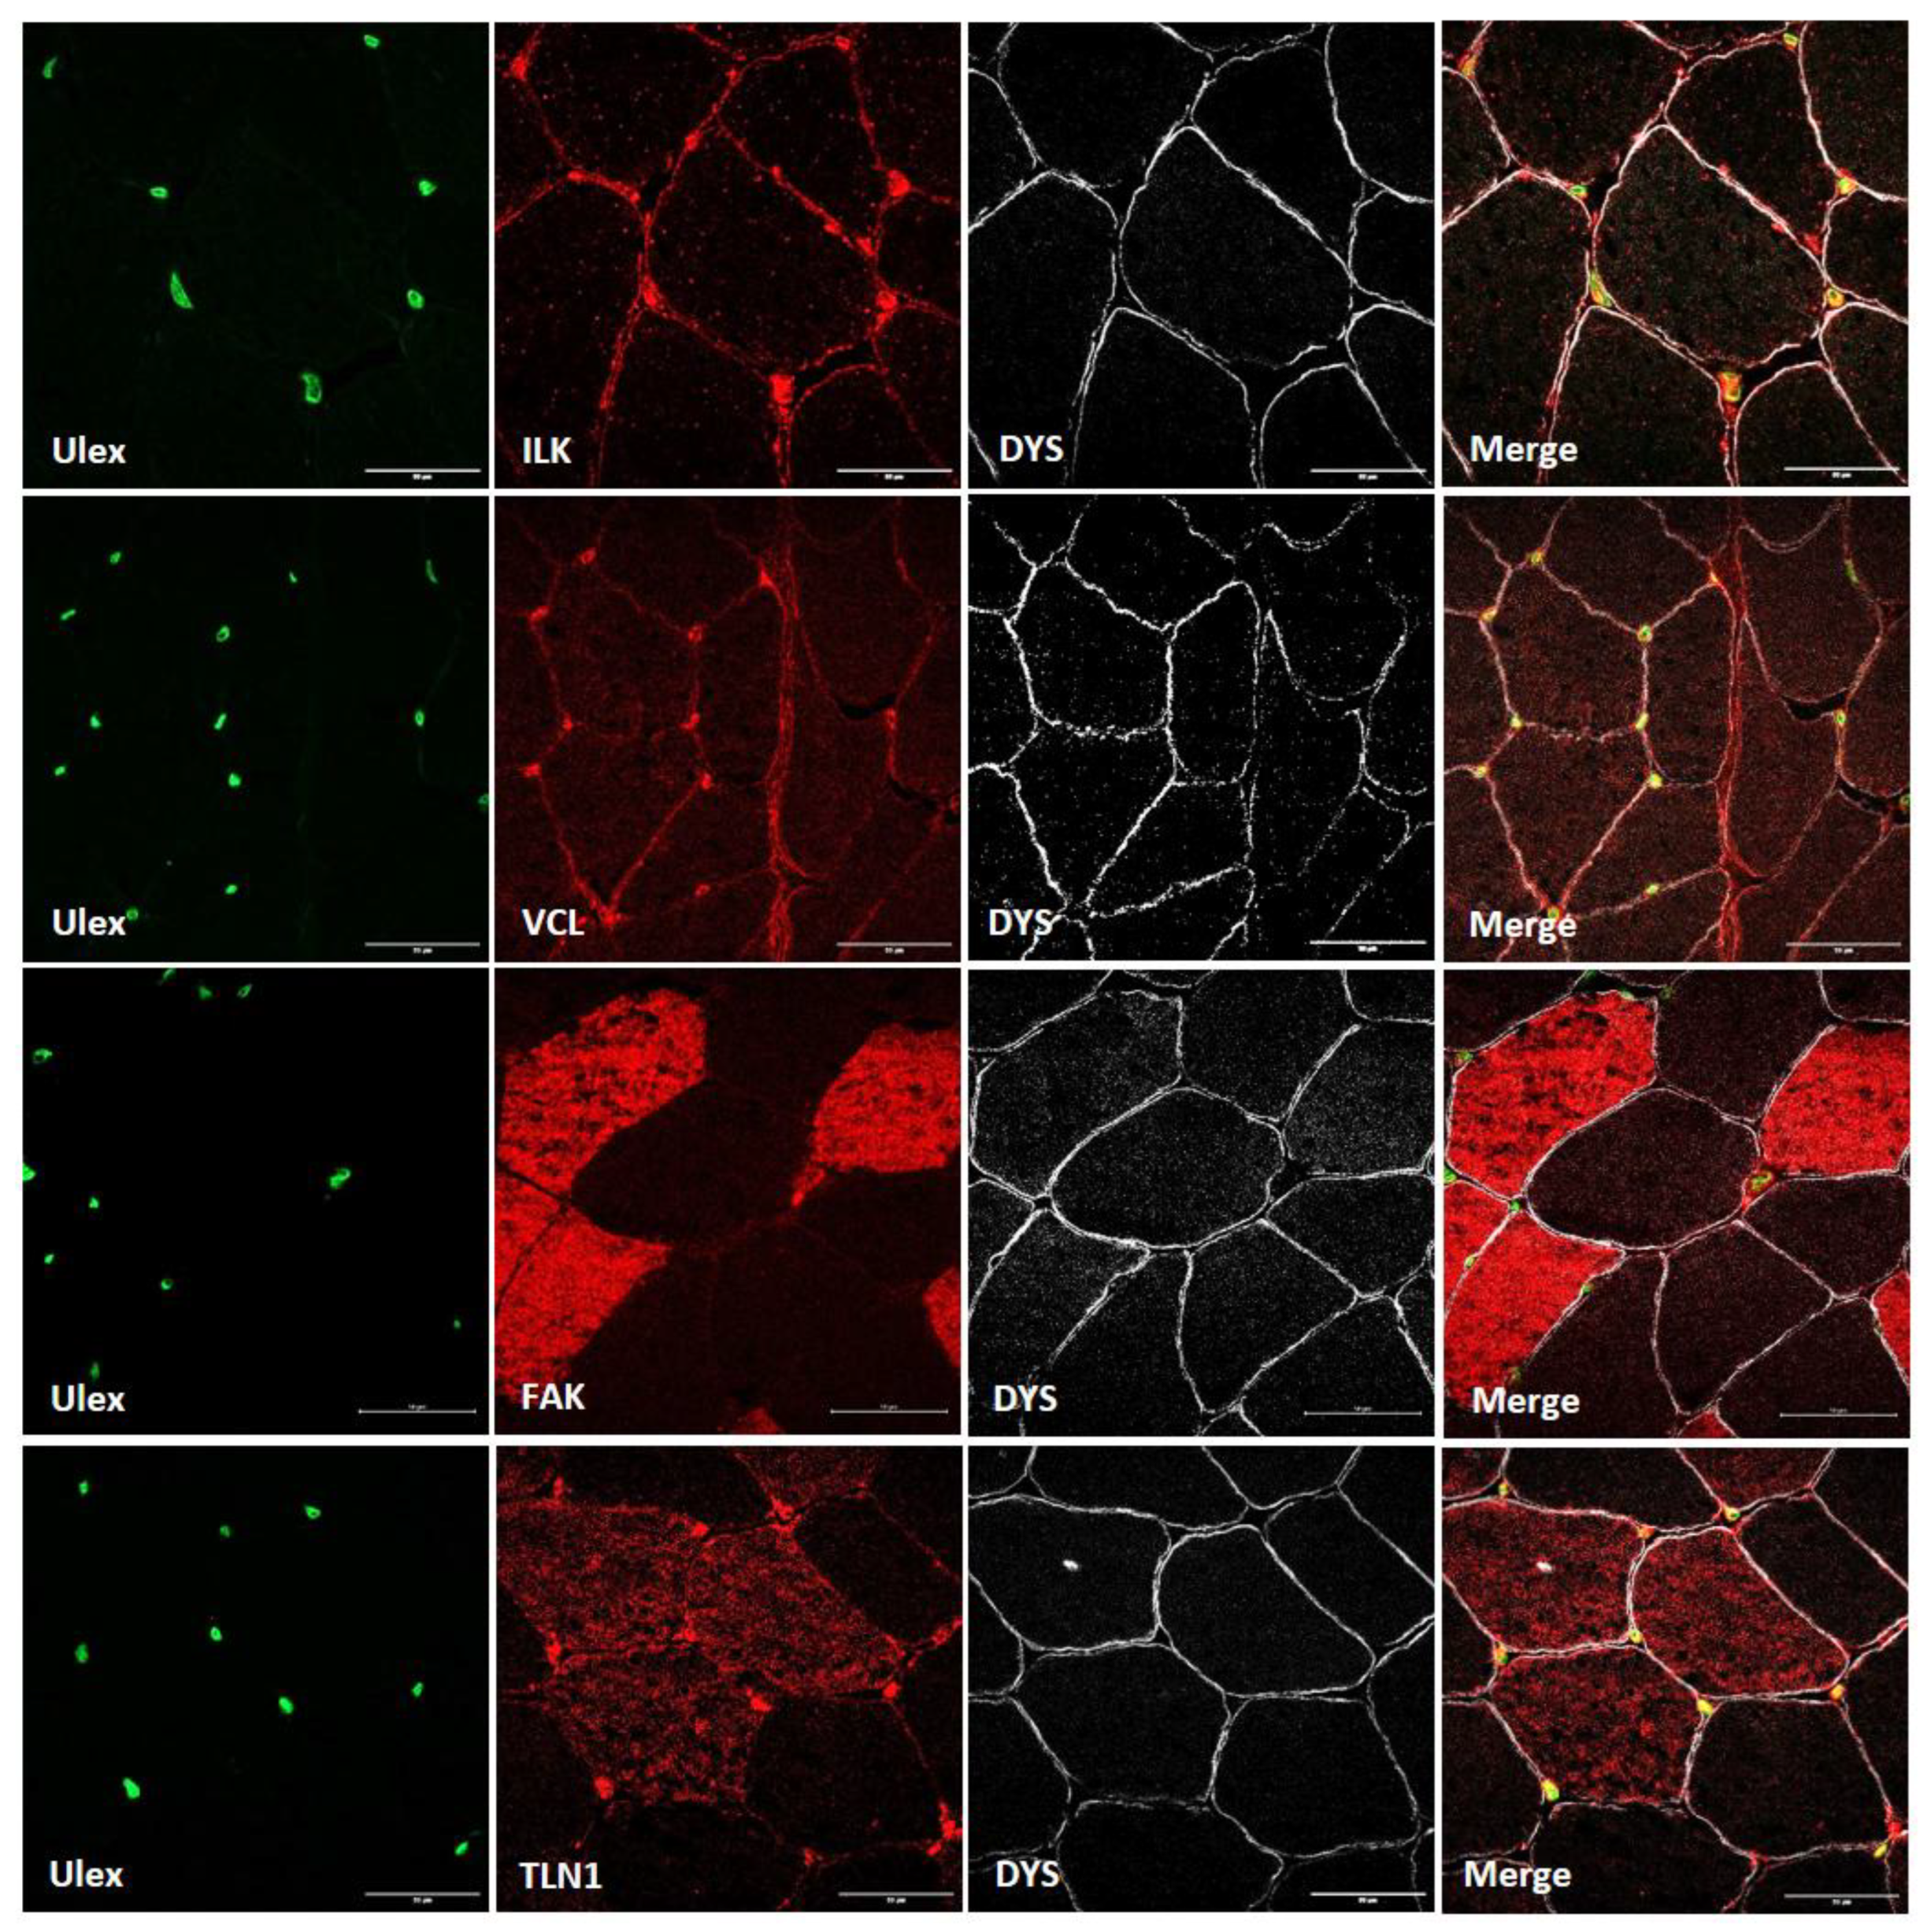
Figure 4.
Discontinuous sarcolemmal distribution of ITGβ1D in the muscle of two LGMDR1 patients (LGMDR1* patient with a very mild phenotype). White arrows indicate areas without ITGβ1D expression. Scale bars: 50 µm. Merge*, higher magnification of white squares. Scale bars: 20 µm. ITGβ1D (green), Dystrophin (A)/laminin (B) as sarcolemmal markers (red).
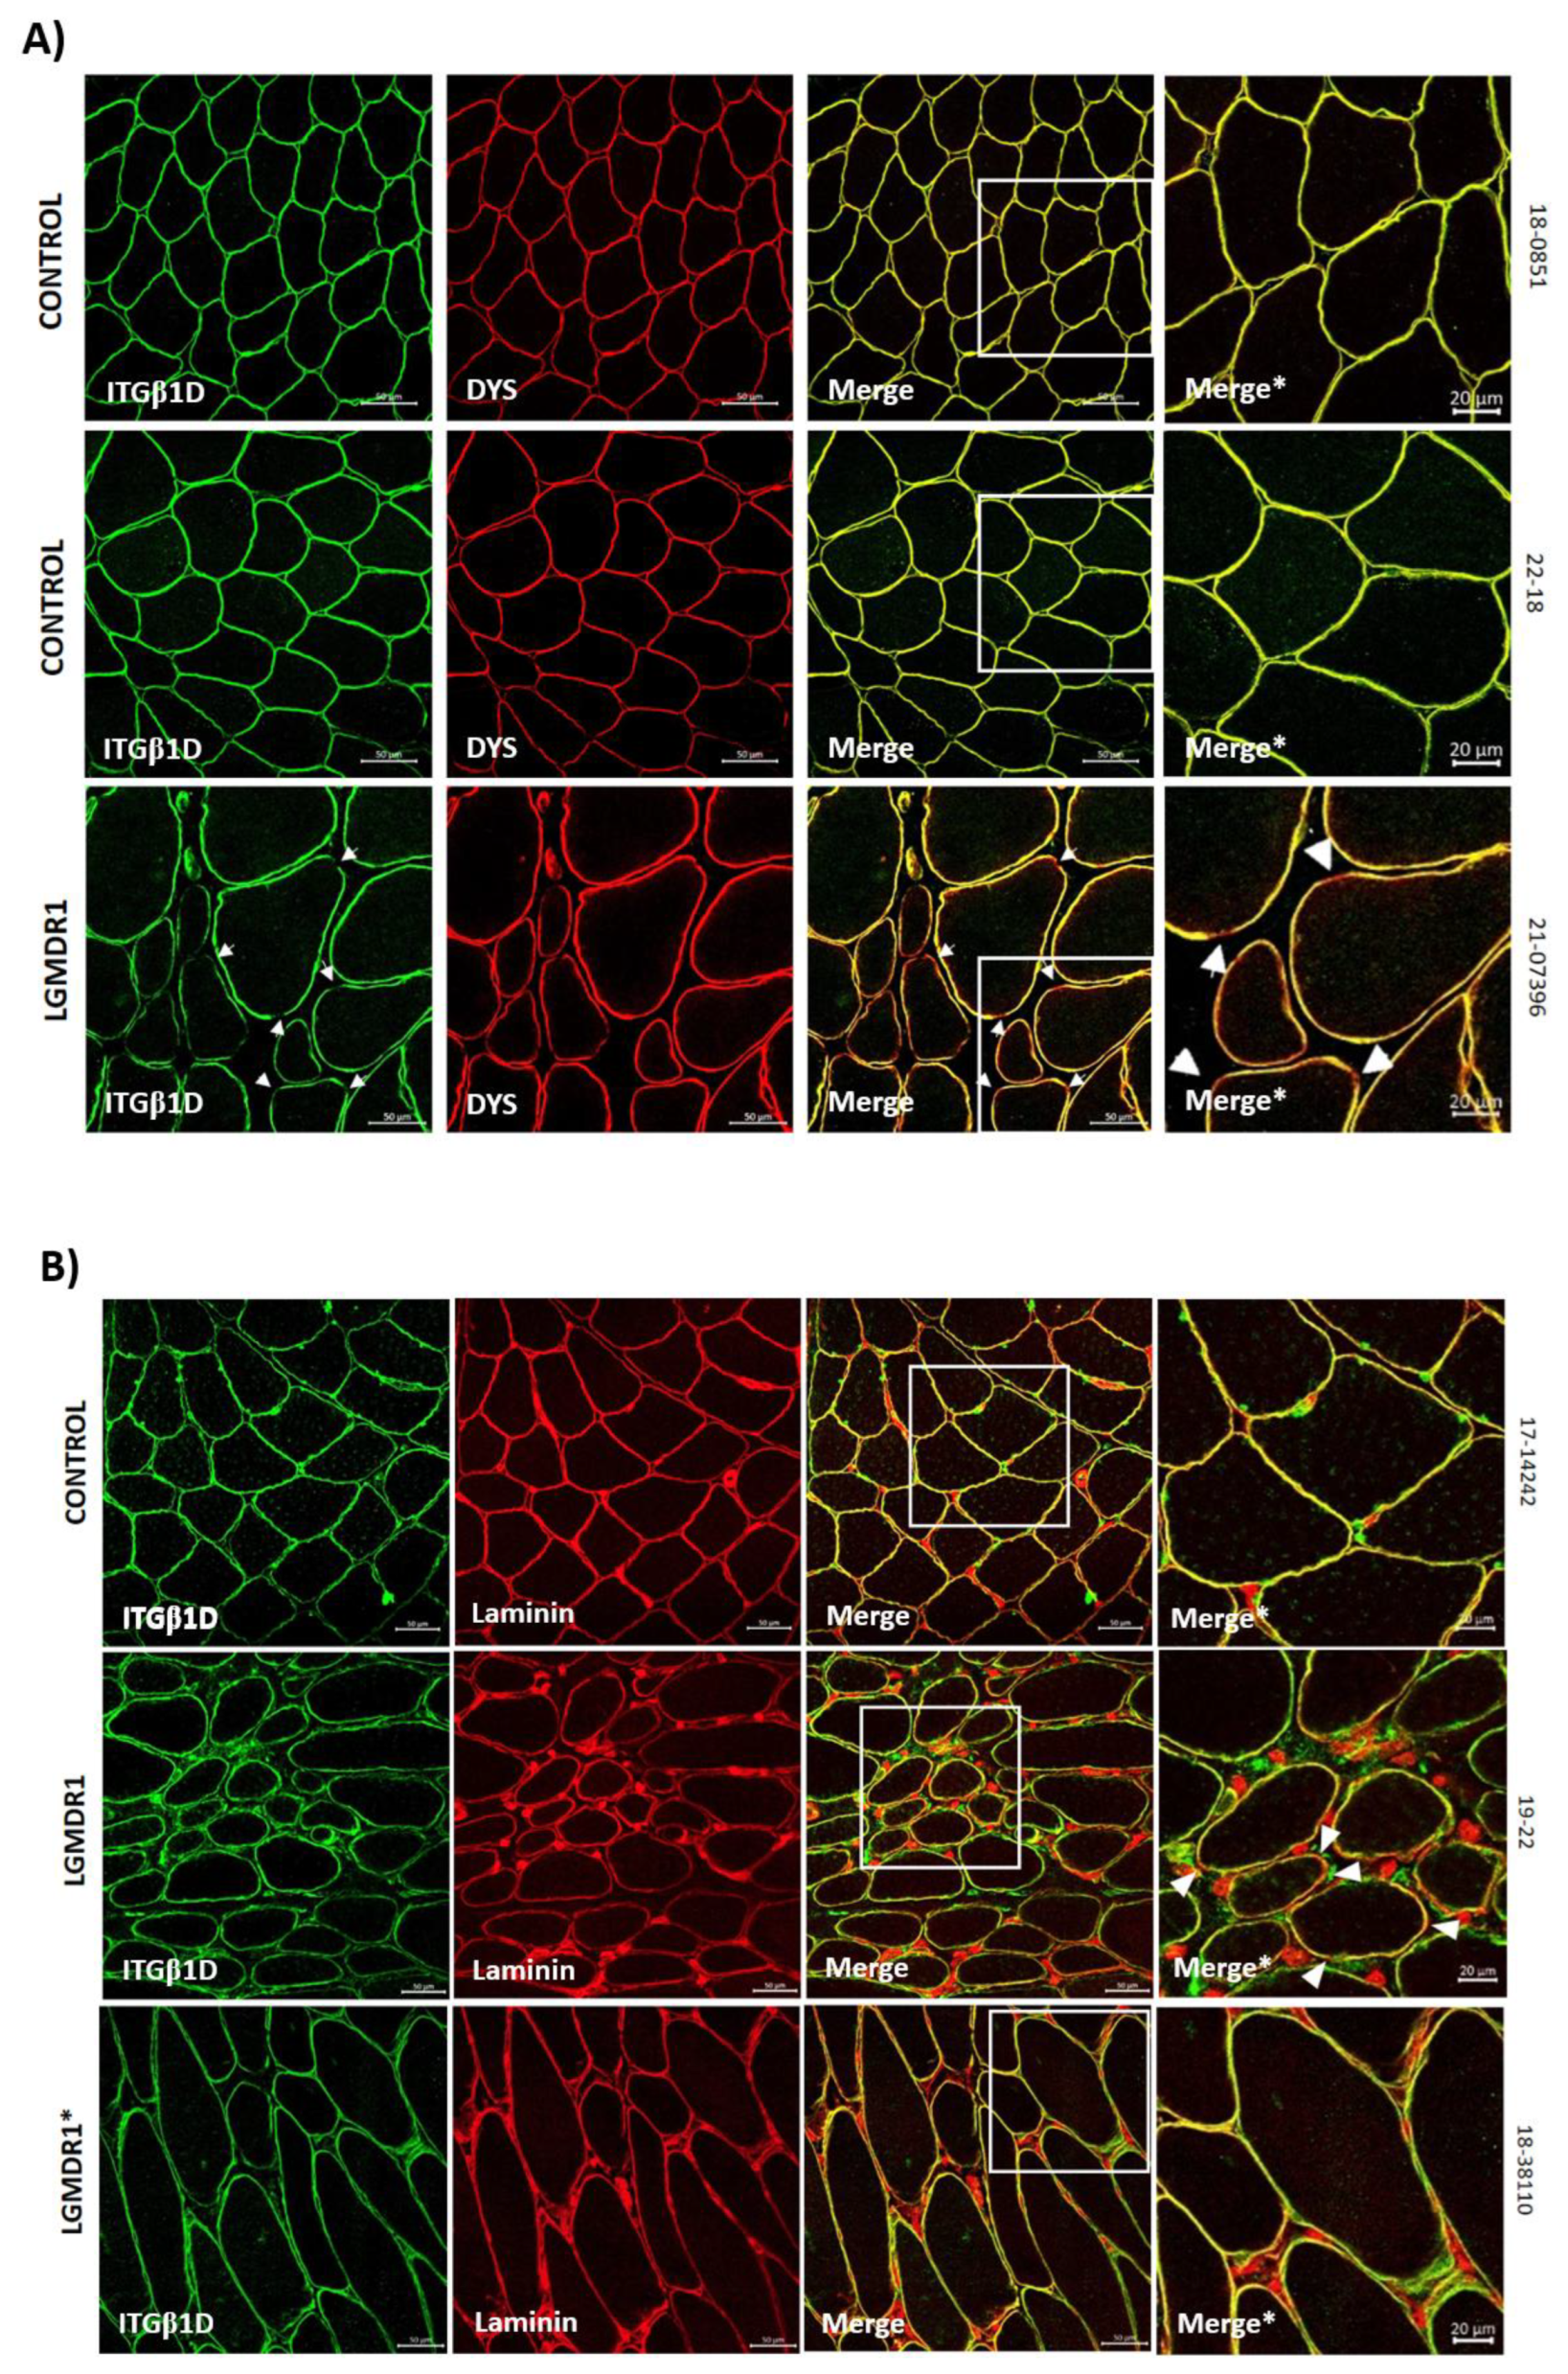
Figure 5.
A-B) TLN1 distribution (representative images) and quantification according to fiber type in two human control muscle and a LGMDR1 patient. C) TLN1 expression comparing LGMDR1 patients and controls in different fiber types. Error bars represent standard error of the mean (SEM). ****p<0.0001.
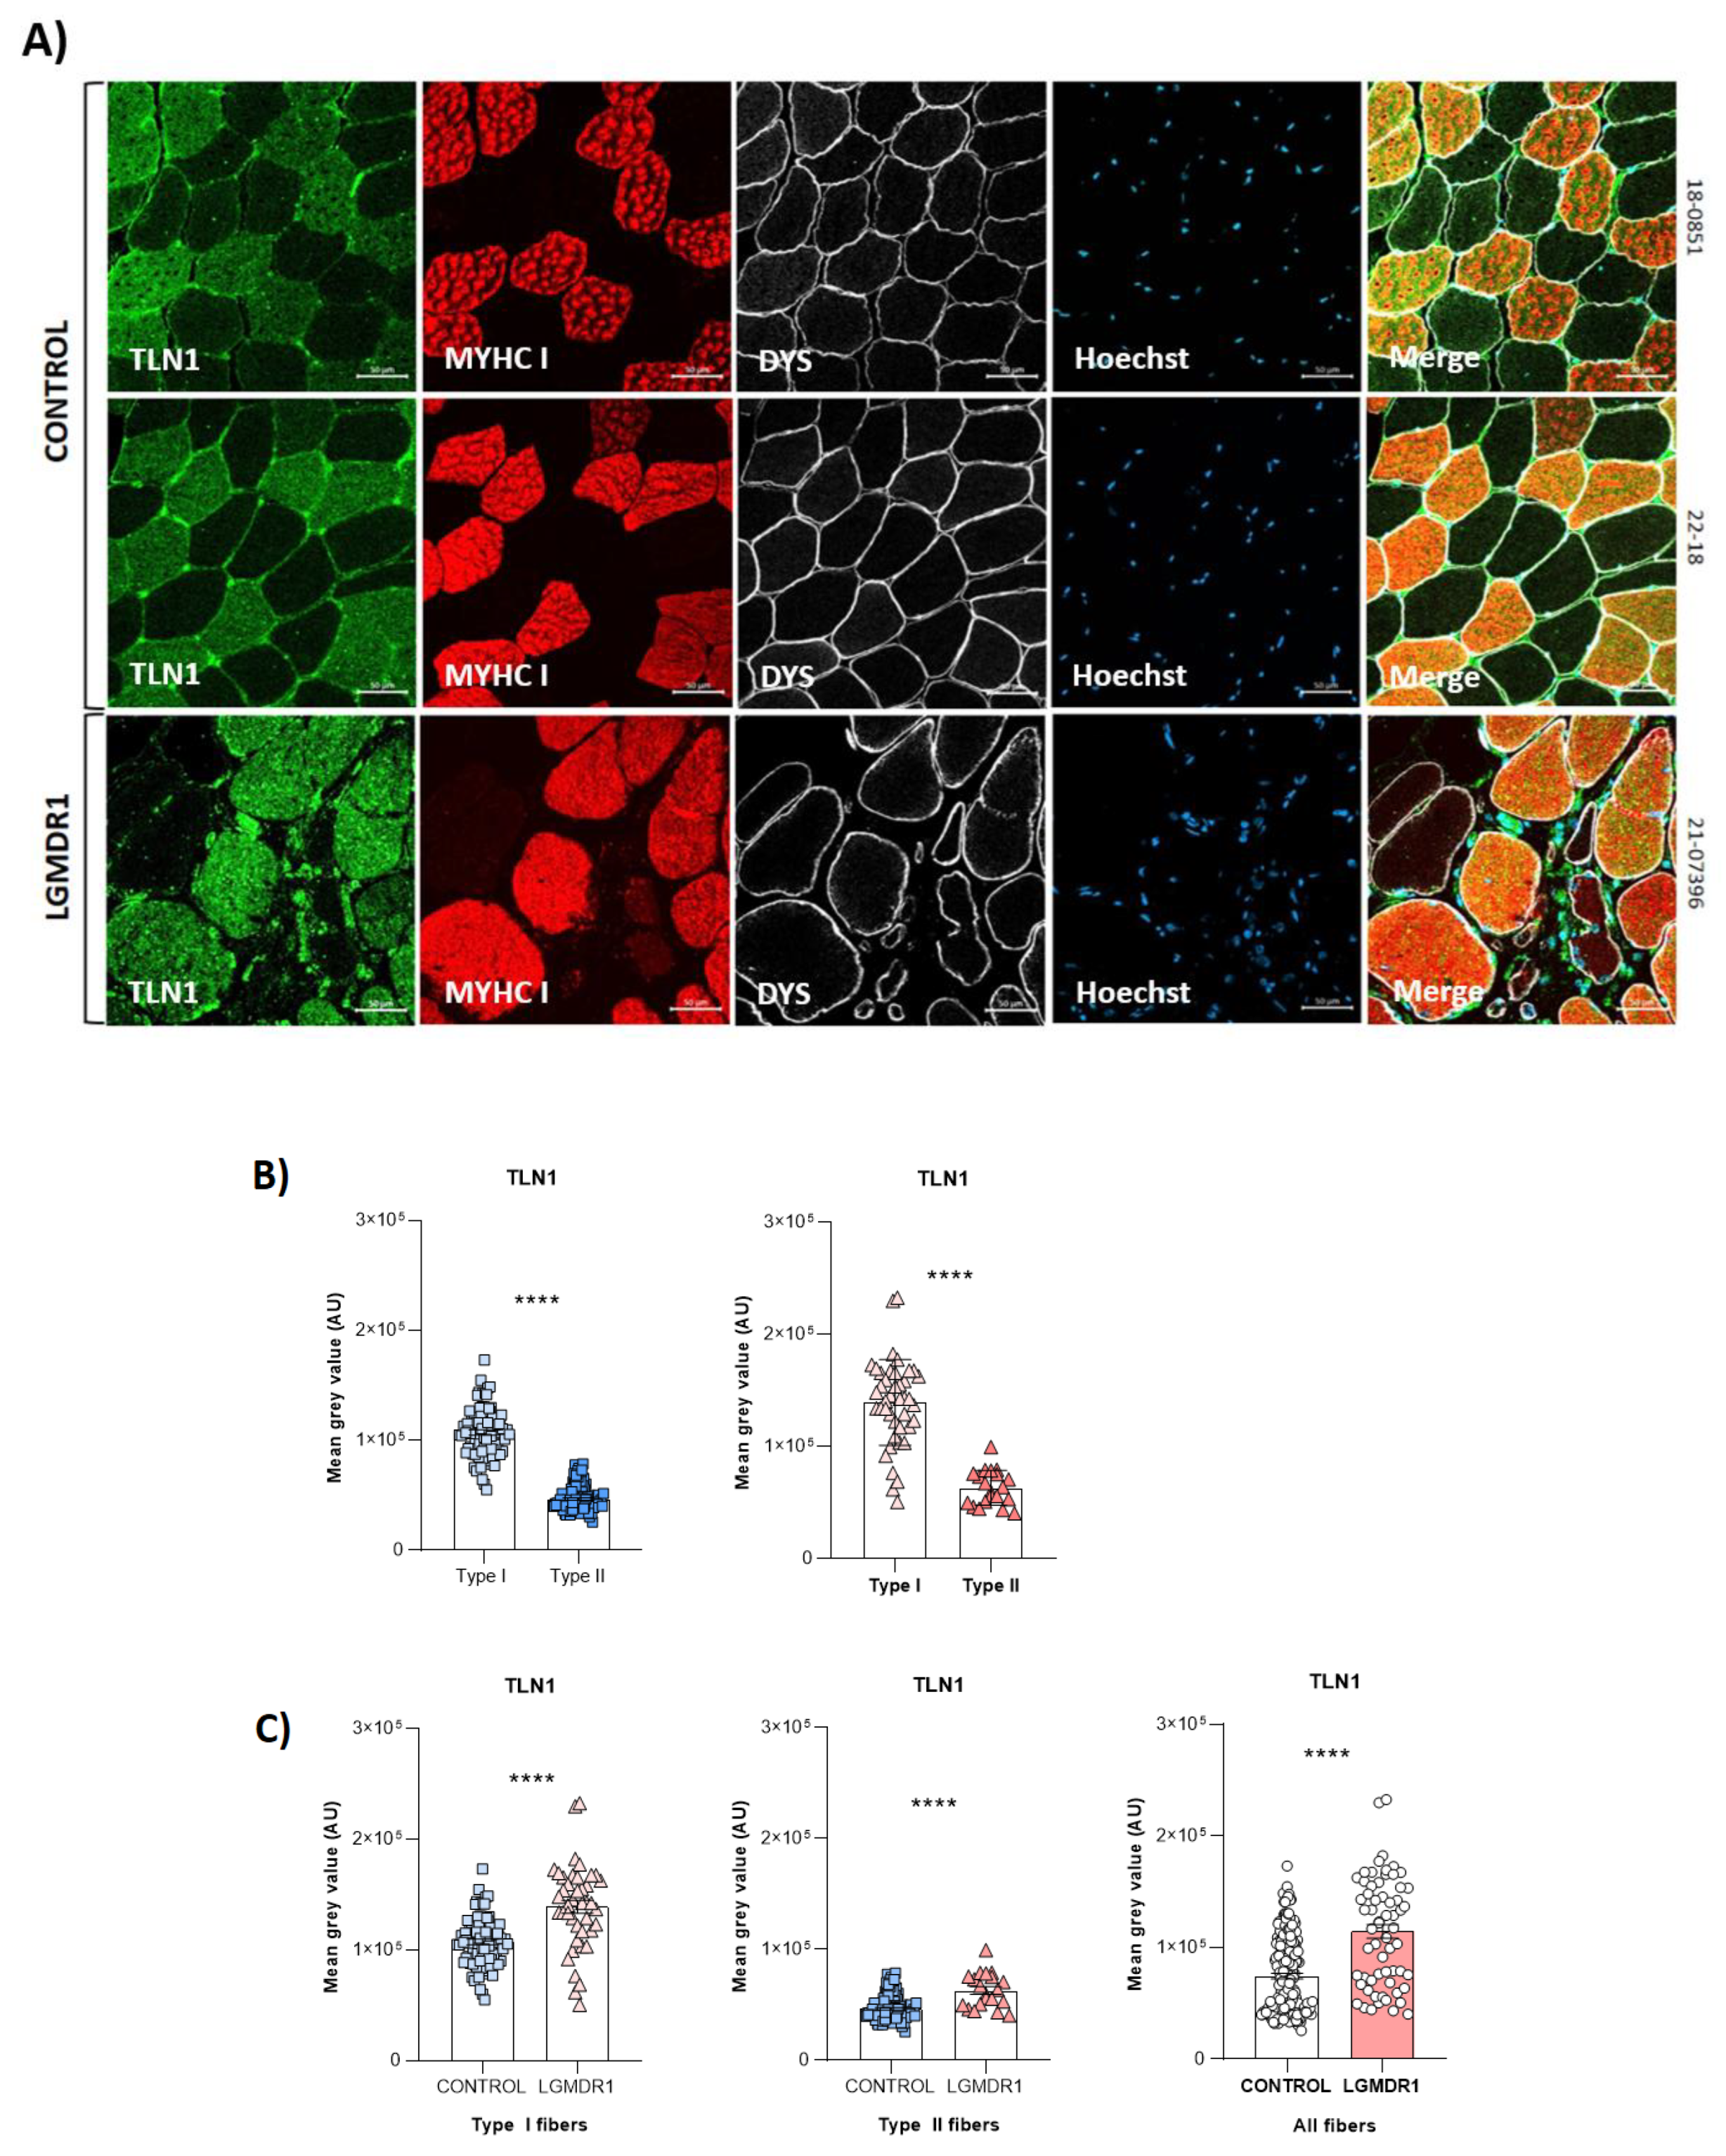
Figure 6.
Distribution of TLN1 in control (n=2) and patients’ (n=3) muscle fibers. A) TLN1 (green) and DYS (red) co-staining in muscles from one healthy control and one LGMDR1 patient. B) TLN1 (green) and laminin (red) co-staining in muscles from one healthy control and two LGMDR1 patients (18-38110, LGMDR1 patient with a very mild phenotype). Scale bars: 50 µm.
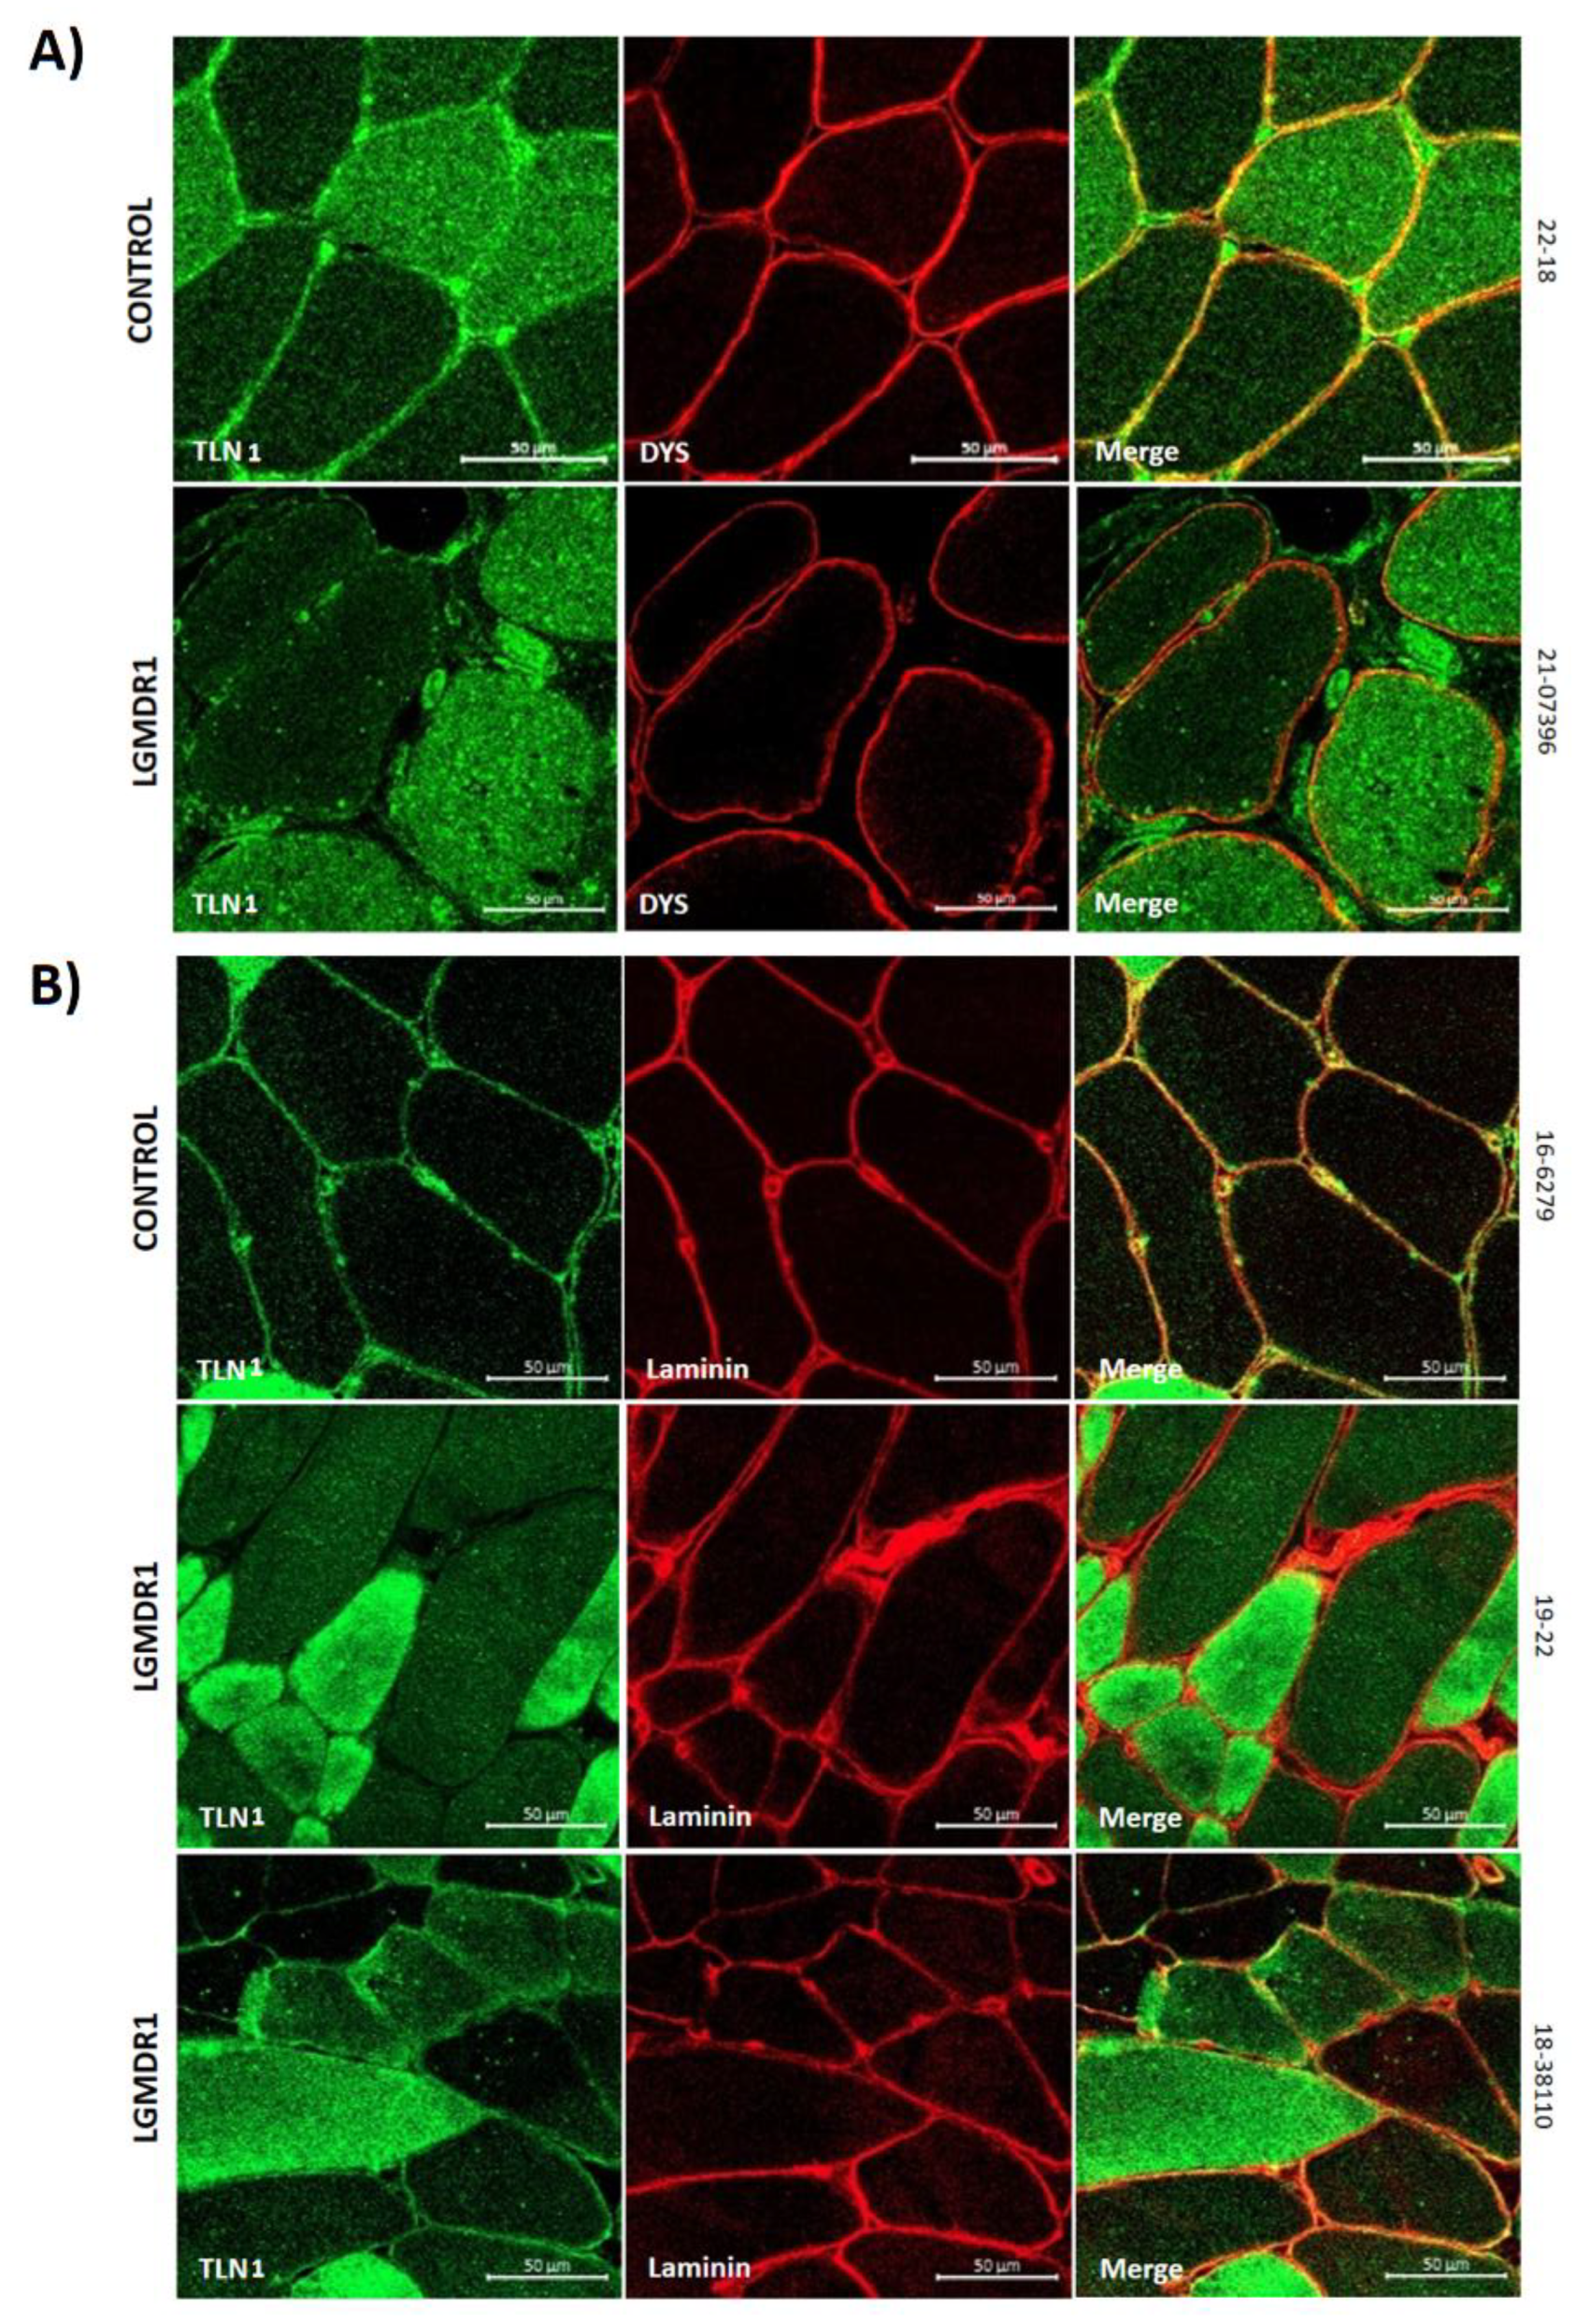
Figure 7.
TLN1-ITGβ1D co-localization in muscle fibers. TLN1 (green), ITGβ1D (red) co-staining in skeletal muscle fiber of two LGMDR1 patients (*LGMDR1 patient with a very mild phenotype) and two healthy controls. White arrowheads indicate co-localization of TLN-ITGβ1D. Scale bars: 20 µm.
Figure 7.
TLN1-ITGβ1D co-localization in muscle fibers. TLN1 (green), ITGβ1D (red) co-staining in skeletal muscle fiber of two LGMDR1 patients (*LGMDR1 patient with a very mild phenotype) and two healthy controls. White arrowheads indicate co-localization of TLN-ITGβ1D. Scale bars: 20 µm.
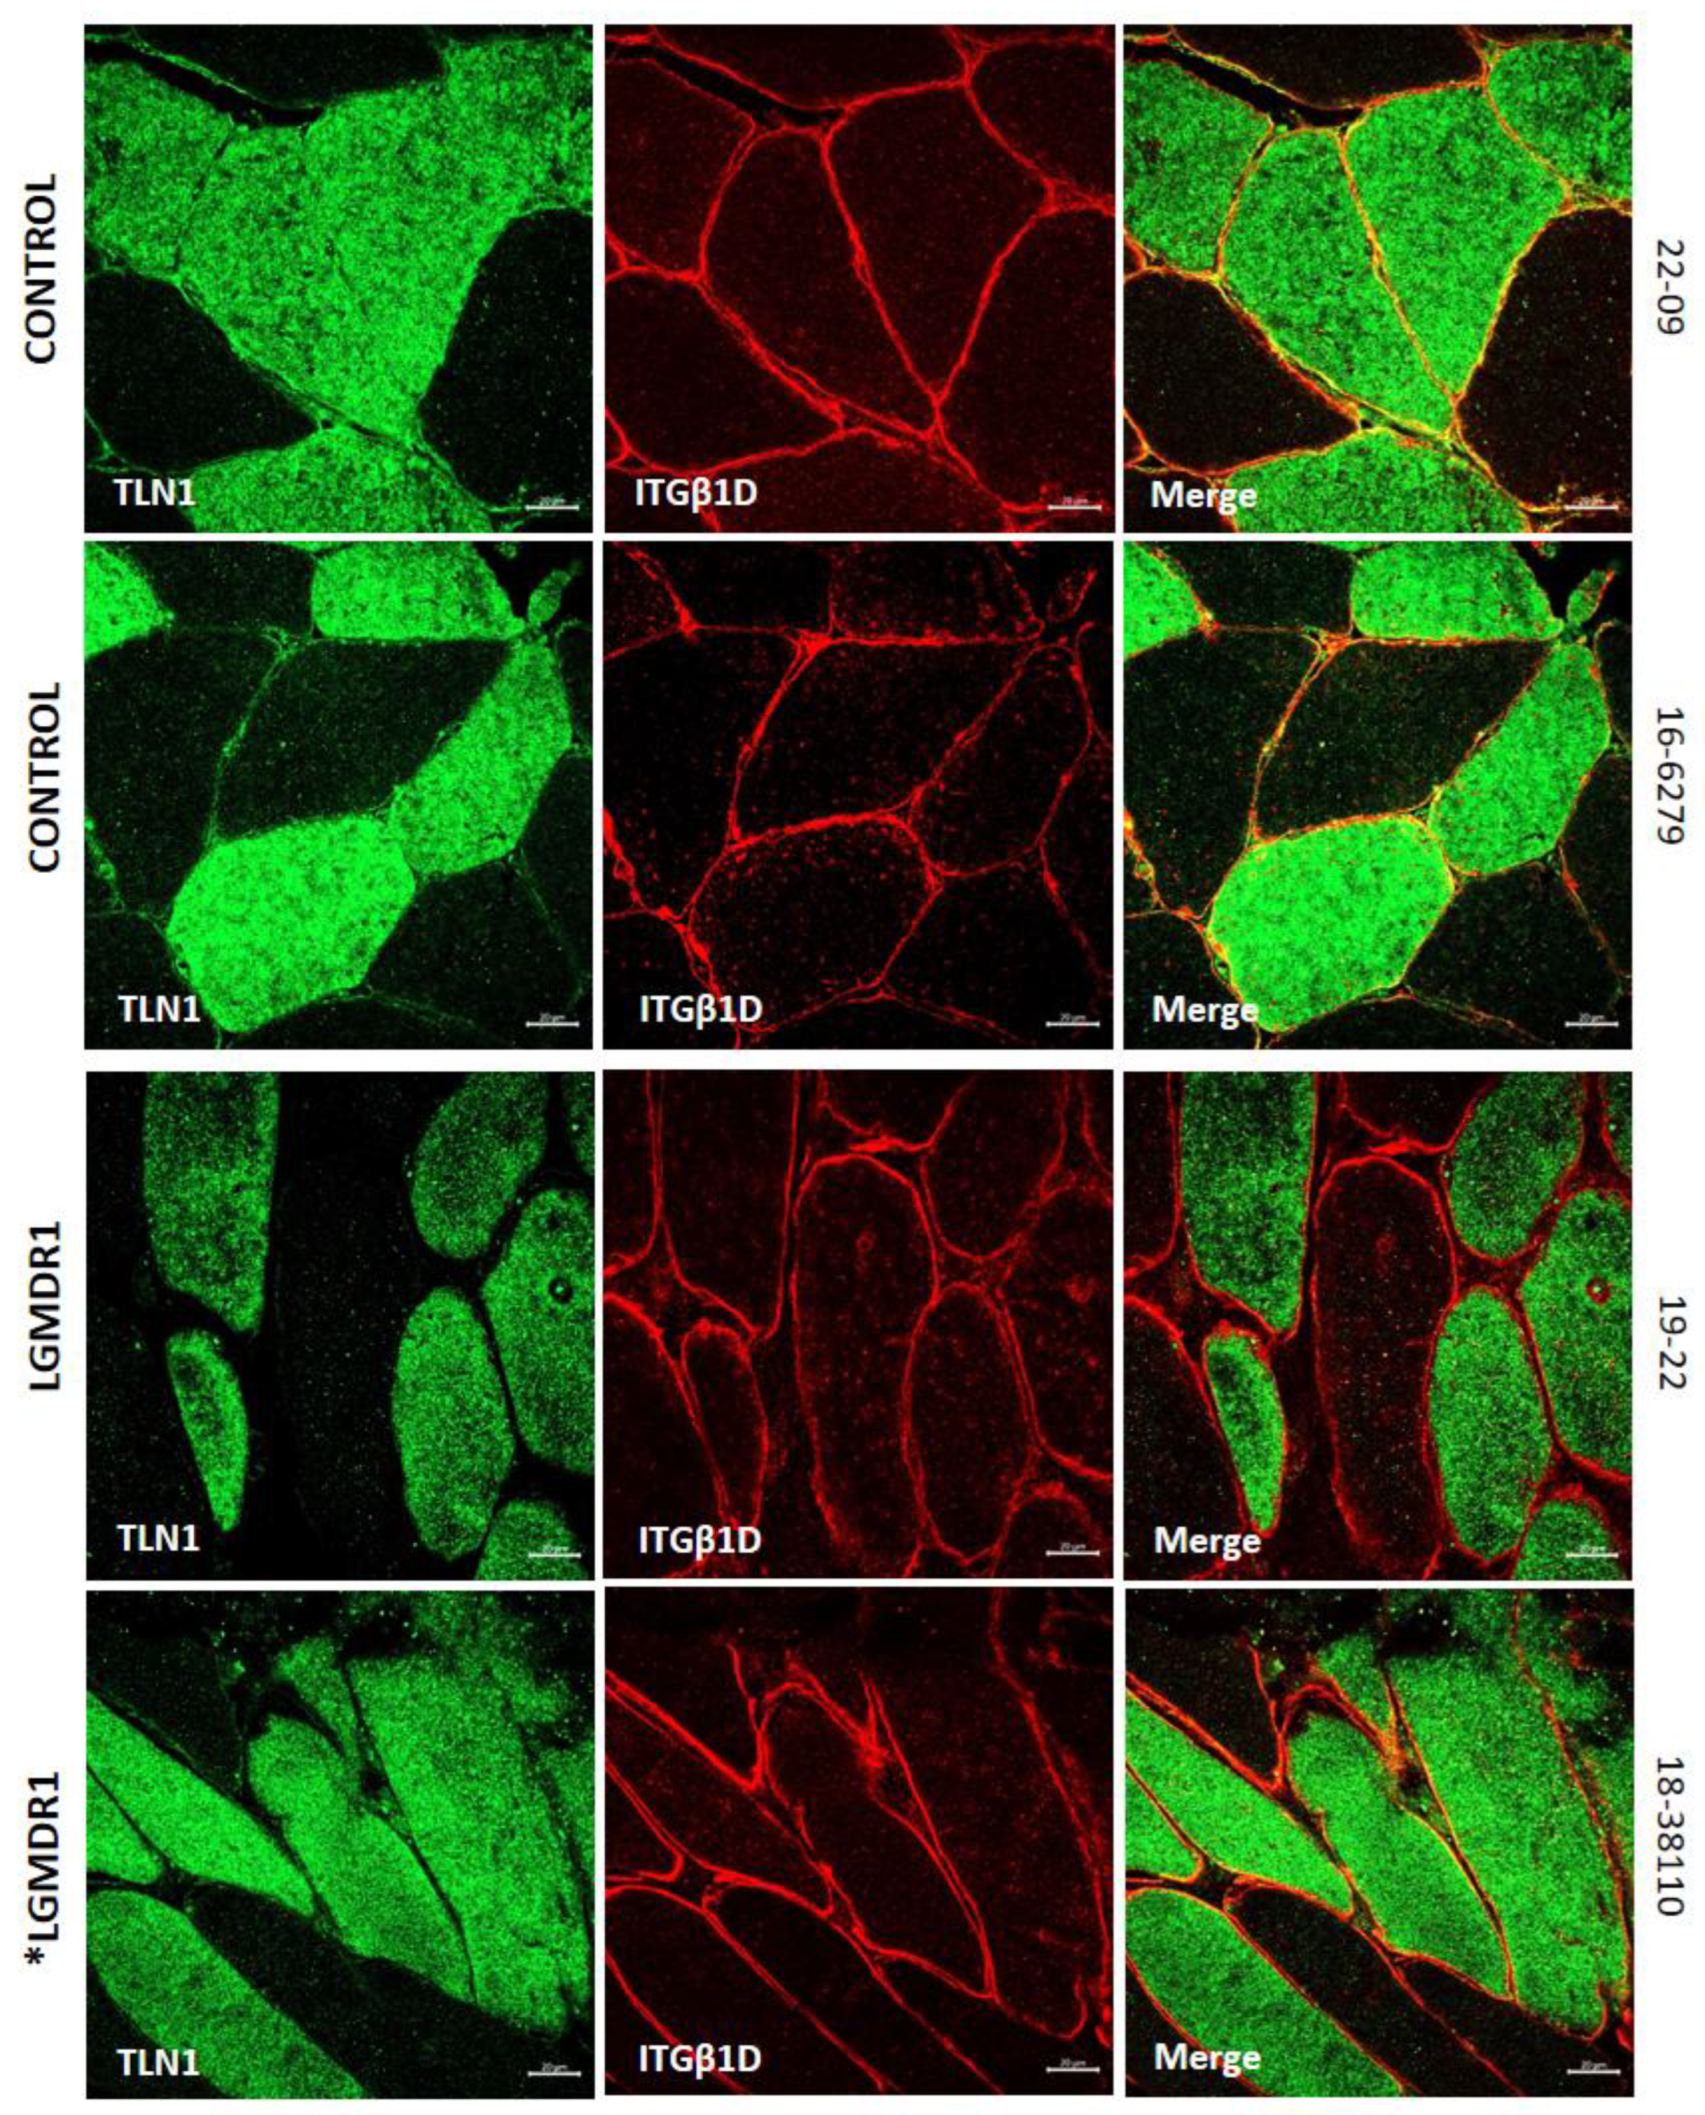
Figure 8.
VCL distribution in two human control muscles and two LGMDR1 patients. VCL (green), MYHC I (red), DYS (white), Hoechst (blue).
Figure 8.
VCL distribution in two human control muscles and two LGMDR1 patients. VCL (green), MYHC I (red), DYS (white), Hoechst (blue).
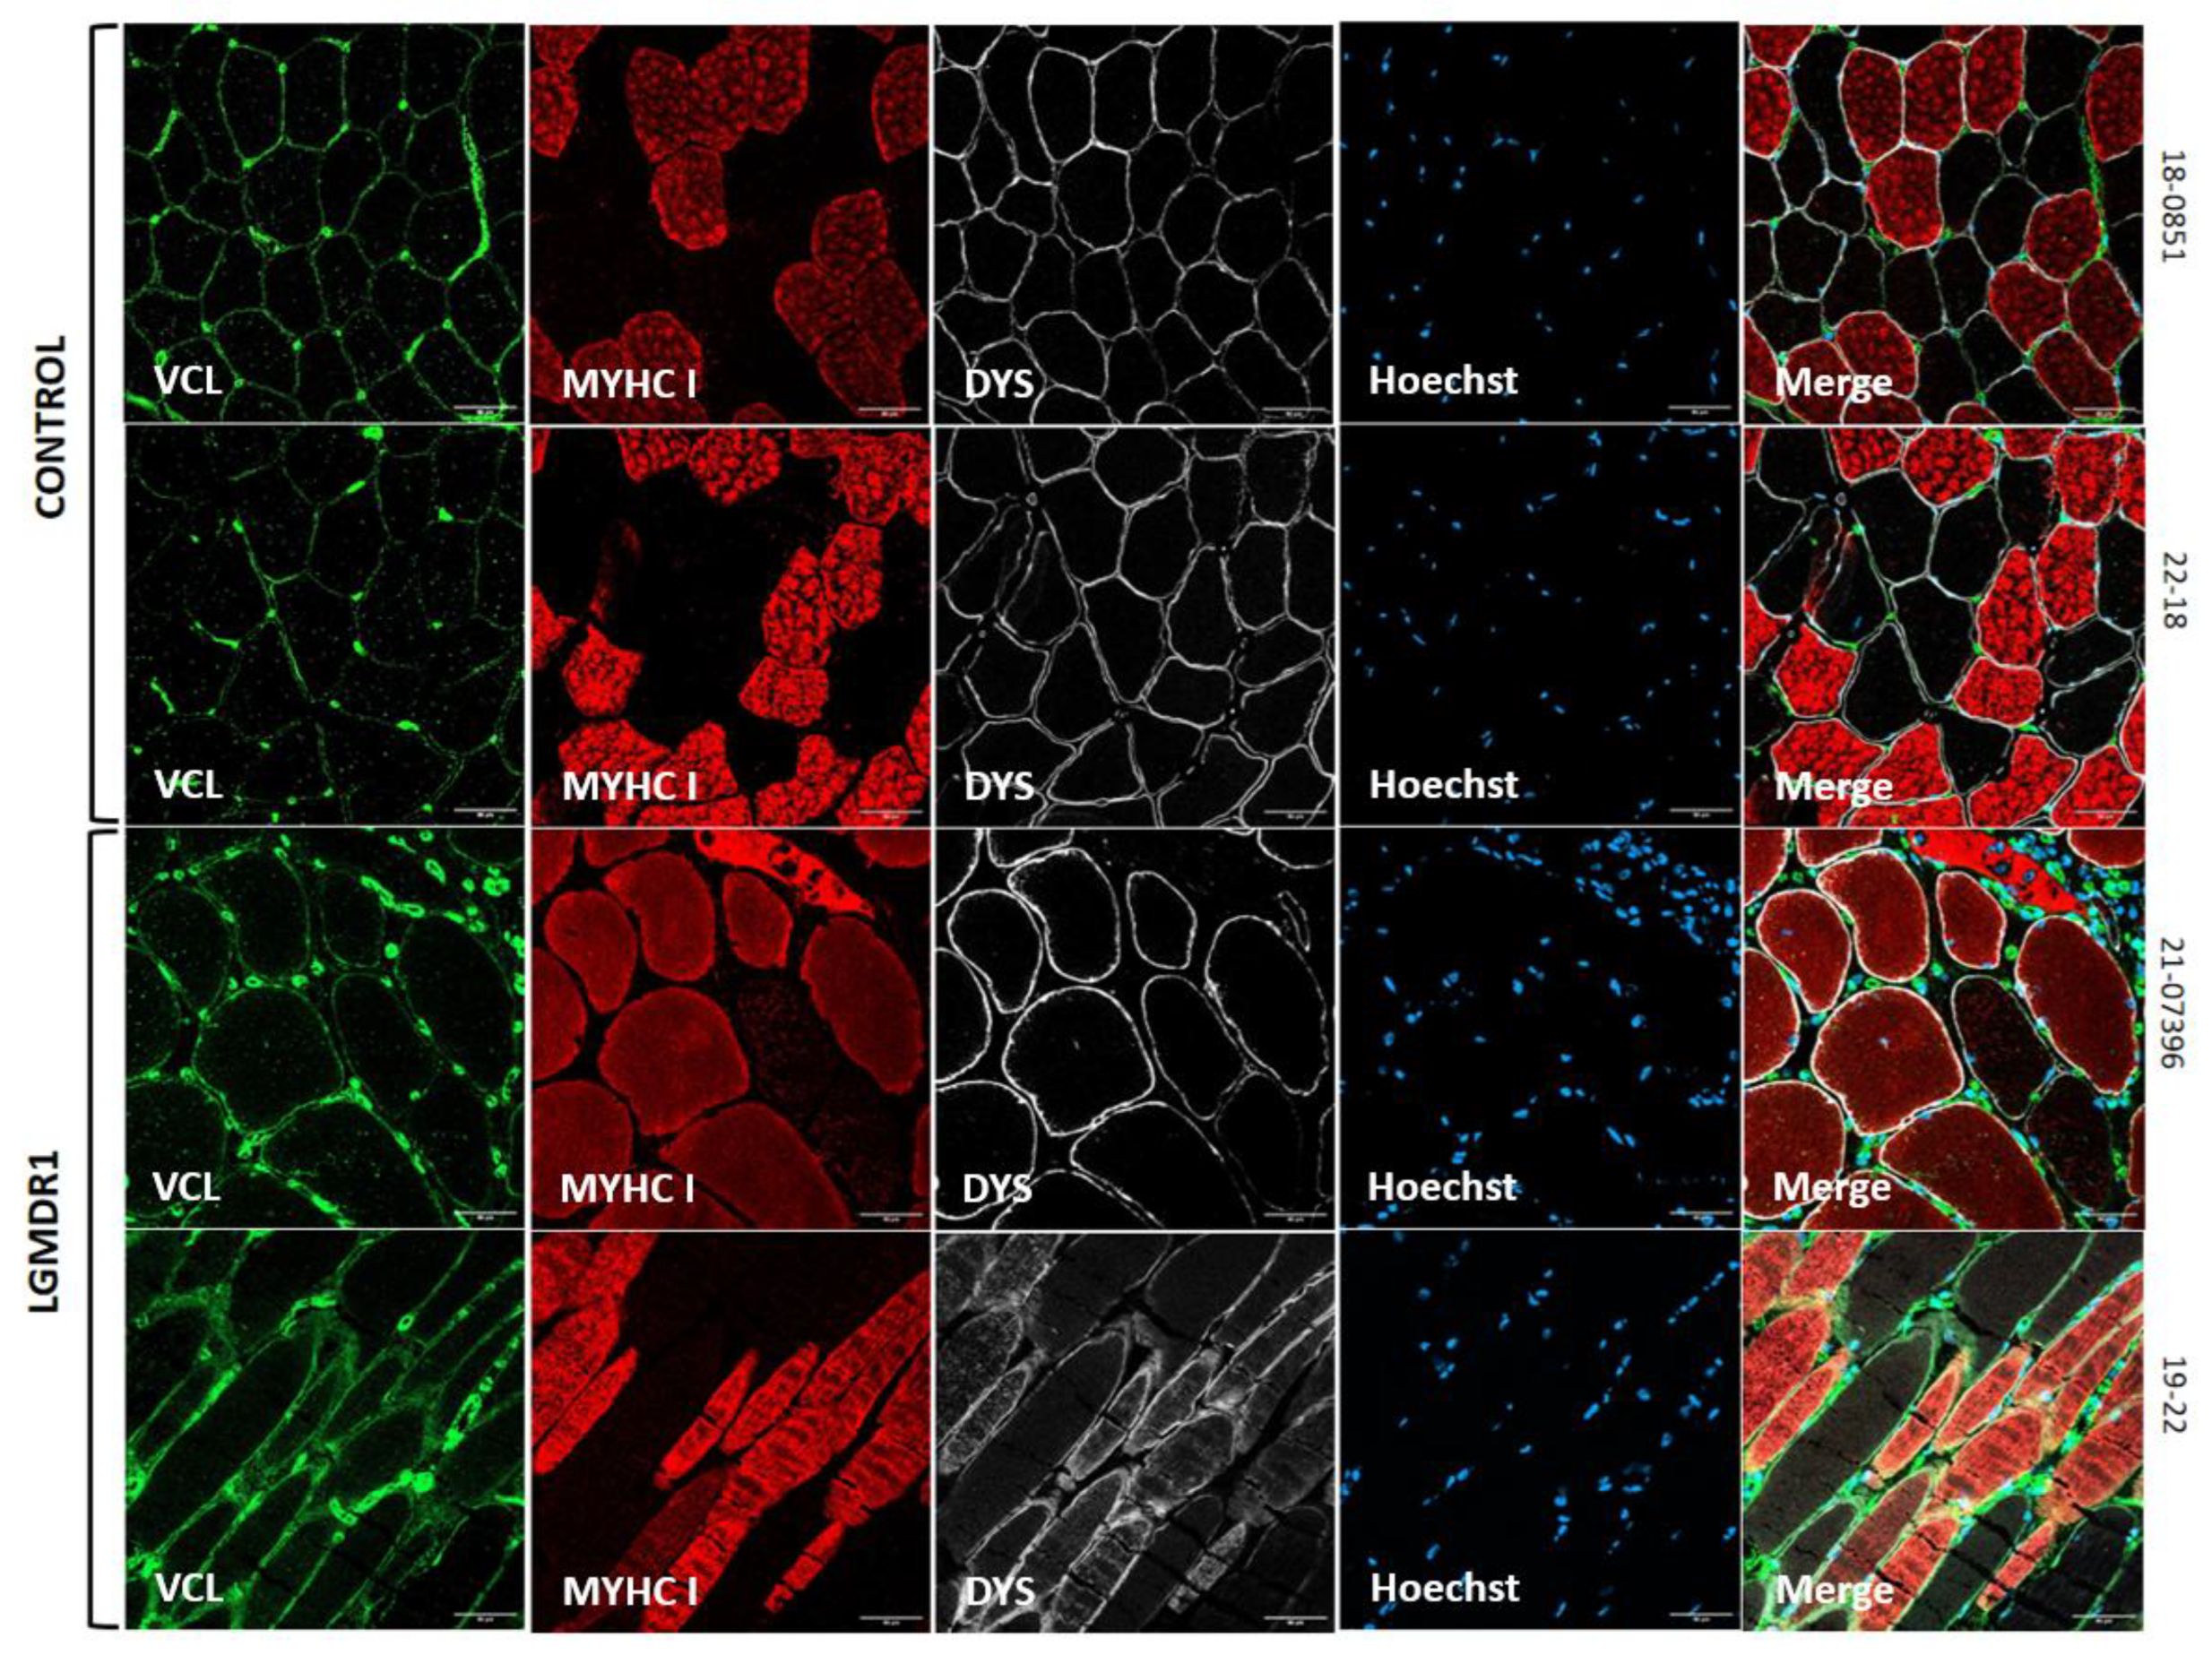
Figure 9.
FAK distribution in muscle fibers. A) FAK distribution in two human control muscle and a LGMDR1 patient. White arrows indicate type I fibers that do not express FAK in one LGMDR1 patient. B) FAK quantification according to fiber type. C) FAK expression comparing LGMDR1 patient and controls in different fiber types. Error bars represent standard error of the mean (SEM). ****p<0.0001.
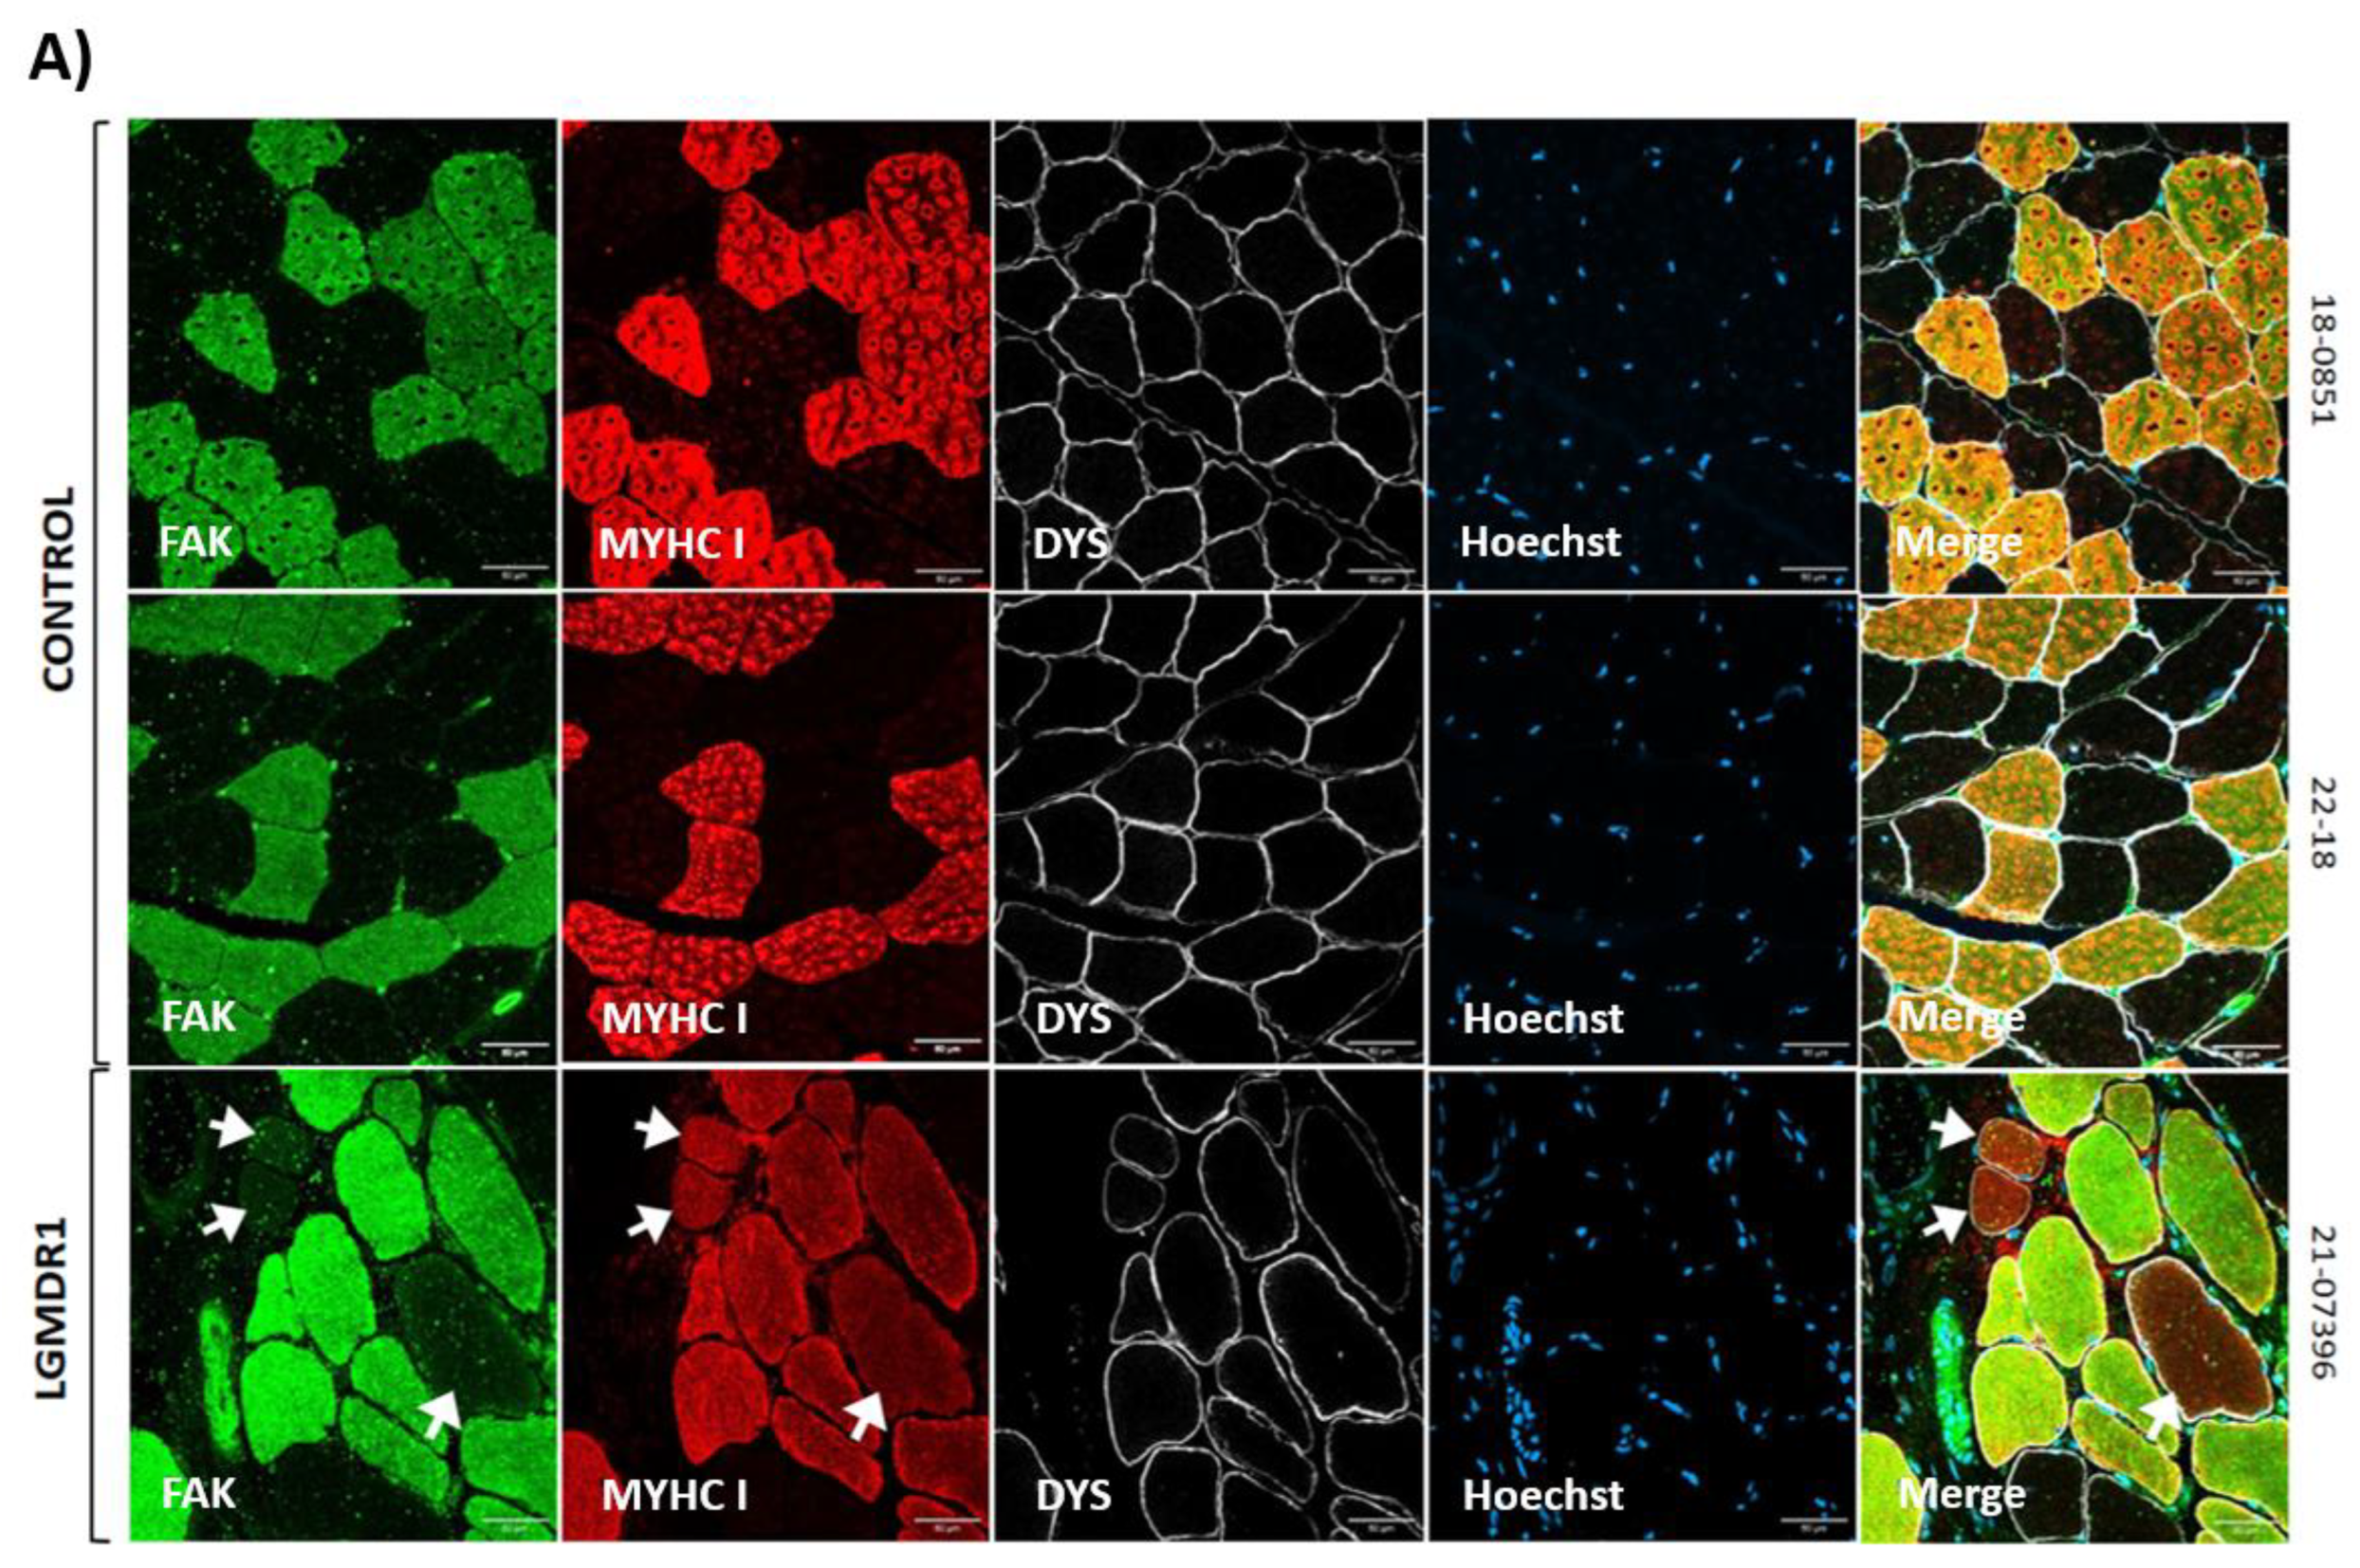
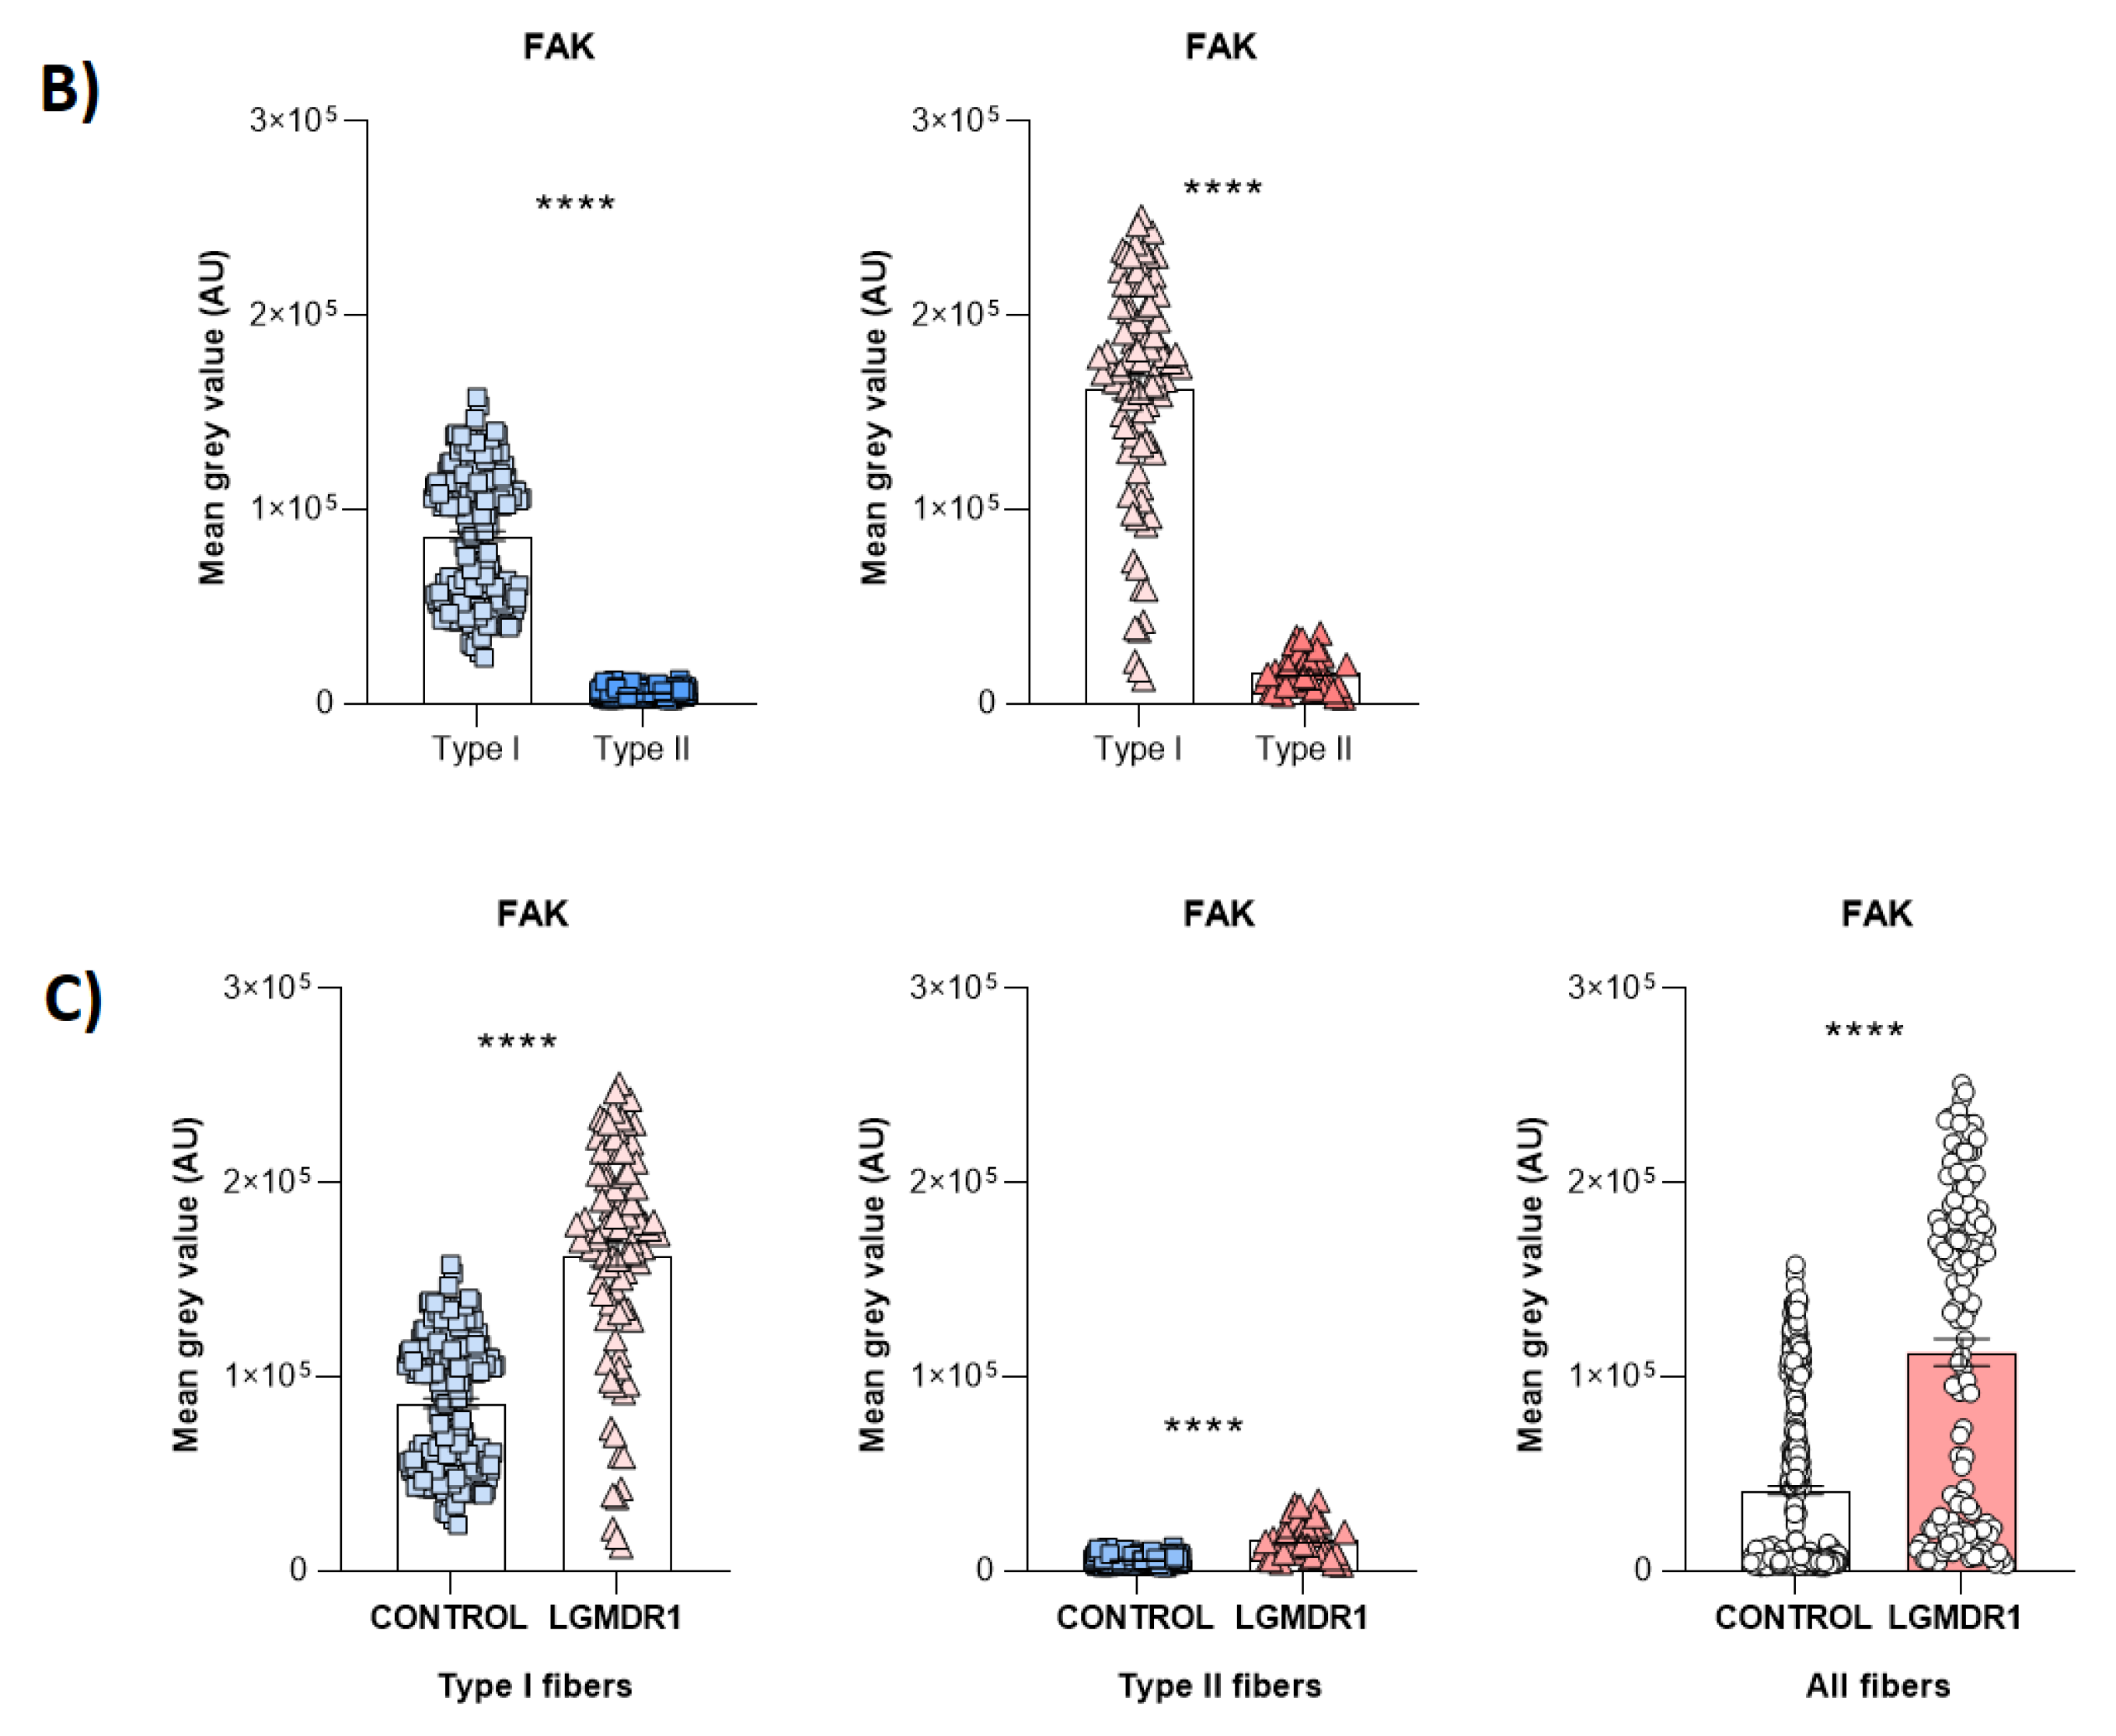
Figure 10.
A-B) ILK distribution and quantification according to fiber type in two human control muscle and a LGMDR1 patient. C) ILK expression comparing LGMDR1 patient and control in different fiber types. Error bars represent standard error of the mean (SEM). ***p<0.001, ****p<0.0001.
Figure 10.
A-B) ILK distribution and quantification according to fiber type in two human control muscle and a LGMDR1 patient. C) ILK expression comparing LGMDR1 patient and control in different fiber types. Error bars represent standard error of the mean (SEM). ***p<0.001, ****p<0.0001.
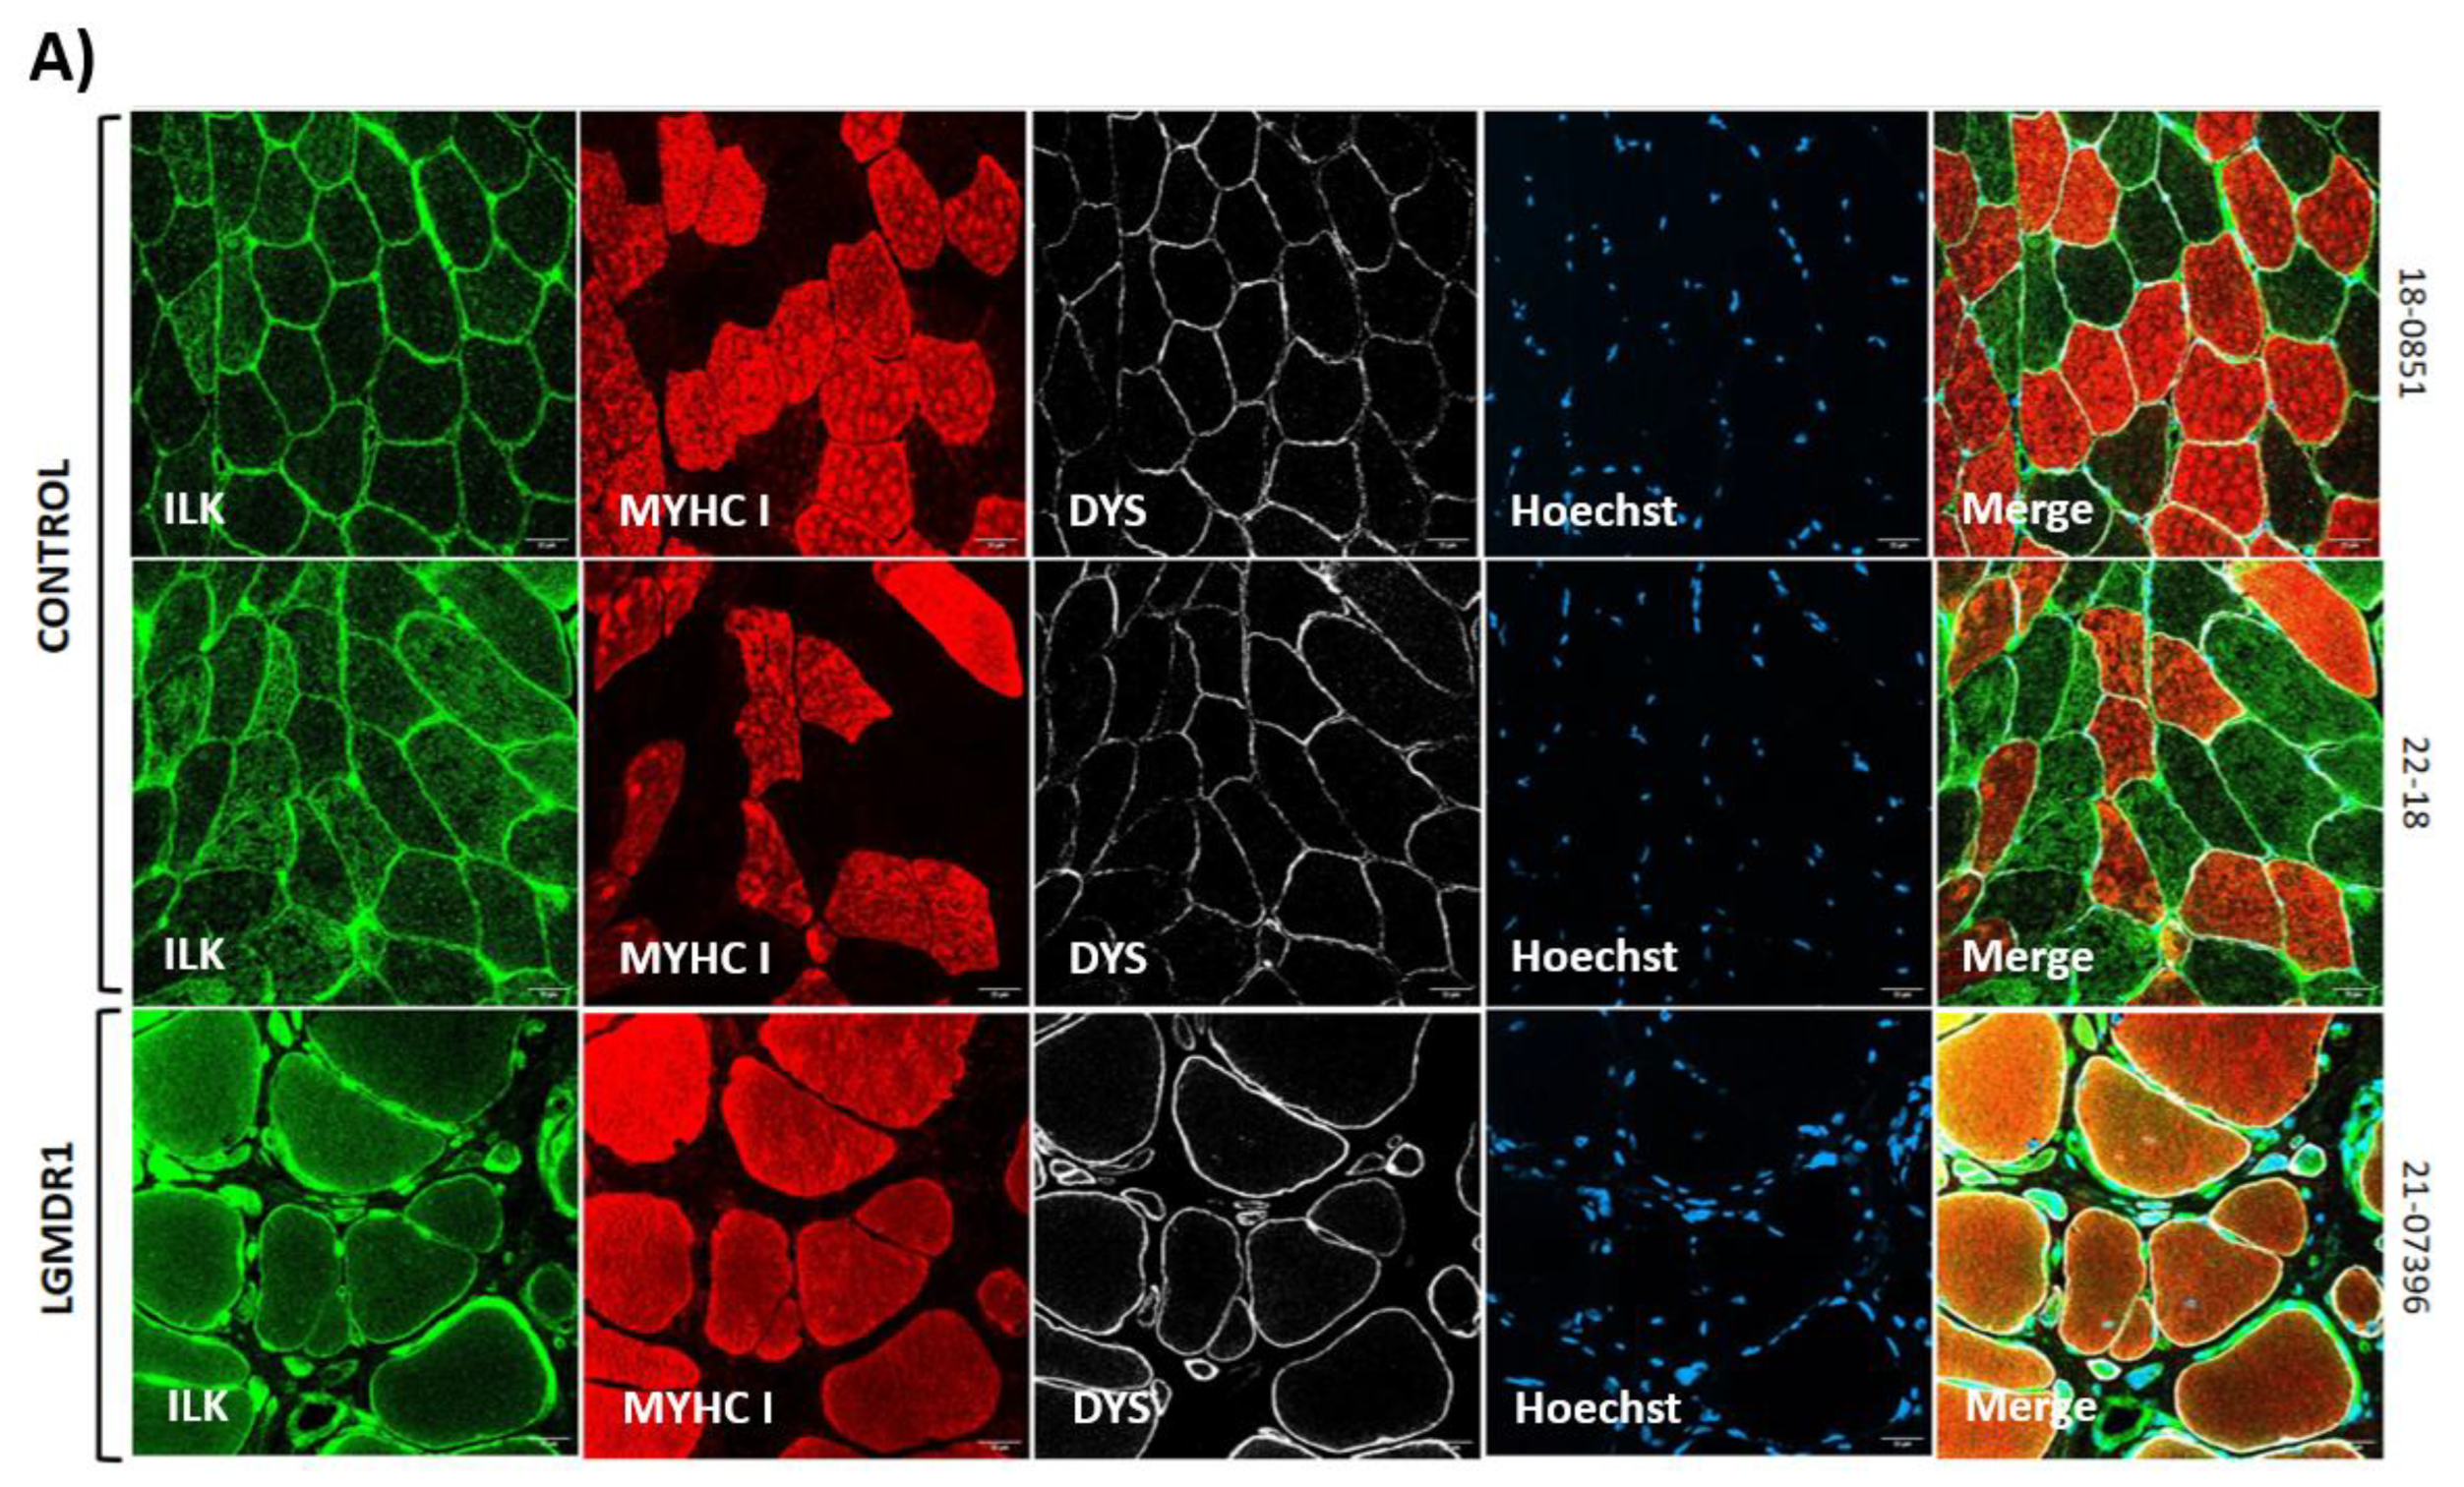
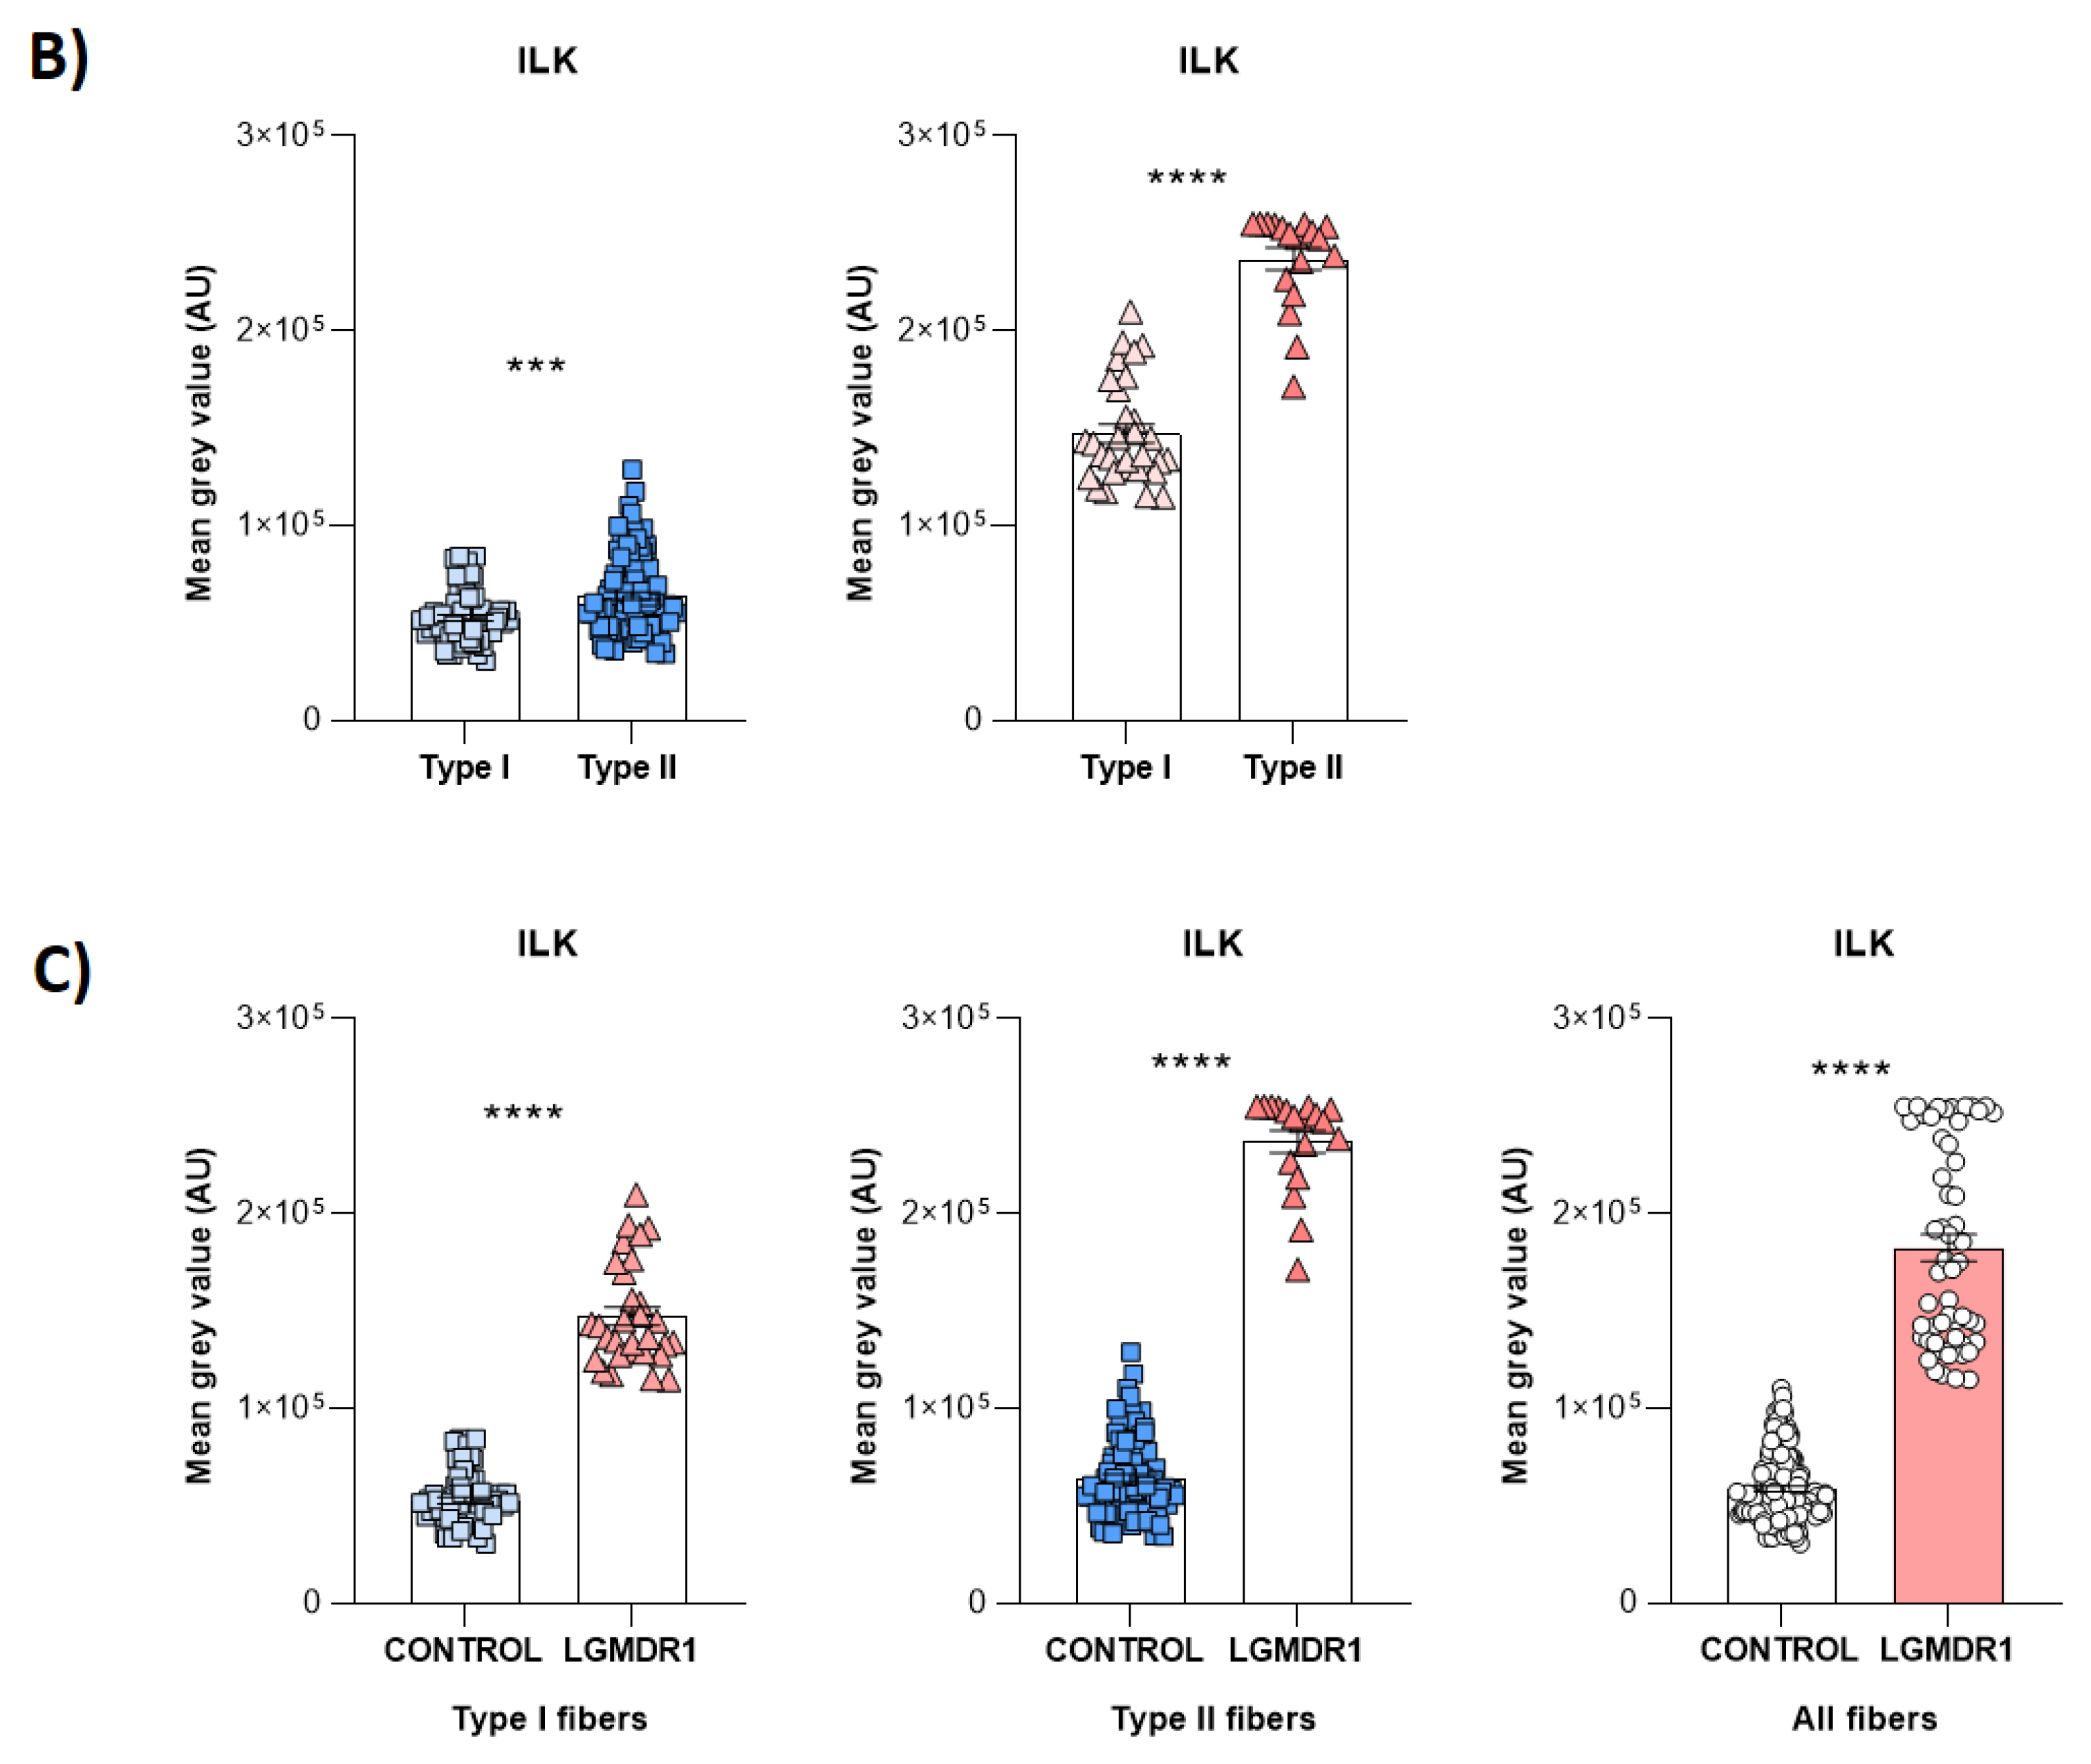
Figure 11.
ILK expression in control and LGMDR1 skeletal muscle fibers. A predominance of dystrophin signal is observed in the sarcolemma in controls, but in the patient, a greater amount of ILK is observed.
Figure 11.
ILK expression in control and LGMDR1 skeletal muscle fibers. A predominance of dystrophin signal is observed in the sarcolemma in controls, but in the patient, a greater amount of ILK is observed.
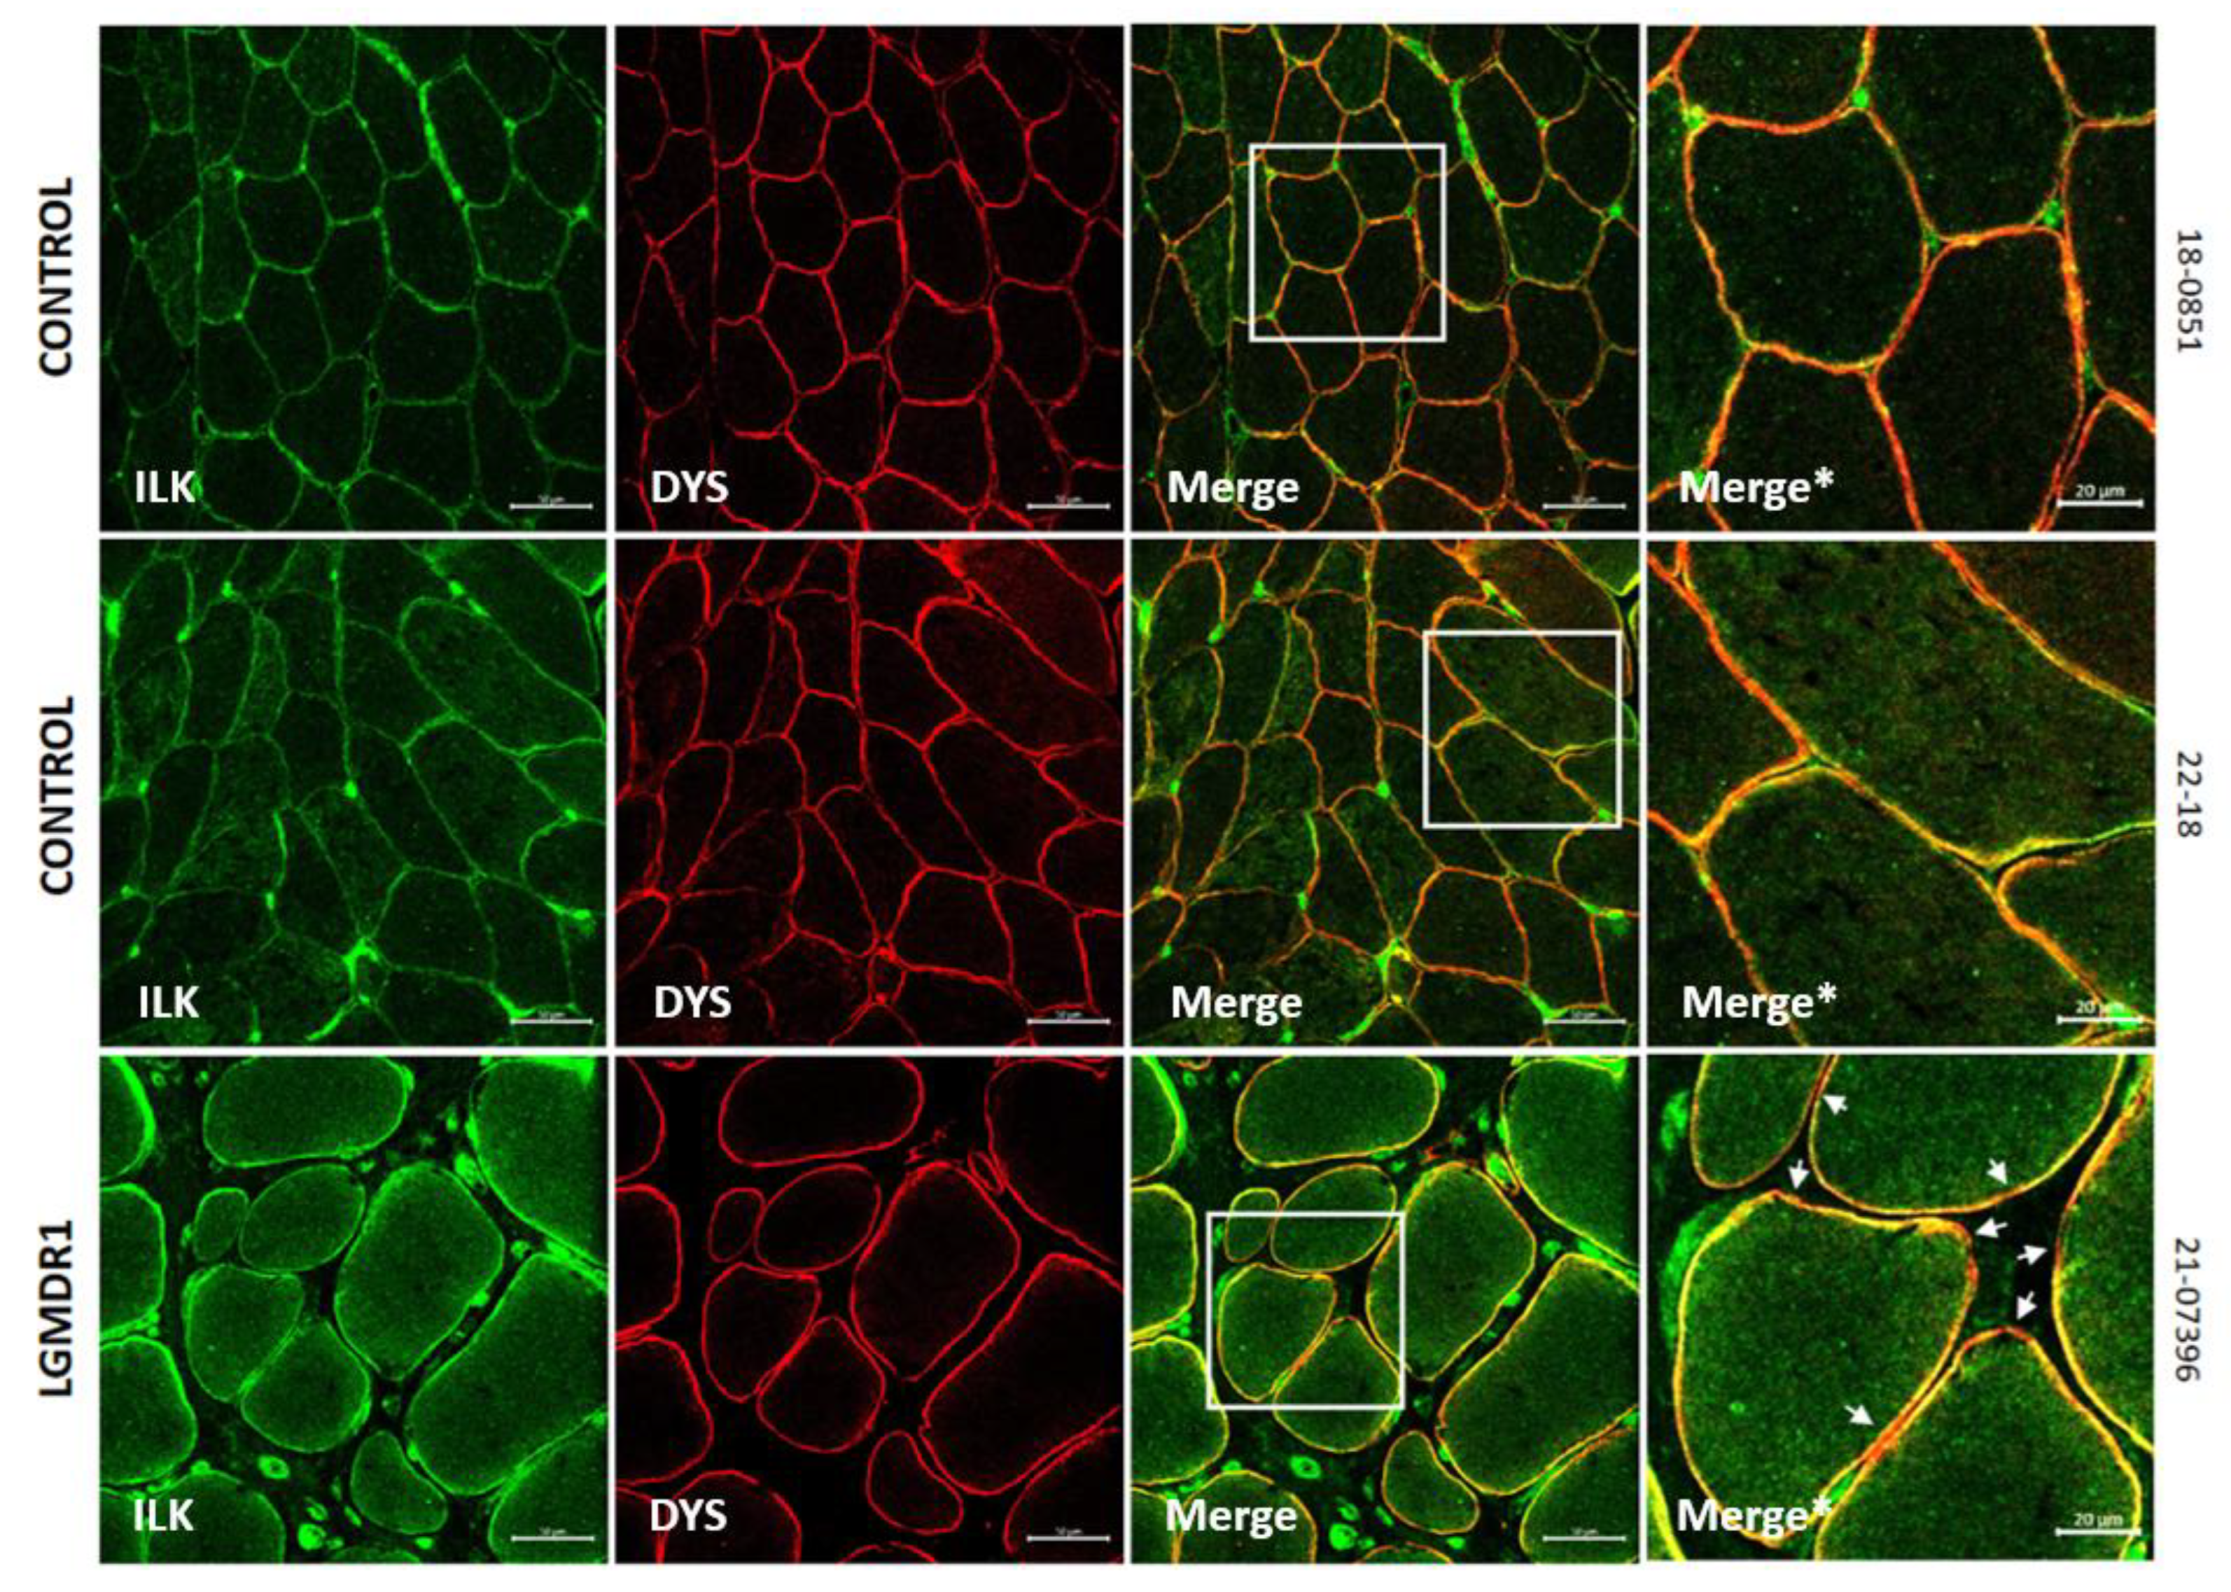
Figure 12.
Vascular endothelium quantification and morphology in skeletal muscle fibers. (A) Representative images of blood vessels in skeletal muscle (3 controls and 1 patient). Ulex (green) and laminin (red). Scale bars: 20 μm. (B) Blood vessels quantification, normalized by number of fibers and by CSA. Error bars represent standard error of the mean (SEM). (C) Abnormal and swollen blood vessel morphology in LGMDR1 patient’s muscle. Ulex (green), laminin (red). Scale bars: 10 μm.
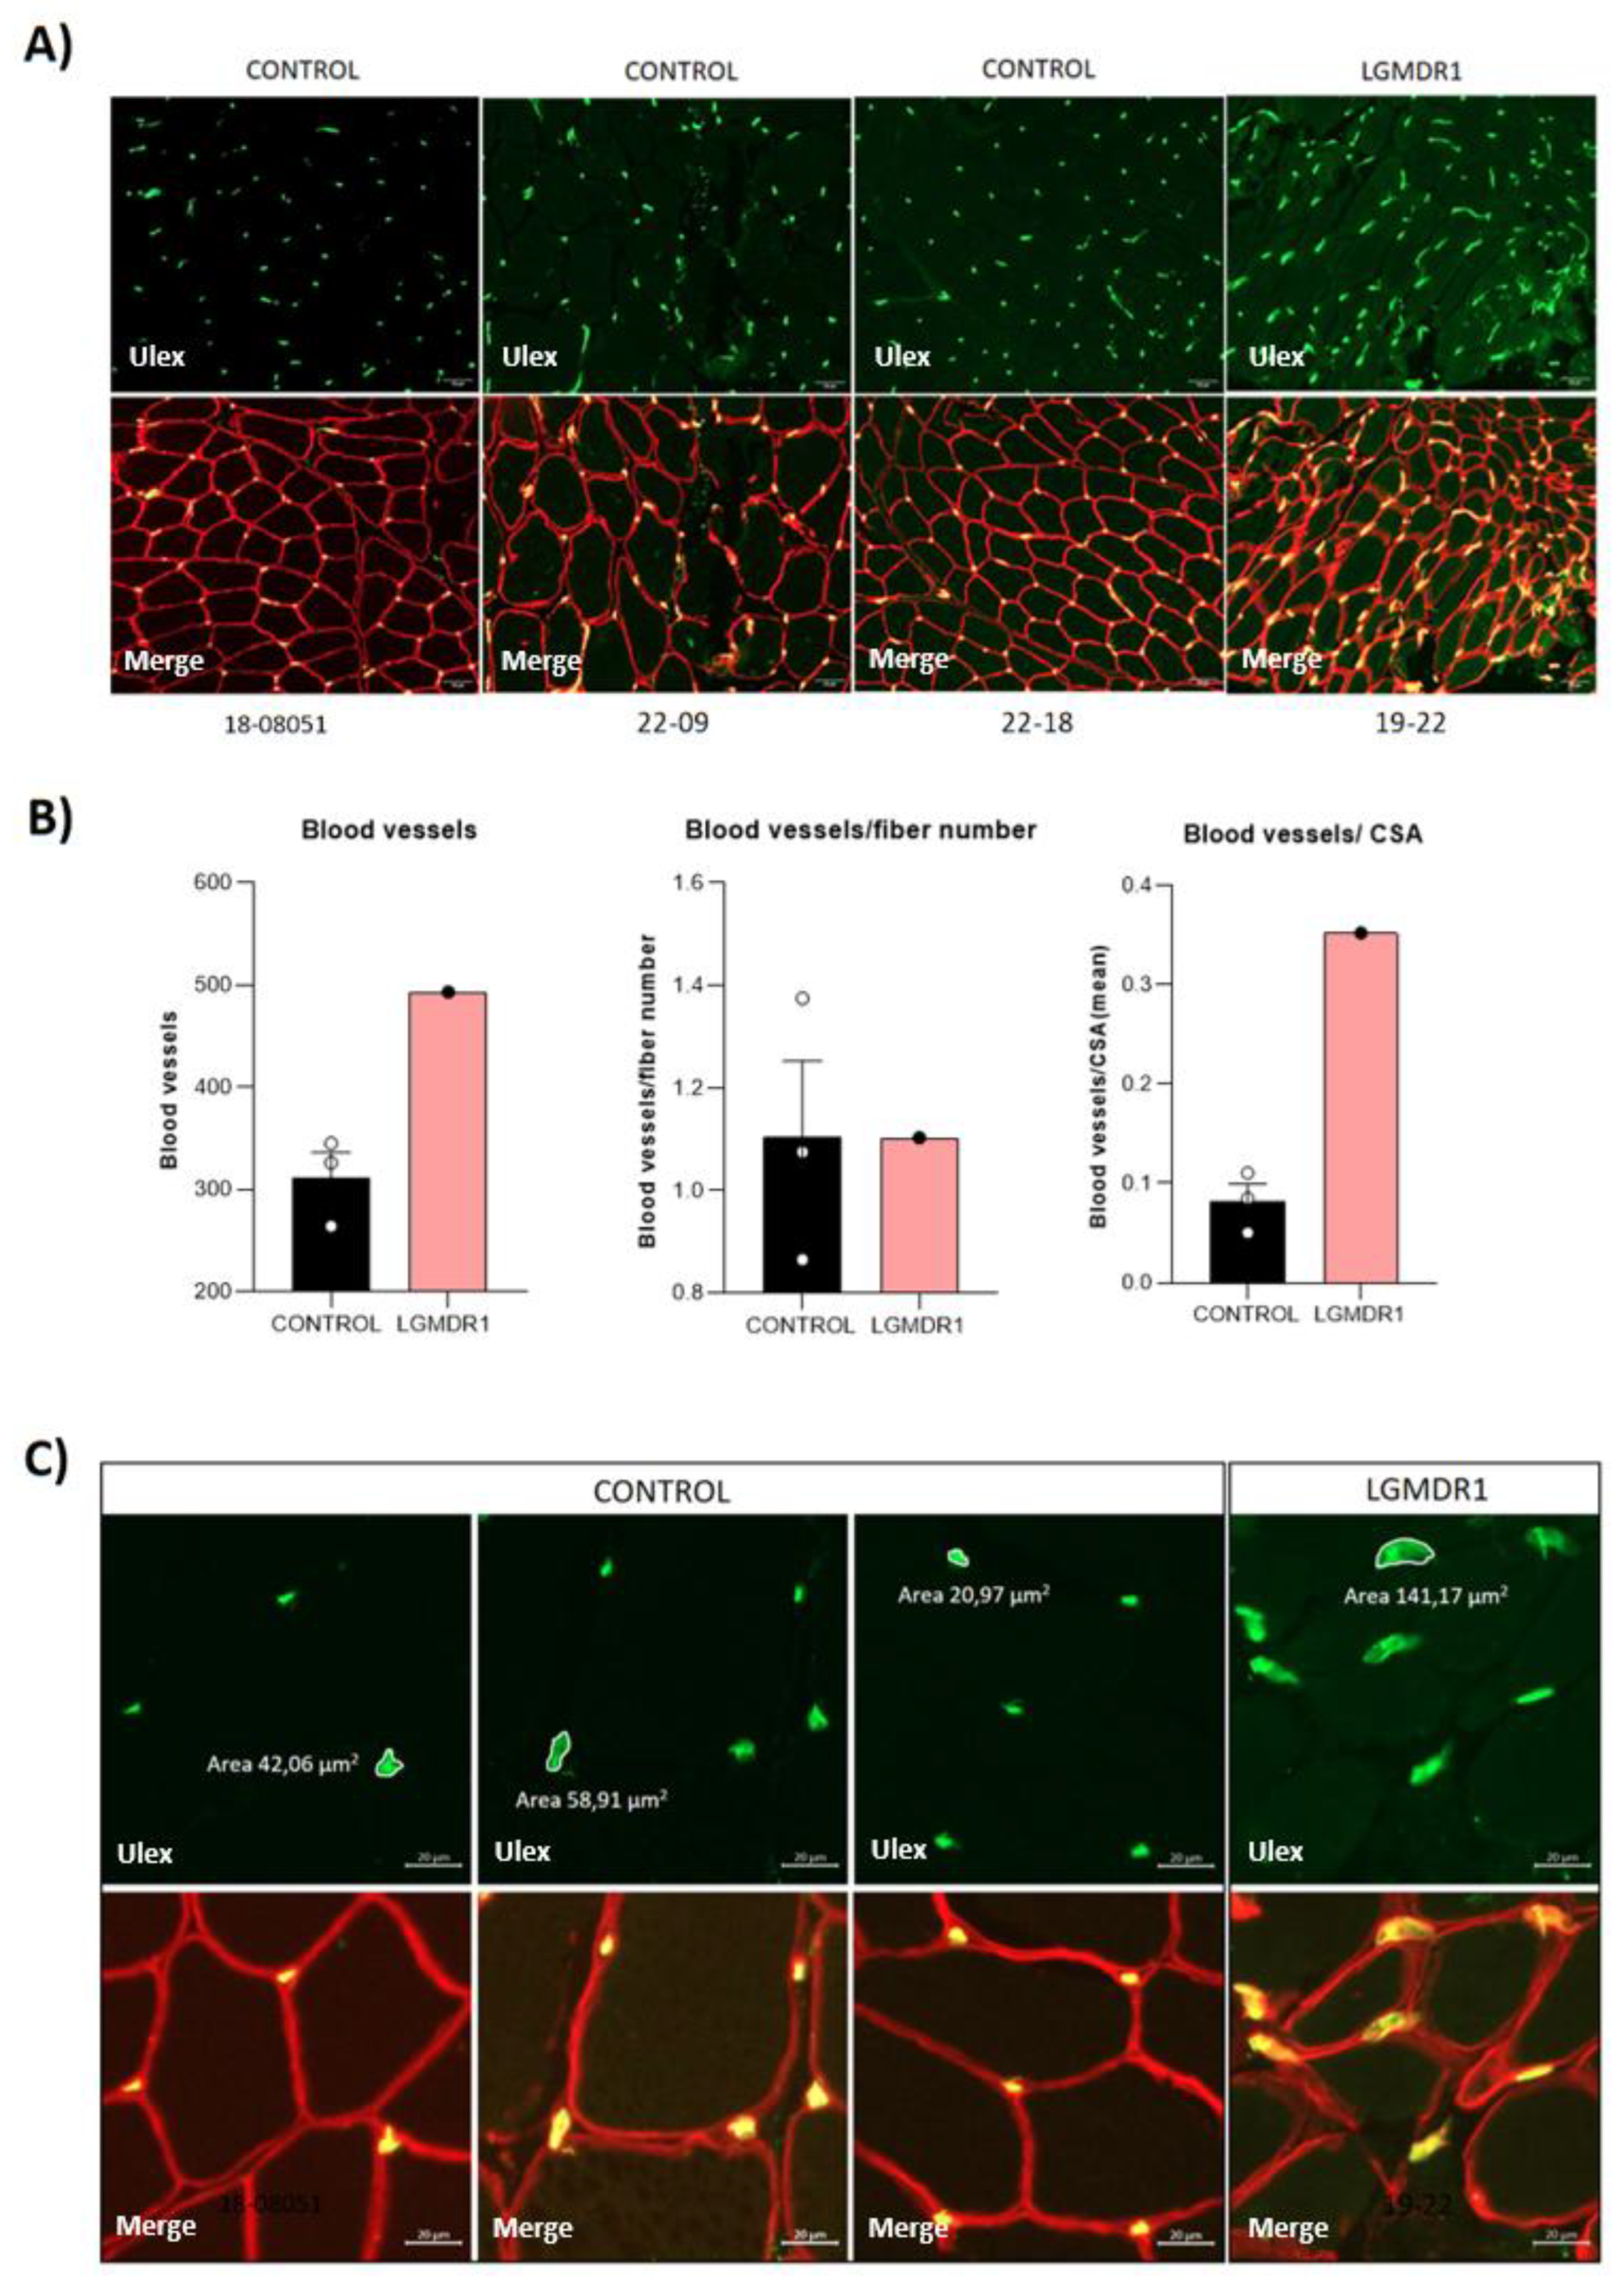
Figure 13.
Nuclear localization of TLN1 in CD56- cells in controls and LGMDR1 patients. TLN1 distribution in nucleus of CD56- cells. TLN1 (green), Hoechst (blue). Scale bars: 10 μm.
Figure 13.
Nuclear localization of TLN1 in CD56- cells in controls and LGMDR1 patients. TLN1 distribution in nucleus of CD56- cells. TLN1 (green), Hoechst (blue). Scale bars: 10 μm.
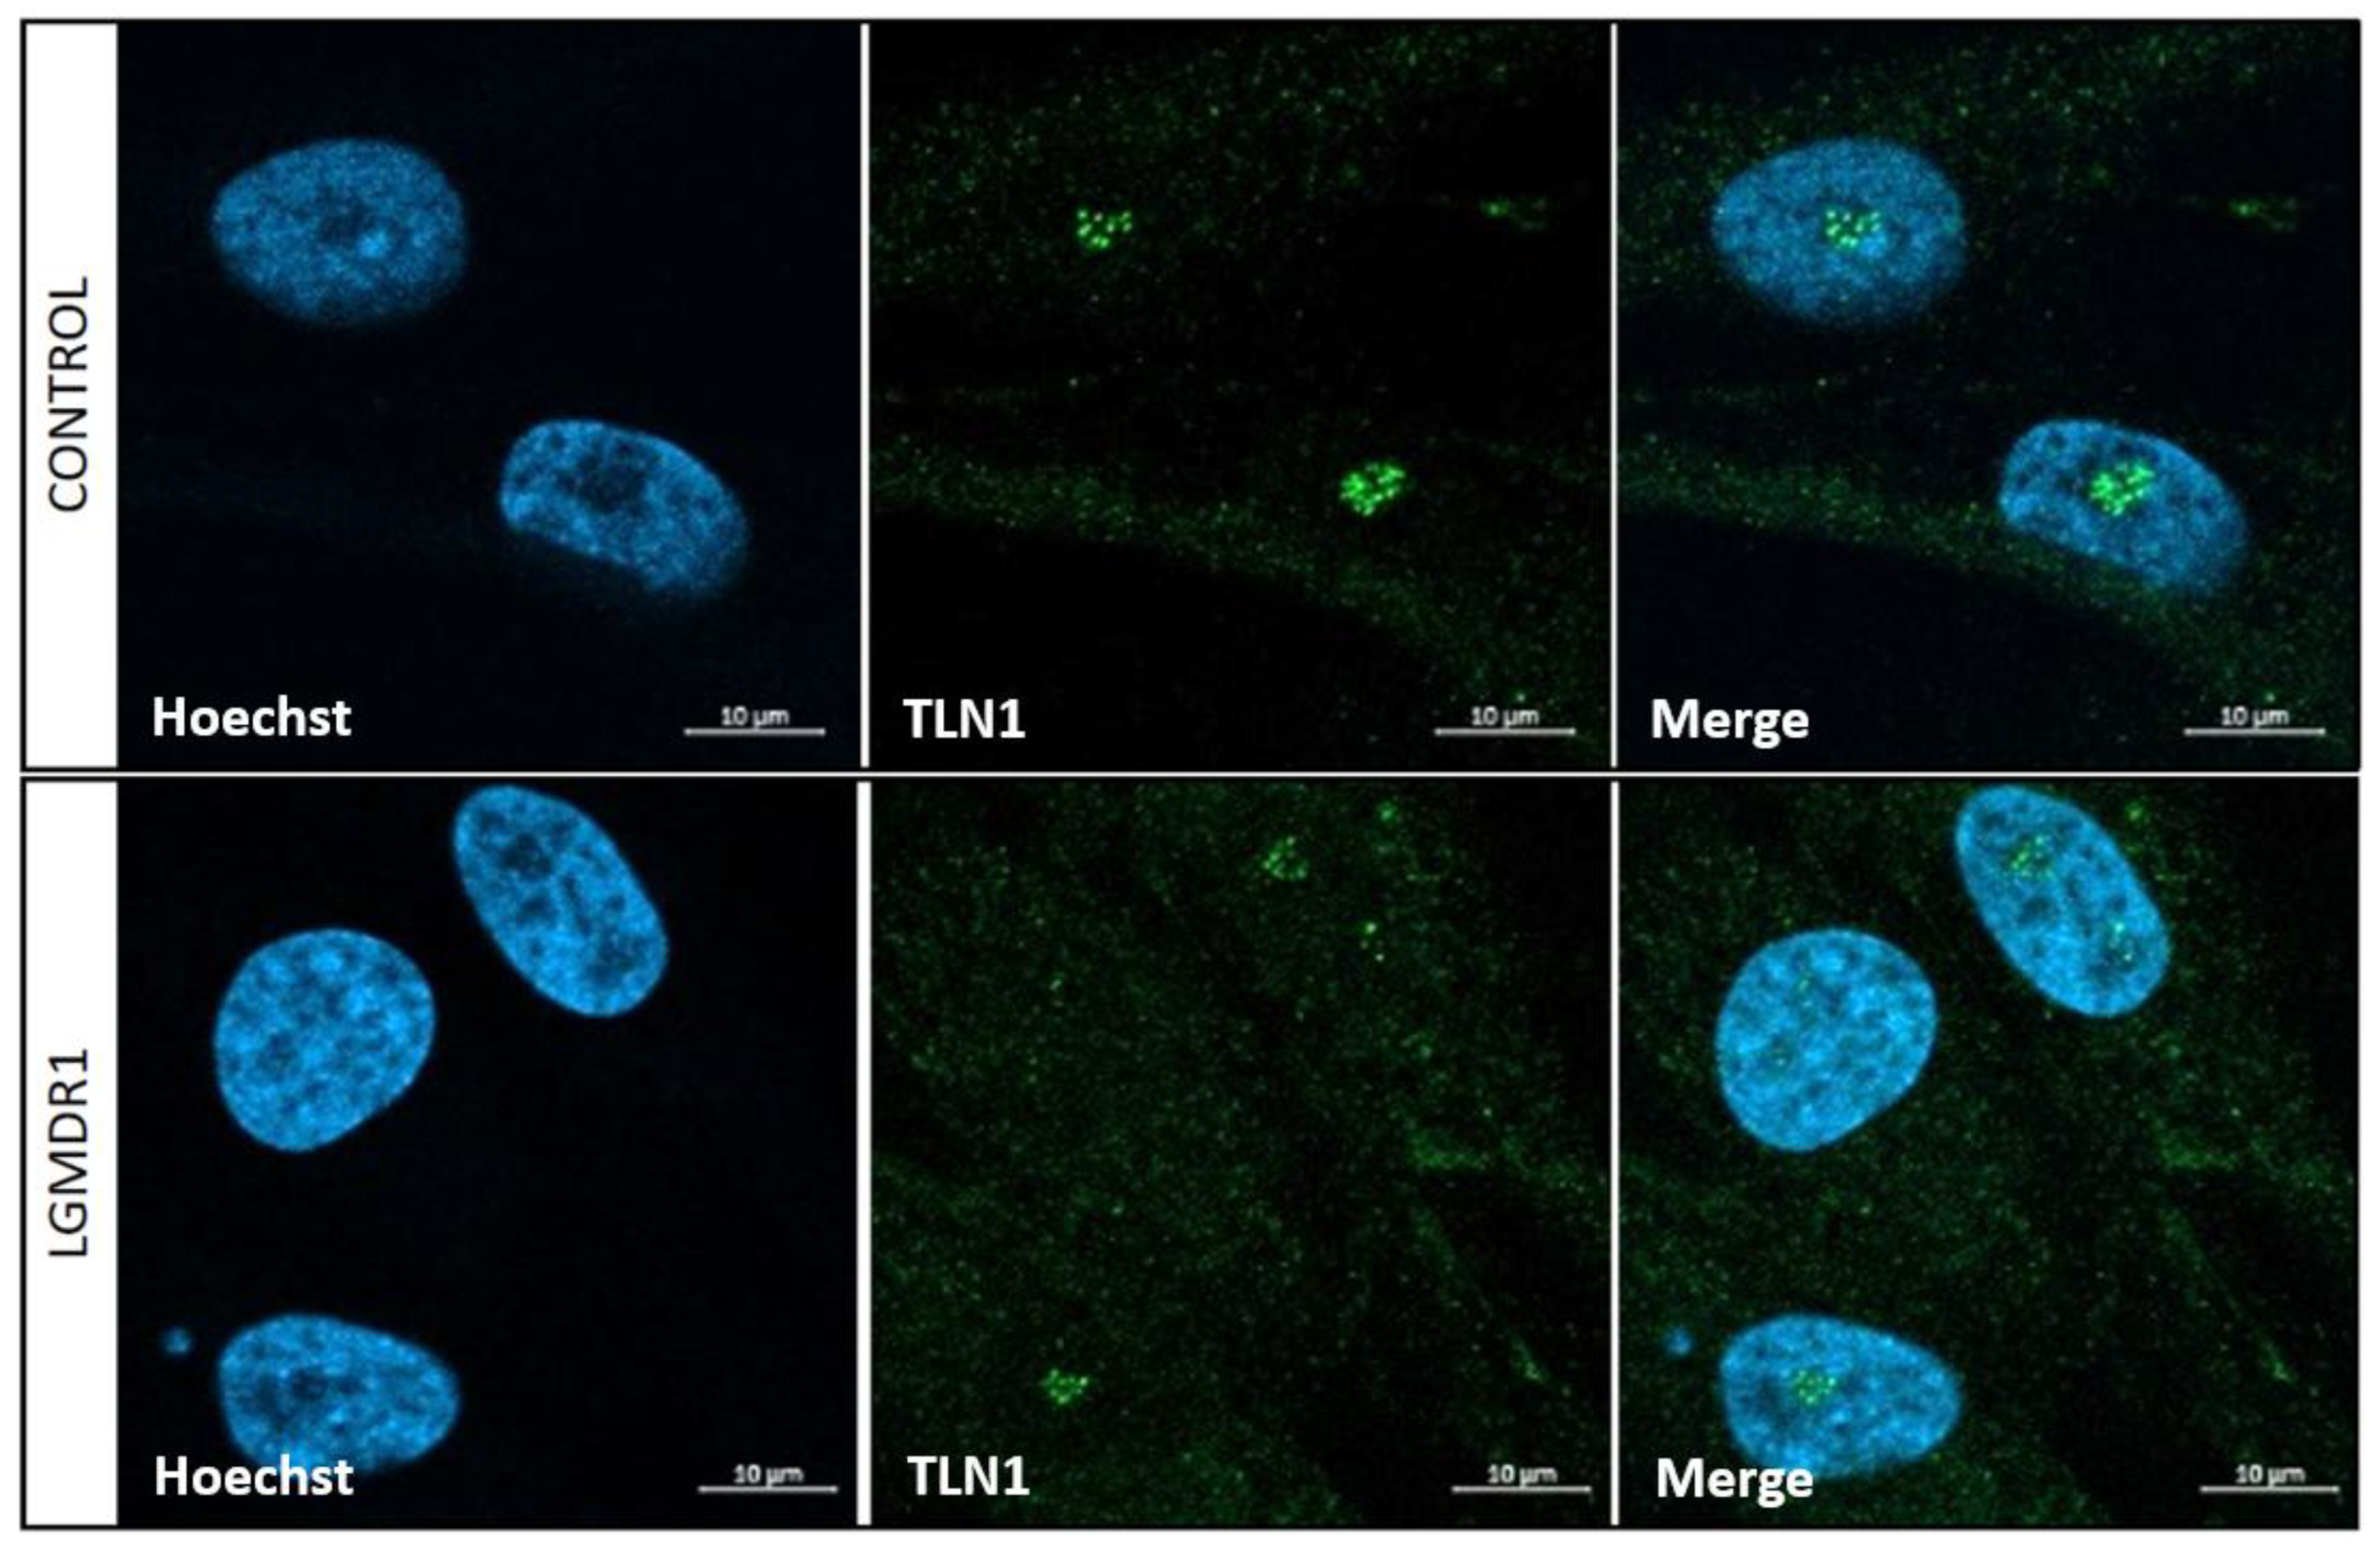
Figure 14.
Nucleolar TLN1 localization in LGMDR1 and control (A) myoblasts and (B) myotubes. TLN1 (green), NCL (pink), Hoechst (blue), MYHC (red). Scale bars: 10 μm.
Figure 14.
Nucleolar TLN1 localization in LGMDR1 and control (A) myoblasts and (B) myotubes. TLN1 (green), NCL (pink), Hoechst (blue), MYHC (red). Scale bars: 10 μm.
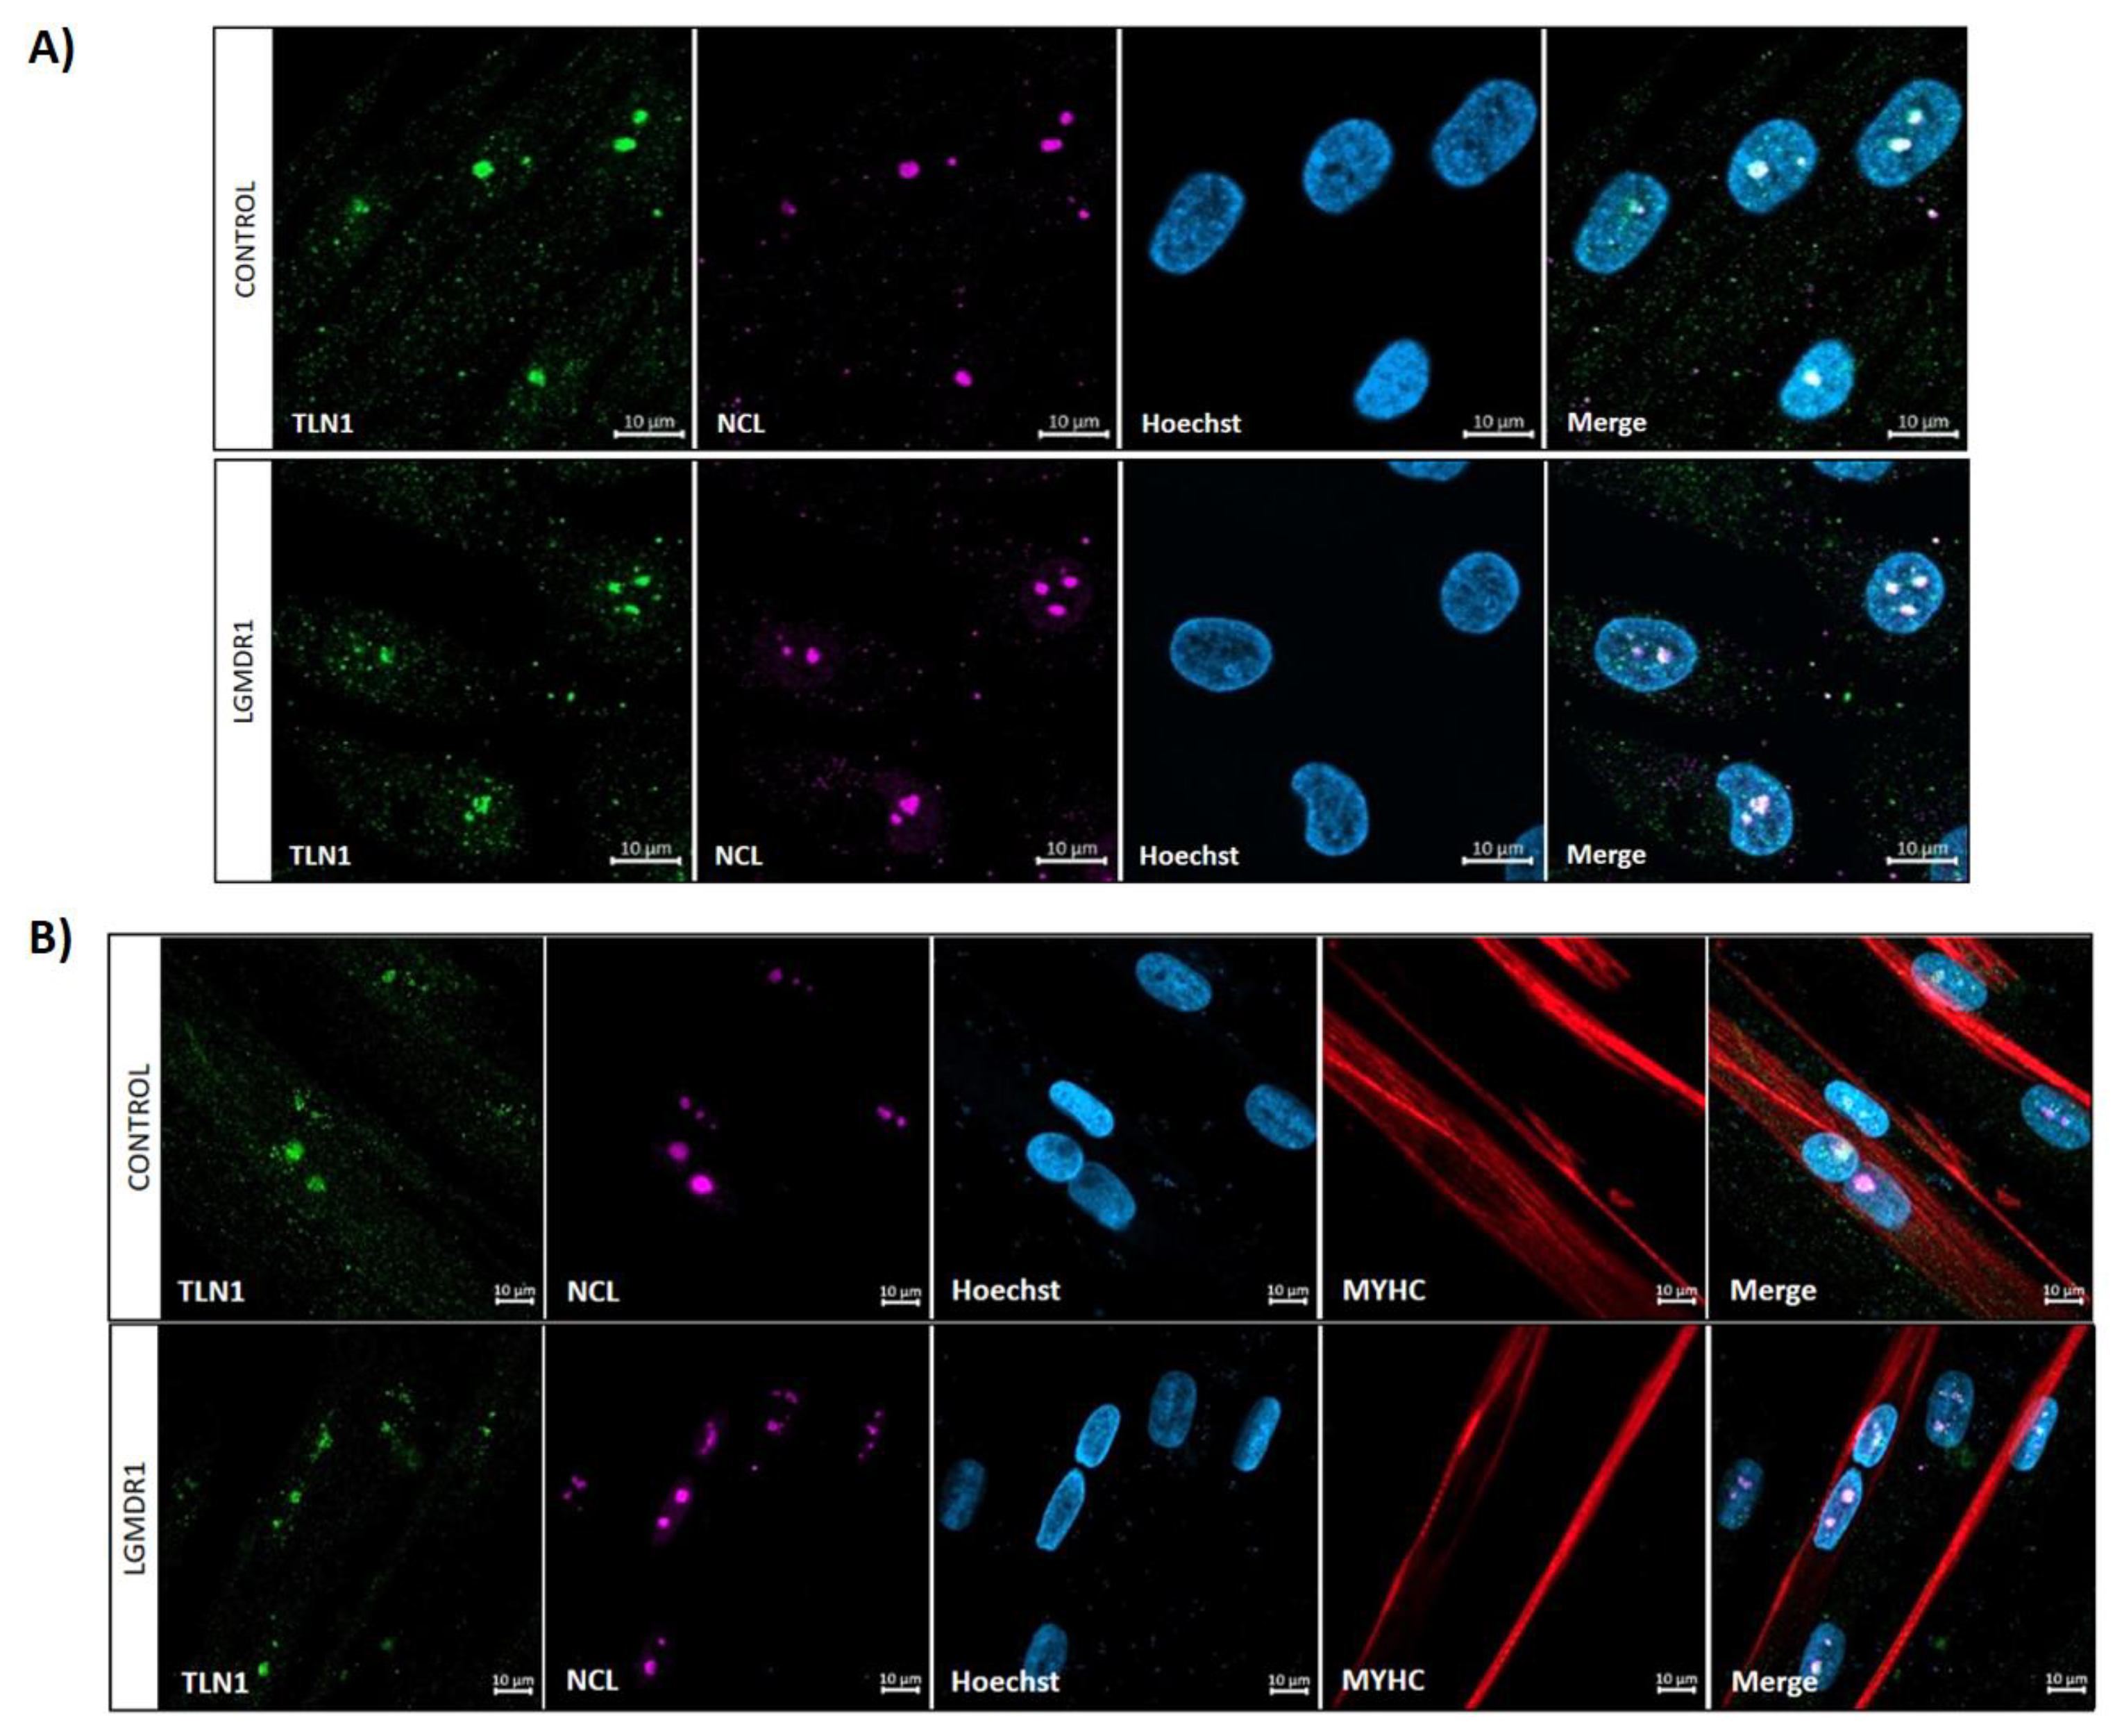
Figure 15.
TLN1 and NCL dispersion throughout myoblast nuclei of LGMDR1. Plotted distance in µm (x axis), fluorescence intensity (y axis). TLN1 (green), NCL (pink), Hoechst (blue).
Figure 15.
TLN1 and NCL dispersion throughout myoblast nuclei of LGMDR1. Plotted distance in µm (x axis), fluorescence intensity (y axis). TLN1 (green), NCL (pink), Hoechst (blue).
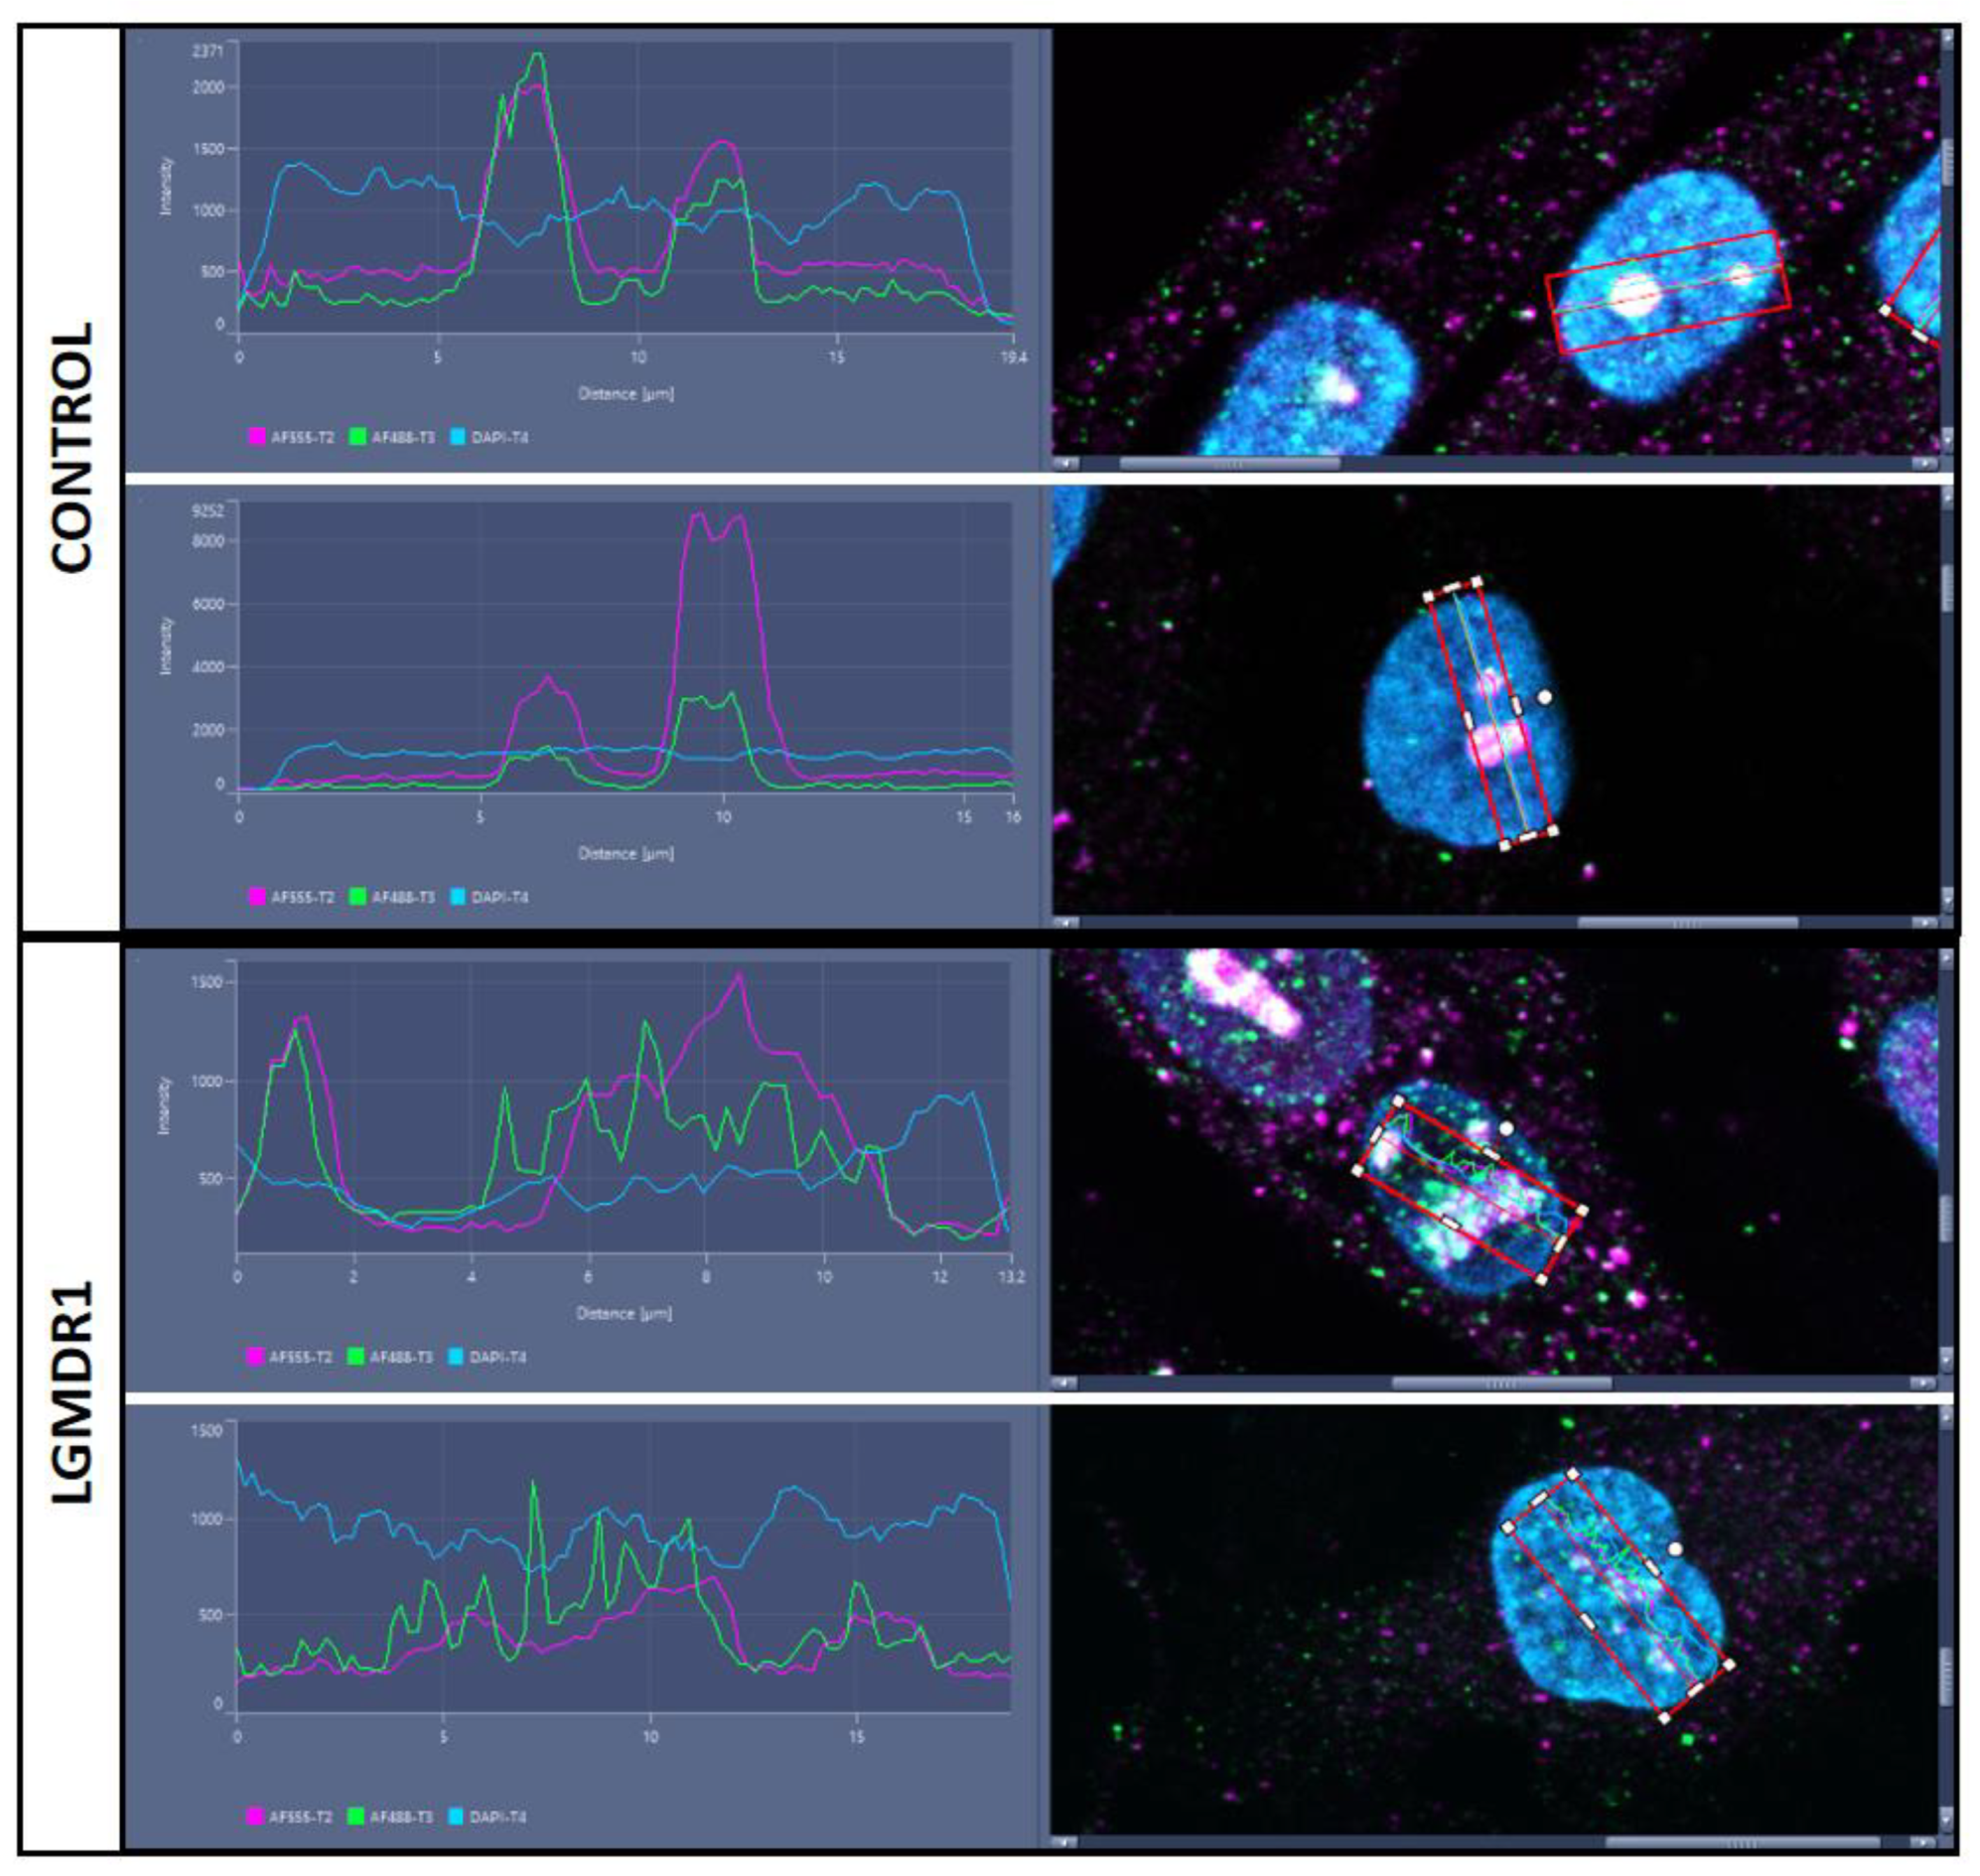
Figure 16.
Nucleolar TLN1 localization in LGMDR1 and control skeletal muscle fibers. Amplification of white squares in lower panel. Scale bars: 50 (upper panel) and 5 (lower panel) μm. TLN1 (green), NCL (pink), Hoechst (blue).
Figure 16.
Nucleolar TLN1 localization in LGMDR1 and control skeletal muscle fibers. Amplification of white squares in lower panel. Scale bars: 50 (upper panel) and 5 (lower panel) μm. TLN1 (green), NCL (pink), Hoechst (blue).
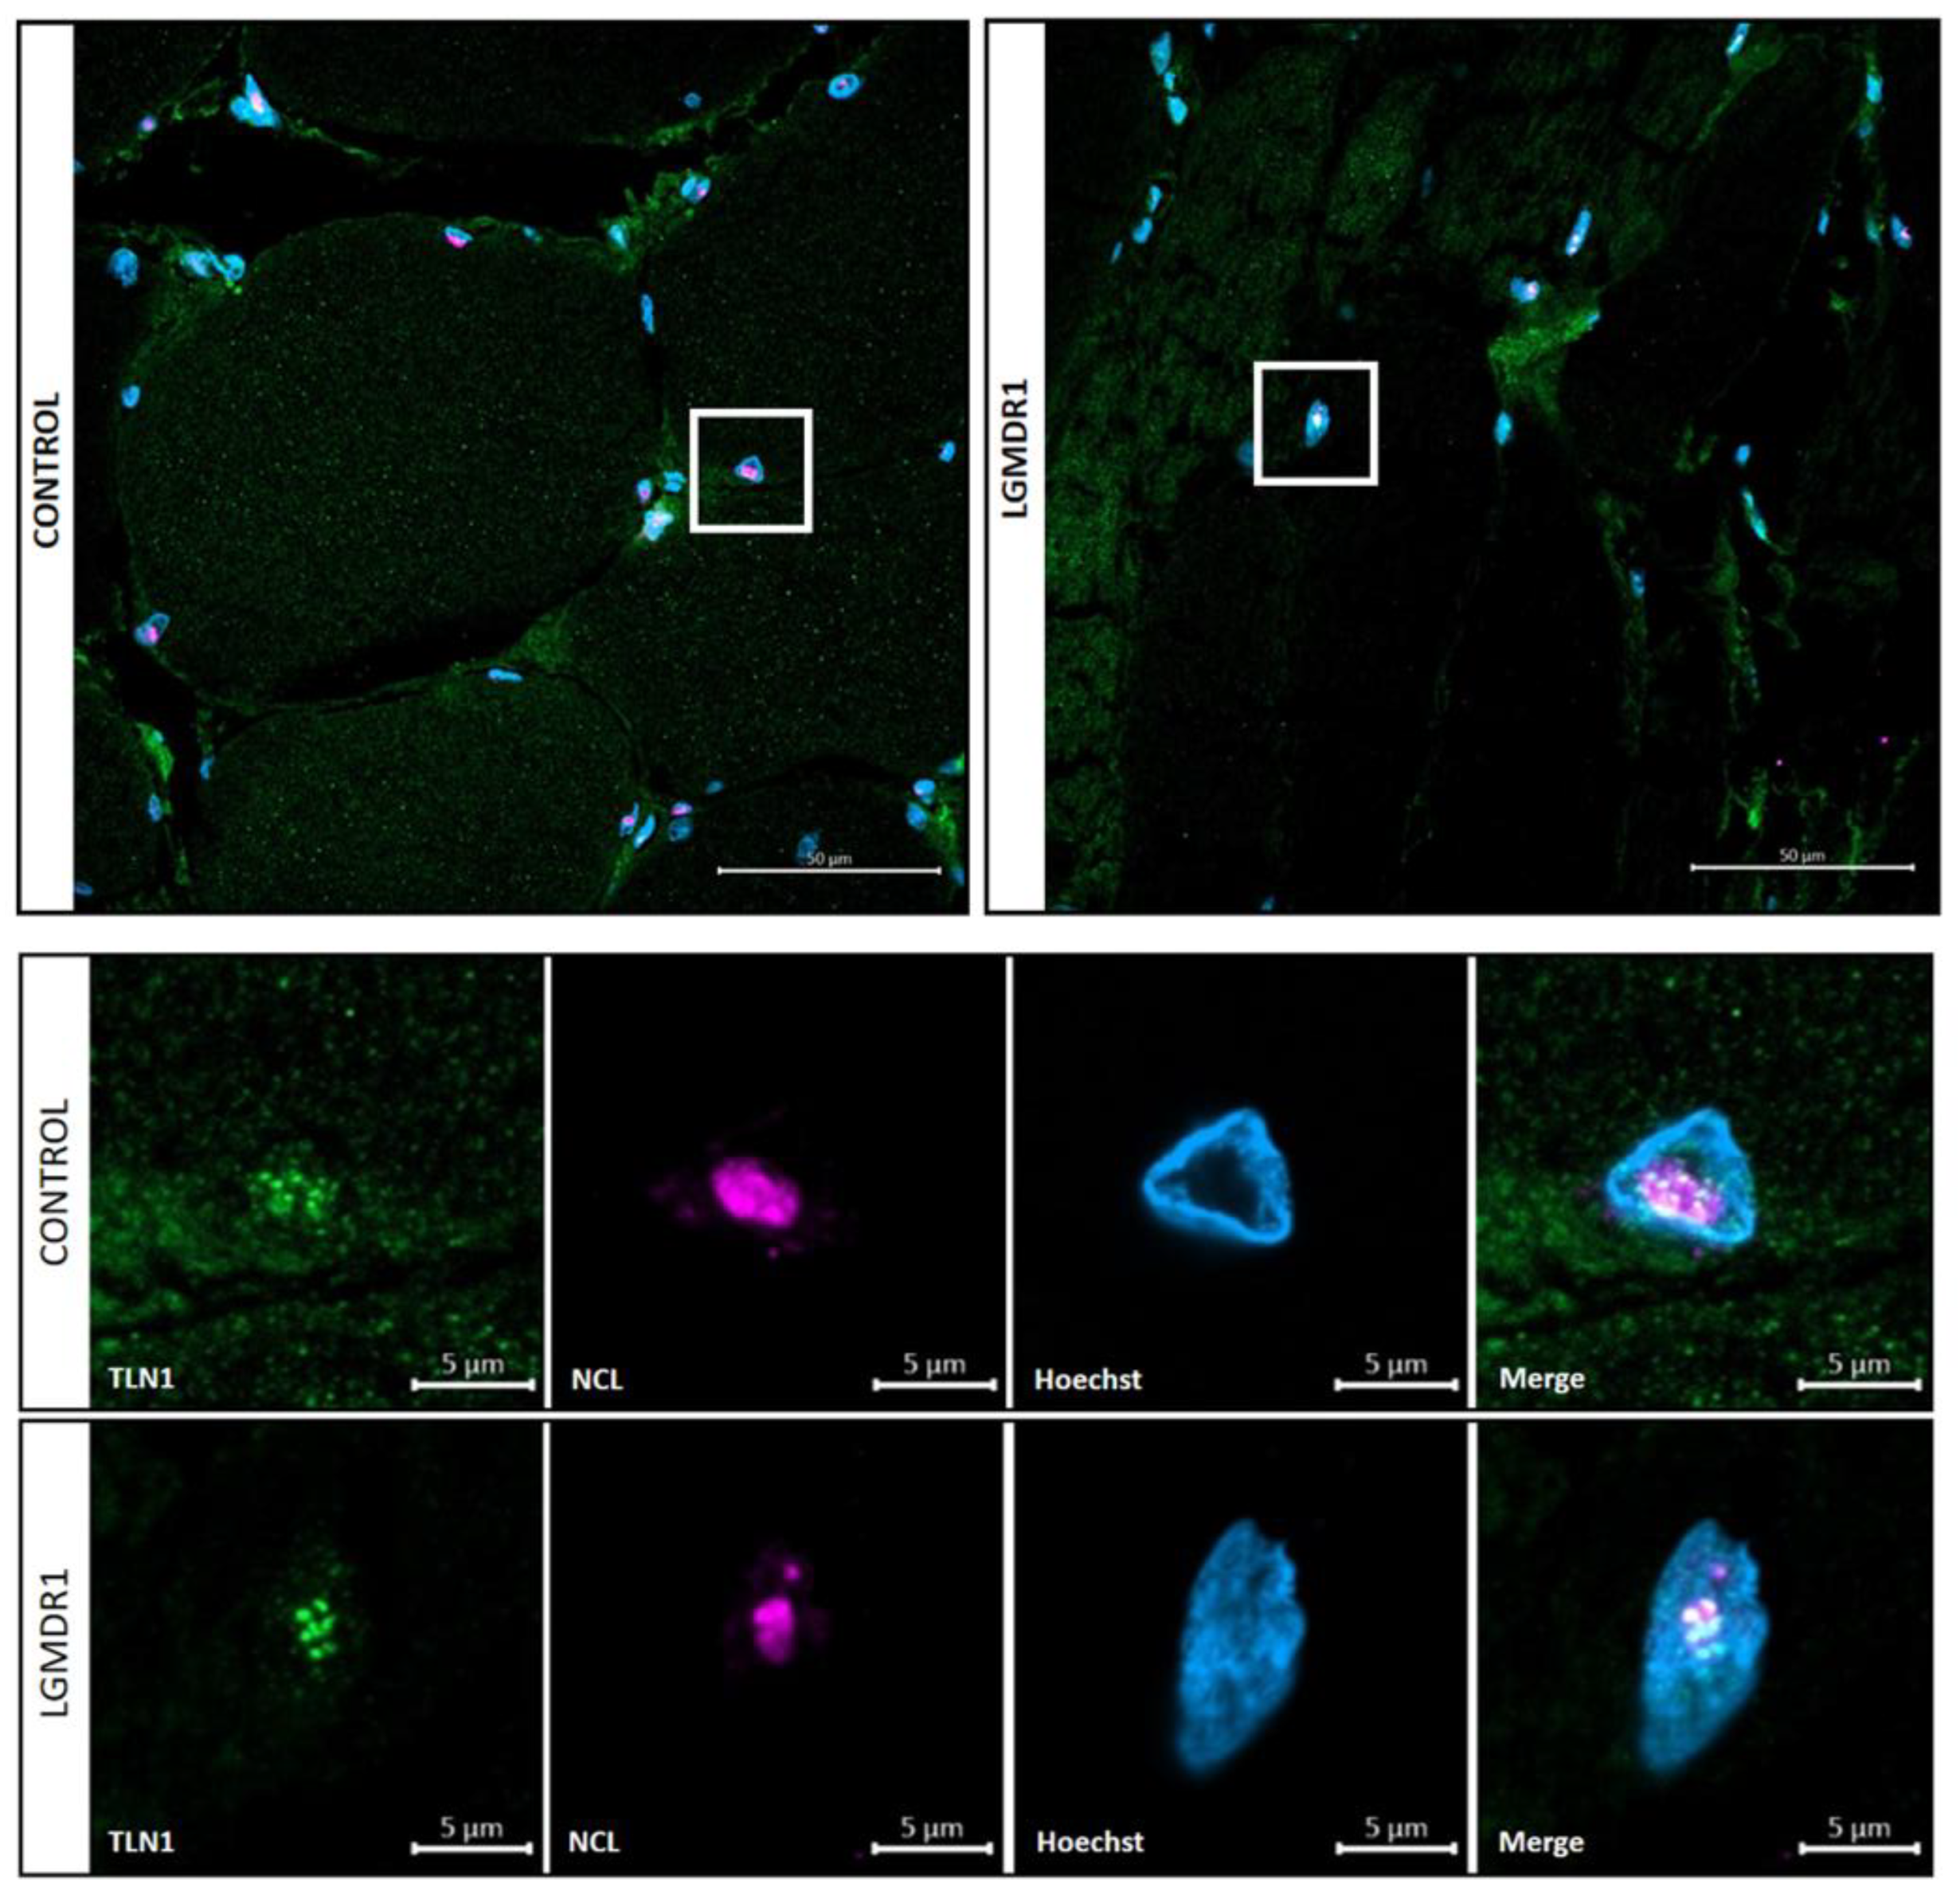
Figure 17.
Nuclear morphology analysis in LGMDR1 cells. (A,B) CD56- cells (2 controls and 2 patients), (C,D) myoblasts (3 controls and 3 patients) and (E,F) myotubes (3 controls and 3 patients). Arrows: Nuclear blebbing. Asterisks: micronuclei. Hoechst (blue), MYHC (red). *p<0,05; **p<0,01;****p<0,0001. For all images, scale bars are 10 μm.
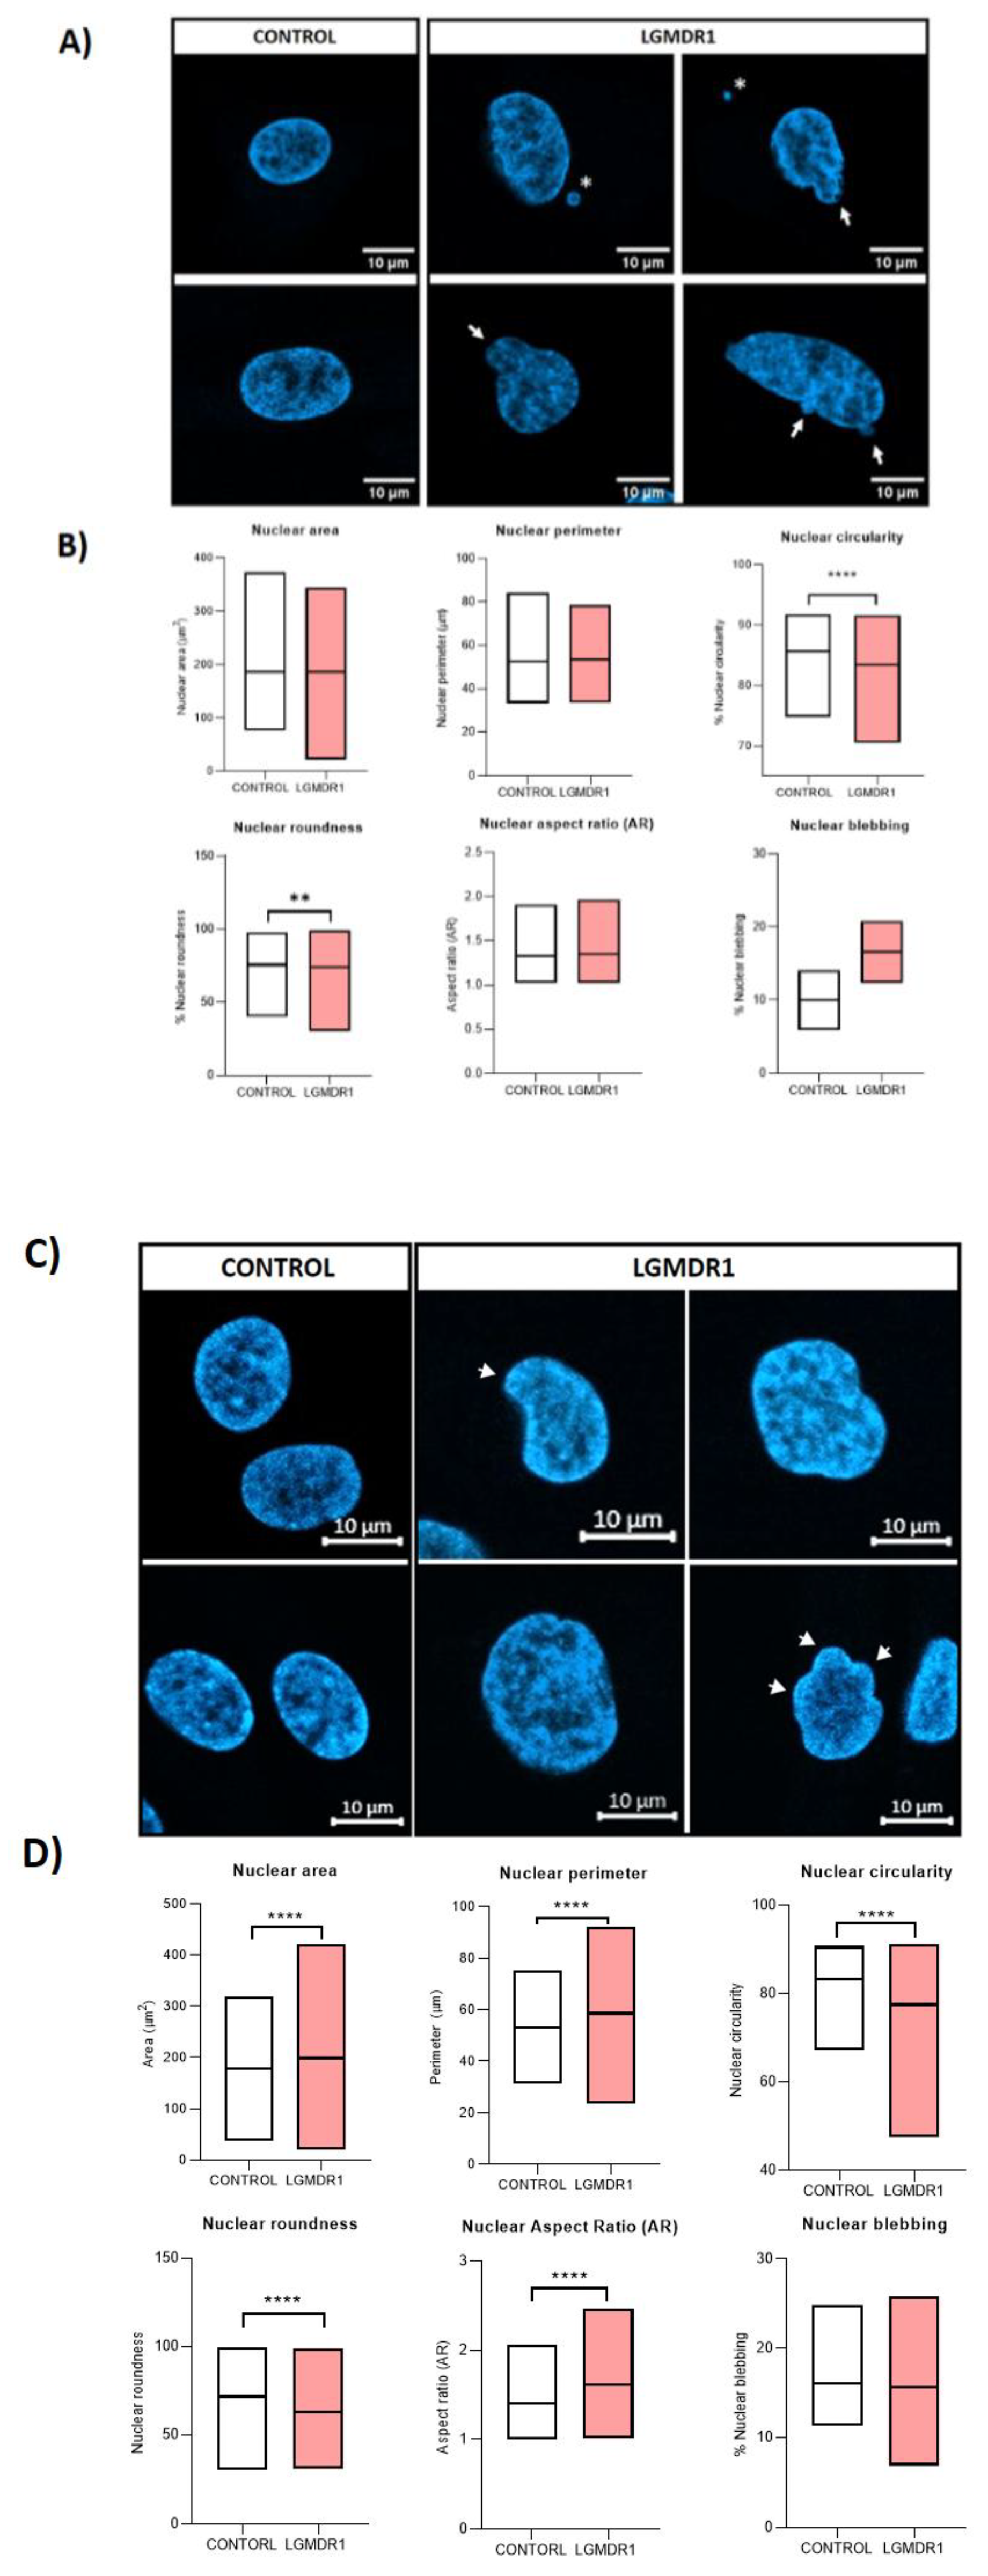
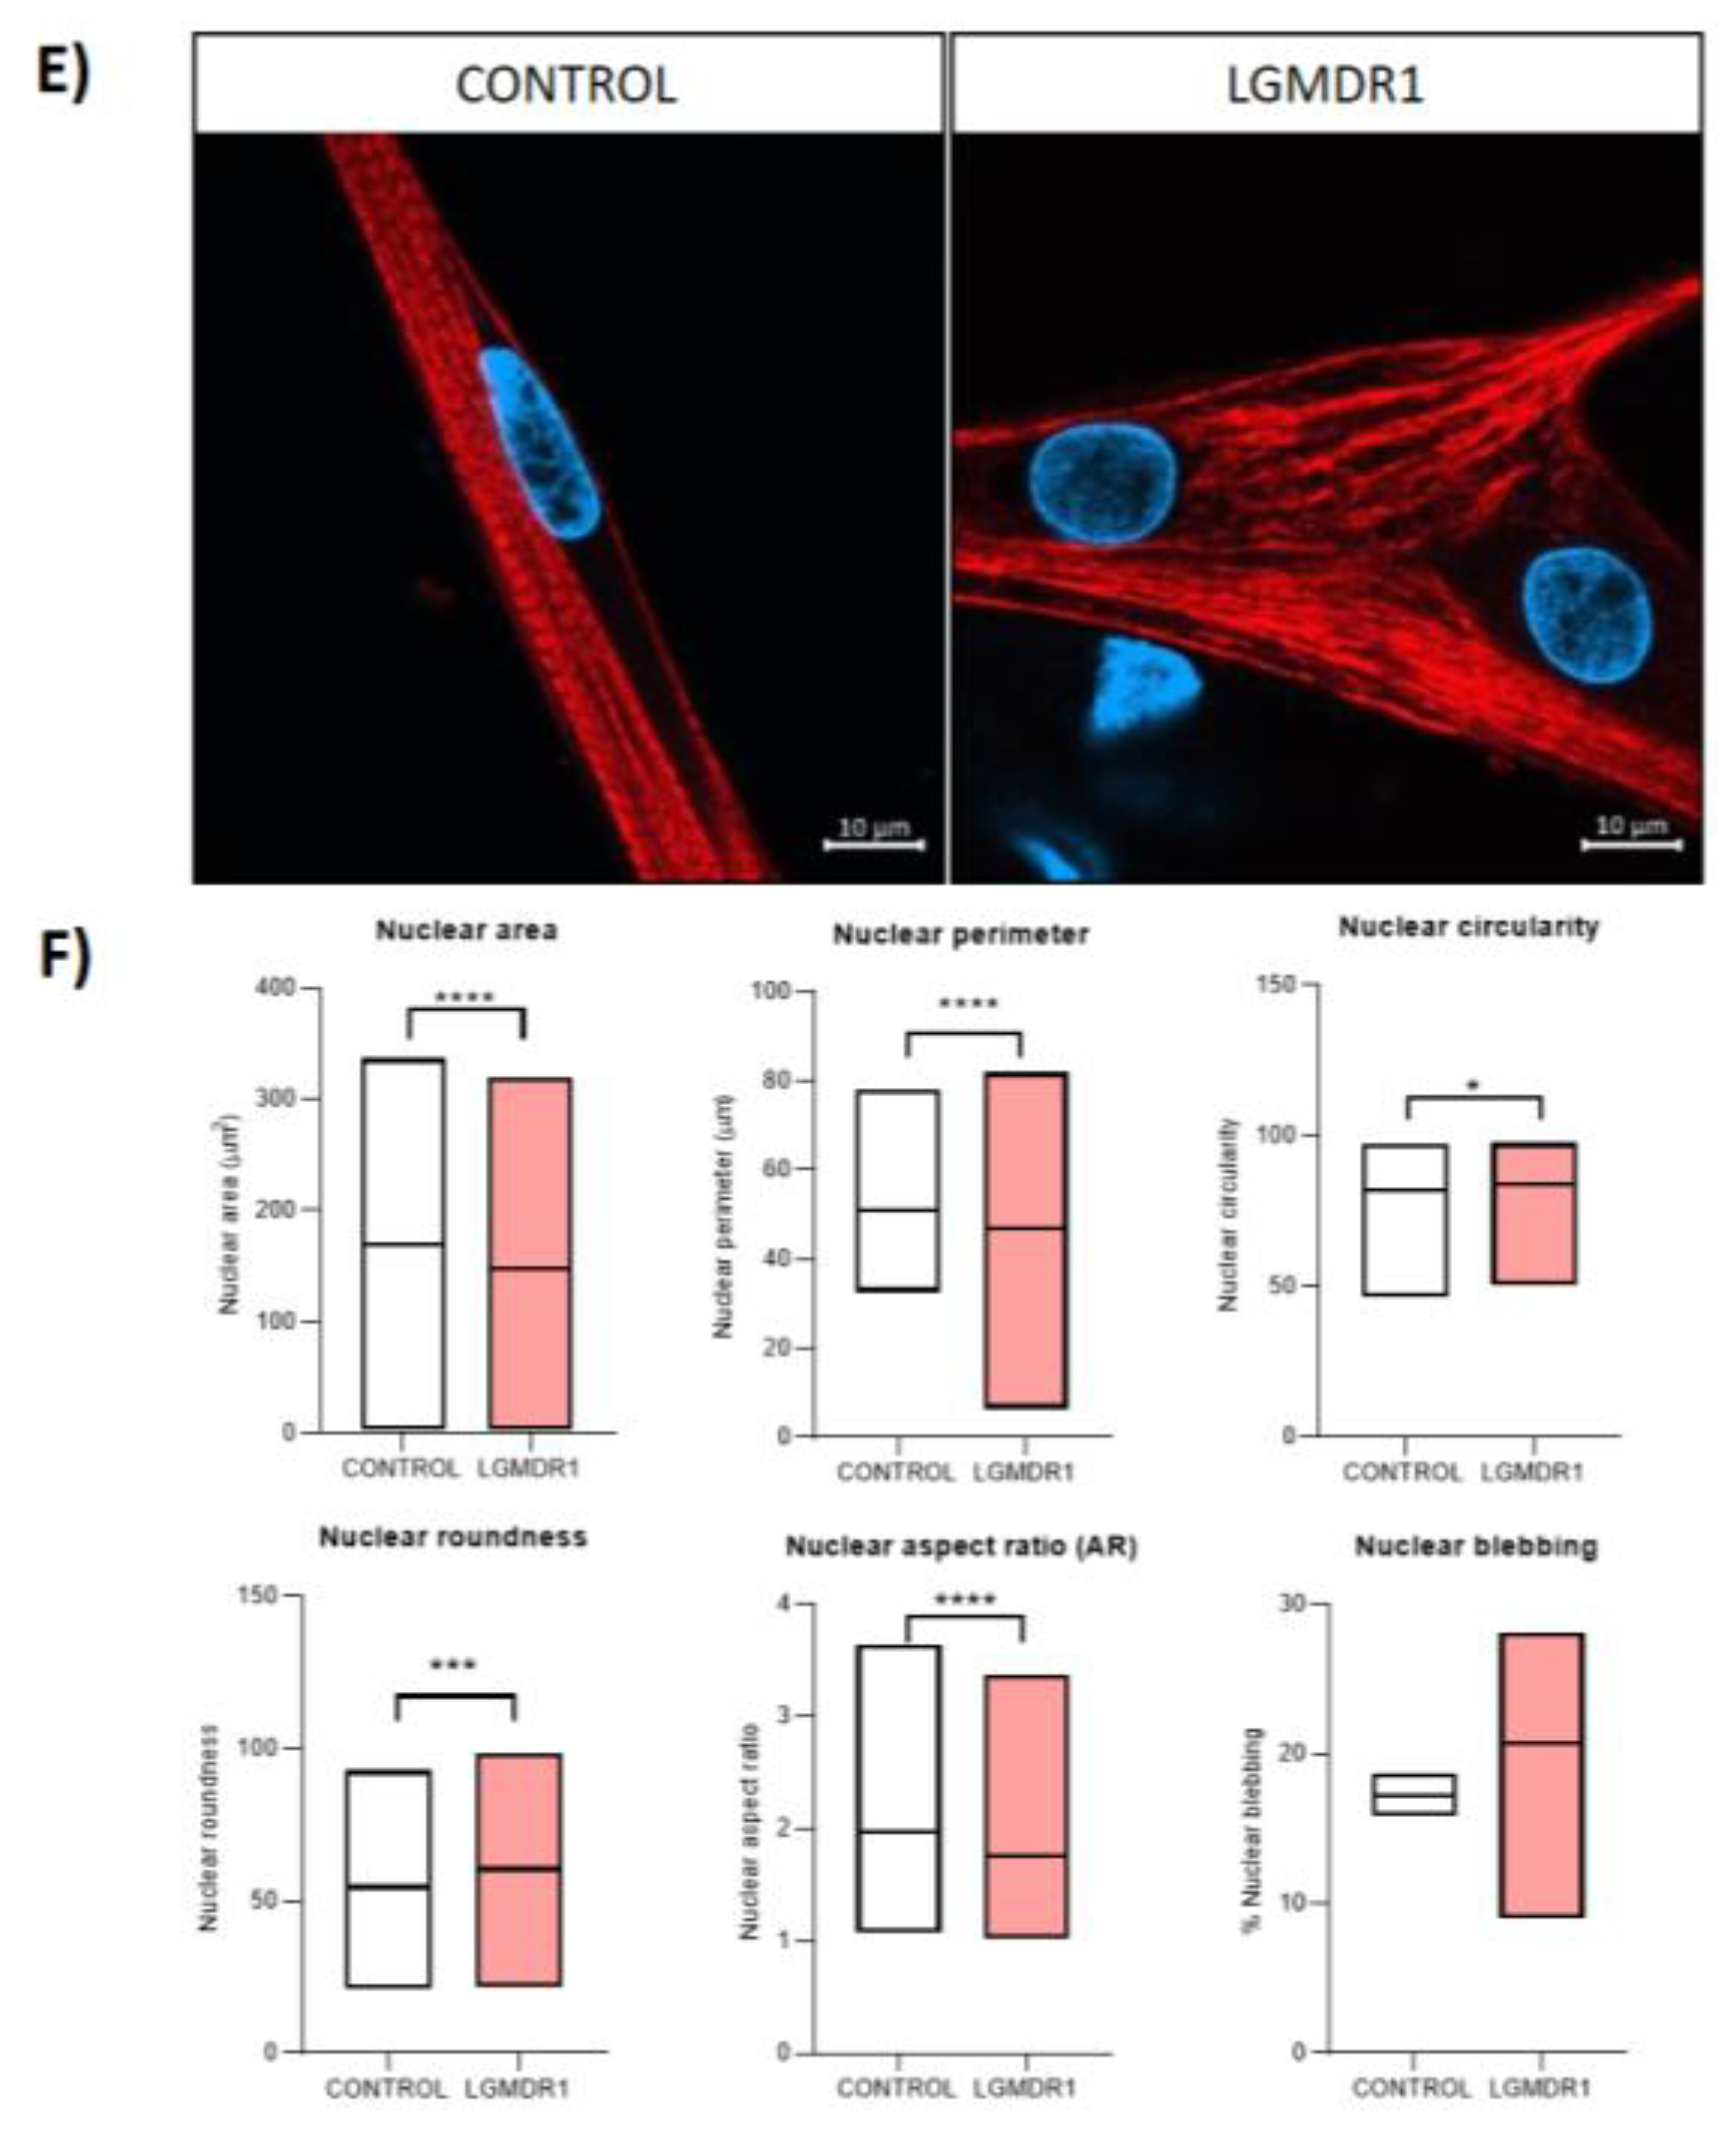
Figure 18.
Nuclear morphology analysis in controls and LGMDR1 patients’ muscle sections. (A) Confocal microscopy images of LGMDR1 and control nuclei of muscle sections. (B) Nuclear morphology analysis (2 controls and 3 LGMDR1 patients). Laminin (red), Hoechst (blue). Scale bars: 10 μm. ****p<0.0001.
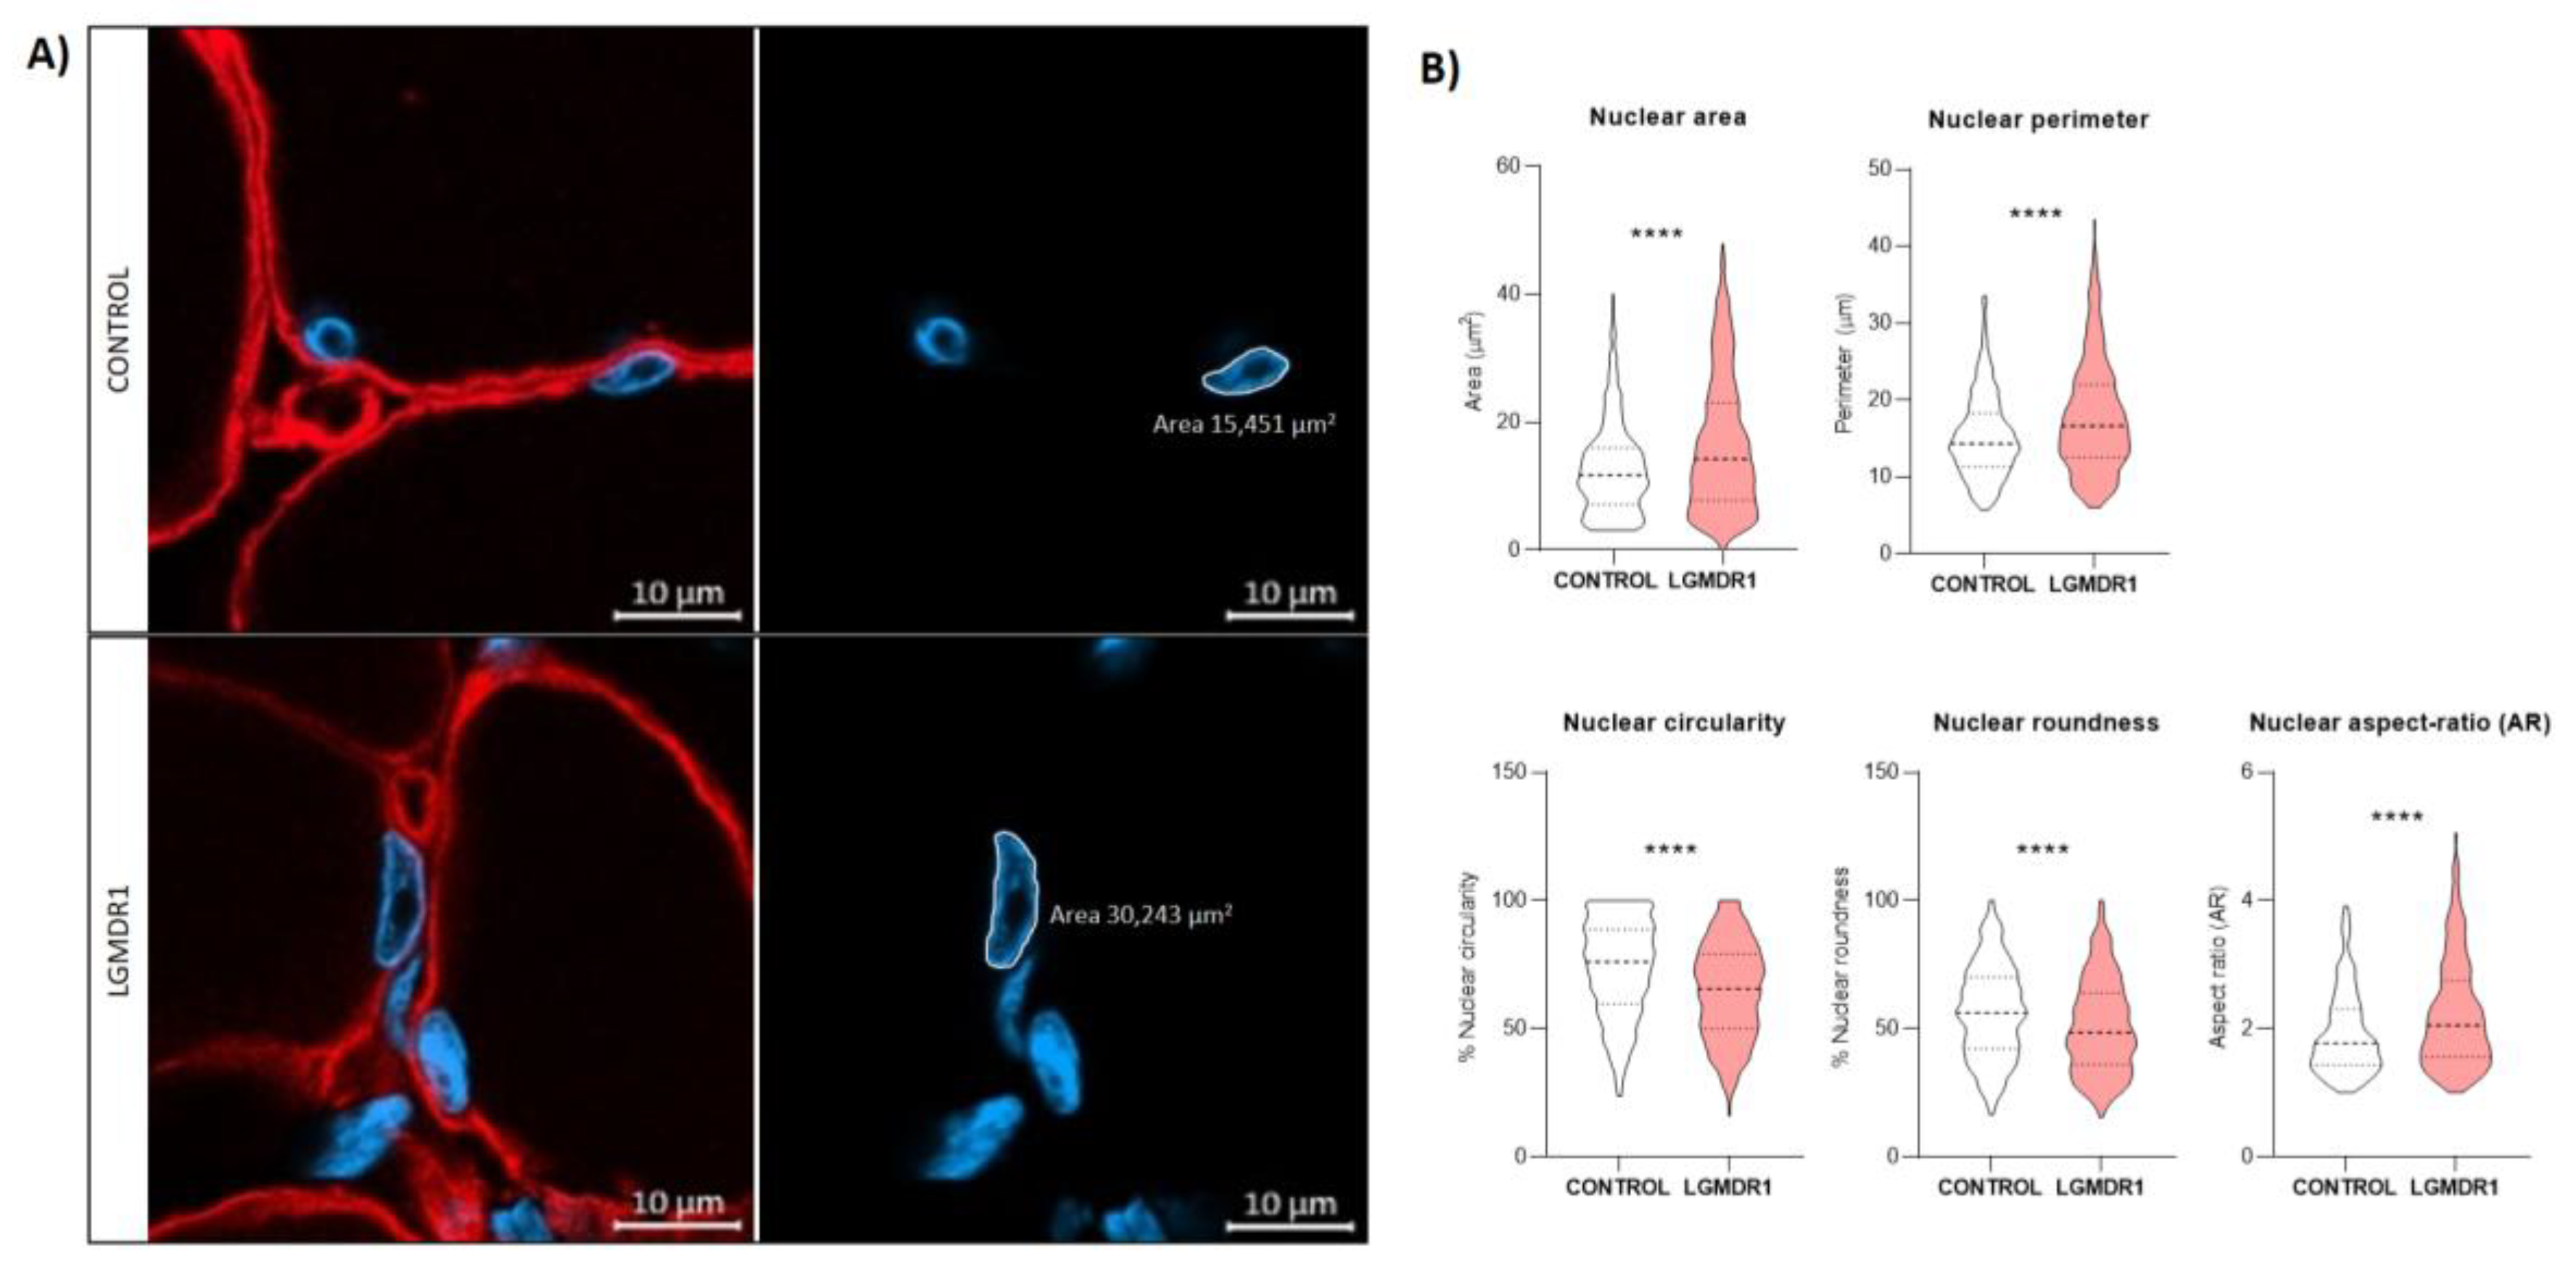
Figure 19.
Clustered centrosomes in LGMDR1 CD56- cells (2 controls and 2 patients). Y-tubulin (green), Hoechst (blue). Scale bars are 10 μm.
Figure 19.
Clustered centrosomes in LGMDR1 CD56- cells (2 controls and 2 patients). Y-tubulin (green), Hoechst (blue). Scale bars are 10 μm.
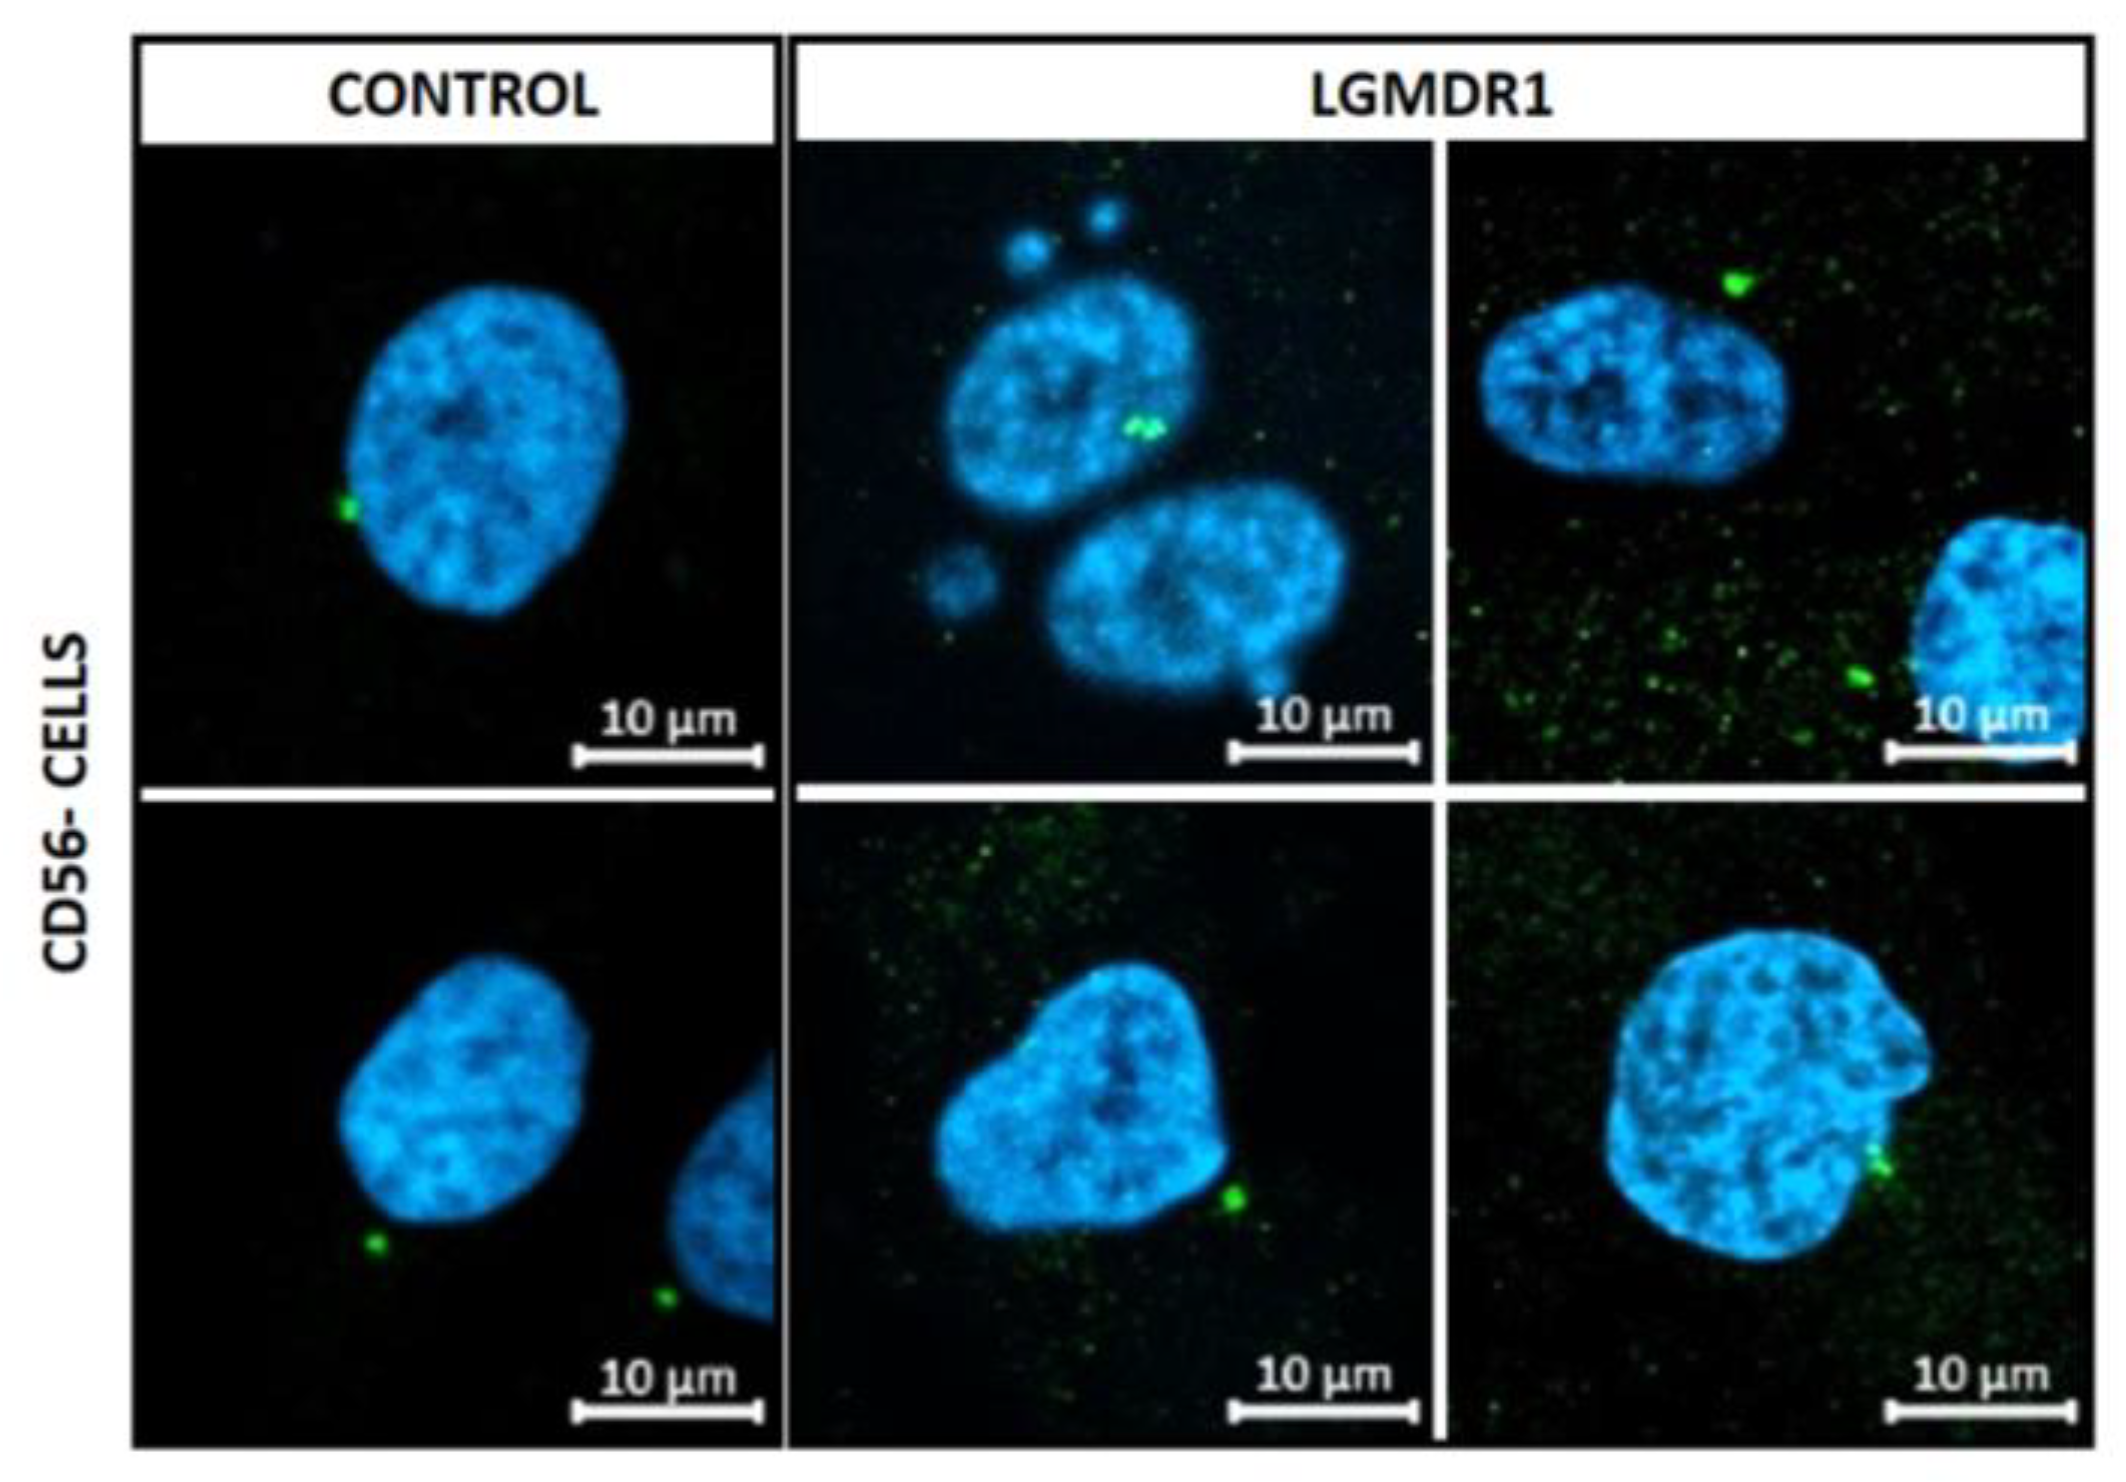
Figure 20.
Centrosome-nucleus distance in LGMDR1 cells. (A) Distance and representative images of CD56- cells (2 controls and 2 patients) and (B) myoblasts (3 controls and 3 patients). Hoechst (blue), ϒ-tubulin (green). ****p<0.0001. Scale bars: 10 µm.
Figure 20.
Centrosome-nucleus distance in LGMDR1 cells. (A) Distance and representative images of CD56- cells (2 controls and 2 patients) and (B) myoblasts (3 controls and 3 patients). Hoechst (blue), ϒ-tubulin (green). ****p<0.0001. Scale bars: 10 µm.
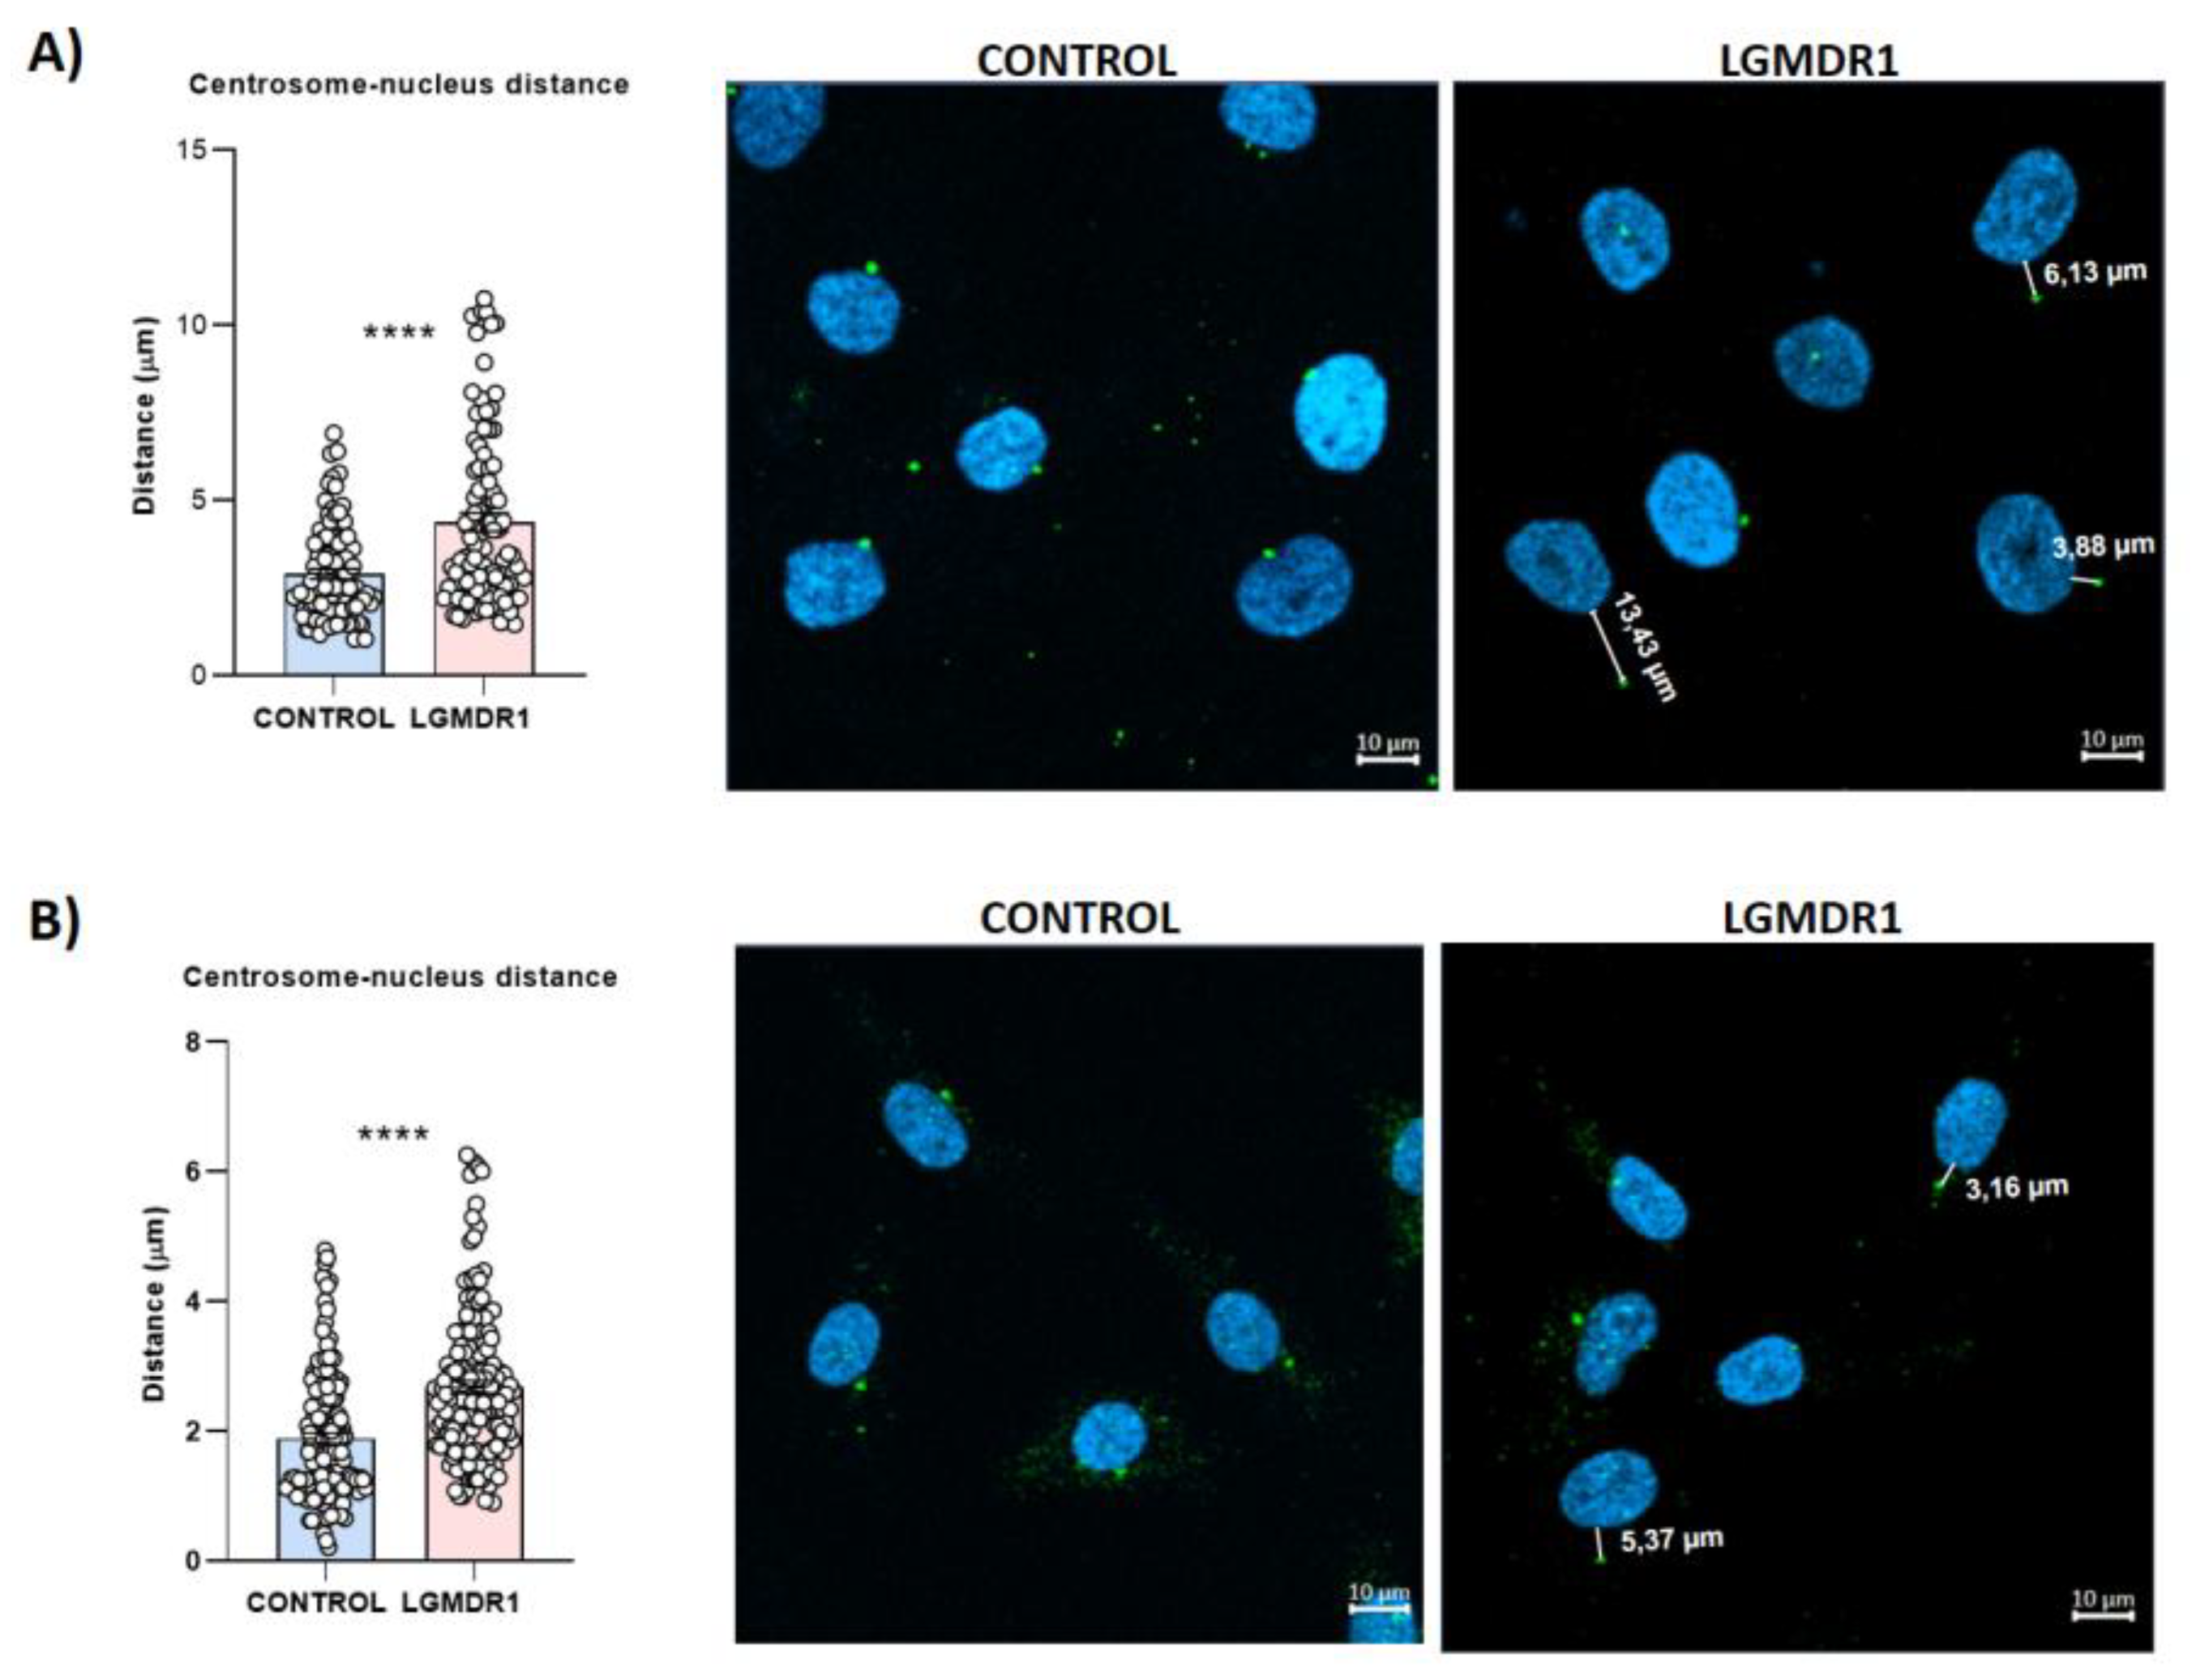
Figure 21.
Impairment of α-tubulin cytoskeleton in LGMDR1 in CD56- cells. (A) Confocal microscopy images of disorganized α-tubulin cytoskeleton in LGMDR1 cells. α-tubulin (green), Hoechst (blue). Scale bars: 20 µm. (B) Quantification of α-tubulin expression in myoblasts (2 patients and 2 controls). p=0.1106.
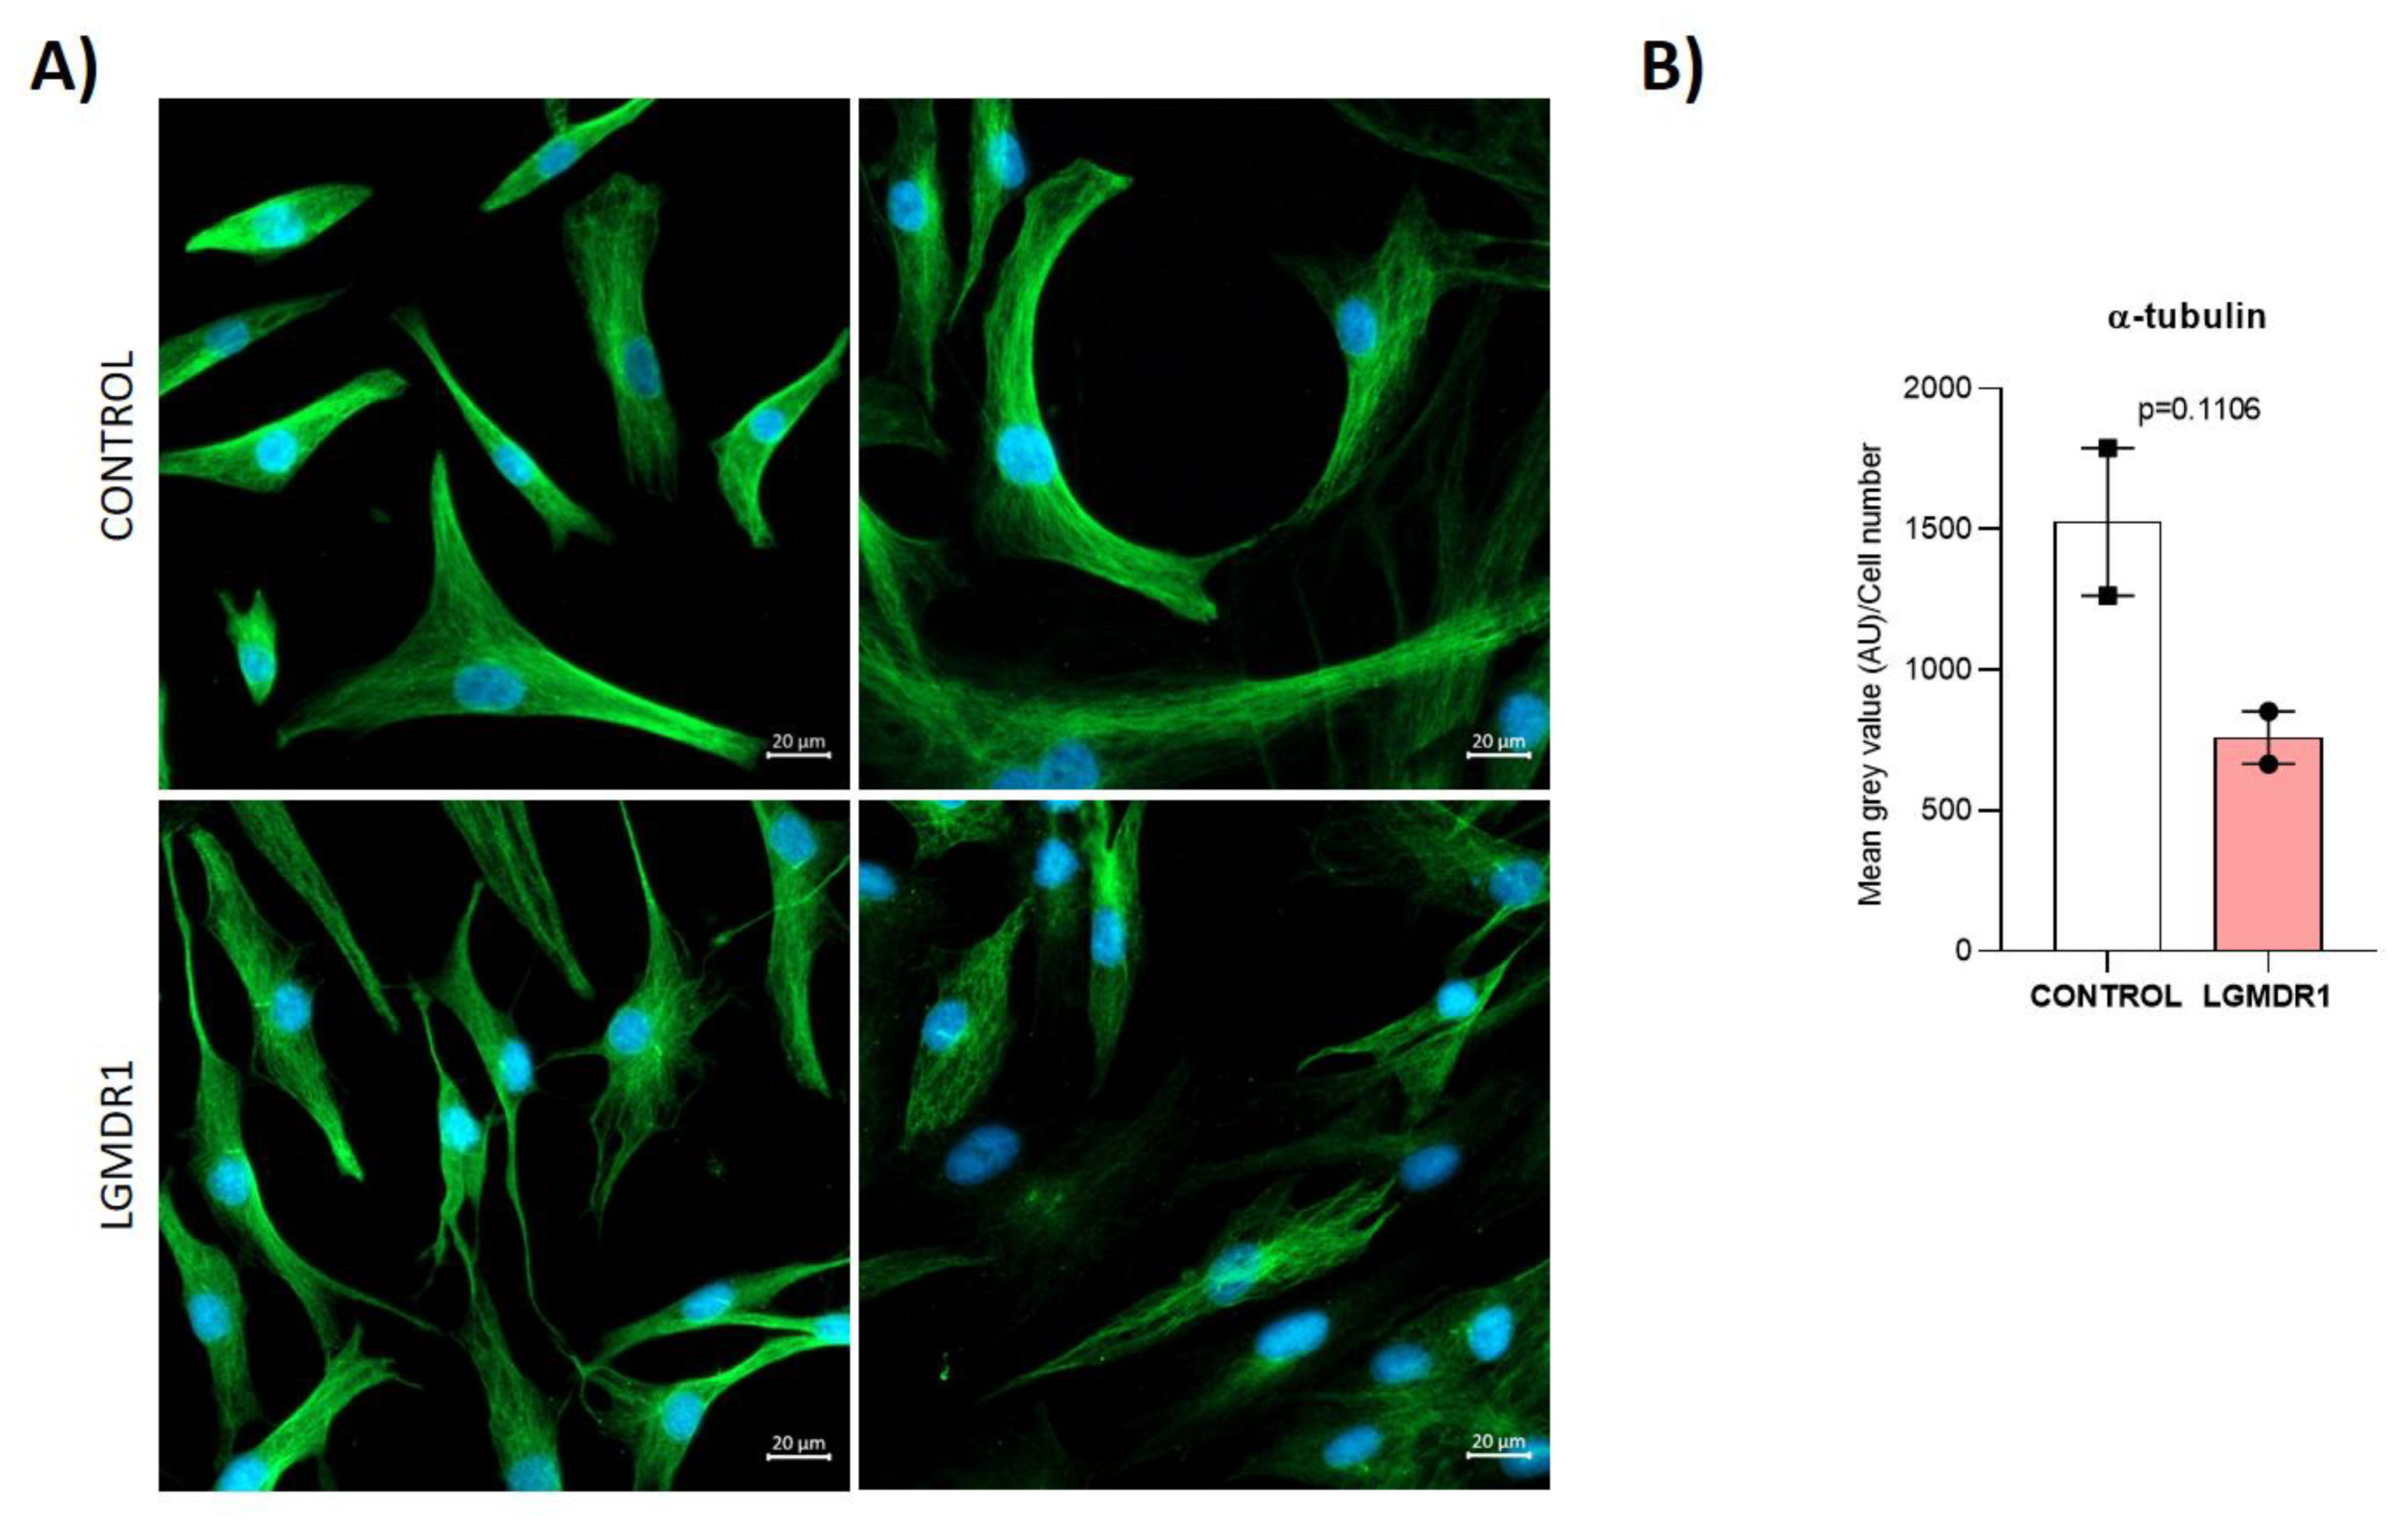
Figure 22.
Impairment of α-tubulin cytoskeleton in LGMDR1 myoblasts. (A) Representative images of disorganized α-tubulin cytoskeleton in LGMDR1 cells. α-tubulin (green), Hoechst (blue). Scale bars: 10 µm. (B) Decreased α-tubulin expression in LGMDR1 myoblasts (3 patients and 2 controls.**p<0.01.
Figure 22.
Impairment of α-tubulin cytoskeleton in LGMDR1 myoblasts. (A) Representative images of disorganized α-tubulin cytoskeleton in LGMDR1 cells. α-tubulin (green), Hoechst (blue). Scale bars: 10 µm. (B) Decreased α-tubulin expression in LGMDR1 myoblasts (3 patients and 2 controls.**p<0.01.
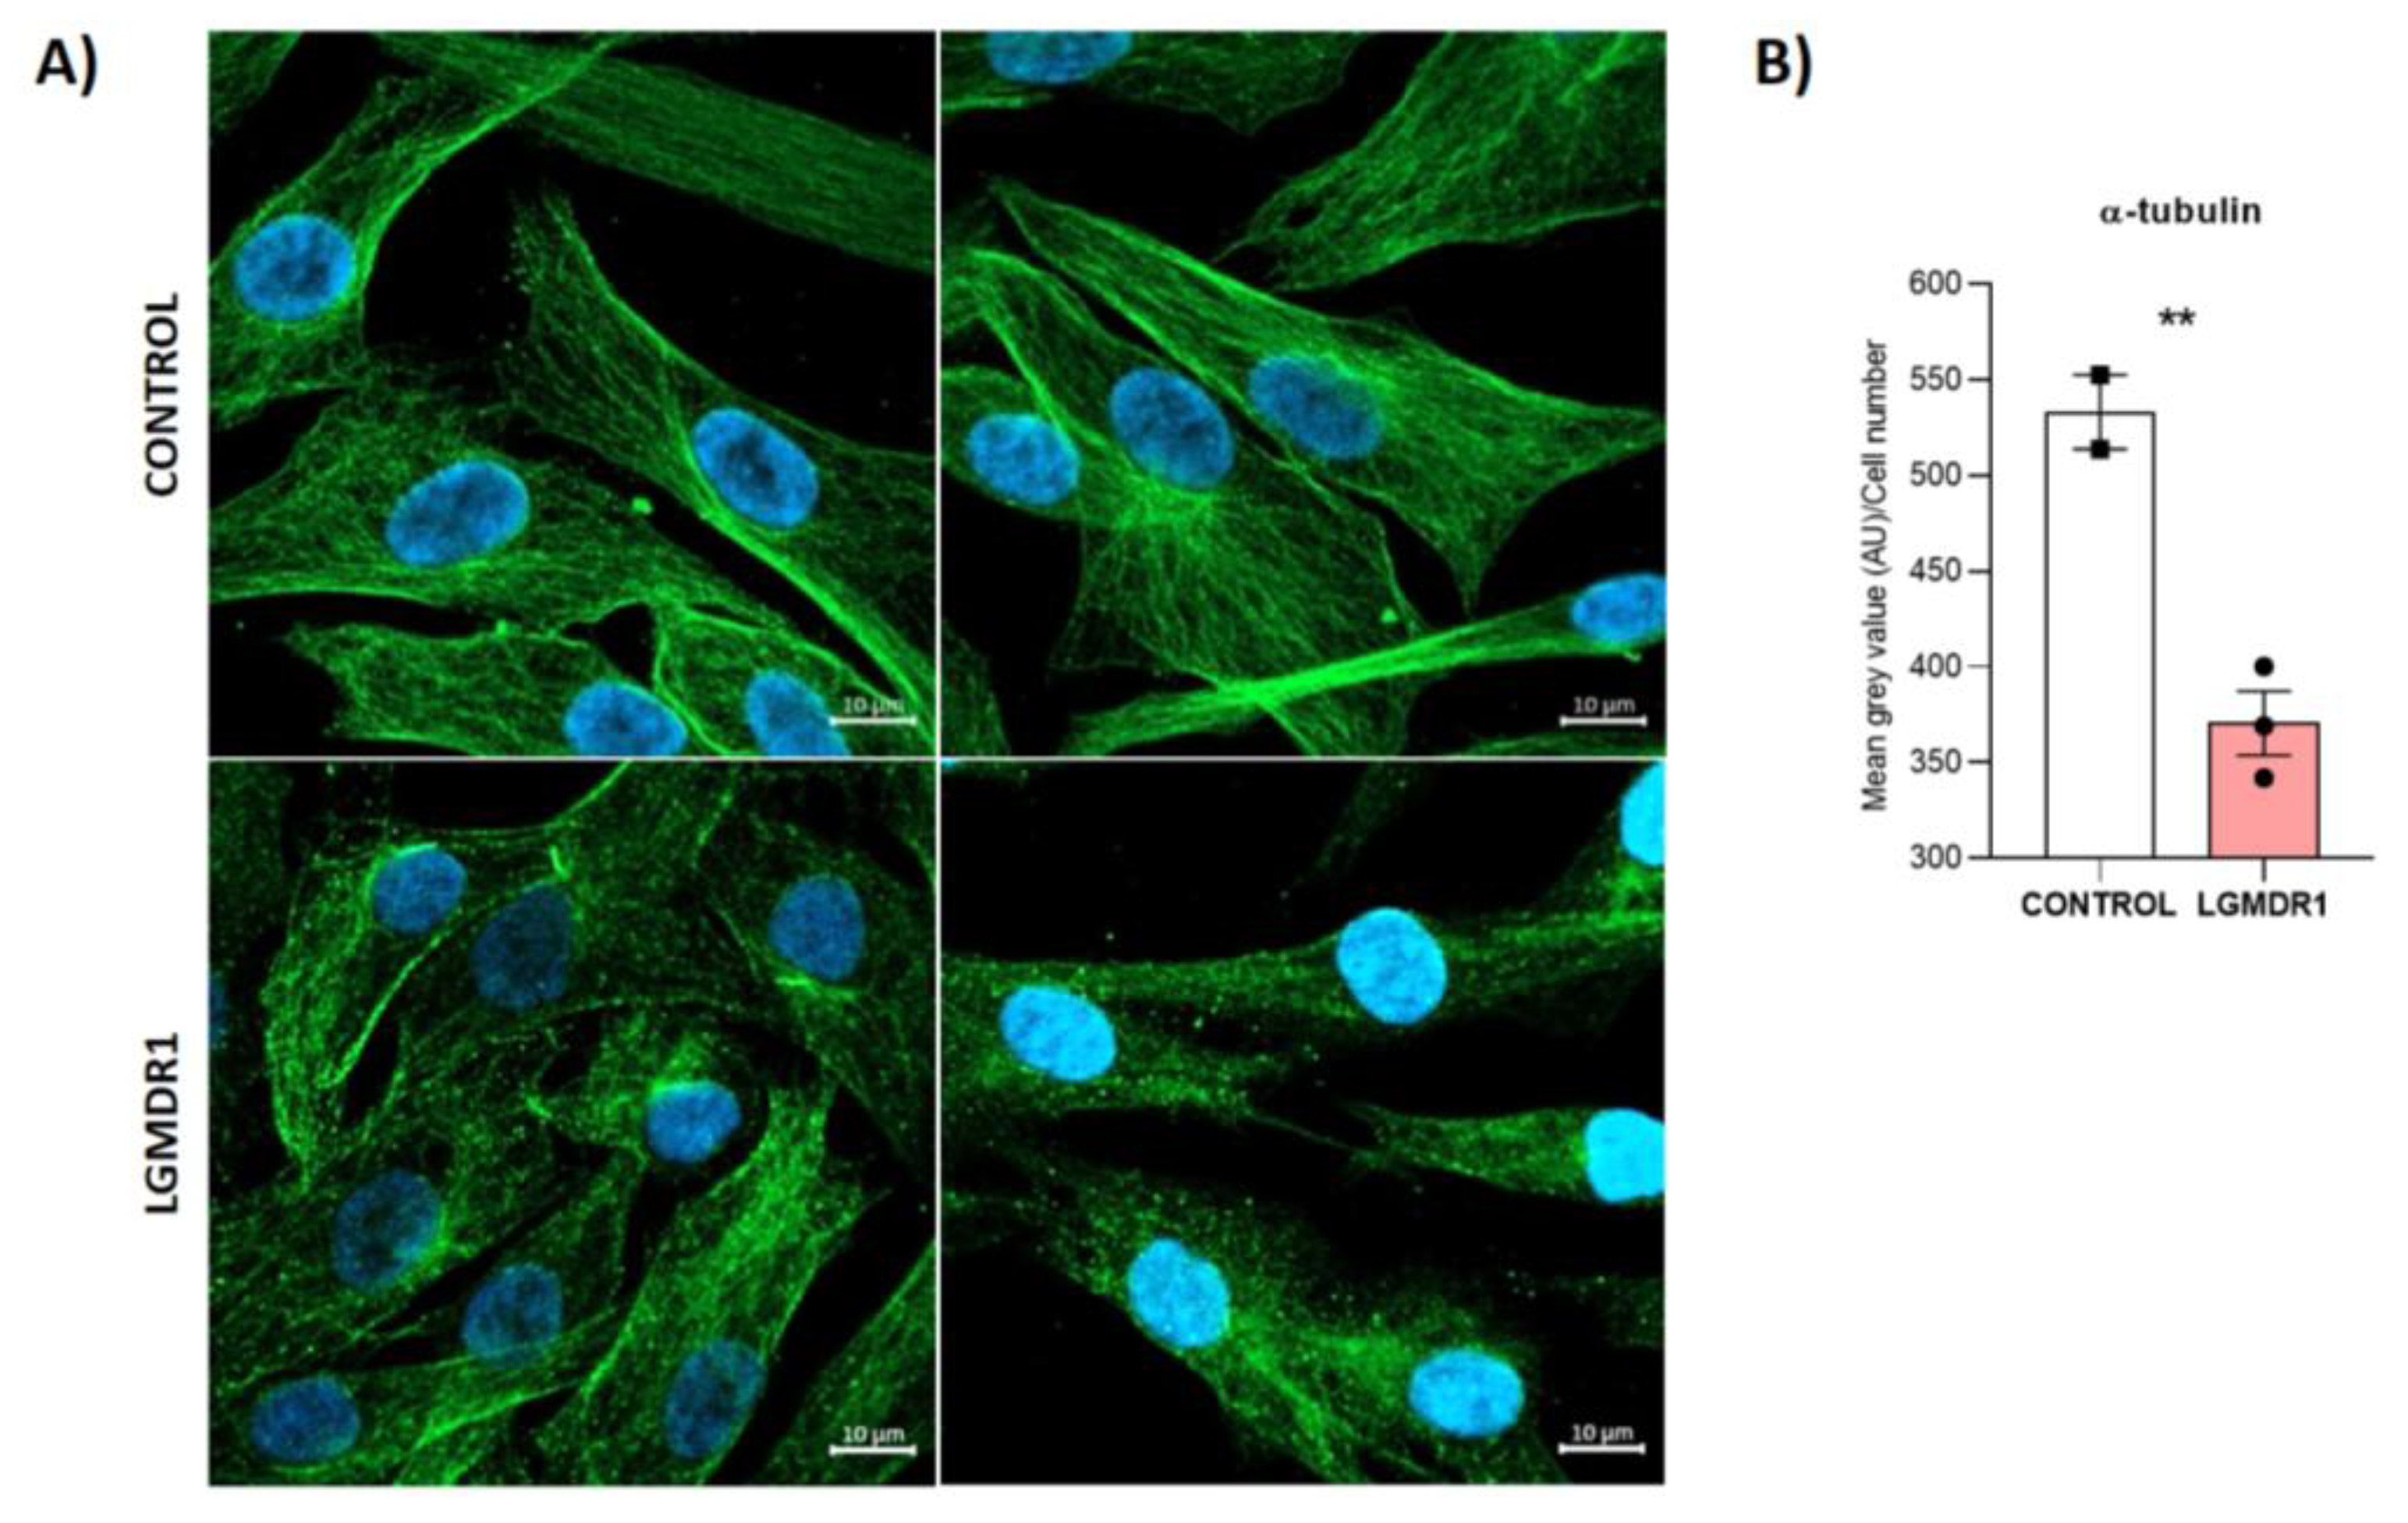
Figure 23.
Misoriented centrosomes in CD56- cells from LGMDR1 patients after WH. (A) Representative images of centrosome orientation. ɣ-tubulin-labelled centrosomes (red), α-tubulin-labelled cytoskeleton (green), Hoechst-labelled nuclei (blue). White arrowheads indicate the direction of CD56- cells based on centrosome position. Punctuated arrow indicate the wounded area. Scale bars: 20 um. (B) Percentage of disoriented centrosomes in CD56- cells after wounded (2 controls and 2 patients). p=0.3114.
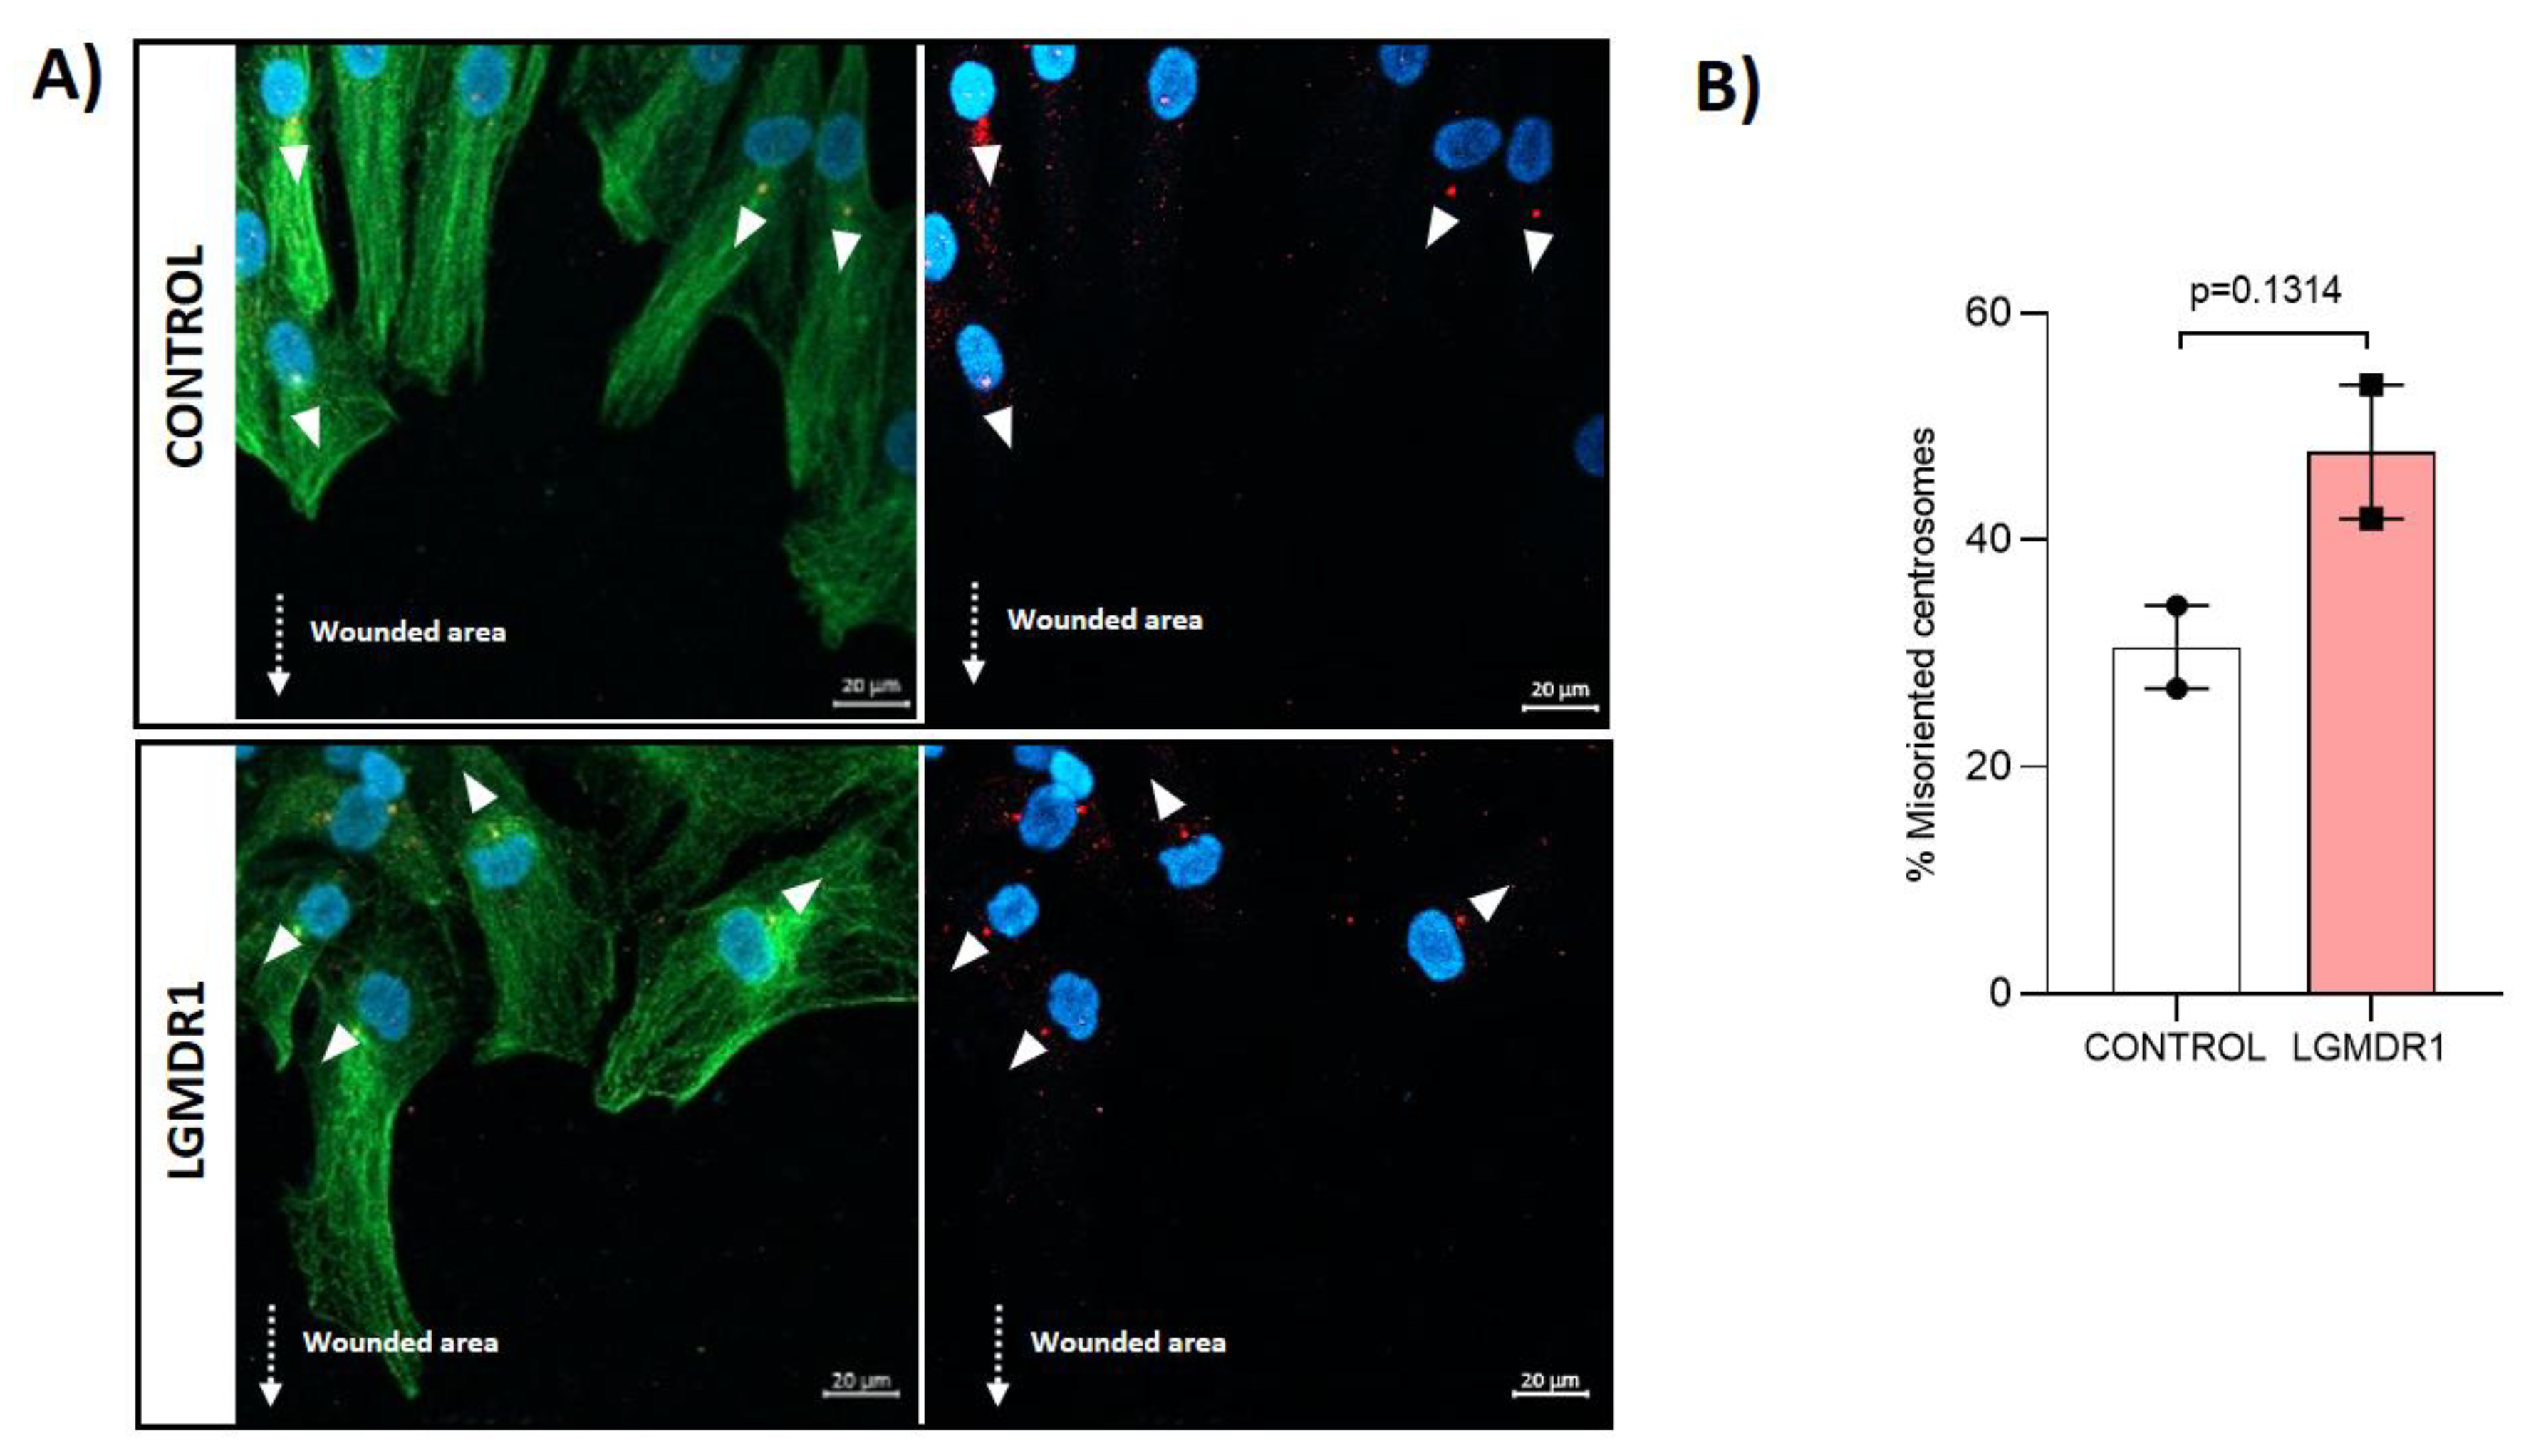
Figure 24.
Confocal microscopy images of mitotic spindle in CD56- cells from healthy control (A) and LGMDR1 (B, C and D) (2 patients and 1 control). Normal mitotic spindle (A), tripolar spindle (B), monopolar spindle (C) and aberrant spindle (D). α-tubulin (green), ɣ-tubulin (red), Hoechst (blue). Scale bars: 10 µm.
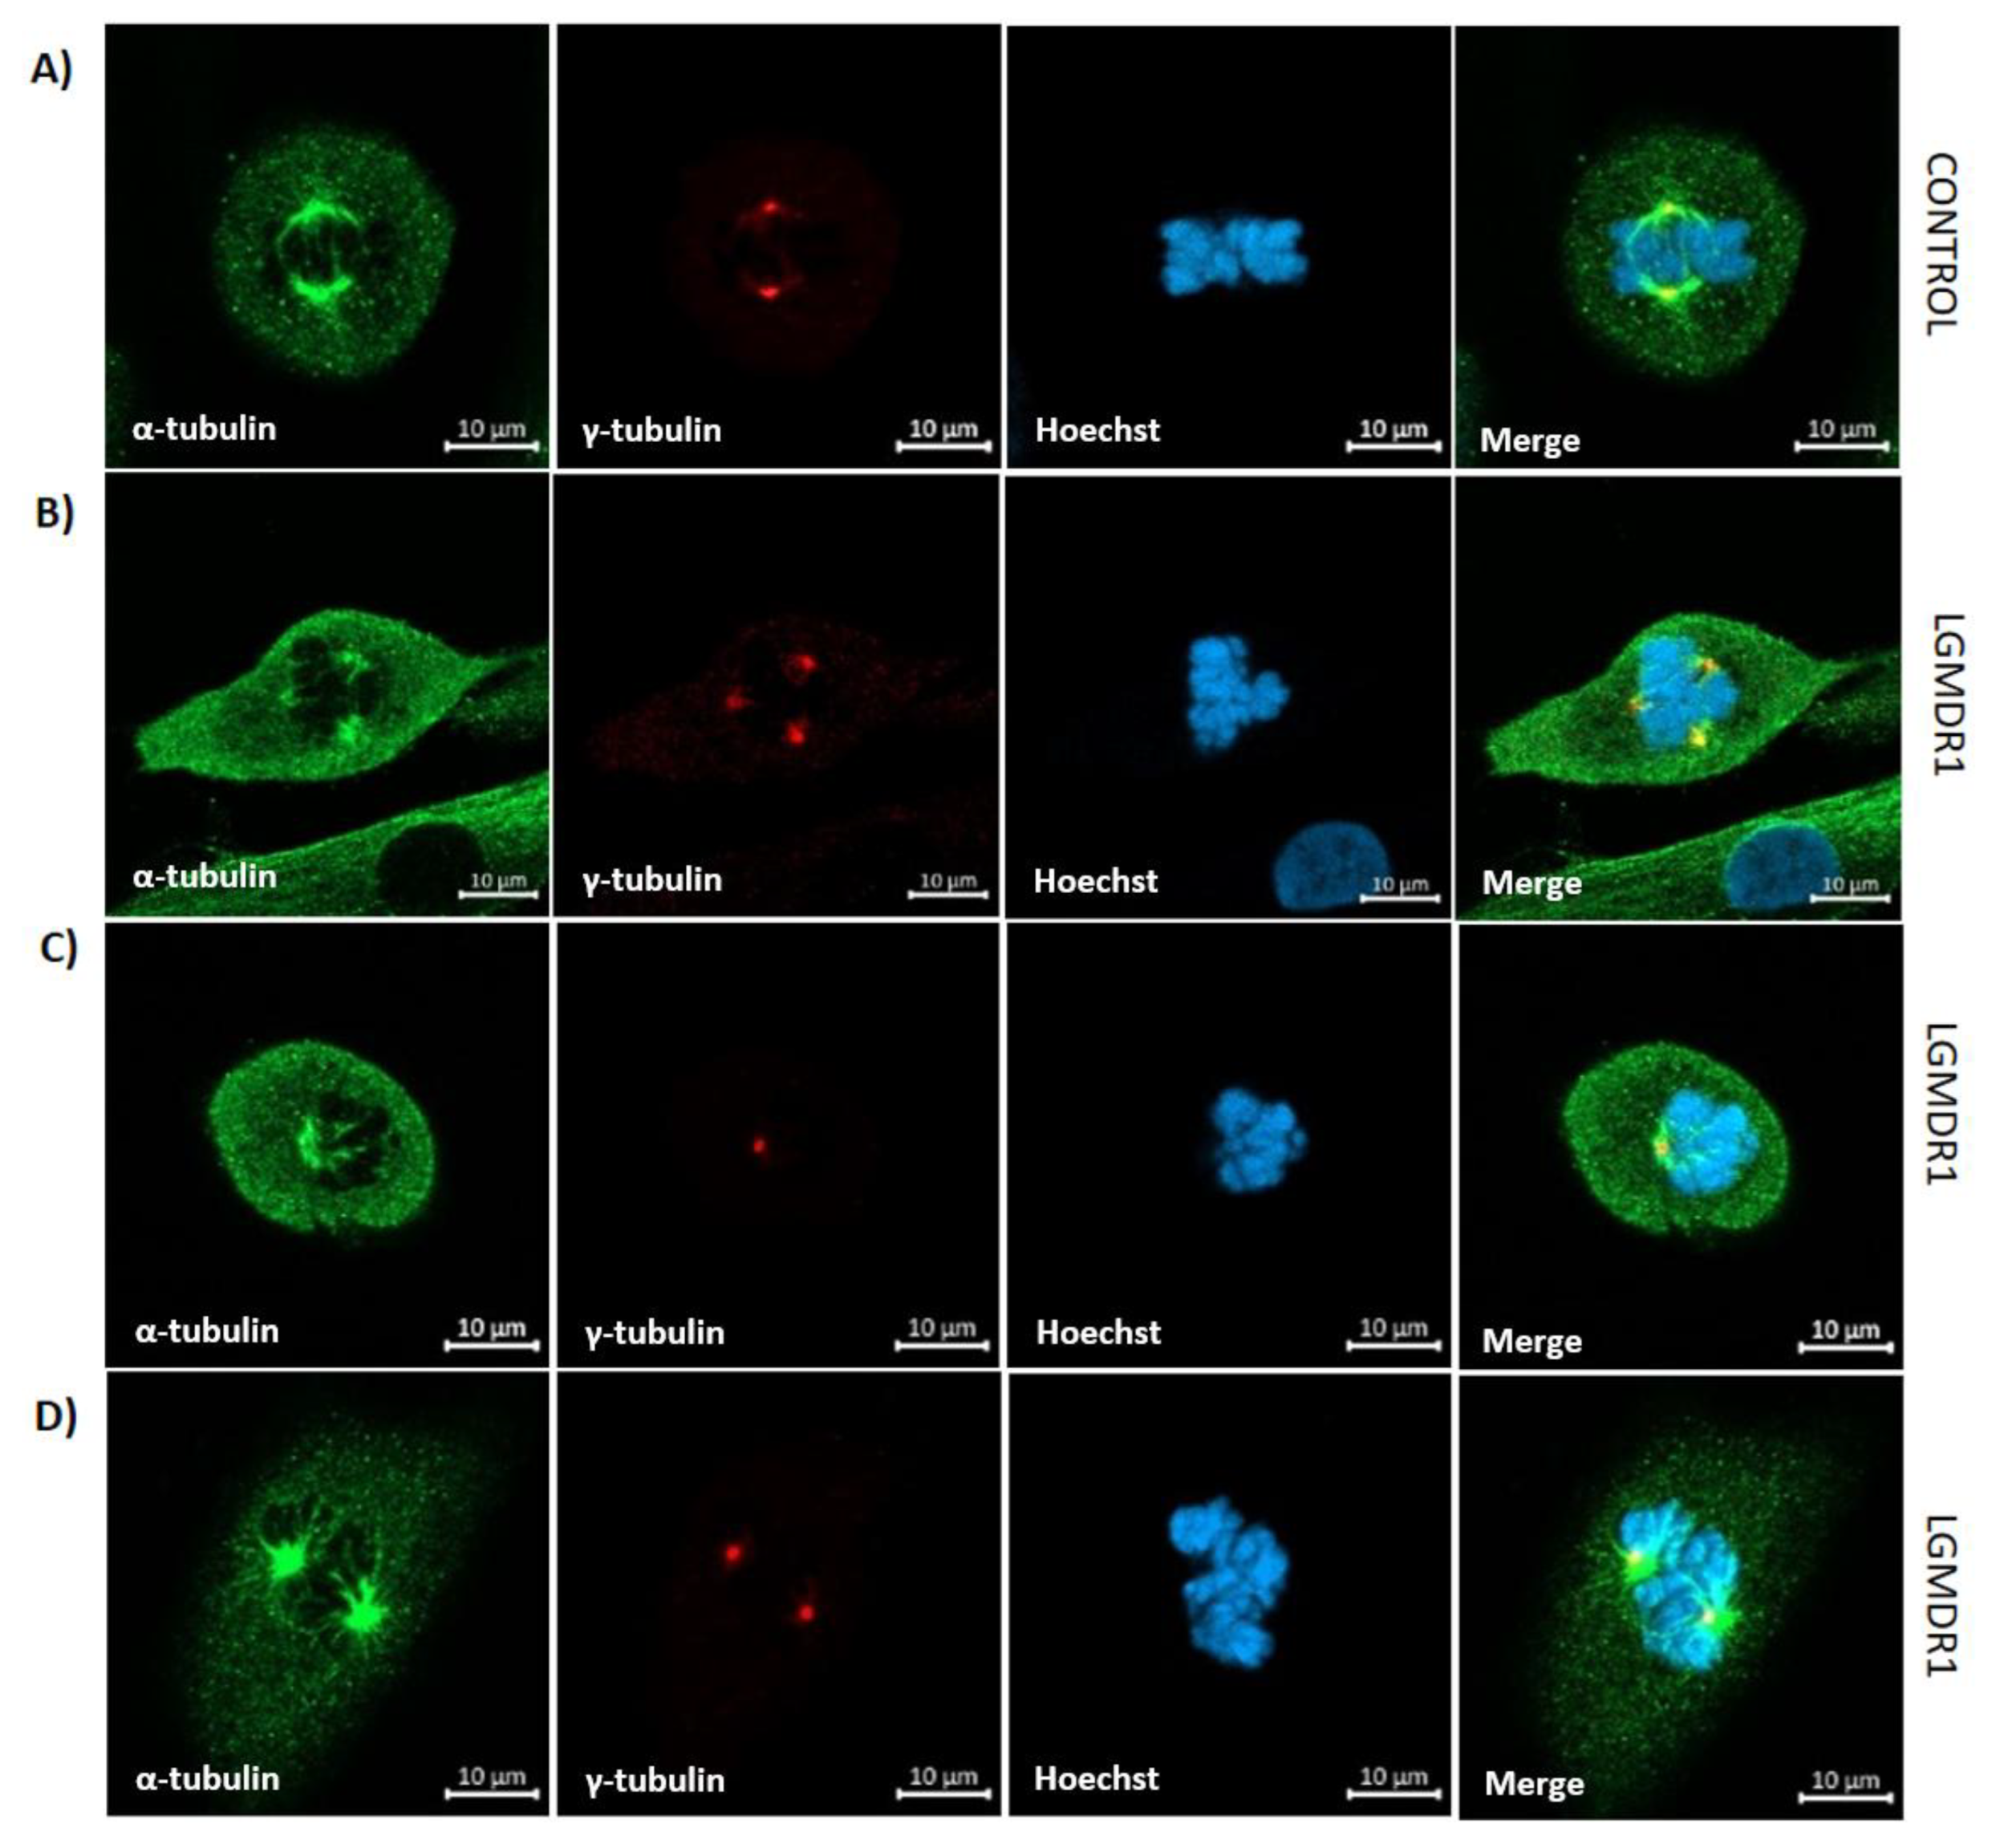
Figure 25.
Analysis of ciliated cells in myoblasts of controls and LGMDR1. (A) Representative images of ciliated cells (white asterisks) in control and LGMDR1 myoblasts. Arl13b (green), ϒ-tubulin (red), Hoechst (blue). Scale bars: 10µm. (B) Ciliated cells quantification in myoblasts (two controls and three LGMDR1 patients). *p<0.1.
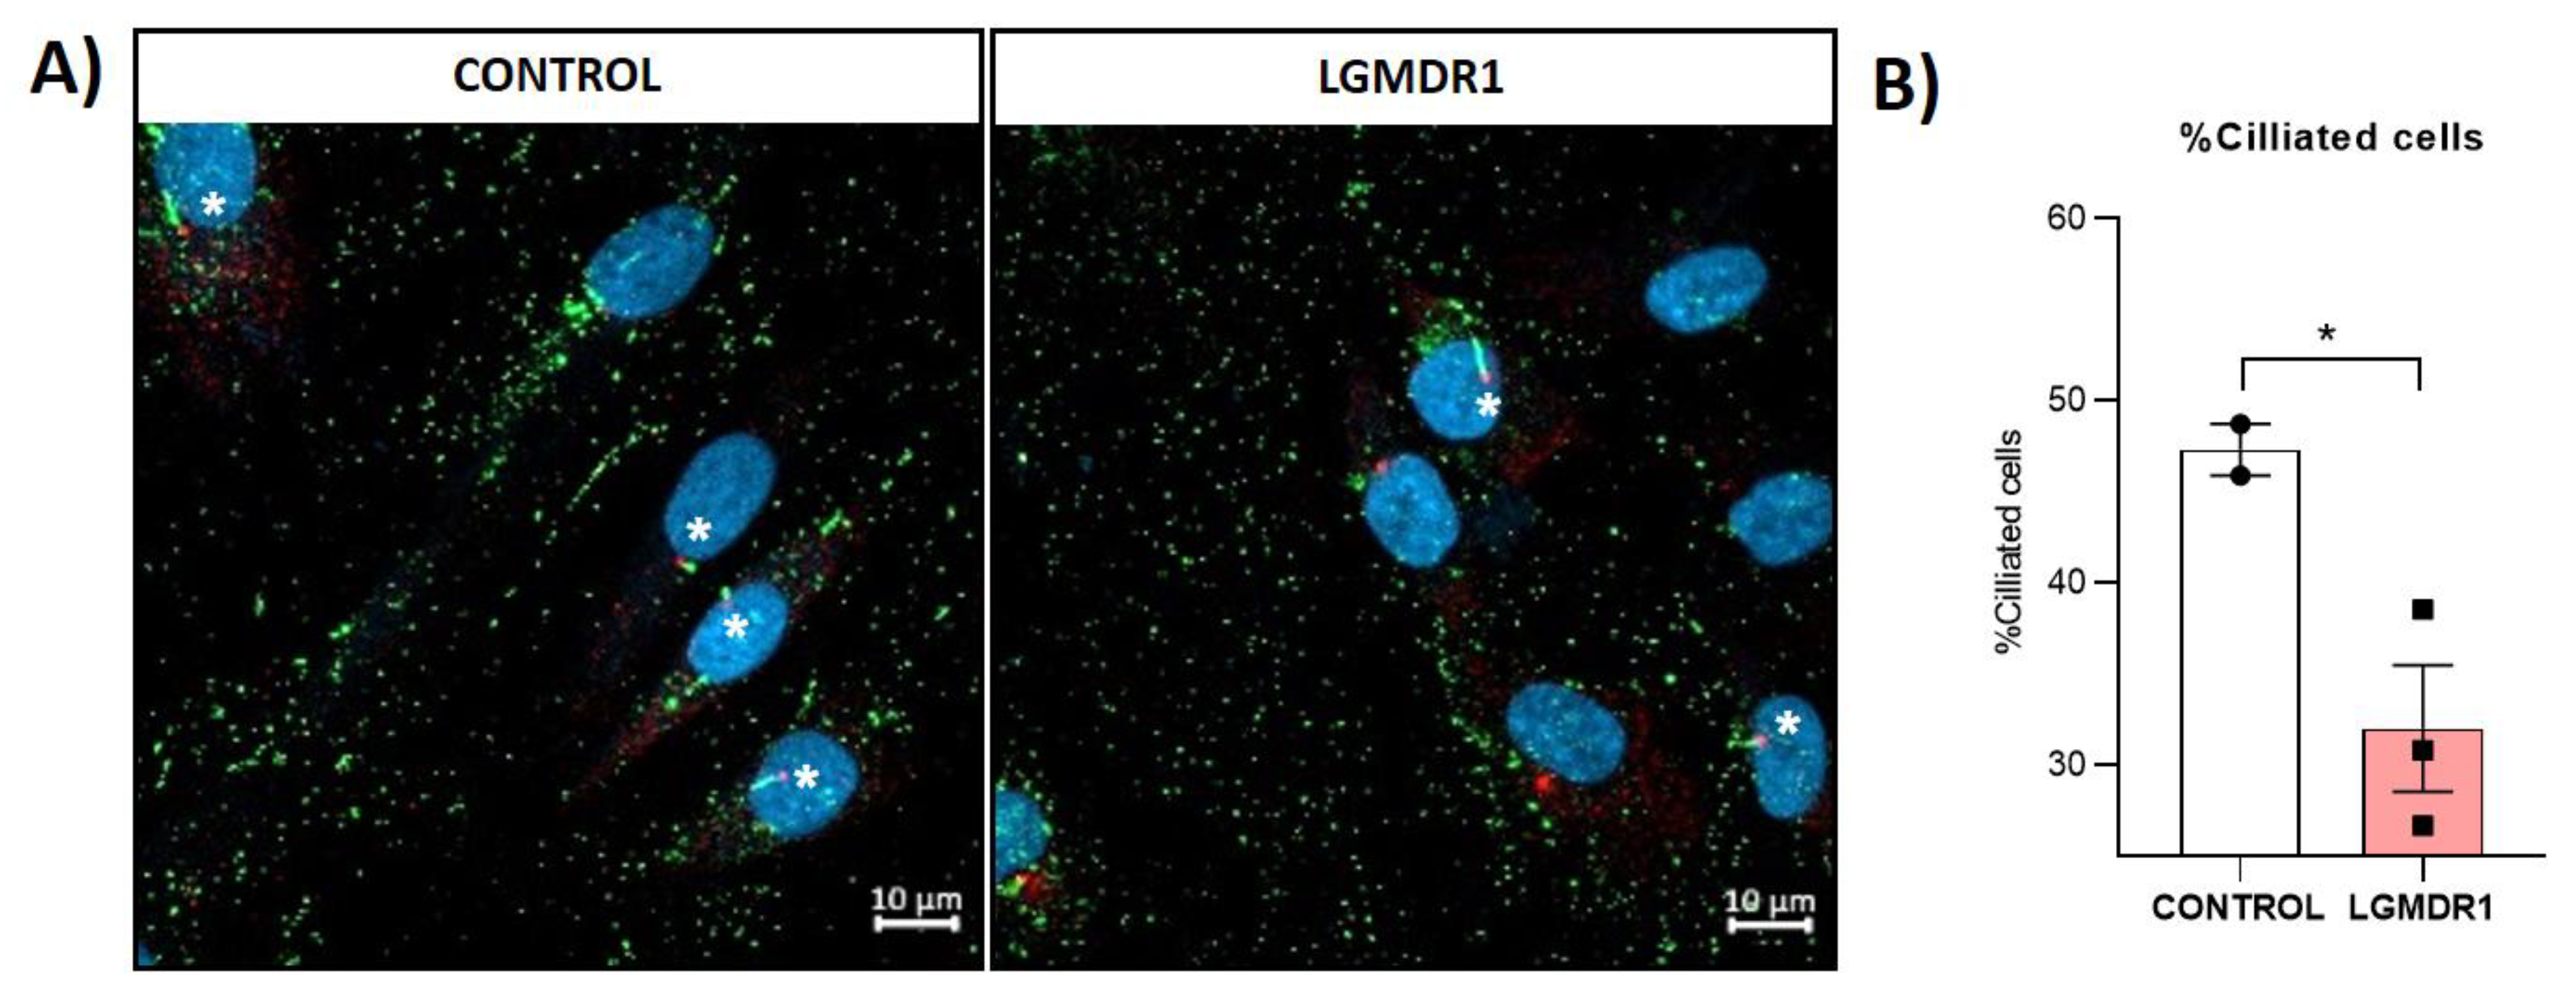

Table 1.
Muscles samples from healthy controls and LGMDR1 patients for immunofluorescence analysis. Age #: Age at biopsy.
Table 1.
Muscles samples from healthy controls and LGMDR1 patients for immunofluorescence analysis. Age #: Age at biopsy.
| Biopsy Number | Gender | Status | Mutation 1 | Mutation 2 | Muscle | Age # | Age at onset | Functional Status |
Clinical information |
|---|---|---|---|---|---|---|---|---|---|
| 22-09 | Male | Control | - | - | Biceps | 47 | - | - | - |
| 22-18 | Male | Control | - | - | Semitendinosus | 24 | - | - | - |
| 17-08051 | Female | Control | - | - | Quadriceps | 46 | - | - | - |
| 23-10 | Male | Control | - | - | Deltoid | 75 | - | - | - |
| 16-6279 | Male | Control | - | - | Quadriceps | 35 | - | - | - |
| 19-22 | Female | LGMDR1 | p.(Arg788Serfs*14) | Complete deletion of CANP3 gene | Biceps | 23 | 23 | Ambulant | Benign |
| 21-07396 | Male | LGMDR1 | p.(Arg490Trp) | p.(Arg490Trp) | Tibialis anterior | 46 | 33 | Ambulant | Mild facial weakness. Proximal weakness. Bilateral scapular winging. Bilateral atrophy of biceps and pectoral muscles. |
| B09-83 | Female |
LGMDR1 |
DelEx2-6 | DelEx2-6 | Quadriceps | 12 | 12 | Ambulant | Proximal weakness. Not able to climb stairs. |
| 18-38110 | Female | LGMDR1 | p.(Arg489Gln) | c.1116-2A>C | Biceps | 47 | Fifth decade | Ambulant | First symptoms were myalgia and fatigue, with persistently elevated CK, X9 (1800 UI/l). No muscle weakness at 52 year old. Unspecific slight changes in the biopsy. |
|
97-168 |
Male | LGMDR1 | p.(Ser479Gly) | c.1992+1G>T | N.A. | 41 | 20 | Ambulant | Muscle weakness of the pelvic and scapular girdles. |
Table 2.
Samples from healthy controls and LGMDR1 patients for cell culture.
| BIOPSY N. | STATUS | MUSCLE | AGE | MUTATION 1 | MUTATION 2 |
|---|---|---|---|---|---|
| 15-12 | CONTROL | Deltoid | 36 | - | - |
| 13-07 | CONTROL | Deltoid | 36 | - | - |
| 13-09 | CONTROL | Vastus lateralis | 37 | - | - |
| 22-18 | CONTROL | Semitendinosus | 24 | - | - |
| 23-10 | CONTROL | Deltoid | 75 | - | - |
| 10-39 | LGMDR1 | Deltoid | 29 | p.(Lys254del) | p.(X822Leuext62X) |
| 09-21 | LGMDR1 | Biceps | 19 | p.(His690Argfs*9) | p.(His690Argfs*9) |
| 09-25 | LGMDR1 | Deltoid | 28 | p.(Lys254Glu) | p.(Pro637HisfsX25) |
| Exp05 | LGMDR1 | Deltoid | 13 | p.(Arg788SersX14) | p.(Arg788SersX14) |
Disclaimer/Publisher’s Note: The statements, opinions and data contained in all publications are solely those of the individual author(s) and contributor(s) and not of MDPI and/or the editor(s). MDPI and/or the editor(s) disclaim responsibility for any injury to people or property resulting from any ideas, methods, instructions or products referred to in the content. |
© 2025 by the authors. Licensee MDPI, Basel, Switzerland. This article is an open access article distributed under the terms and conditions of the Creative Commons Attribution (CC BY) license (http://creativecommons.org/licenses/by/4.0/).
Copyright: This open access article is published under a Creative Commons CC BY 4.0 license, which permit the free download, distribution, and reuse, provided that the author and preprint are cited in any reuse.


