1. Introduction
Energy and in particular renewable energy are a fundamental theme when discussing sustainability, [
1] involving a wide range of topics related to energy sources and processes, as well as systems and components, including production and transformation, energy use and utilization systems, transport and distribution, storage and accumulation, and energy flow management, [
2,
3]. An integrated model of energy systems shifts from a sectoral approach to a comprehensive vision, aiming for optimal resource utilization, which inherently increases the complexity of the challenge, [
4,
5].
In recent years, the significant penetration of renewable energy sources has become a key topic in the energy sector. Renewables, particularly hydropower, wind, and solar photovoltaics, have seen remarkable growth in electricity generation. According to the International Energy Agency (IEA) and IRENA, and other diffused data sources [
6,
7,
8] at least 30% of global electricity is now generated from renewable sources, with even higher penetration levels in some countries. For instance, in Italy, over 40% of electricity comes from renewables such as solar, wind, and hydropower, [
9]. However, this shift towards a renewable-based system introduces increasing complexity, mainly due to the challenges of aligning production with consumption. The variability and intermittency of sources like solar and wind demand innovative and integrated solutions to ensure system stability and reliability, a topic that has been under analysis since the 2010s, particularly in several European countries where the share of renewable energy sources has significantly increased during this period, [
10,
11]. The global transition towards a renewable-driven energy system is a key element in achieving sustainability goals. However, this transition comes with significant technical and economic challenges that require innovation, infrastructure upgrades, and careful planning, [
12,
13]. While many issues are at play, one universally acknowledged as highly significant is forecasting—both of energy final uses and energy production. This topic is particularly critical in the electricity sector, where the complexity of implementing efficient energy storage systems makes accurate forecasting even more essential for maintaining balance and reliability, [
14,
15,
16].
Let us explore these challenges and the critical role forecasting plays in addressing them. One of the primary challenges of renewable energy is its variability. Sources like wind and solar are inherently intermittent, which can lead to instability in the power grid, [
17]. To address this, monitoring systems have advanced in a relevant way: these systems allow us to optimize energy flows within the grid, ensuring efficient use and allocation of resources and energy storage solutions. Technologies like batteries and other storage methods can absorb surplus energy during peak production and release it when demand exceeds supply, maintaining grid balance, [
18].
The growing share of renewable energy demands a significant upgrade of transmission and distribution networks, so the topic of modernizing transmission and distribution infrastructure is a relevant topic of research. Modernization efforts should focus on upgraded transmission devices designed to handle higher energy loads while ensuring reliability and development of Smart Grid Technologies. These enable real-time, two-way communication between consumers and the grid, creating a more dynamic and adaptive energy distribution system, [
19]. As renewable energy increases in the mix, ensuring continuous balance between energy supply and demand becomes increasingly complex. Effective dispatching requires efficient energy technologies to optimize production and reduce inefficiencies and Integrated Control Systems to enhance the management of production, distribution, and consumption to avoid mismatches that could destabilize the grid, [
20]. Considering all the areas of advancements, forecasting continues to be a critical tool in ensuring system efficiency and stability. By leveraging advanced techniques such as machine learning, we can accurately predict energy demand and supply, enabling proactive resource management; anticipating demand patterns ensures optimal production and distribution, improved dispatching and aligning energy availability with consumption reduces the risk of imbalances. Accurate forecasts empower operators to optimize energy flows, plan infrastructure upgrades, and respond effectively to fluctuations in supply and demand. A thorough understanding of energy demand is critical to system efficiency. This allows us to optimize production and distribution: tailoring energy generation to actual needs reduces inefficiencies, avoiding overproduction and resource wastage results in cost savings and environmental benefits. Proactive maintenance and development of resilient systems prevent outages and blackouts.
1.1. State of the Art:
The forecasting of electricity demand has become a critical aspect of grid management, as accurate predictions enable the optimization of operations and support decision-making processes related to energy production and distribution. This not only enhances operational efficiency but also improves the reliability of energy systems.
Based on factors like data availability and system complexity, the problem of the prediction of energy demand can be tackled by different methods including statistical models, machine learning algorithms, and physics-based models.
Traditionally, energy demand forecasting relied on statistical and mathematical models, such as time series analysis and regression techniques, which were effective in identifying patterns in structured data, [
21].
However, with the growing availability of detailed consumption data and the increasing complexity of energy systems, these methods have faced limitations in capturing non-linear relationships and dynamic behaviors, [
22]. The advent of data-driven approaches, fueled by advancements in machine learning, has significantly transformed forecasting methodologies. Machine learning, a subset of artificial intelligence, employs sophisticated statistical techniques to uncover complex patterns in large datasets. Unlike traditional methods, machine learning models can adapt to evolving data trends and account for various factors influencing energy demand, such as weather conditions, economic activities, and consumer behavior, [
23].
Key machine learning techniques applied in energy forecasting include supervised learning models, [
24], deep learning architectures, [
25] and hybrid models, [
26]. Among these, supervised learning models, such as Support Vector Machines (SVMs), Random Forests, and Neural Networks, are widely utilized for demand prediction, leveraging their ability to identify patterns in large datasets. Deep learning architectures, including Recurrent Neural Networks, are particularly notable for their capability to capture temporal dependencies and sequential patterns, making them highly effective in time-series forecasting. Additionally, hybrid models, which integrate machine learning techniques with traditional methods or incorporate domain-specific knowledge, have emerged as a powerful approach to enhance both accuracy and robustness. These hybrid solutions bridge the gap between purely data-driven models and the unique characteristics of energy systems, offering a more comprehensive and reliable framework for forecasting.
Those advanced methods not only improve forecasting precision but also allow for real-time predictions, dynamic grid management, and proactive decision-making. As energy systems continue to evolve towards greater complexity and renewable integration, the role of machine learning in forecasting will become increasingly vital for achieving sustainable and resilient energy management.
Concerning energy demand forecasting, the more relevant applications rely on a combination of traditional mathematical approaches and advanced machine learning techniques. Traditional methods like regression models and time-series analysis (e.g., ARIMA) remain useful for capturing seasonal trends and cyclical patterns.
In energy demand forecasting, traditional approaches like regression models and time-series analysis (e.g., ARIMA) remain useful for capturing seasonal trends. However, the increasing availability of large, complex datasets has accelerated the adoption of machine learning techniques, which better capture non-linear relationships and temporal dependencies. Deep learning models, such as Long Short-Term Memory (LSTM) networks and Gated Recurrent Units (GRUs), are particularly effective for time-series forecasting, while hybrid approaches integrate these methods with classical techniques for greater accuracy. Despite advancements, challenges persist. Data quality and integration across diverse sources (e.g., weather and socioeconomic factors) remain complex, and models struggle to adapt to abrupt changes like extreme weather or economic shifts. Addressing these challenges is key to enhancing forecasting capabilities and supporting the transition to a more resilient, renewable-driven energy system.
1.2. Objectives of the Study:
The objective of this paper is to contribute to the ongoing research on energy demand forecasting by applying advanced machine learning techniques. In this context, our goal is to investigate the adaptability of a forecasting algorithm to a well-defined dataset.
Although this topic has been extensively studied and numerous contributions exist in literature, navigating this wealth of knowledge and effectively implementing the various methods remains a challenging task. Forecasting errors are still significant, particularly in critical and unpredictable situations, highlighting the need for more robust and adaptable approaches.
We apply our approach to a large and realistic dataset: the electricity demand in Italy. This choice ensures that our study is not only theoretically relevant but also practically meaningful, as electricity demand is a complex and dynamic variable with significant real-world implications.
In this study, we focus on testing the performance of Recurrent Neural Network models through numerical experiments, given their promising capabilities in handling sequential data. Recurrent Neural Networks form a class of artificial neural networks where the connections between nodes can create a cycle, where the output from some nodes affects subsequent input to the same nodes. Unlike traditional neural networks, RNNs can retain past information through "loop" mechanisms that allow information to be passed from one step of the network to the next. This makes them particularly suited for time-series forecasting. Specifically, we implemented the Long Short-Term Memory (LSTM) model, a type of RNN designed to capture both short- and long-term dependencies in sequential data.
Using electricity demand data provided by Terna - Rete Elettrica Nazionale S.p.A., Italy's national electricity transmission network operator, we aimed to evaluate the model’s effectiveness in addressing the complexities of energy demand forecasting. By grounding our study in a real-world system, we sought to provide actionable insights and advance the practical applicability of machine learning techniques in energy forecasting.
2. Background and Statement of the Problem
In recent years, driven by the increasing implementation of sustainability and climate change policies, renewable energy sources have gained significant traction in power systems. This shift has been particularly evident in many European countries, where the traditional model of centralized power generation has gradually evolved into a distributed generation system.
The need to efficiently generate and utilize energy, especially in the context of high renewable penetration, has brought forecasting to the forefront of energy management. In this regard, the Italian energy system presents a valuable platform for testing forecasting algorithms, given its dynamic and evolving nature.
The Italian energy system, like many others, has undergone a rapid transformation in recent years, shifting from a centralized structure with a few large power plants to a decentralized system comprising millions of small-scale generation units, driven primarily by the growth of renewable energy sources. The challenge of managing energy flows, which has been recognized for some time, has become significantly more complex in recent years. At the end of 2023, Italy had more than 1,500,000 million of plants in operation, the major number are photovoltaic (PV) plants in operation, with a total installed capacity of 30,319 MW, [
27]. The installed capacity for different renewable energy sources was distributed as follows:
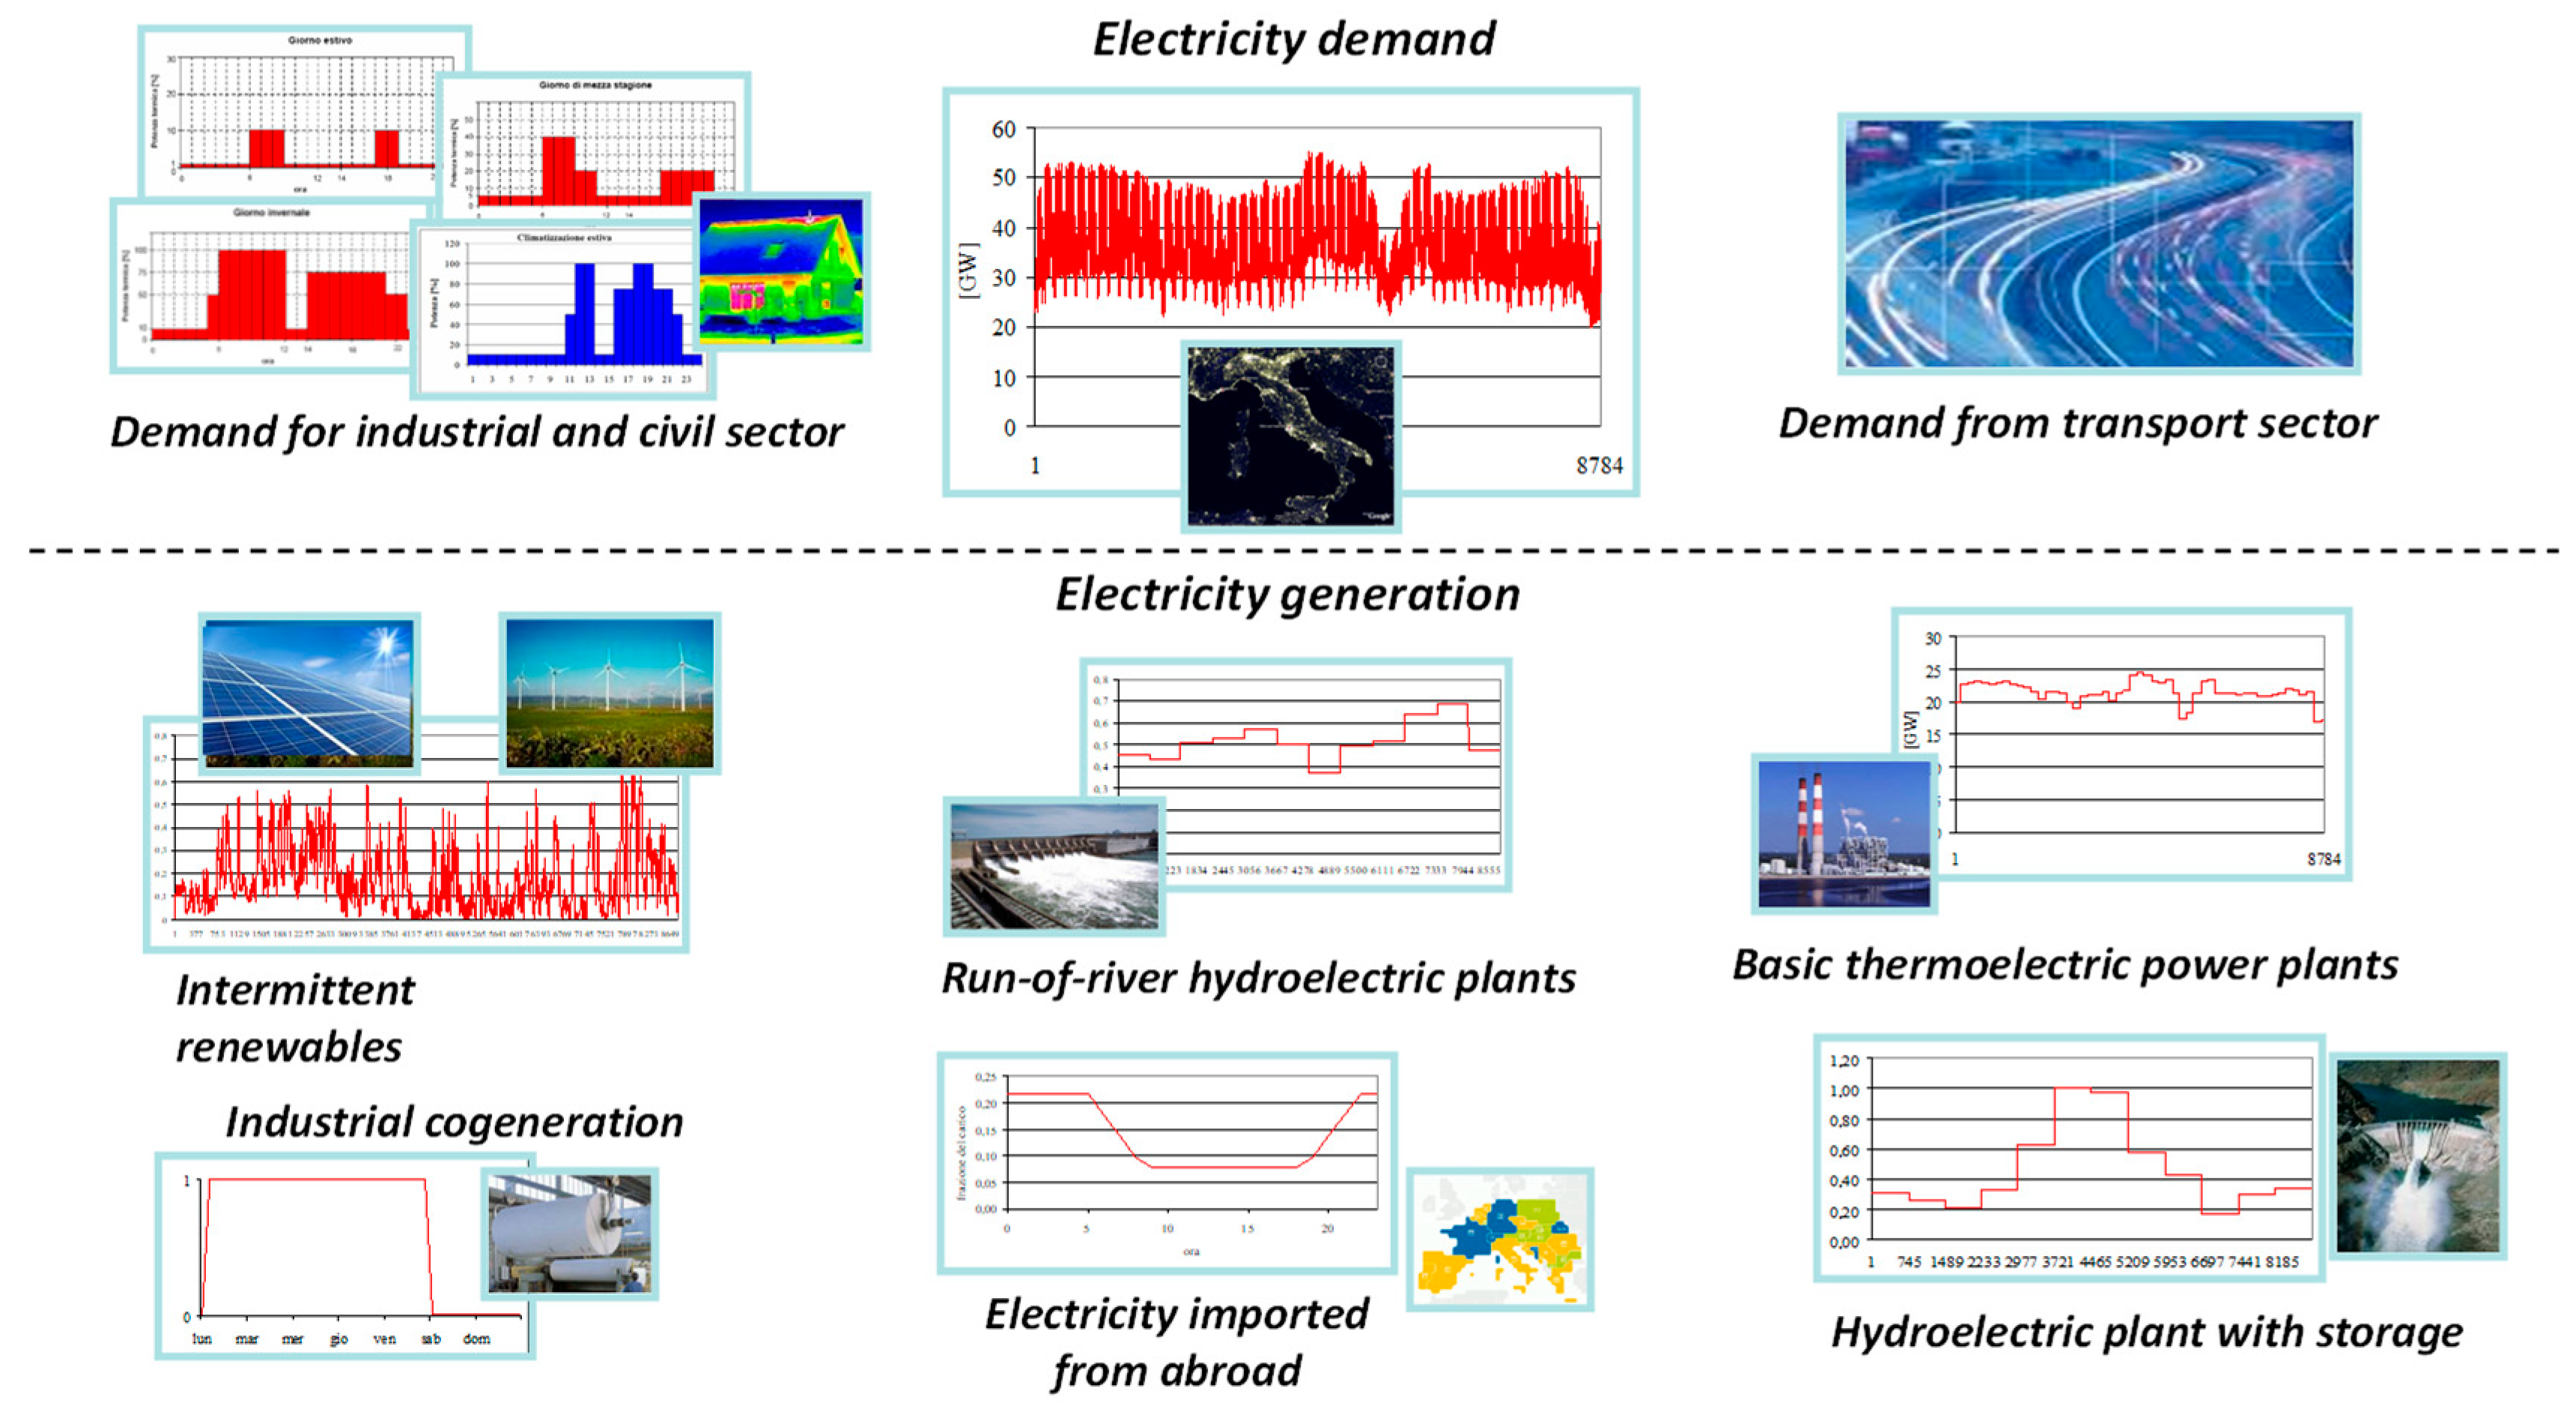
The power demand pattern is schematically illustrated in
Figure 1, that provides a visual representation of the growing complexity in managing the energy system.
This complexity stems from the coexistence of millions of power generation facilities with highly diverse production profiles, the import of energy from abroad—primarily concentrated during nighttime hours—and the need to meet the energy demand of millions of users with varying consumption patterns.
Figure 1 highlights the dynamic interplay between production, imports, and consumption within the system.
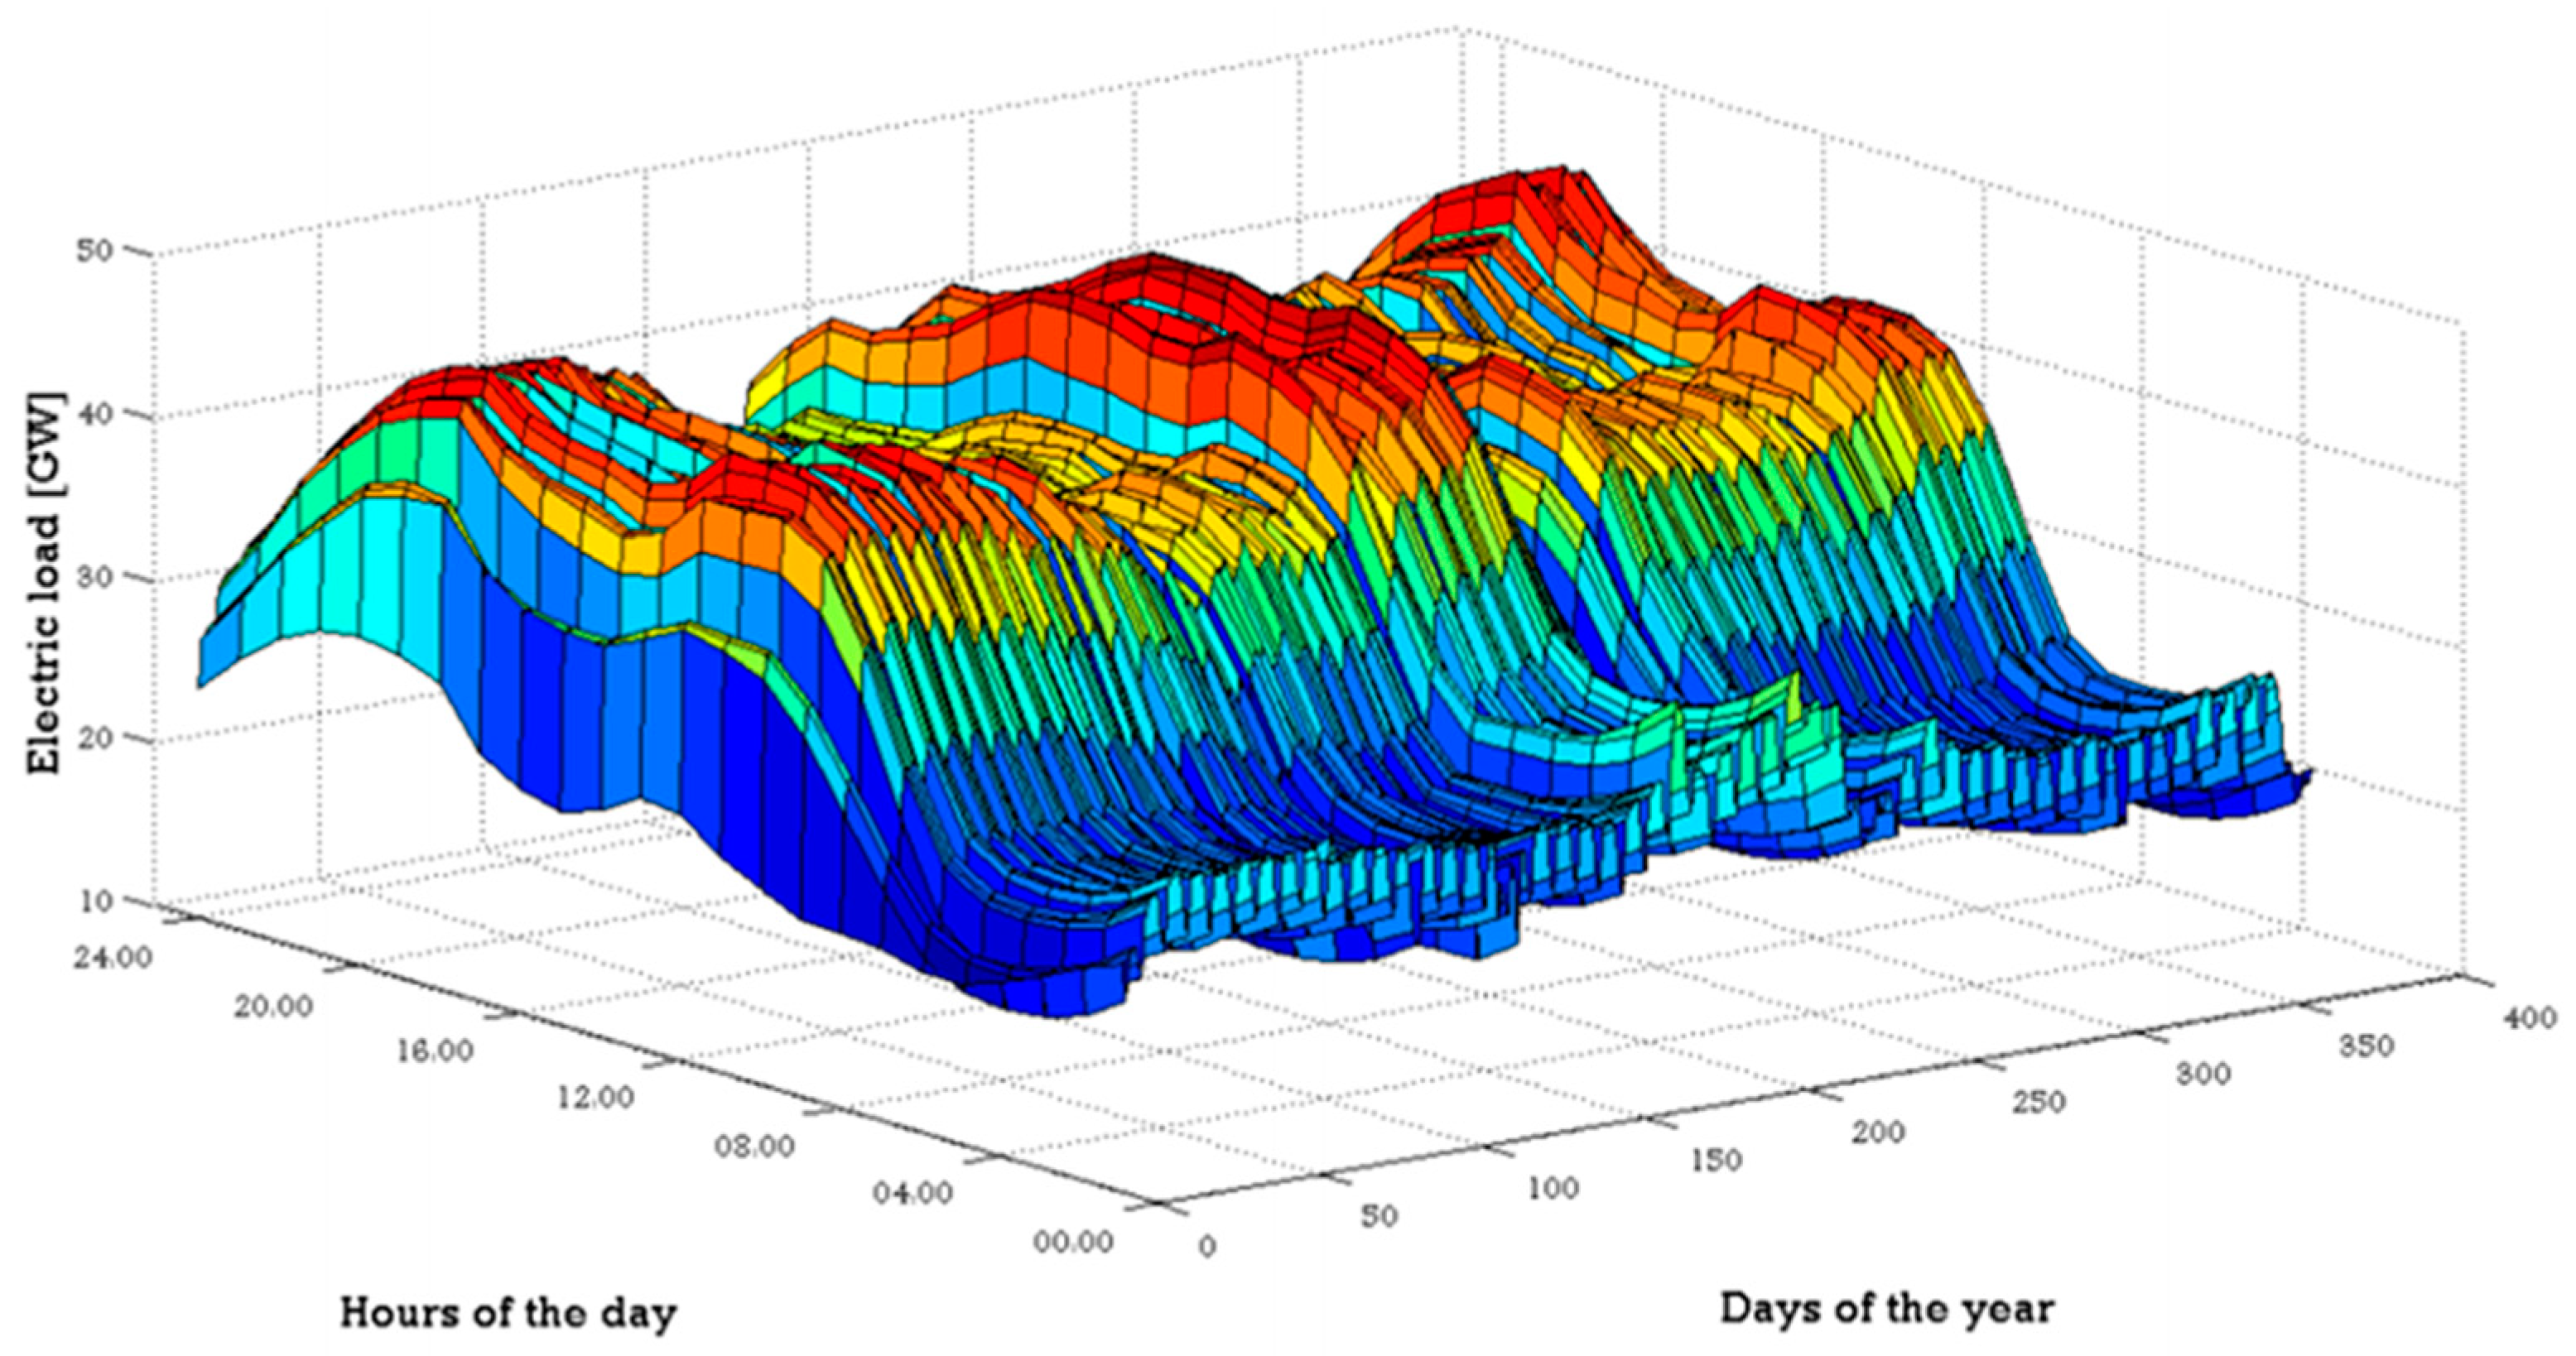
The analysis of electricity usage data in Italy reveals a somewhat unique trend, characterized in recent years by peaks in energy demand during the summer season.
Figure 2 illustrates a typical pattern of electricity consumption, highlighting both the hours of the day and the days of the week. In contrast,
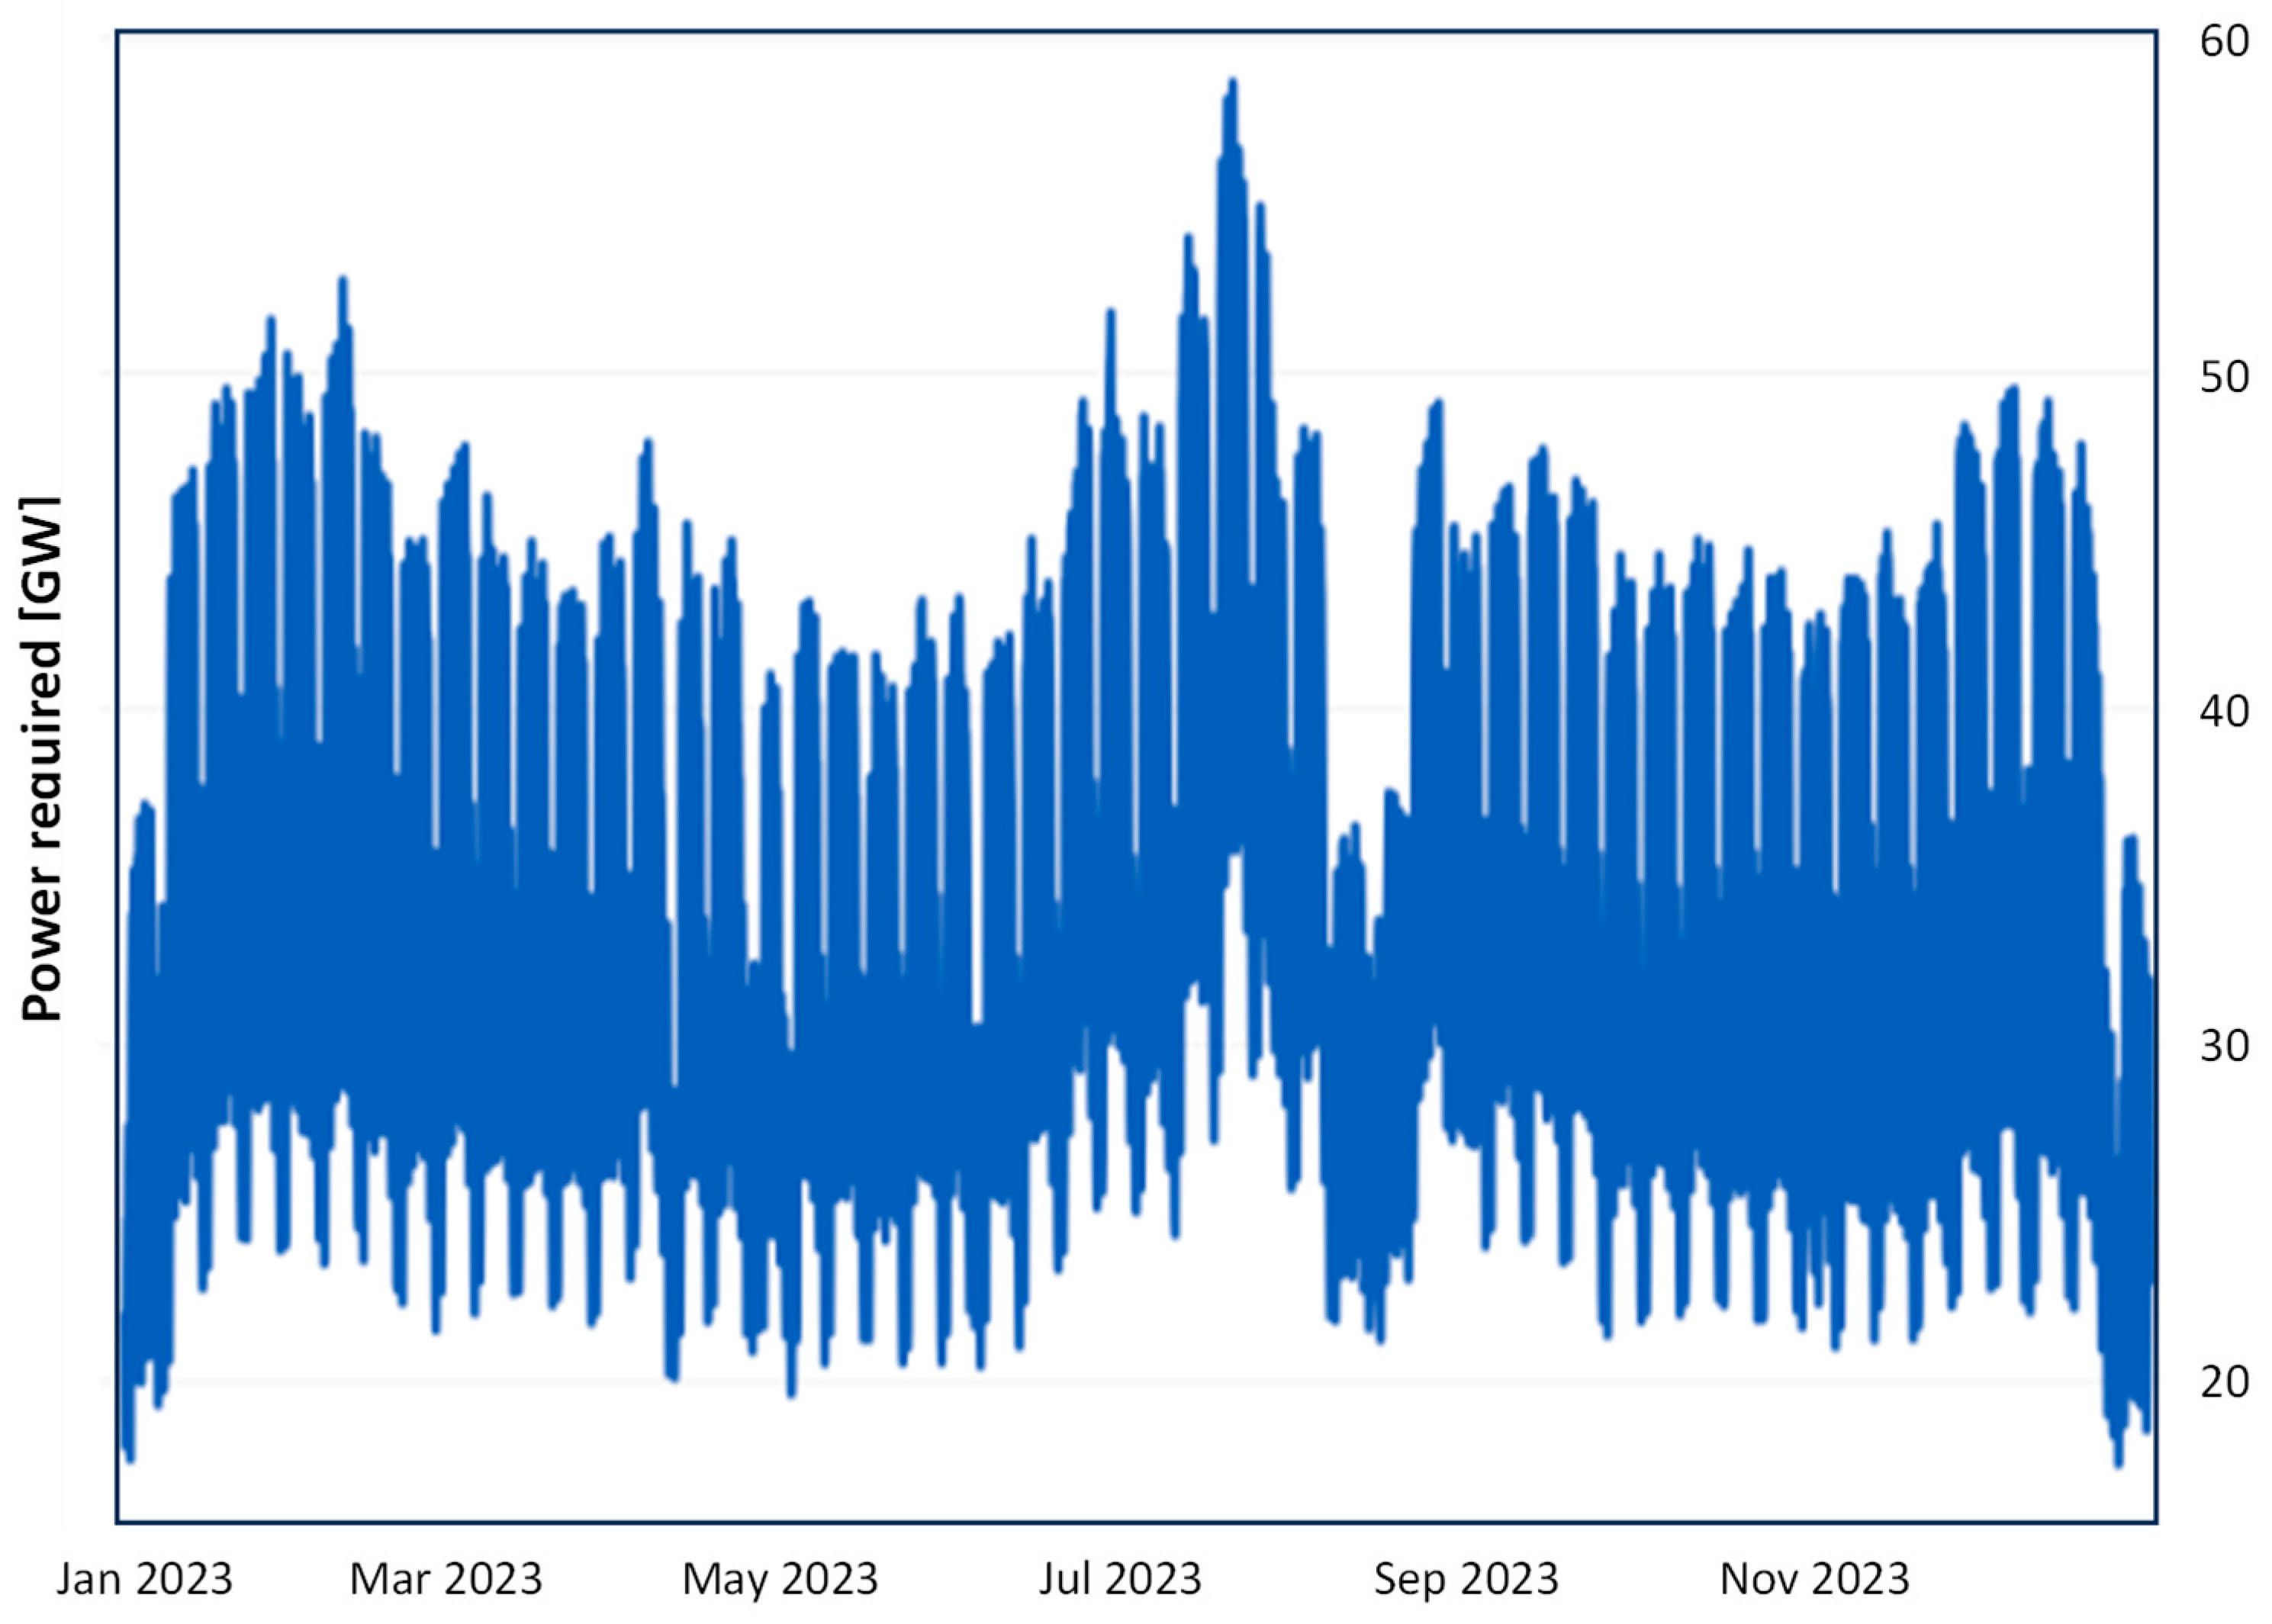
Figure 3, which refers to data from 2023, provides a clearer representation of minimum and maximum values. As can be observed, all the curves exhibit distinct behaviors, with no exact repetitions, reflecting the inherent variability of modern energy systems. This non-repeating nature is now a common feature across all complex energy systems, driven by diverse factors such as changing consumption patterns, integration of renewable sources, and the increasing role of distributed generation. All the data are derived from the national operator Terna’s portal [
28,
29].
As shown in the figure, the range of demand in Italy for 2023 varied from a minimum value around 20 GW to almost 60 GW per hour. Franco et al. have previously analyzed in [
30] the relationship between electricity demand and several key variables, such as weekdays (including working days, pre-holidays, and holidays), as well as seasonal patterns. This wide fluctuation underscores the challenges in balancing supply and demand, highlighting the need for reliable forecasting to maintain grid stability and efficiency.
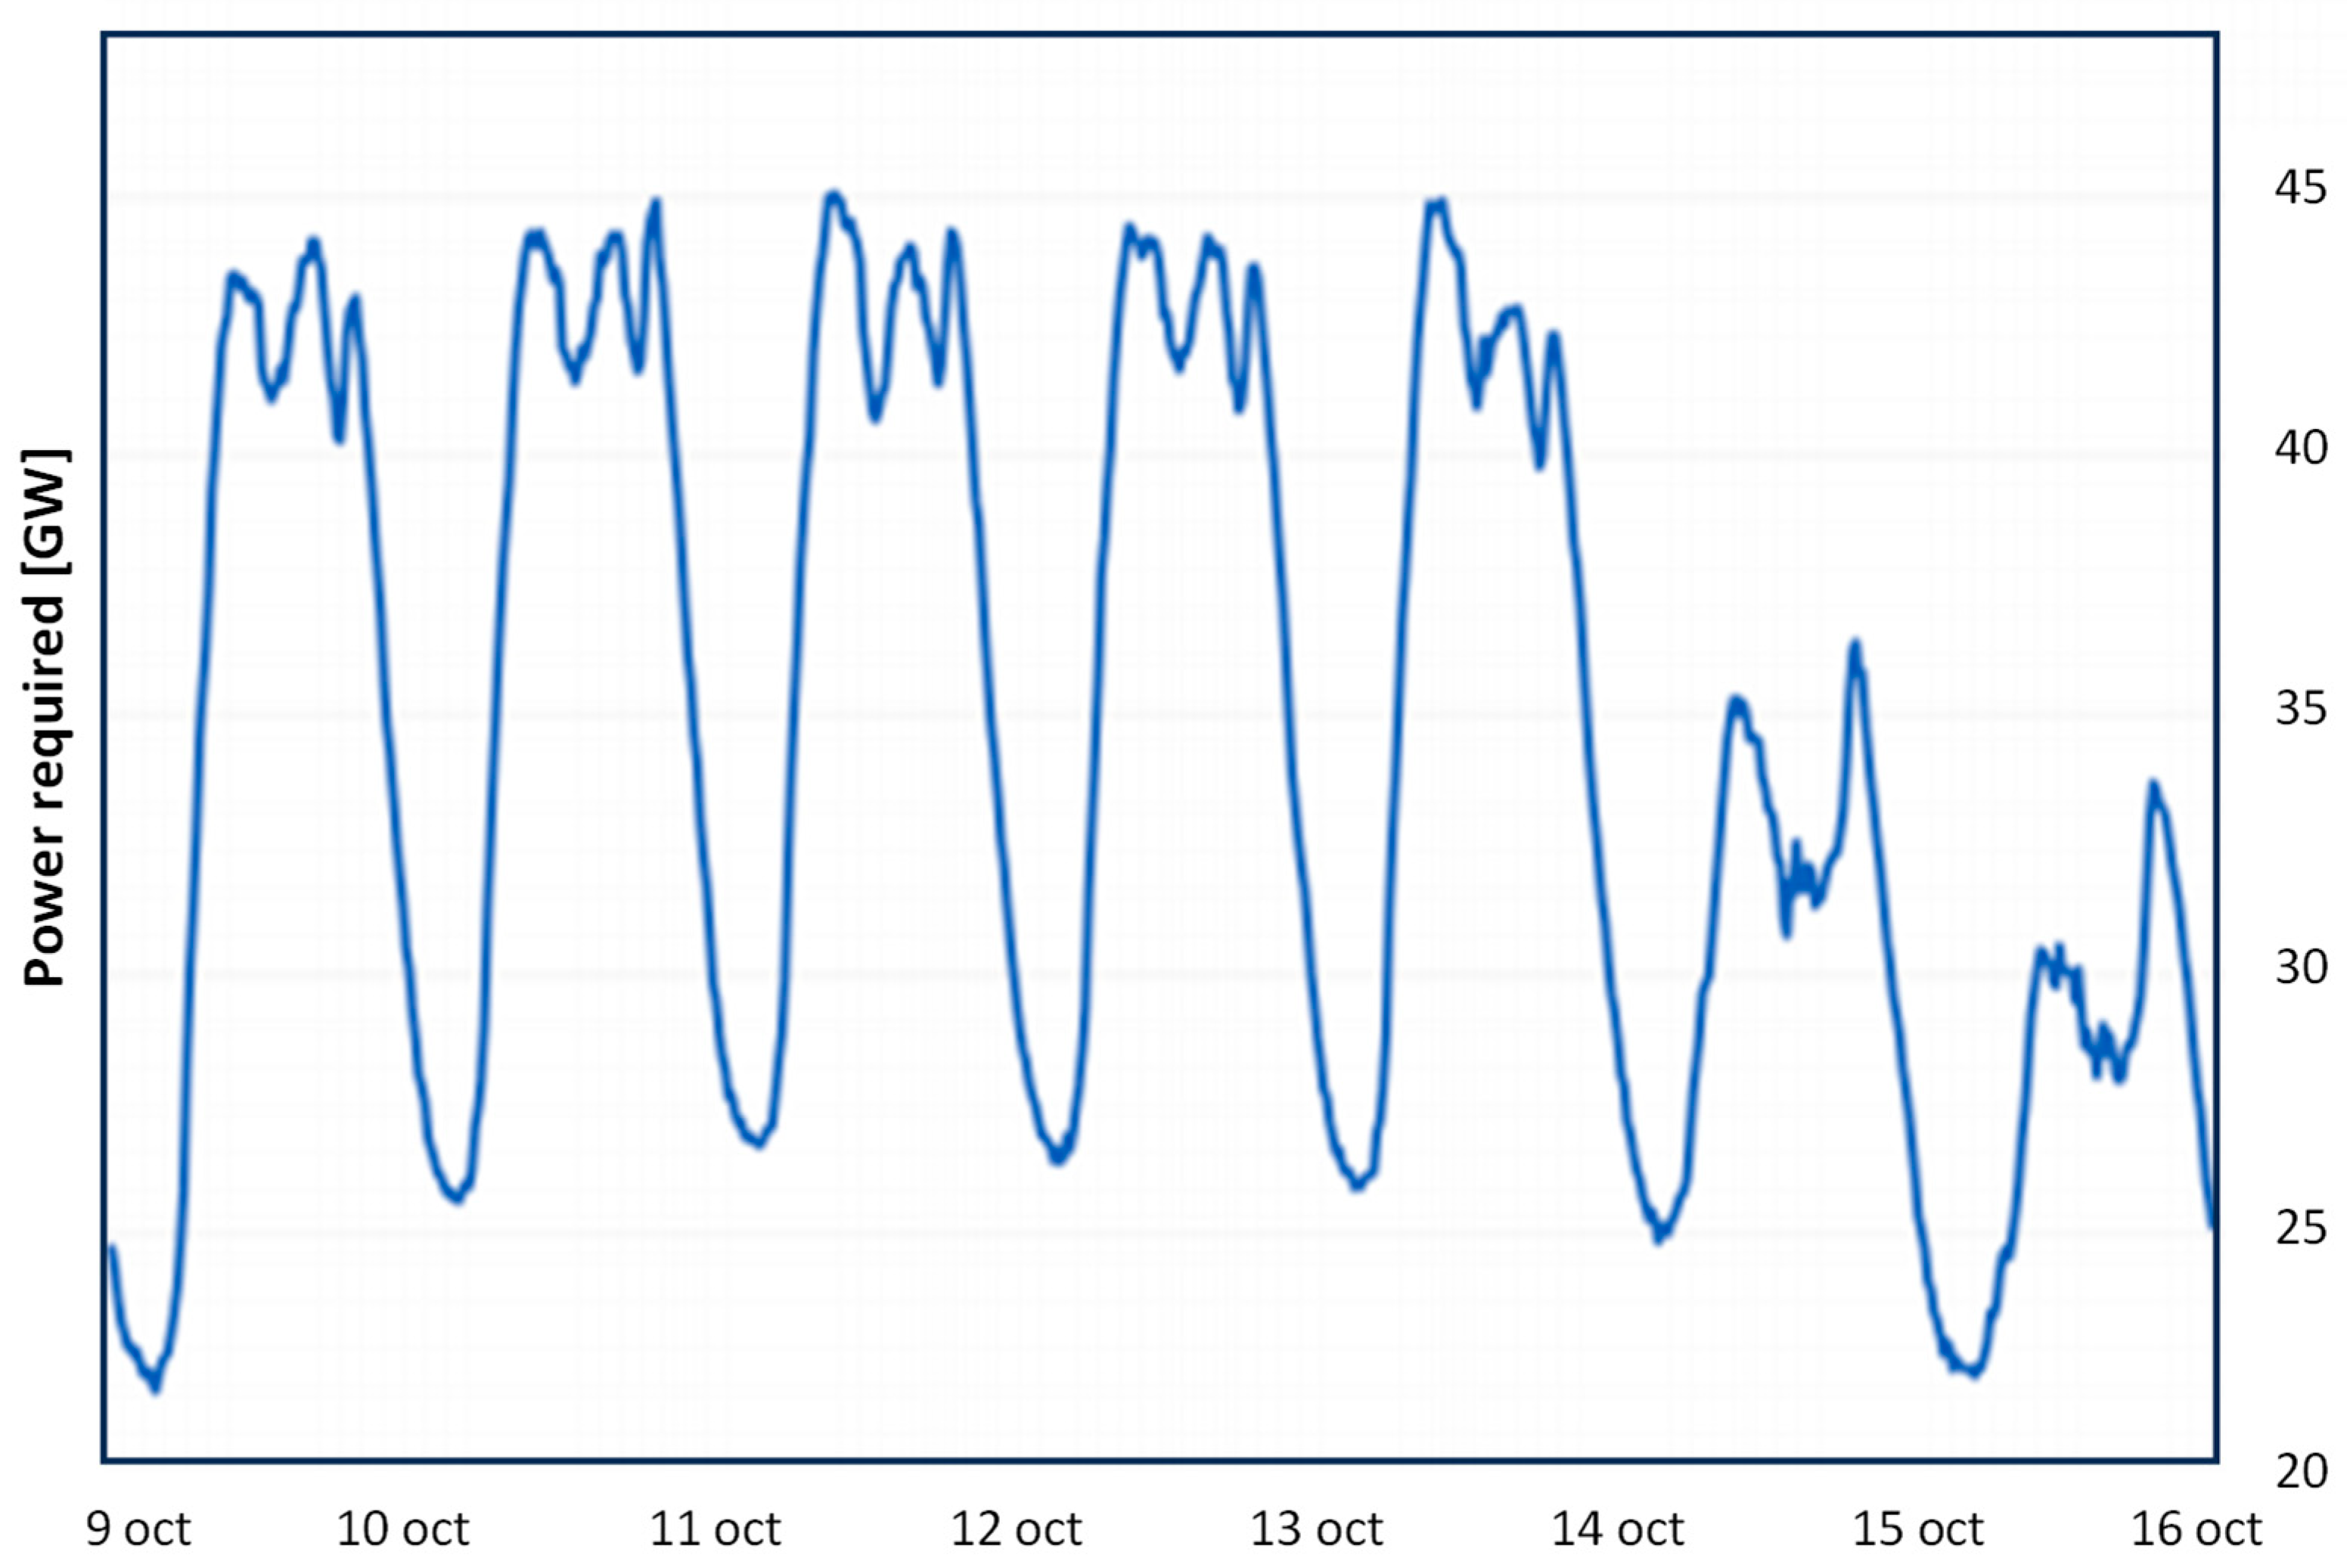
To furnish major details,
Figure 4 represents the demand on a typical autumn week. The analysis includes a clustering that highlights differences between weekdays, pre-holiday days, and holidays. The curve shows two to three peaks, corresponding to the hours between 12:00 PM and 8:00 PM, with a minimum demand ranging between 22 and 25 GW and a maximum demand reaching values between 34 and 45 GW. This shift has transformed the traditional electricity grid, previously reliant on a few large power plants with unidirectional energy flow, into a decentralized system with distributed energy sources.
The Italian electricity system has become increasingly complex in recent years, as highlighted in
Table 1. This table, rearranged by the authors, basing on the data distributed by Terna, [
29], illustrates how the significant growth in the number of power plants—primarily renewable installations, particularly photovoltaic systems—has complicated system management. This evolution has occurred despite a stable demand, emphasizing the challenges posed by the sheer number of plants now integrated into the grid.
These changes have introduced bidirectional energy flows and increased grid complexity. Modern smart energy systems, powered by advanced Information and Communication Technologies (ICT), rely on real-time data exchange and accurate forecasting of both energy consumption and renewable generation to balance the grid, prevent congestion, and ensure efficient operations. These developments have significantly advanced the field of forecasting, driving innovation in predicting both energy demand and power generation. Accurate forecasting has become a cornerstone of modern energy systems, enabling better grid management, optimizing resource utilization, and ensuring the reliability of increasingly complex and decentralized networks.
Temporal forecasting is the process of predicting future values of a time series, which is a sequence of data collected over time. More in detail, time series are data points, typically measured at discrete time instances, which are ordered chronologically, i.e., in terms of an increasing time index. The points are usually equispaced in time and, if the values at each time step consist of only a single variable, the series is said to be univariate. All tests considered in this work are based on these assumptions.
Mathematically, the forecasting problem can be stated, in a simplified form, as follows: given a set of historical observations:
find an approximation of a future value X by constructing a so-called forecasting model, which accurately describes the future behaviour of the time series. The forecasting model can be written as
for some nonlinear function
f which generates the forecast and depends on the past data and on parameters β which determine the response to the inputs. The parameters must be appropriately trained to produce an accurate forecast.
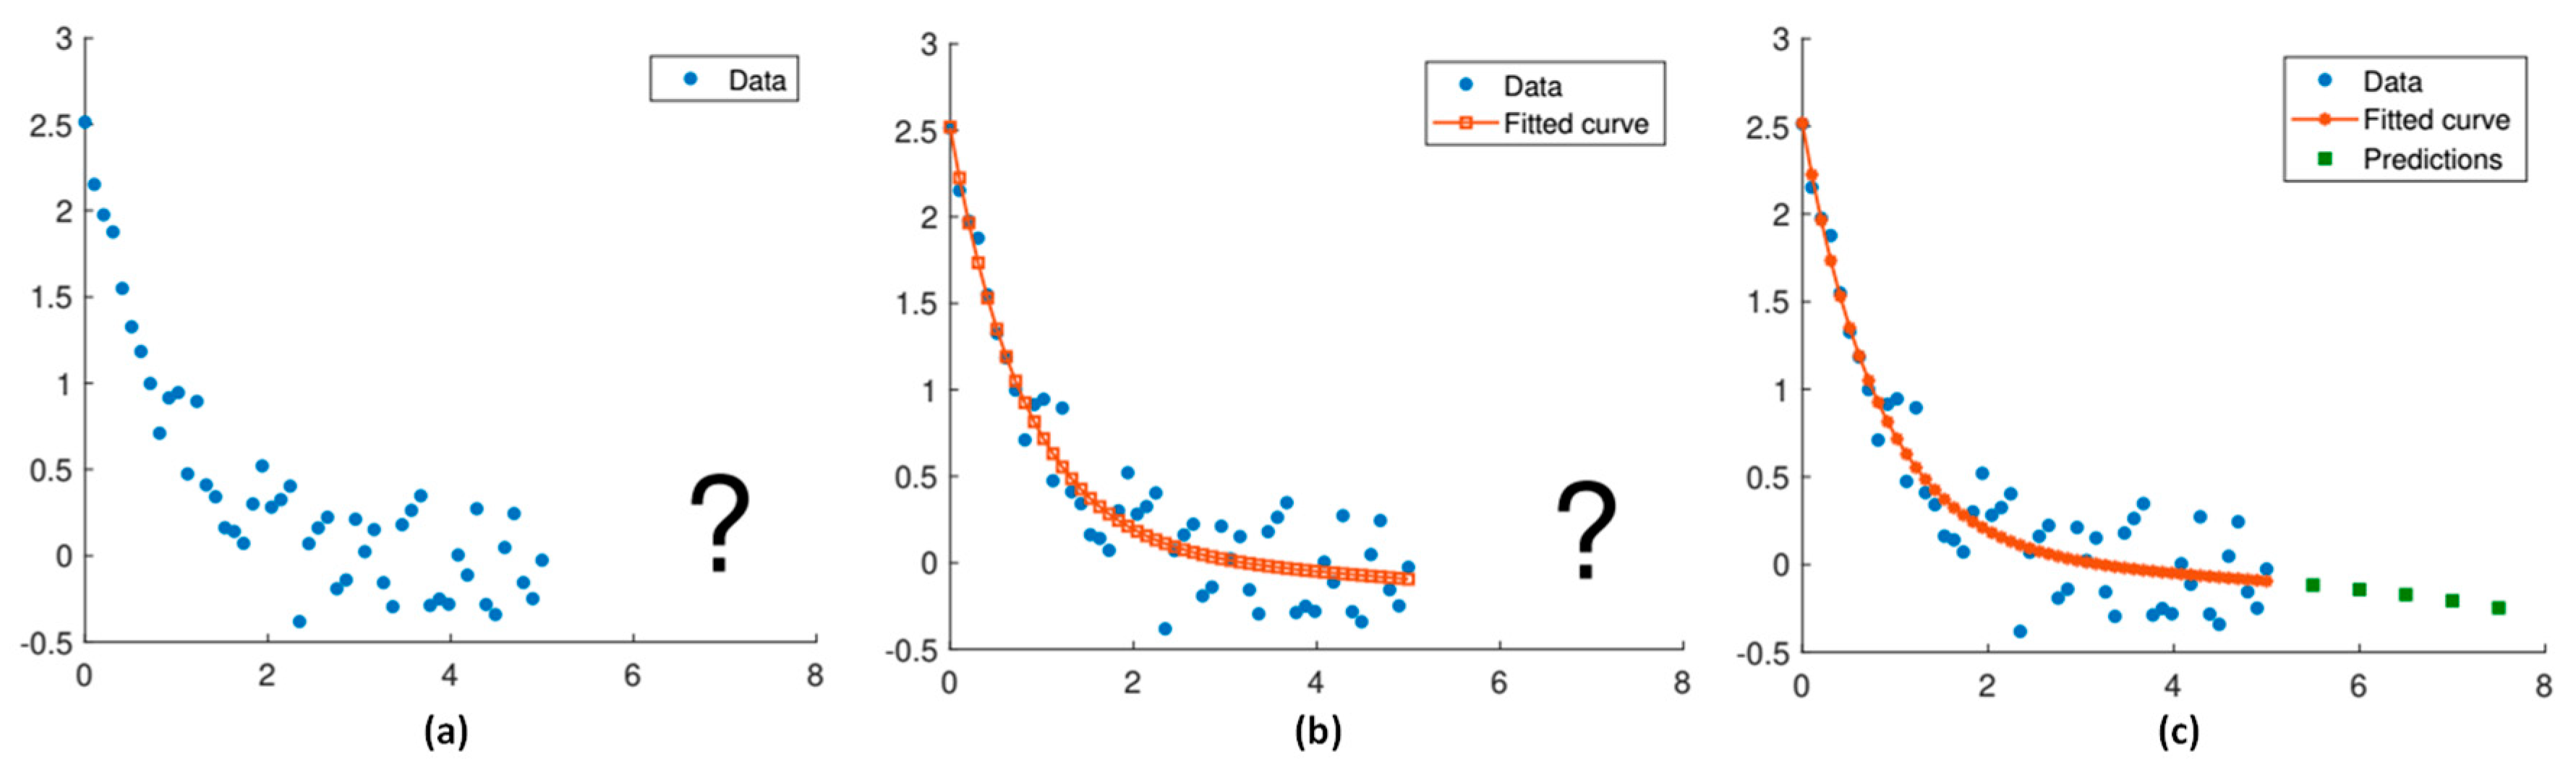
The forecasting algorithm learns from past data to generate reliable predictions about future values.
Figure 5 provides a visual representation of this process, even if it does not depict the mathematical model itself.
The forecasting of electricity demand is becoming increasingly important, especially in the context of rising renewable energy integration. Accurate predictions of electricity demand are crucial for effective grid management, enabling the optimization of energy production and distribution. As renewable energy sources like wind and solar are variable and often unpredictable, precise forecasting becomes vital to ensure supply meets demand and avoid imbalances that can cause disruptions. Predicting energy consumption and production accurately becomes essential for ensuring stability and efficiency. With the growing presence of renewable power plants, which often produce energy intermittently, it is crucial to manage supply and demand effectively to prevent imbalances and energy waste.
In the electricity market, every operator relies on a sophisticated system of measurement points to monitor energy demand in real time. In Italy, for instance, Terna - Rete Elettrica Nazionale S.p.A. plays a key role. As Transmission System Operator (TSO), Terna is responsible for the transmission, management, and dispatching of electricity across the Italian grid. A precise knowledge of future consumption enables the optimization of energy production and the avoidance of unnecessary waste.
Forecasting plays a critical role in the management of modern electricity systems, encompassing both load forecasting (predicting energy demand) and generation forecasting (predicting energy supply from power plants). Forecasting spans different time horizons and serves diverse purposes, depending on the decisions to be made.
Very Short and Short-term forecasting, sometimes called as nowcasting, supports real-time system operation and intraday electricity market management.
Medium-term forecasting, typically up to 24 hours ahead, enables day-ahead market scheduling and critical planning, such as resolving network congestion.
Long-term forecasting focuses on strategic planning, including infrastructure development and investment decisions.
These distinct forecasting objectives are summarized in
Table 2, highlighting the varying timeframes and applications crucial to ensuring the efficiency and reliability of the electricity grid.
Forecasting is challenging due to the irregular temporal fluctuations in demand. While recurring patterns exist, the data can vary greatly depending on the location and period considered. The most problematic aspects, such as demand peaks and valleys, are the hardest to predict in advance. Building a physical model to capture all the influencing factors is not feasible due to the sheer number of variables and the unpredictability or complexity of many of these factors.
Given these challenges, accurate demand forecasting is more important than ever, requiring sophisticated data-driven approaches like machine learning to handle the complexities and uncertainties in energy consumption. Data-driven algorithms have indeed proven powerful in predicting unseen features and in learning complex nonlinear relationships in the data.
In developed countries, electricity demand follows recurring patterns, such as daily, weekly, and seasonal trends. Predictable factors like temperature, weather conditions, daylight hours, and scheduled holidays play a significant role in shaping these patterns. However, there are also unpredictable factors, such as sudden heatwaves, unexpected events, or changes in consumption behavior, which can significantly impact demand.
In the field of energy systems, forecasting has become a crucial area of research and innovation. Over the years, various methods have been developed to address the challenges of predicting energy demand and generation. These approaches can broadly be categorized into mathematical models, which rely on statistical techniques, physical models, which simulate the underlying processes based on physical laws and hybrid models, which combine elements of both. Recently, there has been a growing interest in machine learning techniques, which leverage large datasets and advanced algorithms to identify complex patterns and improve prediction accuracy, offering significant potential for modern energy systems.
Machine learning models offer significant potential for forecasting, particularly when it comes to predicting future electricity demand. The goal is to identify the best numerical, data-driven methods that can provide the most accurate approximation of future energy needs. ML, a branch of artificial intelligence, uses statistical methods to detect patterns in data, making it highly effective for modeling complex relationships that traditional analytical functions cannot capture. In our approach, we aim to build a model that predicts future electricity demand based on past observations. We are working with a time series, where each data point represents electricity demand at a specific time. Given this series, the task is to approximate the future value of electricity demand at a time point beyond the available data. This involves finding a function f that maps past demand data to future values, using a set of parameters, β, as illustrated in Eq. (2).
The machine learning algorithm is trained from historical data by finding the parameters β that minimize the misfit with the training data. Once trained, the model is capable of extrapolating and predicting future demand values, offering reliable forecasts even for time periods not directly observed. In essence, the algorithm "learns" from past observations to predict future values, providing an efficient and accurate solution for energy demand forecasting.
3. Methodology Developed: Recurrent Neural Network (RNN) with Long Short-Term Memory (LSTM)
As the electricity grid becomes increasingly reliant on renewable energy sources, accurate forecasting of energy consumption is crucial for optimizing production and distribution. Electricity demand in a complex system, such as a national grid, is influenced by numerous factors, including weather conditions, economic activities, and social behaviors, which evolve over time.
One of the authors of this work has been engaged with other collaborators in studying the penetration of renewable energy within the national energy system [
10,
31]. Their contributions include advancements in forecasting both on the generation side and the demand side, having already tested several methodologies, as thoroughly outlined in [
30,
32].
In the present study, we aim to explore the application of Machine Learning techniques, specifically Recurrent Neural Networks and Long Short-Term Memory (LSTM) networks, to predict electricity demand.
Traditional forecasting methods often struggle to account for the temporal dependencies and fluctuations inherent in energy demand. By leveraging the power of LSTMs, which are well-suited for capturing both short-term and long-term dependencies in time-series data, we aim to improve the accuracy and reliability of energy demand predictions, ultimately contributing to more efficient grid management.
A specific type of RNN, called Long Short-Term Memory (LSTM) networks, was introduced by Hochreiter and Schmidhuber in 1997, [
33,
34,
35]. The Long Short-Term Memory (LSTM) method has found extensive applications across a wide range of fields due to its ability to handle sequential data and capture long-term dependencies. Key areas of application include Natural Language Processing (NLP), Time-Series Analysis, Healthcare and Biomedical Applications, Audio and Speech Processing, Video and Image Sequence Analysis, Control Systems and Robotics and Autonomous Vehicles.
The method's versatility lies in its architectural enhancements that mitigate issues like the vanishing gradient problem, allowing it to effectively process sequences over long horizons. Its adaptability makes it a cornerstone in many sequential data problems across disciplines. For this reason, Long Short-Term Memory (LSTM) networks seem particularly well-suited for predicting electricity demand in complex systems due to their inherent ability to model temporal dependencies and sequential data. The capability of RNNs to process data across multiple time steps, by updating a form of memory based on the current input and the previous hidden state, allows these architectures to retain and process information from previous time steps.
This feature is crucial in energy demand forecasting, where patterns are often influenced by historical consumption trends, seasonal variations, and temporal correlations.
RNNs excel in capturing these dynamic and non-linear relationships, making them more effective in handling the intricacies of time series. This is especially the case in scenarios involving fluctuating or unpredictable demand patterns, which are common in modern energy systems heavily influenced by renewable energy integration and decentralized generation.
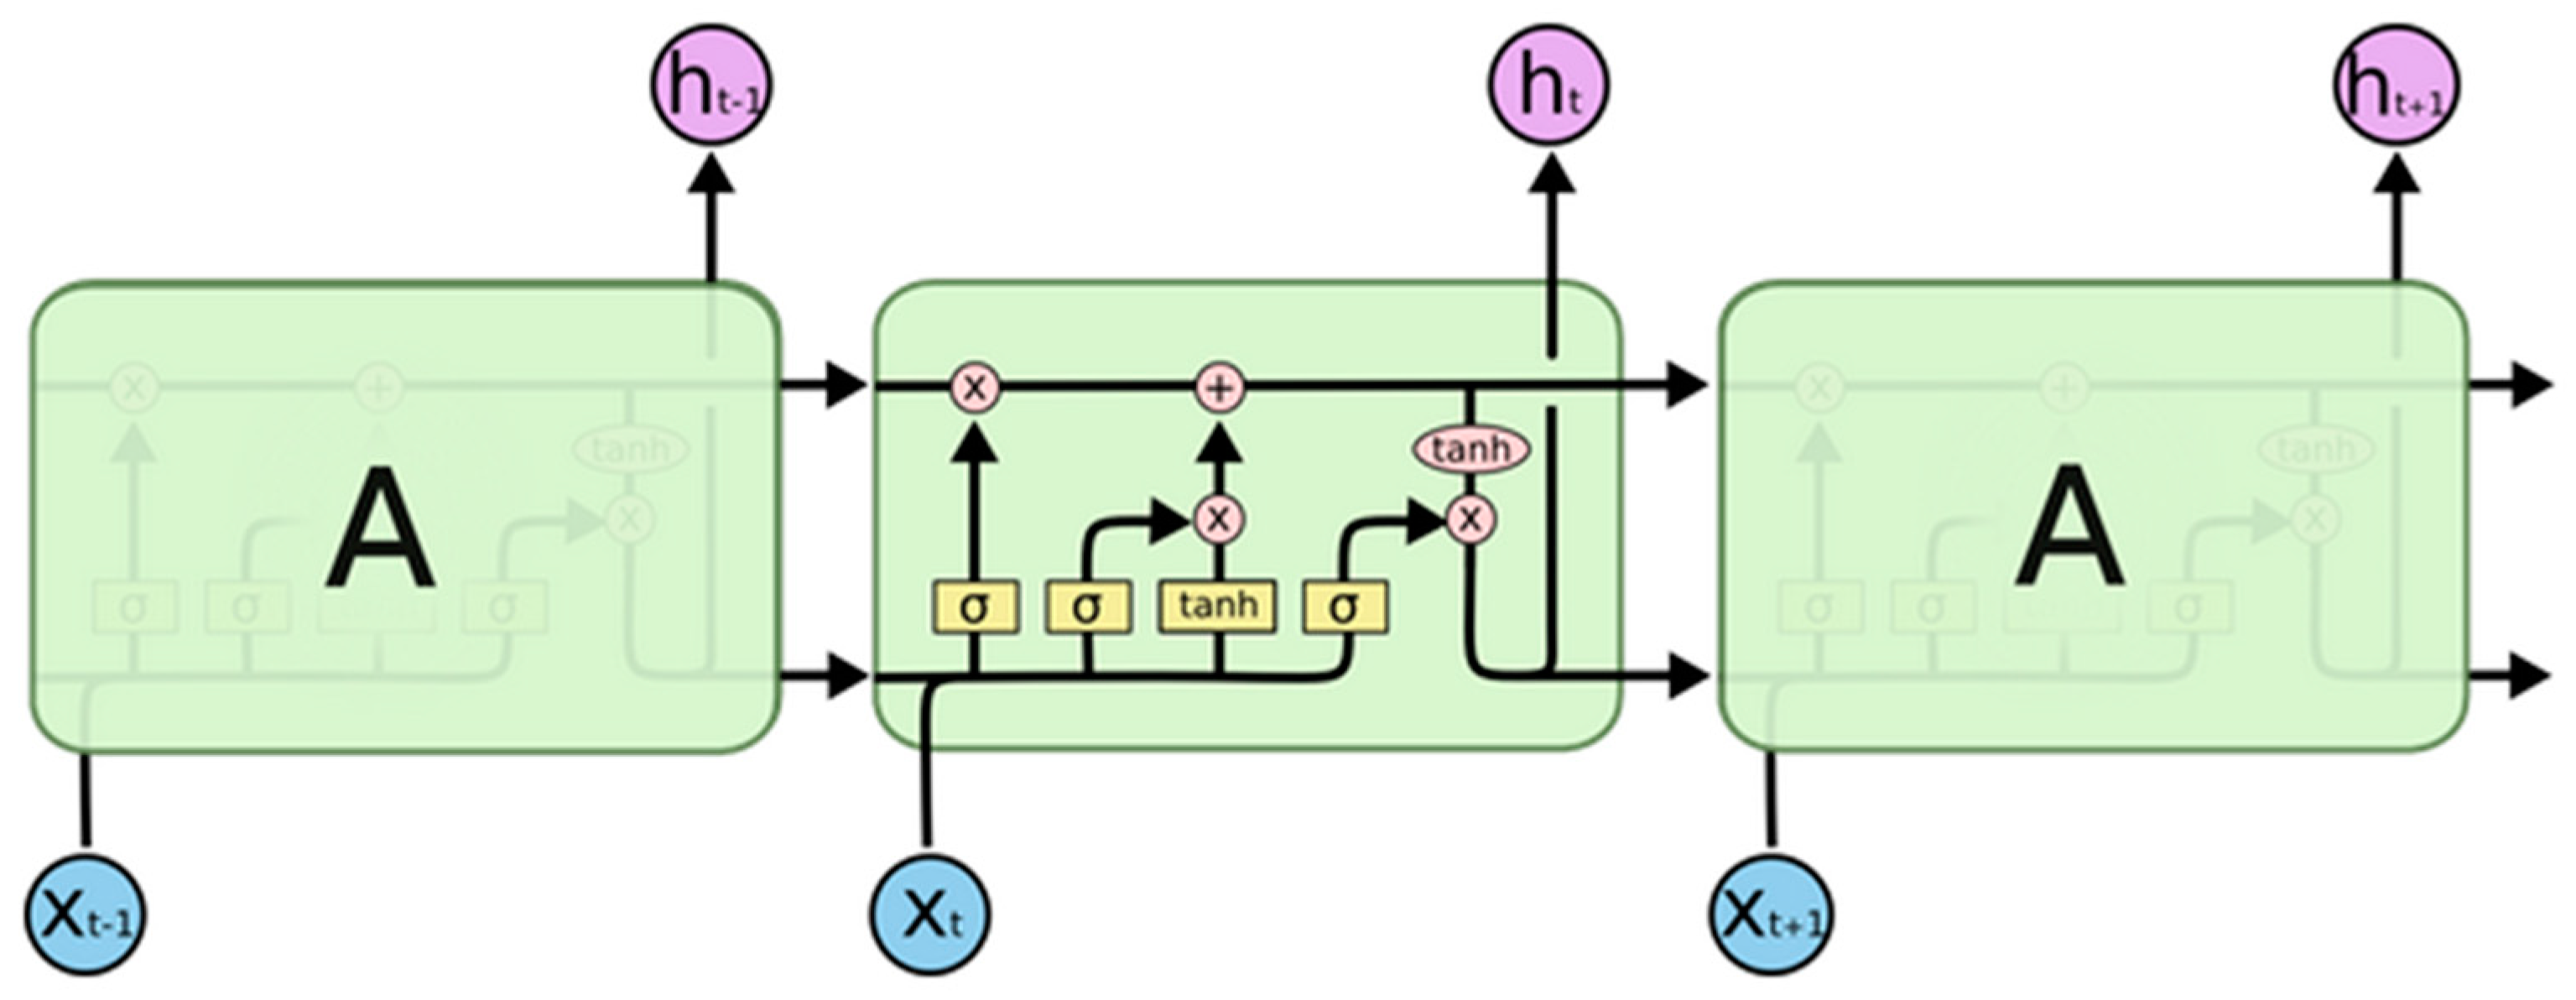
The building block of LSTM models is the recurrent unit. This is typically composed of a cell and three gates that regulate the flow of information into and out of the cell: the input gate, the output gate, and the forget gate. To update the cell state Ct the unit mantains a so-called hidden state ht which plays the role of a memory, and it is updated at each time step based on the previous hidden state and on the current input Xt.
The LSTM could remove or add information to the cell state via the gates. This feedback loop allows the LSTM network to maintain useful, long-term dependencies to make predictions, both in current and future time-steps.
In their formulation, the states of an LSTM are defined by the following variables:
- Xt is the input state at time t;
- ht is the hidden state at time t;
- Ct is the cell state at time t.
The gates are neural network layers whose architecture is of the form
where σ is the sigmoid activation function, and, for any z = {F, I, O}, W
z are the weights and b
z are the biases. The weights and the biases of all layers form the set of parameters β introduced in the general forecasting model in Eq. (2).
The LSTM network processes electricity load data, available every 15 minutes (4 times per hour), by using gates to control the flow of information. The forget gate decides which past data to discard by evaluating which information is no longer relevant. For example, if a sudden spike in electricity demand occurred due to a temporary event (like a short-term weather change), the forget gate may decide to ignore that spike in future predictions. The input gate determines which new information to add to the memory, focusing on patterns that are consistent and relevant, such as recurring load patterns during peak hours. Finally, the output gate controls what information is used to make predictions. This flow of information allows the network to remember important trends (like daily peaks) while forgetting irrelevant noise, ensuring accurate predictions based on historical load trends.
The fundamental steps and equations for an LSTM can be summarized as follows:
These operations enable LSTMs to learn long-term dependencies by selectively keeping relevant information and discarding irrelevant data over time.
Figure 6 provides a simplified representation of the methodology. The yellow boxes depict neural network layers, the pink circle pointwise operators, while the sequence of operations can be inferred from the arrows.
In this paper, we focus on the problem of forecasting the hourly electricity demand in Italy. We want to study and test the performance of numerical models based on recurrent artificial neural networks through computational experiments.
The specific model we implemented is the LSTM (Long Short-Term Memory), a type of recurrent neural network designed to capture both short-term and long-term dependencies in time series data. LSTM networks are particularly well-suited for tasks where context from earlier in the sequence is essential for making accurate predictions, such as in time series forecasting. By leveraging this model, we aimed to improve the accuracy of electricity demand predictions, which is crucial for better energy management and grid optimization in Italy. Through numerical experiments, we tested the model's ability to forecast energy demand, comparing its performance to traditional forecasting methods and analyzing the results to assess its effectiveness in this domain.
3.1. Data Description
For this study, we focused on the electricity demand in Italy, utilizing datasets provided by Terna S.p.A., the operator responsible for the national electricity grid. The data includes electricity consumption (actual load) in gigawatts (GW) measured every 15 minutes for the years 2022 and 2023, available at [
28].
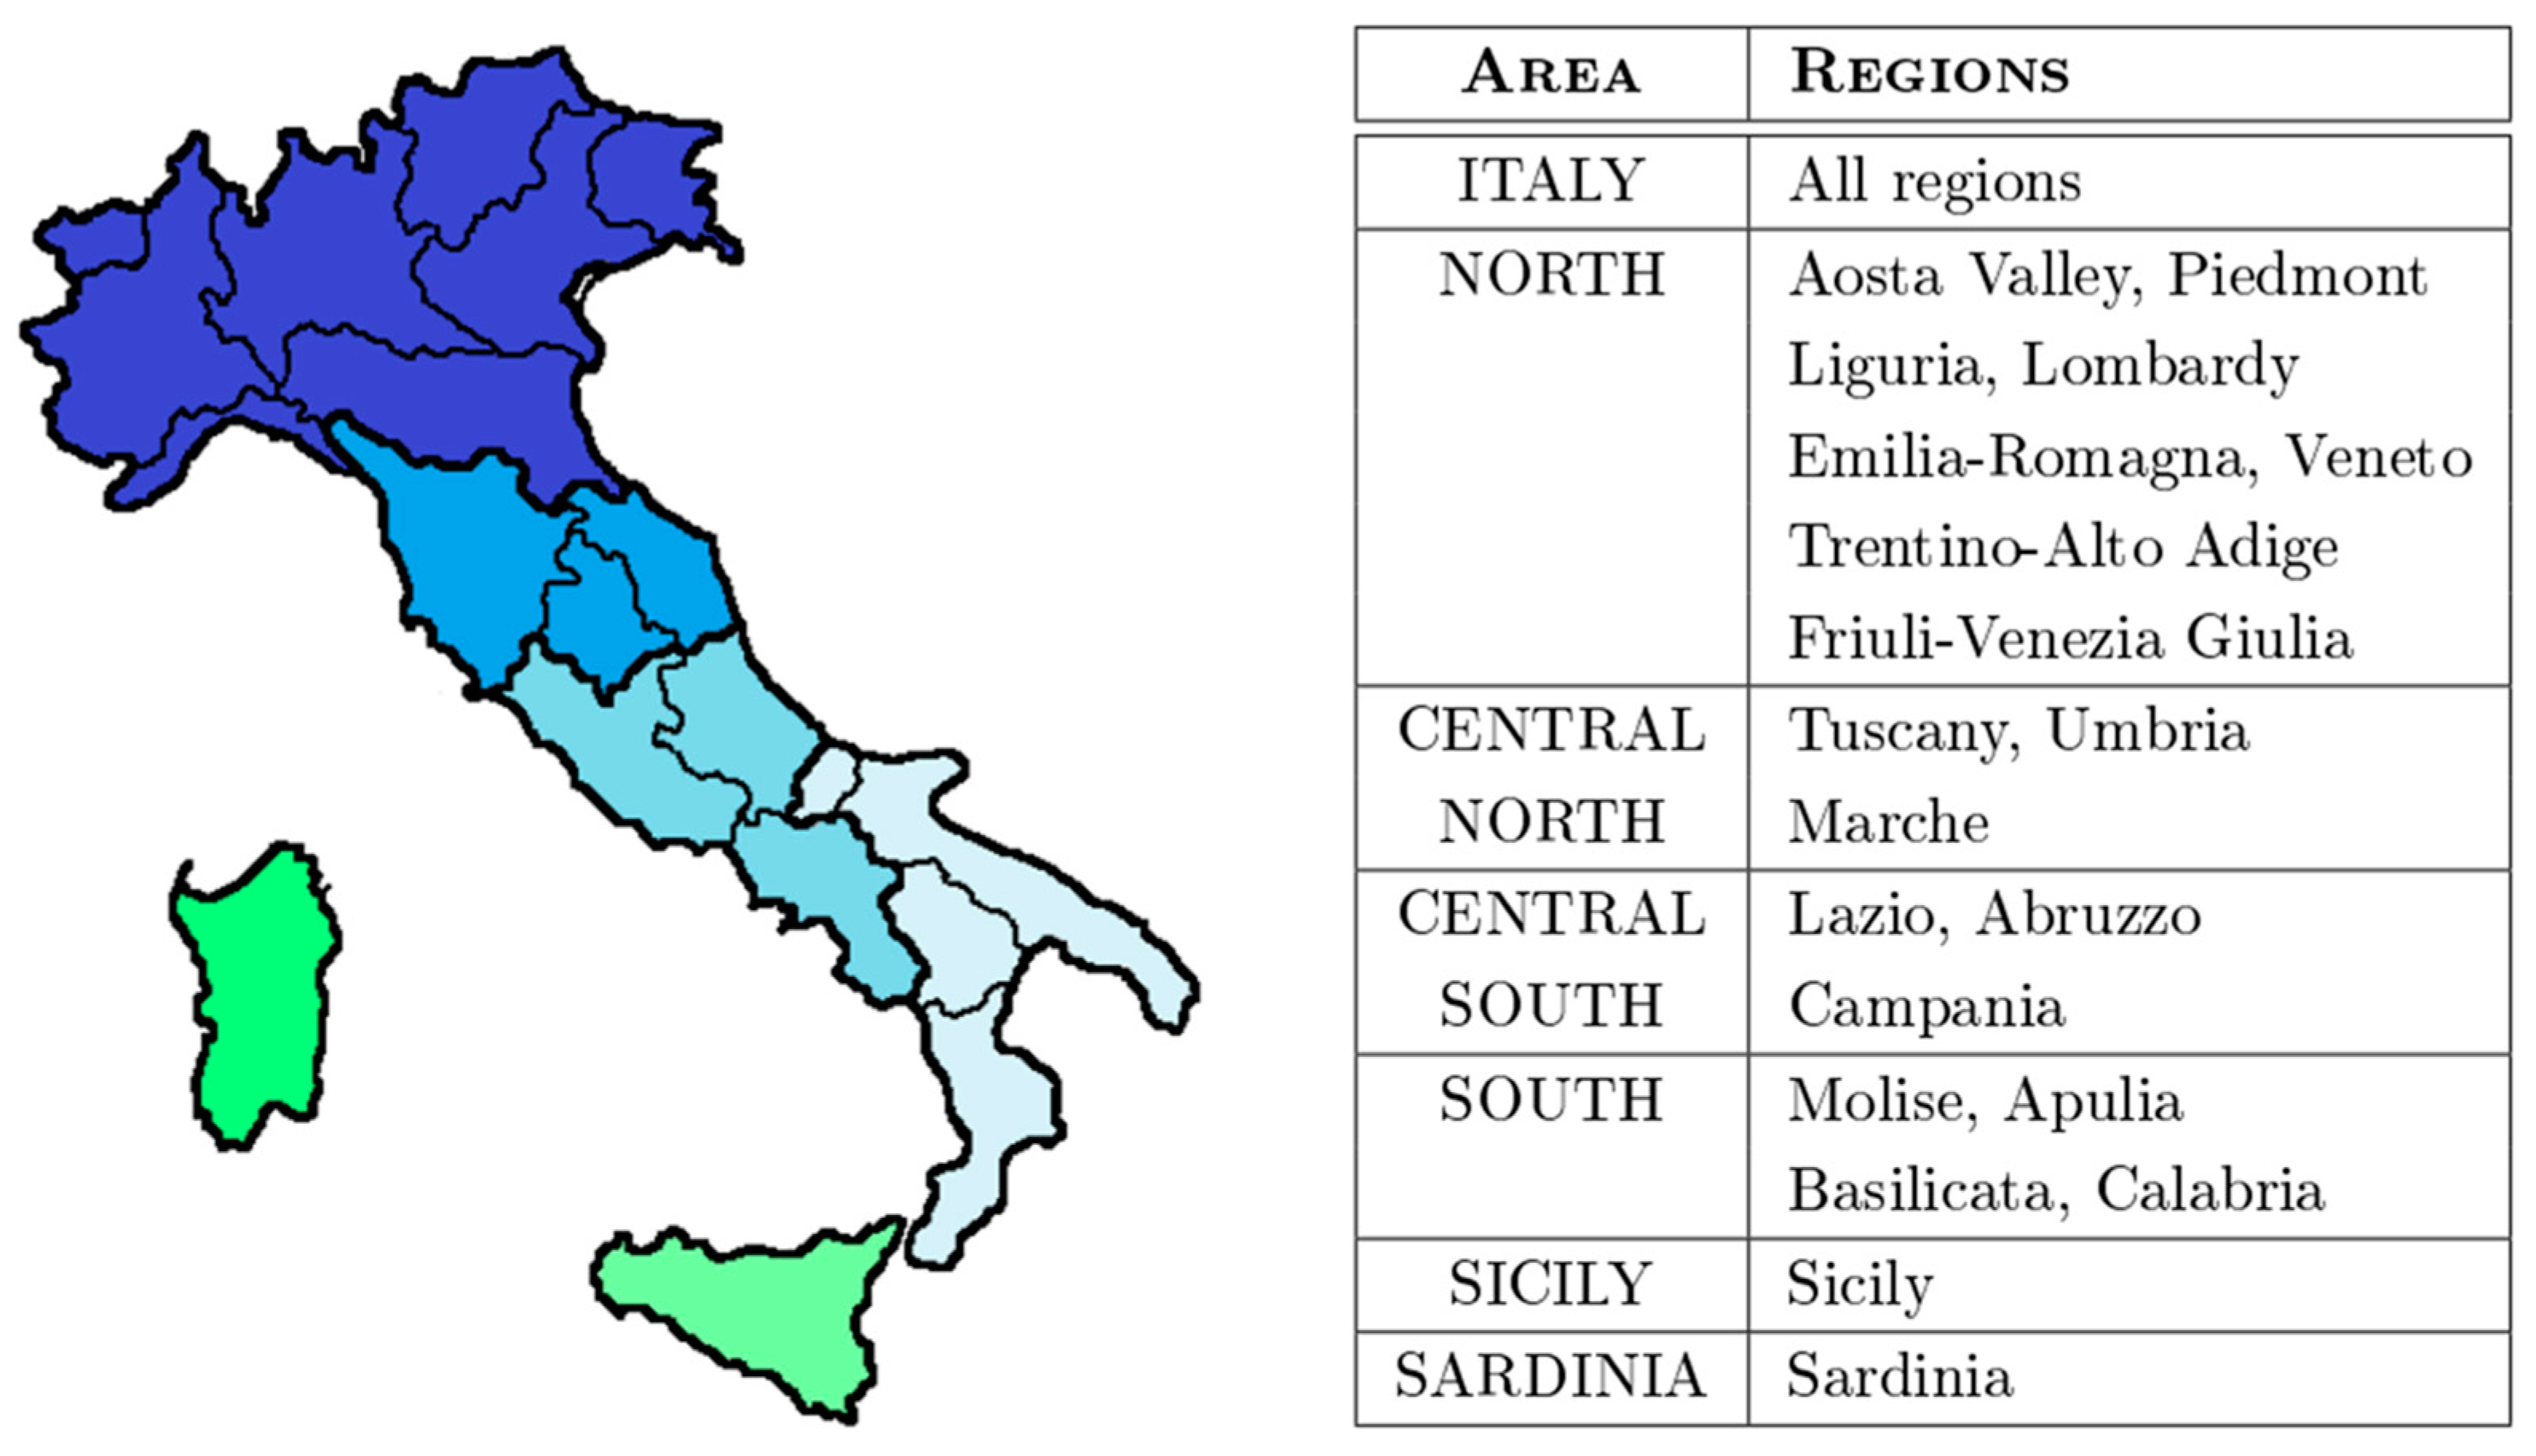
Actual load represents the injections of power into the grid (vertical load), including grid losses, for 7 geographical reference areas, corresponding to Northern Italy, Central-Northern Italy, Centra-Southern Italy, Sardinia ad Sicily and the aggregated national data (
Figure 7).
For the purpose of this work, we considered two different type of data sets: the actual load data set, containing the consumptive of load consumption, and the day-ahead load forecast data, containing the load forecast provided by Terna. The first dataset is used to test the neural network, while the second for comparison.
To ensure the datasets were suitable for analysis, some preprocessing steps were applied. First, the data was cleaned to address missing or inconsistent values. Next, to predict hourly consumption, data were downsampled using resample function from a frequency of 15 minutes to hourly frequency. Moreover, since ML algorithms are sensitive to the scale of the input data, the dataset was normalized, that is they were rescaled to the range [0, 1].
Finally, the dataset was split into training, validation, and testing sets to facilitate model development and evaluation.
3.2. Model Architecture and Test methodology
We developed an LSTM model using Python, a versatile and widely-used programming language [
36], and the Keras library with a specific architecture. Keras is an open-source library specifically designed for deep learning tasks. Integrated within TensorFlow, Keras provides a high-level Application Programming Interface (API) that simplifies the creation and training of neural network models. In the context of this program, Keras was chosen because of its ability to handle sequential data efficiently through recurrent neural networks and, more specifically, Long Short-Term Memory (LSTM) models. These architectures are particularly well-suited for capturing temporal dependencies in time-series data, which is a critical aspect of this work, [
37].
To better understand the structure of the proposed model, we provide the following description of its architecture and training process. The model is based on a recurrent neural network with Long Short-Term Memory (LSTM) layers. Specifically, it consists of four LSTM layers, each containing 50 hidden units. To prevent overfitting, a dropout layer with a rate of 0.2 is applied. The final output is produced by a single output layer. The input to the model is a sequence of “length” 100, and the total number of trainable parameters amounts to 71,051.
The training process spans 50 epochs with a batch size of 20. The model is optimized using the Adam algorithm, and the Mean Squared Error (MSE) loss function is employed to measure prediction accuracy.
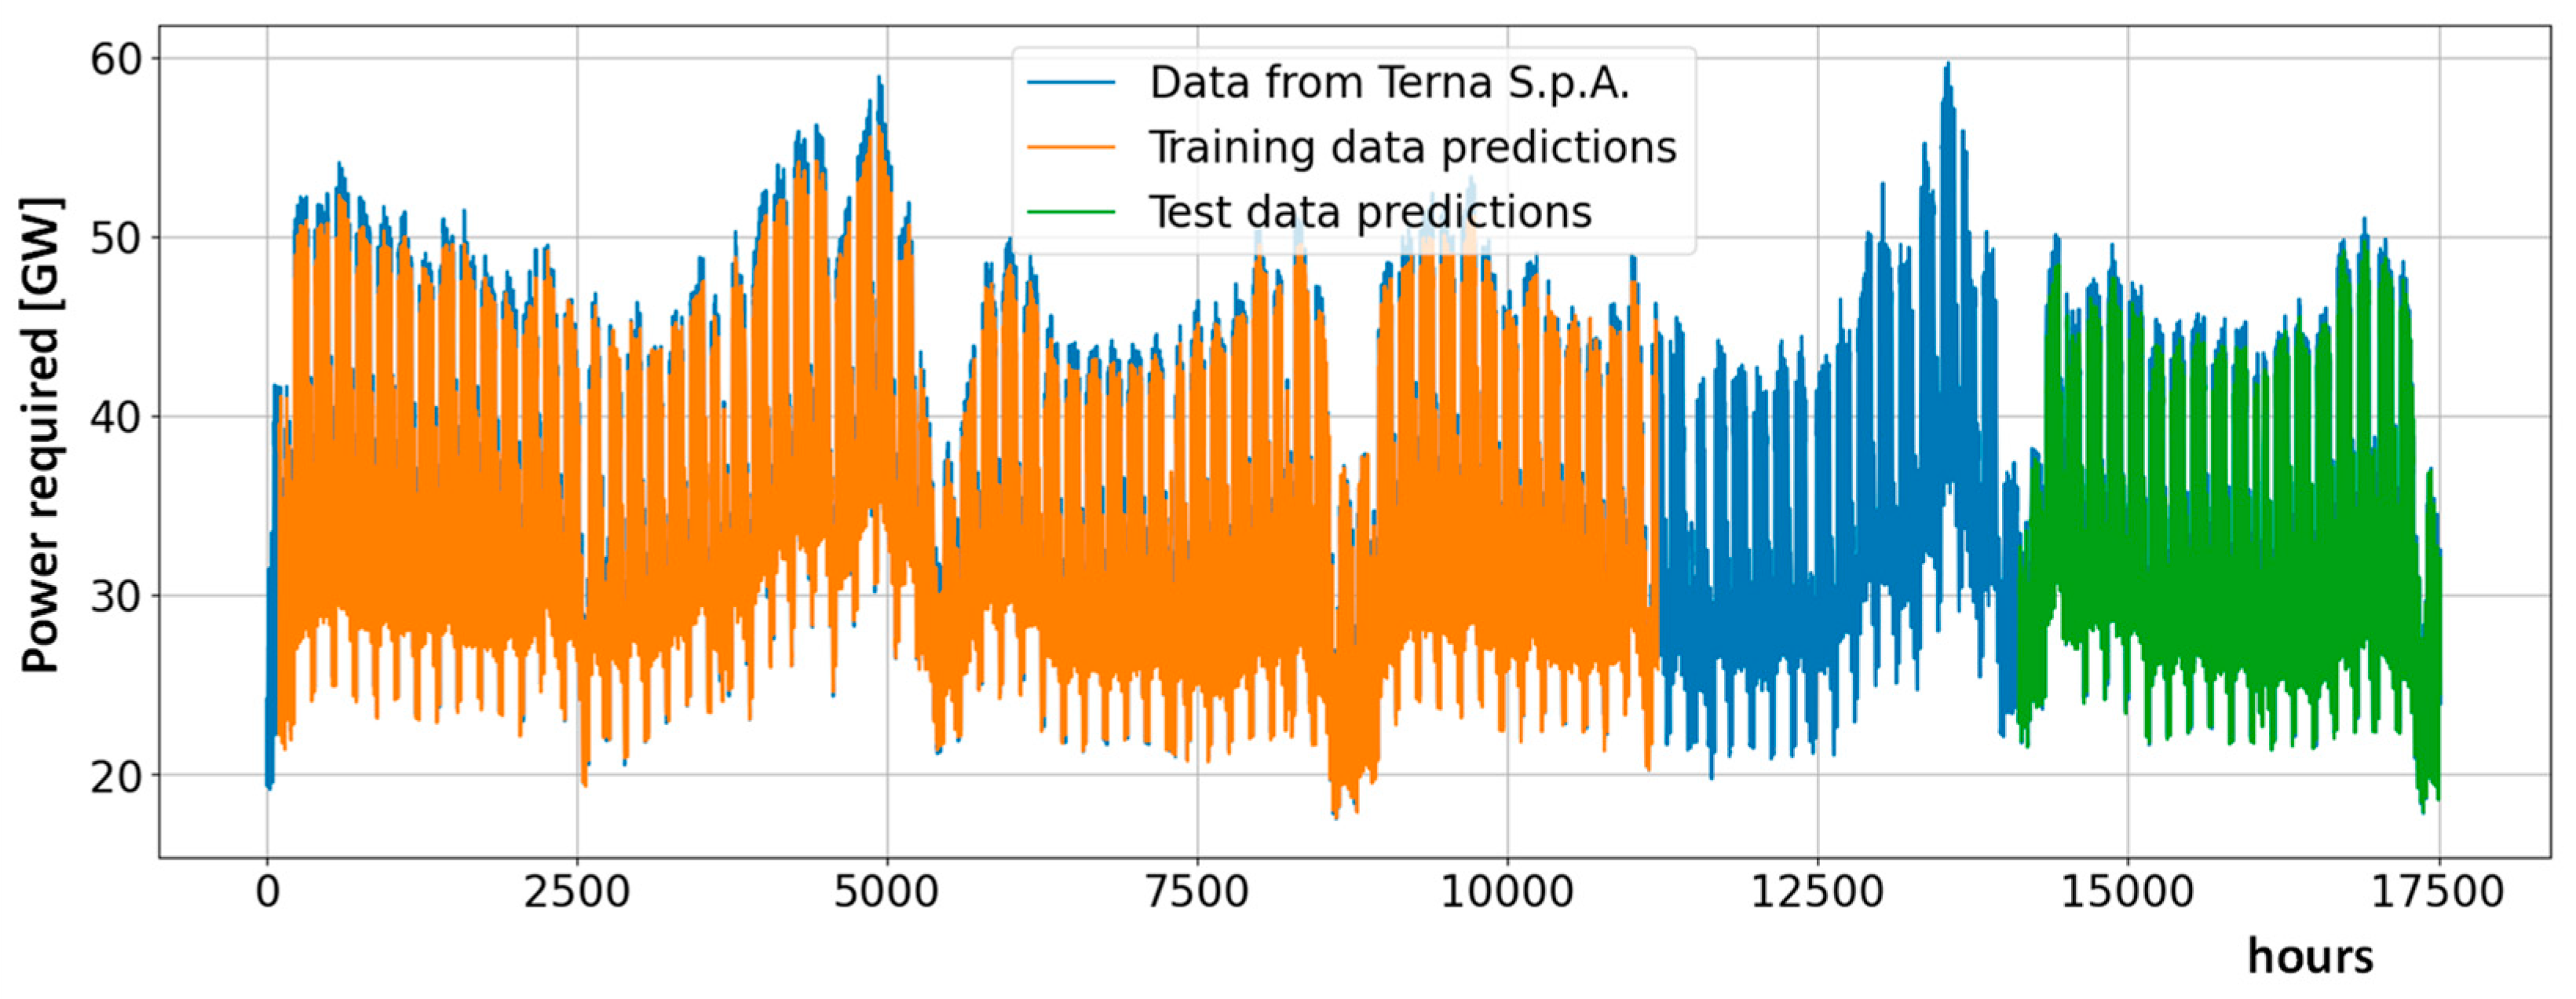
The dataset consists of hourly electricity demand data in the Italian system from January 2022 to December 2023 (a range of 17520 hours). The data were normalized in the [0, 1] interval and divided as follows:
- Training set: data from January 1, 2022, to April 12, 2023 (a period of around fifteen months) were used for model training.
- Validation set: this was used to fine-tune the network architecture during training and collects data from April 13, 2023, to August 7, 2023 (a period of around four months has been considered).
- Test set: data from August 8, 2023, to December 31, 2023 (a period of around five months) were employed to evaluate the model's performance.
The training and validation sets correspond to 80% of the total available data while the test set collects the remaining 20% of the data.
Figure 8 provides all the data evidencing the dataset used (in blue), the result of the forecasting on the training data (in orange) and on the test data (in green). Note that the interval in which only the actual data in blue are plotted corresponds to the validation window.
3.3. Validation and Metrics
The key aspect of ML algorithm is the training phase, where the goal is to derive the function parameters β such that the model performs well on new, previously unseen inputs. At this stage the number of parameters plays a crucial role. Indeed, a model with
very few parameters will not be able to capture some of the core features of the time series and underfit the data. In contrast, the more parameters the more likely the model is to fit to spurious noise in the time series signal and hence cannot be extrapolated very well to new data, the so-called overfitting. A powerful feature of ML algorithm is the possibility to minimize, during the training phase, the generalization error, namely the expected value of the error on new data, ideally from the set of data that we expect the algorithm to encounter in practice. To simulate this, the generalization error is estimated by assessing its performance on a test set of examples that were collected separately from the training set, the so-called validation set.
In the numerical tests of this work, the model was validated using the Mean Squared Error (MSE) as the evaluation metric. MSE measures the average squared difference between predicted and actual values, providing a robust indicator of the model's performance.
The same metric was used to assess the quality of the model predictions on the test set collecting data that were not seen by the ML model. A lower MSE value indicates higher accuracy and better predictive capability.
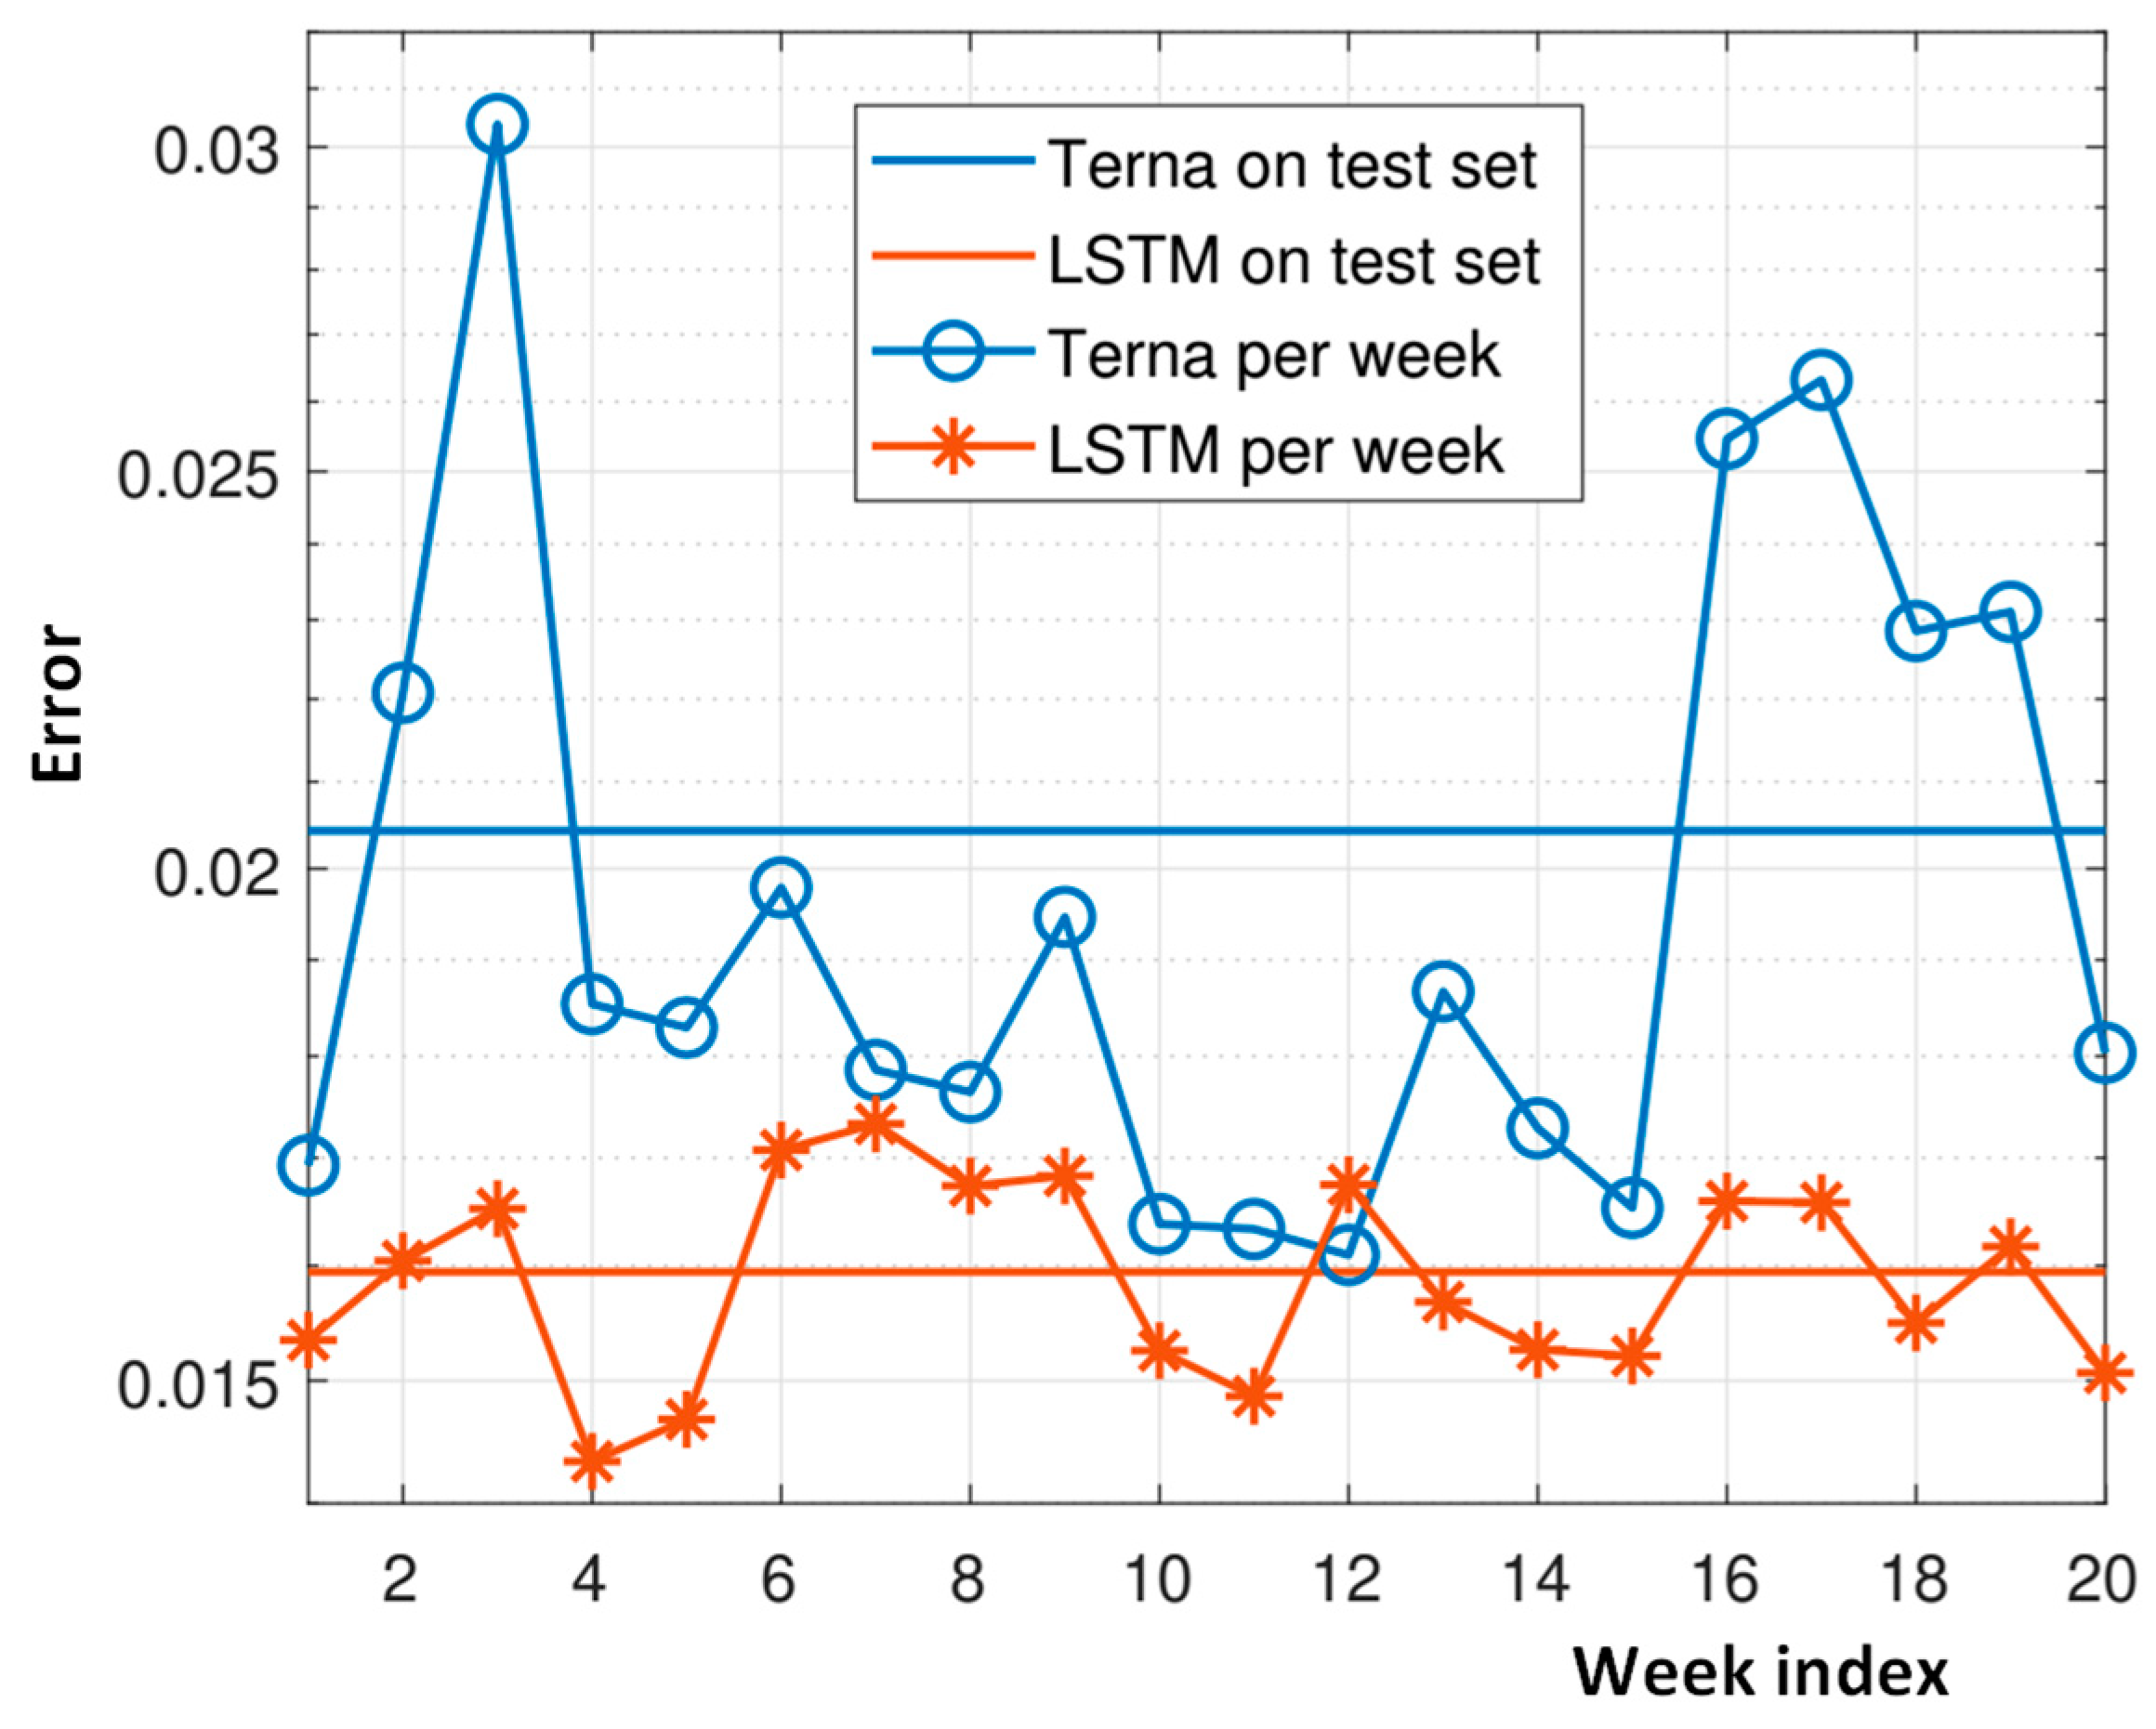
The results are like Terna's in terms of the error computed over the test set: 0.0161 compared to Terna's 0.0204. When looking at the MSE over the test data corresponding to each single week, we observe, in
Figure 9, that our model presents less oscillations of the error compared to Terna’s result, showing a good predictive capability both a couple of weeks ahead and more than 15 weeks ahead. Qualitatively, the algorithm seems slightly better at capturing the function's behavior during peak periods, at least for these data sets. As clearly shown in
Figure 10, the developed method demonstrated an excellent fit to the data, outperforming even the official model developed and used for predictions by Terna. This highlights the effectiveness of the proposed approach in accurately capturing the dynamics of electricity demand.