5. Results and Discussion
5.1. Results on DS1 with 15% Churn Ratio
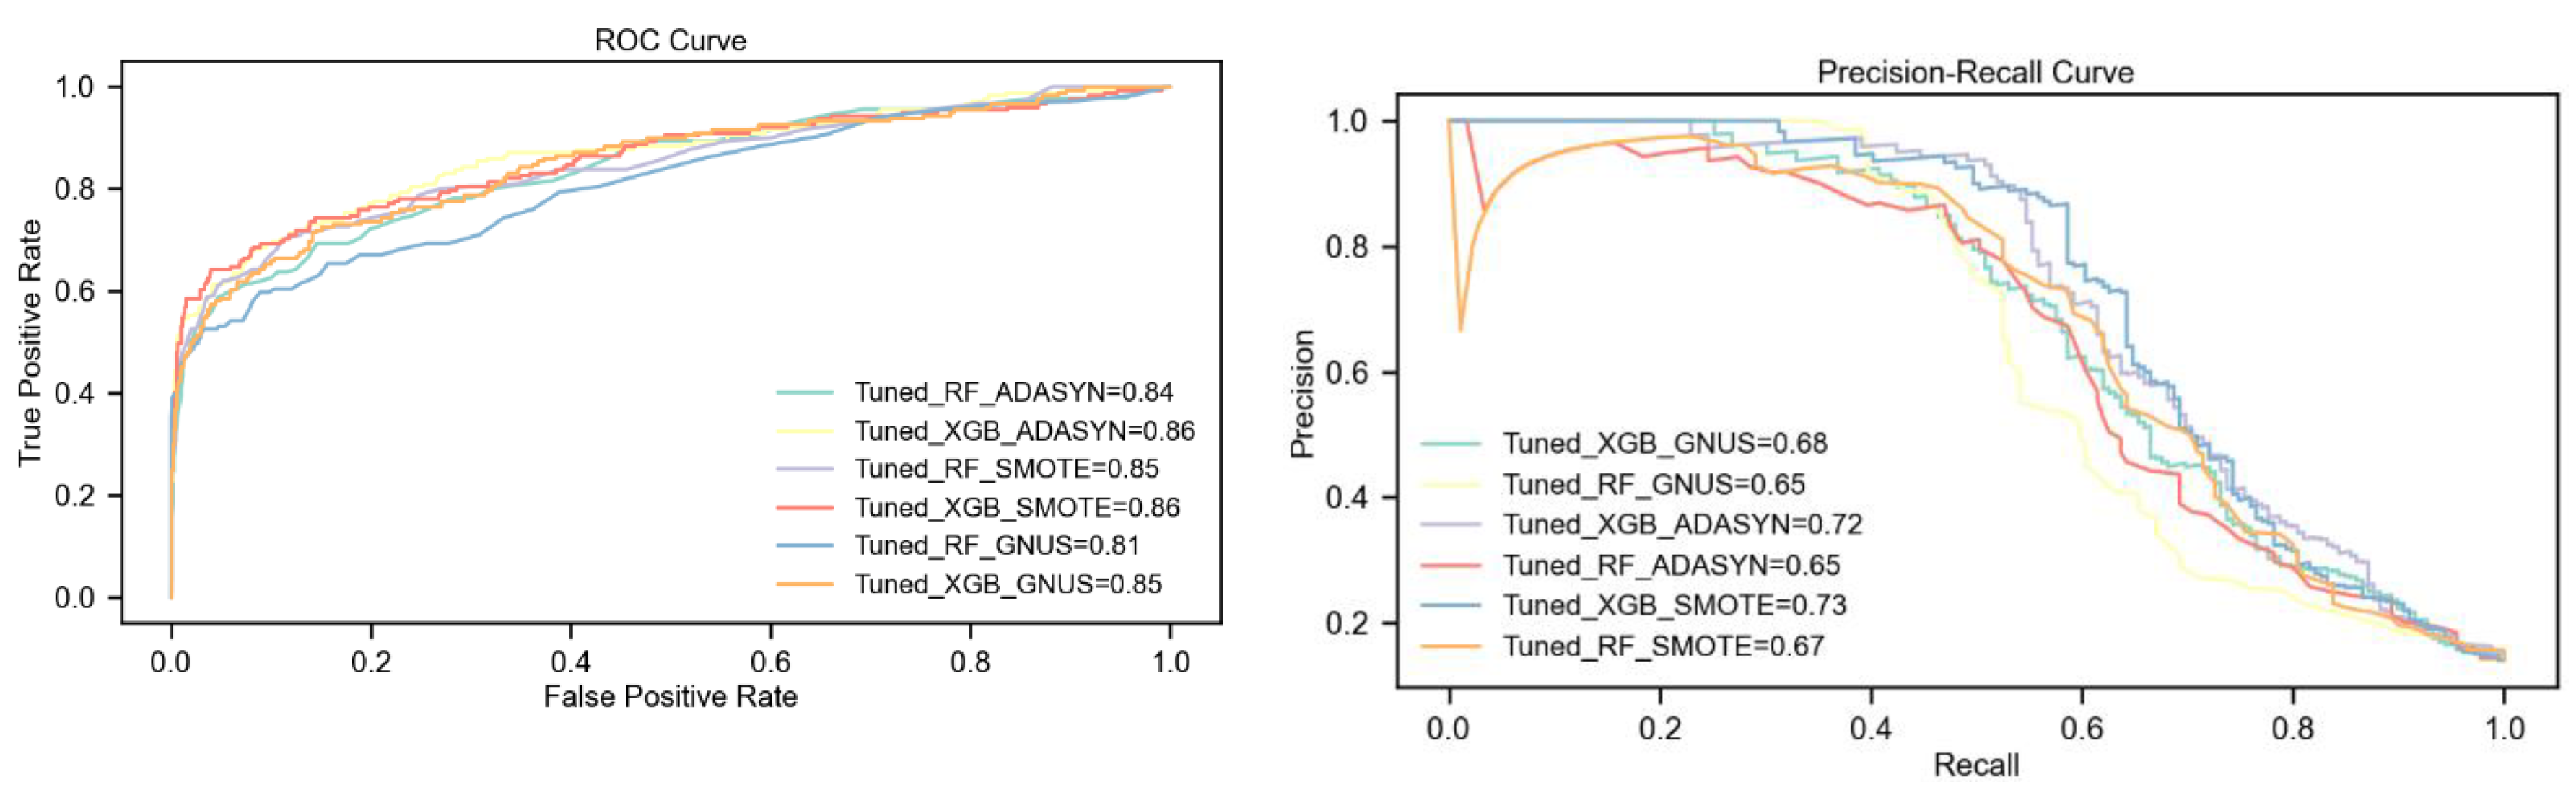
The evaluation shows that the tuned XGBoost model consistently outperforms Random Forest, particularly when paired with the SMOTE upsampling technique. Under SMOTE, XGBoost achieves the highest scores across all key metrics, including a 4% higher F1-Score, a 6% higher PR-AUC, and notable improvements in Kappa and MCC (5% and 4%, respectively). This demonstrates the strong synergy between XGBoost's advanced learning capabilities and SMOTE's synthetic sample generation.
Using ADASYN, XGBoost shows moderate improvements over Random Forest, with a 1% higher F1-Score and a significant 7% advantage in PR-AUC, though both models exhibit similar Kappa statistics. GNUS is the least effective upsampling method, with both models performing equally in F1-Score and Kappa, but XGBoost still maintains modest gains in ROC-AUC (4%) and PR-AUC (3%).
Overall, SMOTE-enhanced XGBoost delivers the best performance, significantly surpassing ADASYN and GNUS in addressing class imbalance. These findings, detailed in
Table 4 and
Figure 4, affirm SMOTE as the most effective technique and XGBoost as the most robust model for this dataset.
5.2. Results on DS2 with 10% Churn Ratio
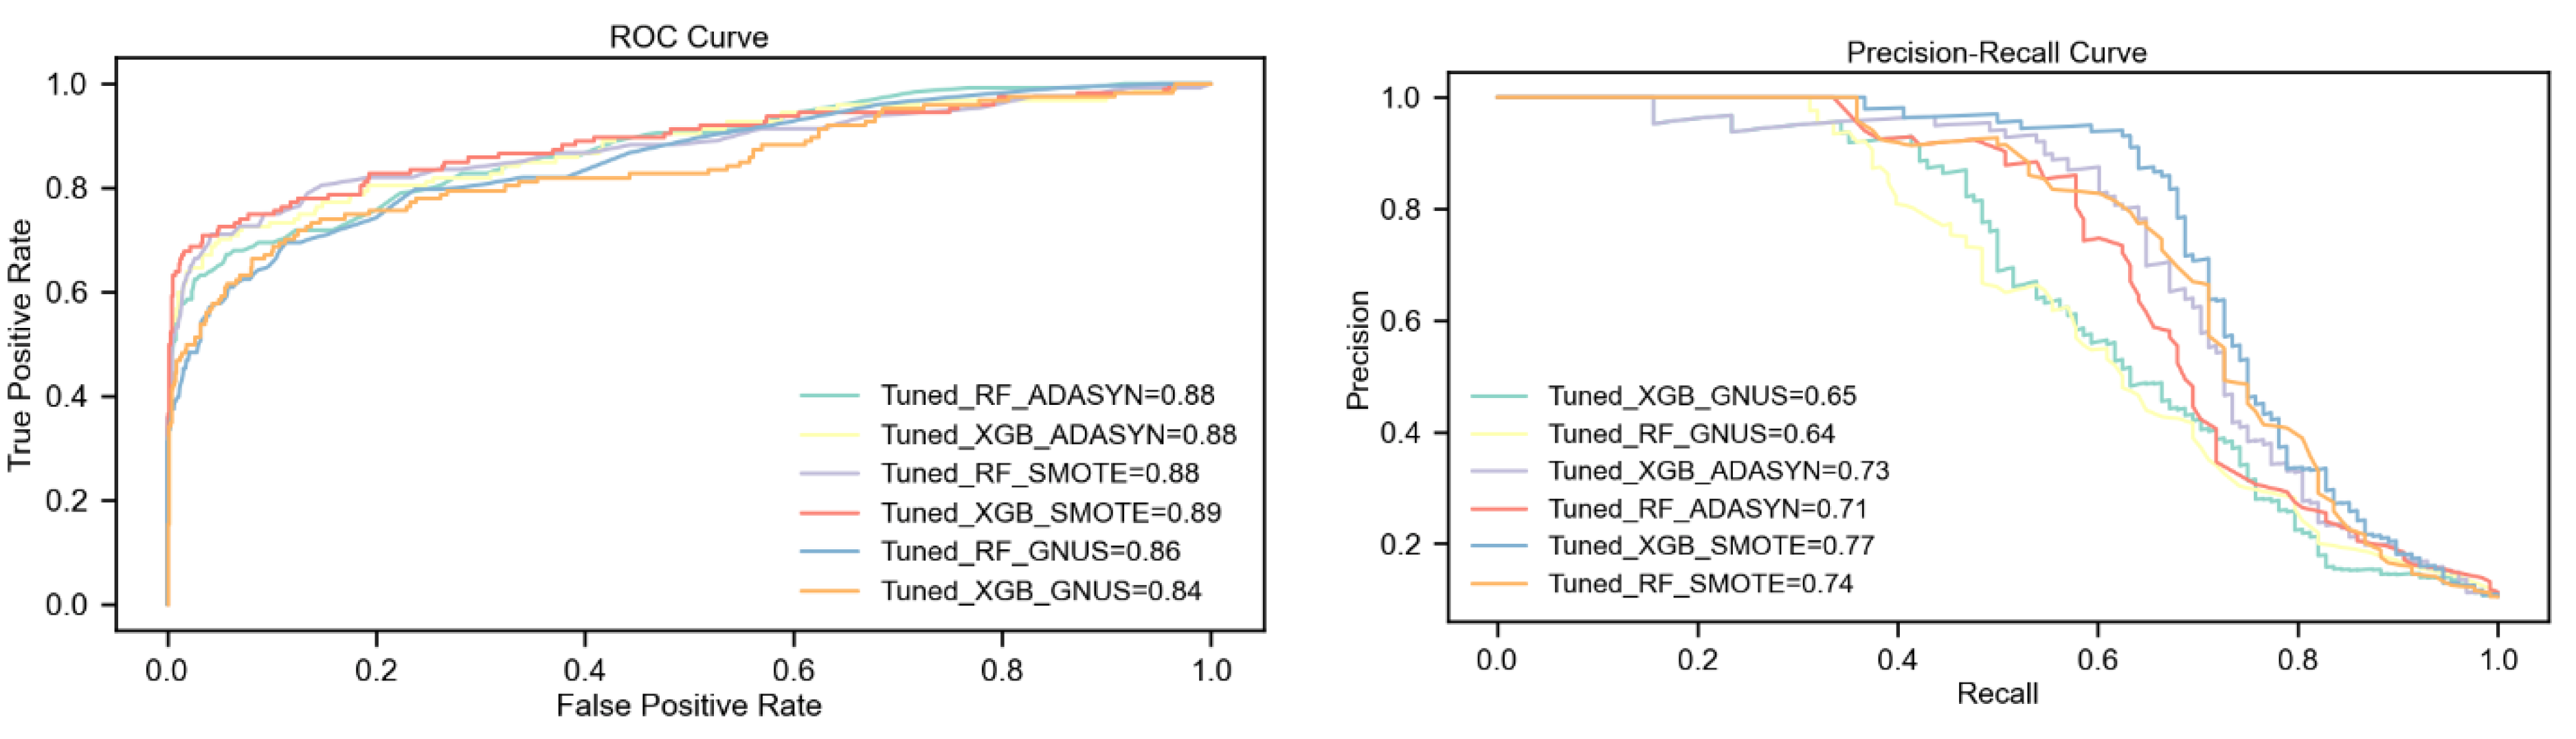
The analysis reveals that the tuned XGBoost model paired with SMOTE consistently achieves the highest performance across all metrics, including F1-Score, PR-AUC, Kappa, and MCC. SMOTE proves to be the most effective upsampling method, enabling XGBoost to significantly outperform Random Forest, particularly with a 7% higher F1-Score and 8% higher Kappa statistic.
With ADASYN, XGBoost maintains an advantage, achieving a 3% higher F1-Score and a slight improvement in PR-AUC over Random Forest. However, both models show equal ROC-AUC performance under this technique. GNUS, by contrast, favors Random Forest, which outperforms XGBoost in most metrics, highlighting GNUS's limited compatibility with XGBoost.
Overall, SMOTE-enhanced XGBoost emerges as the optimal approach for addressing class imbalance, consistently delivering the best results, as summarized in
Table 5 and illustrated in
Figure 5.
5.3. Results on DS3 with 5% Churn Ratio
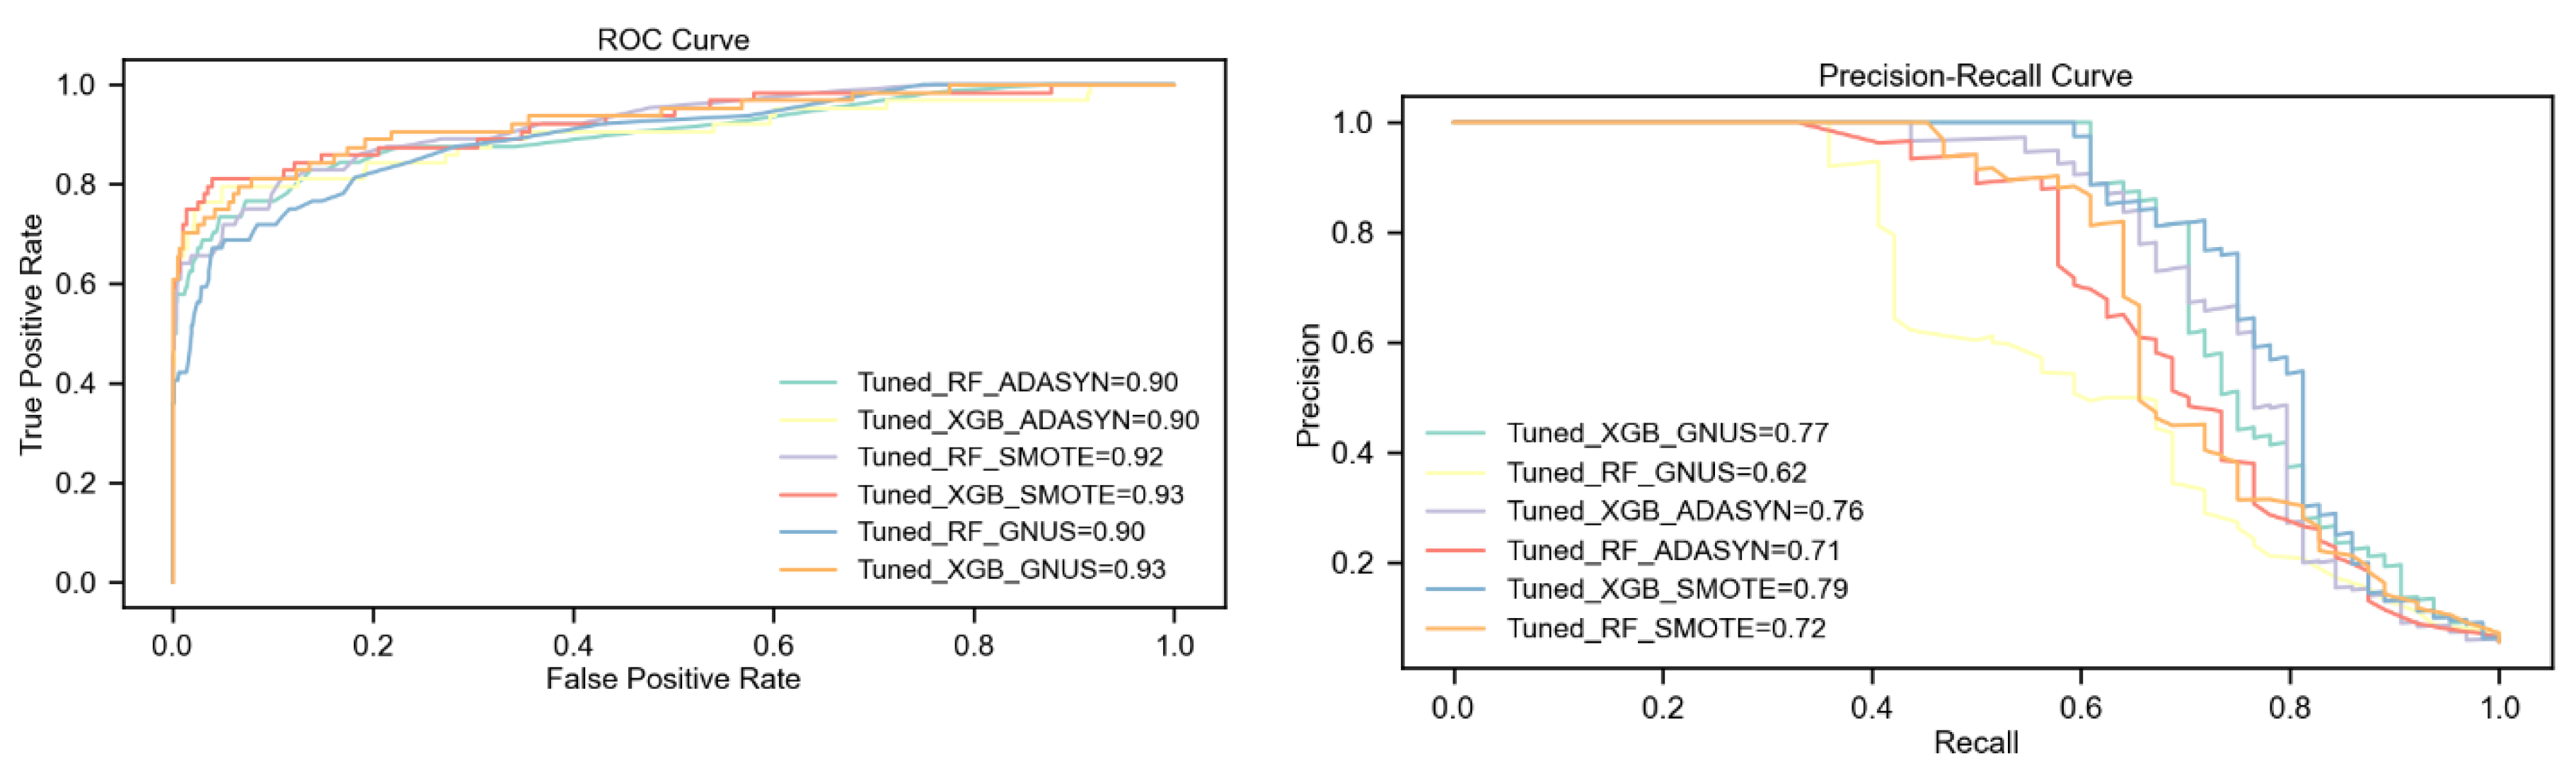
The analysis highlights the consistent superiority of the tuned XGBoost model over Random Forest across all upsampling techniques, particularly with SMOTE. Under SMOTE, XGBoost achieves the highest overall performance, including a 5% higher F1-Score (75%), a 7% higher PR-AUC (79%), and significant gains in Kappa and MCC (6% and 5%, respectively). This combination demonstrates the strong synergy between XGBoost's advanced learning capabilities and SMOTE's ability to generate effective synthetic samples.
With ADASYN, XGBoost outperforms Random Forest by 5% in F1-Score and PR-AUC, while both models achieve an equal ROC-AUC of 90%. Additionally, XGBoost shows notable improvements of 6% in Kappa and MCC, reflecting its stronger predictive reliability. GNUS reveals the largest performance gap, where XGBoost outshines Random Forest with an 11% higher F1-Score, a 15% improvement in PR-AUC, and double-digit gains in Kappa and MCC.
Overall, SMOTE emerges as the most effective upsampling technique, delivering the best results for both models, especially XGBoost. While ADASYN provides moderate benefits, GNUS proves less effective overall, though XGBoost demonstrates remarkable resilience under this technique. The combination of tuned XGBoost with SMOTE achieves the highest scores across all metrics, affirming its robustness and suitability for handling extreme class imbalance. Results are detailed in
Table 6 and illustrated in
Figure 6.
5.4. Results on DS4 with 1% Churn Ratio
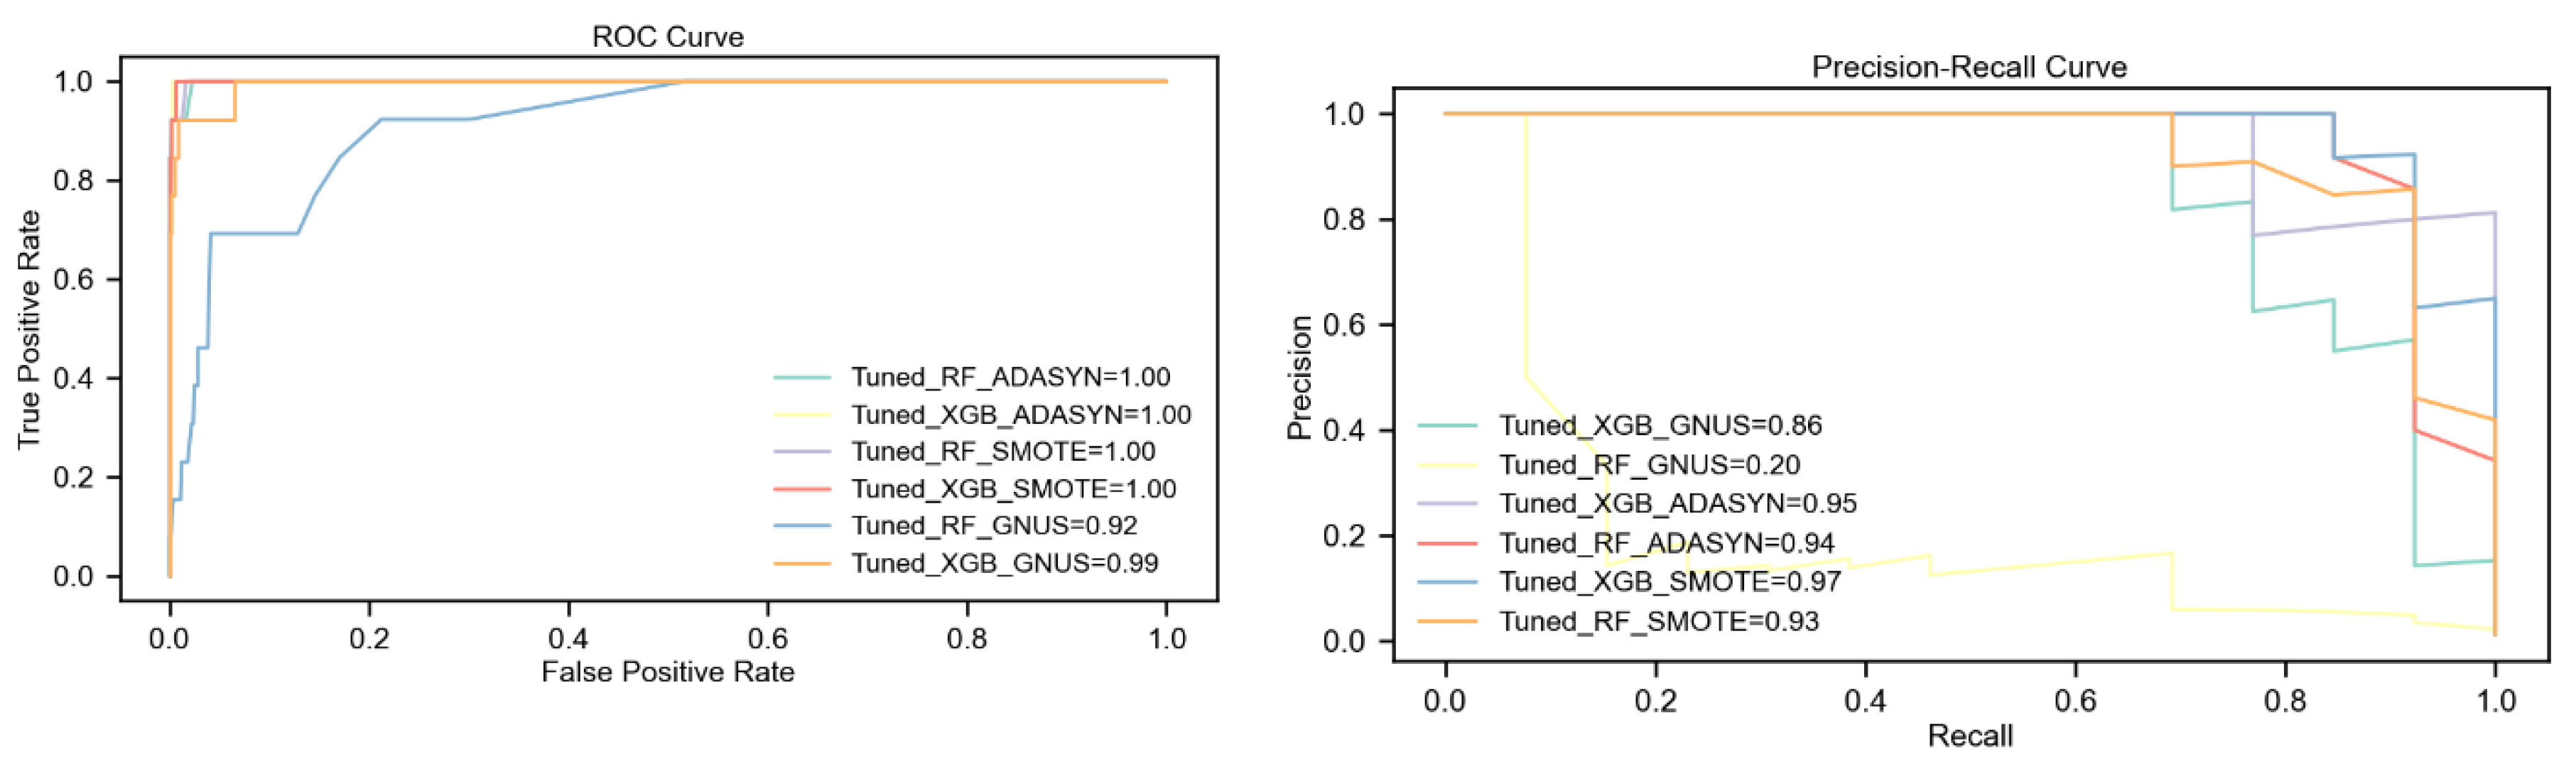
The evaluation highlights the tuned XGBoost model's remarkable superiority over Random Forest across all upsampling techniques, particularly in scenarios of extreme class imbalance. With ADASYN, XGBoost achieves significantly higher F1-Score and Kappa (80% vs. 47%) and a substantial 25-point advantage in MCC (80% vs. 55%), despite both models achieving a perfect ROC AUC of 100%. XGBoost also demonstrates a slight edge in PR AUC, scoring 95% compared to Random Forest's 94%.
SMOTE further amplifies the performance gap, with XGBoost reaching an F1-Score and Kappa of 92%, outperforming Random Forest by 36%. XGBoost also surpasses Random Forest in PR AUC by 4% (97% vs. 93%) and MCC by 30 points (92% vs. 62%), while maintaining a perfect ROC AUC of 100%. These results confirm the effectiveness of combining SMOTE with XGBoost in handling extreme class imbalance.
The largest performance differences emerge with GNUS. XGBoost achieves an F1-Score of 74%, 47% higher than Random Forest, and a PR AUC of 86%, vastly outperforming Random Forest's 20%. XGBoost also achieves a 41-point lead in MCC (74% vs. 33%) and a 7% higher ROC AUC (99% vs. 92%). These findings highlight XGBoost’s robustness, even under less effective upsampling methods like GNUS.
The results demonstrate that MCC and Kappa exhibit different sensitivity to extreme class imbalance depending on the model and resampling technique. While it is often assumed that MCC fluctuates more than Kappa, our experiments show that this depends on the specific model and dataset. For instance, in Tuned_RF_GNUS, MCC exhibits greater fluctuation in DS4 (1% churn), dropping from 55 to 33, while Kappa drops from 54 to 25. This aligns with MCC’s formulation, which is highly sensitive to class distribution distortions when the minority class becomes extremely small. However, in other models, such as Tuned_RF_ADASYN and Tuned_RF_SMOTE, Kappa fluctuates more than MCC, indicating that MCC is not universally more volatile. These findings suggest that the impact of imbalance on evaluation metrics is model-dependent, and both metrics must be interpreted carefully when dealing with extreme class imbalance.
Overall, SMOTE-enhanced XGBoost delivers the highest performance across all metrics, establishing itself as the most effective strategy for this dataset with a 1% churn rate. While ADASYN provides moderate improvements for XGBoost, it yields far lower results for Random Forest. GNUS is the least effective for Random Forest, but XGBoost consistently demonstrates resilience. The results, presented in
Table 7 and
Figure 7, emphasize the critical importance of pairing advanced models like XGBoost with effective upsampling techniques to address extreme class imbalance.
5.5. Analysis of Average Performance and Variability
Table 8 and
Table 9 provide a comprehensive analysis of the effectiveness and consistency of various machine learning models and upsampling techniques applied to datasets with differing churn ratios. These results reveal distinct patterns in both performance and variability, facilitating the identification of the most robust strategies for managing imbalanced datasets.
The data in
Table 8 highlights significant differences in model performance across various evaluation metrics. Tuned_XGB_SMOTE consistently achieves the highest average scores among all models, indicating superior effectiveness in handling imbalanced datasets with different churn ratios. Specifically, it attains the highest average F1-Score (77.25%), ROC-AUC (92.0%), PR-AUC (81.5%), Kappa (75.25%), and MCC (75.5%). This suggests that combining the XGBoost classifier with the SMOTE upsampling technique yields the most robust predictive performance.
In contrast, Tuned_RF_GNUS exhibits the lowest average performance across all metrics, with an average F1-Score of 51.25% and PR-AUC of 52.75%, indicating limited effectiveness in addressing class imbalance when using the Random Forest model with the GNUS upsampling method.
The other models, such as Tuned_XGB_ADASYN and Tuned_RF_SMOTE, show moderate performance, with Tuned_XGB_ADASYN being the second-best performer. This model achieves an average F1-Score of 71.0% and an average Kappa of 68.25%, suggesting that the XGBoost model combined with the ADASYN technique is also effective but less so than when paired with SMOTE.
Overall, the analysis underscores the importance of selecting appropriate combinations of machine learning algorithms and upsampling techniques. The superior performance of Tuned_XGB_SMOTE highlights its suitability as a robust strategy for managing imbalanced datasets, particularly in scenarios where predictive accuracy and reliability are critical.
The standard deviation is a key statistical measure that quantifies the extent of variation or dispersion within a numerical dataset. It reflects the average distance of individual data points from the dataset's mean, offering valuable insight into the overall variability of the data.
The calculation of standard deviation serves several important purposes in the context of machine learning model evaluation:
Assessing Consistency: Standard deviation helps gauge how consistently a model performs across different datasets by measuring the variability in its performance metrics.
Comparing Stability: Models with lower standard deviations exhibit more stable performance, indicating their reliability across varying datasets.
Identifying Variability: A high standard deviation reveals significant variability in model performance, which could be attributed to dataset characteristics or the sensitivity of the model to specific features or configurations.
This metric plays a critical role in understanding and comparing the robustness of machine learning models in diverse scenarios. The Standard Deviation is as follows:
: Sample standard deviation.
: Each individual data point in your dataset.
: The sample mean (average of your data points).
: The total number of data points in your sample.
: Degrees of freedom. Subtracting 1 accounts for the fact that we're estimating the population standard deviation from a sample.
Using the same methodology, we computed the standard deviations for all models and performance metrics. The results are summarized in the table below, providing a comprehensive view of the variability in model performance across different datasets. This table highlights the consistency and stability of each model, offering insights into their robustness and reliability.
XGBoost emerges as the most effective model overall, consistently outperforming Random Forest in both average metrics and adaptability. Among the configurations, XGBoost combined with SMOTE demonstrated the highest average performance across all datasets, achieving exceptional scores such as an F1-Score of 77.25% and a PR-AUC of 81.5%. This combination excelled at balancing precision and recall while maintaining strong reliability in predictions, as reflected in its high Kappa and MCC values. The slightly higher average ROC-AUC of 92.0% further reinforced its superior ability to distinguish between churners and non-churners. However, this strong performance came with notable variability, particularly in metrics like F1-Score and Kappa, indicating sensitivity to the degree of class imbalance.
When paired with ADASYN, XGBoost also delivered impressive results, with an average F1-Score of 71.0% and PR-AUC of 79.0%. Although slightly less effective than SMOTE, ADASYN provided more consistent outcomes, as evidenced by its lower standard deviations. This stability suggests that ADASYN's approach to generating synthetic samples creates reliable improvements across datasets with varying churn rates.
In contrast, the GNUS upsampling technique proved to be less effective for both models, though XGBoost managed to perform reasonably well, with an average F1-Score of 64.75% and PR-AUC of 74.0%. Random Forest struggled the most with GNUS, achieving an average F1-Score of only 51.25% and a PR-AUC of 52.75%. These results indicate that GNUS was insufficient in generating the diversity and representativeness needed to enhance learning from the minority class, particularly for Random Forest. Furthermore, GNUS exhibited the highest variability in performance metrics, such as PR-AUC and F1-Score, underscoring its inconsistency across datasets.
Random Forest's performance was comparatively more stable when combined with SMOTE or ADASYN. SMOTE helped Random Forest achieve better average metrics, such as an F1-Score of 64.25% and a PR-AUC of 76.5%. However, even in this configuration, it fell short of XGBoost’s performance, highlighting the limitations of Random Forest in handling complex class imbalance scenarios. The relatively low variability in Random Forest’s results with SMOTE indicates that it benefited from the upsampling technique’s ability to generate more representative minority class samples, albeit with less overall effectiveness than XGBoost.
The standard deviations further illuminate these trends, revealing that XGBoost with SMOTE, while achieving the best average performance, exhibited greater variability, particularly under extreme imbalance conditions. This variability suggests that the model’s performance is highly dynamic, with significant gains in challenging scenarios. By contrast, XGBoost with ADASYN delivered more consistent but slightly lower performance, making it a reliable alternative for cases where stability is prioritized.
The contrast between the models is particularly striking in their ability to handle GNUS. Random Forest showed significant declines in performance and higher variability, reflecting its inability to generalize effectively from GNUS-generated samples. On the other hand, XGBoost demonstrated adaptability, leveraging even the limited benefits of GNUS to achieve better predictions, though not at the levels seen with SMOTE or ADASYN.
In summary, the analysis highlights the clear advantage of XGBoost in handling imbalanced datasets, especially when paired with SMOTE. While SMOTE provided the highest overall performance, ADASYN emerged as a more stable alternative. GNUS, on the other hand, proved less effective and highly variable, particularly for Random Forest. These findings emphasize the importance of selecting the right combination of model and upsampling technique to address class imbalance effectively. The consistent superiority of XGBoost, combined with its adaptability to challenging conditions, underscores its value as a robust solution for predictive modeling in imbalanced scenarios.
5.6. Statistical Tests
In our investigation, we embarked on a comprehensive comparison of six models evaluated across four distinct datasets and measured by five different performance metrics. To discern whether the differences we observed were truly reflective of each model’s performance—or merely artifacts of chance—we embraced a non-parametric approach, beginning with the Friedman test. This test was particularly appealing because it is well-suited for scenarios where more than two algorithms are compared, such as our case, where we explored various combinations of Random Forest and XGBoost, each paired with different upsampling methods [
84,
85].
5.6.1. Friedman Test
Given that each model was evaluated across the same four datasets, their results were inherently correlated. Consequently, the Friedman test was chosen as the most appropriate method, as it effectively accounts for repeated-measures designs. Moreover, our chosen performance metrics—F1-score, ROC-AUC, PR-AUC, Cohen’s Kappa, and MCC—do not always conform to a normal distribution, especially given the limited number of datasets at our disposal. This non-parametric, rank-based procedure thus offered a robust alternative to more traditional methods that assume normality and homogeneity of variances.
Our analysis unfolded as a systematic narrative. We began by selecting a specific metric, say the F1-score, and organizing the data into a table that represented the performance of each model across the four datasets. For each dataset, we assigned ranks to the models, with a rank of 1 indicating the best performance and a rank of 6 representing the poorest. With these rankings in hand, we computed the average rank for each model and derived the Friedman statistic, which in turn yielded a p-value to indicate whether any model consistently outperformed the rest.
When the Friedman test revealed a significant overall difference (p < 0.05), we proceeded with the Nemenyi post-hoc test. This step allowed us to delve deeper, comparing each pair of models to pinpoint where the significant differences lay. By following this rigorous workflow for each metric, we ensured that our conclusions about model performance were based on statistically sound evidence rather than on mere chance.
In summary, our methodical use of the Friedman and Nemenyi tests provided a clear, data-driven narrative that allowed us to confidently interpret the performance differences observed across multiple datasets. This approach not only highlights the strengths and weaknesses of each model but also reinforces the reliability of our conclusions regarding their comparative effectiveness. The Friedman test statistic is computed using the following mathematical formulation:
Given:
Degrees of freedom = .
The resulting statistic is approximately distributed as a Chi-square () for moderate N.
The table below presents the F1-score rankings for each model across the datasets, where the best performance is assigned a rank of 1. It is important to note that in DS3, a tie occurred between Tuned_XGB_ADASYN (70) and Tuned_RF_SMOTE (70), with each receiving a rank of 2.5. Similarly, in DS1, a tie between Tuned_RF_GNUS (61) and Tuned_XGB_GNUS (61) resulted in both models being assigned a rank of 5.5.
Table 10.
Ranking F1-score per Dataset (Best = rank 1).
Table 10.
Ranking F1-score per Dataset (Best = rank 1).
| Models/Datasets |
DS1 |
DS2 |
DS3 |
DS4 |
| Tuned_RF_ADASYN |
4 |
3 |
5 |
5 |
| Tuned_XGB_ADASYN |
3 |
2 |
2.5 |
2 |
| Tuned_RF_SMOTE |
2 |
4 |
2.5 |
4 |
| Tuned_XGB_SMOTE |
1 |
1 |
1 |
1 |
| Tuned_RF_GNUS |
5.5 |
5 |
6 |
6 |
| Tuned_XGB_GNUS |
5.5 |
6 |
4 |
3 |
Subsequently, we computed both the sum and the average of the ranks. For instance, consider the model Tuned_RF_ADASYN evaluated on the F1-score metric across four datasets. The ranks obtained were 4, 3, 5, and 5, which sum to 17, resulting in an average rank of 4.25. Employing this same procedure, we calculated the average ranks for all other metrics and models across the four datasets, as summarized in the table below:
Table 11.
The average ranks for all other metrics and models across the four datasets.
Table 11.
The average ranks for all other metrics and models across the four datasets.
| |
Average Ranks (from the Friedman Step) |
| Models/Metrics |
F1-Score |
PR-AUC |
Kappa |
MCC |
| Tuned_RF_ADASYN |
4.25 |
4.375 |
4.375 |
4.375 |
| Tuned_XGB_ADASYN |
2.375 |
2.5 |
2.625 |
3.125 |
| Tuned_RF_SMOTE |
3.125 |
3.5 |
3 |
2.875 |
| Tuned_XGB_SMOTE |
1 |
1 |
1 |
1 |
| Tuned_RF_GNUS |
5.625 |
5.875 |
5.375 |
5.375 |
| Tuned_XGB_GNUS |
4.625 |
3.75 |
4.625 |
4.25 |
Now in this step we calculate Friedman Statistic result for F1-score based on above formula:
Degrees of freedom = 5 (since ).
We computed the Friedman test statistic (=16.0) with five degrees of freedom—reflecting the number of models minus one—and compared it to the Chi-square distribution. The value of 16.0 lies between the critical values for p=0.01 and p=0.005 for five degrees of freedom, indicating a p-value between these thresholds. Further refinement using statistical software yielded an approximate p-value of 0.007. This result implies that the likelihood of observing such a statistic by chance is below 1%, thereby providing sufficient evidence to reject the null hypothesis at the 5% significance level. Using the same procedure, we derived the Friedman test outcomes and corresponding approximate p-values for all metrics, as summarized in the table below:
As illustrated in the table above, the Friedman test reveals statistically significant differences among the six models for F1, PR-AUC, Kappa, and MCC at the 5% level. In contrast, the ROC-AUC metric does not reach significance (p ≈ 0.08), leading us to retain the null hypothesis for this measure. Consequently, a post-hoc analysis will be conducted to identify the specific model differences for the metrics that exhibit overall significance.
5.6.2. Post-Hoc Analysis
This section provides an overview of our post-hoc analysis utilizing the Nemenyi test, which was conducted on the metrics that exhibited significant differences in the Friedman test. The analysis begins by ranking the models on each dataset—assigning a rank of 1 for the best performance and 6 for the worst. We then compute the average rank for each model across all datasets. Next, we calculate the Critical Difference (CD) at a significance level of
. For
models and
datasets, the CD for Nemenyi is given by:
where
represents the critical value from the Studentized range distribution for k groups at the chosen significance level
,
is the number of models, and
is the number of datasets. Finally, we compare the absolute differences in average ranks between each pair of models to the CD; if for model
and model
then the difference meets or exceeds the CD, the pair is considered significantly different at
. For our analysis, with six models and four datasets, the approximate CD is 3.80.
By applying the Nemenyi post-hoc procedure to the results presented in
Table 12, we observed that, among the evaluated metrics—F1-score, PR-AUC, Cohen’s Kappa, and MCC—only the comparison between Tuned_XGB_SMOTE and Tuned_RF_GNUS yielded a critical difference (CD) of 3.8 or greater. In essence, for every metric where the Friedman test signaled statistically significant differences (with the exception of ROC-AUC), the only pair of models that demonstrated a statistically significant difference at the conventional α = 0.05 level was that between Tuned_XGB_SMOTE and Tuned_RF_GNUS.
Although the comparisons between Tuned_XGB_SMOTE and both Tuned_XGB_GNUS and Tuned_RF_ADASYN approached the critical difference threshold (CD ≈ 3.80), they ultimately did not meet the criteria for significance. Under the strict binary decision rule of the Nemenyi test, these pairs are formally deemed non-significant, even though their proximity to the threshold suggests a potential trend favoring Tuned_XGB_SMOTE.
In terms of model performance, Tuned_XGB_SMOTE frequently achieved the highest average ranks across the datasets, establishing it as the dominant model. However, given our limited sample of four datasets, it was only statistically superior to Tuned_RF_GNUS. Conversely, Tuned_RF_GNUS consistently ranked near the bottom, and the post-hoc analysis confirmed that its performance gap with Tuned_XGB_SMOTE was indeed significant.
It is important to acknowledge that the relatively small number of datasets contributes to a larger critical difference, and with a larger sample size, additional significant differences might emerge. Moreover, while this study focuses on customer churn prediction—a domain that, although important, may not be as critical as sectors such as healthcare or finance—we have adhered to the conventional significance level of α = 0.05. For applications in industries with higher stakes, such as healthcare, it may be prudent to recalculate the significance using a more stringent threshold (e.g., α = 0.01 or α = 0.001) to mitigate the risk of false positives that could result in costly or unsafe outcomes.
5.7. Overall Comparison and Analysis
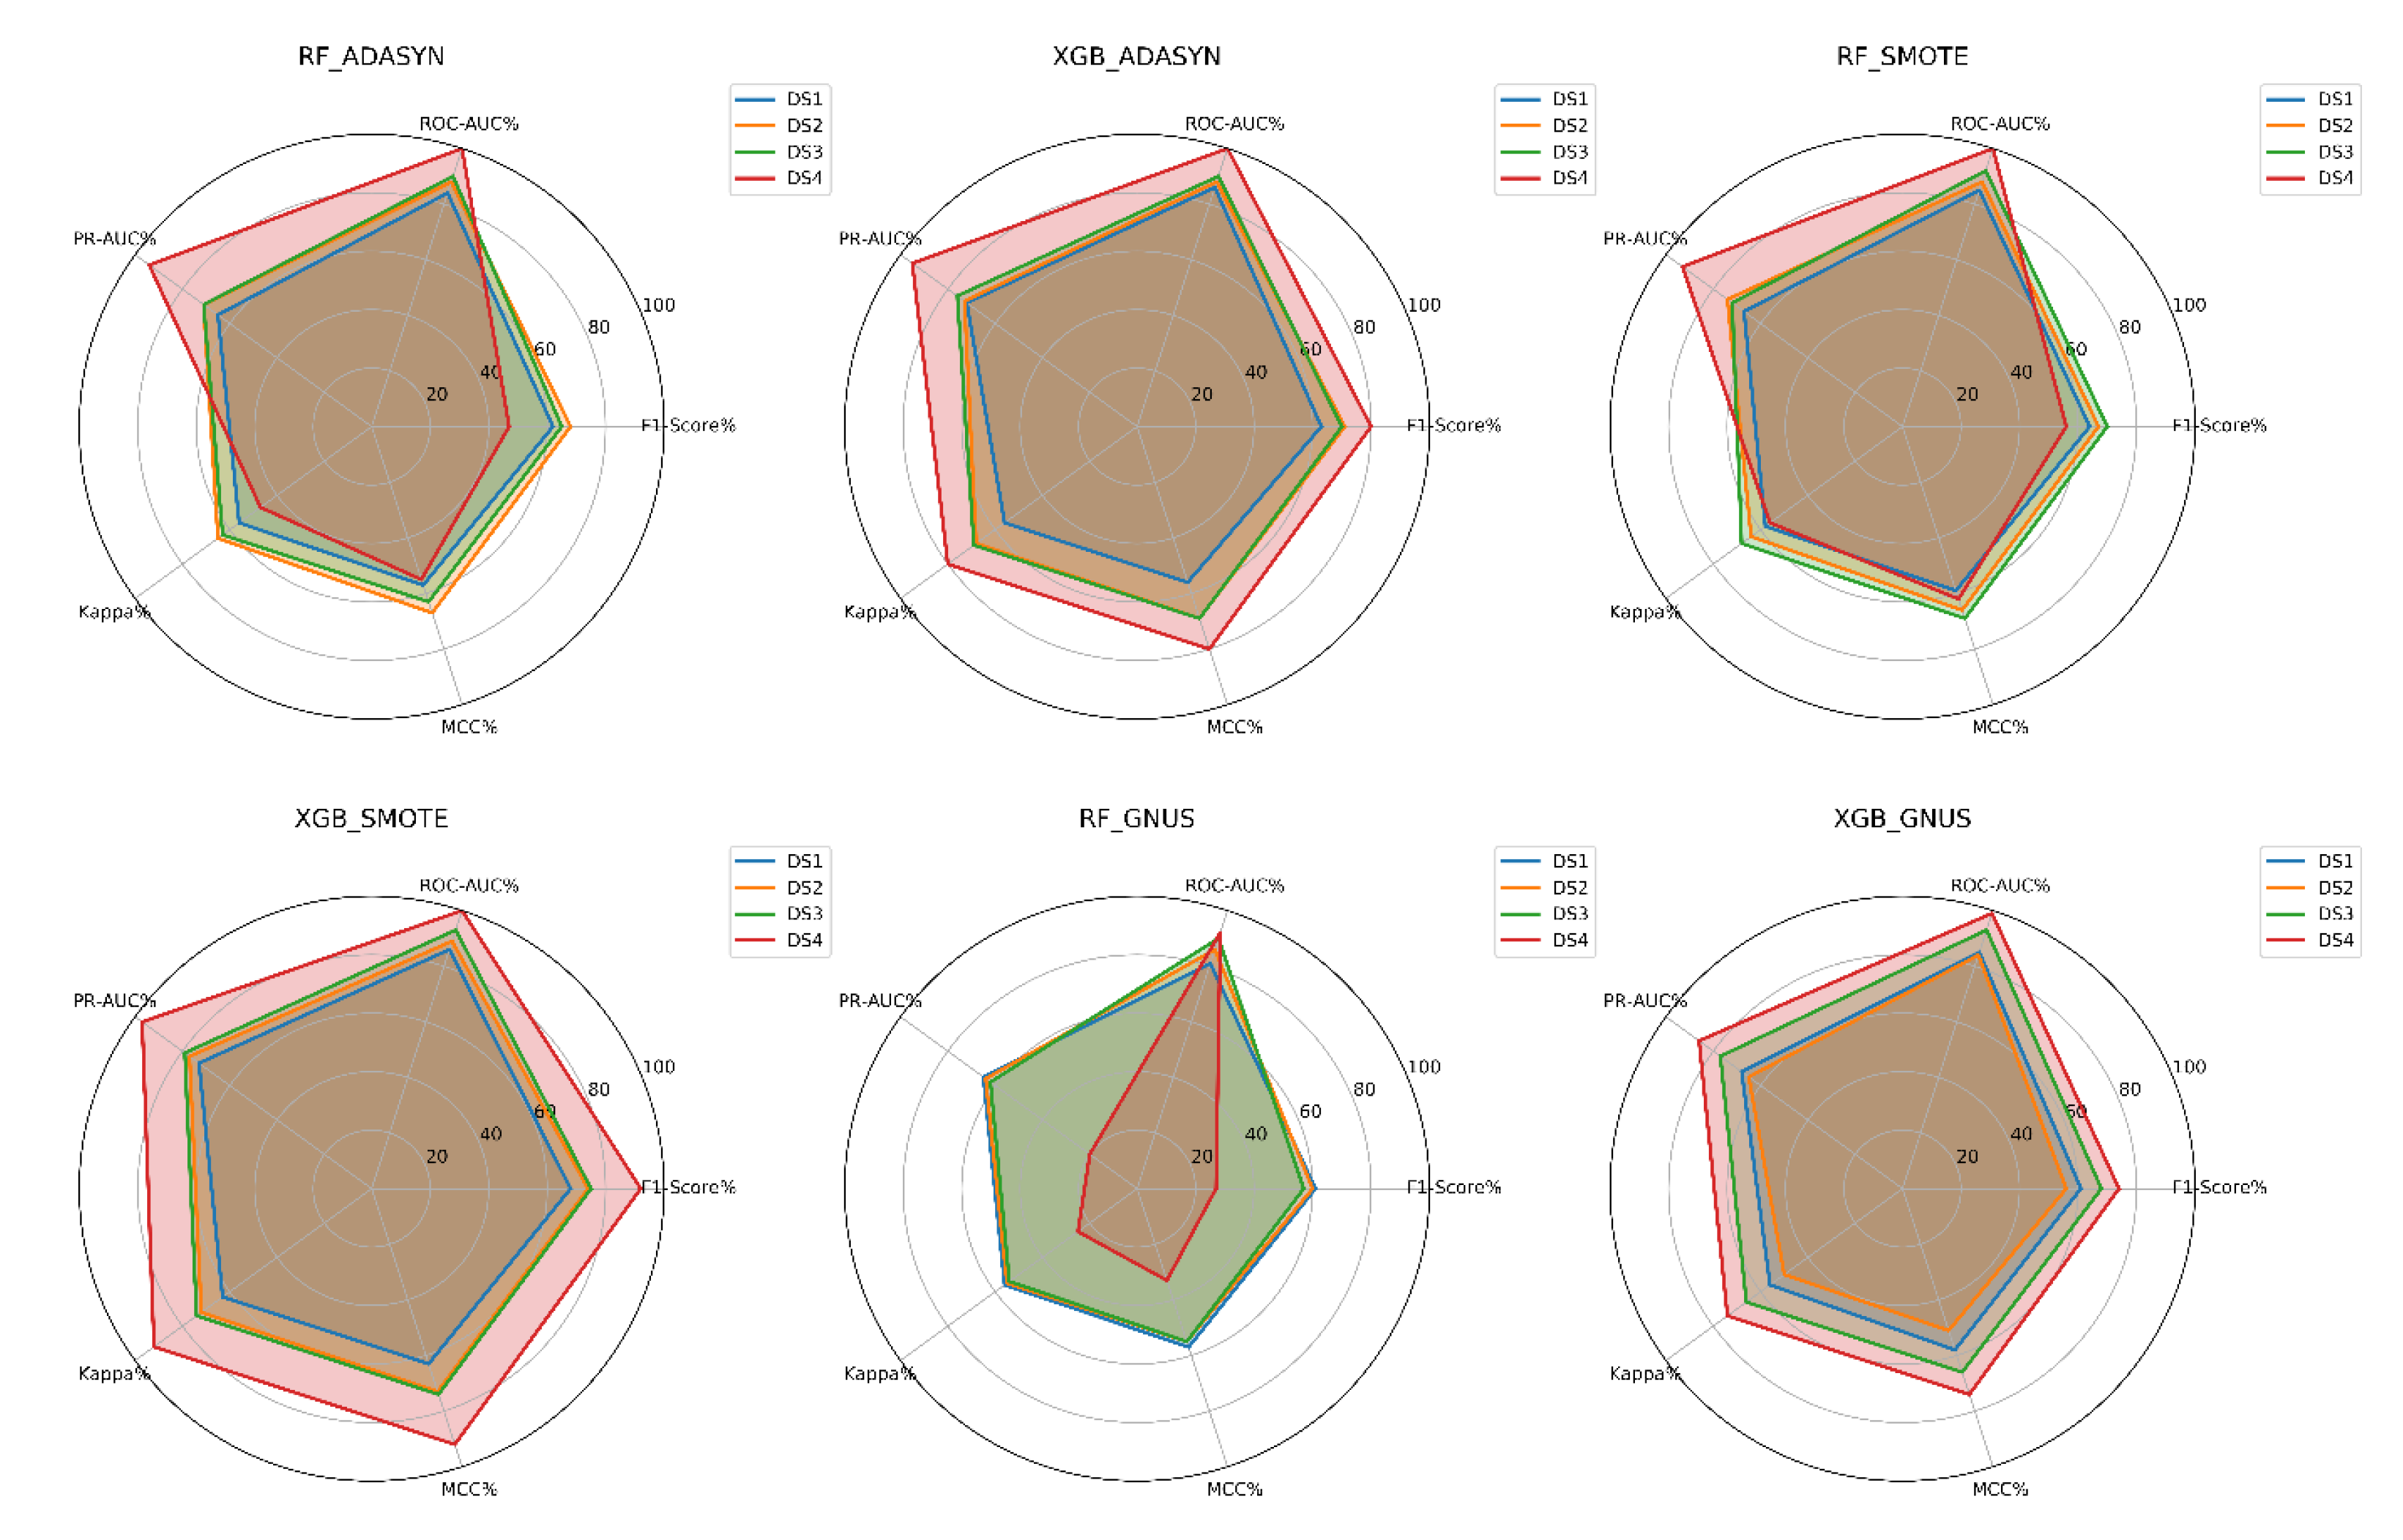
The results presented in the below Table and Figure provide valuable insights into the performance and reliability of different machine learning models and upsampling techniques across datasets with churn ratios ranging from 15% to 1%.
Table 13.
The summary of all models' performance on four datasets.
Table 13.
The summary of all models' performance on four datasets.
| Models/Metrics |
F1-Score% |
ROC-AUC% |
PR-AUC% |
Kappa% |
MCC% |
F1-Score% |
ROC-AUC% |
PR-AUC% |
Kappa% |
MCC% |
| |
DS 1 (15% churn) |
DS 2 (10% churn) |
| Tuned_RF_ADASYN |
62 |
84 |
65 |
56 |
57 |
68 |
88 |
71 |
65 |
67 |
| Tuned_XGB_ADASYN |
63 |
86 |
72 |
56 |
56 |
71 |
88 |
73 |
68 |
69 |
| Tuned_RF_SMOTE |
64 |
85 |
67 |
58 |
59 |
67 |
88 |
74 |
64 |
66 |
| Tuned_XGB_SMOTE |
68 |
86 |
73 |
63 |
63 |
74 |
89 |
77 |
72 |
73 |
| Tuned_RF_GNUS |
61 |
81 |
65 |
56 |
57 |
60 |
86 |
64 |
55 |
55 |
| Tuned_XGB_GNUS |
61 |
85 |
68 |
56 |
58 |
56 |
84 |
65 |
50 |
51 |
| |
DS 3 (5% churn) |
DS 4 (1% churn) |
| Tuned_RF_ADASYN |
65 |
90 |
71 |
63 |
63 |
47 |
100 |
94 |
47 |
55 |
| Tuned_XGB_ADASYN |
70 |
90 |
76 |
69 |
69 |
80 |
100 |
95 |
80 |
80 |
| Tuned_RF_SMOTE |
70 |
92 |
72 |
68 |
69 |
56 |
100 |
93 |
55 |
62 |
| Tuned_XGB_SMOTE |
75 |
93 |
79 |
74 |
74 |
92 |
100 |
97 |
92 |
92 |
| Tuned_RF_GNUS |
57 |
90 |
62 |
54 |
55 |
27 |
92 |
20 |
25 |
33 |
| Tuned_XGB_GNUS |
68 |
93 |
77 |
66 |
66 |
74 |
99 |
86 |
74 |
74 |
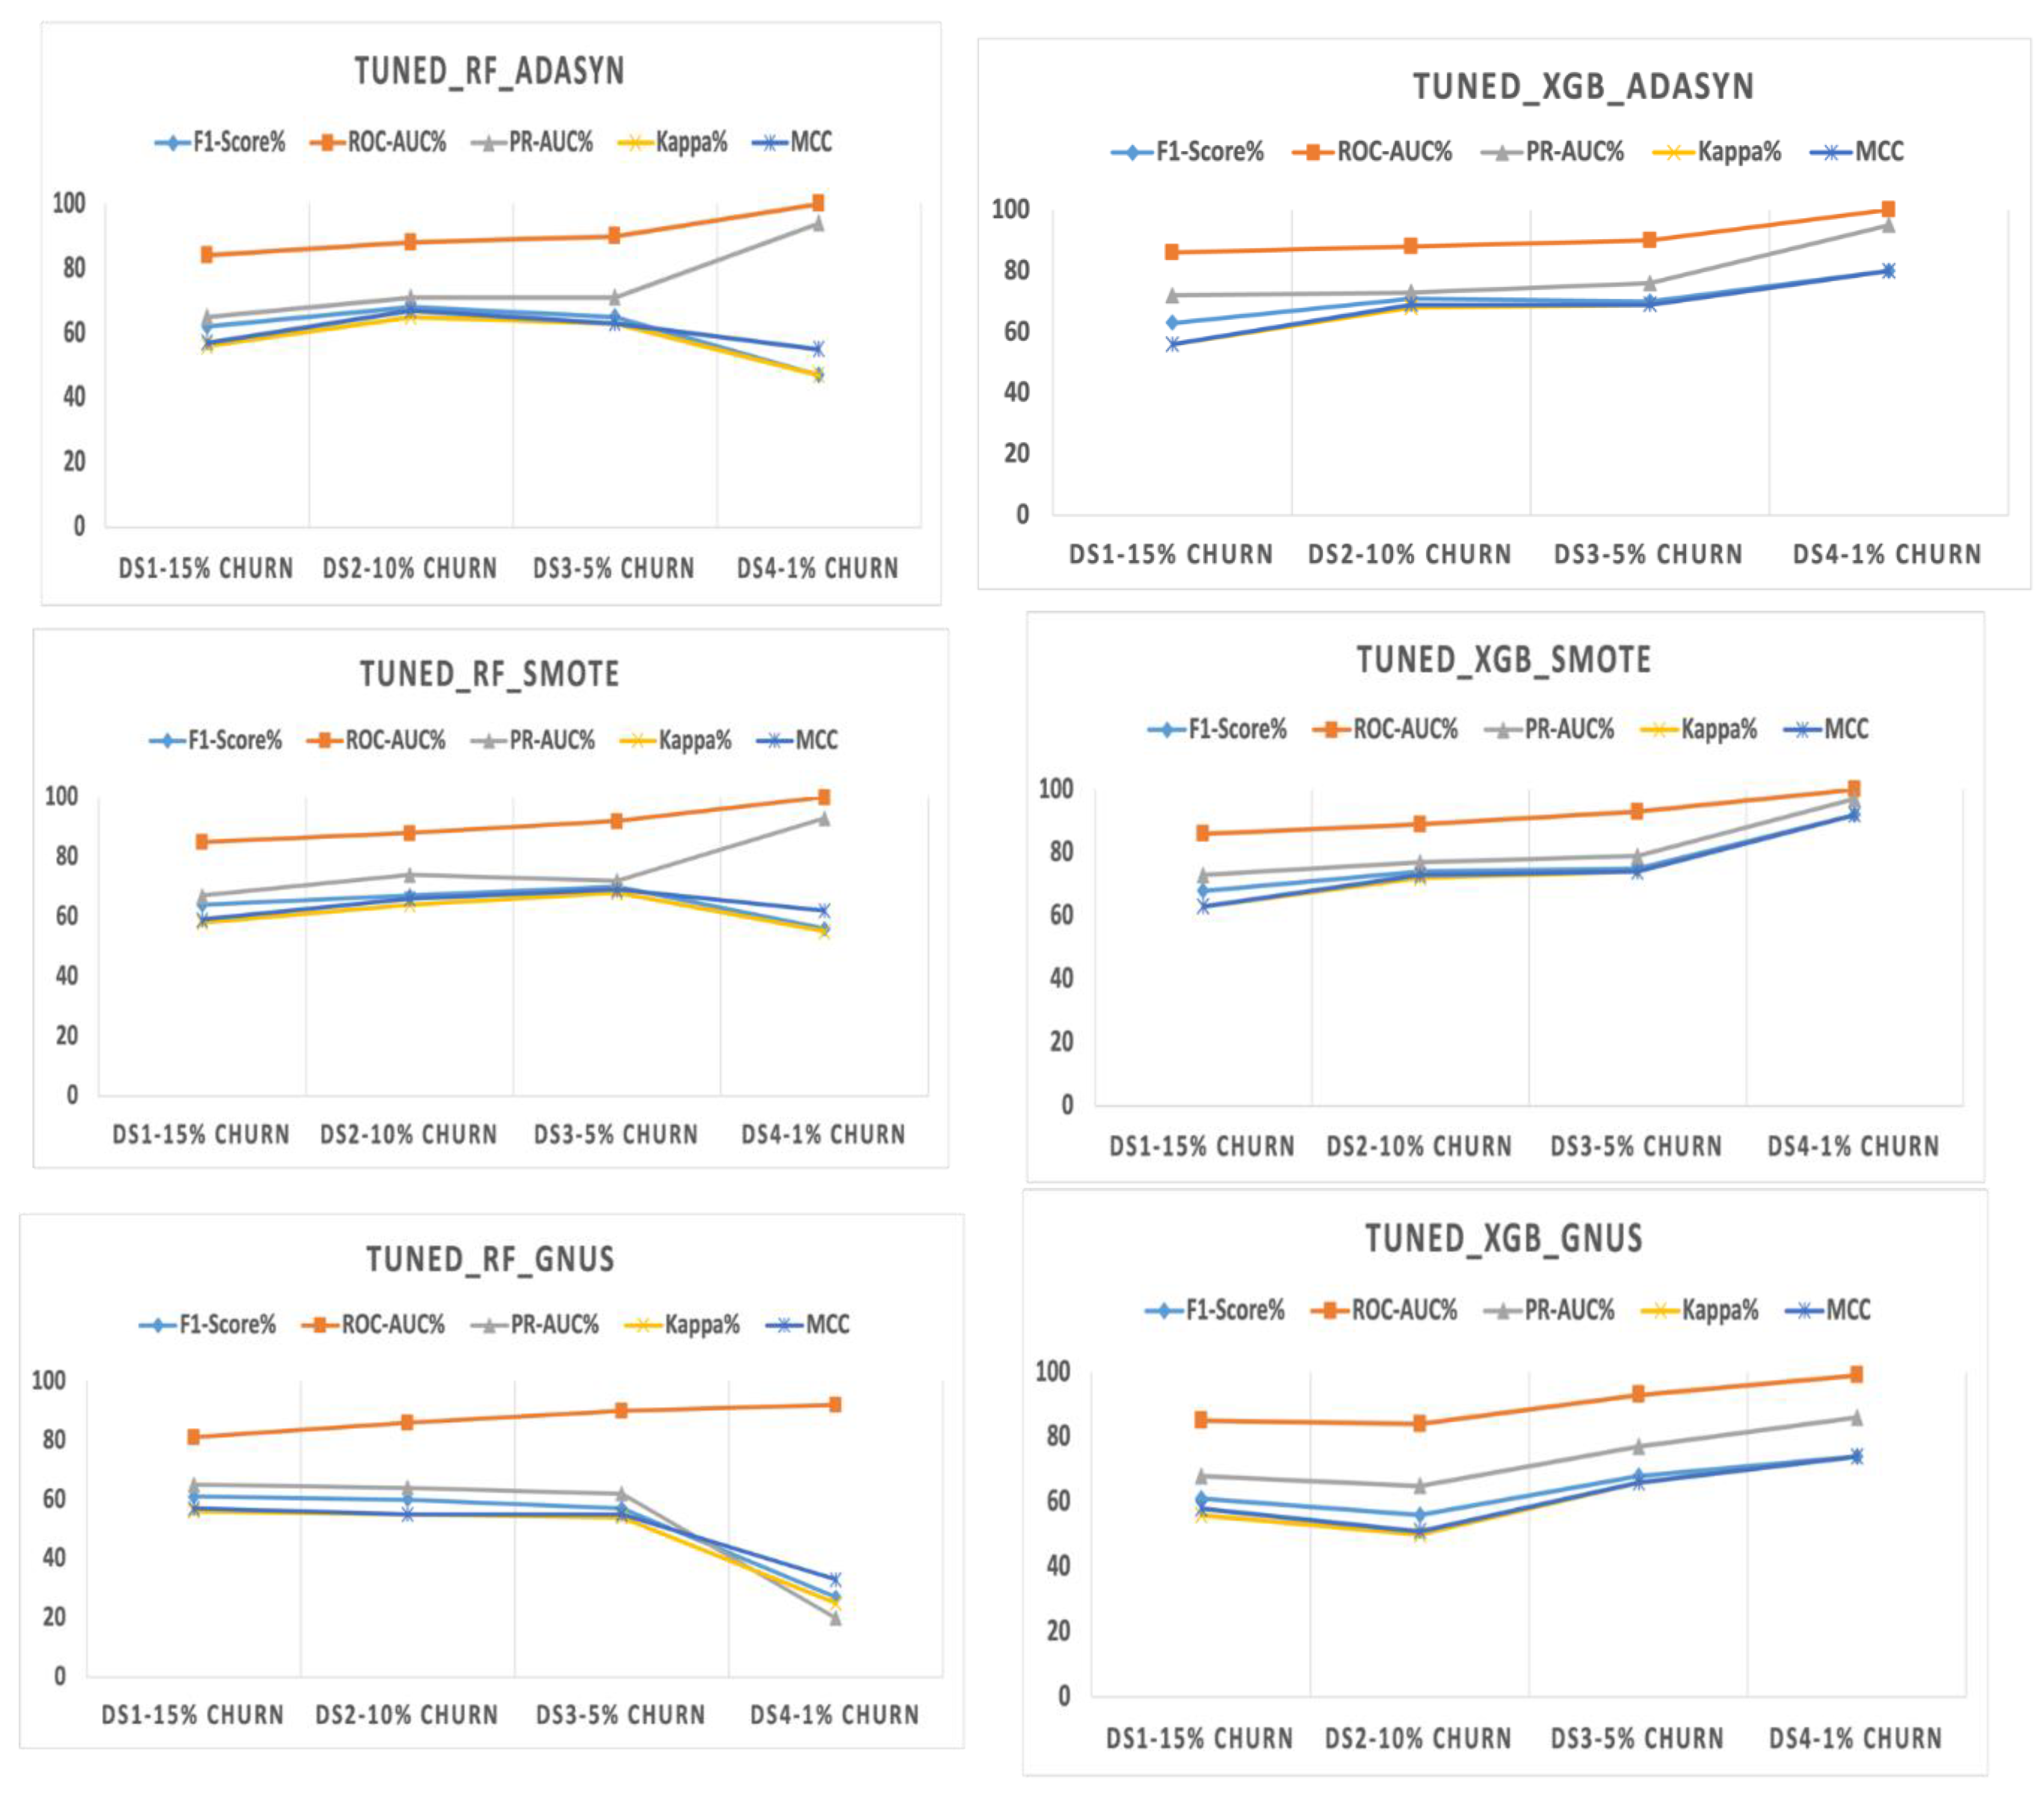
Figure 8.
The performance of the models with upsampling techniques on datasets with different levels of imbalance.
Figure 8.
The performance of the models with upsampling techniques on datasets with different levels of imbalance.
The evaluation of machine learning models and upsampling techniques across datasets with varying churn rates provides valuable insights into addressing class imbalance. By analyzing Random Forest and XGBoost models paired with SMOTE, ADASYN, and GNUS across datasets with churn rates of 15%, 10%, 5%, and 1%, this study sheds light on how model performance evolves under increasing imbalance. Key performance metrics such as F1-Score, ROC-AUC, PR-AUC, Kappa, and MCC were examined to reveal critical patterns.
When ADASYN was applied, XGBoost demonstrated a remarkable ability to maintain and even enhance its performance as churn rates decreased. For example, in the dataset with a 1% churn rate, XGBoost achieved an F1-Score and Kappa of 80%, alongside a perfect ROC-AUC of 100%. This improvement suggests that ADASYN’s synthetic samples effectively enhanced XGBoost’s capacity to learn meaningful patterns from the minority class. In contrast, Random Forest struggled under extreme imbalance. While it also achieved a perfect ROC-AUC at 1% churn, its F1-Score dropped to 47%, indicating that the model’s predictions were skewed toward the majority class. This discrepancy highlights the limitations of relying solely on ROC-AUC in highly imbalanced datasets, as it can obscure deficiencies in minority class prediction.
SMOTE emerged as a particularly powerful technique, especially when paired with XGBoost. As the churn rate decreased, XGBoost consistently improved its performance, reaching an F1-Score and Kappa of 92% in the 1% churn dataset. These results underline the strong synergy between SMOTE's synthetic data generation and XGBoost's advanced learning algorithms. The model effectively leveraged the enriched training data to improve precision, recall, and overall reliability, even under extreme imbalance. Random Forest, while more robust with SMOTE than ADASYN, showed limitations in handling severe imbalance. At a 1% churn rate, its F1-Score fell to 56%, reflecting difficulties in balancing precision and recall under such conditions.
GNUS presented a mixed picture. For Random Forest, performance metrics such as F1-Score and PR-AUC plummeted as imbalance intensified. At a 1% churn rate, the F1-Score dropped to 27%, and the PR-AUC to just 20%, indicating that the model struggled to effectively use GNUS-generated synthetic samples. In contrast, XGBoost showed notable adaptability, improving its metrics as churn rates decreased. At 1% churn, XGBoost achieved an F1-Score of 74% and a PR-AUC of 86%. This divergence suggests that GNUS, while less effective than SMOTE or ADASYN, still provided some benefit when combined with XGBoost's advanced algorithms.
Overall, XGBoost consistently outperformed Random Forest across all upsampling techniques and churn rates. Its ability to generalize and adapt to extreme imbalance set it apart, particularly when paired with SMOTE. While Random Forest demonstrated resilience in moderately imbalanced datasets, its performance declined significantly under extreme imbalance, especially with GNUS. Moreover, the Friedman test identified statistically significant differences (p < 0.05) in key performance metrics, including F1-Score, PR-AUC, Kappa, and MCC, among the evaluated models. Additionally, the Nemenyi test confirmed that Tuned_XGB_SMOTE demonstrated a statistically significant performance advantage over Tuned_RF_GNUS.
These findings emphasize the importance of selecting appropriate metrics and techniques for evaluating imbalanced datasets. Metrics like F1-Score, PR-AUC, Kappa, and MCC offered a more nuanced view of model performance than ROC-AUC alone, which often overstated a model’s ability to predict minority class instances. Moreover, the results highlight the critical role of upsampling techniques in mitigating imbalance. SMOTE proved the most effective, providing consistently strong results, particularly for XGBoost. ADASYN delivered moderate improvements but struggled under extreme imbalance, while GNUS was the least effective overall, though it showed some promise when paired with XGBoost.
The superior performance of XGBoost over Random Forest, particularly under extreme class imbalance, can be attributed to fundamental differences in their learning mechanisms. XGBoost employs gradient boosting, where trees are trained sequentially, with each iteration correcting errors from the previous one. This iterative learning process enables XGBoost to focus more on misclassified minority class instances, dynamically adjusting its decision boundaries. In contrast, Random Forest constructs independent decision trees in parallel, aggregating their outputs through majority voting. While this approach enhances model stability, it does not inherently prioritize learning from the minority class, making it less effective in highly imbalanced datasets.
The interaction between SMOTE and model training strategies further explains this performance gap. Since SMOTE-generated samples are interpolations of existing minority class instances, XGBoost’s iterative framework refines decision boundaries at each boosting step, helping the model make better use of synthetic samples. Random Forest, on the other hand, treats synthetic samples equally with original data but lacks a mechanism to adjust decision boundaries dynamically, reducing its effectiveness in learning from synthetic minority examples.
Additionally, XGBoost benefits from L1 (Lasso) and L2 (Ridge) regularization, preventing overfitting to synthetic samples while preserving model generalization. Random Forest, lacking explicit regularization beyond bootstrapping, may overfit or struggle with synthetic minority instances. Furthermore, XGBoost’s gradient-based split selection enhances its ability to separate minority instances, whereas Random Forest relies on static criteria like Gini impurity or entropy, which are less adaptive to imbalanced data distributions.
Ultimately, XGBoost’s ability to iteratively adjust for class imbalance, adaptively weight instances, and refine decision boundaries allows it to outperform Random Forest, particularly in datasets where SMOTE-generated synthetic samples play a critical role in balancing class representation.
In conclusion, the combination of tuned XGBoost with SMOTE emerged as the most effective strategy for imbalanced datasets, achieving the highest scores across all evaluation metrics. This approach’s success underscores the importance of leveraging advanced algorithms and effective upsampling methods to address the challenges posed by class imbalance. These findings provide valuable guidance for practitioners in churn prediction and similar classification tasks, demonstrating the potential to achieve reliable and accurate predictions even under challenging conditions of extreme imbalance.
5.8. Results Summary
The analysis reveals that Tuned XGBoost models, when paired with SMOTE or ADASYN upsampling techniques, consistently deliver the best predictive performance for customer churn across datasets with varying levels of imbalance (churn rates ranging from 15% to 1%), as depicted in
Figure 9. These combinations achieve high scores across key metrics, including F1-Score, ROC-AUC, PR-AUC, Cohen's Kappa, and MCC, demonstrating exceptional robustness and adaptability even in scenarios of extreme imbalance.
In contrast, Tuned Random Forest models exhibit satisfactory performance under moderate imbalance conditions but show a marked decline in effectiveness as the level of imbalance intensifies, irrespective of the upsampling technique employed. Among the upsampling methods, SMOTE and ADASYN outperform GNUS, with their effectiveness being particularly pronounced when integrated with XGBoost.
For achieving accurate and reliable customer churn predictions across datasets with different degrees of imbalance, the combination of Tuned XGBoost with SMOTE is strongly recommended. This pairing demonstrates superior performance and resilience, making it an ideal choice for churn prediction tasks.