
Submitted:
30 January 2025
Posted:
30 January 2025
You are already at the latest version
Abstract
Timely and accurate knowledge of forest composition is important for the conservation and management of ecosystems. Information on the land cover can be obtained by classifying satellite images. Still, satellite optical data are not always sufficient to get results of the required accuracy because of the similarity of spectral characteristics of tree species. One approach to improve the accuracy of tree species mapping is to use auxiliary data such as climatic, soil, topographic, and vegetation indices. The paper presents the study results for the Slyudyanskoye forestry of the Irkutsk region near Lake Baikal. A set of 101 features was collected, including both Sentinel-2 satellite images and data on soils, climate, forest canopy height, and topography. The spectral characteristics of five tree species at key sites were determined for the training dataset. Polygons corresponding to these species and common land cover types (land, grass, water, and clouds) were marked on the original image. Forest classification was performed using the Random Forests machine learning method. The paper presents classification results for eight sets of variables: spectral bands, their combinations with each type of auxiliary data, all 101 features, and a reduced set of 98 features. The results showed a strong influence of the auxiliary data on the performance of the tree species classification model – the overall accuracy increased from 49.59% for only Sentinel-2 bands to 80.69% for the set of 98 selected features. The addition of climate and soil features caused the greatest increase in accuracy, while the most important variables were the B11 band, forest canopy height, and growing season length. The result shows that auxiliary environmental data improves the accuracy of tree species mapping from satellite images.
Keywords:
tree species classification
; climate data
; soil data
; tree species mapping
; Sentinel-2
; Chelsa
; SoilGrids
1. Introduction
Information on the composition and spatial distribution of tree species in the study area is necessary for sustainable forest management [1]. Timely monitoring of forest resources is important for modeling forest dynamics, fire risk assessment, forest inventory, and carbon stock assessment [2]. However, up-to-date data of sufficient accuracy and completeness are not always available to researchers and decision-makers. Traditional methods of forest research are time-consuming and expensive, which makes it difficult to acquire relevant data [3].
Multispectral remote sensing (RS) data, widely available in open sources with regular updates and different resolutions, can provide information about forests. Analyzing satellite images is less costly than field forest research and saves time by scaling the results to areas with similar characteristics. Sentinel-2 and Landsat 8-9 images with resolutions of 10 and 30 m, respectively, have been frequently used for forest resources research in recent years [4,5,6]. Sentinel-2 satellite images have several bands in the shortwave infrared and red edge area, which allows it to improve the separation of different vegetation types [7]. [8] revealed the effectiveness of the multispectral sensors in classifying four tree species by Sentinel-2 images. Fusion of different remote sensing data can improve the result. For example, the fusion of WorldView-2/3 images with LiDAR, as shown in [9], marked an improvement in classification accuracy when mapping urban forest tree species using deep learning techniques.
Classification methods use as a base a training dataset – a set of polygons pre-labeled on the image, each of which is assigned a corresponding land cover type class. Machine learning plays an important role in tree species classification. Studies have shown [10,11,12,13] that Random Forest (RF), support vector machine (SVM), gradient boosting (XGBoost, GBDT), k-nearest neighbors (K-NN), and Naive Bayes (NB) algorithms can effectively identify tree species based on spectral and textural features. Random forest classifiers have been widely adopted due to their effectiveness in high-dimensional data and robustness to overfitting. For example, [14] combined spectral information with crown texture and environmental variables to map five dominant tree species in North Korea, demonstrating the importance of utilizing different data.
Multispectral imagery is not always sufficient for large-scale environmental studies [15,16]. Recognizing tree species in images can be challenging because of the similarity of reflectance and surface texture of different species. Current remote sensing technologies do not always provide accurate results, especially in mountain forests with dense cover and complex species composition. The difficulty in accessing some forests limits the ability to collect accurate data for training classification algorithms. Here, one way to improve the classification results of satellite data is to add some supplementary data – vegetation indices, topographic characteristics, soil, and meteorological maps – to the original set of bands [17].
For example, in a study of differences in tree species classification in northern and southern regions of China, the authors selected a dataset of Sentinel-2, Landsat-8, Sentinel-1 imagery, vegetation indices, texture, and topographic features [18], with the addition of altitude being the strongest contributor to classification accuracy. In [19], the authors compared 16 different combinations of features to classify forest tree species, including Sentinel-2 spectral reflectance and vegetation indices, texture, phenological information, topography, precipitation, air temperature, UV aerosol index, and NO2 concentration. Topography, UV aerosol index, and phenological information were found to be more important features for classification, while frequently used texture features had limited impact on the change in accuracy. In [20], topographic variables (elevation, slope, exposure, and curvature) showed higher importance than multispectral data in classifying individual tree species (birch, cedar, willow) in tree classification in Mongolia, but topographic data alone was insufficient for accurate classification. The authors of [21] found that using multiple input data for an area in Inner Mongolia, China – spectral, textural, topographic, canopy height – significantly improved the accuracy of land cover and forest classification compared to using only spectral bands when classifying them with six machine learning algorithms. When comparing different combinations of Sentinel-2 imagery, topographic data, and texture features for tree identification of the Prahova Valley in Romania [22], the best results were obtained by combining all data types, with the contribution of texture features being minimal, while the addition of topographic data (height, exposure and slope) significantly improved accuracy. To map forests in a mountain range in southwest China, the authors [23] collected multimodal data: Sentinel-2 optical images, Sentinel-1 radar images, texture features, topographic and climatic data. The combination of different data types improved classification accuracy - the integration of SAR data improved the separation of conifers and hardwoods, but reduced the accuracy of oak recognition. Topographic and climatic parameters showed a notable influence on forest classification in mountainous areas.
In this study, the object of study was the Slyudyanskoye forestry of the Irkutsk region, located along the shore of Lake Baikal. We used Sentinel-2 images, vegetation indices, forest canopy height, topographic, climatic, and soil data as data sources. The main objectives were: (1) to study and evaluate the impact of auxiliary data on the accuracy of tree species classification compared to using multispectral satellite images alone, (2) to select the best combination of features for model performance, and (3) to map tree species in the study area.
2. Materials and Methods
The Slyudyanskoye forestry of the Irkutsk region was selected as the study area (Figure 1). It occupies 351 thousand hectares, including 299 thousand hectares of forested land, which is over 85% of the total area of the region. According to the Forest Regulations [24], in the Slyudyanskoye forestry pine occupies 13.9 thousand ha, spruce – 4.6 thousand ha, fir – 22.3 thousand ha, larch – 20.5 thousand ha, cedar – 159.4 thousand ha, birch – 34.1 thousand ha and aspen – 3.2 thousand ha. The territory of the forestry is located along the southern edge of Lake Baikal and has a strongly mountainous relief. The high percentage of forest cover combined with the presence of mountainous, inaccessible areas makes it important to clarify the classification of forests in the study area.
2.1. Data for Training
Sentinel-2 satellite images were used as the base data in this study. Eleven main bands (B1-B8, B8A, B11-B12) were taken for forest cover classification. The B9 and B10 bands were not included in the classification because they contain water vapor data and therefore do not affect the identification of tree species [25]. The B1 band, containing coastal aerosol concentration values, was included in the research due to the proximity of the study area to the coastal area of Lake Baikal. This provides a high level of aerosol, the concentration of which is closely related to the mountainous terrain of the area.
The auxiliary data set was composed of the most common vegetation indices [26,27], soil, climatic and topographic variables, and forest canopy height (Table 1).
Vegetation Indices
Vegetation indices were calculated using various combinations of Sentinel-2 bands, most frequently the red, infrared, and shortwave infrared bands, which have shown good ability to identify tree species [28]. This is related to the fact that green vegetation absorbs red wavelengths and reflects infrared wavelengths, and the absorption and reflection patterns differ among tree species because they depend on leaf structure and chlorophyll content. Shortwave infrared channels have longer wavelengths, so they propagate better through the atmosphere and show their high relevance in forest classification [29].
Soil Data
Soil parameters are directly related to which tree species will grow in the area. The proportions of sand, silt, and clay particles determine the texture of the soil, which regulates water availability. Nitrogen and organic carbon content show soil quality and fertility, which affects productivity and forest biomass stocks [30]. In this study, soil data is obtained from the ISRIC Word Soil Information project website https://www.isric.org/. Global SoilGrids datasets are presented as 250 m resolution raster maps that include information on soil chemical and physical properties. The values of each parameter are given for six soil depth intervals from 0 to 200 cm (0-5 cm, 5-15 cm, 15-30 cm, 30-60 cm, 60-100 cm, 100-200 cm). Soil density and composition parameters were selected as mechanical parameters for the study, pH, nitrogen, and organic carbon content – as chemical parameters. For each parameter, maps were downloaded for all six depth intervals.
Climate Data
Climate has a strong influence on the character of forest vegetation. Growth and establishment of different tree species are related to their range of tolerance to average annual precipitation and air temperature [30]. The main climatic parameters chosen were minimum and maximum temperature and precipitation. Their values were obtained from WorldClim sets, which represent averaged values for the period 1970-2000 with a spatial resolution of 30 sec. Additionally, Chelsa bioclimatic sets were downloaded. These are derived from the main climatic variables and are intended for modeling species distributions as they reflect annual trends (e.g., mean annual temperature), seasonality (annual range of temperature and precipitation), growing season parameters, and extreme or limiting environmental factors. Values of Chelsa bioclimatic variables are averages over the period 1981-2010.
Topographic Data
Topography affects the distribution of forest tree species, forming unique conditions for their growth, so topographic indicators are used to refine the classification of tree species [31]. Slope gradient affects the angle of incidence of sunlight, and the aspect (its direction relative to the sides of light) determines the duration and intensity of sunlight. Elevation is closely related to differences in climatic conditions such as temperature and humidity. In this paper, elevation, slope, and shading parameters were calculated based on the Copernicus DEM digital elevation model created in 2011-2015.
Forest Canopy Height
The height of a tree depends on its species. There are both deciduous and coniferous trees of different species in the study area, so we have added canopy height data to our survey. The 10 m resolution forest canopy height map is downloaded as an ETH Global Sentinel-2 Canopy Height dataset. It contains tree height parameters derived by deep learning methods from GEDI LiDAR data and Sentinel-2 optical images. This combination of data from different satellites overcame the limitations of each of them, taking the strengths of GEDI's measurements of vertical forest structure and Sentinel-2's broad, high-resolution coverage of the Earth's surface for analysis. The final map represents forest canopy height data on a global scale [32].
2.2. Model Evaluation
Classification was performed by Random Forests machine learning method from Python scikit-learn library. To evaluate the performance of the model, the values of overall accuracy across all classes, overall precision, recall, and f1-score [33] were used. The validation samples were separately generated and marked up in QGis by the AsATaM plugin over the entire satellite image. This approach provided spatial independence of the validation dataset from the training samples, which gave unbiased model estimates.
To improve model performance and assess the influence of different variables, the importance of each feature was calculated by comparing the results of the internal Random Forest method (feature_importances). The importance of feature_importances was counted at each step of cross-validation using the K-Fold method. The data was split into 10 parts, and the importance values for each feature were calculated sequentially at each iteration. The mean values of each variable for all 10 iterations of cross-validation were taken as totals (Figure 2).
2.3. Features Combinations
Eight feature combinations were investigated in this work (Table 2). Models 1-6 compared the classification results of spectral bands only and their alternating combinations with different auxiliary data. Model 7 contains all collected features and model 8 was obtained after removing from the full set those features that received low values in the importance calculation. The performance of all models was evaluated on the same validation dataset.
2.4. Training Dataset
The 2009 Russian forest map with a resolution of 150 m [34] served as the basis for the training dataset. Based on the analysis of papers on spectral reflectance of different tree species [7,35,36] and visual comparison of the forest map with high-resolution satellite images, several key sites were selected for each of the seven tree species of the Slyudyanskoye forestry. For each site, spectral characteristics were calculated in QGIS with the Semi-automatic classification plugin on Sentinel-2 bands, which was further used for classification. After analyzing the obtained values, it was decided to carry out further labeling of the sample and classification by five species – pine, cedar, larch, fir, and birch. The spectral characteristics of aspen and spruce were too close to the values for birch and fir, respectively, and the areas of these species in the forestry's territory are much smaller. Therefore, additional information will be needed in the future to mark the areas occupied by aspen and spruce.
Figure 3 shows a plot of the reflectance variation of different species by Sentinel-2 bands. The resulting values were used to mark polygons occupied by the selected species. Additionally, the general surface classes of water, open ground, grass, and urban areas were marked.
2.5. Data Preprocessing
The study area is located at the boundary of the three tiles of the Sentinel-2 grid. The original images were obtained from Copernicus Hub on 5 July 2019, and then processed by the Sen2Cor algorithm to perform atmospheric correction. To cover the study area, the three original tiles were first merged by each band, and then cropped to the forestry contour in QGis. All auxiliary data were scaled to 30 m resolution, raster cell bounds were aligned to the satellite band cells.
The values of all variables were then normalized within the interval (0, 1). The initial data differed significantly in absolute values: (0, 10000) for Sentinel-2 bands, ranges (-2000, 30000) and (-1, 1) for vegetation indices, (0, 1000) for soil parameters. To remove imbalance, all indices were transformed using the method proposed for the Dynamic World global classification [37]. It includes logarithmic transformation, which also allows to equalize the outliers of highly reflective values in the spectral data distributions.
3. Results
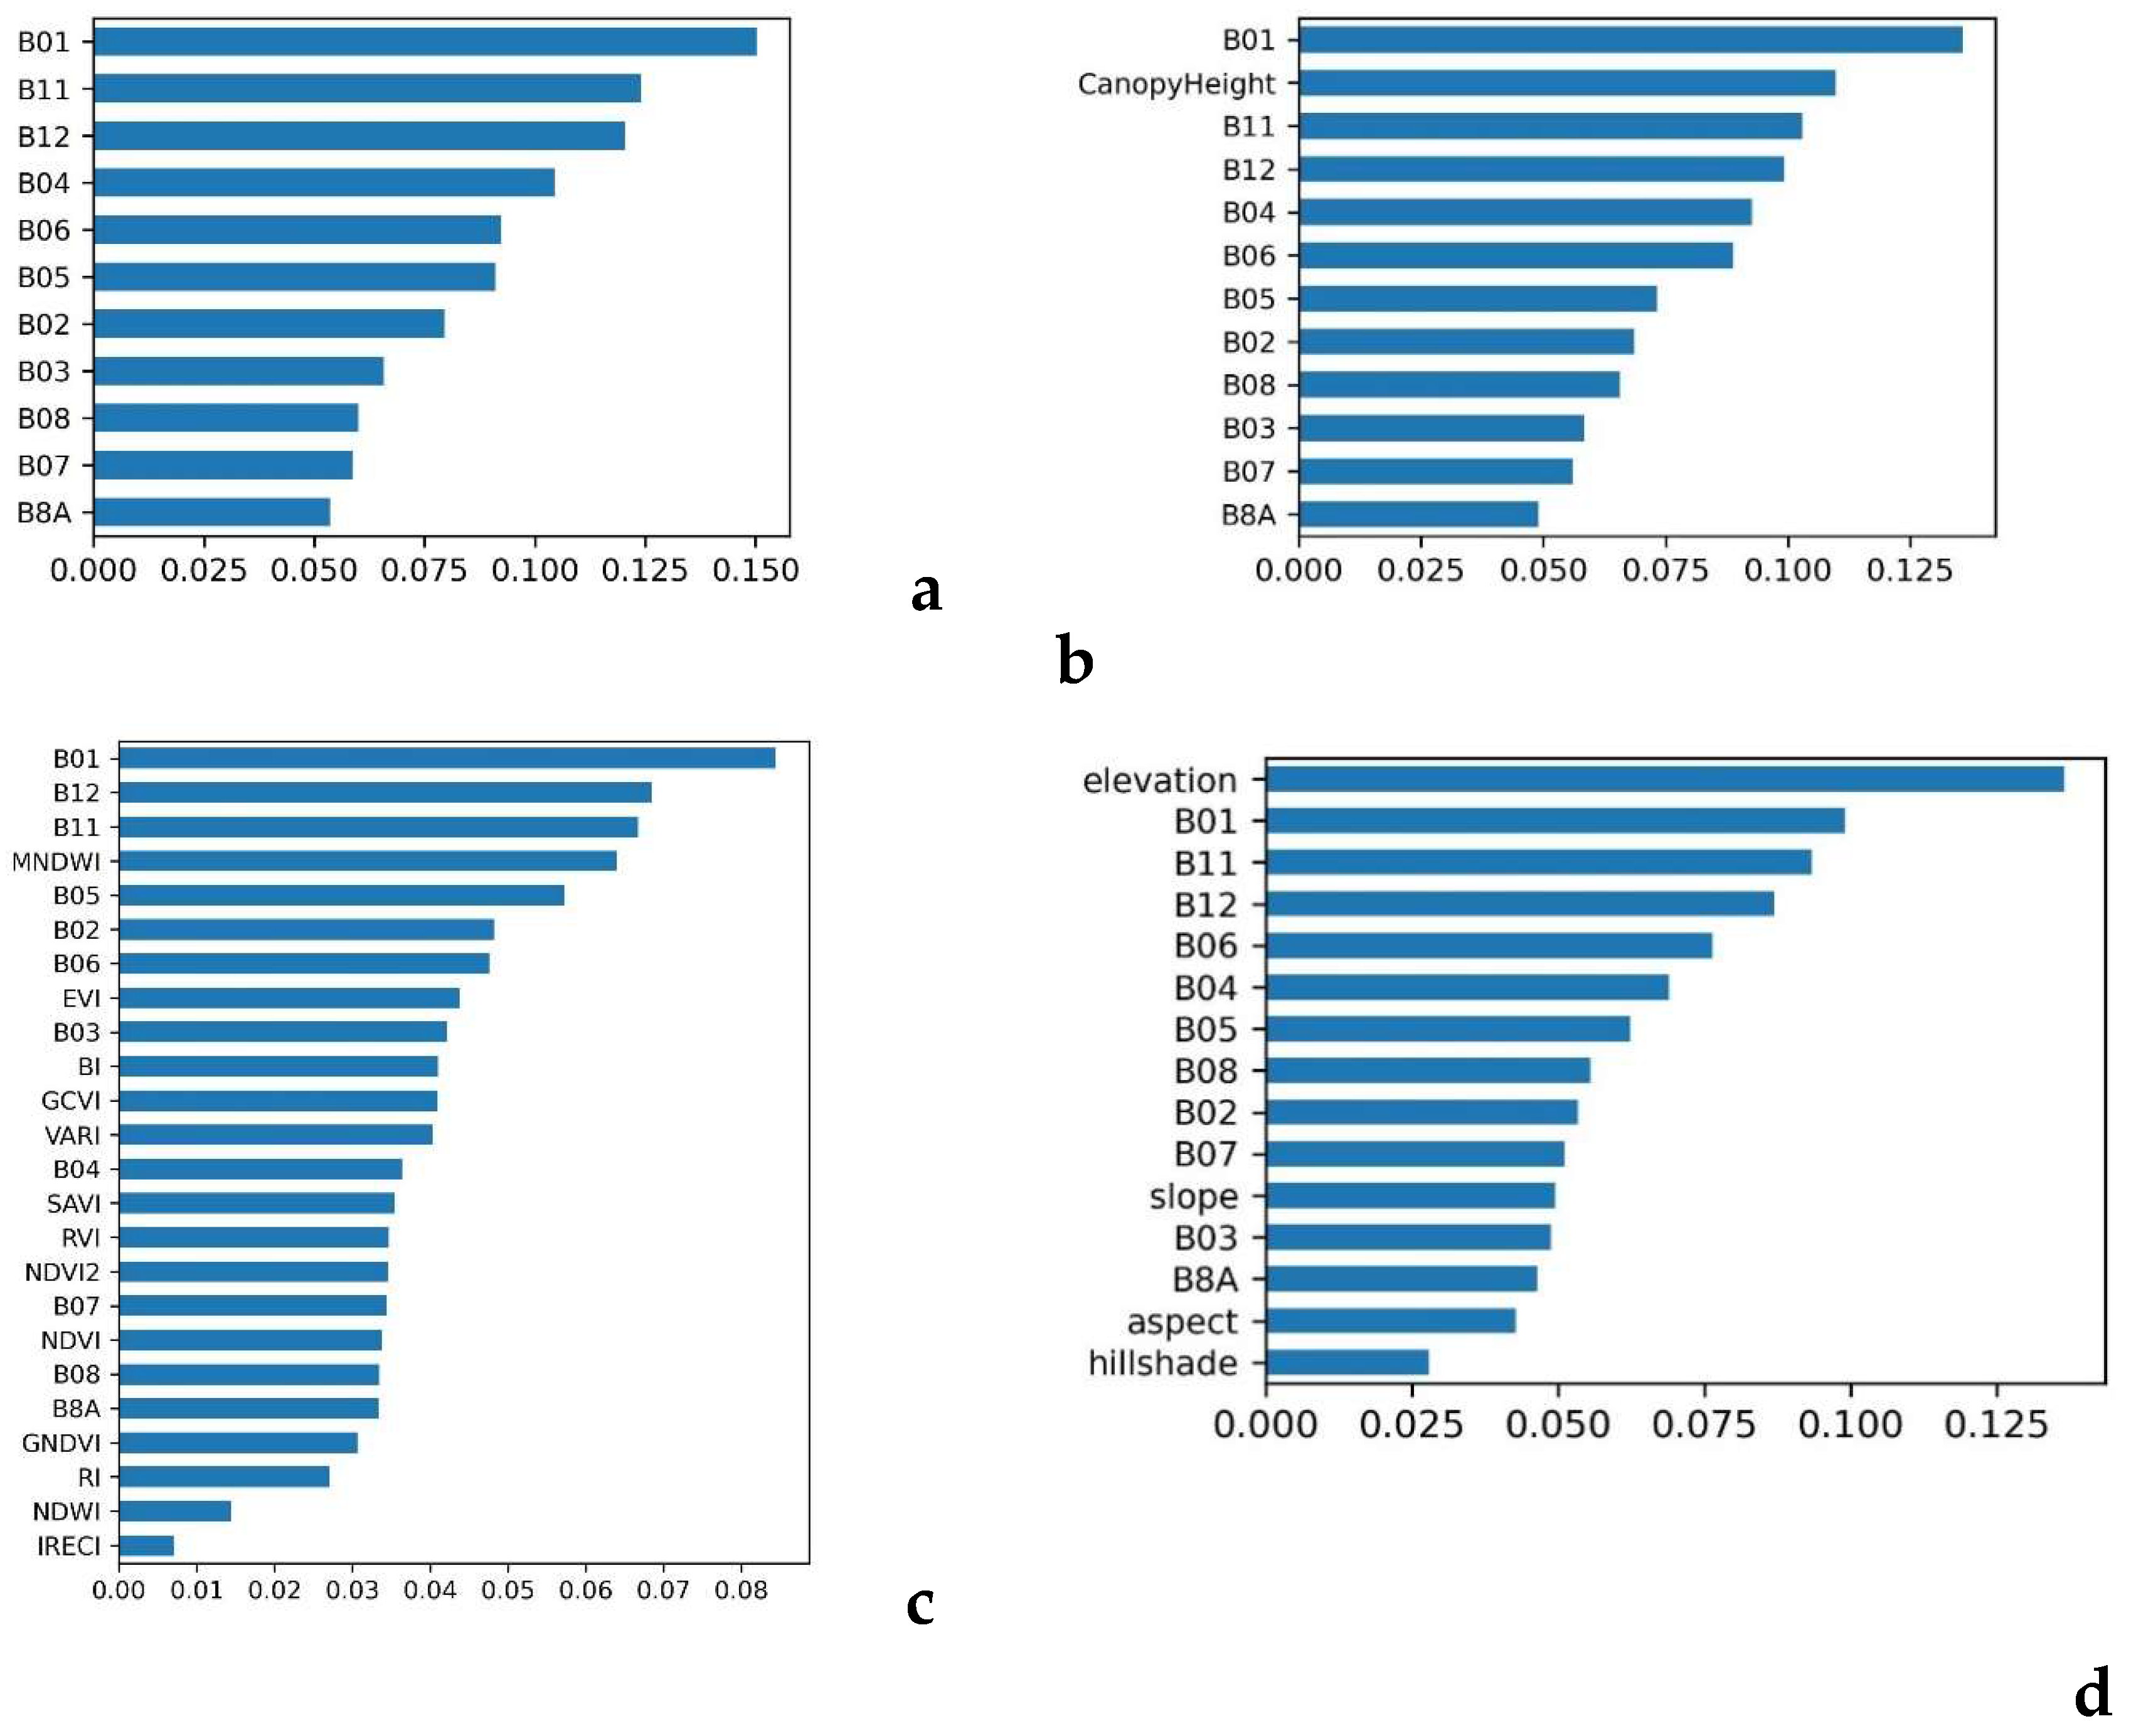
At first, only Sentinel-2 bands were classified. The overall accuracy was OAA=49.59%, f1-score=0.53 (Table 3). The most important bands for the model were aerosol B1, shortwave infrared B11 and B12, followed by red B4 and red edge B5 and B6. The least important was B8A (Figure 5a).
The addition of vegetation indices did not help to improve the overall accuracy, the accuracy of recognition of individual tree species also remained at the same level. The modified water index MNDWI was in fourth place in importance score, and the extended vegetation index EVI was in eighth place. The remaining indices were placed starting from tenth place after the main bands and received approximately the same scores. The water NDWI and the inverted red edge chlorophyll index IRECI were the least important (Figure 5c).
Adding tree canopy height increased overall model accuracy by 2.27%. Pine (+4.63%) and larch (+3.82%) increased the most in accuracy by tree species class (Table 4), while birch showed a slight decrease (-2.51%). The order of importance of the optical bands remained the same as in the first model, but CanopyHeight became the second most important (Figure 5b).
Topographic data increased overall accuracy by 6.27% and tree species recognition accuracy by 4.69%. The most noticeable increase was in the accuracy of the fir classification – on 8.15%. In this model, elevation was the most important feature, which shows the importance of considering topographic features in classification, especially for mountainous areas. The other three additional variables (slope, aspect, hillshade) were less important than most of the main bands (Figure 5d).
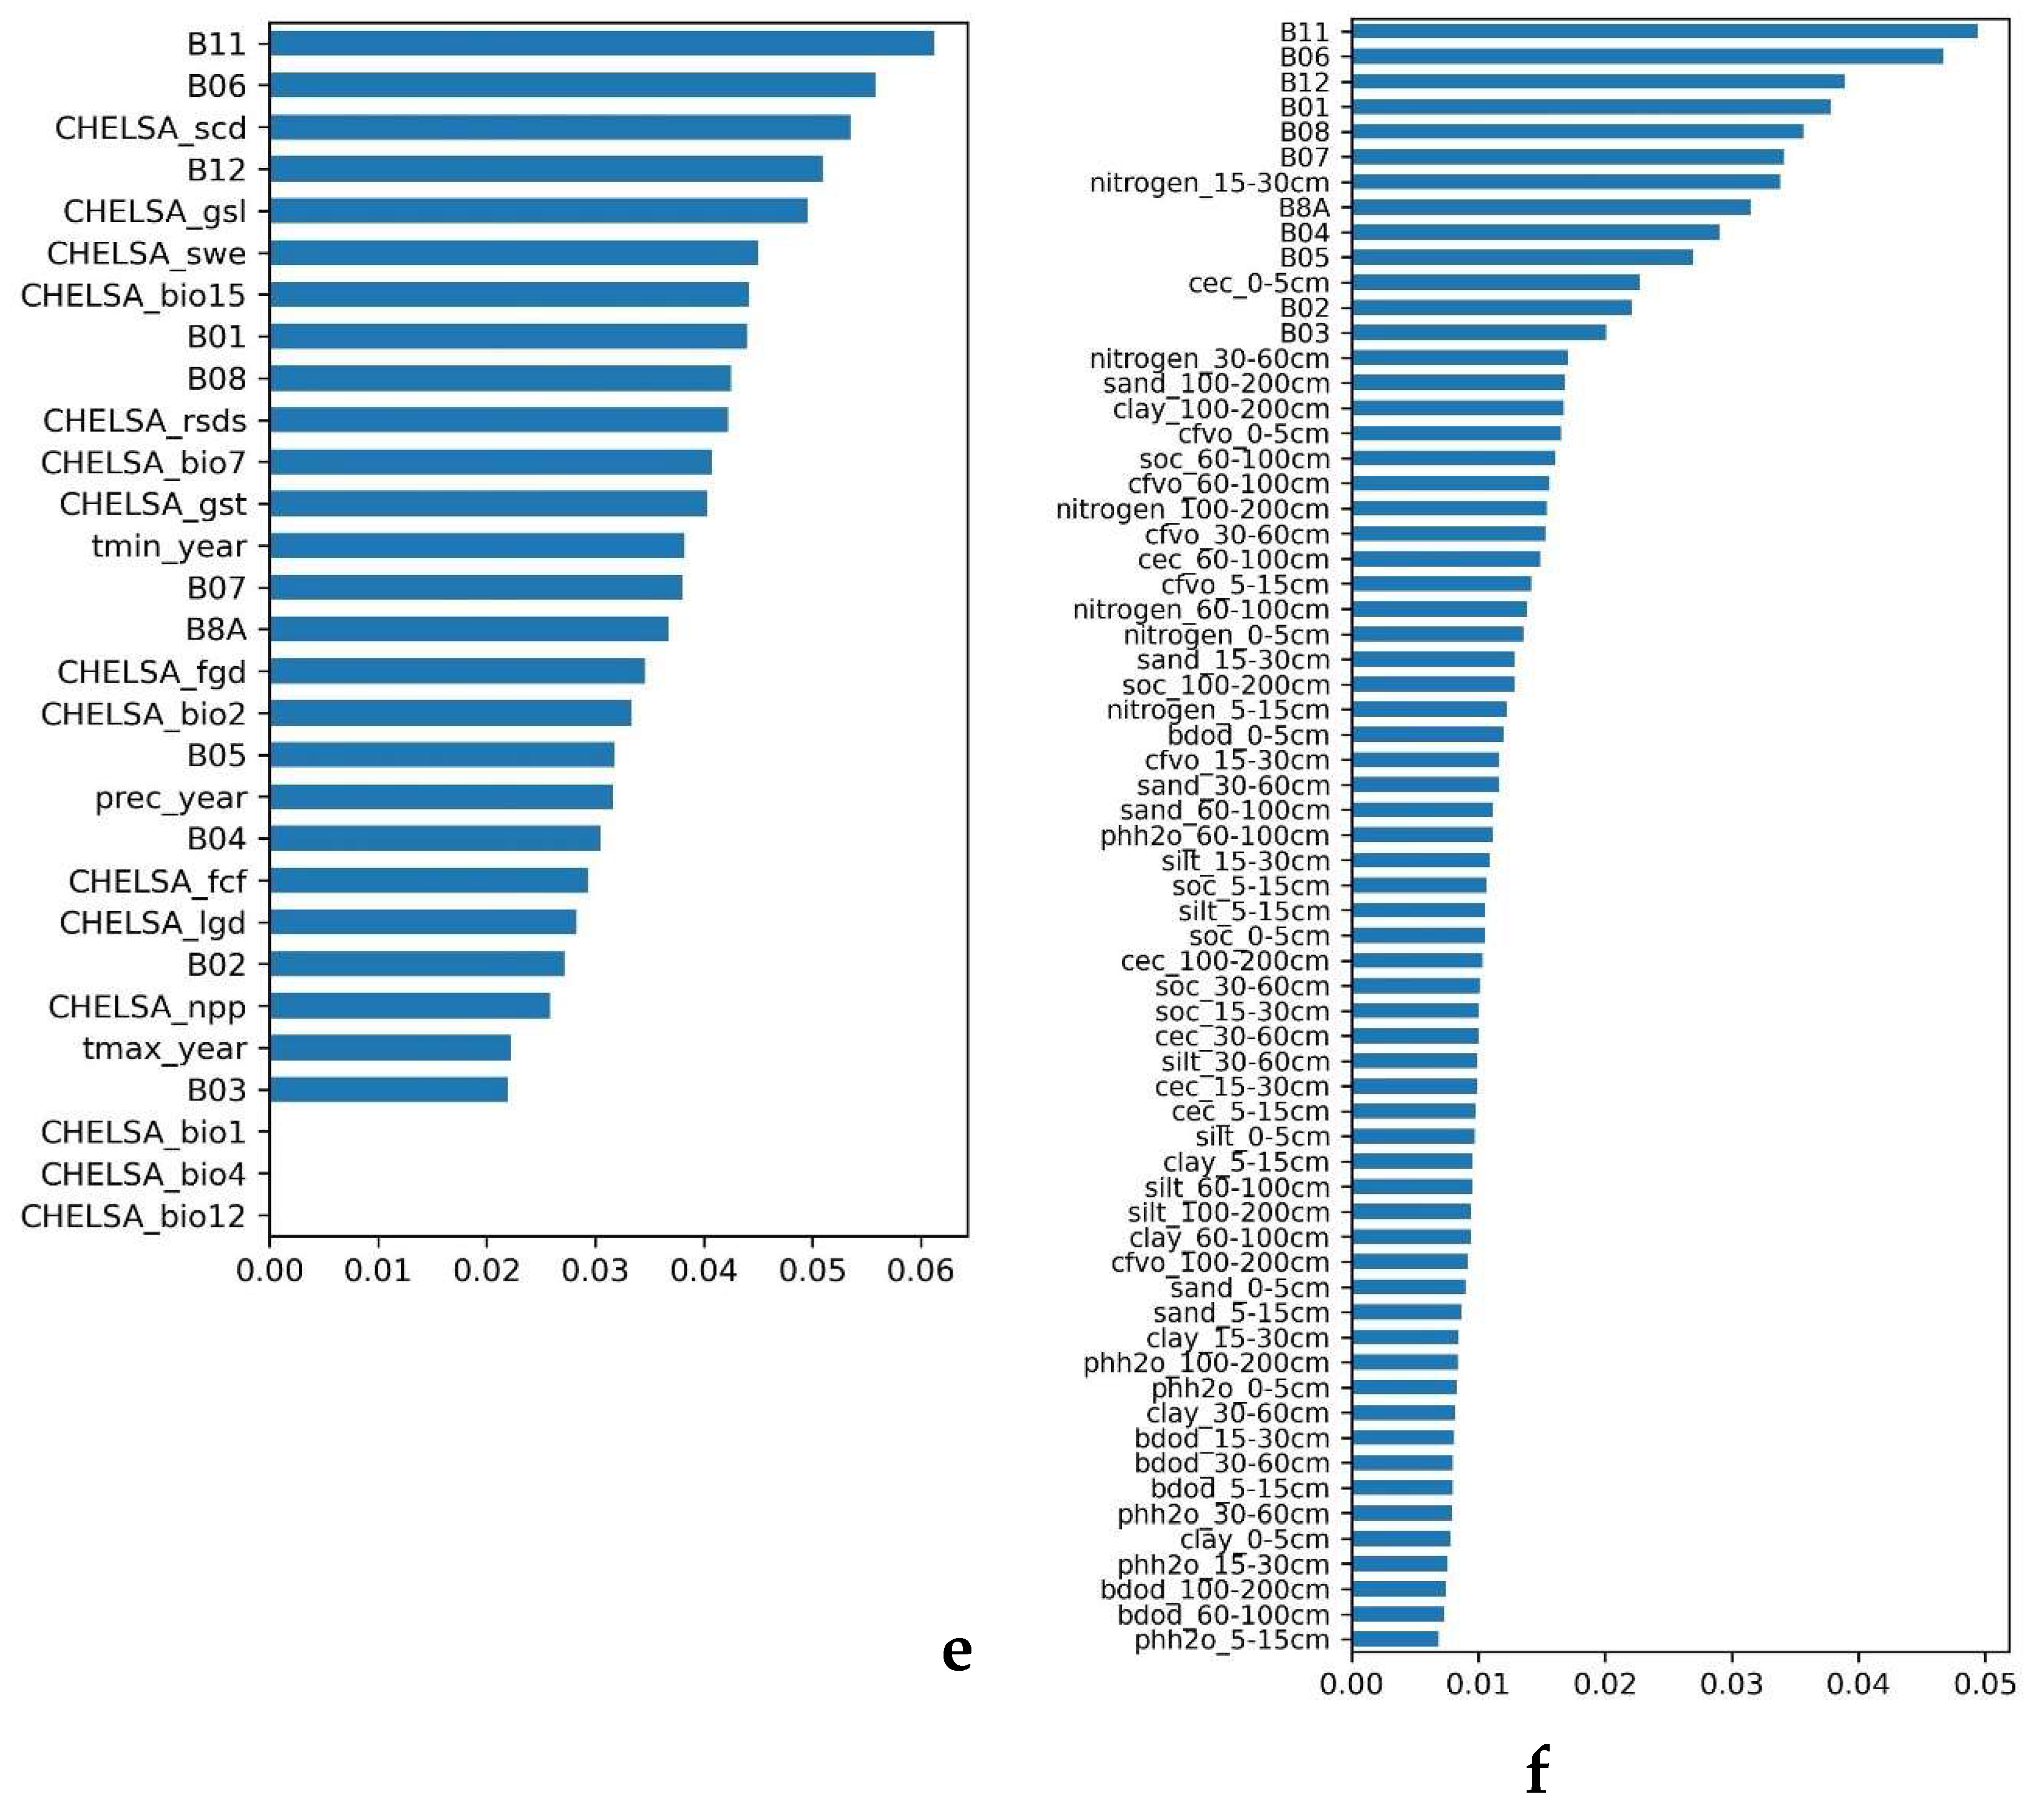
The climatic variables provided a noticeable increase in classification accuracy – overall accuracy increased to 67.38% compared to 49.59% for the set of Sentinel-2 bands, so an increase was 17.79%. The average classification accuracy of tree species increased by 16.77%, from 51.63% to 68.4%, with pine (+29%), fir (+18.52%), and larch (+17.83%) classes showing the greatest increase (Figure 4). The most significant of the climatic variables were the number of days with snow cover (CHELSA_scd), length of the growing season (CHELSA_gsl), snow water (CHELSA_swe), and precipitation seasonality (CHELSA_bio15). Annual mean air temperature (CHELSA_bio1), temperature seasonality (CHELSA_bio4), and annual precipitation (CHELSA_bio12) were the least important (Figure 5e).
Figure 4.
Accuracy by tree species classes for different models.
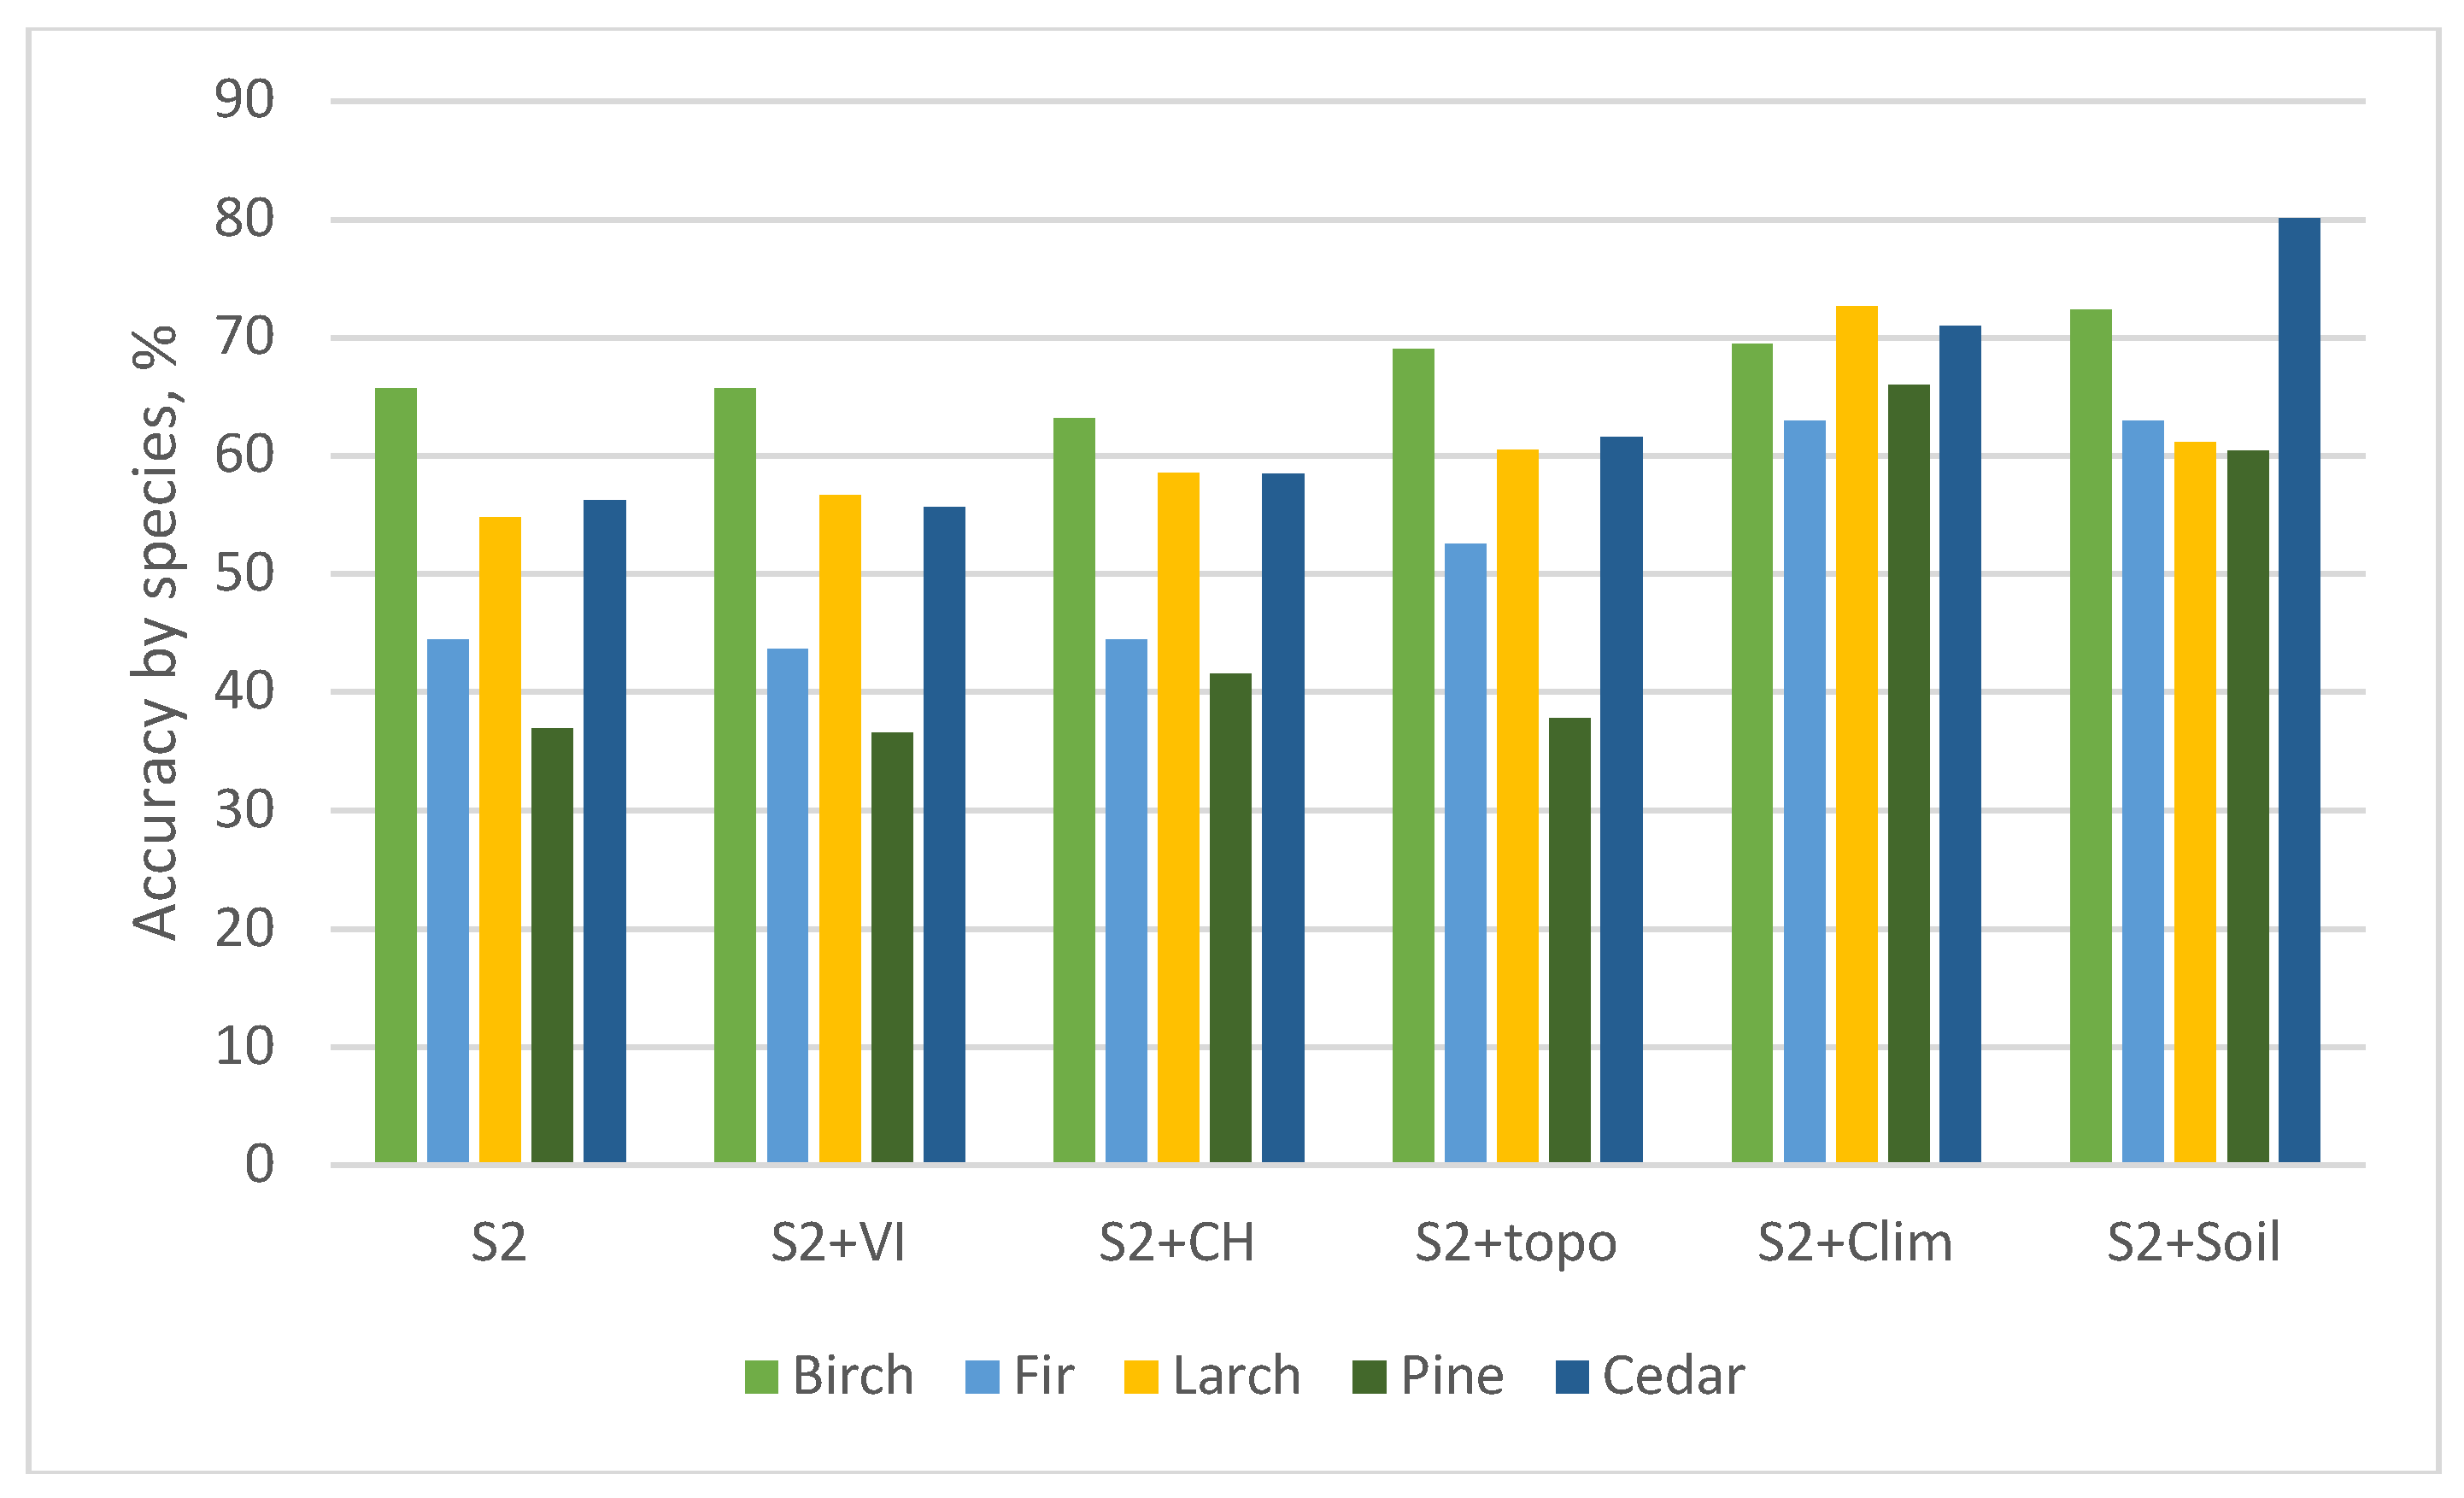
The model with soil features provided the largest increase in overall accuracy by 20.27%, from 49.59% to 69.86%, while forest class classification accuracy increased by 15.79%. By tree species, cedar (+23.86%) and pine (+23.53%) showed the largest increases (Figure 4). B11, B6, and B12 bands were the most important in this model, followed by other spectral bands with a small gap in almost all soil parameters. Only two variables showed an importance score comparable to the spectral data: total nitrogen at a depth of 15-30 cm (nitrogen_15-30cm) and cation exchange capacity at a depth of 0-5 cm (cec_0-5cm). Among all soil variables, total nitrogen at other depths, volumetric fraction of coarse fragments (cfvo), and organic carbon content (soc) received higher importance. Soil pH (phho), bulk density (bdod), and clay particle fraction (clay) had lower results (Figure 5f).
After adding all auxiliary data, the complete set has 101 variables. The classification results showed an overall accuracy of 78.8% and a forest class accuracy of 80.07%. This is 29.21% and 28.44% more than the base set from Sentinel-2 bands and 8.94% and 12.65% more than the set with soil variables, which showed the highest accuracy. B11 band was the most important in this set, followed by forest canopy height (CanopyHeight), growing season length (CHELSA_gsl), and number of days with snow cover (CHELSA_scd). B12, B6 B8, and B8A bands, modified water index MNDWI, and average growing season temperature were among the top 10 most important features for this model. Three bioclimatic parameters showed the lowest importance, which also had the lowest importance in the S2+Clim model: CHELSA_bio1, CHELSA_bio4, CHELSA_bio12. The water index NDWI also showed low importance (Figure 6).
Figure 5.
Importance of features for different models: (a) S2 bands; (b) S2+vegetation indices; (c) S2+canopy height; (d) S2+topography; (e) S2+climate; (f) S2+soil.
Figure 5.
Importance of features for different models: (a) S2 bands; (b) S2+vegetation indices; (c) S2+canopy height; (d) S2+topography; (e) S2+climate; (f) S2+soil.
In the set of 101 features, three bioclimatic features showed an importance noticeably lower than other features. We removed these features from the set and left 98 features for classification. This model showed a small increase in performance – overall accuracy increased by 1.89%, tree species classification accuracy increased by 1-3%, and almost all species were above 80%, except birch – its accuracy was 79.92%. Cedar had the highest classification accuracy of 84.66%. Attempts to remove more features with minimal importance from the set were unsuccessful, causing a decrease in both overall accuracy and accuracy for individual tree species.
Figure 5 and Figure 6 show the importance of features in different models. The higher the importance of the feature score in the figure, the more important it was for the decision. Sentinel-2 bands are labelled in the list by a combination of the letter ‘B’ with numbers, where the number is the band number. Soil variables were taken for different depths, the digits in their names show the average value for that interval in cm. For example, phh2o_15-30cm is the average value of soil pH at a depth of 15 to 30cm. CHELSA bioclimatic variables have a corresponding prefix in the name.
Figure 7 shows the resulting classification map of tree species distribution within the territory of the Slyudyanskoye forestry. Birch is mainly concentrated along the shore of Lake Baikal and river beds. Larch is concentrated in the north-eastern part. Fir, pine, and cedar are distributed all over the territory.
4. Discussion
4.1. Effect of Auxiliary Data on Model Performance
In this paper, we evaluated the effect of various data – spectral, topographic, climatic, and soil data – on tree species classification. With using only satellite bands, birch showed a maximum accuracy of 65.69%, while pine recognition accuracy was only 36.97%. Using Sentinel-2 spectral data, 13 vegetation indices were calculated, which are related to vegetation growth, water content of vegetation, and chlorophyll concentration [38,39]. The bands most often used in the calculation of vegetation indices in this work were green (B3), red (B4), and near-infrared (B8). The addition of vegetation indices did not help to improve the both overall accuracy and accuracy classification of the individual species. This confirms the conclusions of studies [23,36,40] that a set of satellite bands alone, similar in quantity and width to the Sentinel-2 bands, is not always sufficient to distinguish tree species with sufficient accuracy.
In the models, we used two water indices – NDWI and modified MNDWI. The combination of bands B8 and B8a is used to calculate the NDWI index, and B3 and B11 for MNDWI. Both indices are used as measures of vegetation moisture content [27,38]. In the importance score of the full model of 101 features, MNDWI ranked fifth and NDWI was one of the least important for the model, ranking fourth from the end. In our study area, coniferous trees occupy the main area, and the combination of green and shortwave infrared bands proved to be more informative for interpreting moisture in them.
The addition of forest canopy height data in [21] did not improve forest cover classification, but improved the accuracy of results for specific tree species (birch and Mongolian common pine). Our study showed a similar result, with a minimal increase in overall accuracy after adding canopy height data, but improved recognition accuracy for pine and larch. However, in the full set of 101 features, CanopyHeight became the most important feature. This shows the importance of canopy height data in distinguishing between tree species that differ markedly in height. For example, in our mountain taiga study area, pine has an average height of up to 38 m, larch – up to 40 m, cedar – up to 29 m, and birch – up to 24 m [41].
Topographic features are widely used to improve the accuracy of underlying surface classification [42]. Our study area has a mountainous terrain with elevation variation from 580 to 2330 m above sea level. This provided a large contribution to the model performance of topographic variables, improving the recognition accuracies of fir, larch, and cedar. In the full feature set, elevation ranked seventh in importance. The remaining topographic variables – slope, aspect, and shading – contributed less to the accuracy of tree species distinguishing.
Climatic and soil attributes made about the same contribution to the increase in classification accuracy. This shows a strong dependence of tree species distribution on temperature, rainfall, and soil type [30,43]. The value of the contribution appeared to be species-specific – climatic variables had a stronger effect on the accuracy of larch and pine, soil variables had a stronger effect on birch and cedar, and for fir their influence was similar (Table 4). For individual species, these additional features strongly increased accuracy. For example, climatic variables increased the accuracy of pine distinguishing by 29% and birch by only 3.77%. Soil attributes improved the recognition of cedar by 23.86% and larch by only 6.37%.
The study area has a temperate continental climate with stable snow cover in winter. This ensured high importance of the snow cover days and snow water equivalent features. The diversity of tree species in the area (coniferous, deciduous, and deciduous conifers (larch)) influenced the high importance of the growing season length.
The results confirmed the findings of [43] that soil data improves the performance of tree species classification models and allows the evaluation of the relationship between soil characteristics and species distribution. [44] showed that competition between Scots pine and Norway spruce depends on soil texture, which determines tree species composition. In our area, nitrogen, organic carbon, and soil texture characteristics (volume fraction of coarse fractions) were the most important, while pH value and density were the least important. In contrast, in [43] pH and density were the most important predictors due to differences in species composition and climatic conditions.
4.2. Limitations of the Method and Future Development
Because of the limited data available for training, we were only able to identify five tree species out of seven growing in the selected area. Further data collection, including field surveys, will be required to expand the training and validation dataset. This will help train the model to identify aspen and spruce in the spatial images and improve the accuracy of the classification of the five available tree species.
When training the full set of 101 features, three bioclimatic variables at once received minimal importance and their removal improved model performance. This means that in our study area the variables bio1, bio4, and bio12 have a weak influence on the distribution of different tree species, although other studies [45,46,47] have noted a high influence of these variables, including their influence on the distribution of pine and birch subspecies. In the future, it is necessary to conduct a more extensive study of climatic features. For this purpose, it is necessary to include a larger number of different bioclimatic variables in the model at a preliminary stage, to perform cross-validation, and to remove those variables whose importance will differ markedly from the others.
Additionally, textural characteristics, such as GLCM matrix parameters, which have been successfully used to classify tree species [22,23], should be considered as features to be included in the dataset. Using of multi-temporal image series, when several satellite images of the same area for different periods are submitted to the model for training, is promising. Also, in further research, it is necessary to consider models with more complex structure (ensembles, stacking, deep learning), which reflect spatial heterogeneities well and can improve the quality of tree species classification.
5. Conclusions
The evaluation of the use of additional data in tree species classification showed their great impact – we could increase the overall classification accuracy from satellite images by 31.1% to 80.69% by adding vegetation indices, topographic, climatic, soil features, and forest canopy height to the spectral bands. Soil and climatic variables showed the greatest increase in overall classification accuracy. The most important variables in the full set were band B11, forest canopy height, and growing season length.
In this study, the dataset collected for the first time was used to classify the area of the Slyudyanskoye forestry. All auxiliary data were obtained from open sources and are global. The resulting classification allows estimating the size of tree areas of different species, which is important for effective monitoring and management of forest resources.
Testing the model on other areas will help to evaluate its ability to generalize. If successful, the model can be used with different data sources and environmental conditions, making it suitable for larger-scale monitoring of forest resources and supporting ecosystem management.
Funding
The work was supported by the Ministry of Science and Higher Education of the Russian Federation, the grant No. 075-15-2024-533 for implementation of Major scientific projects on priority areas of scientific and technological development (the project «Fundamental research of the Baikal natural territory based on a system of interconnected basic methods, models, neural networks and a digital platform for environmental monitoring of the environment»).
Data Availability Statement
The data presented in this study will be made available upon request from the corresponding author.
Conflicts of Interest
The authors declare no conflicts of interest.
References
- Pu, R. Mapping Tree Species Using Advanced Remote Sensing Technologies: A State-of-the-Art Review and Perspective. J. Remote Sens. 2021, 2021, 9812624. [CrossRef]
- Bonan, G.B. Forests, Climate, and Public Policy: A 500-Year Interdisciplinary Odyssey. Annu. Rev. Ecol. Evol. Syst. 2016, 47, 97–121. [CrossRef]
- Chiarucci, A.; Piovesan, G. Need for a Global Map of Forest Naturalness for a Sustainable Future. Conserv. Biol. 2020, 34, 368–372. [CrossRef]
- H. Nguyen, T.; Jones, S.; Soto-Berelov, M.; Haywood, A.; Hislop, S. Landsat Time-Series for Estimating Forest Aboveground Biomass and Its Dynamics across Space and Time: A Review. Remote Sens. 2019, 12, 98. [CrossRef]
- Talukdar, S.; Singha, P.; Mahato, S.; Shahfahad; Pal, S.; Liou, Y.-A.; Rahman, A. Land-Use Land-Cover Classification by Machine Learning Classifiers for Satellite Observations—A Review. Remote Sens. 2020, 12, 1135. [CrossRef]
- Bychkov, I.; Popova, A. Forest Landscape Model Initialization with Remotely Sensed-Based Open-Source Databases in the Absence of Inventory Data. Forests 2023, 14, 1995. [CrossRef]
- Grabska, E.; Hostert, P.; Pflugmacher, D.; Ostapowicz, K. Forest Stand Species Mapping Using the Sentinel-2 Time Series. Remote Sens. 2019, 11, 1197. [CrossRef]
- Ma, M.; Liu, J.; Liu, M.; Zeng, J.; Li, Y. Tree Species Classification Based on Sentinel-2 Imagery and Random Forest Classifier in the Eastern Regions of the Qilian Mountains. Forests 2021, 12, 1736. [CrossRef]
- Hartling, S.; Sagan, V.; Sidike, P.; Maimaitijiang, M.; Carron, J. Urban Tree Species Classification Using a WorldView-2/3 and LiDAR Data Fusion Approach and Deep Learning. Sensors 2019, 19, 1284. [CrossRef]
- Wang, J.; Bretz, M.; Dewan, M.A.A.; Delavar, M.A. Machine Learning in Modelling Land-Use and Land Cover-Change (LULCC): Current Status, Challenges and Prospects. Sci. Total Environ. 2022, 822, 153559. [CrossRef]
- Wessel, M.; Brandmeier, M.; Tiede, D. Evaluation of Different Machine Learning Algorithms for Scalable Classification of Tree Types and Tree Species Based on Sentinel-2 Data. Remote Sens. 2018, 10, 1419. [CrossRef]
- Axelsson, A.; Lindberg, E.; Reese, H.; Olsson, H. Tree Species Classification Using Sentinel-2 Imagery and Bayesian Inference. Int. J. Appl. Earth Obs. Geoinf. 2021, 100, 102318. [CrossRef]
- Bychkov, I.V.; Ruzhnikov, G.M.; Fedorov, R.K.; Popova, A.K.; Avramenko, Y.V. On Classification of Sentinel-2 Satellite Images by a Neural Network ResNet-50. Comput. Opt. 2023, 47, 474–481. [CrossRef]
- Lim, J.; Kim, K.-M.; Kim, E.-H.; Jin, R. Machine Learning for Tree Species Classification Using Sentinel-2 Spectral Information, Crown Texture, and Environmental Variables. Remote Sens. 2020, 12, 2049. [CrossRef]
- Liu, Y.; Gong, W.; Xing, Y.; Hu, X.; Gong, J. Estimation of the Forest Stand Mean Height and Aboveground Biomass in Northeast China Using SAR Sentinel-1B, Multispectral Sentinel-2A, and DEM Imagery. ISPRS J. Photogramm. Remote Sens. 2019, 151, 277–289. [CrossRef]
- Lechner, M.; Dostálová, A.; Hollaus, M.; Atzberger, C.; Immitzer, M. Combination of Sentinel-1 and Sentinel-2 Data for Tree Species Classification in a Central European Biosphere Reserve. Remote Sens. 2022, 14, 2687. [CrossRef]
- Xu, P.; Tsendbazar, N.-E.; Herold, M.; Clevers, J.G.P.W.; Li, L. Improving the Characterization of Global Aquatic Land Cover Types Using Multi-Source Earth Observation Data. Remote Sens. Environ. 2022, 278, 113103. [CrossRef]
- Zhang, J.; Li, H.; Wang, J.; Liang, Y.; Li, R.; Sun, X. Exploring the Differences in Tree Species Classification between Typical Forest Regions in Northern and Southern China. Forests 2024, 15, 929. [CrossRef]
- You, H.; Huang, Y.; Qin, Z.; Chen, J.; Liu, Y. Forest Tree Species Classification Based on Sentinel-2 Images and Auxiliary Data. Forests 2022, 13, 1416. [CrossRef]
- Chiang, S.-H.; Valdez, M. Tree Species Classification by Integrating Satellite Imagery and Topographic Variables Using Maximum Entropy Method in a Mongolian Forest. Forests 2019, 10, 961. [CrossRef]
- Xie, Z.; Chen, Y.; Lu, D.; Li, G.; Chen, E. Classification of Land Cover, Forest, and Tree Species Classes with ZiYuan-3 Multispectral and Stereo Data. Remote Sens. 2019, 11, 164. [CrossRef]
- Vorovencii, I. Assessing Various Scenarios of Multitemporal Sentinel-2 Imagery, Topographic Data, Texture Features, and Machine Learning Algorithms for Tree Species Identification. IEEE J. Sel. Top. Appl. Earth Obs. Remote Sens. 2024, 17, 15373–15392. [CrossRef]
- Zheng, P.; Fang, P.; Wang, L.; Ou, G.; Xu, W.; Dai, F.; Dai, Q. Synergism of Multi-Modal Data for Mapping Tree Species Distribution—A Case Study from a Mountainous Forest in Southwest China. Remote Sens. 2023, 15, 979. [CrossRef]
- Appendix 28 to the order of the Ministry of the Forestry Complex of the Irkutsk Region dated 28 January 2022 No. 91-7-mpr. In Forest Regulations Slyudyanskoye Forestry of the Irkutsk Region; Branch of FSBI “Roslesinforg” “Vostsiblesproekt”: Krasnoyarsk, Russia, 2021; p. 542.
- Campos-Taberner, M.; García-Haro, F.J.; Martínez, B.; Izquierdo-Verdiguier, E.; Atzberger, C.; Camps-Valls, G.; Gilabert, M.A. Understanding Deep Learning in Land Use Classification Based on Sentinel-2 Time Series. Sci. Rep. 2020, 10, 1–12. [CrossRef]
- Wang, X.; Zhang, C.; Qiang, Z.; Xu, W.; Fan, J. A New Forest Growing Stock Volume Estimation Model Based on AdaBoost and Random Forest Model. Forests 2024, 15, 260. [CrossRef]
- Yuan, X.; Liu, S.; Feng, W.; Dauphin, G. Feature Importance Ranking of Random Forest-Based End-to-End Learning Algorithm. Remote Sens. 2023, 15, 5203. [CrossRef]
- Immitzer, M.; Vuolo, F.; Atzberger, C. First Experience with Sentinel-2 Data for Crop and Tree Species Classifications in Central Europe. Remote Sens. 2016, 8, 166. [CrossRef]
- Abdi, A.M. Land Cover and Land Use Classification Performance of Machine Learning Algorithms in a Boreal Landscape Using Sentinel-2 Data. GIScience Remote Sens. 2020, 57, 1–20. [CrossRef]
- Mensah, S.; Noulèkoun, F.; Dimobe, K.; Seifert, T.; Glèlè Kakaï, R. Climate and Soil Effects on Tree Species Diversity and Aboveground Carbon Patterns in Semi-Arid Tree Savannas. Sci. Rep. 2023, 13, 11509. [CrossRef]
- Liu, M.; Liu, J.; Atzberger, C.; Jiang, Y.; Ma, M.; Wang, X. Zanthoxylum Bungeanum Maxim Mapping with Multi-Temporal Sentinel-2 Images: The Importance of Different Features and Consistency of Results. ISPRS J. Photogramm. Remote Sens. 2021, 174, 68–86. [CrossRef]
- Lang, N.; Jetz, W.; Schindler, K.; Wegner, J.D. A High-Resolution Canopy Height Model of the Earth. Nat. Ecol. Evol. 2023, 7, 1778–1789. [CrossRef]
- Olofsson, P.; Foody, G.M.; Herold, M.; Stehman, S. V.; Woodcock, C.E.; Wulder, M.A. Good Practices for Estimating Area and Assessing Accuracy of Land Change. Remote Sens. Environ. 2014, 148, 42–57. [CrossRef]
- Schepaschenko, D.G.; Shvidenko, A.Z.; Lesiv, M.Y.; Ontikov, P. V.; Shchepashchenko, M. V.; Kraxner, F. Estimation of Forest Area and Its Dynamics in Russia Based on Synthesis of Remote Sensing Products. Contemp. Probl. Ecol. 2015, 8, 811–817. [CrossRef]
- Persson, M.; Lindberg, E.; Reese, H. Tree Species Classification with Multi-Temporal Sentinel-2 Data. Remote Sens. 2018, 10, 1794. [CrossRef]
- Wang, M.; Zheng, Y.; Huang, C.; Meng, R.; Pang, Y.; Jia, W.; Zhou, J.; Huang, Z.; Fang, L.; Zhao, F. Assessing Landsat-8 and Sentinel-2 Spectral-Temporal Features for Mapping Tree Species of Northern Plantation Forests in Heilongjiang Province, China. For. Ecosyst. 2022, 9, 100032. [CrossRef]
- Brown, C.F.; Brumby, S.P.; Guzder-Williams, B.; Birch, T.; Hyde, S.B.; Mazzariello, J.; Czerwinski, W.; Pasquarella, V.J.; Haertel, R.; Ilyushchenko, S.; et al. Dynamic World, Near Real-Time Global 10 m Land Use Land Cover Mapping. Sci. Data 2022, 9, 251. [CrossRef]
- Gao, B. NDWI—A Normalized Difference Water Index for Remote Sensing of Vegetation Liquid Water from Space. Remote Sens. Environ. 1996, 58, 257–266. [CrossRef]
- Gao, S.; Yan, K.; Liu, J.; Pu, J.; Zou, D.; Qi, J.; Mu, X.; Yan, G. Assessment of Remote-Sensed Vegetation Indices for Estimating Forest Chlorophyll Concentration. Ecol. Indic. 2024, 162, 112001. [CrossRef]
- Wan, H.; Tang, Y.; Jing, L.; Li, H.; Qiu, F.; Wu, W. Tree Species Classification of Forest Stands Using Multisource Remote Sensing Data. Remote Sens. 2021, 13, 1–24. [CrossRef]
- Shvidenko, A.; Schepaschenko, D.; Nilsson, S. Tables and Models of Growth and Productivity of Forests of Major Forest Forming Species of Northern Eurasia (Standard and Reference Materials); ); Federal Agency of Forest Management, International Institute for Applied Systems Analysis: Moscow, 2008; p. 886.
- Lu, D.; Weng, Q. A Survey of Image Classification Methods and Techniques for Improving Classification Performance. Int. J. Remote Sens. 2007, 28, 823–870. [CrossRef]
- Rota, F.; Scherrer, D.; Bergamini, A.; Price, B.; Walthert, L.; Baltensweiler, A. Unravelling the Impact of Soil Data Quality on Species Distribution Models of Temperate Forest Woody Plants. Sci. Total Environ. 2024, 944, 173719. [CrossRef]
- Levula, J.; Ilvesniemi, H.; Westman, C. Relation between Soil Properties and Tree Species Composition in a Scots Pine–Norway Spruce Stand in Southern Finland. Silva Fenn. 2003, 37, 205–218. [CrossRef]
- Feng, J.; Wang, B.; Xian, M.; Zhou, S.; Huang, C.; Cui, X. Prediction of Future Potential Distributions of Pinus Yunnanensis Varieties under Climate Change. Front. For. Glob. Chang. 2023, 6, 1308416. [CrossRef]
- Xiao, X.; Wang, Q.; Guan, Q.; Zhang, Z.; Yan, Y.; Mi, J.; Yang, E. Quantifying the Nonlinear Response of Vegetation Greening to Driving Factors in Longnan of China Based on Machine Learning Algorithm. Ecol. Indic. 2023, 151, 110277. [CrossRef]
- Yang, Q.; Xiang, Y.; Li, S.; Zhao, L.; Liu, Y.; Luo, Y.; Long, Y.; Yang, S.; Luo, X. Modeling the Impacts of Climate Change on Potential Distribution of Betula Luminifera H. Winkler in China Using MaxEnt. Forests 2024, 15, 1624. [CrossRef]
Figure 1.
Study area: (a) Location of the Slyudyanskoye forestry area; (b) Map of the Slyudyanskoye forestry area.
Figure 1.
Study area: (a) Location of the Slyudyanskoye forestry area; (b) Map of the Slyudyanskoye forestry area.
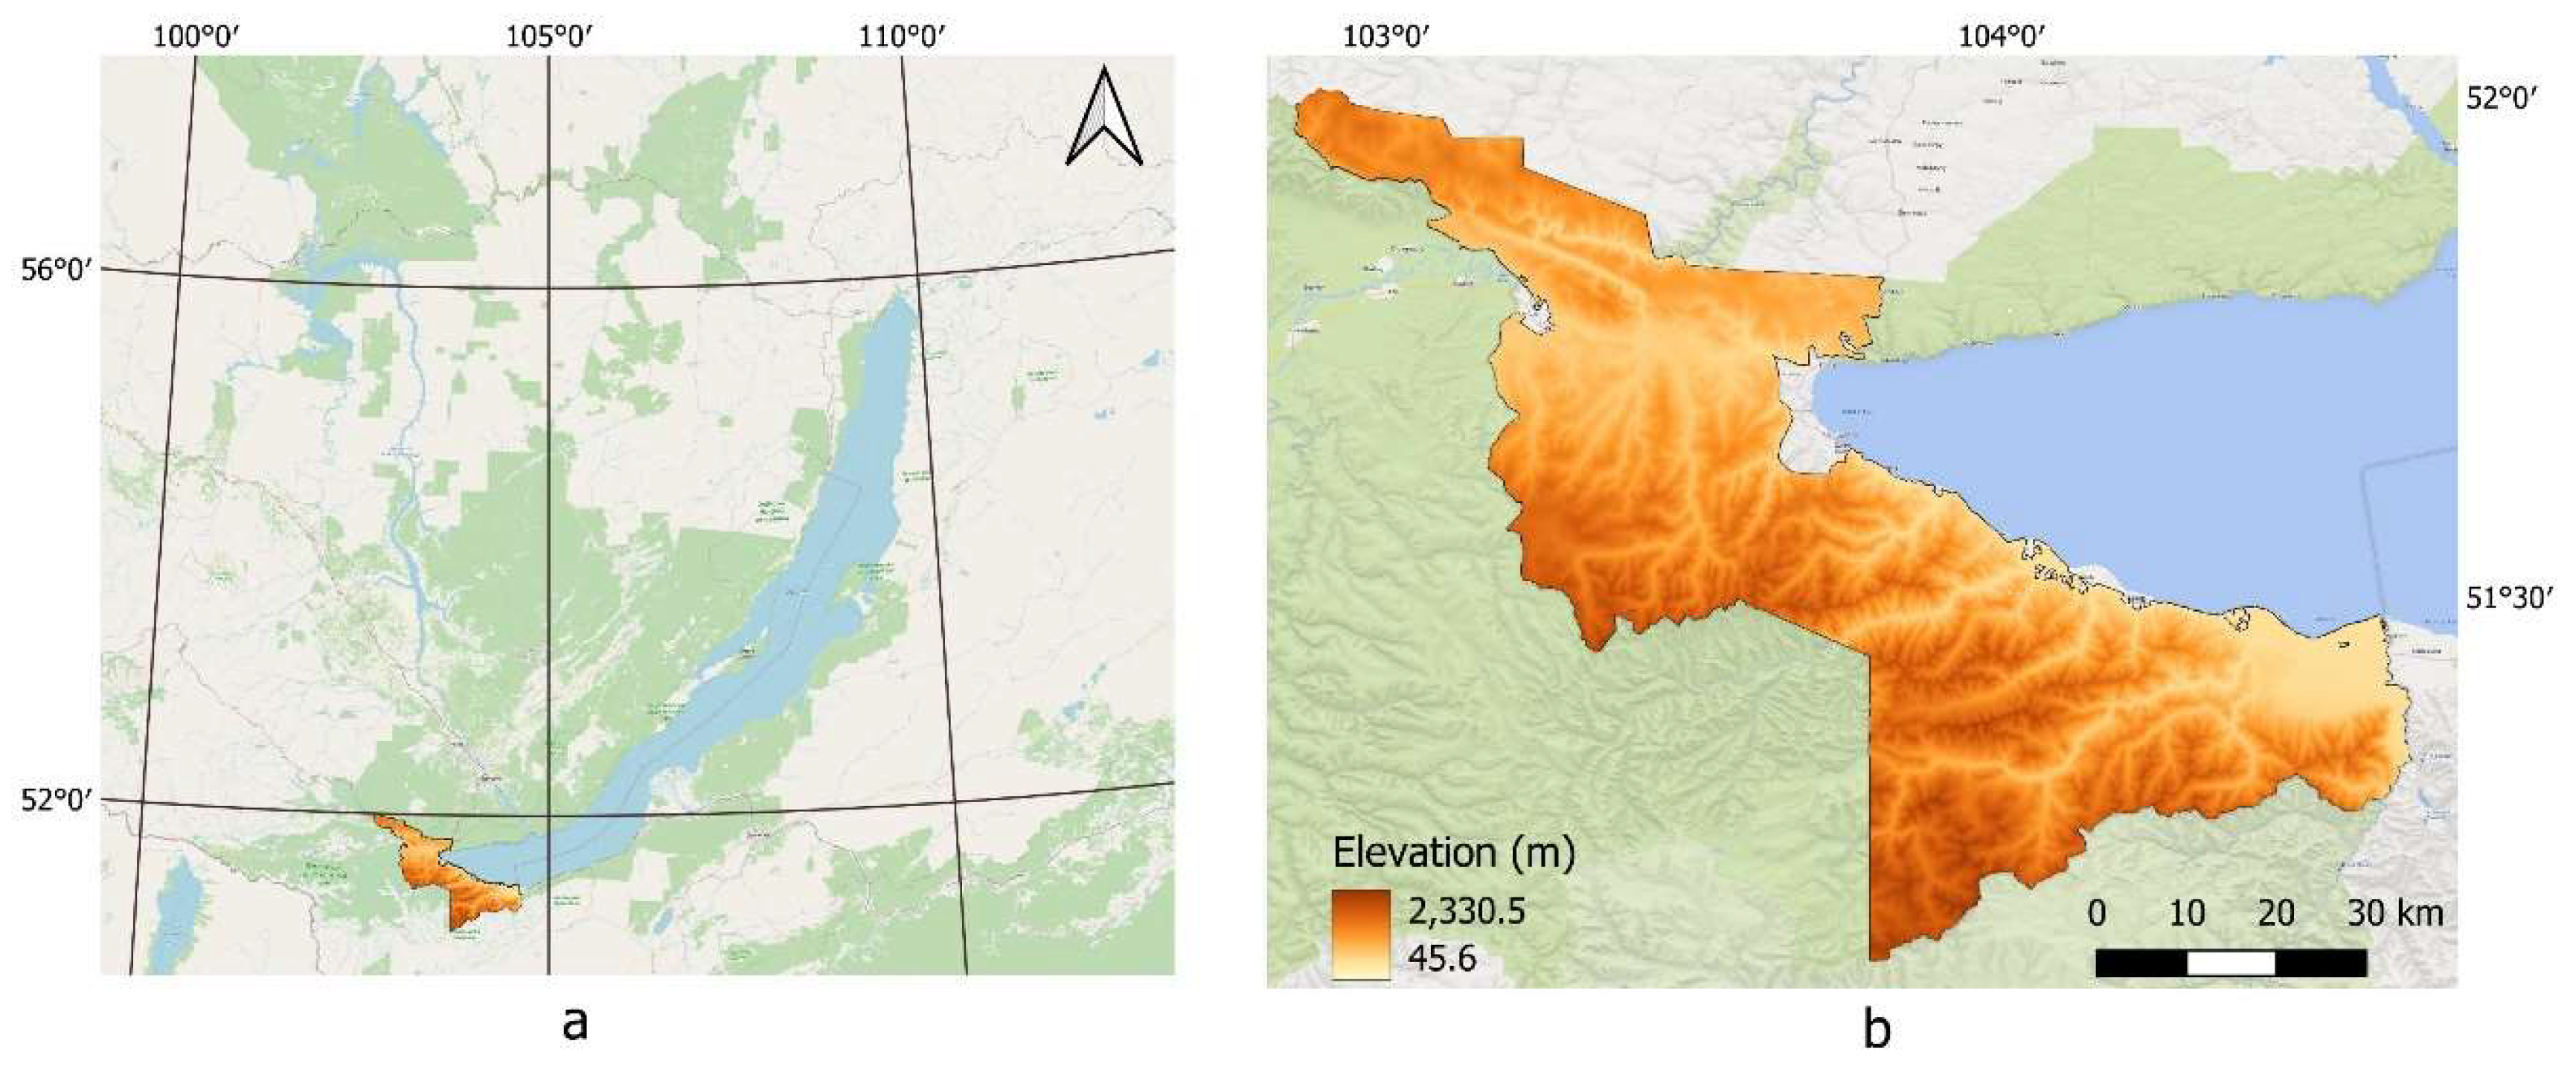
Figure 2.
Flowchart of the proposed method.
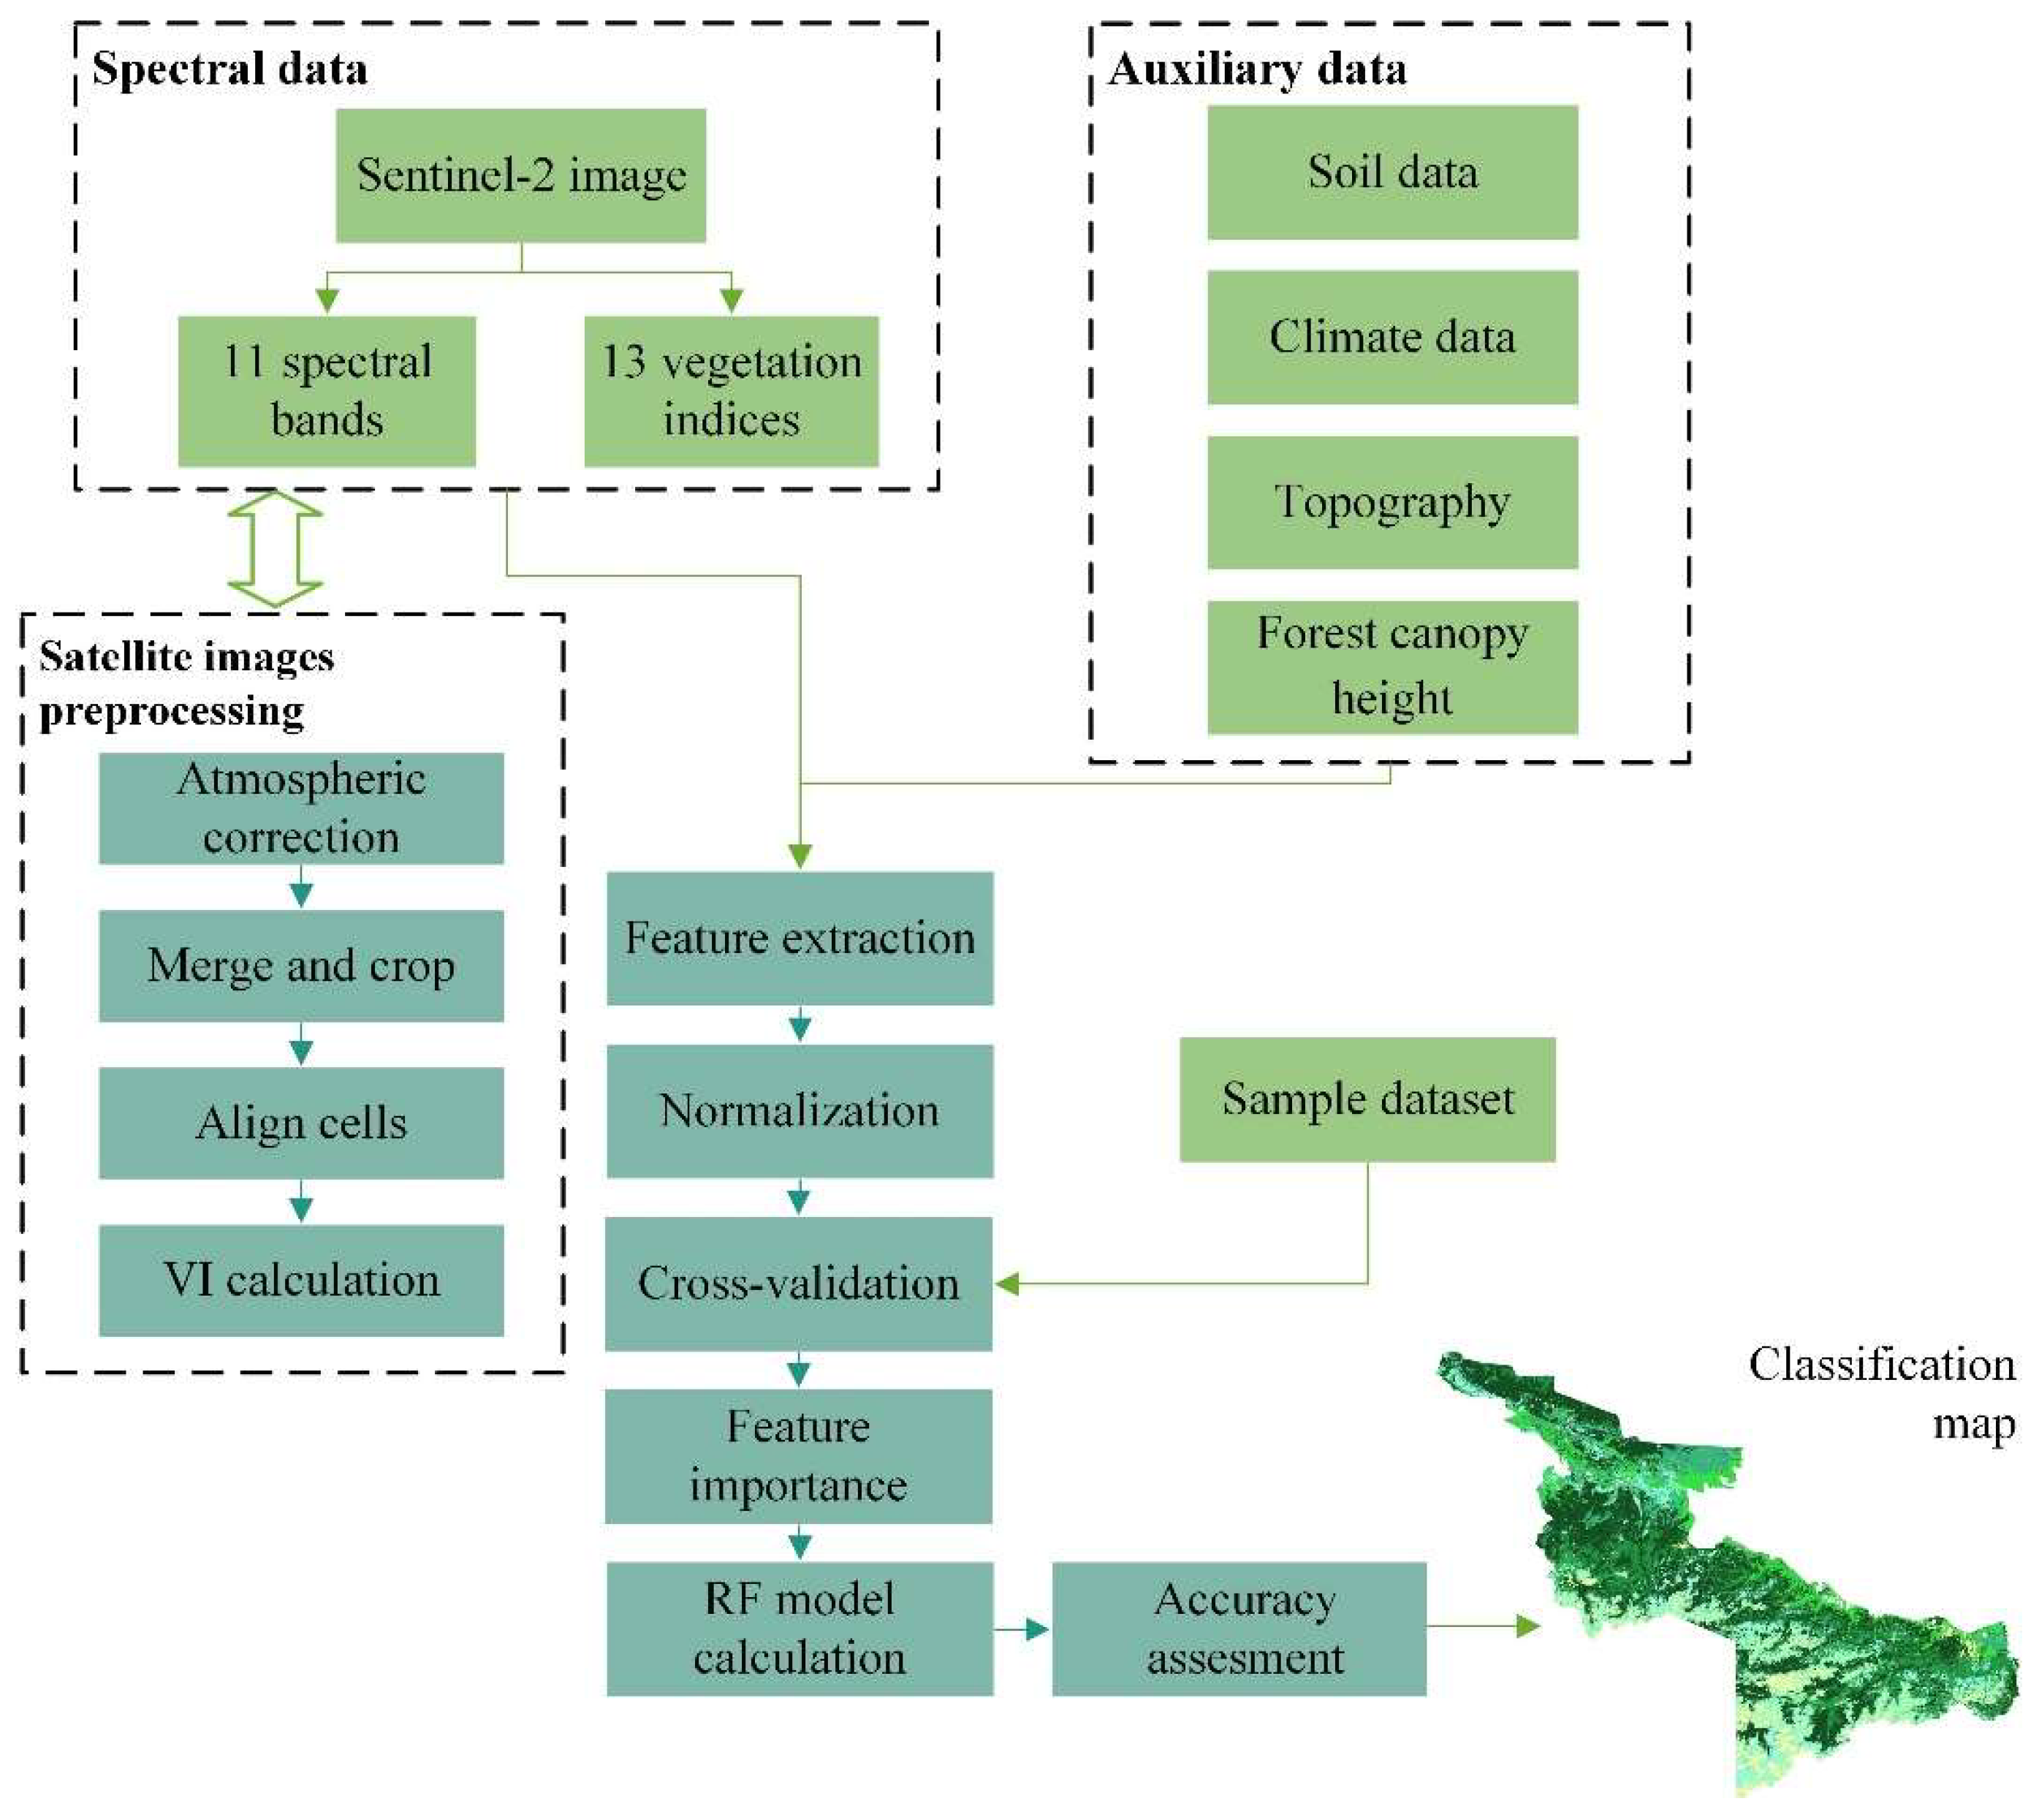
Figure 3.
Plot of tree species spectral characteristics by bands.
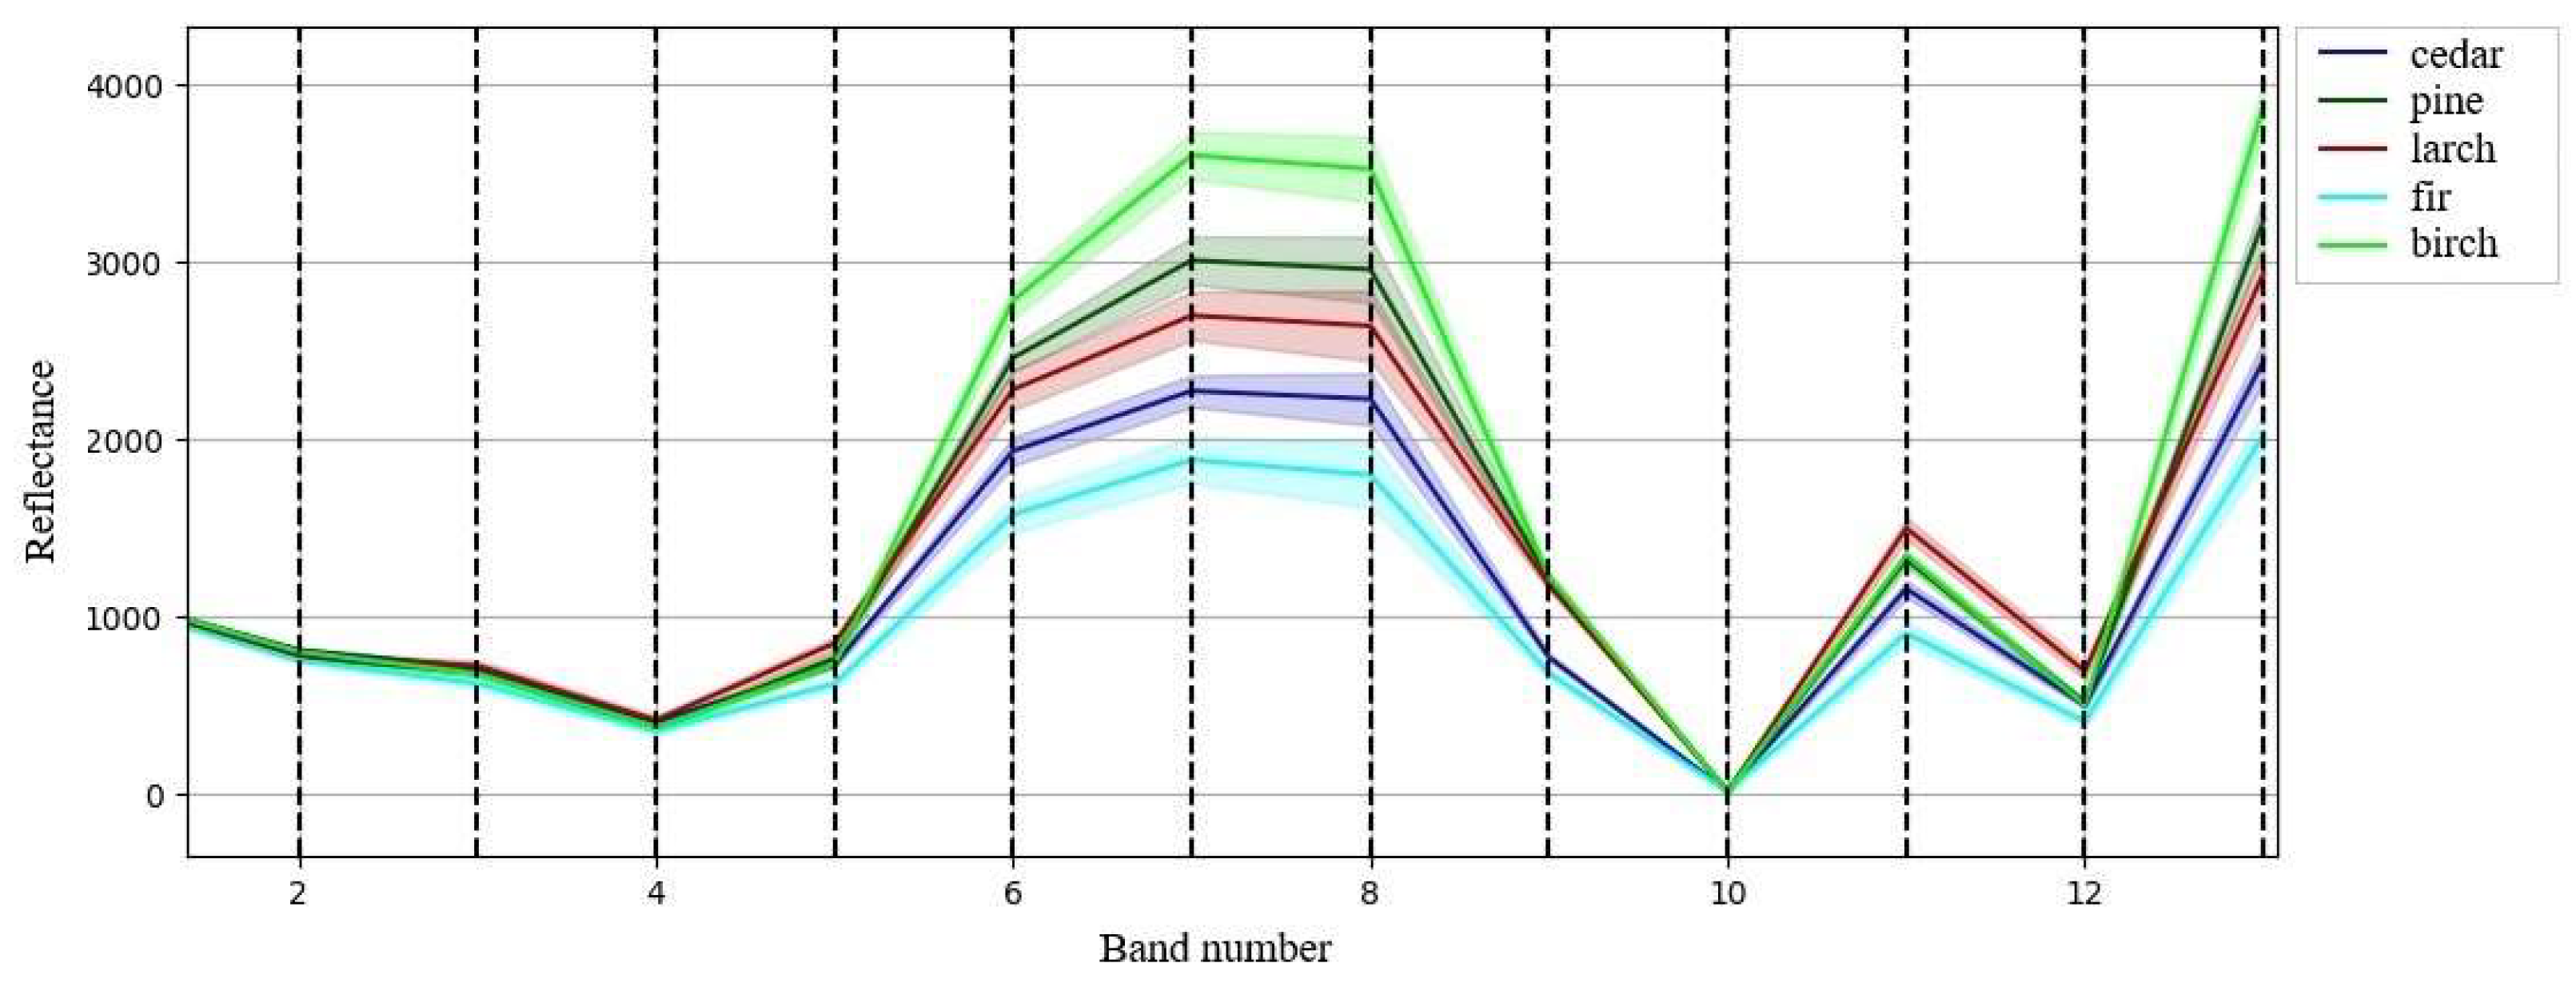
Figure 6.
Importance across all 101 features.
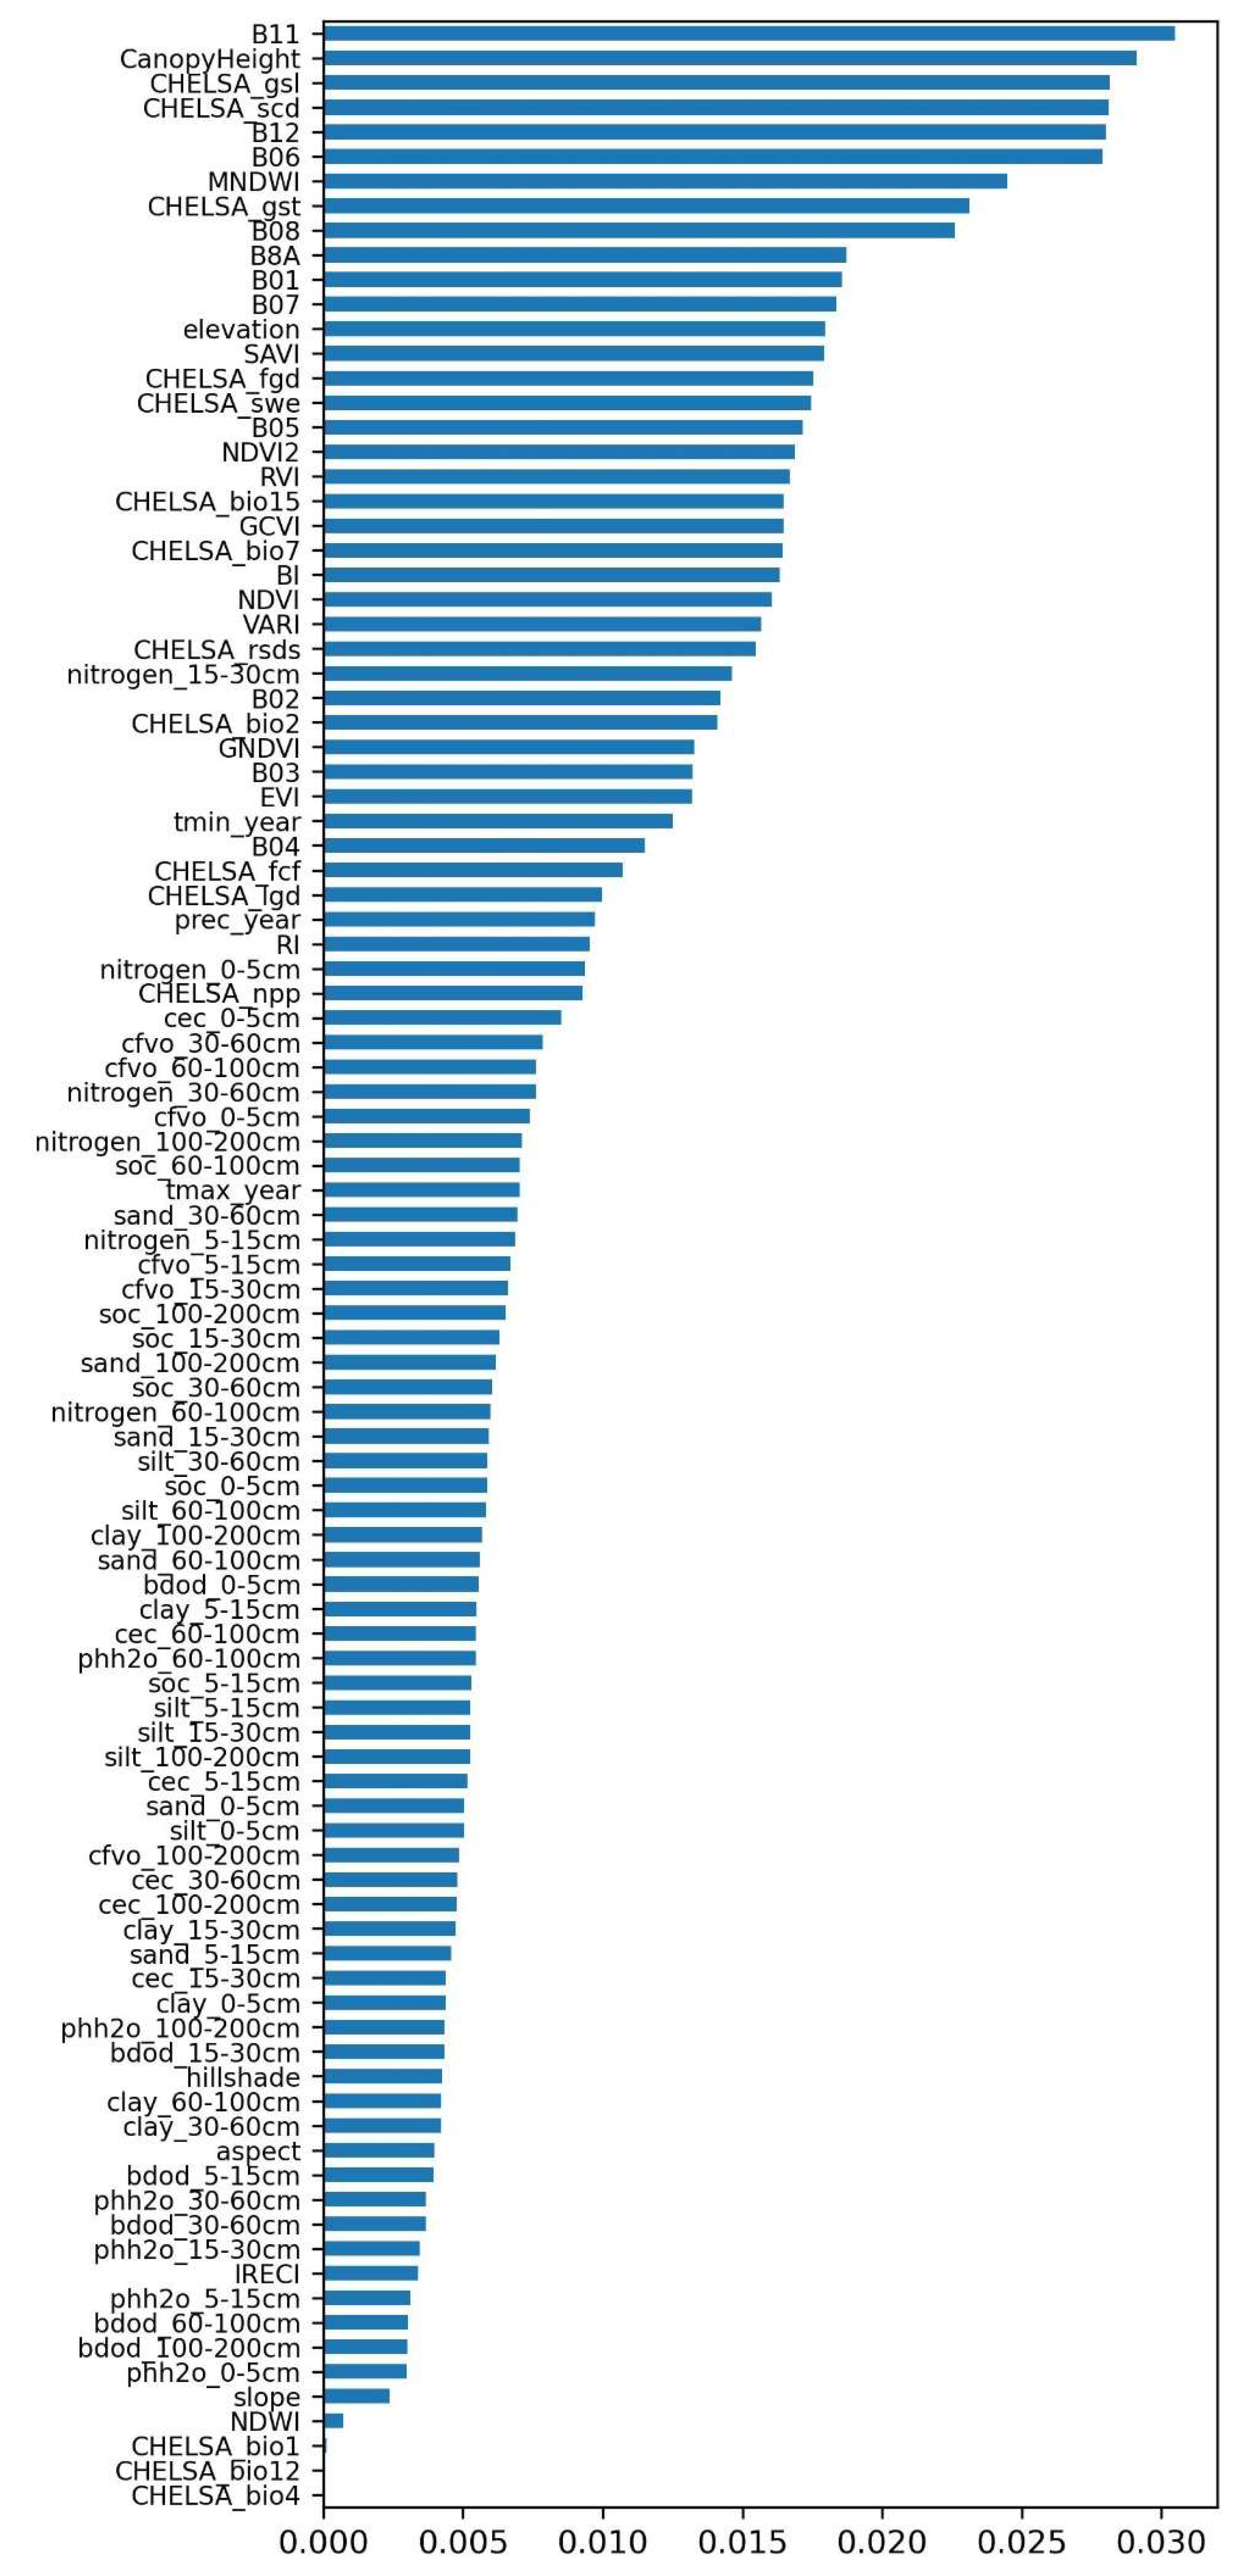
Figure 7.
Tree species distribution map: (a) – the entire territory of the Slyudyanskoye forestry; (b-e) enlarged spatial details of the map
Figure 7.
Tree species distribution map: (a) – the entire territory of the Slyudyanskoye forestry; (b-e) enlarged spatial details of the map
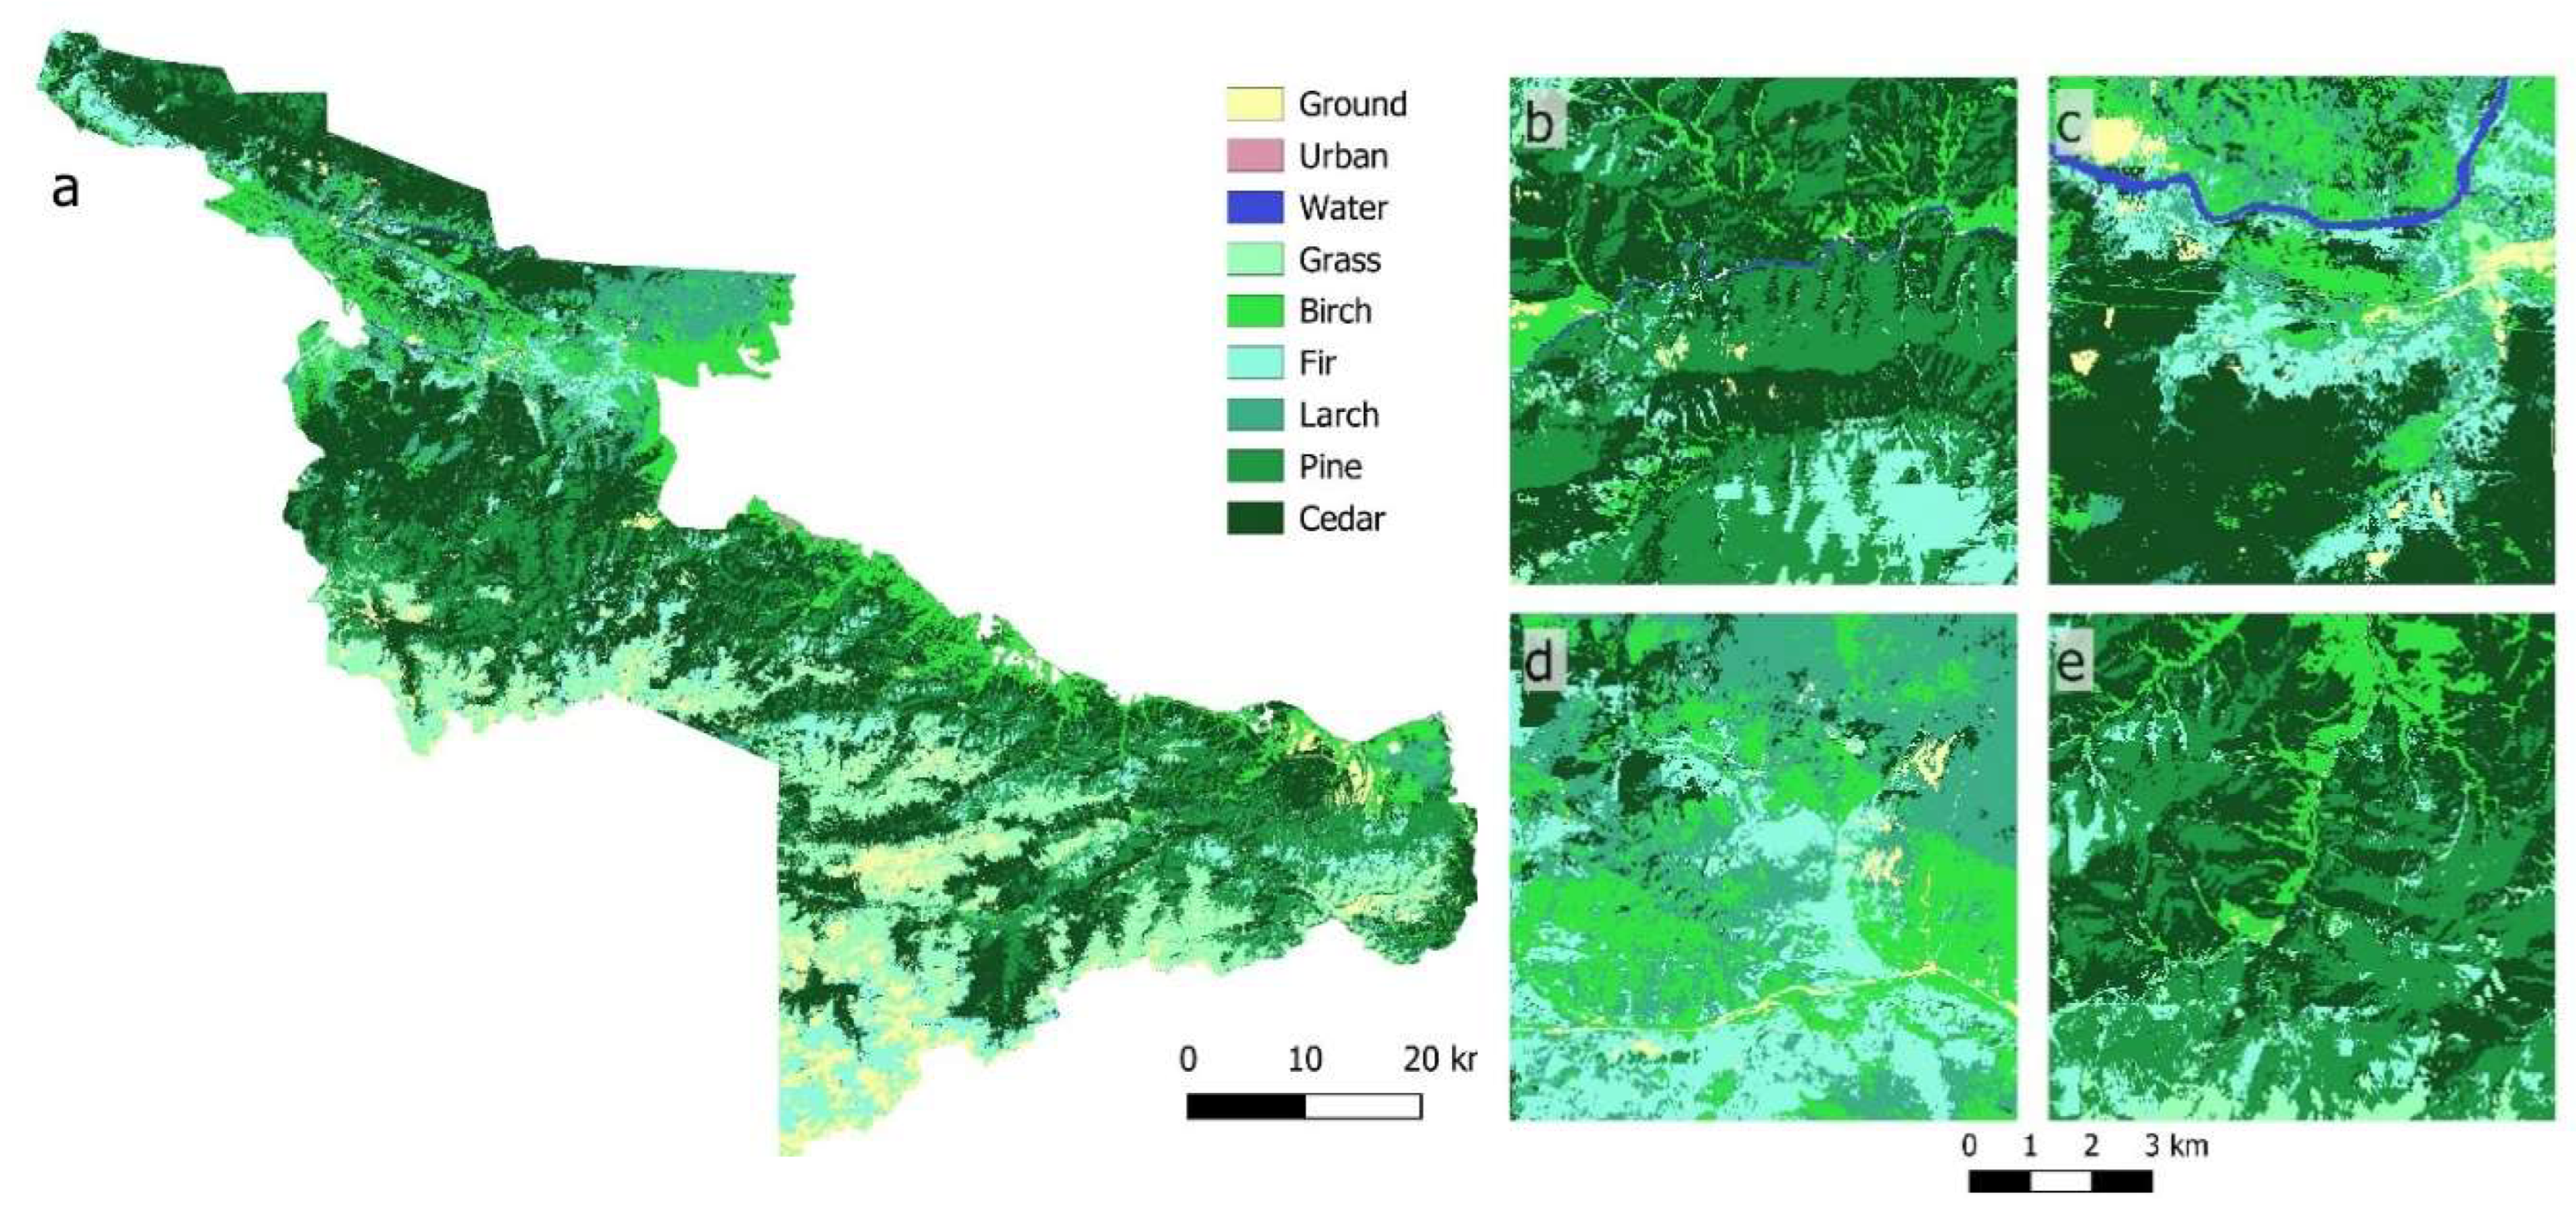

Table 1.
List of auxiliary data for classification.
| Data type | Dataset features | Features | Description |
|---|---|---|---|
| Vegetation indices | 13 indices | NDVI | |
| RVI | |||
| NDWI | |||
| RI | |||
| EVI | |||
| GNDVI | |||
| IRECI | |||
| BI | |||
| GCVI | |||
| MNDWI | |||
| NDVI2 | |||
| SAVI | |||
| VARI | |||
| Soil | Soilgrids, 9 features, for each of the 6 depth intervals, total 54 features |
bdod | Bulk density of the fine earth fraction, cg/cm³ |
| cec | Cation Exchange Capacity, mmol(c)/kg | ||
| cfvo | Volumetric fraction of coarse fragments (> 2 mm), cm3/dm3 | ||
| clay | Proportion of clay particles (< 0.002 mm), g/kg | ||
| nitrogen | Total nitrogen, cg/kg | ||
| phh2o | Soil pH | ||
| sand | Proportion of sand particles (> 0.05 mm), g/kg | ||
| silt | Proportion of silt particles (≥ 0.002 mm and ≤ 0.05 mm), g/kg | ||
| soc | Soil organic carbon content, dg/kg | ||
| Climate | WorldClim, 3 features |
tmax | Average maximum temperature, °C |
| tmin | Average minimum temperature, °C | ||
| precepitation | Precipitation amount, mm | ||
| Chelsa, 15 features |
bio1 | Mean annual air temperature, °C | |
| bio2 | Mean diurnal air temperature range, °C | ||
| bio4 | Temperature seasonality (standard deviation of the monthly mean temperatures), °C/100 | ||
| bio7 | Annual range of air temperature, °C | ||
| bio12 | Annual precipitation amount, kg/m2 | ||
| bio15 | Precipitation seasonality, kg/m2 | ||
| fcf | Frost change frequency | ||
| fgd | First day of the growing season | ||
| gsl | Growing season length | ||
| gst | Mean temperature of the growing season, °C | ||
| lgd | Last day of the growing season | ||
| npp | Net primary productivity, gC/m2 | ||
| rsds_mean | Mean monthly surface downwelling shortwave flux in air, MJ/m2 | ||
| scd | Snow cover days | ||
| swe | Snow water equivalent, kg/m2 | ||
| Topography | Copernicus Digital Surface Model (DEM), 4 features |
aspect | Orientation of the slope in degrees |
| slope | Relief slope angle | ||
| hillshade | Terrain shading | ||
| elevation | Elevation above sea level | ||
| Forest canopy height | ETH Global Sentinel-2 10m Canopy Height, 1 feature |
CanopyHeight | Global forest canopy height |
| Total 90 auxiliary features | |||
Table 2.
Features combination schemes.
| Model | Features combinations | Number of features |
|---|---|---|
| 1 | Sentinel-2 bands | 11 |
| 2 | Sentinel-2 + vegetation indices (S2+VI) | 24 |
| 3 | Sentinel-2 + Canopy height (S2+CH) | 12 |
| 4 | Sentinel-2 + topographic features (S2+topo) | 15 |
| 5 | Sentinel-2 + climate features (S2+clim) | 29 |
| 6 | Sentinel-2 + soil features (S2+Soil) | 65 |
| 7 | All collected features | 101 |
| 8 | Set of selected features | 98 |
Table 3.
Overall model performance.
| Model | Overall accuracy, % | Precision | Recall | F1-score |
|---|---|---|---|---|
| S2 | 49.59 | 0.55 | 0.50 | 0.53 |
| S2+VI | 49.93 | 0.55 | 0.50 | 0.53 |
| S2+CH | 51.86 | 0.59 | 0.52 | 0.56 |
| S2+topo | 55.86 | 0.62 | 0.56 | 0.61 |
| S2+Clim | 67.38 | 0.68 | 0.67 | 0.69 |
| S2+Soil | 69.86 | 0.70 | 0.70 | 0.70 |
| 101 features | 78.8 | 0.77 | 0.79 | 0.79 |
| 98 features | 80.69 | 0.79 | 0.81 | 0.81 |
Table 4.
Overall accuracy by tree species.
| Tree species | S2 | S2+VI | S2+CH | S2+topo | S2+Clim | S2+Soil | 101 | 98 |
|---|---|---|---|---|---|---|---|---|
| Birch | 65.69 | 65.69 | 63.18 | 69.04 | 69.46 | 72.38 | 76.57 | 79.92 |
| Fir | 44.44 | 43.7 | 44.44 | 52.59 | 62.96 | 62.96 | 82.22 | 83.7 |
| Larch | 54.78 | 56.69 | 58.6 | 60.51 | 72.61 | 61.15 | 79.62 | 80.89 |
| Pine | 36.97 | 36.55 | 41.6 | 37.82 | 65.97 | 60.50 | 79.83 | 80.67 |
| Cedar | 56.25 | 55.68 | 58.52 | 61.65 | 71.02 | 80.11 | 82.10 | 84.66 |
| Average by species | 51.63 | 51.66 | 53.27 | 56.32 | 68.40 | 67.42 | 80.07 | 81.97 |
Disclaimer/Publisher’s Note: The statements, opinions and data contained in all publications are solely those of the individual author(s) and contributor(s) and not of MDPI and/or the editor(s). MDPI and/or the editor(s) disclaim responsibility for any injury to people or property resulting from any ideas, methods, instructions or products referred to in the content. |
© 2025 by the authors. Licensee MDPI, Basel, Switzerland. This article is an open access article distributed under the terms and conditions of the Creative Commons Attribution (CC BY) license (http://creativecommons.org/licenses/by/4.0/).
Copyright: This open access article is published under a Creative Commons CC BY 4.0 license, which permit the free download, distribution, and reuse, provided that the author and preprint are cited in any reuse.


