Submitted:
29 January 2025
Posted:
30 January 2025
You are already at the latest version
Abstract
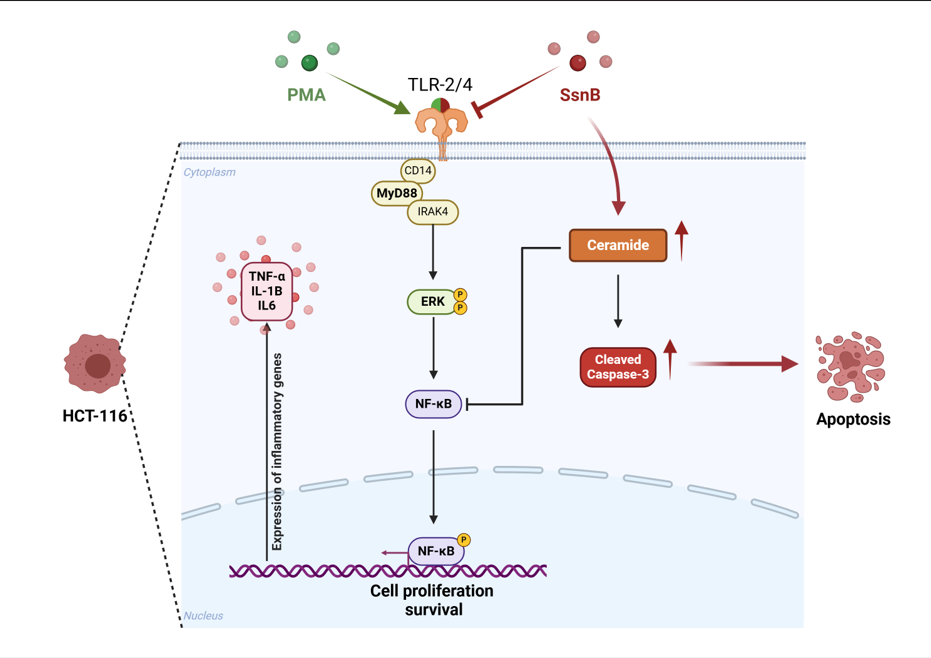
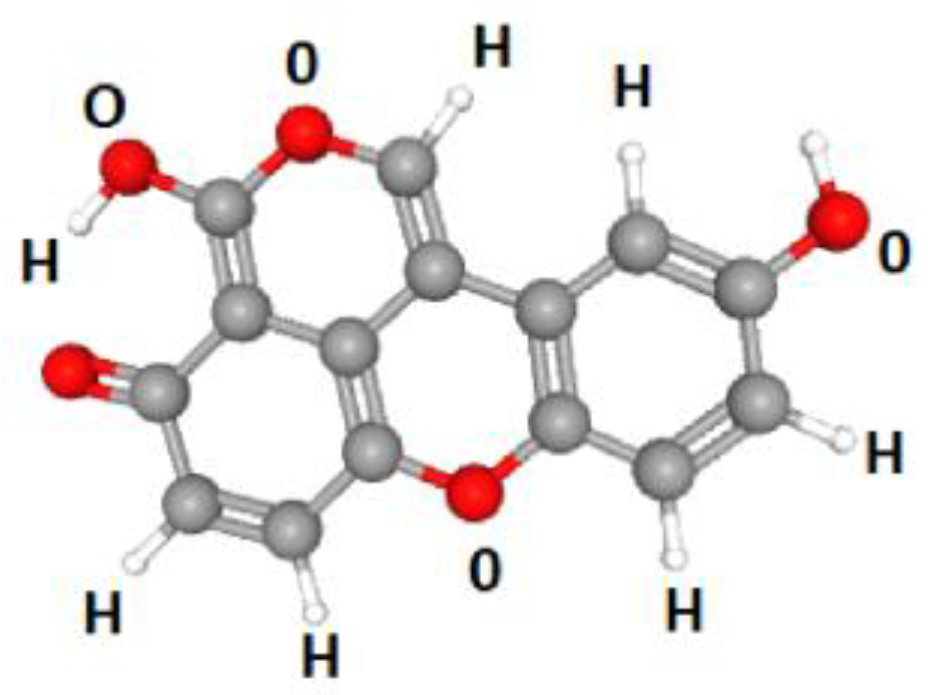
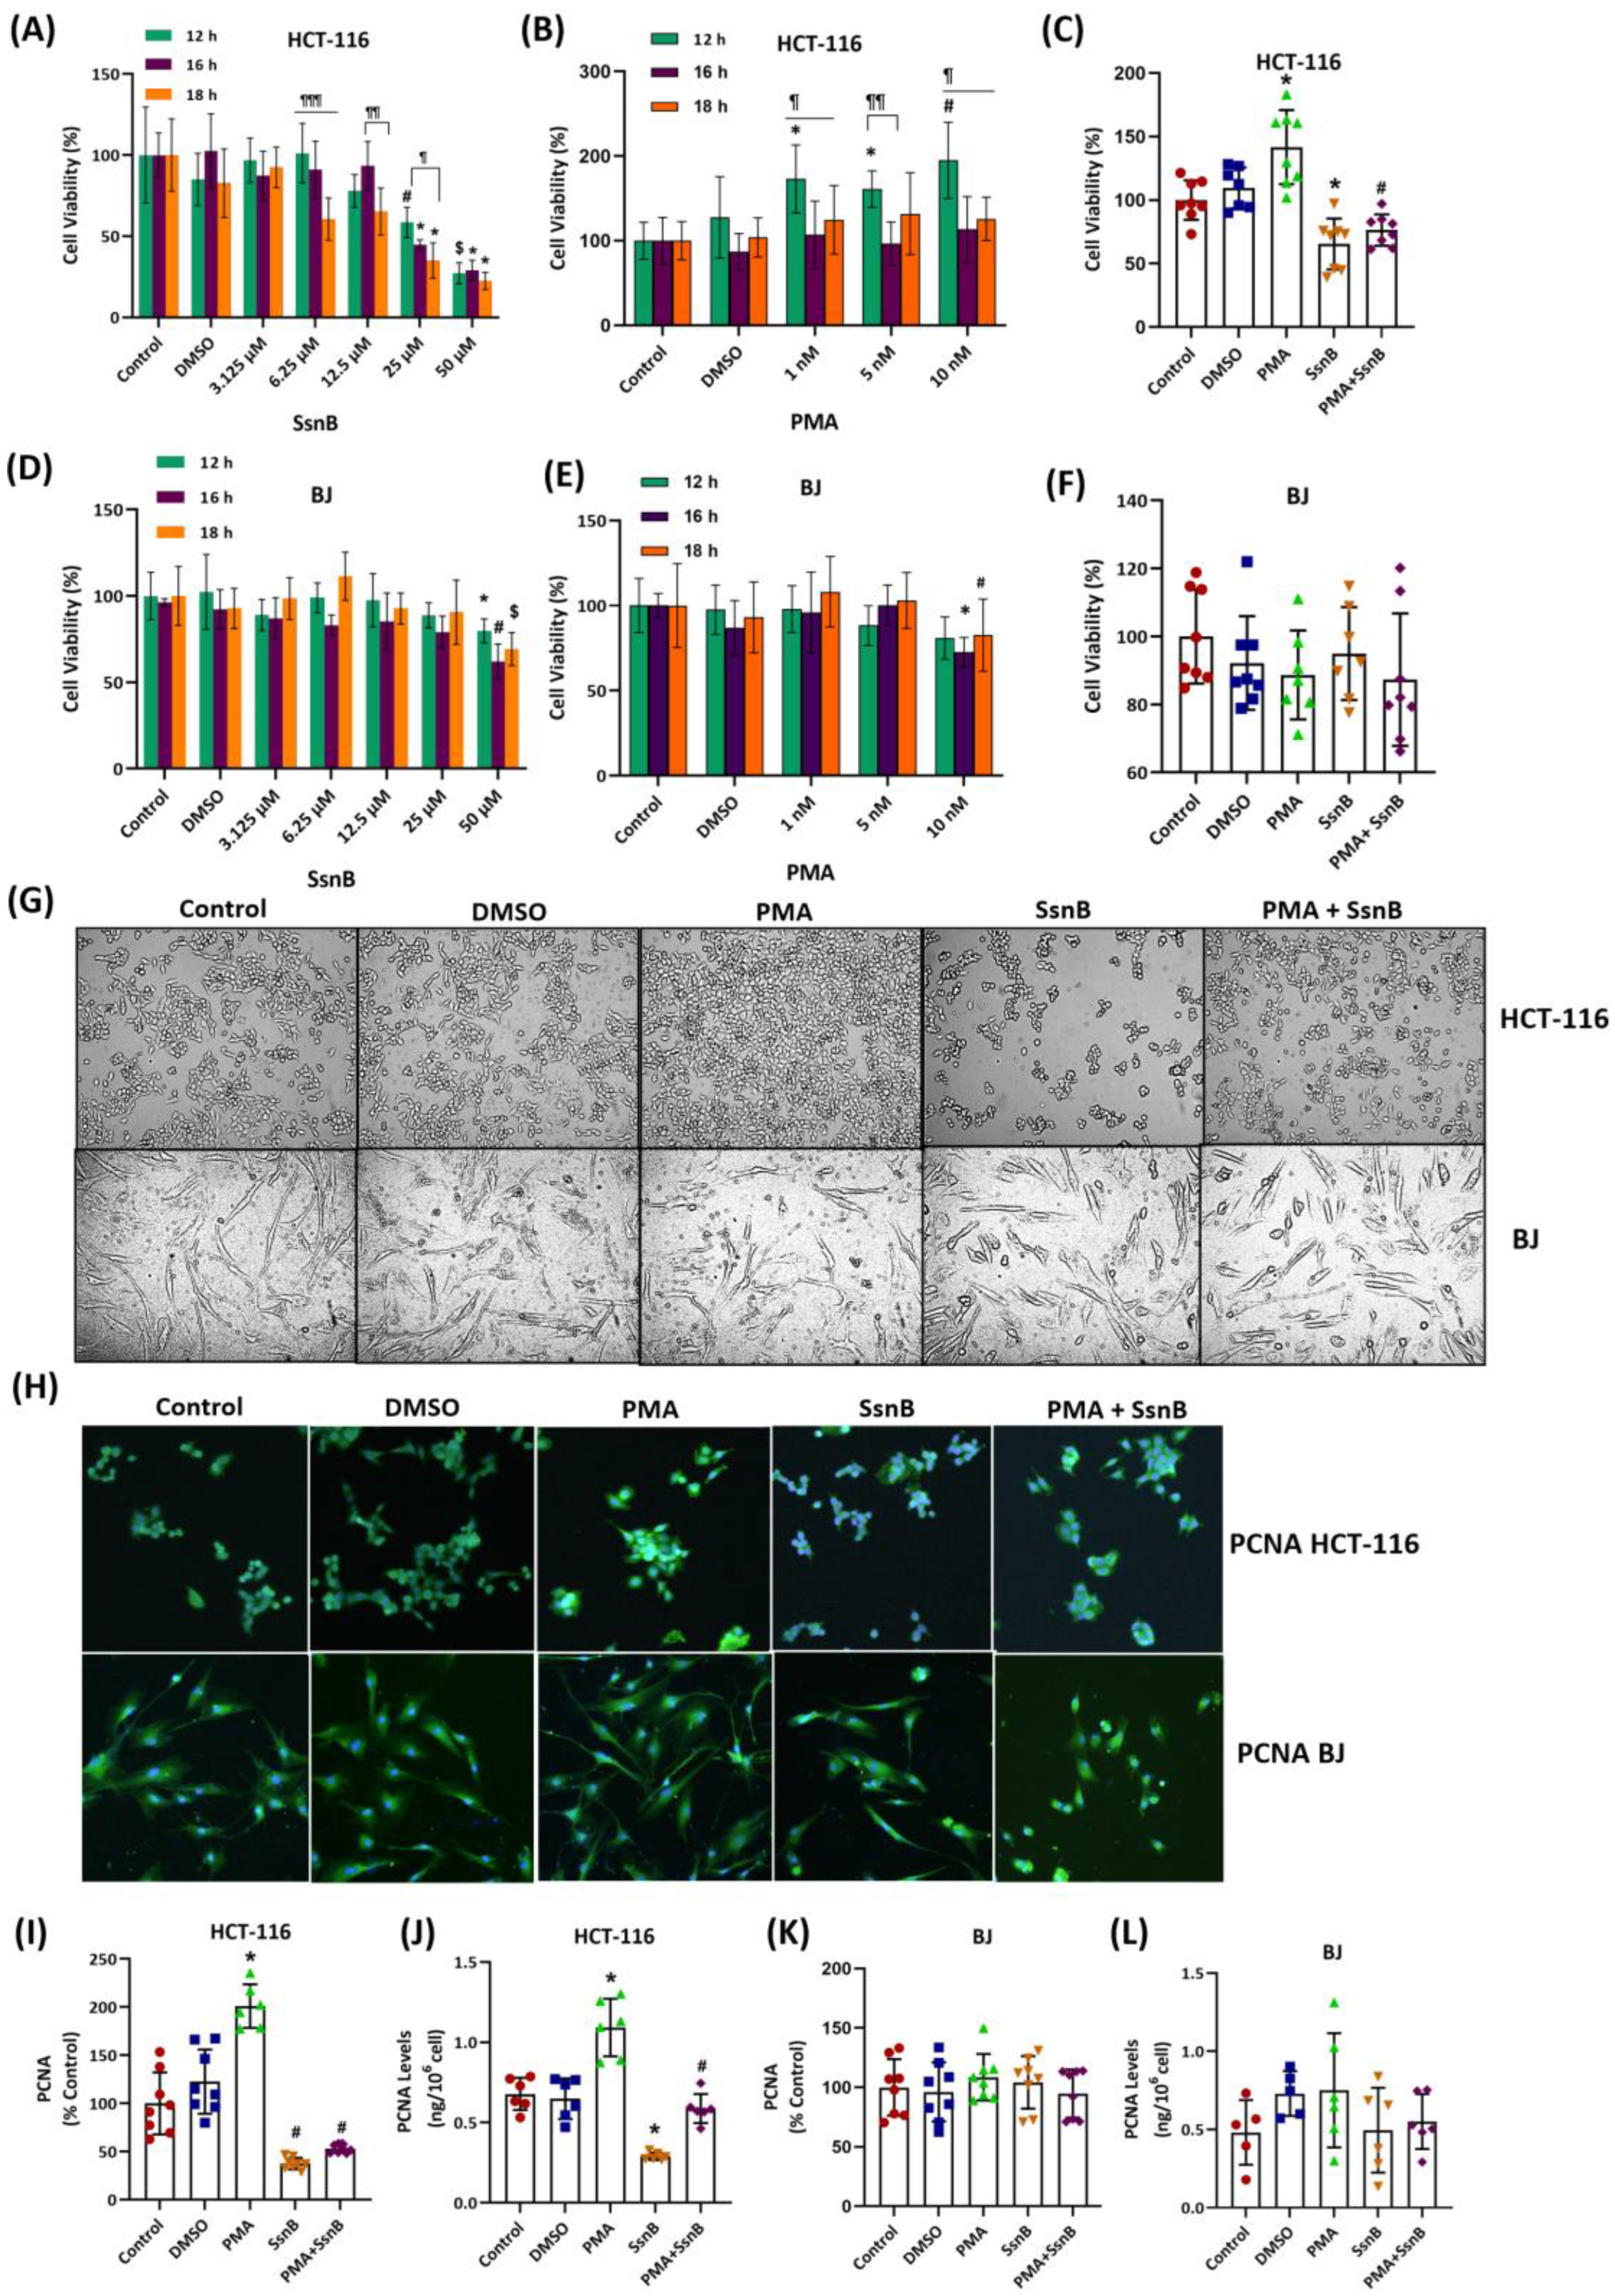
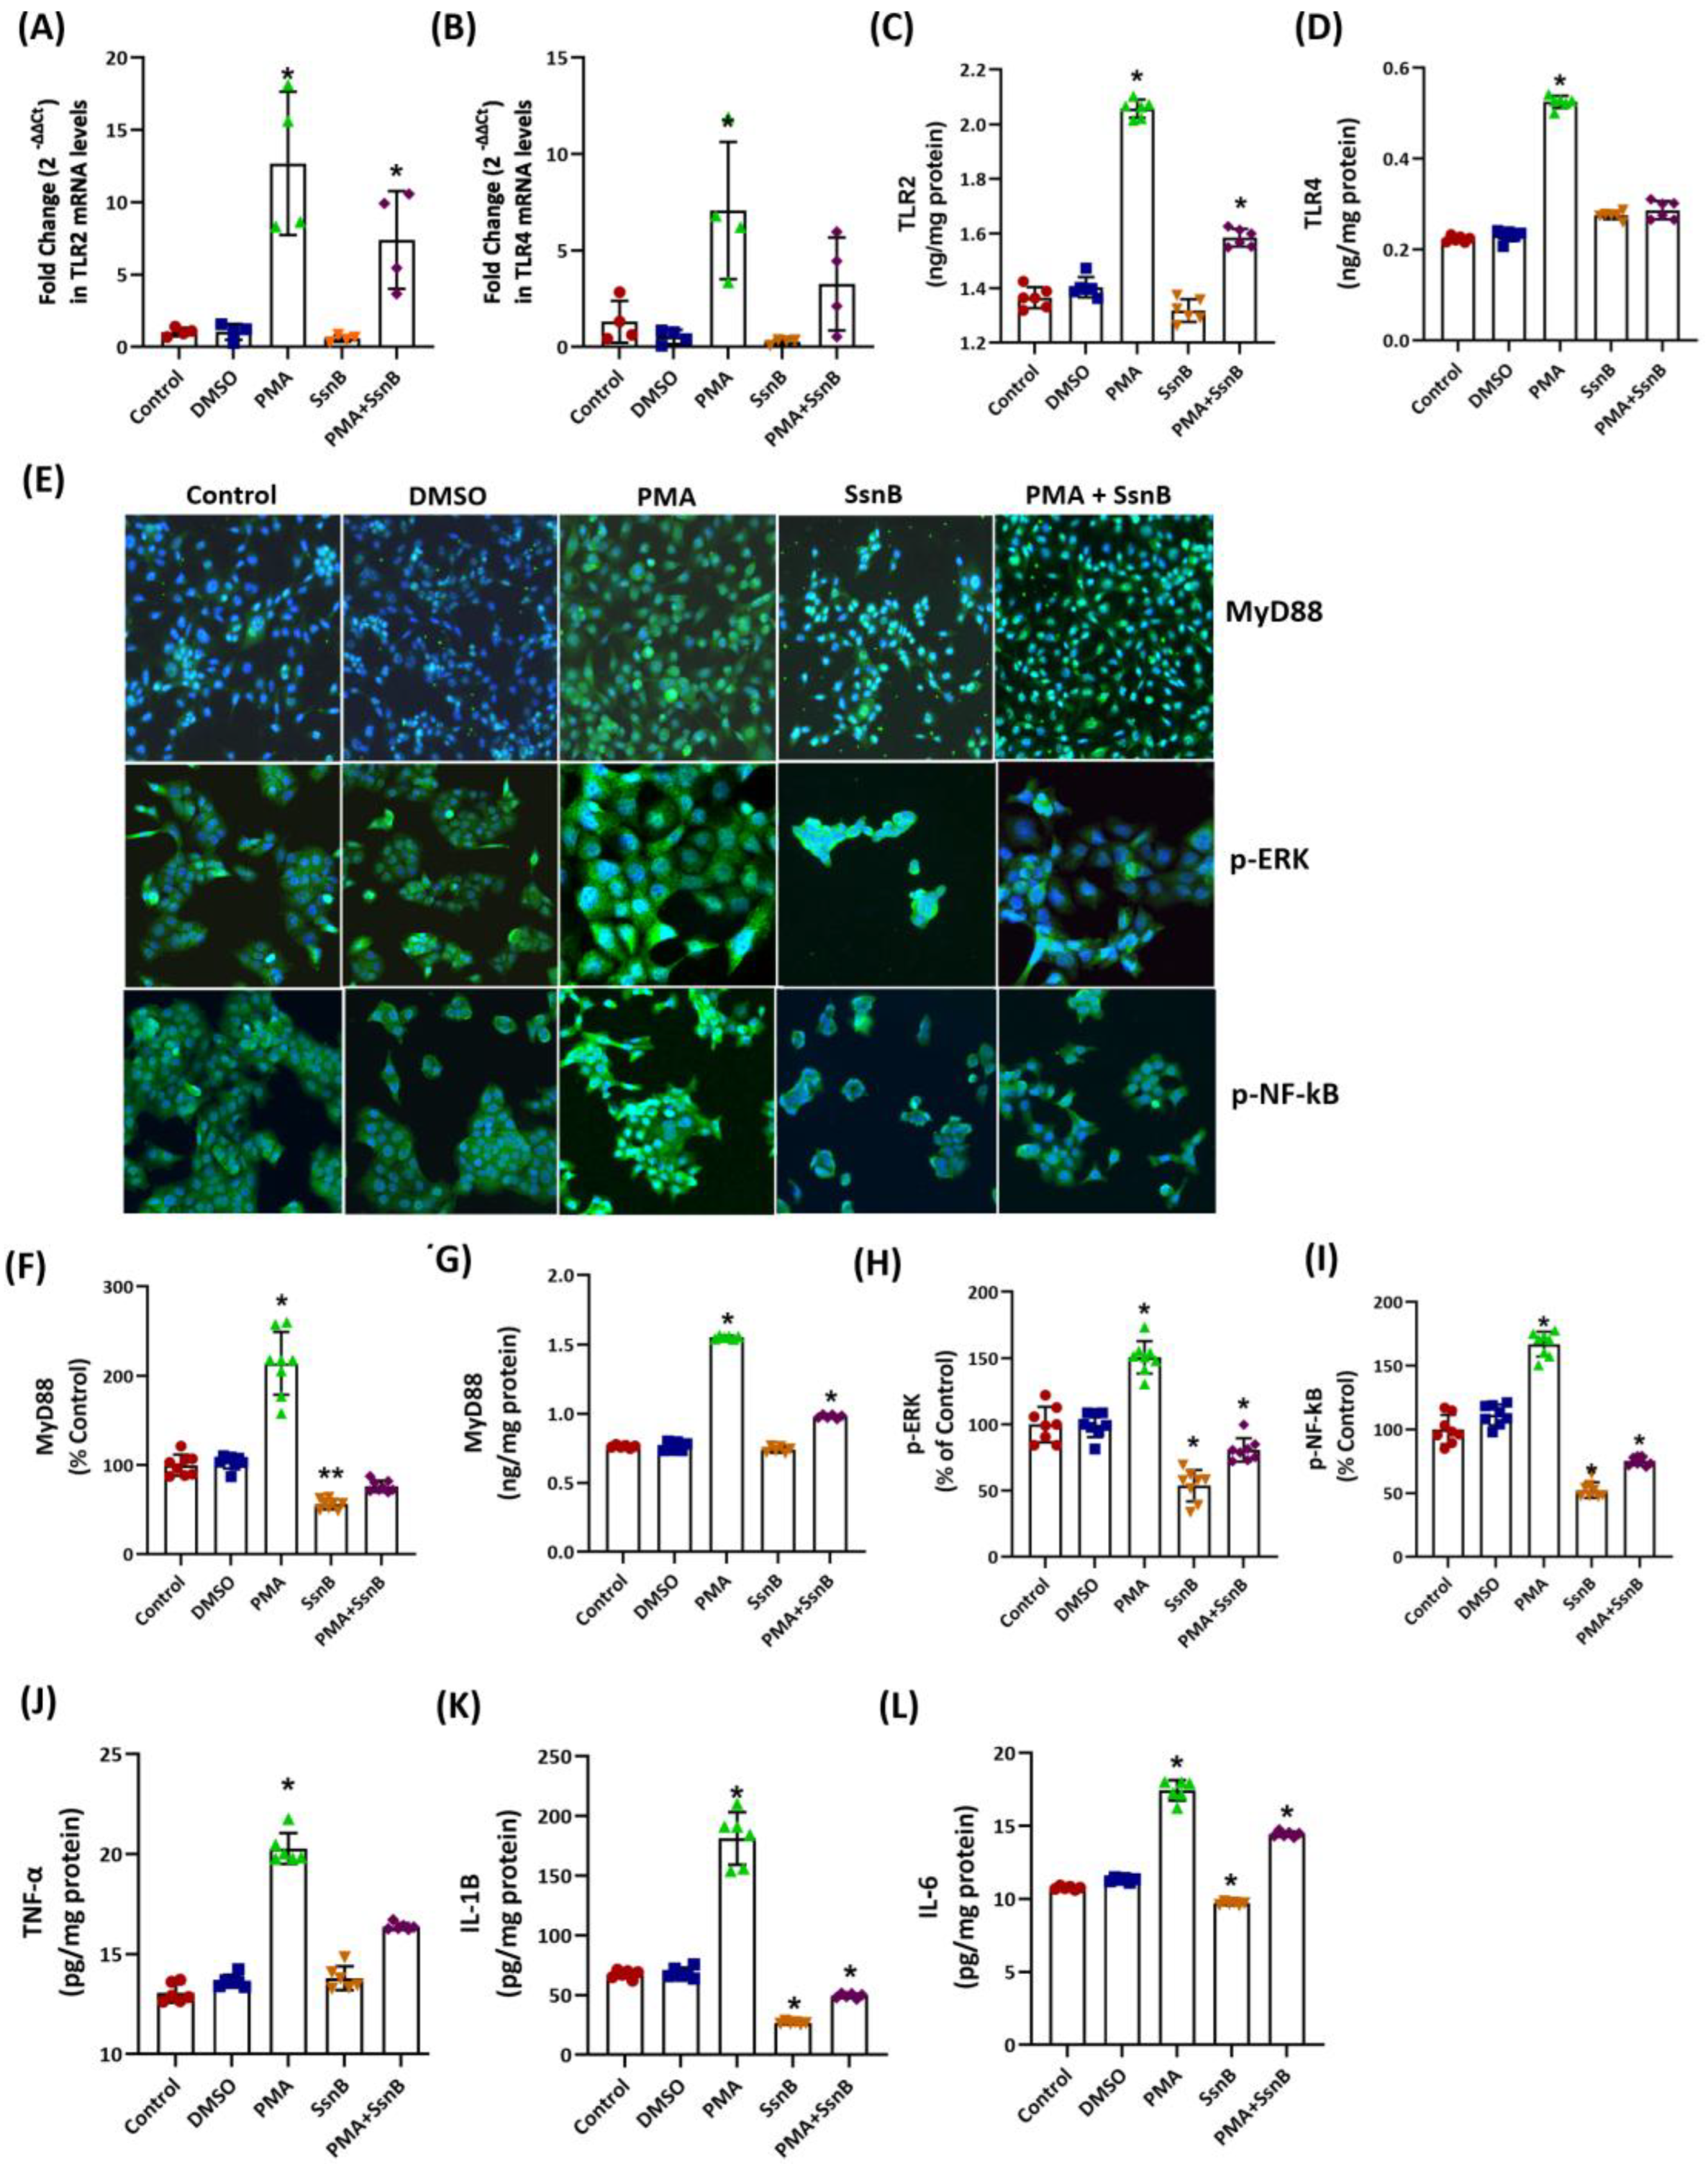
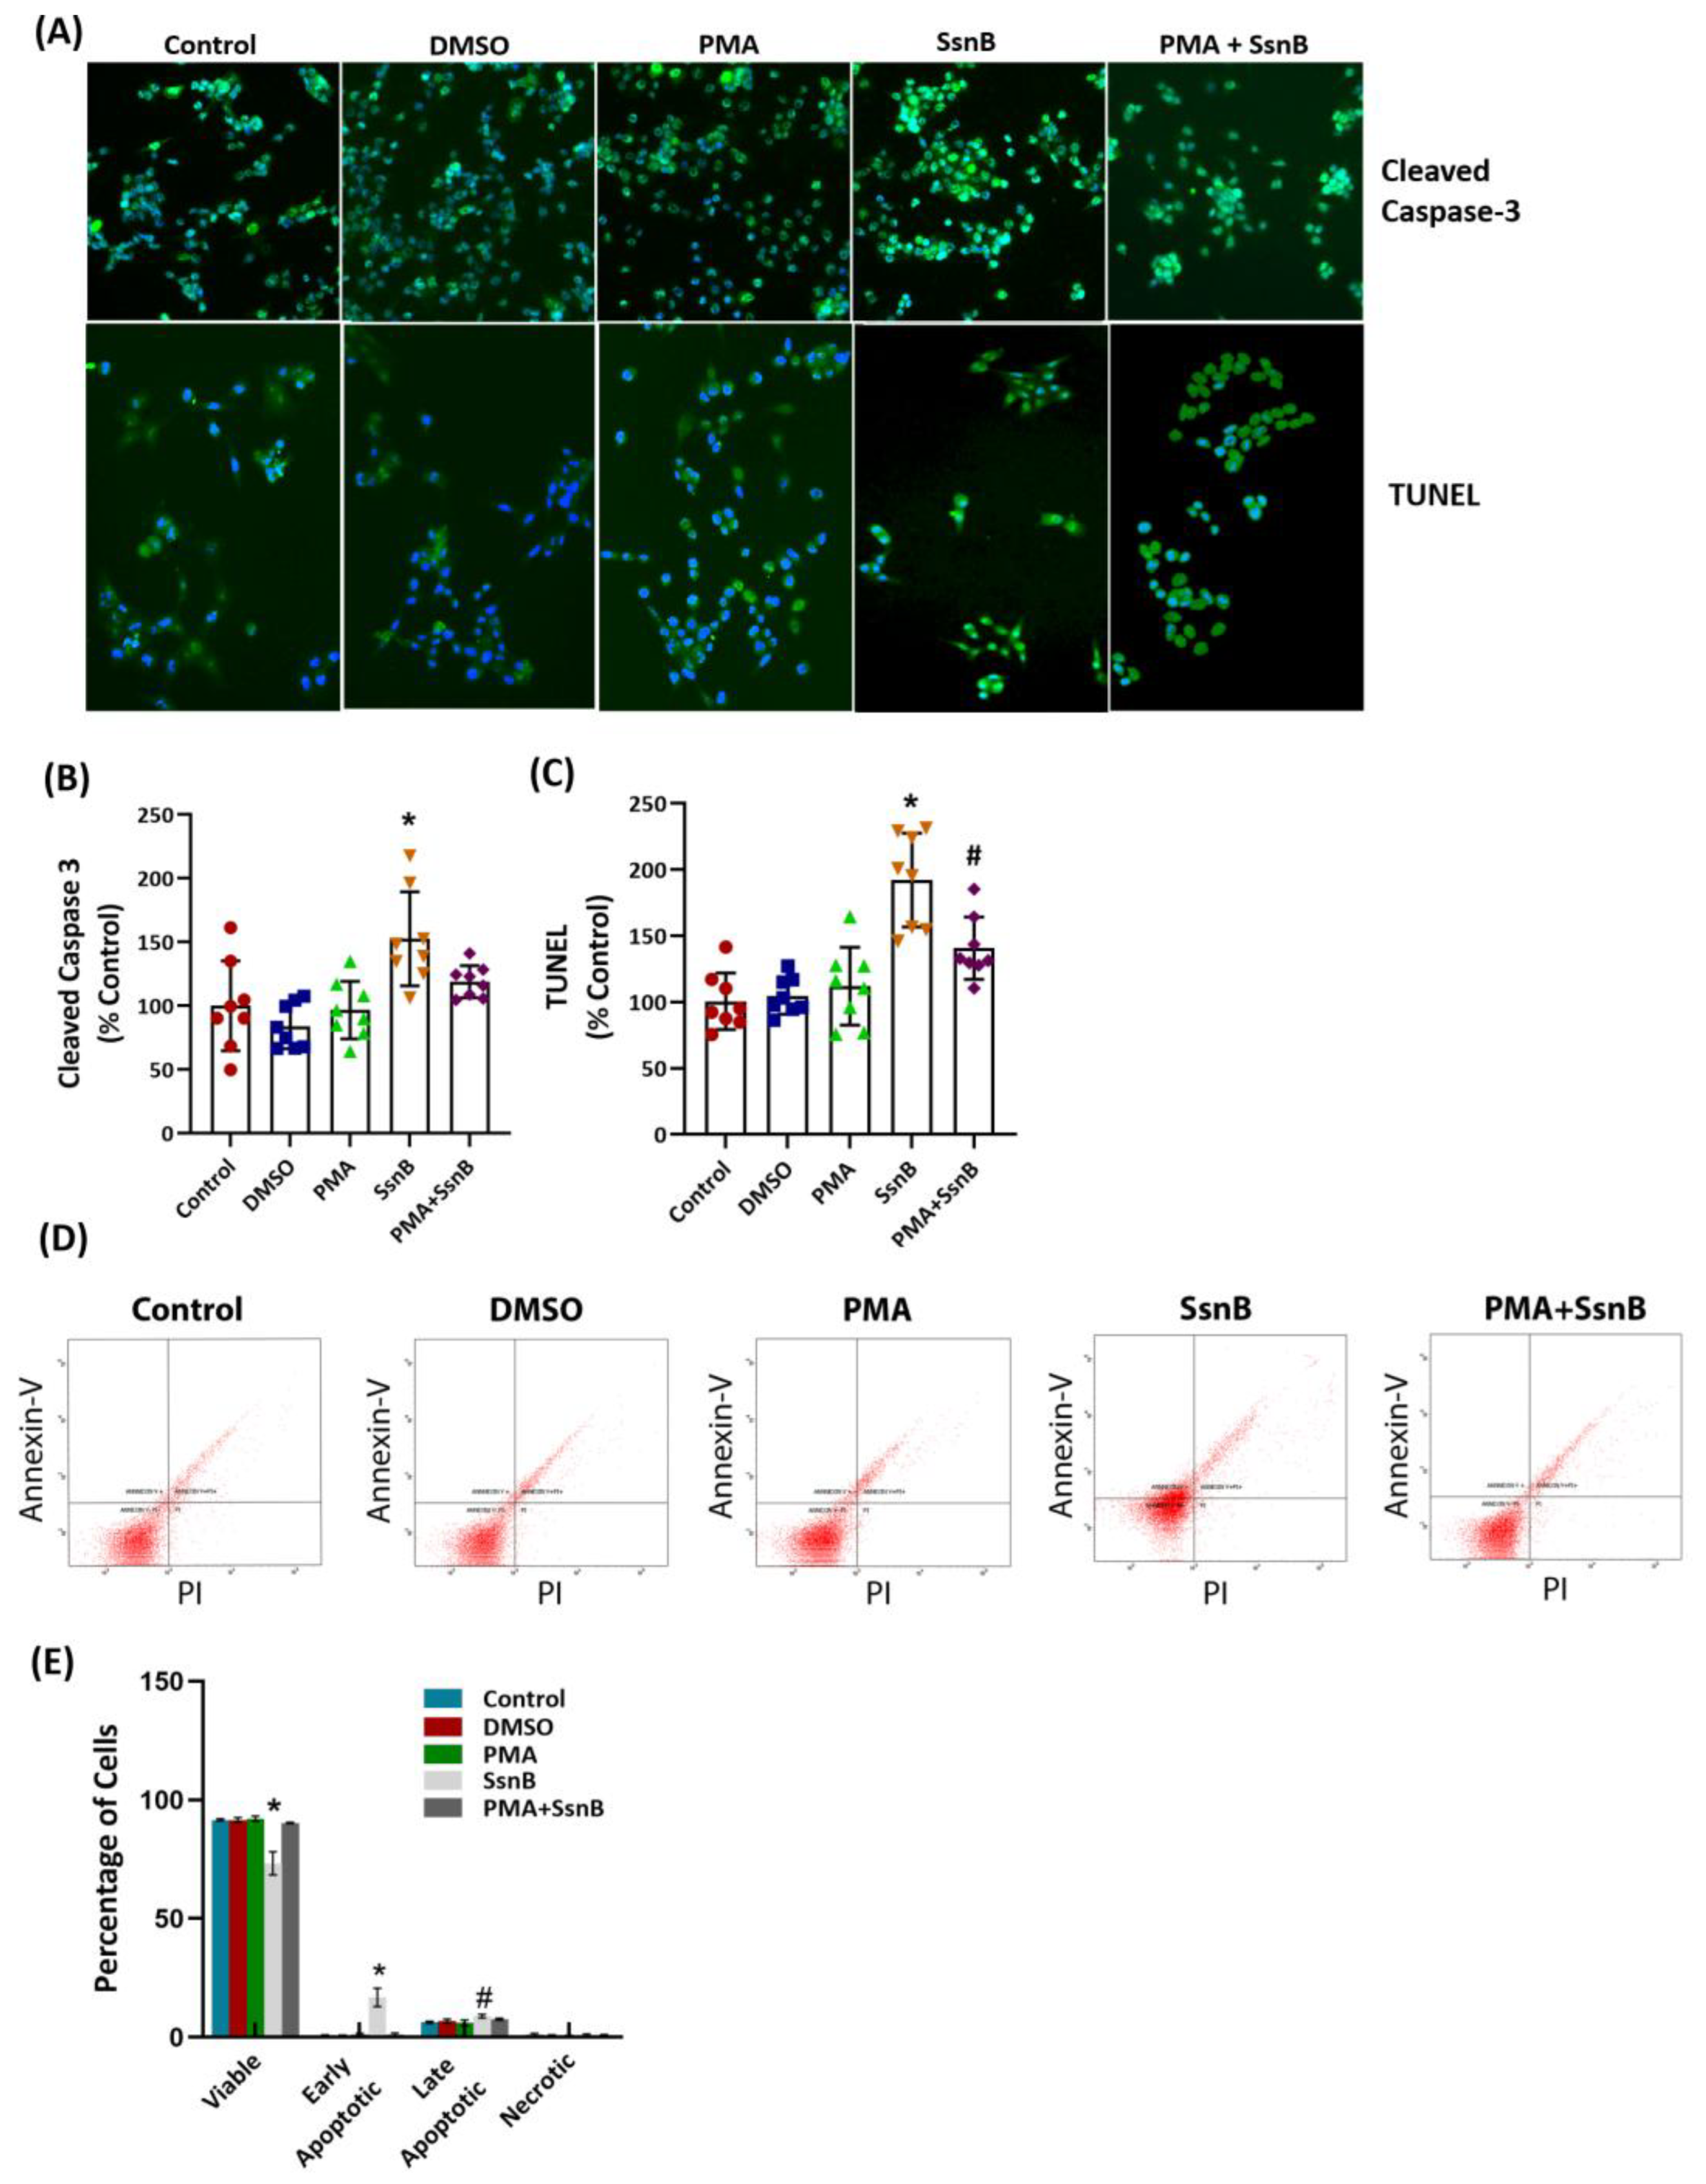
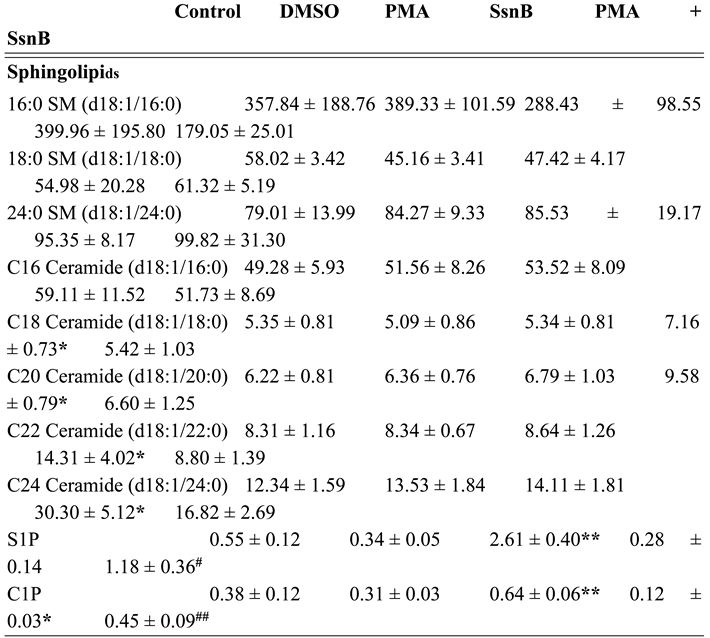
Background: Sparstolonin B (SsnB), a natural compound with an-ti-inflammatory and anti-proliferative properties, was investigated for its effects on cell viability, apoptosis, and inflammatory pathways in human colorectal cancer cells (HCT-116) and healthy human fibroblasts (BJ). Phorbol 12-myristate 13-acetate (PMA), a tumor promoter and inflammatory activator, was used to stimulate prolifer-ation and inflammatory pathways. Methods: HCT-116 and BJ cells were treated with SsnB (3.125–50 μM) or PMA (1–10 nM) for 12–18 hours. Cell viability was assessed using viability assays, while apoptosis was evaluated by cleaved caspase-3 staining, Terminal deoxynucleotidyl transferase dUTP nick end labeling (TUNEL), and flow cy-tometry. Proliferation was analyzed through proliferating cell nuclear antigen (PCNA) staining. Toll-like receptor (TLR) signaling, cytokine expression, and sphingolipid lev-els were measured using immunofluorescence, enzyme-linked immunosorbent assay (ELISA), and mass spectrometry, respectively. Results: SsnB significantly reduced HCT-116 cell viability in a dose- and time-dependent manner, with minimal effects on BJ cells. PMA stimulated proliferation, PCNA expression, and inflammatory markers, including TLR2, TLR4, MyD88, phosphorylated extracellular signal-regulated kinase (p-ERK), nuclear factor kappa-light-chain-enhancer of activated B cells (NF-kB), and cytokines TNF-α (tumor necrosis factor-alpha), IL-1β (interleukin-1 beta), IL-6 (inter-leukin-6). SsnB suppressed PMA-induced effects and promoted apoptosis in HCT-116 cells, increasing cleaved caspase-3, TUNEL staining, and ceramide levels while de-creasing S1P (sphingosine-1-phosphate) and C1P (ceramide-1-phosphate). Conclu-sions: SsnB selectively inhibits proliferation, induces apoptosis, and modulates in-flammatory and sphingolipid pathways in colorectal cancer cells, with minimal tox-icity to healthy fibroblasts, supporting its potential as a targeted therapeutic agent.
Keywords:
1. Introduction
2. Results
2.1. Effect of Sparstolonin B on Cell Viability
2.2. Effect of Sparstolonin B on TLR2-TLR4 Signaling Pathway
2.3. Effect of Sparstolonin B on Apoptosis
2.4. The Effect of Sparstolonin B on Sphingolipid Levels
3. Discussion
4. Materials and Methods
4.1. Cell Culture
4.2. Application of Sparstolonin B and Phorbol 12-Myristate 13-Acetate
4.3. Cell Viability Analysis
4.4. Immunofluorescence Staining
4.5. Determination of TLR 2 and TLR 4 mRNA Expression
4.6. ELISA Measurements
4.7. TUNEL Analysis
4.8. Determination of Apoptotic Cells by Flow Cytometry
4.9. Sphingolipidomic Analysis
4.10. Protein Measurements
4.11. Statistical Analyses
Supplementary Materials
Author Contributions
Funding
Institutional Review Board Statement
Informed Consent Statement
Data Availability Statement
Conflicts of Interest
Abbreviations
References
- Sung H, Ferlay J, Siegel RL, Laversanne M, Soerjomataram I, Jemal A, Bray F. Global Cancer Statistics 2020: GLOBOCAN Estimates of Incidence and Mortality Worldwide for 36 Cancers in 185 Countries. CA Cancer J Clin. 2021 May;71(3):209-249. [CrossRef] [PubMed]
- Mileo AM, Nisticò P, Miccadei S. Polyphenols: Immunomodulatory and Therapeutic Implication in Colorectal Cancer. Front Immunol. 2019 Apr 11;10:729. [CrossRef] [PubMed] [PubMed Central]
- Niedzwiecki A, Roomi MW, Kalinovsky T, Rath M. Anticancer Efficacy of Polyphenols and Their Combinations. Nutrients. 2016 Sep 9;8(9):552. [CrossRef] [PubMed] [PubMed Central]
- Kumar A, Fan D, Dipette DJ, Singh US. Sparstolonin B, a novel plant derived compound, arrests cell cycle and induces apoptosis in N-myc amplified and N-myc nonamplified neuroblastoma cells. PLoS One. 2014 May 1;9(5):e96343. Erratum in: PLoS One. 2016 Jul 6;11(7):e0159082. doi: 10.1371/journal.pone.0159082. [CrossRef] [PubMed] [PubMed Central]
- Yepuri N, Dhawan R, Cooney M, Pruekprasert N, Meng Q, Cooney RN. Sparstolonin B: A Unique Anti-Inflammatory Agent. Shock. 2019 Dec;52(6):568-576. [CrossRef] [PubMed]
- PubChem. Available online: https://pubchem.ncbi.nlm.nih.gov (accessed on 28 January 2025).
- Akira S, Takeda K, Kaisho T. Toll-like receptors: critical proteins linking innate and acquired immunity. Nat Immunol. 2001 Aug;2(8):675-80. [CrossRef] [PubMed]
- Fukata M, Chen A, Vamadevan AS, Cohen J, Breglio K, Krishnareddy S, Hsu D, Xu R, Harpaz N, Dannenberg AJ, Subbaramaiah K, Cooper HS, Itzkowitz SH, Abreu MT. Toll-like receptor-4 promotes the development of colitis-associated colorectal tumors. Gastroenterology. 2007 Dec;133(6):1869-81. [CrossRef] [PubMed] [PubMed Central]
- Cammarota R, Bertolini V, Pennesi G, Bucci EO, Gottardi O, Garlanda C, Laghi L, Barberis MC, Sessa F, Noonan DM, Albini A. The tumor microenvironment of colorectal cancer: stromal TLR-4 expression as a potential prognostic marker. J Transl Med. 2010 Nov 8;8:112. [CrossRef] [PubMed] [PubMed Central]
- Doan HQ, Bowen KA, Jackson LA, Evers BM. Toll-like receptor 4 activation increases Akt phosphorylation in colon cancer cells. Anticancer Res. 2009 Jul;29(7):2473-8. [PubMed] [PubMed Central]
- Guo H, Chen Y, Hu X, Qian G, Ge S, Zhang J. The regulation of Toll-like receptor 2 by miR-143 suppresses the invasion and migration of a subset of human colorectal carcinoma cells. Mol Cancer. 2013 Jul 17;12:77. [CrossRef] [PubMed] [PubMed Central]
- Liu YD, Ji CB, Li SB, Yan F, Gu QS, Balic JJ, Yu L, Li JK. Toll-like receptor 2 stimulation promotes colorectal cancer cell growth via PI3K/Akt and NF-κB signaling pathways. Int Immunopharmacol. 2018 Jun;59:375-383. [CrossRef] [PubMed]
- Chung YH, Kim D. Enhanced TLR4 Expression on Colon Cancer Cells After Chemotherapy Promotes Cell Survival and Epithelial-Mesenchymal Transition Through Phosphorylation of GSK3β. Anticancer Res. 2016 Jul;36(7):3383-94. [PubMed]
- Guo Y, Zhou K, Zhuang X, Li J, Shen X. CDCA7-regulated inflammatory mechanism through TLR4/NF-κB signaling pathway in stomach adenocarcinoma. Biofactors. 2021 Sep;47(5):865-878. [CrossRef] [PubMed]
- Liang Q, Wu Q, Jiang J, Duan J, Wang C, Smith MD, Lu H, Wang Q, Nagarkatti P, Fan D. Characterization of sparstolonin B, a Chinese herb-derived compound, as a selective Toll-like receptor antagonist with potent anti-inflammatory properties. J Biol Chem. 2011 Jul 29;286(30):26470-9. [CrossRef] [PubMed] [PubMed Central]
- Wang M, Xiu L, Diao J, Wei L, Sun J. Sparstolonin B inhibits lipopolysaccharide-induced inflammation in 3T3-L1 adipocytes. Eur J Pharmacol. 2015 Dec 15;769:79-85. [CrossRef] [PubMed]
- Piazzesi A, Afsar SY, van Echten-Deckert G. Sphingolipid metabolism in the development and progression of cancer: one cancer's help is another's hindrance. Mol Oncol. 2021 Dec;15(12):3256-3279. [CrossRef] [PubMed] [PubMed Central]
- Dilber Y, Çeker HT, Öztüzün A, Çırçırlı B, Kırımlıoğlu E, Barut Z, Aslan M. Sparstolonin B Reduces Estrogen-Dependent Proliferation in Cancer Cells: Possible Role of Ceramide and PI3K/AKT/mTOR Inhibition. Pharmaceuticals (Basel). 2024 Nov 21;17(12):1564. [CrossRef] [PubMed] [PubMed Central]
- Li F, Zhang N. Ceramide: Therapeutic Potential in Combination Therapy for Cancer Treatment. Curr Drug Metab. 2015;17(1):37-51. [CrossRef] [PubMed]
- Ogretmen, B. Sphingolipid metabolism in cancer signalling and therapy. Nat Rev Cancer. 2018 Jan;18(1):33-50. [CrossRef] [PubMed] [PubMed Central]
- Mosior M, Newton AC. Mechanism of interaction of protein kinase C with phorbol esters. Reversibility and nature of membrane association. J Biol Chem. 1995 Oct 27;270(43):25526-33. [CrossRef] [PubMed]
- Tahara E, Kadara H, Lacroix L, Lotan D, Lotan R. Activation of protein kinase C by phorbol 12-myristate 13-acetate suppresses the growth of lung cancer cells through KLF6 induction. Cancer Biol Ther. 2009 May;8(9):801-7. [CrossRef] [PubMed]
- Hwang YP, Yun HJ, Choi JH, Kang KW, Jeong HG. Suppression of phorbol-12-myristate-13-acetate-induced tumor cell invasion by bergamottin via the inhibition of protein kinase Cdelta/p38 mitogen-activated protein kinase and JNK/nuclear factor-kappaB-dependent matrix metalloproteinase-9 expression. Mol Nutr Food Res. 2010 Jul;54(7):977-90. [CrossRef] [PubMed]
- Liu S, Hu J, Shi C, Sun L, Yan W, Song Y. Sparstolonin B exerts beneficial effects on prostate cancer by acting on the reactive oxygen species-mediated PI3K/AKT pathway. J Cell Mol Med. 2021 Jun;25(12):5511-5524. [CrossRef] [PubMed] [PubMed Central]
- Liu Q, Li J, Liang Q, Wang D, Luo Y, Yu F, Janicki JS, Fan D. Sparstolonin B suppresses rat vascular smooth muscle cell proliferation, migration, inflammatory response and lipid accumulation. Vascul Pharmacol. 2015 Apr-Jun;67-69:59-66. [CrossRef] [PubMed] [PubMed Central]
- Bateman HR, Liang Q, Fan D, Rodriguez V, Lessner SM. Sparstolonin B inhibits pro-angiogenic functions and blocks cell cycle progression in endothelial cells. PLoS One. 2013 Aug 5;8(8):e70500. [CrossRef] [PubMed] [PubMed Central]
- Lyu Y, Duan B, Liu Z, Yang F, Chen C, Jiang X, Liu X. Sparstolonin B inhibits pancreatic adenocarcinoma through the NF-κB signaling pathway. Exp Cell Res. 2022 Aug 1;417(1):113214. [CrossRef] [PubMed]
- Takahashi I, Takagi K, Yamaguchi-Tanaka M, Sato A, Sato M, Miki Y, Ito A, Suzuki T. Toll-like receptor (TLR) 4 is a potent prognostic factor in prostate cancer associated with proliferation and invasion. Pathol Res Pract. 2024 Aug;260:155379. [CrossRef] [PubMed]
- Kim N, Kim C, Ryu SH, Kim GO, Bae JS. Anti-Inflammatory Effect of Sparstolonin B through Inhibiting Expression of NF-κB and STAT-1. Int J Mol Sci. 2022 Sep 6;23(18):10213. [CrossRef] [PubMed] [PubMed Central]
- Schilling JD, Machkovech HM, He L, Sidhu R, Fujiwara H, Weber K, Ory DS, Schaffer JE. Palmitate and lipopolysaccharide trigger synergistic ceramide production in primary macrophages. J Biol Chem. 2013 Feb 1;288(5):2923-32. [CrossRef] [PubMed] [PubMed Central]
- Sato Y, Goto Y, Narita N, Hoon DS. Cancer Cells Expressing Toll-like Receptors and the Tumor Microenvironment. Cancer Microenviron. 2009 Sep;2 Suppl 1(Suppl 1):205-14. [CrossRef] [PubMed] [PubMed Central]
- Onier N, Hilpert S, Arnould L, Saint-Giorgio V, Davies JG, Jeannin JF, Jeannin JF. Cure of colon cancer metastasis in rats with the new lipid A OM 174. Apoptosis of tumor cells and immunization of rats. Clin Exp Metastasis. 1999 Jun;17(4):299-306. [CrossRef] [PubMed]
- Garay RP, Viens P, Bauer J, Normier G, Bardou M, Jeannin JF, Chiavaroli C. Cancer relapse under chemotherapy: why TLR2/4 receptor agonists can help. Eur J Pharmacol. 2007 Jun 1;563(1-3):1-17. [CrossRef] [PubMed]
- Zhang YB, He FL, Fang M, Hua TF, Hu BD, Zhang ZH, Cao Q, Liu RY. Increased expression of Toll-like receptors 4 and 9 in human lung cancer. Mol Biol Rep. 2009 Jul;36(6):1475-81. [CrossRef] [PubMed]
- Furrie E, Macfarlane S, Thomson G, Macfarlane GT; Microbiology & Gut Biology Group; Tayside Tissue & Tumour Bank. Toll-like receptors-2, -3 and -4 expression patterns on human colon and their regulation by mucosal-associated bacteria. Immunology. 2005 Aug;115(4):565-74. [CrossRef] [PubMed] [PubMed Central]
- Pradere JP, Dapito DH, Schwabe RF. The Yin and Yang of Toll-like receptors in cancer. Oncogene. 2014 Jul 3;33(27):3485-95. [CrossRef] [PubMed] [PubMed Central]
- Yoo KH, Lim TJ, Chang SG. Monthly intravesical bacillus Calmette-Guérin maintenance therapy for non-muscle-invasive bladder cancer: 10-year experience in a single institute. Exp Ther Med. 2012 Feb;3(2):221-225. [CrossRef] [PubMed] [PubMed Central]
- Li J, Yang F, Wei F, Ren X. The role of toll-like receptor 4 in tumor microenvironment. Oncotarget. 2017 Jul 8;8(39):66656-66667. [CrossRef] [PubMed] [PubMed Central]
- Wajapeyee N, Beamon TC, Gupta R. Roles and therapeutic targeting of ceramide metabolism in cancer. Mol Metab. 2024 May;83:101936. [CrossRef] [PubMed] [PubMed Central]
- Li RZ, Wang XR, Wang J, Xie C, Wang XX, Pan HD, Meng WY, Liang TL, Li JX, Yan PY, Wu QB, Liu L, Yao XJ, Leung EL. The key role of sphingolipid metabolism in cancer: New therapeutic targets, diagnostic and prognostic values, and anti-tumor immunotherapy resistance. Front Oncol. 2022 Jul 27;12:941643. [CrossRef] [PubMed] [PubMed Central]
- Pralhada Rao R, Vaidyanathan N, Rengasamy M, Mammen Oommen A, Somaiya N, Jagannath MR. Sphingolipid metabolic pathway: an overview of major roles played in human diseases. J Lipids. 2013;2013:178910. [CrossRef] [PubMed] [PubMed Central]
- Wang L, Yu K, Zhang X, Yu S. Dual functional roles of the MyD88 signaling in colorectal cancer development. Biomed Pharmacother. 2018 Nov;107:177-184. [CrossRef] [PubMed]
- Tanimura A, Nakazato A, Tanaka N. MYD88 signals induce tumour-initiating cell generation through the NF-κB-HIF-1α activation cascade. Sci Rep. 2021 Feb 17;11(1):3991. [CrossRef] [PubMed] [PubMed Central]
- Xia Y, Shen S, Verma IM. NF-κB, an active player in human cancers. Cancer Immunol Res. 2014 Sep;2(9):823-30. [CrossRef] [PubMed] [PubMed Central]
- Chung SS, Wu Y, Okobi Q, Adekoya D, Atefi M, Clarke O, Dutta P, Vadgama JV. Proinflammatory Cytokines IL-6 and TNF-α Increased Telomerase Activity through NF-κB/STAT1/STAT3 Activation, and Withaferin A Inhibited the Signaling in Colorectal Cancer Cells. Mediators Inflamm. 2017;2017:5958429. [CrossRef] [PubMed] [PubMed Central]
- Aslan M, Polyunsaturated Fatty Acid and Sphingolipid Measurements by Tandem Mass Spectrometry, Mini-Reviews in Organic Chemistry; Mini-Reviews in Organic Chemistry, 18(1), 3-10. [CrossRef]

 |
Disclaimer/Publisher’s Note: The statements, opinions and data contained in all publications are solely those of the individual author(s) and contributor(s) and not of MDPI and/or the editor(s). MDPI and/or the editor(s) disclaim responsibility for any injury to people or property resulting from any ideas, methods, instructions or products referred to in the content. |
© 2025 by the authors. Licensee MDPI, Basel, Switzerland. This article is an open access article distributed under the terms and conditions of the Creative Commons Attribution (CC BY) license (http://creativecommons.org/licenses/by/4.0/).


