Submitted:
28 January 2025
Posted:
29 January 2025
You are already at the latest version
Abstract
Background: Upper gastrointestinal (GI) motility disorders, such as gastroparesis and functional dyspepsia (FD), contribute significantly to morbidity, especially in populations at risk for type 2 diabetes. However, the prevalence and clinical manifestations of these disorders in India and associated gastric dysrhythmias are not well-studied within this population. Methods: A retrospective, cross-sectional study was conducted, analysing 3,689 patients who underwent electrogastrography with water load satiety test (EGGWLST) testing across multiple motility clinics in India. The prevalence of gastroparesis and FD-like symptoms, symptom severity, and their association with diabetes and other comorbidities were evaluated. Symptom severity was assessed using the Gastroparesis Cardinal Symptom Index (GCSI) and EGGWLST findings were documented including the Gastric myoelectric activity threshold (GMAT) scores. Results: The study population had a mean age of 43.18 years. GCSI scores indicated mild symptoms (55%), moderate (33%), and severe (8%). As compared to non-diabetic population diabetic subjects had significantly higher rates of early satiety (56% vs. 45%, p<0.0001), bloating (73% vs. 67%, p 0.005), and reflux (28% vs. 24%, p 0.029) while WLST data analysis revealed that significantly more diabetic subjects ingested <350ml (16% vs 12%, p 0.000016). EGG analysis revealed gastric dysthymias in 1/3rd (65%). Significantly more diabetic subjects (22% vs 18% p 0.015) had a >0.59 GMAT score. Conclusions: Upper GI motility disorders are prevalent in India, particularly among diabetic patients. EGG is a valuable tool for characterising these disorders which may help in appropriating therapeutic approaches. Further research is required to optimize treatment strategies.
Keywords:
1. Introduction
2. Materials and Methods
2.1. Electrogastrography (EGG)
2.2. Data Collection and Analysis
3. Results
3.1. Description of Demographic and Symptom Characteristics in Overall Population and Between Diabetic Versus Non-Diabetic Populations
3.2. Region-Wise Analysis of Demographic & Symptom Characteristics
3.3. Water Ingestion and Gastric Myoelectric Activity Characteristics
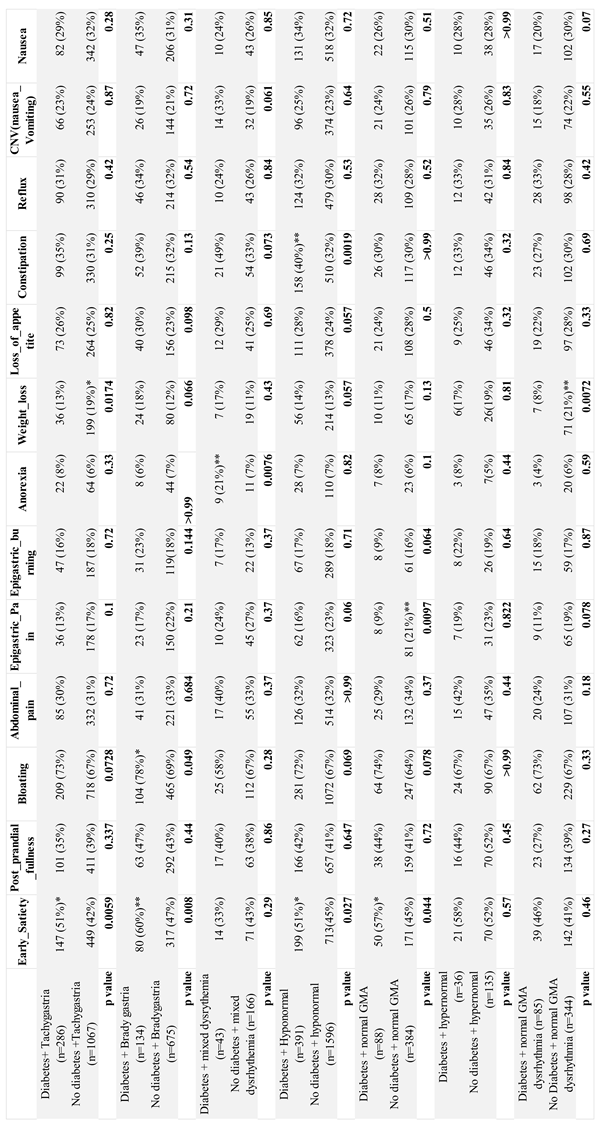
3.4. Assessment of Upper GI Symptom Characteristics, EGG Based GMA Subtypes and Characteristics in Diabetic Versus Non-Diabetic Groups
4. Discussion
5. Conclusions
Author Contributions
Funding
Institutional Review Board Statement
Informed Consent Statement
Data Availability Statement
Acknowledgments
Conflicts of Interest
Abbreviations
| APD | Antropyloroduodenal dysfunction |
| BDQ | Bowel Disease Questionnaire |
| cpm | Cycles per minute |
| FD | Functional dyspepsia |
| GCSI | Gastroparesis Cardinal Symptom Index |
| GES | Gastric electrical stimulation |
| GI | Gastrointestinal |
| GMA | Gastric myoelectric activity |
| ICH | International Council for Harmonisation |
| GCP | Good Clinical Practice |
| GMAT | Gastric myoelectric activity threshold |
| IEC | Independent ethics committee |
| ICCs | Interstitial cells of Cajal |
| nNOS | Neuronal nitric oxide synthase |
| NO | Nitric oxide |
| EGG | Electrogastrography |
| EGGWLST | Electrogastrography with water load satiety test |
| WLST | Water load satiety test |
References
- Rothstein, R.D. Gastrointestinal motility disorders in diabetes mellitus. Am J Gastroenterol. 1990, 85, 782–785. [Google Scholar] [PubMed]
- Frank, L.; Kleinman, L.; Ganoczy, D.; McQuaid, K.; Sloan, S.; Eggleston, A.; Tougas, G.; Farup, C. Upper gastrointestinal symptoms in North America: prevalence and relationship to healthcare utilization and quality of life. Dig Dis Sci. 2000, 45, 809–818. [Google Scholar] [CrossRef] [PubMed]
- Huang, I.H.; Schol, J.; Khatun, R.; Carbone, F.; Van den Houte, K.; Colomier, E.; et al. , Worldwide prevalence and burden of gastroparesis-like symptoms as defined by the United European Gastroenterology (UEG) and European Society for Neurogastroenterology and Motility (ESNM) consensus on gastroparesis. United European Gastroenterol J. 2022, 10, 888–897. [Google Scholar] [CrossRef] [PubMed]
- Oshima, T.; Siah, K.T.H.; Kim, Y.S.; Patcharatrakul, T.; Chen, C.L; Mahadeva, S.; et al. , Knowledge, Attitude, and Practice Survey of Gastroparesis in Asia by Asian Neurogastroenterology and Motility Association. J Neurogastroenterol Motil. 2021, 27, 46–54. [Google Scholar] [CrossRef] [PubMed]
- Hsu, C.T.; Azzopardi, N.; Broad, J. Prevalence and disease burden of gastroparesis in Asia. J Gastroenterol Hepatol. 2024, 39, 649–657. [Google Scholar] [CrossRef]
- Pasricha, P.J.; Grover, M.; Yates, K.P.; Abell, T.L.; Bernard, C.E.; Koch, K.L.; et al. , National Institute of Diabetes and Digestive and Kidney Diseases/National Institutes of Health Gastroparesis Clinical Research Consortium. Functional Dyspepsia and Gastroparesis in Tertiary Care are Interchangeable Syndromes With Common Clinical and Pathologic Features. Gastroenterology. 2021, 160, 2006–2017. [Google Scholar] [CrossRef]
- Salet, G.A.; Samsom, M.; Roelofs, J.M.; van Berge Henegouwen, G.P.; Smout, A.J.; Akkermans, L.M. Responses to gastric distension in functional dyspepsia. Gut 1998, 42, 823–829. [Google Scholar] [CrossRef]
- Tack, J.; Piessevaux, H.; Coulie, B.; Caenepeel, P.; Janssens, J. Role of impaired gastric accommodation to a meal in functional dyspepsia. Gastroenterology 1998, 115, 1346–1352. [Google Scholar] [CrossRef]
- Wang, Y.; Chen, J. D,Z.; Nojkov, B. Diagnostic Methods for Evaluation of Gastric Motility-A Mini Review. Diagnostics (Basel). 2023, 13, 803. [Google Scholar] [CrossRef]
- Lacy, B.E.; Crowell, M.D.; Cangemi, D.J.; Lunsford, T.N.; Simren, M.; Tack, J. Diagnostic Evaluation of Gastric Motor and Sensory Disorders. Am J Gastroenterol. 2021, 116, 2345–2356. [Google Scholar] [CrossRef]
- Kenneth, L.; Koch, Electrogastrography for suspected gastroparesis. In Gastroparesis, McCallum, R.W.; Parkman, H.P.; Academic Press. 2021, 189-205. [CrossRef]
- Parkman, H.P.; Hasler, W.L.; Barnett, J.L.; Eaker, E.Y. American Motility Society Clinical GI Motility Testing Task Force. Electrogastrography: a document prepared by the gastric section of the American Motility Society Clinical GI Motility Testing Task Force. Neurogastroenterol Motil. 2003, 15, 89–102. [Google Scholar] [CrossRef] [PubMed]
- Brzana, R.J.; Koch, K.L.; Bingaman, S. Gastric myoelectrical activity in patients with gastric outlet obstruction and idiopathic gastroparesis. Am J Gastroenterol. 1998, 93, 1803–1809. [Google Scholar] [CrossRef] [PubMed]
- Noar, M.; Khan, S. Gastric myoelectrical activity based AI-derived threshold predicts resolution of gastroparesis post-pyloric balloon dilation. Surg Endosc. 2023, 37, 1789–1798. [Google Scholar] [CrossRef] [PubMed]
- Forster, J.; Damjanov, I.; Lin, Z.; Sarosiek, I.; Wetzel, P.; McCallum, R.W. Absence of the interstitial cells of Cajal in patients with gastroparesis and correlation with clinical findings. J Gastrointest Surg. 2005, 9, 102–108. [Google Scholar] [CrossRef]
- Bröker, L.E.; Hurenkamp, G.J.B.; Riet, G.; Schellevis, F.G.; Grundmeijer, H.G.; van Weert, H.C. Upper gastrointestinal symptoms, psychosocial co-morbidity and health care seeking in general practice: population based case control study. BMC Fam Pract 2009, 10, 63. [Google Scholar] [CrossRef]
- Ballou, S.; Singh, P.; Nee, J.; Rangan, V.; Iturrino, J.; Geeganage, G.; et al. , Prevalence and Associated Factors of Bloating: Results From the Rome Foundation Global Epidemiology Study. Gastroenterology. 2023, 165, 647–655.e4. [Google Scholar] [CrossRef]
- Ryu, M.S.; Jung, H.K.; Ryu, J.I.; Kim, J.S.; Kong, K.A. Clinical Dimensions of Bloating in Functional Gastrointestinal Disorders. J Neurogastroenterol Motil. 2016, 22, 509–516. [Google Scholar] [CrossRef]
- Khan, U.; Samant, B.R.; Naik, N.; Sanwalka, N. Gastro-intestinal health and dietary intake in asymptomatic patient. Clinical Nutrition. ESPEN. 2023, 58, 424e750. [Google Scholar] [CrossRef]
- Du, Y.T.; Rayner, C.K.; Jones, K.L.; Talley, N.J.; Horowitz, M. Gastrointestinal Symptoms in Diabetes: Prevalence, Assessment, Pathogenesis, and Management. Diabetes Care. 2018, 41, 627–637. [Google Scholar] [CrossRef]
- Asgharnezhad, M.; Joukar, F.; Fathalipour, M.; Khosousi, M.; Hassanipour, S.; Pourshams, A.; et al. , Gastrointestinal symptoms in patients with diabetes mellitus and non-diabetic: A cross-sectional study in north of Iran. Diabetes Metab Syndr. 2019, 13, 2236–2240. [Google Scholar] [CrossRef]
- Bytzer, P.; Talley, N.J.; Hammer, J.; Young, L.J.; Jones, M.P.; Horowitz, M. GI symptoms in diabetes mellitus are associated with both poor glycemic control and diabetic complications. Am J Gastroenterol. 2002, 97, 604–11. [Google Scholar] [CrossRef] [PubMed]
- Maleki, D.; Locke, G.R.; Camilleri, M.; et al. Gastrointestinal tract symptoms among persons with diabetes mellitus in the community. Arch Intern Med. 2000, 160, 2808–2816. [Google Scholar] [CrossRef] [PubMed]
- Sang, M.; Wu, T.; Zhou, X.; Horowitz, M.; Jones, K.L.; Qiu, S.; et al. , Prevalence of Gastrointestinal Symptoms in Chinese Community-Dwelling Adults with and without Diabetes. Nutrients. 2022, 14, 3506. [Google Scholar] [CrossRef] [PubMed]
- Leeds, J.S.; Hadjivassiliou, M.; Tesfaye, S.; Sanders, D.S. Lower gastrointestinal symptoms are associated with worse glycemic control and quality of life in type 1 diabetes mellitus. BMJ Open Diabetes Res Care. 2018, 6, e000514. [Google Scholar] [CrossRef]
- Ihana-Sugiyama, N.; Nagata, N.; Yamamoto-Honda, R.; Izawa, E.; Kajio, H.; Shimbo, T.; et al. , Constipation, hard stools, fecal urgency, and incomplete evacuation, but not diarrhea is associated with diabetes and its related factors. World J Gastroenterol. 2016, 22, 3252–3260. [Google Scholar] [CrossRef]
- Pathak, H.S.; Banik, K.; Bhattacharya, R.; Kayal, R.; Lahiri, A. Recent Trends of GI Symptoms in Diabetic Population in Eastern India: An Original Article. International Journal of Research & Review. 2019, 6, 242–250. [Google Scholar]
- Wang, X.; Pitchumoni, C.S.; Chandrarana, K.; Shah, N. Increased prevalence of symptoms of gastroesophageal reflux diseases in type 2 diabetics with neuropathy. World J Gastroenterol. 2008, 14, 709–712. [Google Scholar] [CrossRef]
- Parkman, H.P.; Hallinan, E.K.; Hasler, W.L.; Farrugia, G.; Koch, K.L.; Nguyen, L.; et al. , NIDDK Gastroparesis Clinical Research Consortium (GpCRC). Early satiety and postprandial fullness in gastroparesis correlate with gastroparesis severity, gastric emptying, and water load testing. Neurogastroenterol Motil. 2017, 29, 10. [Google Scholar] [CrossRef]
- Channer, K.S.; Jackson, P.C.; O'Brien, I.; Corrall, R.J.; Coles, D.R.; Davies, E.R.; Virjee, J.P. Oesophageal function in diabetes mellitus and its association with autonomic neuropathy. Diabet Med. 1985, 2, 378–382. [Google Scholar] [CrossRef]
- Idrizaj, E.; Traini, C.; Vannucchi, M.G.; Baccari, M.C. Nitric Oxide: From Gastric Motility to Gastric Dysmotility. Int J Mol Sci. 2021, 22, 9990. [Google Scholar] [CrossRef]
- Koch, K.L.; Van Natta, M.; Parkman, H.P.; Grover, M.; Abell, T.L.; McCallum, R.W.; et al. , Gastroparesis Clinical Research Consortium. Effect of liquid and solid test meals on symptoms and gastric myoelectrical activity in patients with gastroparesis and functional dyspepsia. Neurogastroenterol Motil. 2023, 35, e14376. [Google Scholar] [CrossRef] [PubMed]
- Witczyńska, A.; Alaburda, A.; Grześk, G.; Nowaczyk, J.; Nowaczyk, A. Unveiling the Multifaceted Problems Associated with Dysrhythmia. Int J Mol Sci. 2023, 25, 263. [Google Scholar] [CrossRef] [PubMed]
- Sanger, G.J.; Chang, L.; Bountra, C.; Houghton, L.A. Challenges and prospects for pharmacotherapy in functional gastrointestinal disorders. Therap Adv Gastroenterol. 2010, 3, 291–305. [Google Scholar] [CrossRef] [PubMed]
- Lacy, B.E.; Cangemi, D.J.; Distinguishing between functional dyspepsia and gastroparesis: Does it matter?, In Gastroparesis, Editor(s): McCallum, R.W.; Parkman, H.P.; Academic Press. 2021, 481-493.

| Variables | Overall population (n=3689) | Diabetic population (n=714) | Non-diabetic population (n=2937) | P value (Diabetes vs non-diabetes) |
| Age, yrs(SD) | 43.18 (15.30) | 56 (12) | 40(14.40) | <0.0001$ |
|
Gender Male, n (%) Female, n (%) |
2011 (55%) 1675 (45%) |
365 (51%) 349 (49%) |
1627 (55%) 1310 (45%) |
|
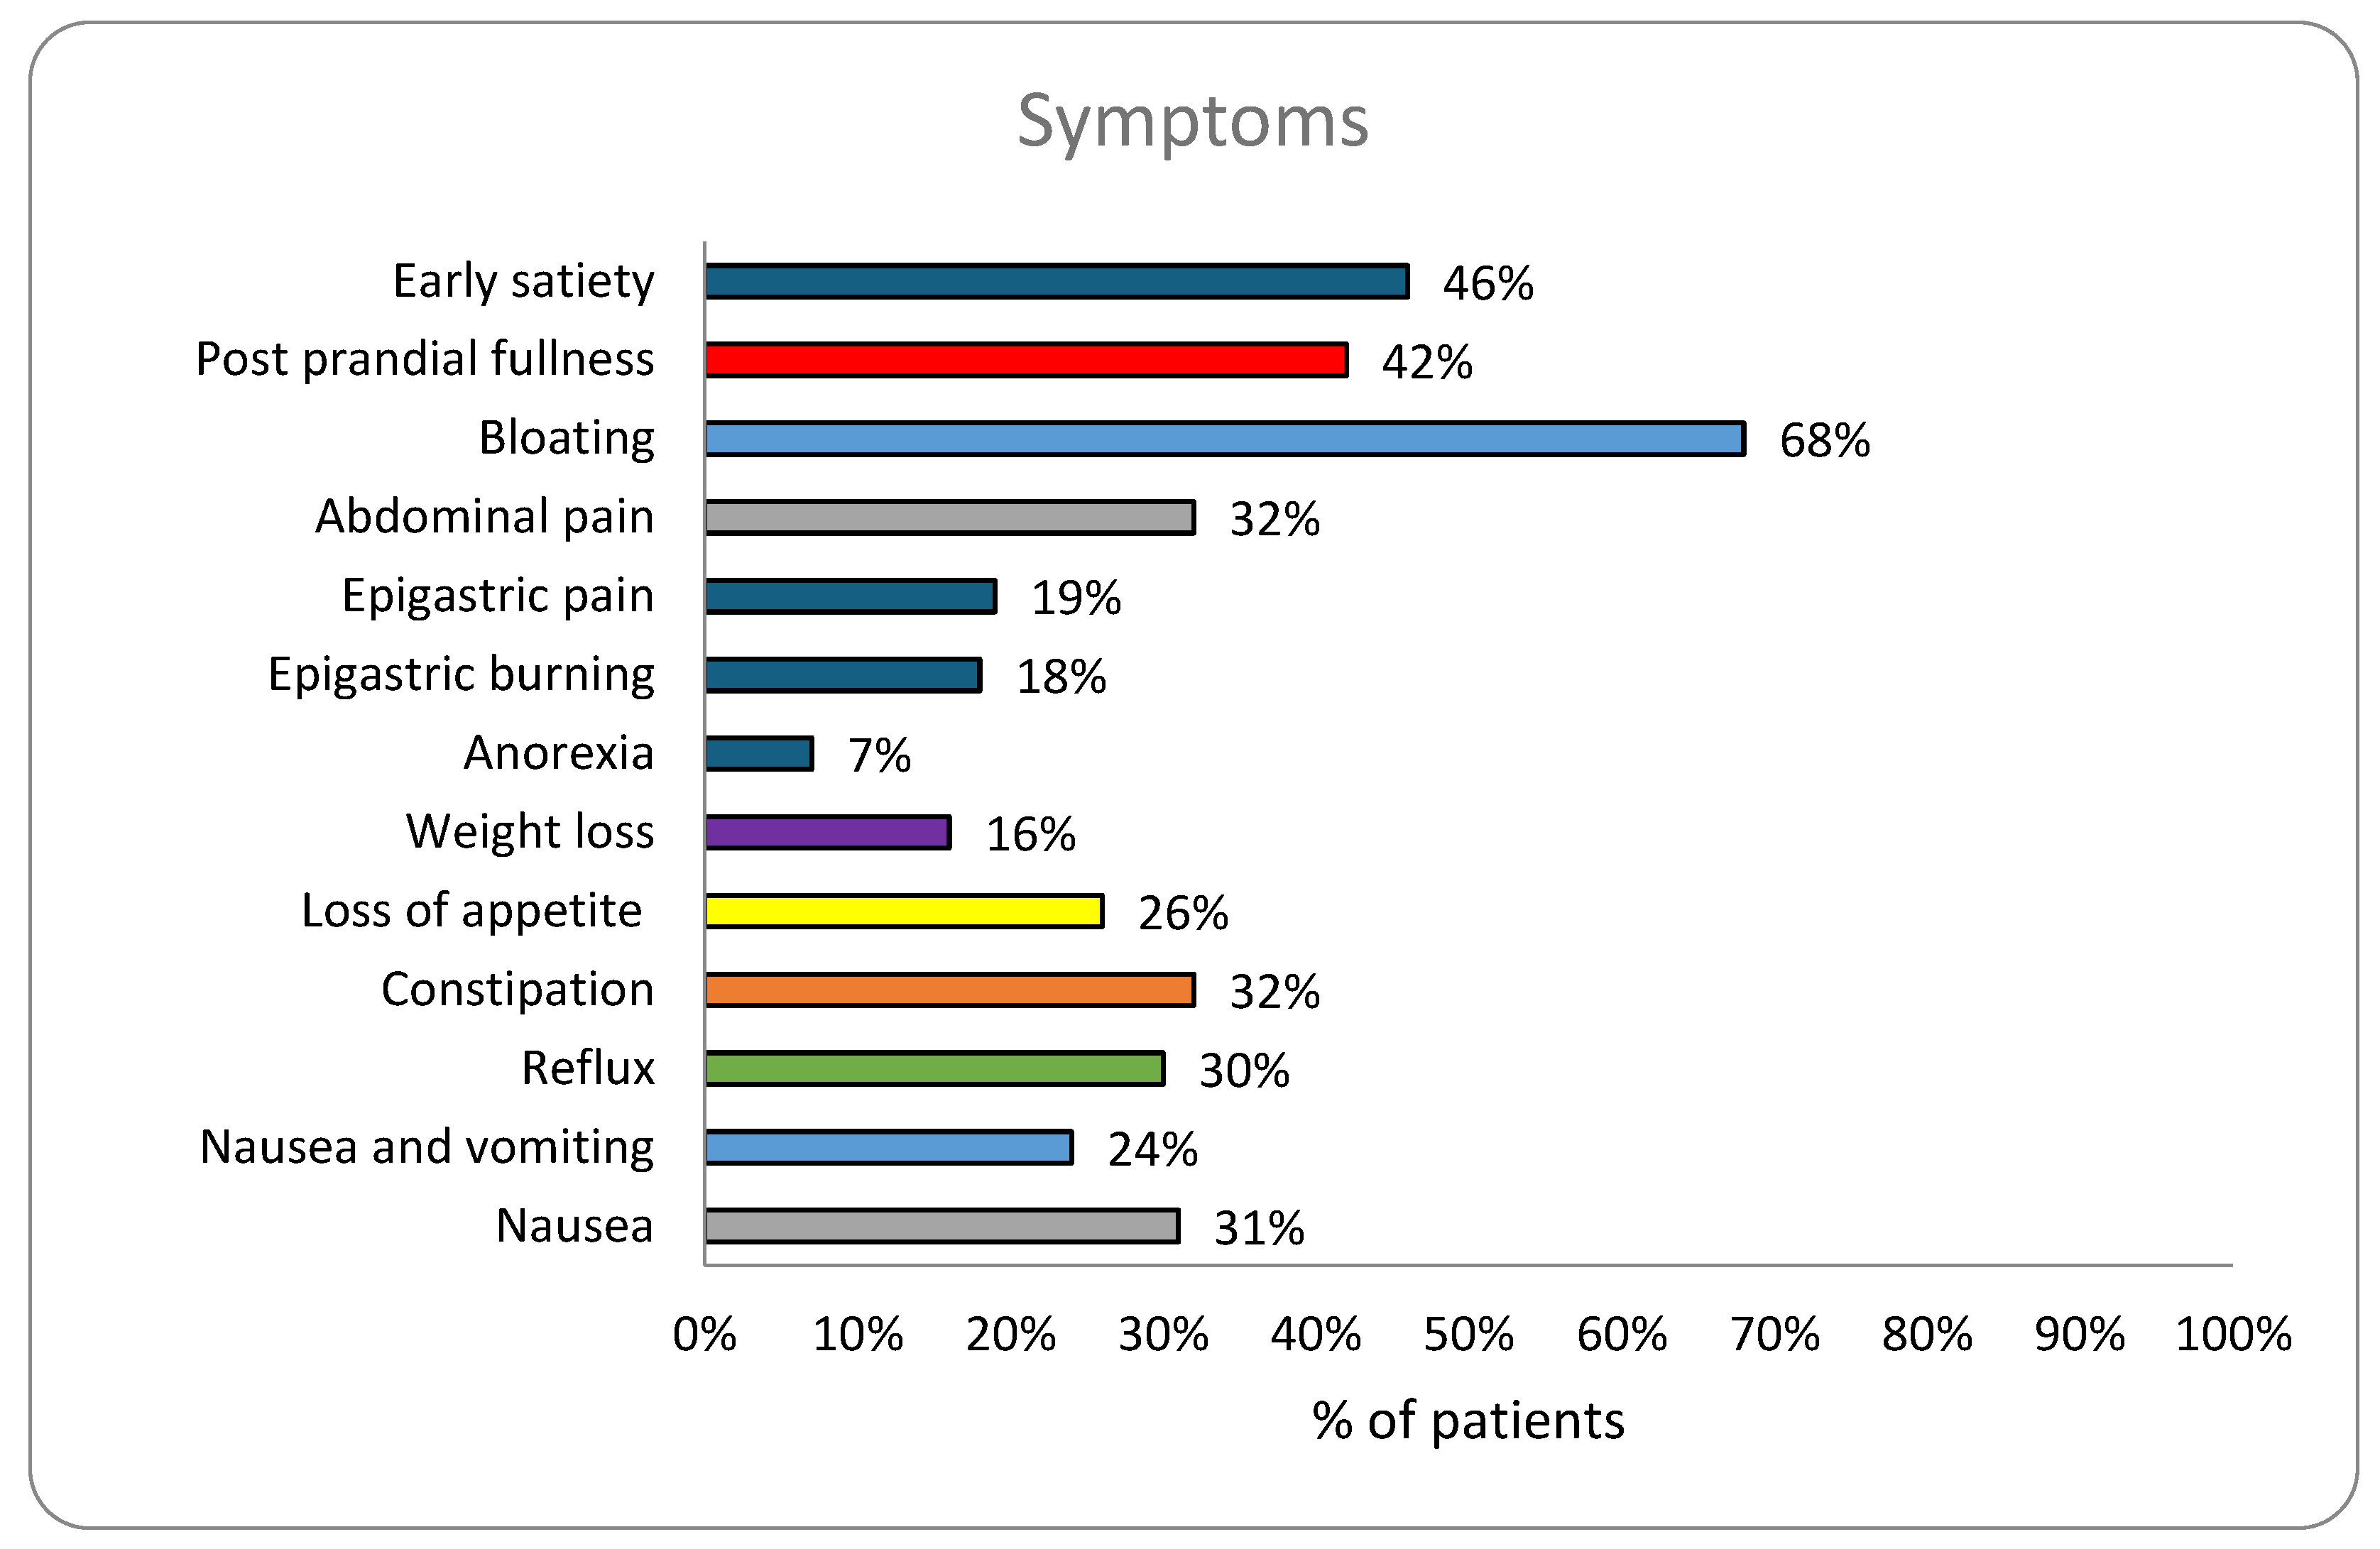
| Symptoms, n (%) | ||||
| Early satiety | 1686 (46%) | 376 (56%)*** | 1310 (45%) | <0.0001 |
| Post prandial fullness | 1531 (42%) | 295 (38%) | 1221 (42%) | 0.899 |
| Bloating | 2498 (68%) | 519 (73%)** | 1956 (67%) | 0.0015 |
| Abdominal pain | 1191 (32%) | 217 (30%) | 954 (32%) | 0.30 |
| Epigastric pain | 684 (19%) | 100 (13%) | 583 (20%)*** | 0.0003 |
| Epigastric burning | 668 (18%) | 124 (17%) | 187 (6%) | 0.83 |
| Anorexia | 244 (7%) | 57 (8%) | 471 (16%) | 0.13 |
| Weight loss | 586 (16%) | 103 (14%) | 759 (26%) | 0.30 |
| Loss of appetite | 963 (26%) | 194 (27%) | 917 (31%) | 0.47 |
| Constipation | 1191 (32%) | 261 (35%)** | 869 (30%) | 0.006 |
| Reflux | 1118 (24%) | 241 (28%)* | 703 (24%) | 0.029 |
| Nasuea& vomiting | 879 (24%) | 174 (23%) | 905 (31%) | 0.80 |
| Nausea | 1128 (31%) | 212 (30%) | 355 (13%) | 0.55 |
| GCSI score, n(%) | ||||
| Mild | 2015 (55%) | 363 (51%) | 1544 (53%) | 0.40 |
| Moderate | 1234 (33%) | 252 (35%) | 973 (33%) | 0.27 |
| Severe | 299 (8%) | 68 (10%) | 227 (8%) | 0.11 |
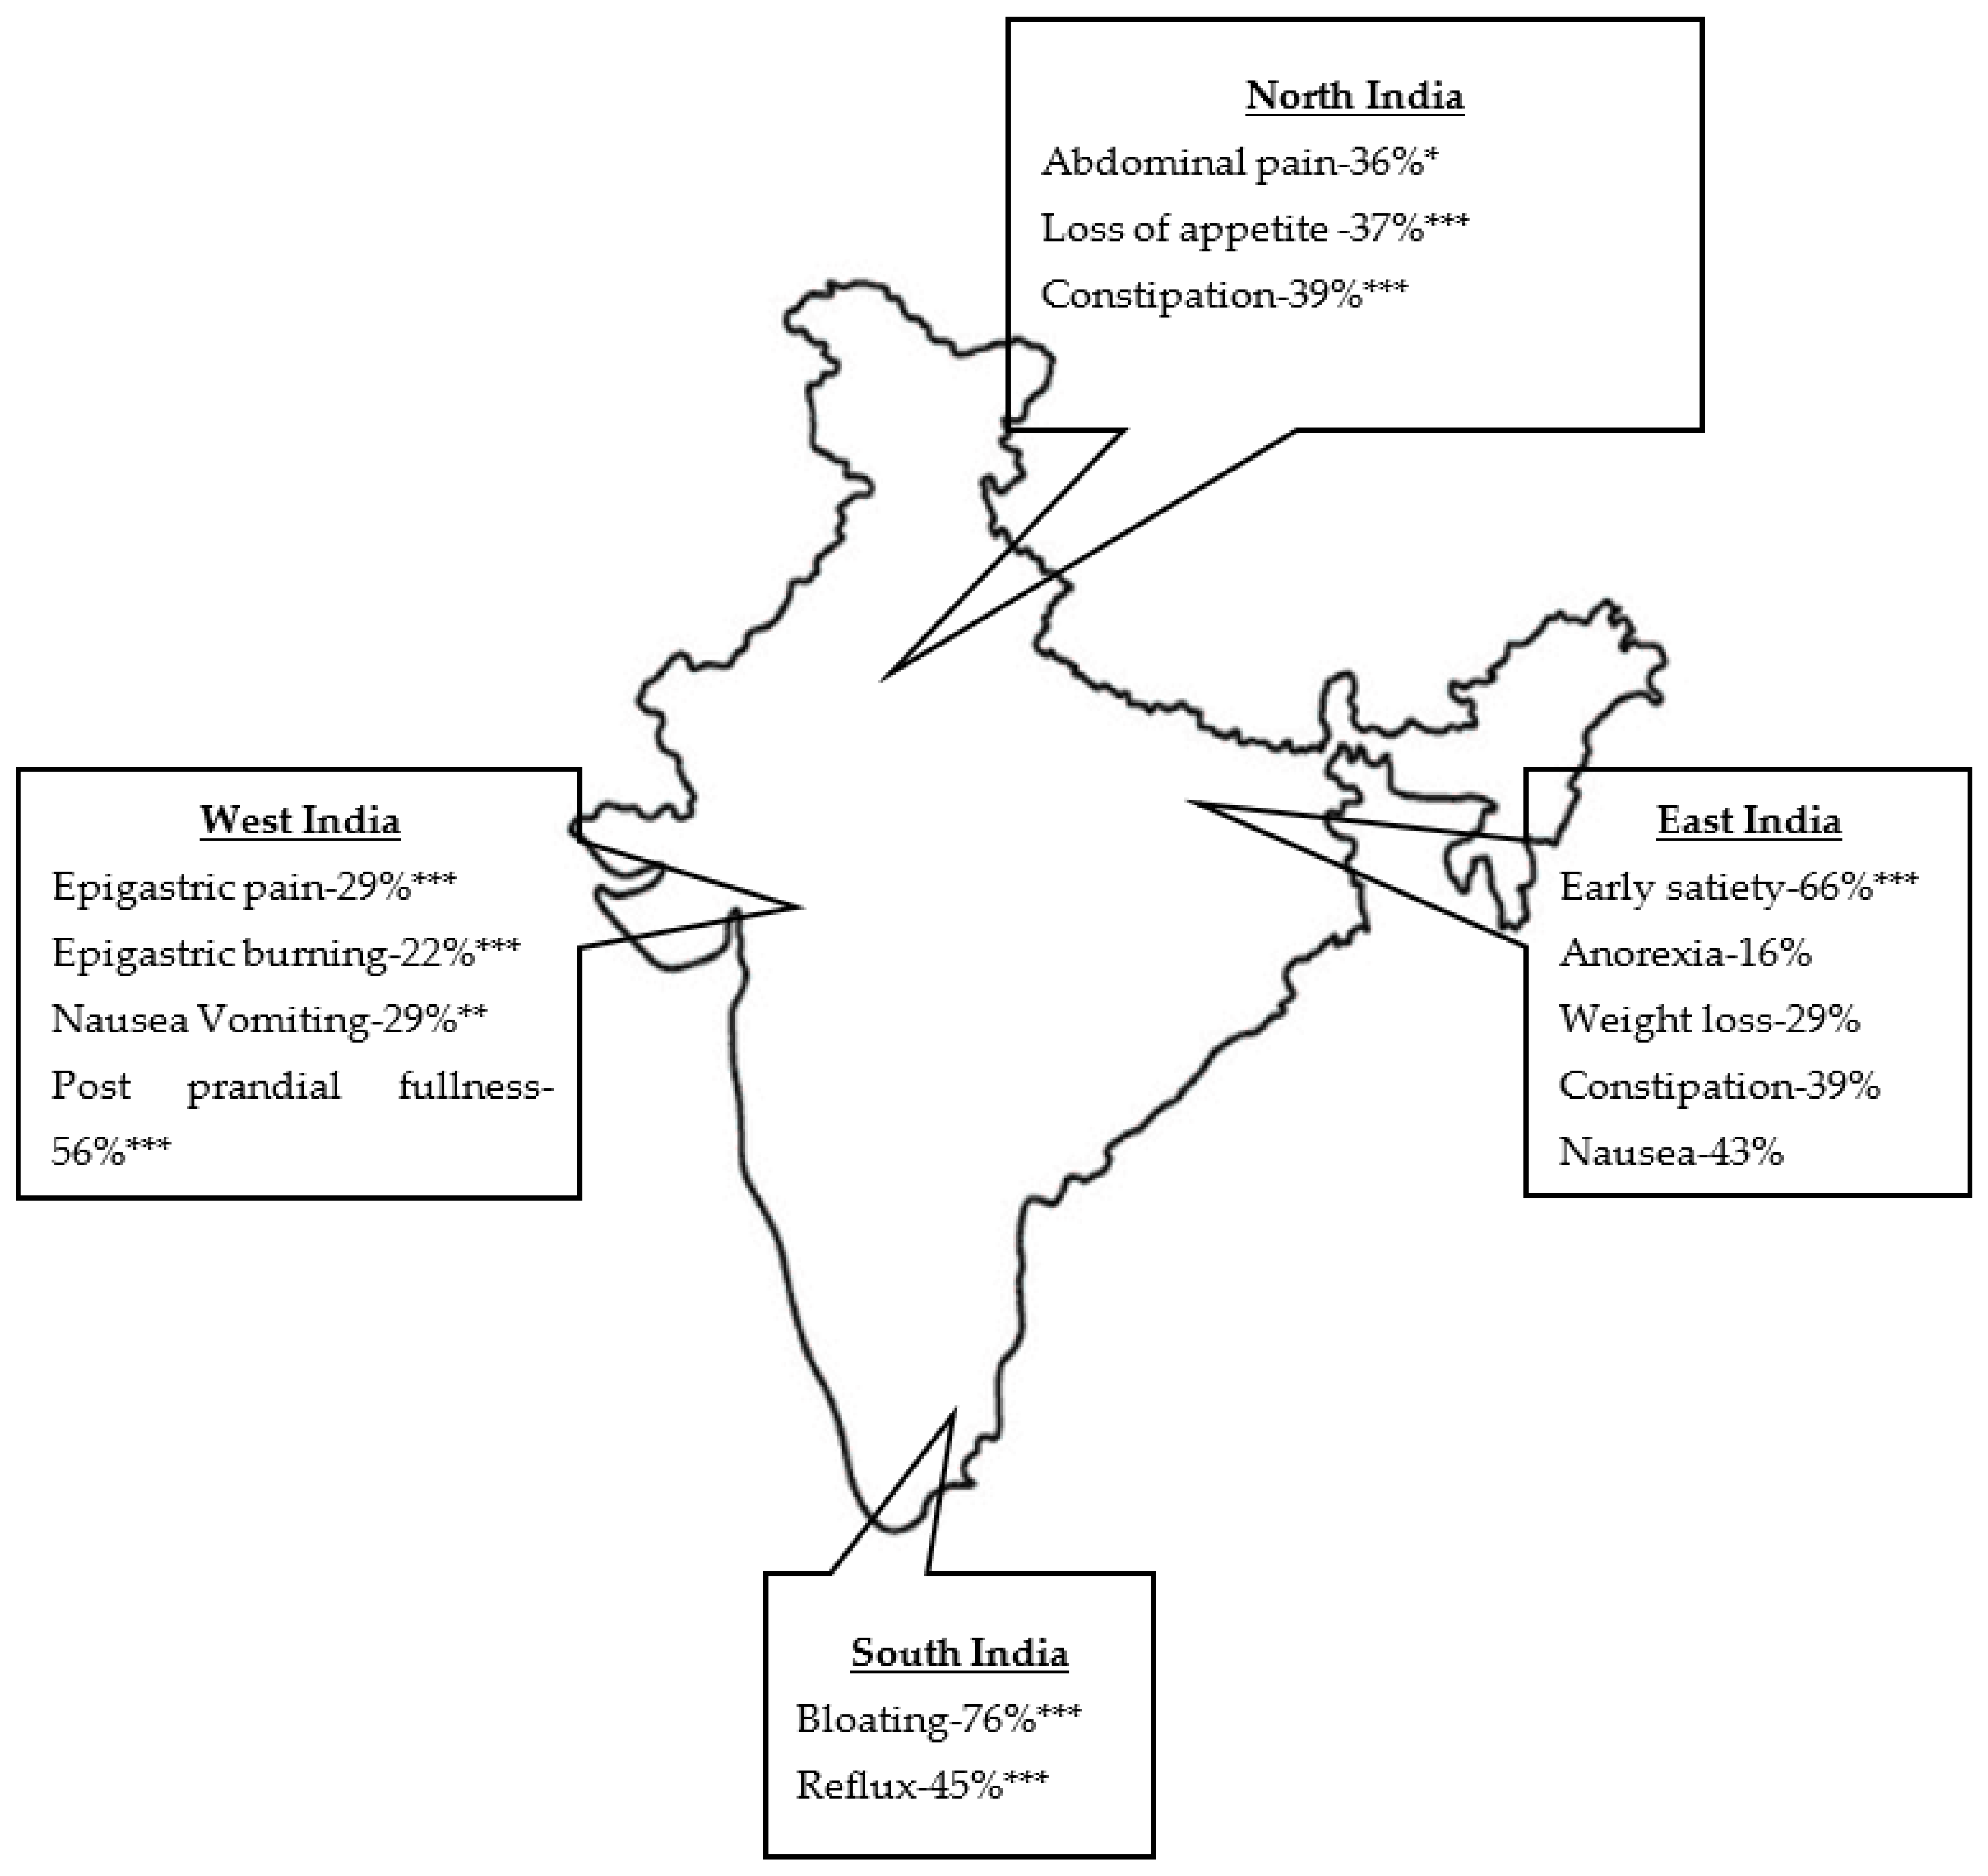
| Variables | North (n=949) | South (n=1368) | West (n=651) | East (n=720) | P value |
| Age | 42 (11-85) | 44 (5-87) | 43 (13-86) | 43 (6-82) | 0.0215* ($) |
| Gender Female Male |
420 (44%) 527 (56%) |
586 (43%) 782 (57%) |
294 (45%) 357 (55%) |
375 (52%) 345 (48%) |
|
| Early satiety | 264 (28%) | 790 (58%) | 159 (24%) | 473 (66%)*** | <0.0001 |
| Post prandial fullness | 435 (46%) | 428 (31%) | 366 (56%)*** | 302 (42%) | <0.0001 |
| Bloating | 583 (61%) | 1040 (76%)*** | 370 (57%) | 504 (70%) | <0.0001 |
| Abdominal pain | 342 (36%)* | 418 (31%) | 210 (33%) | 216 (30%) | 0.0187 |
| Epigastric pain | 227 (24%) | 128 (9%) | 186 (29%)*** | 142 (20%) | <0.0001 |
| Epigastric burning | 160 (17%) | 281 (21%) | 141 (22%)*** | 86 (12%) | <0.0001 |
| Anorexia | 40 (4%) | 43 (3%) | 46 (7%) | 115 (16%)*** | <0.0001 |
| Weight loss | 85 (9%) | 208 (15%) | 65 (12%) | 212 (29%)*** | <0.0001 |
| Loss of appetite | 352 (37%)*** | 258 (19%) | 185 (28%) | 167 (23%) | <0.0001 |
| Constipation | 372 (39%)*** | 253 (18%) | 288 (44%) | 278 (39%)*** | <0.0001 |
| Reflux | 125 (13%) | 622 (45%)*** | 53 (8%) | 318 (44%) | <0.0001 |
| Nausea and vomiting | 195 (21%) | 324 (24%) | 187 (29%)** | 170 (24%) | 0.002 |
| Nausea | 294 (31%) | 315 (23%) | 212 (33%) | 306 (43%)*** | <0.0001 |
| Variables | Overall population (n=3689) | Diabetic population (n=714) | Non-diabetic population (n=2937) |
P value (Diabetes vs non- diabetes) |
| Amount of water ingested in ml, n (%) | ||||
| Average amount of water ingested | 533.51±216.35 | 543.32±261.58 | 532.32±204.16 | 0.22 |
| >350ml | 3201 (87%) | 590 (83%)*** | 2578 (87%) | 0.00027 |
| <350ml | 472 (13%) | 114 (16%)*** | 342 (12%) | 0.000016 |
| Average water consumed >350ml±SD | 579.97±189.86 | 605.38±237.26** | 579.98±177.27 | 0.0032$ |
| Average water consumed <350ml±SD | 218.49±77.14 | 217.19±74.39*** | 150.67 ±52.49 | 0.0001$ |
| GMAT score | ||||
| >0.59 | 772 (20%) | 154 (22%)* | 518 (18%) | 0.015 |
| <0.59 | 905 (25%) | 171 (21%)*** | 711(20%) | 0.18 |
| Dysrhythmic GMAa response | ||||
| Tachygastria | 1370 (37%) | 257 (36%) | 1067 (36%) | 0.86 |
| Bradygastria | 795 (22%) | 134(19%) | 645 (22%) | 0.061 |
| Mixed dysrhythemia | 210 (6%) | 43(6%) | 166 (6%) | 0.70 |
| Hyponormal 3cpm GMA | 2012 (55%) | 387(54%) | 1590 (54%) | 0.97 |
| Normal 3cpm GMA response | ||||
| Normal 3cpm GMA | 472 (13%) | 88 (12%) | 384 (13%) | 0.59 |
| Hypernormal 3cpm GMA | 194 (5%) | 36 (5%) | 158 (5%) | 0.71 |
| Normal 3 cpm with dysrhythmiab | 439 (12%) | 85 (12%) | 344 (12%) | 0.88 |
| Dysfunction, n (%) | ||||
| APD | 772 (20%) | 154 (22%)* | 518 (18%) | 0.01 |
| ICC | 2012 (55%) | 387 (54%) | 1590 (54%) | 0.97 |
| Normal 3 cpm with and without dysrhythemia | 911 (24.7%) | 173(24.22%) | 728(4.78%) | 0.75 |
 |
Disclaimer/Publisher’s Note: The statements, opinions and data contained in all publications are solely those of the individual author(s) and contributor(s) and not of MDPI and/or the editor(s). MDPI and/or the editor(s) disclaim responsibility for any injury to people or property resulting from any ideas, methods, instructions or products referred to in the content. |
© 2025 by the authors. Licensee MDPI, Basel, Switzerland. This article is an open access article distributed under the terms and conditions of the Creative Commons Attribution (CC BY) license (http://creativecommons.org/licenses/by/4.0/).


