
Submitted:
27 January 2025
Posted:
29 January 2025
You are already at the latest version
Abstract
Ghana’s lymphatic filariasis (LF) elimination was intensified by Global Programme to Eliminate Lymphatic filariasis in 2000. LF transmission was interrupted in some endemic district, yet, persistent in others. This study investigated some characteristics of Wuchereria bancrofti that potentially contribute to persistent LF transmission in Ghana’s endemic districts after prolonged mass chemotherapy (≧15yrs) expected to interrupt transmission. Participants’ finger-prick blood was screened for antigenaemia and positives followed for night blood to detect microfilariae. The antigenaemia/microfilaraemia prevalence, implications of W. bancrofti transmission, and microfilariae clearance using scoring method (SM) were assessed. Exactly 2973 individuals were screened for antigenaemia and 33 found positive. Infected individuals were followed for night blood to detect microfilaraemia in 8 communities from the 4 study districts. The antigenaemia/microfilaraemia prevalence in Antseambua, Asemkow, Badunu, Navio (Sanwu) Central, Atampiisi Bongo, and Balungu Nabiisi were 1.3/0.0, 0.8/0.3, 0.8/0.0, 1.2/0.0, 1.7/0.0, and 3.1/0.9 respectively but none in Ampeasem and Obrayebona. Microfilariae density for thick blood films/Sedgwick counts was relatively higher in Western Region (283.9/410.0) compared to Upper East Region (44.5/25.0). Microfilariae clearance/reinfection was observed (using SM). Currently, prevalence thresholds suggest competent vectors can sustain LF transmission in Ahanta West District (hotspot) and cause possible reinfection/resurgence in Bongo (control district).
Keywords:
Lymphatic filariasis
; mass drug administration
; prevalence
; antigenaemia
; microfilaraemia
; hotspot
; control
; transmission
; Ghana
Introduction
Lymphatic filariasis (LF) is a parasitic disease caused by the filarial worms, Brugia malayi, B. timori, and Wuchereria bancrofti, spread through the infective bites of mosquito vectors. It has been a little over two decades since LF was recognised as a disease of public health importance in Ghana, before the commencement of interventions on a national level by the Global Programme to Eliminate Lymphatic Filariasis (GPELF) [1,2,3,4,5]. The two strategies of the GPELF were to interrupt transmission of LF through large-scale annual mass drug administration (MDA); and morbidity management and disability prevention (MMDP) [6,7]. The target of the GPELF was to achieve elimination of LF disease in Ghana by the year 2020. However, due to several factors and operational challenges, the target of LF elimination was not met. The complex dynamics of Wuchereria bancrofti infection in endemic foci, prolonged doling out of the LF drug regimen during MDA, and MDA non-compliant individuals among others has led to the creation of hotspot districts in Ghana [8,9,10]. The LF hotspots have been the main reason responsible for the sustenance of LF despite the numerous rounds of MDA conducted in LF endemic foci in Ghana [8,9,11]. After failing to meet the target of elimination in 2020, the GPELF is now working to achieve elimination of LF with a new roadmap having a 10-year extension set as the deadline for LF disease elimination by the WHO [12,13]. The goals for the new neglected tropical diseases (NTD) roadmap include ensuring that (i) 4 years after stopping MDA and giving essential package of care to all known LF patients in all endemic countries, sustained infections of the disease will be below target thresholds and with about 80% of the endemic countries meeting the criteria for validation of elimination of LF as a disease of public health importance; (ii) that implementation of post-MDA or post-validation surveillance is done in all endemic countries; and that the total population that need MDA is reduced to zero [13]. Strictly adhering to the goals set in the new NTD roadmap for elimination of the disease will help the GPELF achieve its initial target of elimination by the deadline. Already, it has been noticed that the number of hotspot districts in Ghana keeps decreasing after the first transmission assessment survey (TAS). Studies have reported a high initial average baseline LF prevalence in Ghana to be 8.7% (range = 0% - 45.7%) [11,14]. Currently, the average LF or microfilariae prevalence is just a little above the targeted threshold of 1%, below which interruption of disease transmission is expected in districts that are still having MDA. However, reliable data is required for the decision to stop MDA. Such decisions are driven by W. bancrofti parasite clearance in the blood of infected persons in LF endemic areas. The immunochromatographic test (ICT) card and/or filarial test strip (FTS) band has been used to determine W. bancrofti antigenaemia positive individuals. The intensities of these bands can be used as a surrogate measure to estimate W. bancrofti parasite clearance. This could be exploited to assess parasite clearance in the blood of indigenes after MDA. These analyses utilised a free downloadable R software and packages. This simple scoring method could be employed by intervention programmes and national NTD programme managers to critically assess available LF intervention data for the decision to stop MDA. It may serve as a quick analytical tool to complement all LF MDA assessments, including transmission assessment surveys (TAS), for decision-making (continue or stop MDA) especially in resource limited settings. This is because it does not require technical expertise, expensive equipment (microscopes, thermocyclers, ELISA plate readers, etc.) and high-through-put assays (ELISA, PCR, etc.). Also, intervention programmes with low budgets or limited funding can patronize this simple scoring method when conducting any LF MDA assessment. This method will also be very useful in LF Hotspot areas. In this commission the W. bancrofti and circulating filarial antigen clearance trends was assessed using a new antigenaemia scoring method and the standard WHO criteria, in some control and hotspot districts. The implications for LF transmission are also discussed.
Methods
Study sites
This study was conducted in the Ahanta West and Mpohor districts of the Western Region and the Bongo and Kassena Nankana West districts of the Upper East Region of Ghana (Figure 1).
Selection criteria
Inclusion criteria
The selected hotspot communities and districts had at least 10 rounds of LF MDA; antigenaemia prevalence of ≥ 2.0%; microfilaraemia prevalence of ≥ 1.0%. Communities selected as controls had participated in at least one of the LF MDAs; and have both antigenaemia and microfilaraemia prevalence below 2.0% and 1.0% respectively or being zero percent.
Exclusion criteria
Communities and districts were excluded if their antigenaemia and/or microfilaraemia prevalence were below 2.0% and 1.0% respectively, and control communities as well as control districts must not be selected if their antigenaemia and/or microfilaraemia prevalence was above the respective thresholds mentioned above. Also, children below the age of 5 years, lactating mothers and pregnant women were all not recruited.
These are adjoining districts with Mpohor found at the northern border of Ahanta West. Agrarian activities constitute the major occupation in these districts. The total land size for the two districts is 1,273.4 km2 (Ahanta West = 554.9 km2 and Mpohor = 718.5 km2). This is located between latitudes 4º.45” N, and 5°4’3857” N; and longitudes 1°52’6288” W and 1º.58” W. Ahanta West is positioned at the southernmost point of Ghana and the entire West African sub-region spanning 52.8 km of the Gulf of Guinea coastline. These two districts are found within the South-Western Equatorial Climatic Zone, the high rainforest vegetation zone (Ahanta West); and the Tropical Climate Zone (Mpohor) of Ghana. The Ahanta West had higher population/population density (153,140/276.0 persons/km2) than Mpohor (52,473/73.03 persons/km2). The two districts also have mean rainfall; temperature; and relative humidity ranging between 1,500 mm - 1,700 mm; 20 ºC - 34 ºC; and 70% - 85% respectively. AW has 5 rivers and 5 lagoons. Mpohor has no lagoon but has a total of 8 rivers/streams [15,16,17].
Bongo and Kassena Nankana West
The total land size of these two districts is 1,237 km2 (Bongo = 425 km2 and Kasena Nankana West = 812 km2). It is approximately found between latitudes 10° 97’ N and 11° 5' 24" N; and longitudes 000° 27' 0" W and 001° 10’ 0” W. They are found in the Guinea Savannah Zones or Woodlands. These districts had total population sizes of 120,254 (Bongo) and 90,735 (Kasena Nankana West) with population densities of 282.9 persons/km2 and 111.8 persons/km2 respectively. The rainfall and temperature in these districts also range between 600 mm - 1,400 mm, 12 ºC – 45 ºC. These districts are found in the Guinea, Sahel and Sudan Savannah vegetation, lies within the Northern Savannah Zone and Interior Continental Climate Zone [15,18,19,20,21].
Community engagement
Prior to sampling activities, meetings were held with the directors of the District Health Directorates, chiefs, elders and opinion leaders to discuss the scope of the study. Public announcements were then made in each community after all stakeholders had approved the study.
Sample size estimation
Sample sizes for each selected district was calculated from their respective demographic data using Epi-info software 7 (CDC, Atlanta, GA, USA). The initial parameter used was an expected maximum antigen prevalence of 2%. Below this threshold, the WHO guideline recommends MDA stoppage in areas having Anopheles mosquitoes as the primary vectors for the transmission of lymphatic filariasis disease [22]. Even at 99% confidence level only 52 individuals were to be recruited per site for the study. This number of subjects was anticipated to be inadequate to detect ample number of Wuchereria bancrofti positive individuals that would be significant for good analysis due to prolonged MDA rounds (over 10 MDAs) which had significantly reduced the level of parasitaemia in the human population. To increase the chances of getting several W. bancrofti positive study participants, a 50% prevalence was assumed to purposefully recalculate the samples sizes using demographic data of the communities selected for the study (Table 1).
Wuchereria bancrofti screening
Finger-prick and venous blood (from antigenaemia positive individuals) were obtained from recruited persons and screened for the presence of W. bancrofti parasites using the methods described below.
Blood sampling
Sterile lancet was used to puncture the tip of the third or fourth finger selected for bleeding. The first drop of blood was expressed while applying gentle pressure and wiped using a dry piece of cotton ball. About 100 µl expressed blood was collected using a calibrated capillary tube.
Circulating filarial antigen (CFA) screening
Immunochromatographic test (ICT)
The 100 µl finger-prick blood collected from the volunteer was added to the ICT kit and results read after 10 minutes. The test was said to be positive for W. bancrofti parasites when both the control (C) and test (T) pink lines are observed in the viewing window of the ICT card. The test was negative if only the C pink line was seen in the viewing window of the ICT card. The test was, however, considered invalid if only the T pink line or no pink line shows in the ICT card viewing window.
Filariasis test strip (FTS)
About 75 µl finger-prick blood collected with the fixed volume micropipette was used for the Alere™ Filariasis Test Strip (FTS) following manufacrturer’s protocol, and results read after 10 minutes.
When the control (C) and test (T) pink lines shows after 10 minutes, the test was deemed positive for W. bancrofti parasites. The test was negative if only the C pink line appears and was invalid if only the T pink line or no pink line was seen.
Surrogate determination of Wuchereria bancrofti clearance after treatment using Immunochromatographic test (ICT) cards or filariasis test strip (FTS)
The ICT/FTS was used to detect antigenaemia positive individuals before treatment (baseline screening). All ICT/FTS positive persons were followed for night blood collections. The night blood samples were examined for W. bancrofti parasites. Individuals with parasitaemia were then followed up for W. bancrofti parasite detection at 3-month interval for 9 months after treatment with LF MDA drug regimen (albendazole and ivermectin). The intensity of the pink band on a positive ICT card or FTS is assessed to estimate W. bancrofti parasite clearance from blood of indigenes post treatment. This is done as a semiquantitative assessment using a scoring method based on intensity of the “T-line” (positive test band) relative to the “C-line” (control band) [23,24].
Immunochromatographic test (ICT) cards or filariasis test strip (FTS) scoring method
All antigenaemia positive cards were independently scored by six randomly selected persons following given criteria. The average score is then used to estimate W. bancrofti parasite clearance. A test is considered valid if only the “C-line” is visible (i.e. test = negative) or both the “C-line” and “T-line” are visible (i.e. test = positive). However, a test is invalid if the “C-line” is not visible. Once a test was deemed valid, the simple scoring criteria ranging 0 - 3 was used to estimate W. bancrofti clearance in the blood. A valid test is assigned a score of “0” if the only band visible was the “C-line”; “1” if the intensity of the “T-line” is lower than that of the “C-line”; “2” if the intensity of both “C-line” and “T-line” are almost equal or equal; and “3” if the intensity of “C-line” is lower than that of the “T-line”.
Wuchereria bancrofti clearance assessment using Mann-Kendall’s time-series trend analysis, Sens slop, and Pettitt’s point-of-change estimations
After LF MDA or treatment, it is expected that microfilariae (mf) load in the blood of infected individuals will clear over a period. To confirm the trends in parasite clearance from the average scores from each of the positive test, the Mann-Kendall’s time-series trend analysis was exploited. This was a package from R programming. This programme was to predict whether there was W. bancrofti parasite clearance, repopulation, and/or reinfection in the blood of mf positive individuals over a given period after treatment. This was complemented by the Sen’s slope and Pettitt’s point-of-change analysis to confirm the trends predicted by the average scores from the ICT/FTS positive band intensities (see Appendix A).
Estimation of parasitaemia
Venous night blood was collected from W. bancrofti antigenaemia positive volunteers between 21:00 hr and 02:00 hr GMT. About 2 ml blood was taken from the veins and then injected into an ethylenediaminetetraacetic acid (EDTA) tube, and then stored in a cool box.
Wuchereria bancrofti parasite counts using Sedgwick-Rafter counting chamber
About 100 µl capillary night blood was added to 900 µl 3% acetic acid. This was applied to the Sedgwick Rafter Counting Chambers and observed under the Leica Galen III compound microscope. The concentration of Wuchereria bancrofti parasites in the observed blood was then estimated by counting the total number of mf in the grids of the Sedgwick Rafter Counter and dividing by 100 after which the quotient is multiplied by 1000 to express the value as mf/ml [22]. The mf density for the study districts was also estimated as the total number of mf observed with Sedgwick Rafter Counter multiplied by 10 and dividing the product by the total number of Sedgwick counter (or total number of individuals) found to be W. bancrofti positive after microscopy (Table 3).
Prevalence was estimated as the number of individuals positive for mf (after screening with the Sedgwick Rafter Counter) multiplied by 100 and the product was divided by the total number of individuals screened with the Sedgwick Rafter Counter for the detection of W. bancrofti mf [22].
Wuchereria bancrofti parasite counts using thick blood film
Night blood obtained from volunteers who consented to be part of the study was also used for thick blood film slides. To get the density of mf in 1 ml of W. bancrofti infected blood used for thick blood film preparation, the total number of mf observed during microscopy was multiplied by 16.7 and the product was divided by the total number of slides found to be W. bancrofti positive after microscopy to express the value as mf/ml [22]. The mf prevalence was estimated as the number of individuals whose slides were positive for mf multiplied by 100 and the product was divided by the total number of individuals screened for W. bancrofti mf [22].
Wuchereria bancrofti parasite counts using nucleopore filtration parasitaemia estimation
About 1 ml of night blood sampled from subjects recruited for the study was added to 9 ml of 3% acetic acid solution and passed through a 25 mm diameter Nucleopore Track-Etch filter membrane with a pore size of 5 µm [25,26]. The mf trapped on the membrane was placed on a clean glass slide upside down. The total number of parasites was then counted with the aid of a Leica Galen III compound microscope. This gives the number of W. bancrofti mf observed per ml (i.e., mf/ml) of blood.
Antigenaemia prevalence
Circulating filarial antigens in the human population was screened using the Binax Now® Filariasis Immunochromatographic Test (ICT) cards, or Alere™ Filariasis Test Strip (FTS). The antigenaemia prevalence was estimated as the number of individuals found to be W. bancrofti antigen-positive (i.e., ICT-positive or FTS-positive) multiplied by 100 and the product was divided by the total number of individuals screened with ICT or FTS [22]. This value gave the W. bancrofti antigenaemia prevalence for the study area (Table 2).
DNA extraction from blood and packed cells (whole blood having no serum)
A slightly modified protocol of the QIAGEN DNeasy Blood & Tissue Kit was used for the extraction of genomic DNA from the blood samples collected from the volunteers. The modifications made included: (i) increasing proteinase K volume by 50% and doubling the incubation time; (ii) adding equal volume of lysis buffer as the volume of the lysate; (iii) incubating lysate at 100 °C; (iv) adding ethanol as much as half the volume of the entire lysate; (v) adding one additional Buffer AW1 wash step; (vi) tripling the incubation time before eluting DNA; and (vii) eluting DNA at half the recommended volume as specified in the manufacturer’s protocol.
Wuchereria bancrofti detection using conventional polymerase chain reaction (PCR)
Conventional polymerase chain reaction (PCR) was used for the detection of Wuchereria bancrofti parasites using the extracted DNA from the blood samples of subjects recruited. This PCR amplified a SspI (small, acid-soluble spore protein I) region of the W. bancrofti genome which have repeated sequence unique to this filaria parasite. The expected band size after amplification of the DNA is 188 bp [27,28,29]. The constituents of the master mix included 2X GoTaq (2X Green GoTaq (Flexi Buffer), 0.2 mM of each dNTP, 25 mM MgCl2, 1.25 Units of GoTaq DNA polymerase), 0.4 μM each of NV1 [5’- CGT GAT GGC ATC AAA GTA GCG - 3’] – (21-mer), NV2 [5’ – CCC TCA CTT ACC ATA AGA CAA C - 3’] – (22-mer) primers and nuclease free water ( Invitrogen™ LS4387936). A volume of 5 μl DNA template was added to the master mix and amplified in a thermal cycler. The cycling conditions included a 2 min pre-heating temperature of 95 °C, followed by 35 cycles of 95 °C for 30 s, 55 °C for 30 s, and 72 °C for 1 min for denaturation, annealing and elongation respectively, followed by another elongation temperature of 72 °C for 7 min and finally a 4 °C.
The amplicon was run on a 2% (w/v) agarose gel prepared with ethylenediaminetetraacetic acid (EDTA The electrophoresis was run with and observed under a Mupid-2 plus Submarine electrophoresis system and ultraviolet (UV) light (Cleaver Scientific Ltd, Clear View, UV Transilluminator) respectively to visualize the expected band size of 188 bp for W. bancrofti detection (Figure 2).
Wuchereria bancrofti detection using real-time polymerase chain reaction (RT-PCR)
The extracted genomic DNA was also used as template for real-time polymerase chain reaction (RT-PCR) using “Long DNA Repeats” (LDR) primers as described by Rao’s working group [28]. Briefly, a 5 µl DNA template was added to a master mix consisting of a final concentration of 1X TaqMan One-Step Real-Time PCR Master Mix, 0.45 µM each of LDR1 [5’-ATT TTG ATC ATC TGG GAA CGT TAA TA-3’] and LDR2 [5’-CGA CTG TCT AAT CCA TTC AGA GTG A-3’] primers, 0.125 µM TaqMan probes with sequence [5’-ATC TGC CCA TAG AAA TAA CTA CGG TGG ATC TCT G-3’], and Nuclease Free Water (Ambion®, P/N: AM9932, L/N: 1608217) to run the PCR. This reaction was run with the ABI Prism 7300 instrument having the SDS software (Life technologies/Applied Biosystems Listing No. 200114) and calibrations of the manufacturer. The samples were run in duplicates and the cycle threshold (Ct) values were as instructed by the manufacturer. Amplified samples were seen as Sigmoid curves (Figure 3). These curves were seen at different Ct values with a given range (i.e., 23 – 33 Ct values).
Results

Table 2.
Wuchereria bancrofti antigenaemia and microfilaraemia prevalence.
| Region | District | Community | Wuchereria bancrofti Screening | Prevalence | |||
|---|---|---|---|---|---|---|---|
| Number Observed | ICT Positive | Mf | ICT (%) | Mf (%) | |||
| Positive | |||||||
| Western | HAhanta West | Antseambua | 159 | 2 | - | 1.3 | - |
| Asemkow | 370 | 3 | 1 | 0.8 | 0.3 | ||
| CMpohor | Ampeasem | 349 | 0 | - | - | - | |
| Obrayebona | 510 | 0 | - | - | - | ||
| Upper East | HKassena Nankana West | Badunu | 385 | 3 | - | 0.8 | - |
| Navio (Sanwu) Central | 332 | 4 | - | 1.2 | - | ||
| CBongo | Atampiisi Bongo | 413 | 7 | - | 1.7 | - | |
| Balungu Nabiisi | 455 | 14 | 4 | 3.1 | 0.9 | ||
C = control districts; H = hotspot districts; and (%) = values expressed as percentages.
Table 3.
Wuchereria bancrofti microfilariae concentration and density estimation.
| Region | District | Community | Microfilariae Concentration | Microfilariae Density | ||
|---|---|---|---|---|---|---|
| Thick Blood Film (mf/ml) | Sedgwick Count (mf/ml) | Thick Blood Film (mf/ml) | Sedgwick Count (mf/ml) | |||
| Western | HAhanta West | Antseambua | - | - | - | - |
| Asemkow | 283.9 | 410.0 | 283.9 | 410.0 | ||
| CMpohor | Ampeasem | - | - | - | - | |
| Obrayebona | - | - | - | - | ||
| Upper East | HKassena Nankana West | Badunu | - | - | - | - |
| Navio (Sanwu) Central | - | - | - | - | ||
| CBongo | Atampiisi Bongo | - | - | - | - | |
| Balungu Nabiisi | 16.7 | 30.0 | 44.5 | 25.0 | ||
| 83.5 | - | |||||
| - | 20.0 | |||||
| 33.4 | - | |||||
C = control districts; and H = hotspot distric.
Wuchereria bancrofti clearance and repopulation/reinfection estimation
A total of 33 (Antseambua = 2, Asemkow = 3, Ampeasem = 0, Obrayebona = 0, Badunu = 3, Navio Central = 4, Atampiisi Bongo = 7, and Balungu Nabiisi = 14) people in all communities who tested antigenaemia and microfilaraemia positive were followed over a period of 9 months (3 months interval) post infection to assess W. bancrofti parasite clearancein all the study areas.
Discussion
This study looked at the trends in LF transmission to contribute data on when it is appropriate to halt MDA, due to the emergence of hotspots in LF endemic communities in Ghana. The immunochromatographic test (ICT) card and/or filarial test strip (FTS) band was used to determine W. bancrofti antigenaemia positive individuals.
Stopping MDA is dependent on the outcomes of a study satisfying the WHO criteria of antigenaemia and microfilaraemia thresholds that are respectively below 2.0% and 1.0% where Anopheles and Culex mosquitoes are principal vectors of LF. In all Hotspot districts, antigenaemia and microfilaraemia were below the recommended WHO threshold suggesting MDA was no longer needed in these districts. However, stopping MDA will not be the best decisionas. Entomological surveys in the same study area have suggested the presence of vectors competent to transmit even at very low parasitaemia [10,30]. Data from parasitological survey show microfilaraemia concentrations and densities found in the Control districts to be high enough to appreciably sustain active transmission of W. bancrofti. This implied that presence of mosquito vectors for W. bancrofti transmission in these districts will sustain LF transmission following vector bites in the district. Briefly, entomological data in the study area shows high densities of mosquito vectors such as Anopheles gambiae s.l, and Mansonia mosquitoes known for W. bancrofti transmission in the study districts and in Ghana [30,31,32,33,34,35]. For instance, in the Western Region of Ghana, mosquito vectors efficient in transmitting W. bancrofti at very low parasitaemia such as An. melas [32] and Mansonia mosquitoes [36,37] were recorded in the Mpohor and Ahanta West districts. However, only An. melas was found to be transmitting W. bancrofti in the Ahanta West District during the study with an annual transmission potential of about 7.4 [10]. Also, in the Upper East Region of Ghana, the principal vector (An. gambiae s. l.) and secondary vectors (Mansonia africana and Ma. uniformis) for W. bancrofti transmission, were collected [38]. The An. gambiae s. l. mosquitoes in Upper East Region has been reported to exhibit phenomenon of “limitation” which is the ability of vector(s) to efficiently transmit the parasites at very low parasitaemia [35].
Prolonged MDA activities by the GPELF in Ghana has significantly reduced levels of microfilaraemia. This had led to interruption of W. bancrofti transmission in most endemic districts in Ghana. However, for such competent mosquito vectors to be found in Hotspot districts, there will be the potential for residual disease transmission. In all the study districts, there were vectors capable of maintaining W. bancrofti transmission regardless of numerous MDA rounds conducted. Several factors account for persistent LF transmission in any endemic area. These may include non-compliance to MDA [39]; low epidemiological coverage [40,41] which may include both geographical coverage [11] and therapeutic coverage [11,14]; high baseline mf prevalence [42] and efficacy of MDA drug regimen [43] among others. All these factors contribute to the creation of ‘hotspot’ districts. In our study, issues of non-compliance, epidemiological coverage, and efficacy of drug regimen were not presently contributing much to sustenance of LF after several MDA interventions. Parasitaemia has been low in endemic areas showing evidence of drug efficacy and education to reduce non-compliance in the endemic areas. With time, there was also evidence of good epidemiological coverage [11,14]. However, high baseline mf prevalence may still be a relevant factor in the hotspot districts remaining in Ghana. For example, while there was no baseline antigenaemia and microfilaraemia prevalence data for Mpohor, Bongo and Kassena Nankana West district, the baseline antigenaemia (immunochromatographic card test, i.e. (ICT)) and microfilaraemia (microscopy) prevalence data for Ahanta West District was respectively 32.80 and 19.46 (Ghana Neglected Tropical Disease Programme – unpublished data). This was evidence of high baseline antigenaemia and microfilaraemia prevalence. This was contributing to the creation of Hotspot districts aided by some combination of factors that ensured the gradual decline of microfilaraemia after numerous MDA rounds. In addition, the main factors seen to be driving the incidence or creation of Hotspot districts seem to be i) high microfilariae concentrations and densities (high intensity of infection in the human population), and ii) presence of competent vectors that exhibit “limitation” and therefore can transmit W. bancrofti when parasite levels in the blood of indigenes are very low.
The intensity of infection was rather high in the Ahanta West District compared to the Kassena Nankana West District. However, they were all quite high enough for competent vectors in these districts to maintain W. bancrofti transmission. As expected, Mpohor District had no W. bancrofti transmission as a Control District. However, Bongo, that had passed transmission assessment survey (TAS) and therefore stopped MDA, had a relatively high antigenaemia prevalence above the WHO recommended threshold for interrupting LF transmission. Consequently, a resurgence in this district is envisaged if LF surveillance procedures are not reviewed and/or revised to randomly include a few extra communities that were not selected as sentinel and cross-check sites. This will help the intervention programme managers make informed decisions regarding re-starting treatment in this district if similar results are found. In this study, a surrogate method that will generate useful results to support the crucial decision-making to either continue or stop MDA at no extra cost to intervention programmes was demonstrated. This method simply exploited the use of average scores from the ICT/FTS band intensities of antigenaemia and/or microfilariaemia positive individuals screened for W. bancrofti parasites. This was used to estimate the possible status of parasite clearance, repopulation, and/or reinfection in antigenaemia and microfilariaemia positive individuals. This simple scoring method is augmented with some statistically sound R programme packages (Mann-Kendall’s time-series analysis, Sen’s slope and Pettitt’s test) to provide additional vital information on the W. bancrofti clearance, repopulation, and/or reinfection trends in the human population treated (see Appendix). A negative value from the Mann-Kendall’s time-series analysis suggested active parasite clearance and a positive value meant either reinfection or repopulation of mf in the blood. A Sen’s slope value (negative or positive) together with its confidence interval augments the Mann-Kendall’s time-series trend analysis. The Pettitt’s test also supports the Mann-Kendall’s time-series analysis. The value given after running the Pettitt’s test confirms the downward or upward trend in the average ICT/FTS scores being analysed. Issues of Hotspot districts are unique and the rules of engagement for the stoppage of MDA and other GPELF activities must be reviewed to successfully interrupt W. bancrofti transmission in such districts. This review may include i) setting a lower prevalence threshold than the existing one specifically for Hotspot districts; and incorporating the ICT/FTS average scoring intensity method and related analysis for an enhanced decision to continue or stop MDA backed by additional but vital data. This is because there is spatial heterogeneity associated with W. bancrofti transmission in Hotspot districts. This requires that each Hotspot settings is given a tailor-made intervention after a critical assessment of the LF transmission dynamics in such settings. The ICT/FTS band intensity scoring method offers additional critical information about the W. bancrofti transmission dynamics such as antigenaemia and microfilaraemia clearance, repopulation and/or reinfection status in the treated individuals of any Hotspot settings.
Conclusion
The current single-dose ABZ and IVM combination therapy drug regimen for LF MDA is still efficacious and has reduced parasitaemia significantly in the blood of people in LF endemic districts leading to interruption of transmission in most endemic districts of Ghana [8,44]. However, some individuals in the Hotspot districts have mf concentrations and densities high enough to be transmitted by competent vectors such as Anopheles mosquitoes, which are efficient even at low parasitaemia. These vectors known to be exhibiting the phenomenon of “limitation” are found in the study districts. This is of concern because Bongo District, which had stopped MDA have antigenaemia prevalence above the recommended WHO threshold for stopping MDA, thus there is the potential of having LF resurgence in this district. There is the need for tailor-made solutions to accelerate elimination of LF in Hotspot districts due to the unique nature of the factors that ensures the maintenance of residual disease transmission in these settings. The semiquantitative ICT/FTS antigenaemia band intensity scoring method and its related analyse package can be used as a surrogate for estimating W. bancrofti parasite clearance, repopulation, and/or reinfection in the human population.
Recommendation
Results from parasitological survey data should always be complemented with entomological data and the ICT/FTS band intensity scoring method to decide whether to stop MDA after assessing antigenaemia and microfilaraemia prevalence in an endemic area. Also, the WHO threshold for stopping MDA should be reviewed for Hotspot areas. The threshold value should be lower than the existing one to ensure adequate rounds of MDA that will interrupt LF disease transmission and hence MDA stoppage. This will help reduce the number of Hotspot districts created through prolonged MDA. Further, due to issues of spatial heterogeneity in Hotspot districts, there is the need to review the criteria for LF MDA activities and disease interruption using custom-made solutions to expedite the goal of elimination. This will help intervention programme managers to meet the 2030 deadline set for the new NTD Roadmap
Author Contributions
Conceptualization: DAB; data curation: JHNO; formal analysis: JHNO, SPB, KKF, and BKB; funding acquisition: DAB, investigation: JHNO, SO, JO, JQ and WDKA; methodology: DAB, CA, DKdS, FAA, LB, SKD, and JHNO; project administration: DAB, CA, DKdS, and SKD; resources: DAB, MAA, MDW, DKdS, and SKD; supervision: FAA, LB, SKD, BKB, MAA, MDW, DKdS, and DAB; validation: JHNO, SO, JO, JQ and WDKA; visualization: DKdS, MAA, MDW, SKD, and DAB; writing – original draft: JHNO; writing – review & editing: all authors.
Funding
This study was funded by the Centre for Neglected Tropical Diseases, Liverpool School of Tropical Medicine and the SightSavers International, Ghana. The funders were not involved in the design of the study, collection of sample, analysis and interpretation of results and preparation of the manuscript.
Institutional Review Board Statement
The study was conducted in accordance with the Declaration of Helsinki and approved by the Institutional Review Board (or Ethics Committee) of the Noguchi Memorial Institute for Medical Research, Accra, Ghana (CPN 077/13-14).
Informed Consent Statement
Informed consent for participation and publication was obtained from all identifiable human participants. Consent forms were completed by all participants.
Data Availability Statement
The original contributions presented in this study are included in the article/supplementary material. Further inquiries can be directed to the corresponding author.
Acknowledgments
We thank Dr. Irene Owusu Donkor who provided us some logistics. We also thank Prof. Margaret Gyapong for her initial contributions to the conceptual framework of this study. We appreciate members of the Department of Parasitology, Naval Medical Research Unit (NAMRU), Vestergaard Vector Laboratory all of Noguchi Memorial Institute for Medical Research (NMIMR) and the Department of Animal Biology and Conservation Science (DABCS) for their diverse contribution to the study. Our sincere gratitude also goes to the Directors of the District Health Management Team (DHMT), District Disease Control Officers (DDCO), Nurses at the Community-Based Health Planning and Services (CHPS) facilities, the Chiefs, Elders, Opinion Leaders, the indigenes and participants of the study districts for the various roles they played for the successful completion of this study.
Conflicts of Interest
The authors declare no conflict of interest.
Abbreviations
The following abbreviations are used in this manuscript:
| Abbreviation | Meaning |
| ABI | Applied Biosystems Instrument |
| ABZ | Albendazole |
| AW | Ahanta West |
| CDC | Center for Disease Control and Prevention |
| CFA | Circulating Filarial Antigen |
| CHPS | Community-Base Health Planning and Service |
| DDCO | District Disease Control Officer |
| DEPC | Diethylprocarbonate |
| DHMT | District Health Management Team |
| DNA | Deoxyribonucleic acid |
| dNTP | Deoxynucleotide triphosphate |
| EDTA | Ethylenediaminetetraacetic acid |
| FTS | Filarial Test Strip |
| GMT | Greenwich Mean Teime |
| GPELF | Global Programme to Eliminate Lymphatic Filariasis |
| ICT | Immunochromatographic Test |
| 1D | Identification |
| IVM | Ivermectin |
| IVM/VC | Integrated Vector Management/Vector Control |
| KNW | Kassena Nankana West |
| LDR | Long DNA Repeat |
| LF | Lymphatic Filariasis |
| MDA | Mass Drug Administration |
| MMDP | Morbidity Management and Disability Prevention |
| MOFA | Ministry of Food and Agriculture |
| NAMRU | Naval Medical Research Unit |
| NMIMR | Noguchi Memorial Institute for Medical Research |
| NTD | Neglected Tropical Diseases |
| PCR | Polymerase Chain Reaction |
| RT-PCR | Reverse Transcription Polymerase Chain Reaction |
| TAS | Transmission Assessment Survey |
| USA | United States of America |
| UV | Ultraviolet |
| WHA | World Health Assembly |
| WHO | World Health Organisation |
Appendix A
Appendix A.1
Mann-Kendall time series trend analysis
> #Running Mann-Kendall time series trend analysis using R programme packages
> library("mice")
> library("Kendall")
> library("trend")
> library("expss")
> library("finalfit")
> library("dplyr")
> library("tidyr")
> library("broom")
> sapply(pkgs,require,character.only=TRUE)
dplyr tidyr broom
TRUE TRUE TRUE
> pkgs<-c("dplyr","tidyr","broom")
> library("rootSolve")
> require(R2wd)
> library("rtf")
######################################################################
Appendix B.1
> #The Wuchereria bancrofti clearance, repopulation/reinfection in Atampiisi Bongo human population using time-series trends
> atb<-read.csv("C:\\Users\\JHNOSEI\\Desktop\\Atampiisi wb trends.csv",header=TRUE)
> a<-data.frame(atb)
> a
Table A1.
Wuchereria bancrofti trends in Atampiisi Bongo.
| # | Participant | Baseline | X1st.Follow.Up | X2nd.Follow.Up | X3rd.Follow.Up |
|---|---|---|---|---|---|
| 1 | P1 | 2 | 2 | 2 | 1 |
| 2 | P2 | 1 | 2 | 0 | 1 |
| 3 | P3 | 2 | 2 | 2 | 1 |
| 4 | P4 | 2 | 2 | Travelled | Travelled |
| 5 | P5 | 2 | 2 | 2 | Travelled |
| 6 | P6 | 2 | 2 | 2 | 1 |
| 7 | P7 | 2 | 2 | 0 | 1 |
Appendix B.2
> #The "mice" package is run to detect missing data values (i.e. Travelled) to allow the software insert predicted values (in the programme's memory for this table) after running the "complete" command
> h<-mice(a)
Warning message:
Number of logged events: 1
> #The "complete" command is used to fill in missing values with the most likely values after some R background simulations
> a=complete(h)
>
> #Estimating missing values to fill in all “Travelled” values using time-series trends or simulations
> TS<-ts(a$X2nd.Follow.Up,frequency=1,start=c(a$X2nd.Follow.Up,7))
> TS
Time Series:
Start = 2
End = 8
Frequency = 1
[1] 2 1 2 3 2 2 1
attr(,"levels")
[1] 0 2 Travelled
>
> #The "MannKendall(TS)" command is executed to runs the time-series trend analysis for the data under consideration
> MK=MannKendall(TS)
> #The "Summary(MK) summarizes the Mann-Kendall's time-series trend analysis
> summary(MK)
Table A2.
Time series summary for Atampiisi Bongo.
| Score = -2 | Var(Score) = 34.66667 | denominator = 17.14643 | tau = -0.117 | 2-sided pvalue = 0.86513 |
>
Appendix B.3
> #The Sen's slope estimates the approximate gradient for the Mann-Kendall's time-series trend analysis
> sens.slope(TS) Sen's slope
data: TS
Table A3.
Sen’s slope estimations for Atampiisi Bongo.
| z = -0.16984 |
n = 7 |
p-value = 0.8651 |
alternative hypothesis: true z is not equal to 0 | 95 percent confidence interval: -0.5000 0.3333 |
sample estimates: Sen’s slope 0 |
Appendix B.4
> #The Pettitt test gives the point in the data where the change begins or occurs
> pettitt.test(TS) Pettitt's test for single change-point detection
data: TS
Table A4.
Pettitt’s test estimations for Atampiisi Bongo.
| U* = 5 |
p-value = 1.364 |
alternative hypothesis: two.sided | sample estimates: | probable change point at time K 6 |
> a [6]
Table A5.
Pettitt’s test point-of-change values.
| # | Participant | Baseline | X1st.Follow.Up | X2nd.Follow.Up | X3rd.Follow.Up |
| 6 | P6 | 2 | 2 | 2 | 1 |
>
> #Notice that where applicable, all three parameters (Mann-Kendall, Sen's Slope, and Pettitt's Test), are considered to give a better explanation for the time-series trends.
Appendix C.1
> #Wuchereria bancrofti clearance, repopulation/reinfection in Balungu Nabiisi human population using time-series trends
> bln<-read.csv("C:\\Users\\JHNOSEI\\Desktop\\Balungu wb trends.csv",header=TRUE)
> b<-data.frame(bln)
> b
Table A1.
Wuchereria bancrofti trends in Balungu Nabiisi.
| # | Participant | Baseline | X1st.Follow.Up | X2nd.Follow.Up | X3rd.Follow.Up |
|---|---|---|---|---|---|
| 1 | P8 | 2 | 2 | Travelled | Travelled |
| 2 | P9 | 2 | 2 | 2 | 1 |
| 3 | P10 | 2 | 2 | 0 | 1 |
| 4 | P11 | 2 | 1 | 0 | 0 |
| 5 | P12 | 2 | Travelled | Travelled | Travelled |
| 6 | P13 | 2 | 2 | Travelled | 2 |
| 7 | P14 | 2 | 2 | 2 | Travelled |
| 8 | P15 | 2 | 2 | 2 | 1 |
| 9 | P16 | 2 | Travelled | Travelled | 1 |
| 10 | P17 | 2 | 2 | 2 | 0 |
| 11 | P18 | 2 | 2 | 0 | 0 |
| 12 | P19 | 2 | 2 | 2 | Travelled |
| 13 | P20 | 2 | 2 | 2 | 1 |
| 14 | P21 | 2 | 0 | Travelled | 0 |
> i<-mice(b)
Number of logged events: 61
> b=complete(i)
> #Estimating missing values
> TS1<-ts(b$X2nd.Follow.Up,frequency=5,start=c(b$X2nd.Follow.Up,10))
> TS1
Time Series:
Start = c(1, 2)
End = c(3, 5)
Frequency = 5
[1] 1 2 1 1 3 3 2 2 3 2 1 2 2 3
attr(,"levels")
[1] 0 2 Travelled
>
> MK=MannKendall(TS1)
> summary(MK)
Table A2.
Time series summary for Balungu Nabiisi.
| Score = 20 |
Var(Score) = 288 |
denominator = 76.31514 |
tau = 0.262 |
2-sided pvalue = 0.26289 |
> sens.slope(TS1) Sen's slope
data: TS1
Table A3.
Sen’s slope estimations for Balungu Nabiisi.
| z = 1.1196 |
n = 14 |
p-value = 0.2629 |
alternative hypothesis: true z is not equal to 0 | 95 percent confidence interval: 0.00 0.167 |
sample estimates: Sen’s slope 0 |
> pettitt.test(TS1) Pettitt's test for single change-point detection
data: TS1
Table A4.
Pettitt’s test estimations for Balungu Nabiisi.
| U* = 30 |
p-value = 0.3187 |
alternative hypothesis: two.sided | sample estimates: | probable change point at time K 4 |
> b [4]
Table A5.
Pettitt’s test point-of-change values.
| # | Participant | Baseline | X1st.Follow.Up | X2nd.Follow.Up | X3rd.Follow.Up |
|---|---|---|---|---|---|
| 4 | P11 | 2 | 1 | 0 | 0 |
> TS2<-ts(b$X3rd.Follow.Up,frequency=14,start=c(b$X3rd.Follow.Up,14))
> TS2
Time Series:
Start = c(2, 2)
End = c(3, 1)
Frequency = 14
[1] 2 2 2 1 4 3 4 2 2 1 1 4 2 1
attr(,"levels")
[1] 0 1 2 Travelled
>
> MK=MannKendall(TS2)
> summary(MK)
>c
Table A6.
Time series summary.
| Score = -13 |
Var(Score) = 293 |
denominator = 78.08329 |
tau = -0.166 |
2-sided pvalue = 0.48327 |
> sens.slope(TS2) Sen's slope
data: TS2
Table A7.
Sen’s slope estimations.
| z = -0.70105 |
n = 14 |
p-value = 0.4833 |
alternative hypothesis: true z is not equal to 0 | 95 percent confidence interval: -0.2000 0.0000 |
sample estimates: Sen’s slope 0 |
> pettitt.test(TS2) Pettitt's test for single change-point detection
data: TS2
Table A8.
Pettitt’s test estimations.
| U* = 19 |
p-value = 0.9573 |
alternative hypothesis: two.sided | sample estimates: | probable change point at time K NA, 7, 8, NA, 9 |
> b [7]
Table A9.
Pettitt’s test point-of-change values.
| # | Participant | Baseline | X1st.Follow.Up | X2nd.Follow.Up | X3rd.Follow.Up |
|---|---|---|---|---|---|
| 7 | P14 | 2 | 2 | 2 | Travelled |
> b [8]
Table A10.
Pettitt’s test point-of-change values.
| # | Participant | Baseline | X1st.Follow.Up | X2nd.Follow.Up | X3rd.Follow.Up |
|---|---|---|---|---|---|
| 8 | P15 | 2 | 2 | 2 | 1 |
> b [9]
Pettitt’s test point-of-change values
| # | Participant | Baseline | X1st.Follow.Up | X2nd.Follow.Up | X3rd.Follow.Up |
| 9 | P16 | 2 | Travelled | Travelled | 1 |
> #Wuchereria bancrofti clearance, repopulation/reinfection in the Badunu human population using time-series trends
> bnu<-read.csv("C:\\Users\\JHNOSEI\\Desktop\\Badunu wb trends.csv",header=TRUE)
> d<-data.frame(bnu)
> d
Table A1.
Wuchereria bancrofti trends in Badunu.
| # | Participant | Baseline | X1st.Follow.Up | X2nd.Follow.Up | X3rd.Follow.Up |
|---|---|---|---|---|---|
| 1 | P22 | 2 | 2 | 2 | 1 |
| 2 | P23 | 2 | 2 | 0 | 1 |
| 3 | P24 | 2 | 2 | 2 | 0 |
> #Estimating time-series trends
> TS3<-ts(d)
> MK=MannKendall(TS3)
> summary(MK)
Table A2.
Time series summary for Badunu.
| Score = -37 |
Var(Score) = 311.6667 |
denominator = 82.61356 |
tau = -0.448 |
2-sided pvalue = 0.041431 |
> sens.slope(TS3) Sen's slope
data: TS3
Table A3.
Sen’s slope estimations for Badunu.
| z = -2.0392 |
n = 15 |
p-value = 0.04143 |
alternative hypothesis: true z is not equal to 0 | 95 percent confidence interval: -0.1667 0.0000 |
sample estimates: Sen’s slope 0 |
> #Wuchereria bancrofti clearance, repopulation/reinfection in the Navio (Sanwu) Central human population using time-series trends
> nvc<-read.csv("C:\\Users\\JHNOSEI\\Desktop\\Navio wb trends.csv",header=TRUE)
> e<-data.frame(nvc)
> e
Table A1.
Wuchereria bancrofti trends in Navio (Sanwu) Central.
| # | Participant | Baseline | X1st.Follow.Up | X2nd.Follow.Up | X3rd.Follow.Up |
|---|---|---|---|---|---|
| 1 | P25 | 2 | 2 | Travelled | Travelled |
| 2 | P26 | 2 | 2 | 2 | 1 |
| 3 | P27 | 2 | 2 | Travelled | Travelled |
| 4 | P28 | 2 | 2 | Travelled | Travelled |
> k<-mice(e)
Number of logged events: 3
> e=complete(k)
>
> #Estimating missing values
> #No variable has been stated for time-series simulation hence time series is run for entire data frame "e"
> TS4<-ts(e)
> MK=MannKendall(TS4)
> summary(MK)
Table A2.
Time series summary for Navio (Sanwu) Central.
| Score = -28 |
Var(Score) = 538 |
denominator = 124.8199 |
tau = -0.224 |
2-sided pvalue = 0.2444 |
> sens.slope(TS4) Sen's slope
data: TS4
Table A3.
Sen’s slope estimations for Navio (Sanwu) Central.
| z = -1.1641 |
n = 20 |
p-value = 0.2444 |
alternative hypothesis: true z is not equal to 0 | 95 percent confidence interval: 0.0000 0.0000 |
sample estimates: Sen’s slope 0 |
> #Wuchereria bancrofti clearance, repopulation/reinfection in the Antseambua human population using time-series trends
> ant<-read.csv("C:\\Users\\JHNOSEI\\Desktop\\Antseambua wb trends.csv",header=TRUE)
> f<-data.frame(ant)
> f
Table A1.
Wuchereria bancrofti trends in Atseambua.
| # | Participant | Baseline | X1st.Follow.Up | X2nd.Follow.Up | X3rd.Follow.Up |
|---|---|---|---|---|---|
| 1 | P29 | 2 | 1 | 2 | 1 |
| 2 | P30 | 2 | 2 | 2 | 0 |
>
> #Estimating time-series trends
> TS5<-ts(f)
> MK=MannKendall(TS5)
> summary(MK)
Table A2.
Time series summary for Atseambua.
| Score = -9 |
Var(Score) = 93 |
denominator = 34.85685 | tau = -0.258 |
2-sided pvalue = 0.40679 |
> sens.slope(TS5) Sen's slope
data: TS5
Table A3.
Sen’s slope estimations for Atseambua.
| z = -0.82956 |
n = 10 |
p-value = 0.4068 |
alternative hypothesis: true z is not equal to 0 | 95 percent confidence interval: -0.2500 0.0000 |
sample estimates: Sen’s slope 0 |
> #Wuchereria bancrofti clearance, repopulation/reinfection in the Asemkow human population using time-series trends
> asm<-read.csv("C:\\Users\\JHNOSEI\\Desktop\\Asemkow wb trends.csv",header=TRUE)
> g<-data.frame(asm)
> g
Table A1.
Wuchereria bancrofti trends in Asemkow.
| # | Participant | Baseline | X1st.Follow.Up | X2nd.Follow.Up | X3rd.Follow.Up |
|---|---|---|---|---|---|
| 1 | P31 | 2 | 2 | Travelled | 2 |
| 2 | P32 | 2 | 2 | Travelled | 2 |
| 3 | P33 | 2 | 2 | 2 | 2 |
> m<-mice(g)
Number of logged events: 3
> g=complete(m)
>
> #Estimating missing values
> TS6<-ts(g)
> MK=MannKendall(TS6)
> summary(MK)
Table A2.
Time series summary for Asemkow.
| Score = -4 |
Var(Score) = 194.6667 |
denominator = 63.16645 |
tau = -0.0633 |
2-sided pvalue = 0.82975 |
> sens.slope(TS6) Sen's slope
data: TS6
Table A3.
Sen’s slope estimations for Asemkow.
| z = -0.21502 |
n = 15 |
p-value = 0.8298 |
alternative hypothesis: true z is not equal to 0 | 95 percent confidence interval: 0.0000 0.0000 |
sample estimates: Sen’s slope 0 |
> pettitt.test(TS6) Pettitt's test for single change-point detection
data: TS6
Table A4.
Pettitt’s test estimations for Asemkow.
| U* = 13 |
p-value = 1.509 |
alternative hypothesis: two.sided | sample estimates: | probable change point at time K 1 |
> g [1]
Table A5.
Pettitt’s test point-of-change values.
| # | Participant | Baseline | X1st.Follow.Up | X2nd.Follow.Up | X3rd.Follow.Up |
|---|---|---|---|---|---|
| 1 | P31 | 2 | 2 | Travelled | 2 |
References
- Dunyo SK, Appawu M, Nkrumah FK, Baffoe-Wilmot A, Pedersen EM, Simonsen PE: Lymphatic filariasis on the coast of Ghana. Transactions of the Royal Society of Tropical Medicine and Hygiene 1996, 90(6):634-638.
- Dzodzomenyo M, Dunyo SK, Ahorlu CK, Coker WZ, Appawu MA, Pedersen EM, Simonsen PE: Bancroftian filariasis in an irrigation project community in southern Ghana. Tropical Medicine and International Health 1999, 4(1):13-18.
- Gyapong JO, Badu JK, Adjei S, Binka FN: Bancroftian filariasis in the Kasena-Nankana district of the upper east region of Ghana - a preliminary study. Journal of Tropical Medicine and Hygiene 1993, 96:317-322.
- Gyapong JO, Dollimore N, Binka FN, Ross DA: Lay reporting of elephantiasis of the leg in northern Ghana. Transactions of the Royal Society of Tropical Medicine and Hygiene 1995, 89:616-618.
- Gyapong JO, Magnussen P, Binka FN: Parasitological and clinical aspects of Bancroftian filariasis in the Kasena Nankana District, Upper East Region, Ghana. Transactions of the Royal Society of Tropical Medicine and Hygiene 1994, 88(5):555-557.
- Chiphwanya J, Mkwanda S, Kabuluzi S, Mzilahowa T, Ngwira B, Matipula DE, Chaponda L, Ndhlova P, Katchika P, Mahebere Chirambo C et al: Elimination of lymphatic filariasis as a public health problem in Malawi. PLoS Negl Trop Dis 2024, 18(2):e0011957.
- Mathiarasan L, Das LK, Krishnakumari A: Assessment of the Impact of Morbidity Management and Disability Prevention for Lymphatic Filariasis on the Disease Burden in Villupuram District of Tamil Nadu, India. Indian J Community Med 2021, 46(4):657-661.
- de Souza DK, Ahorlu CS, Adu-amankwah S, Otchere J, Mensah SK, Larbi IA, Mensah GE, Biritwum N-k, Boakye DA: Community-based trial of annual versus biannual single-dose ivermectin plus albendazole against Wuchereria bancrofti infection in human and mosquito populations : study protocol for a cluster randomised controlled trial. Trials 2017, 18:448.
- Mehta PK, Maharjan M: Assessment of antigenemia among children in four hotspots of filarial endemic districts of Nepal during post-MDA surveillance. Trop Med Health 2023, 51(1):47.
- Pi-bansa S, Osei JHN, Kartey-Attipoe WD, Elhassan E, Agyemang D, Otoo S, Dadzie SK, Appawu MA, Wilson MD, Koudou BG et al: Assessing the Presence of Wuchereria bancrofti Infections in Vectors Using Xenomonitoring in Lymphatic Filariasis Endemic Districts in Ghana. Tropical Medicine and Infectious Disease 2019, 4:49.
- Biritwum NK, Frempong KK, Verver S, Odoom S, Alomatu B, Asiedu O, Kontoroupis P, Yeboah A, Hervie ET, Marfo B et al: Progress towards lymphatic filariasis elimination in Ghana from 2000-2016: Analysis of microfilaria prevalence data from 430 communities. PLoS Negl Trop Dis 2019, 13(8):e0007115.
- N. T. D. Modelling Consortium Lymphatic Filariasis Group: The roadmap towards elimination of lymphatic filariasis by 2030: insights from quantitative and mathematical modelling [version 1; peer review: 2 approved]. Gates Open Res 2019, 3:1538.
- World Health Organization: NTD Roadmap 2021–2030. World Health Organization 2019:1-25.
- Biritwum NK, de Souza DK, Marfo B, Odoom S, Alomatu B, Asiedu O, Yeboah A, Hervie TE, Mensah EO, Yikpotey P et al: Fifteen years of programme implementation for the elimination of Lymphatic Filariasis in Ghana: Impact of MDA on immunoparasitological indicators. PLoS Negl Trop Dis 2017, 11(3):e0005280.
- General Report Volume 3A: Population of Regions and District.
- Mofa: Mpohor. In.; 2018: Web page-Web page.
- Mofa: Ahanta West. In.; 2018: Web page-Web page.
- Ghana Statistical S: 2010 Population & Housing Census: Regional Analytical Report - Upper East Region. In.; 2013: 1-196.
- Ghana Statistical S: 2010 Population & Housing Census: District Analytical Report - Mpohor District. In.; 2014: 1-68.
- Mofa: Kassena Nankana: Physical and Natural Environment. In.; 2018: Web pages-Web pages.
- Mofa: Bongo. In.; 2018: Web page-Web page.
- WHO/Department of control of neglected tropical diseases: Lymphatic filariasis: monitoring and epidemiological assessment of mass drug administration - A manual for national elimination programmes. In: LYMPHATIC FILARIASIS. Edited by Ichimori K. WHO Press, World Health Organization, 20 Avenue Appia, 1211 Geneva 27, Switzerland: WHO; 2011: xviii, 79 p.
- Chesnais CB, Vlaminck J, Kunyu-Shako B, Pion SD, Awaca-Uvon NP, Weil GJ, Mumba D, Boussinesq M: Measurement of Circulating Filarial Antigen Levels in Human Blood with a Point-of-Care Test Strip and a Portable Spectrodensitometer. Am J Trop Med Hyg 2016, 94(6):1324-1329.
- Chesnais CB, Missamou F, Pion SD, Bopda J, Louya F, Majewski AC, Weil GJ, Boussinesq M: Semi-quantitative scoring of an immunochromatographic test for circulating filarial antigen. Am J Trop Med Hyg 2013, 89(5):916-918.
- de Souza DK, Otchere J, Ahorlu CS, Adu-Amankwah S, Larbi IA, Dumashie E, McCarthy FA, King SA, Otoo S, Osabutey D et al: Low Microfilaremia Levels in Three Districts in Coastal Ghana with at Least 16 Years of Mass Drug Administration and Persistent Transmission of Lymphatic Filariasis. Trop Med Infect Dis 2018, 3:105.
- Dickerson JW, Eberhard ML, J. LP: A technique for microfilarial detection in preserved blood using nuclepore filters. J Parasitol 1990, 76(6):829-833 PMID: 2123924.
- Derua YA, Rumisha SF, Batengana BM, Max DA, Stanley G, Kisinza WN, Mboera LEG: Lymphatic filariasis transmission on Mafia Islands, Tanzania: Evidence from xenomonitoring in mosquito vectors. PLoS Negl Trop Dis 2017, 11(10):e0005938.
- Rao RU, Atkinson LJ, Ramzy RMR, Helmy H, Farid HA, Bockarie MJ, Susapu M, Laney SJ, Williams SA, Weil GJ: A real-time PCR-based assay for detection of Wuchereria bancrofti DNA in blood and mosquitoes. Am J Trop Med Hyg 2006, 74(5)::826–832.
- Zhong M, McCarthy J, Bierwert L, Lizotte-Waniewski M, Chanteau S, Nutman TB, Ottesen EA, Williams SA: A Polymerase Chain Reaction Assay for Detection of the Parasite Wuchereria bancrofti in Human Blood Samples. 1996, 54(4):357–363.
- Opoku M, Minetti C, Kartey-Attipoe WD, Otoo S, Otchere J, Gomes B, de Souza DK, Reimer LJ: An assessment of mosquito collection techniques for xenomonitoring of anopheline-transmitted Lymphatic Filariasis in Ghana. Parasitology 2018, 145:1783–1791.
- Aboagye-Antwi F, Kwansa-Bentum B, Dadzie SK, Ahorlu CK, Appawu MA, Gyapong J, Wilson MD, Boakye DA: Transmission indices and microfilariae prevalence in human population prior to mass drug administration with ivermectin and albendazole in the Gomoa District of Ghana. Parasit Vectors 2015, 8:562.
- Amuzu H, Wilson MD, Boakye DA: Studies of Anopheles gambiae s.l (Diptera: Culicidae) exhibiting different vectorial capacities in lymphatic filariasis transmission in the Gomoa district, Ghana. Parasites & Vectors 2010, 3:85.
- Appawu MA, Dadzie SK, Baffoe-Wilmot A, Wilson MD: Lymphatic filariasis in Ghana: entomological investigation of transmission dynamics and intensity in communities served by irrigation systems in the Upper East Region of Ghana. Tropical Medicine and International Health 2001, 6(7):511-516.
- Boakye DA, Baidoo HA, Glah E, Brown C, Appawu M, Wilson MD: Monitoring lymphatic filariasis interventions: Adult mosquito sampling, and improved PCR - based pool screening method for Wuchereria bancrofti infection in Anopheles mosquitoes. Filaria J 2007, 6:13.
- Boakye DA, Wilson MD, Appawu MA, Gyapong J: Vector competence, for Wuchereria bancrofti, of the Anopheles populations in the Bongo district of Ghana. Ann Trop Med Parasitol 2004, 98(5):501-508.
- Ughasi J, Bekard HE, Coulibaly M, Adabie-Gomez D, Gyapong J, Appawu M, Wilson MD, Boakye DA: Mansonia africana and Mansonia uniformis are Vectors in the transmission of Wuchereria bancrofti lymphatic filariasis in Ghana. Parasites & Vectors 2012, 5:89.
- Ughasi JC, Berkard H, Gomez D, Appawu M, Wilson MD, Boakye DA: Mansonia species are potential vectors of lymphatic filariasis in Ghana. American Journal Of Tropical Medicine And Hygiene 2010, 83(5):302-302.
- Pi-Bansa S, Osei JHN, Joannides J, Woode ME, Agyemang D, Elhassan E, Dadzie SK, Appawu MA, Wilson MD, Koudou BG et al: Implementing a community vector collection strategy using xenomonitoring for the endgame of lymphatic filariasis elimination. Parasit Vectors 2018, 11:672.
- Kyelem D, Biswas G, Bockarie MJ, Bradley MH, El Setouhy M, Fischer PU, Henderson RH, Kazura JW, Lammie PJ, Njenga SM et al: Determinants of Success in National Programs to Eliminate Lymphatic Filariasis: A Perspective Identifying Essential Elements and Research Needs. Am J Trop Med Hyg 2008, 79(4):480–484.
- World Health Organization: Integrating neglected tropical diseases into global health and development: fourth WHO report on neglected tropical diseases. In. Edited by IGO LCB-N-S. Geneva; 2017.
- World Health O: Global Programme to Eliminate Lymphatic Filariasis: Progress Report 2000-2009 and Strategic Plan 2010-2020. World Health Organization 2010:1-93.
- Biritwum NK, Yikpotey P, Marfo BK, Odoom S, Mensah EO, Asiedu O, Alomatu B, Hervie ET, Yeboah A, Ade S et al: Persistent 'hotspots' of lymphatic filariasis microfilaraemia despite 14 years of mass drug administration in Ghana. Trans R Soc Trop Med Hyg 2016, 110:690-695.
- Osei-Atweneboana MY, Awadzi K, Attah SK, Boakye DA, Gyapong JO, Prichard RK: Phenotypic evidence of emerging ivermectin resistance in Onchocerca volvulus. PLoS Negl Trop Dis 2011, 5(3)::e998.
- Mehta PK, Maharjan M: Assessment of microfilaremia in 'hotspots' of four lymphatic filariasis endemic districts of Nepal during post-MDA surveillance. PLoS Negl Trop Dis 2024, 18(1):e0011932.
Figure 1.
Map of study area showing the control and hotspot districts. The base layer for this map was accessed from the “Humanitarian Data Exchange (HDX)” website [https://data.humdata.org/dataset/dc4c17cf-59d9-478c-b2b7-acd889241194/resource/4443ddba-eeaf-4367-9457-7820ea482f7f/download/gha_admbnda_gss_20210308_shp.zip]. The software for drawing this map is QGIS 3.40 [https://www.qgis.org/download/]. The terms of use/icense information for the base layer image or shapefile is [https://data.humdata.org/about/license/legacy_hrinfo]. Ahanta West and Mpohor.
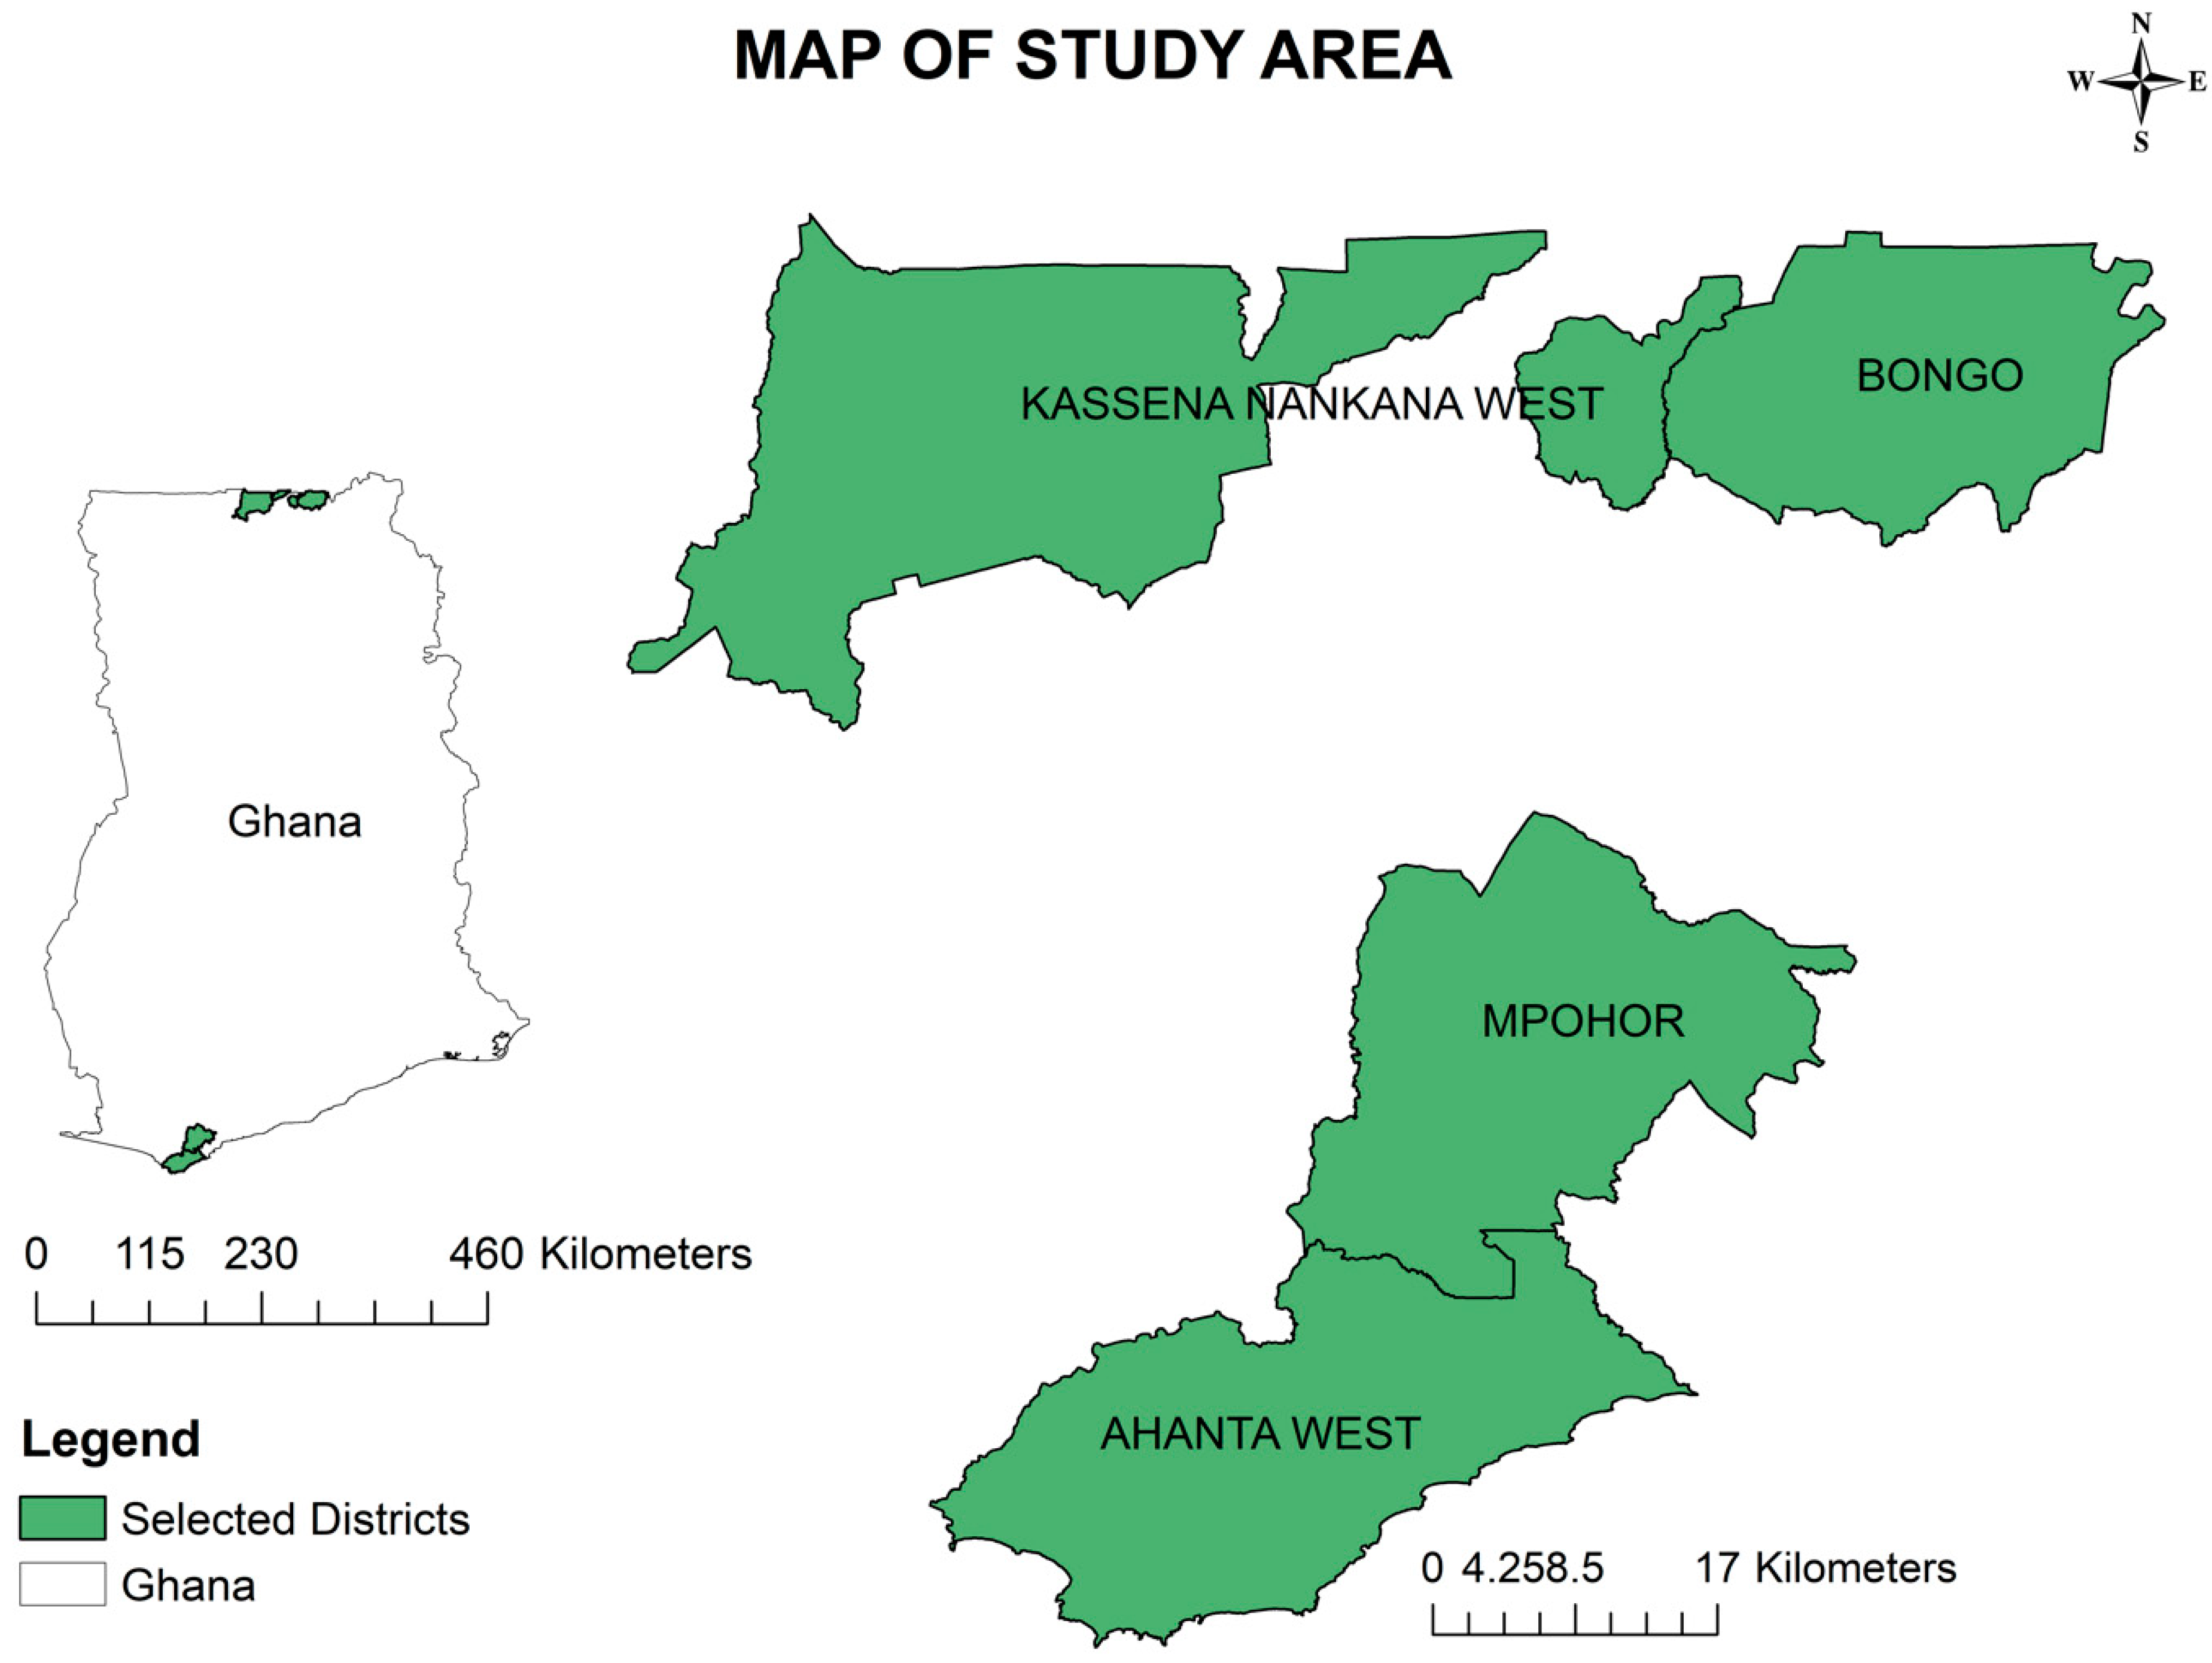
Figure 2.
Wuchereria bancrofti detection using NV1 and NV2 primers. The base layer for this map was accessed from the “Humanitarian Data Exchange (HDX)” website [https://data.humdata.org/dataset/dc4c17cf-59d9-478c-b2b7-acd889241194/resource/4443ddba-eeaf-4367-9457-7820ea482f7f/download/gha_admbnda_gss_20210308_shp.zip]. The software for drawing this map is QGIS 3.40 [https://www.qgis.org/download/]. The terms of use/license information for the base layer image or shapefile is [https://data.humdata.org/about/license/legacy_hrinfo].
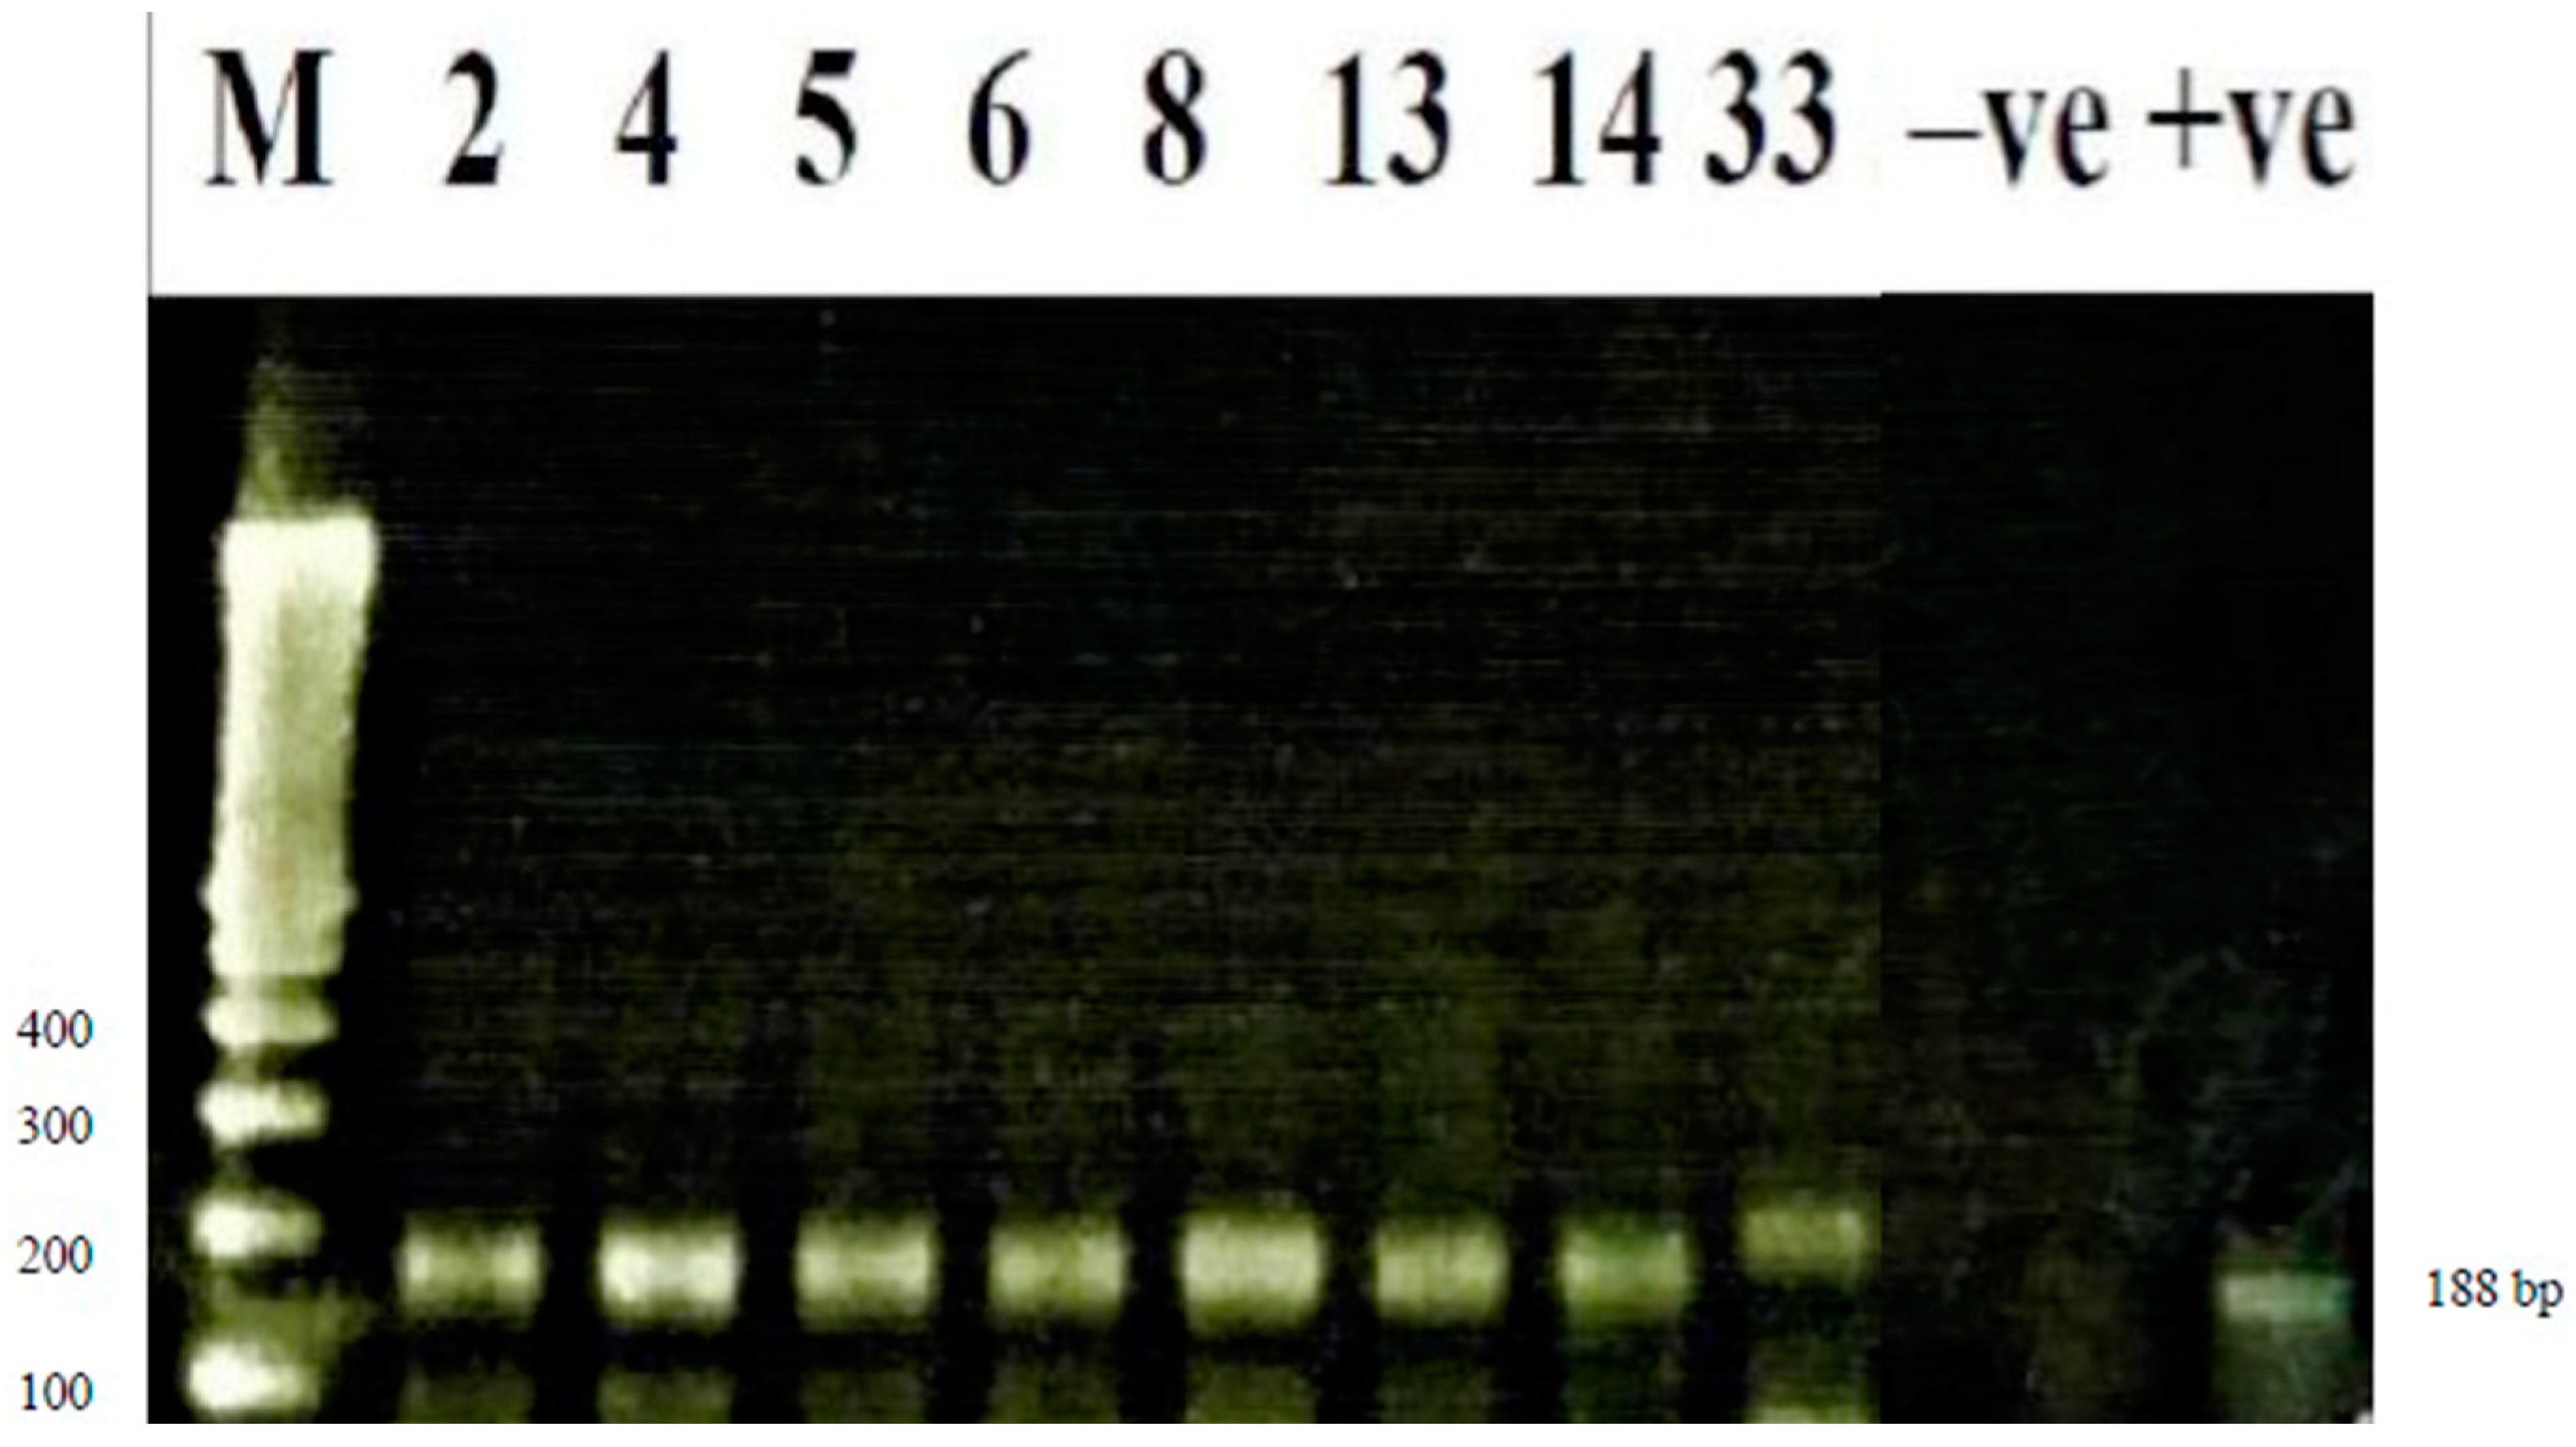
Figure 3.
Detection of Wuchereria bancrofti using real time polymerase chain reaction (RT-PCR). The base layer for this map was accessed from the “Humanitarian Data Exchange (HDX)” website [https://data.humdata.org/dataset/dc4c17cf-59d9-478c-b2b7-acd889241194/resource/4443ddba-eeaf-4367-9457-7820ea482f7f/download/gha_admbnda_gss_20210308_shp.zip]. The software for drawing this map is QGIS 3.40 [https://www.qgis.org/download/]. The terms of use/license information for the base layer image or shapefile is [https://data.humdata.org/about/license/legacy_hrinfo].
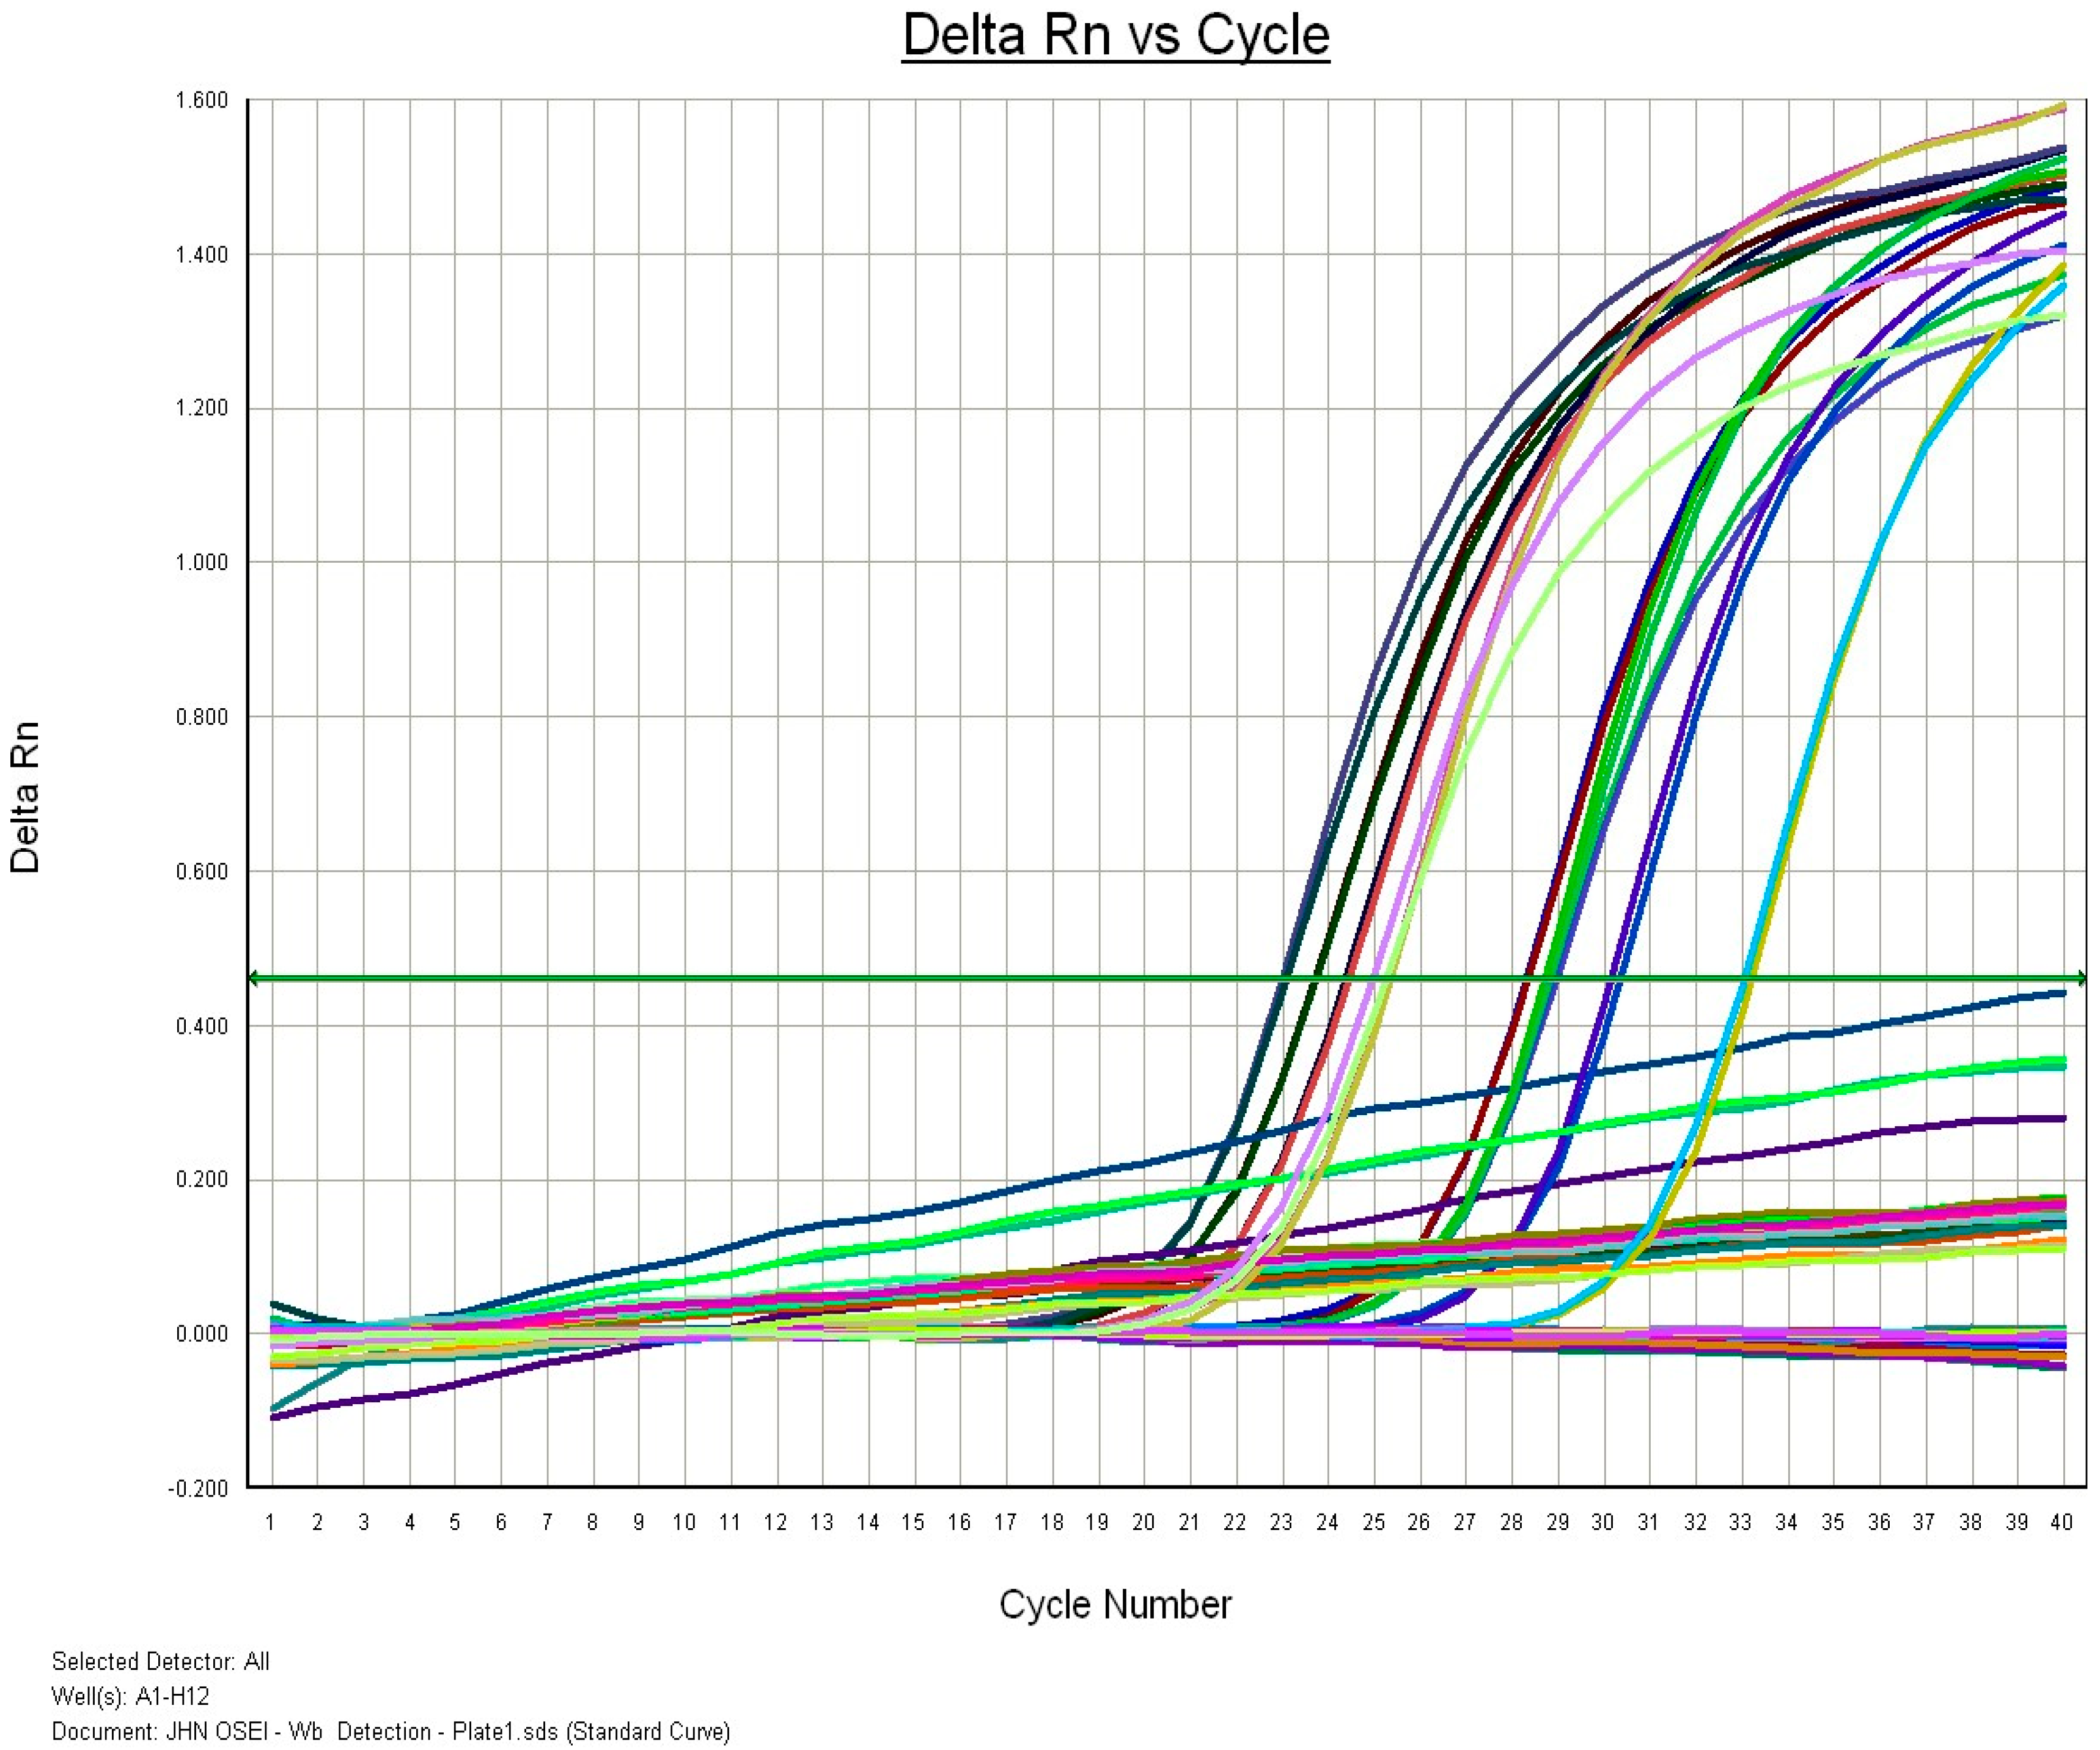
Table 1.
Sample size calculation with Epi-info software 7 (CDC, Atlanta, GA, USA) assuming 50% prevalence.
Table 1.
Sample size calculation with Epi-info software 7 (CDC, Atlanta, GA, USA) assuming 50% prevalence.
| Region | District | Community | Community Population Size | Sample Size |
|---|---|---|---|---|
| Western | HAhanta West | Antseambua | 215 | 162 |
| Asemkow | 938 | 389 | ||
| CMpohor | Ampeasem | 734 | 348 | |
| Obrayebona | 1972 | 496 | ||
| Upper East | HKassena Nankana West | Badunu | 1159 | 422 |
| Navio (Sanwu) Central | 733 | 348 | ||
| CBongo | Atampiisi Bongo | 1207 | 455 | |
| Balungu Nabiisi | 1450 | 428 |
C = control districts; H = hotspot districts.
Disclaimer/Publisher’s Note: The statements, opinions and data contained in all publications are solely those of the individual author(s) and contributor(s) and not of MDPI and/or the editor(s). MDPI and/or the editor(s) disclaim responsibility for any injury to people or property resulting from any ideas, methods, instructions or products referred to in the content. |
© 2025 by the authors. Licensee MDPI, Basel, Switzerland. This article is an open access article distributed under the terms and conditions of the Creative Commons Attribution (CC BY) license (http://creativecommons.org/licenses/by/4.0/).
Copyright: This open access article is published under a Creative Commons CC BY 4.0 license, which permit the free download, distribution, and reuse, provided that the author and preprint are cited in any reuse.


