3.1. Method Validation
As part of the compliance verification for legal requirements, the assessment of efficacy and safety of cosmetic products, as well as contributing to active cosmetovigilance through the determination of the use of prohibited substances in cosmetics, it becomes necessary to develop analytical methods that can be easily applied in post-marketing surveillance and control stages, in addition to being reliable and economical. For this reason, we proceeded to carry out assays for the determination of minoxidil using UV spectrophotometry (data not shown); however, good selectivity was not achieved to differentiate minoxidil base from its derivatives. In this regard, we proceeded to develop and validate a method that would meet the minimum quality parameters according to the ICH for the determination of the analyte of interest by HPLC-UV [
18,
19,
20].
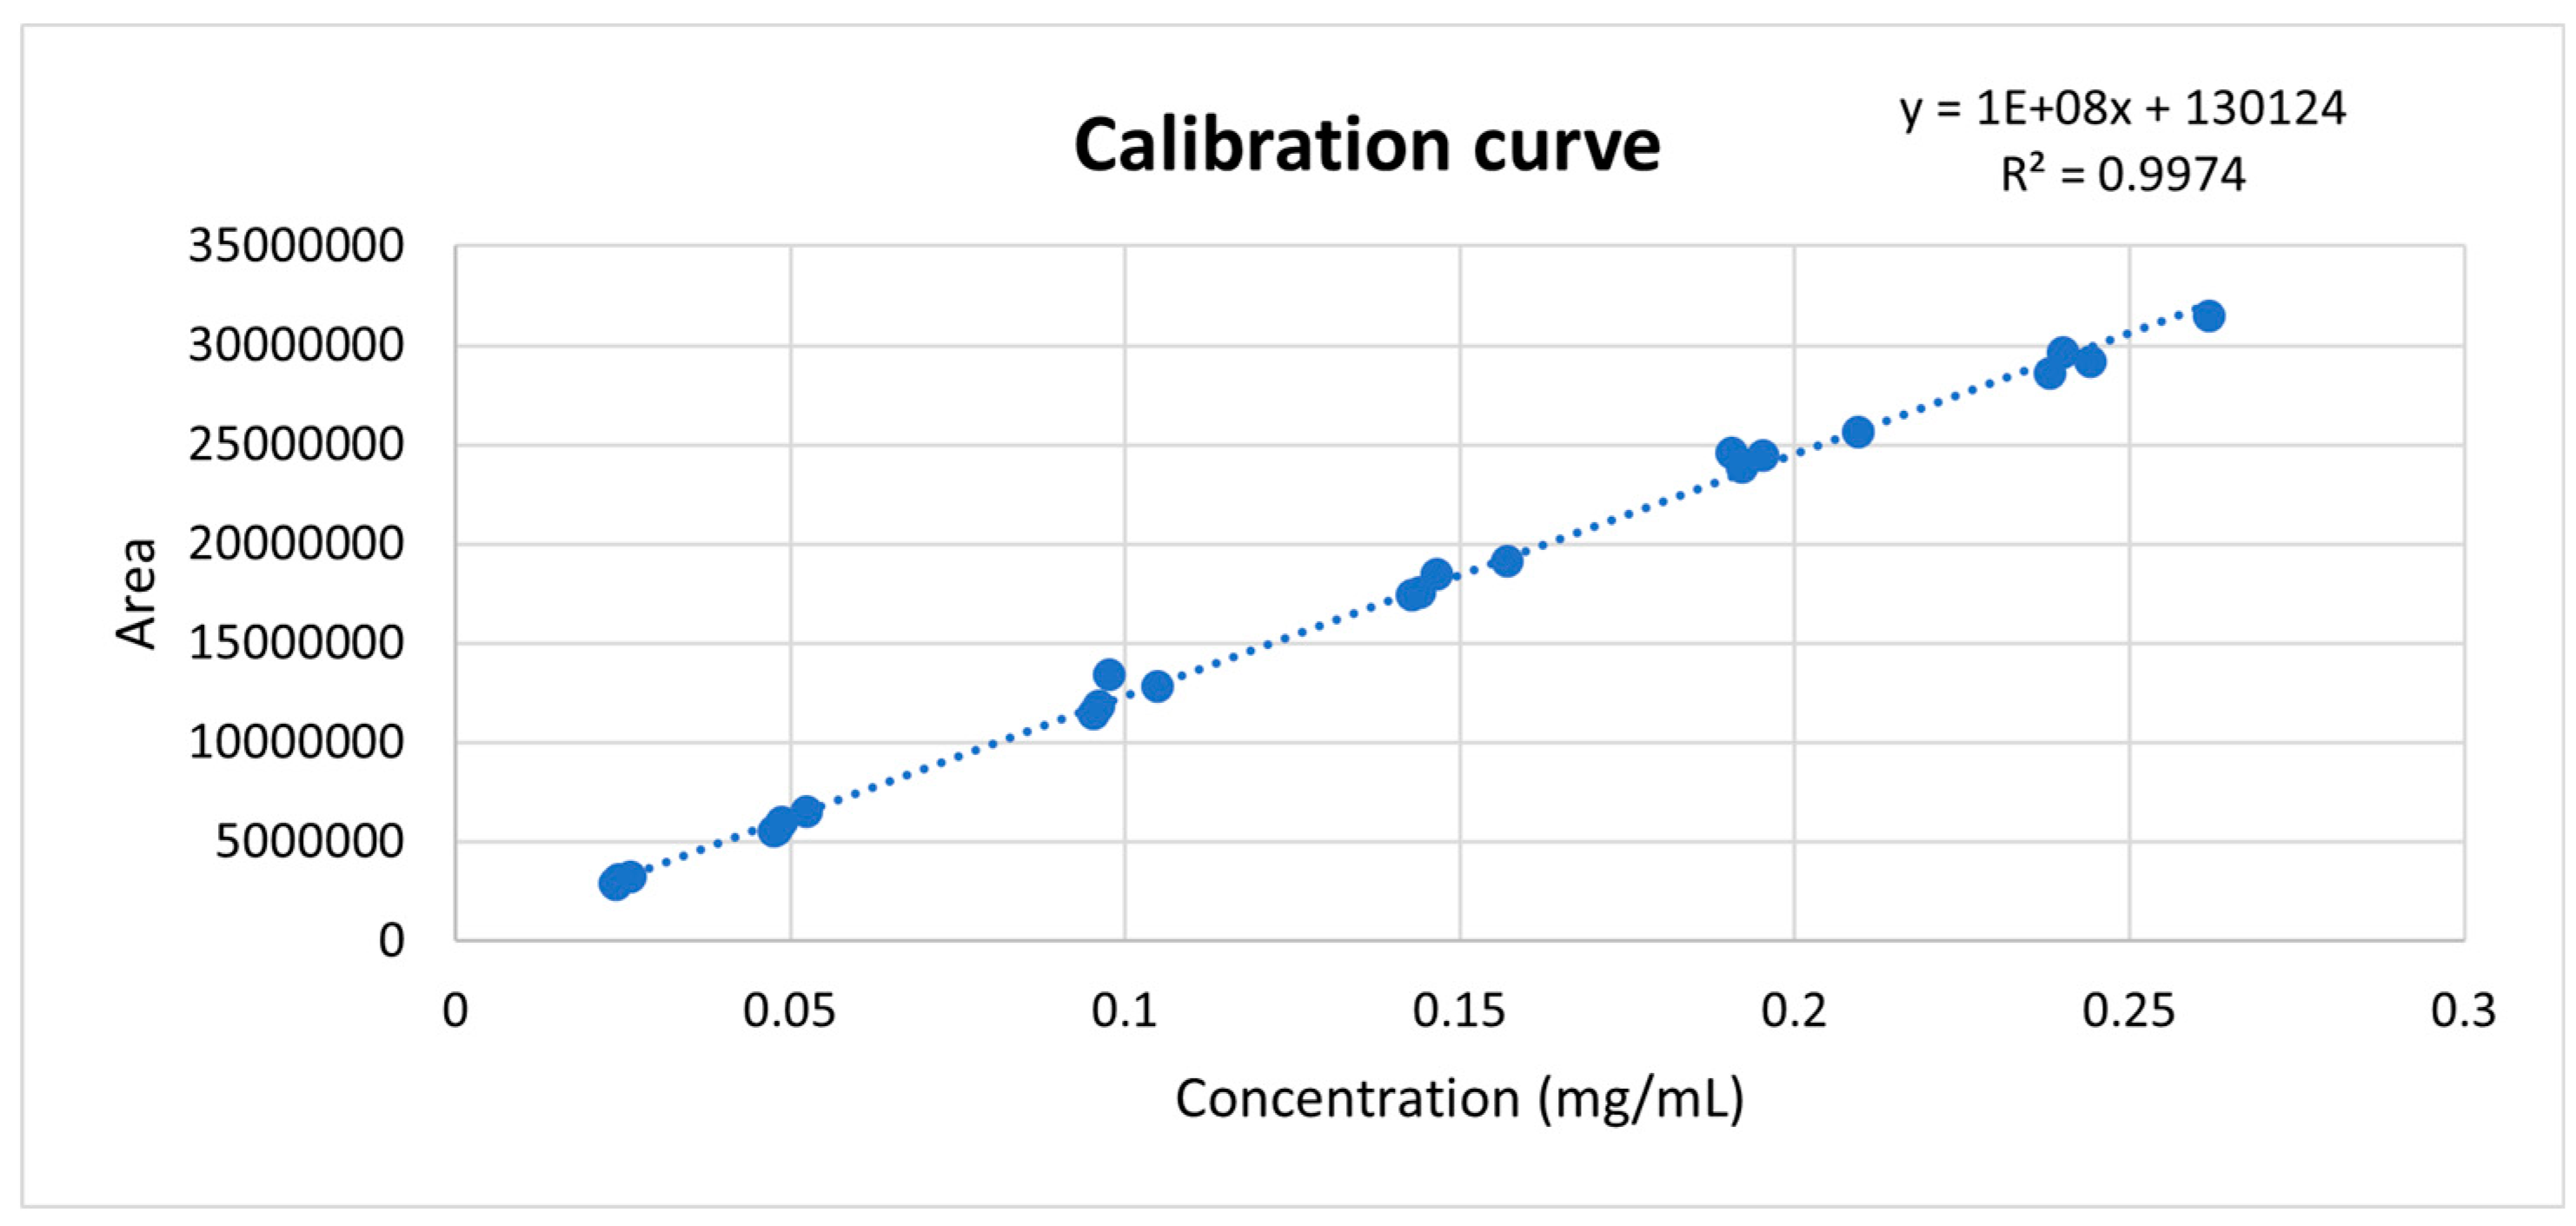
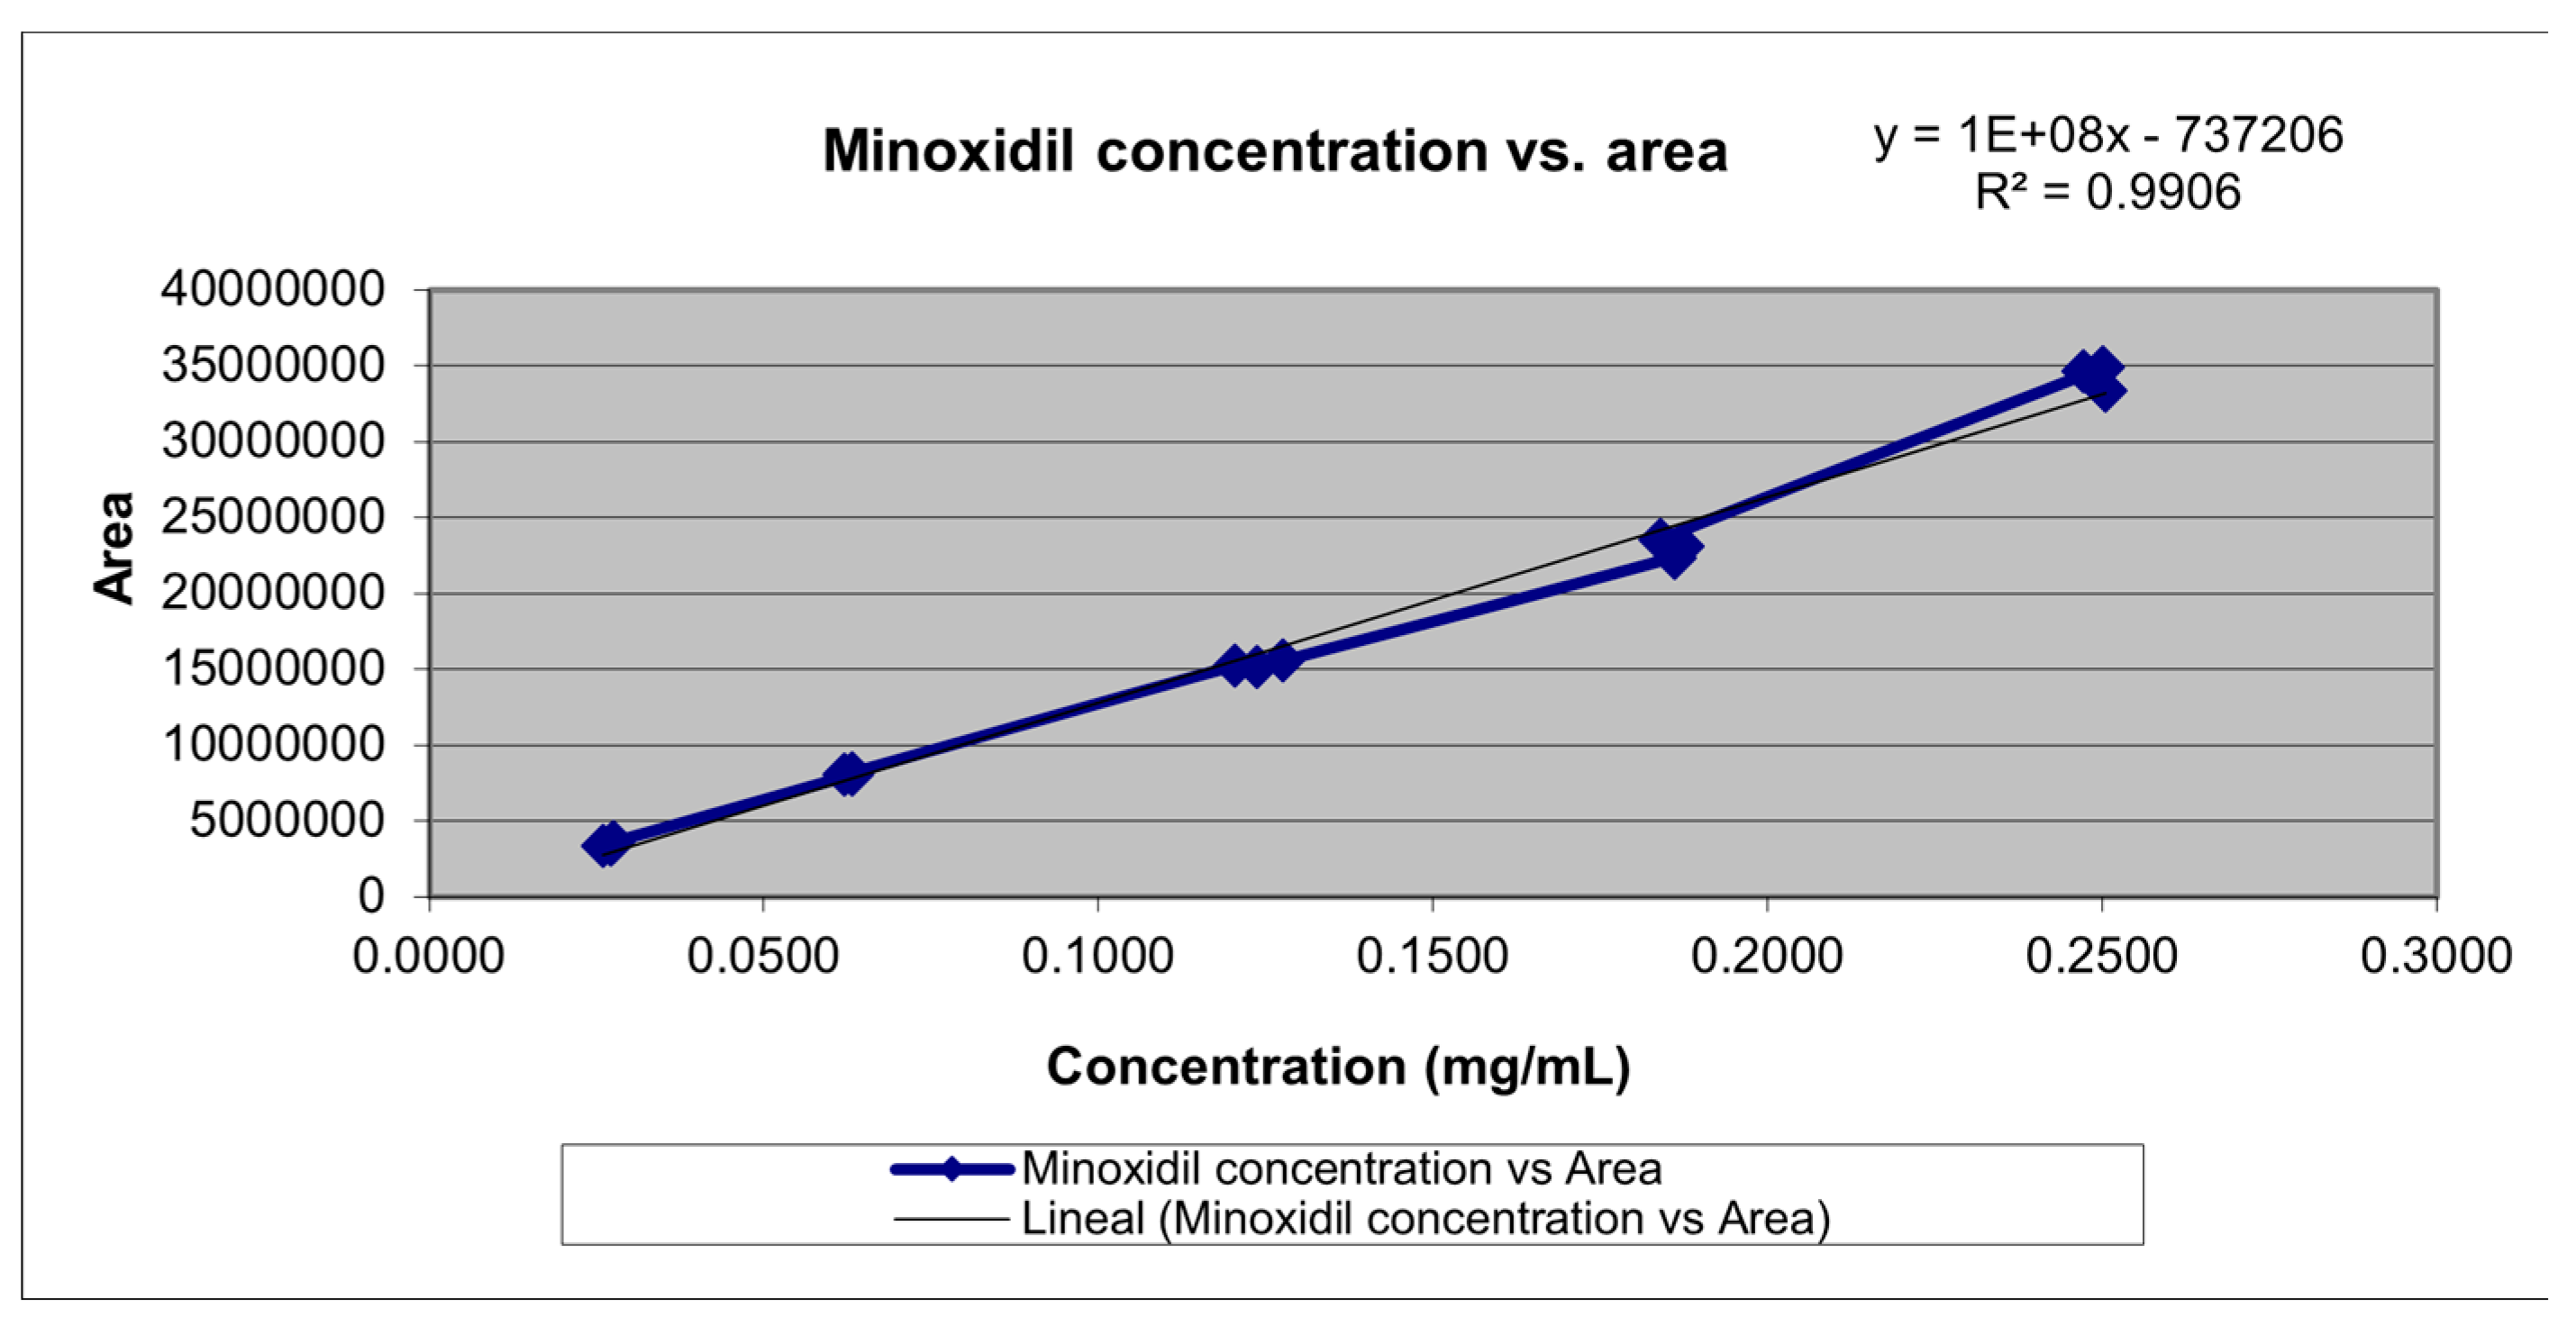
With the calibration curve (
Figure 1), the range of concentrations with linear behavior was determined. In addition to this, the slope and intercept of the straight-line equation were used to calculate the concentrations or recovery percentages of minoxidil from the obtained areas. This allowed the identification and quantification of minoxidil in the evaluated products.
3.1.1. Selectivity
The placebo formulation was prepared considering the different ingredients used in the evaluated products, aiming to create a matrix similar to hair growth cosmetic products. This was done to determine potential interferences in the quantification of the analyte.
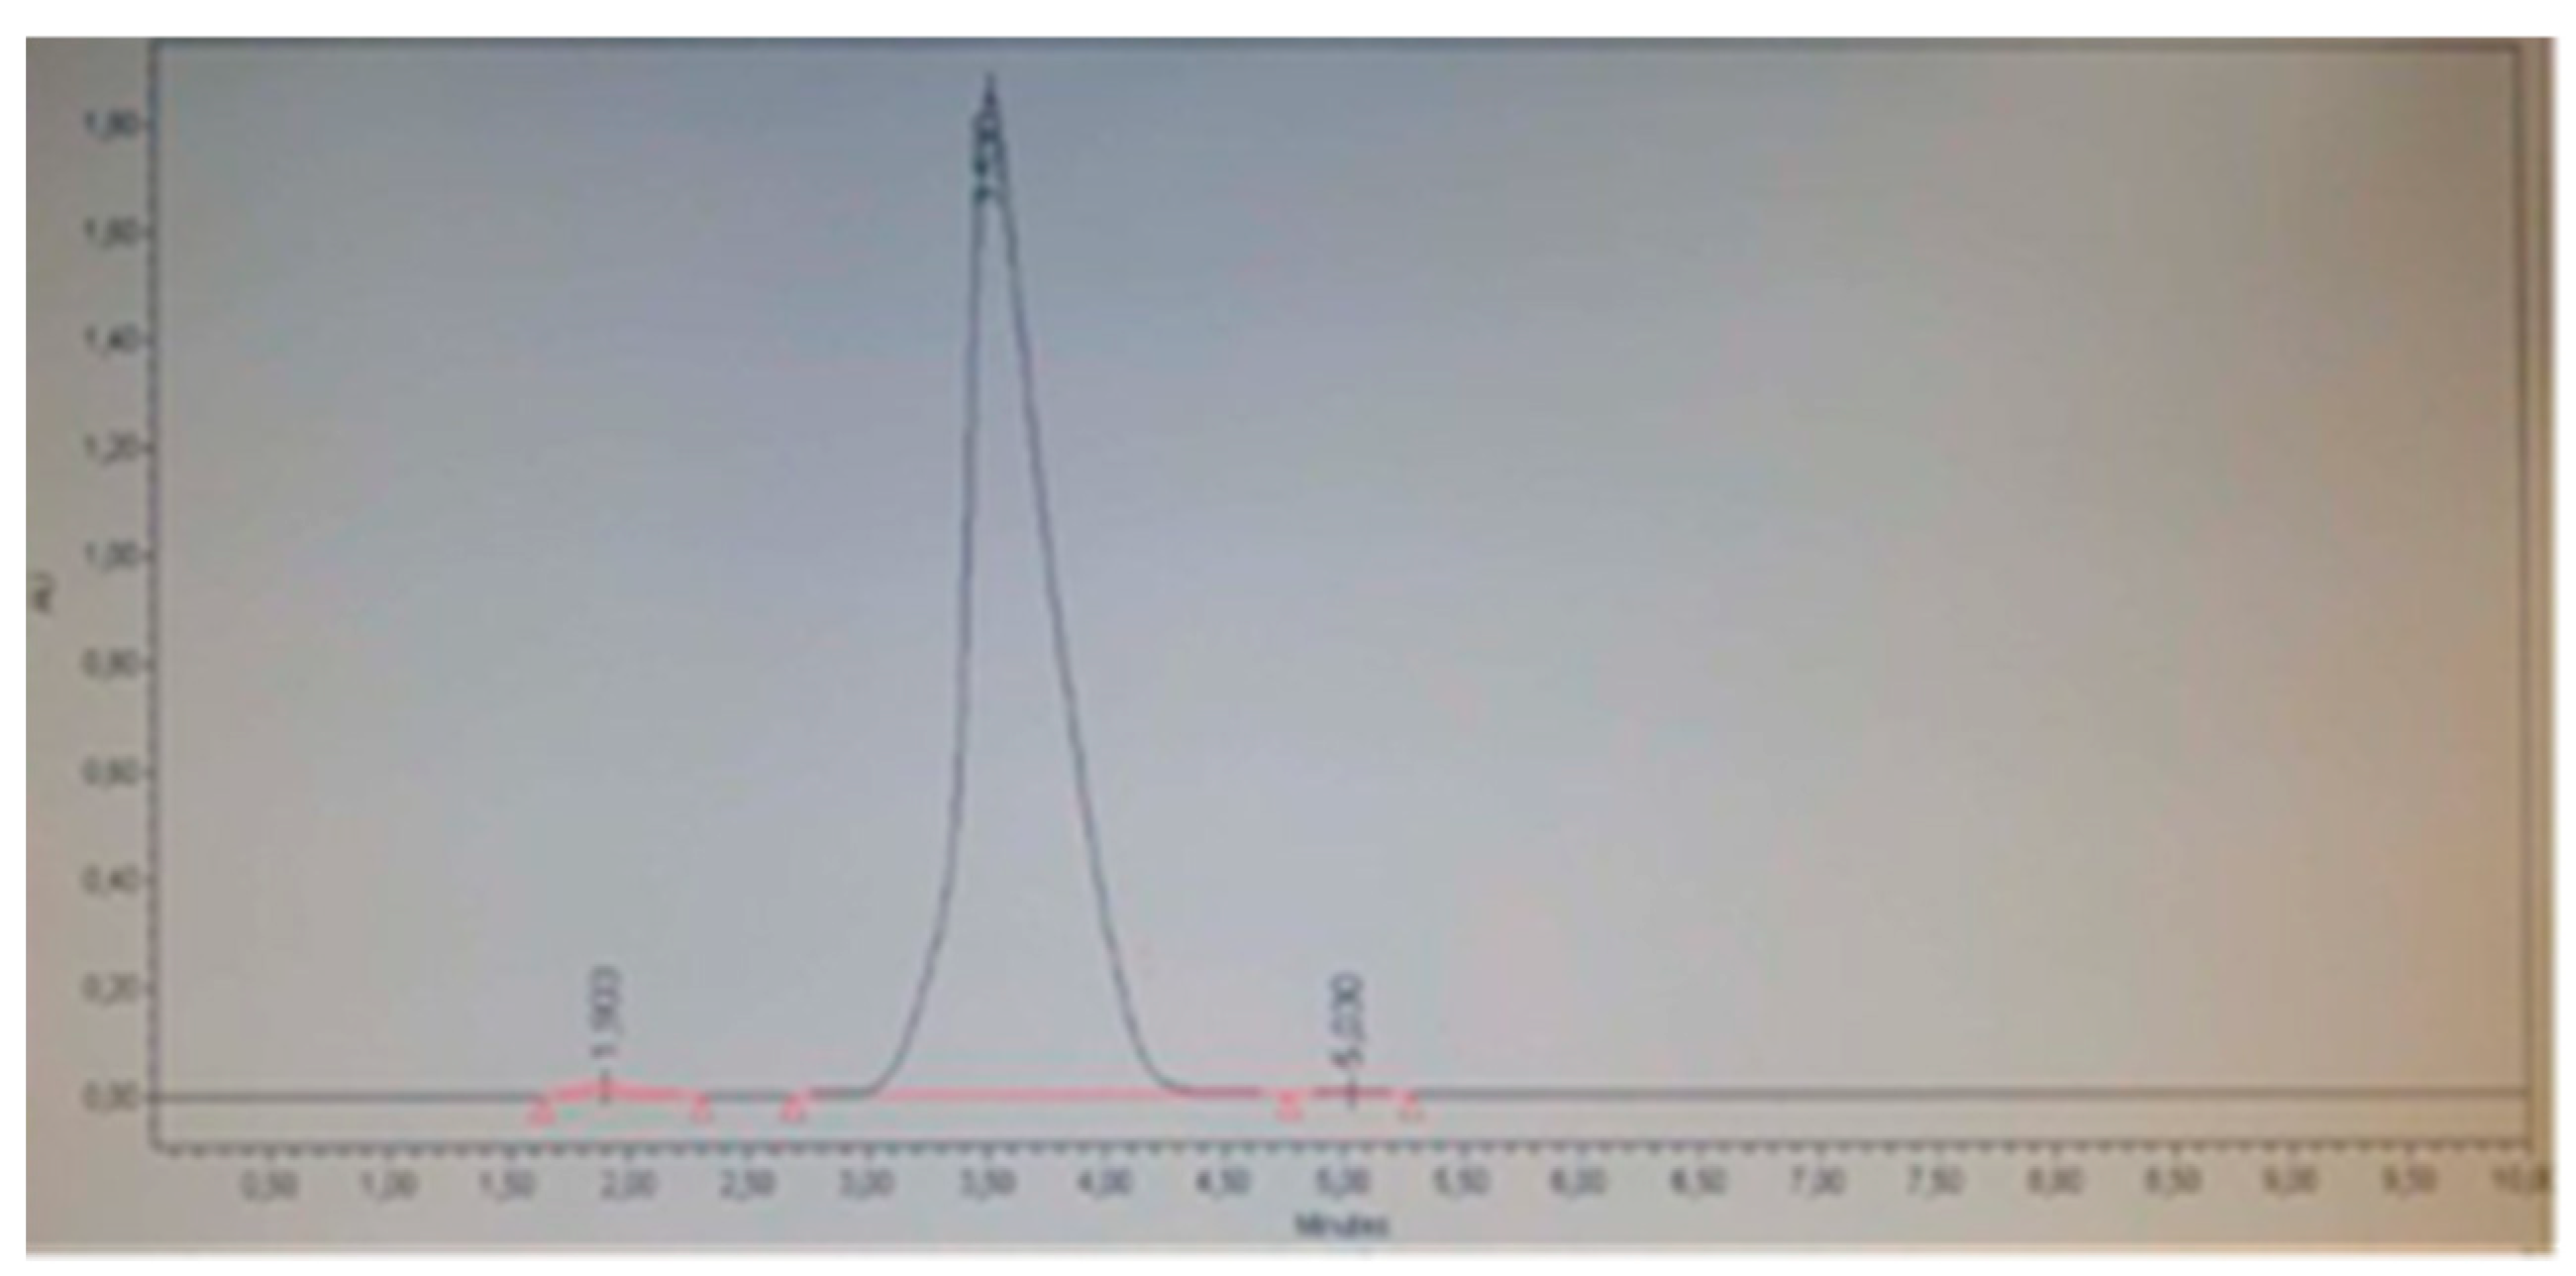
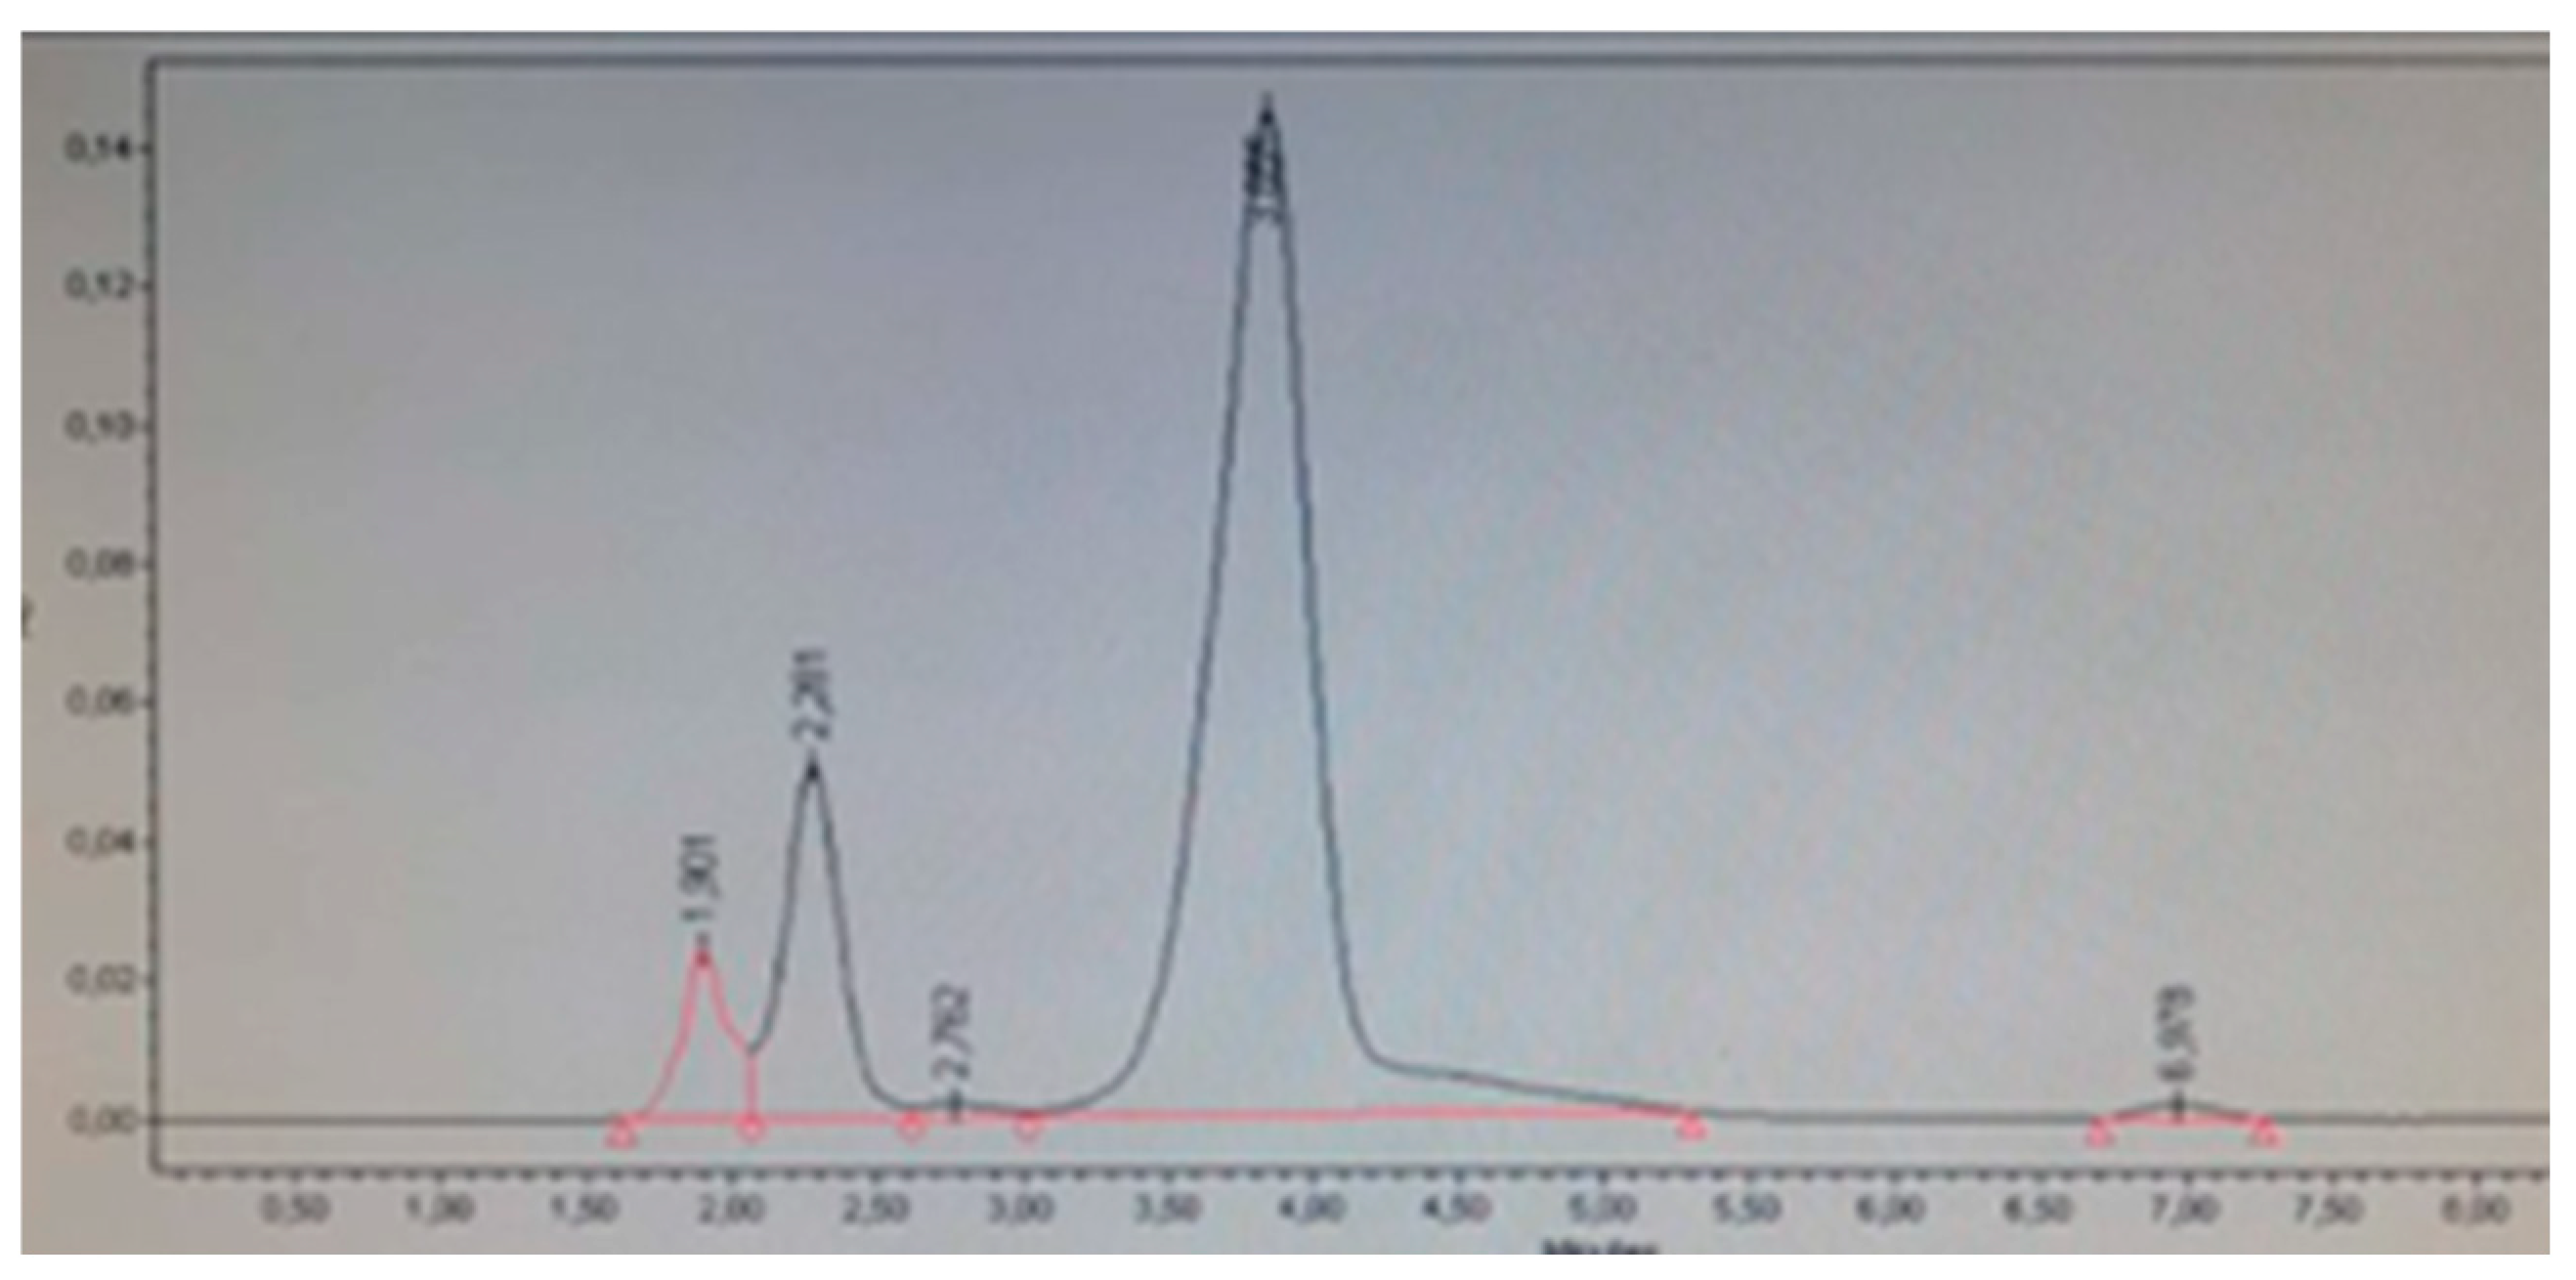
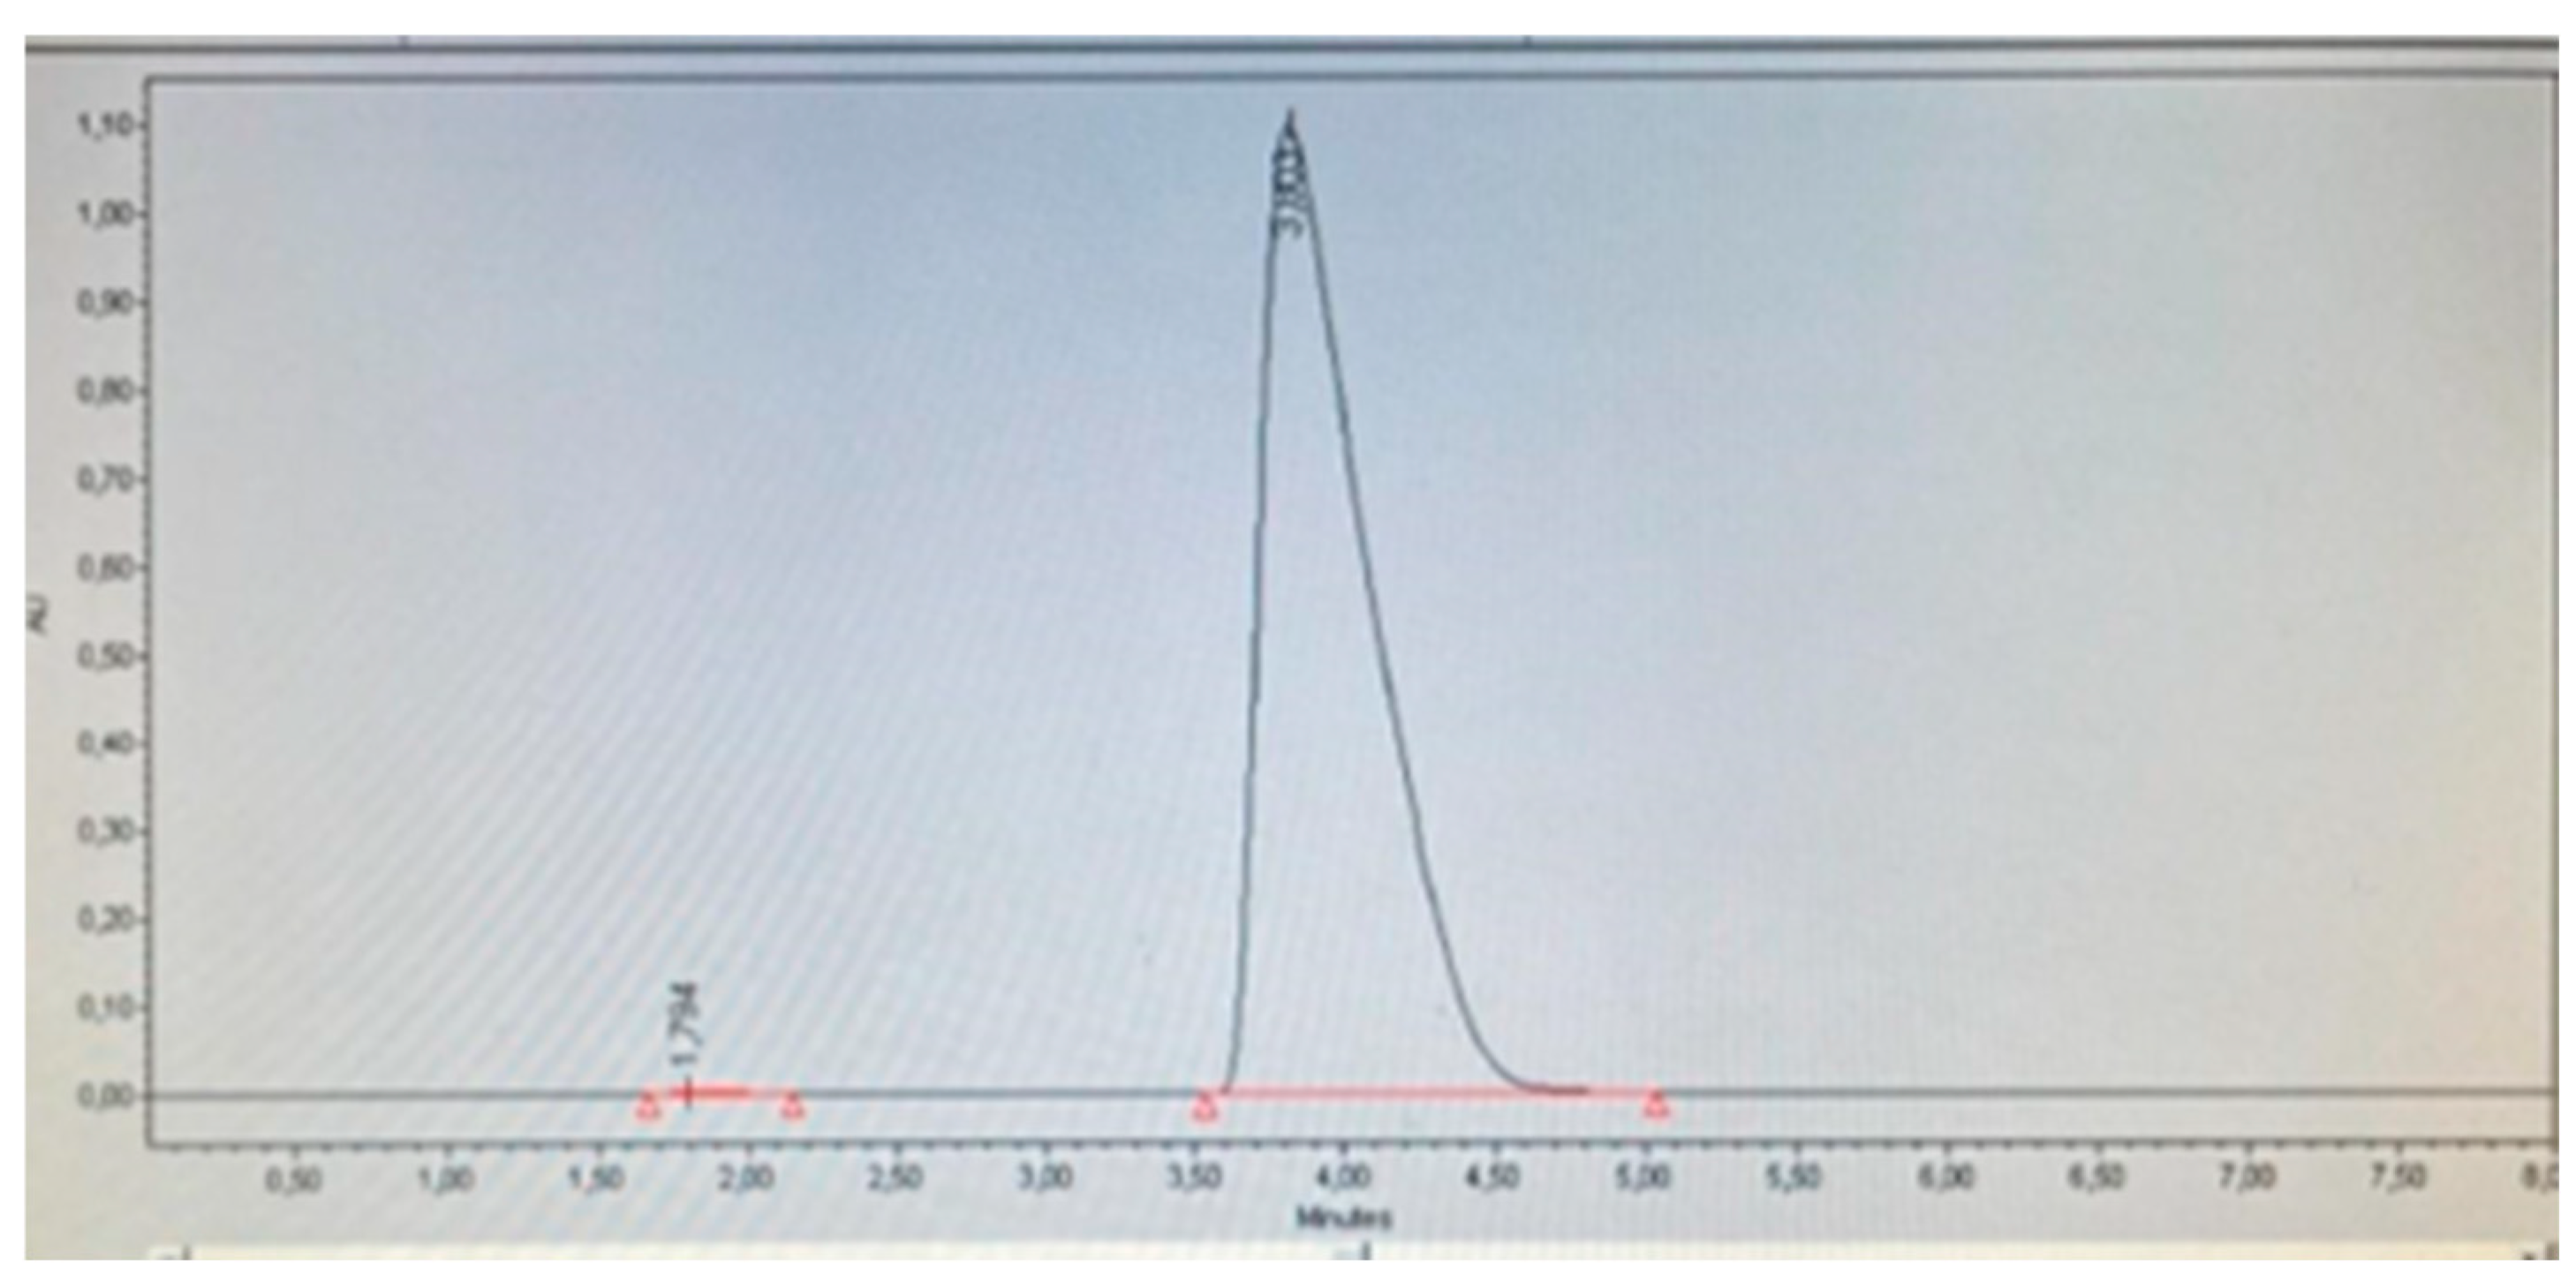
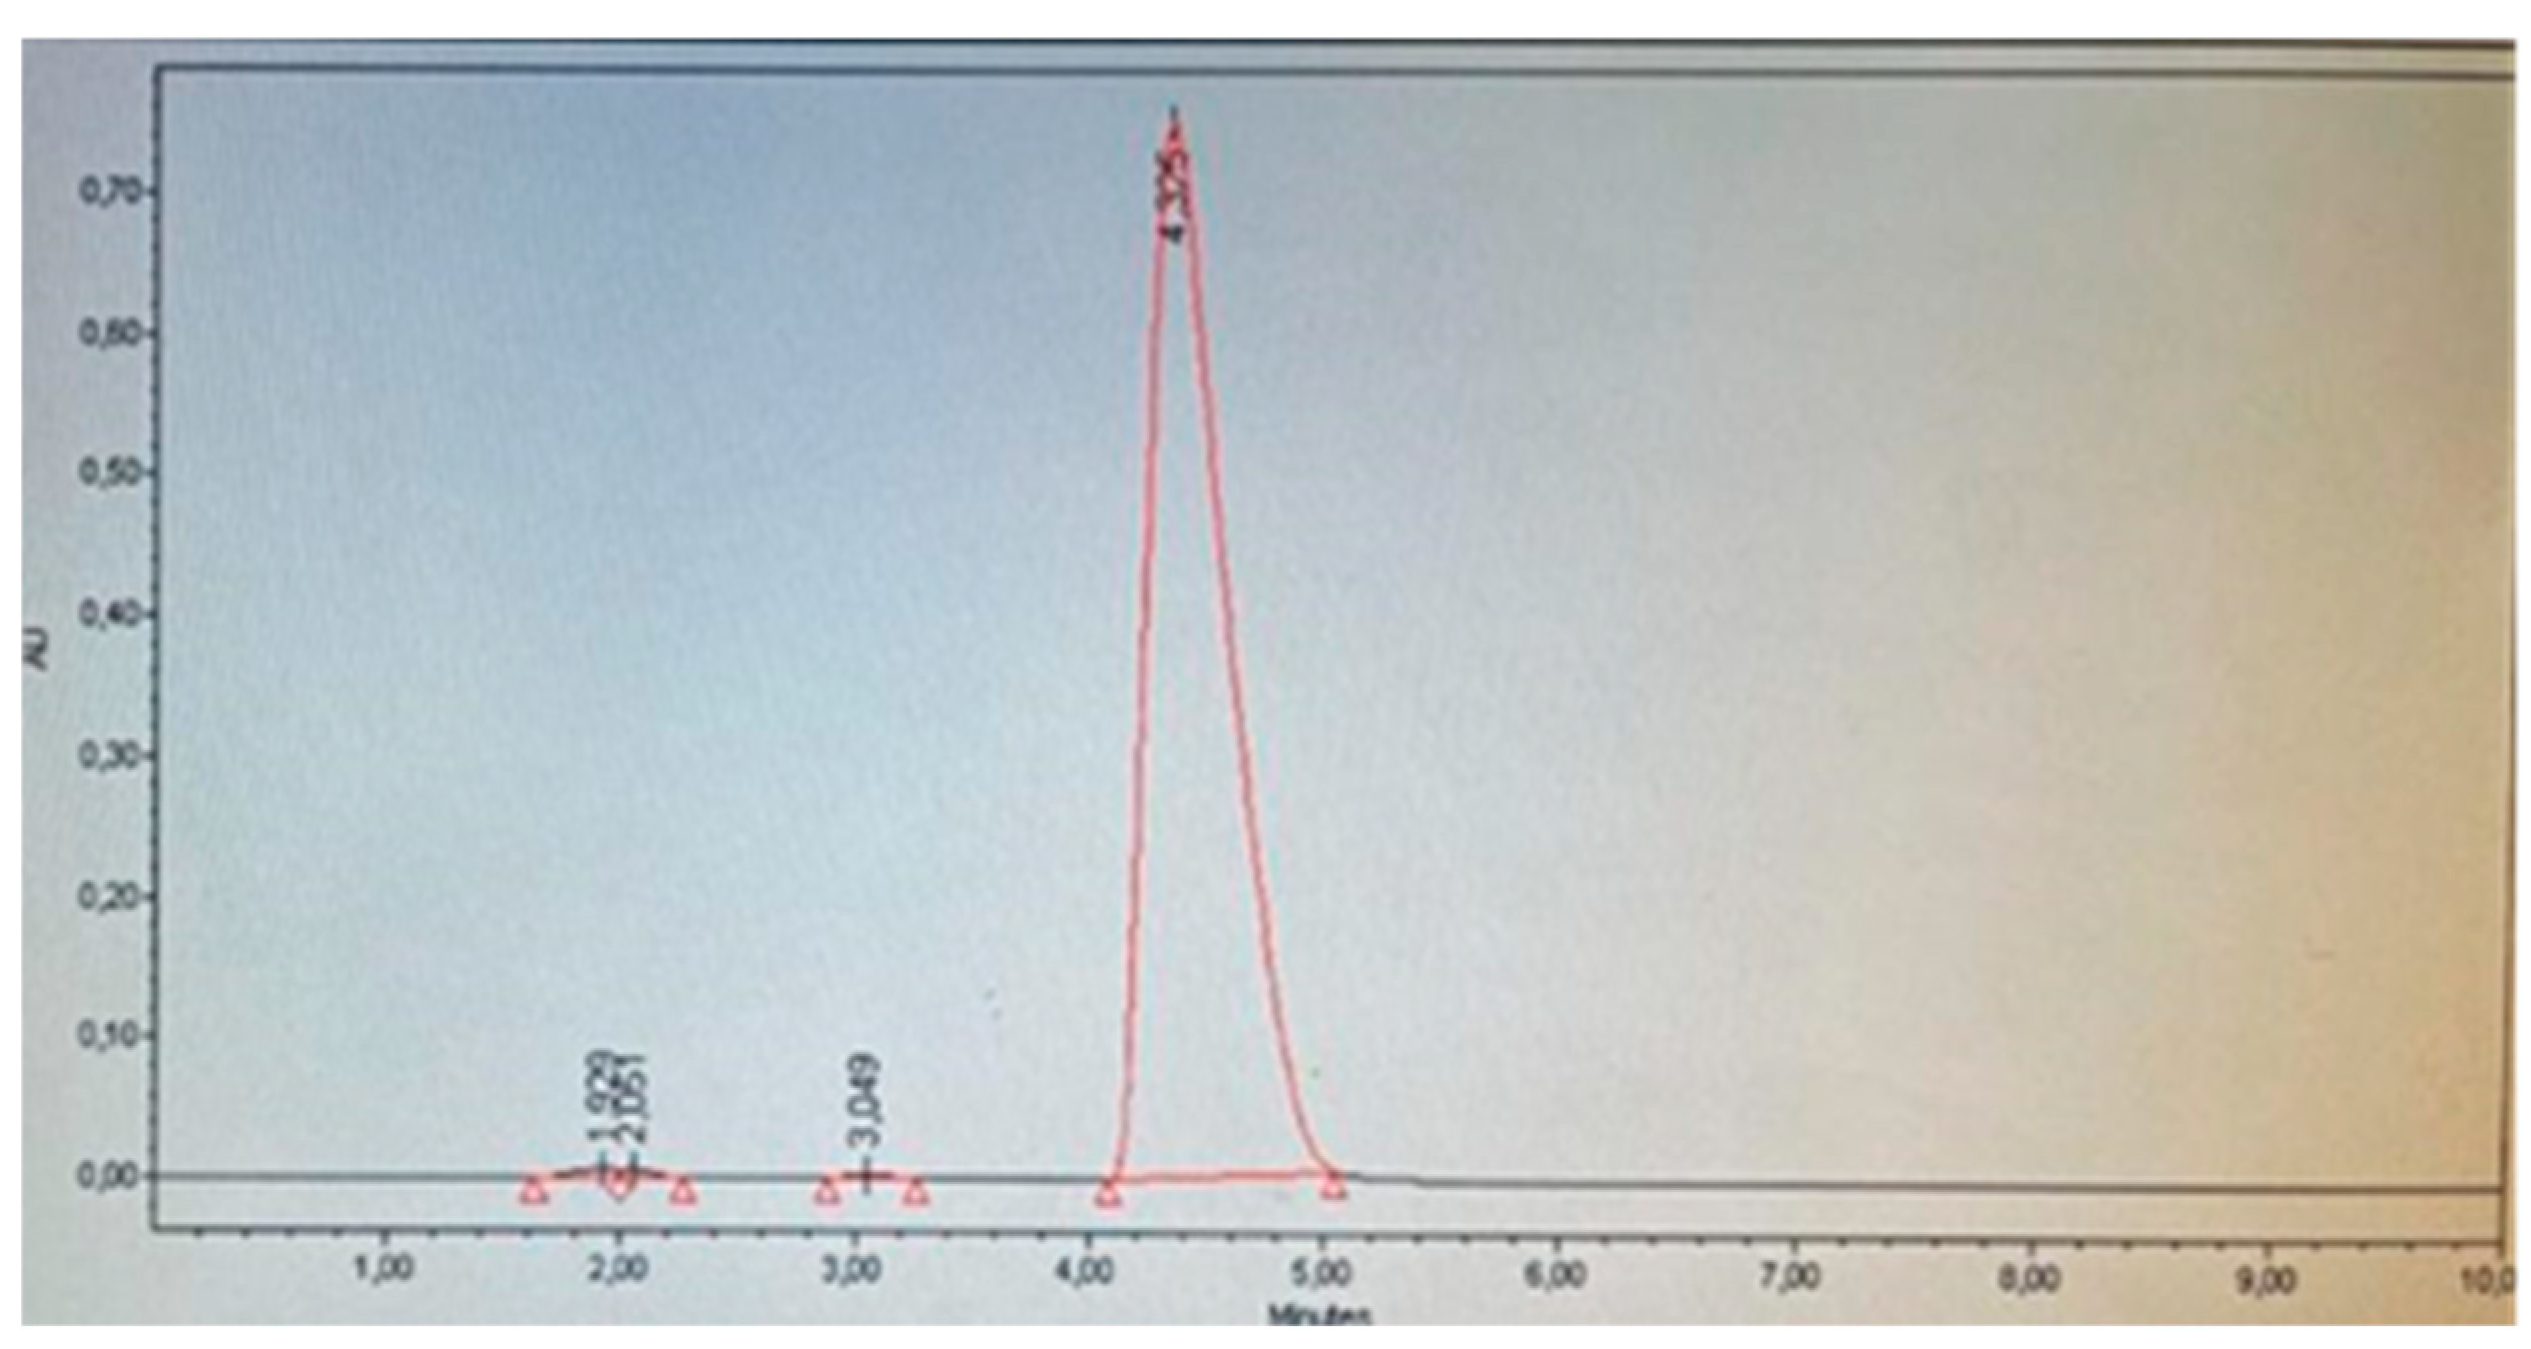
Figure 2 shows that the placebo does not interfere with the detection of the analyte of interest, as no significant peaks are observed in the retention time (tR) between 3.8-4.0 that could interfere with the detection and quantification of minoxidil, in comparison with the height and area ratio observed in the spiked placebo (
Figure 3). Therefore, it can be concluded that the placebo does not interfere with the measurements, indicating the selectivity of the method.
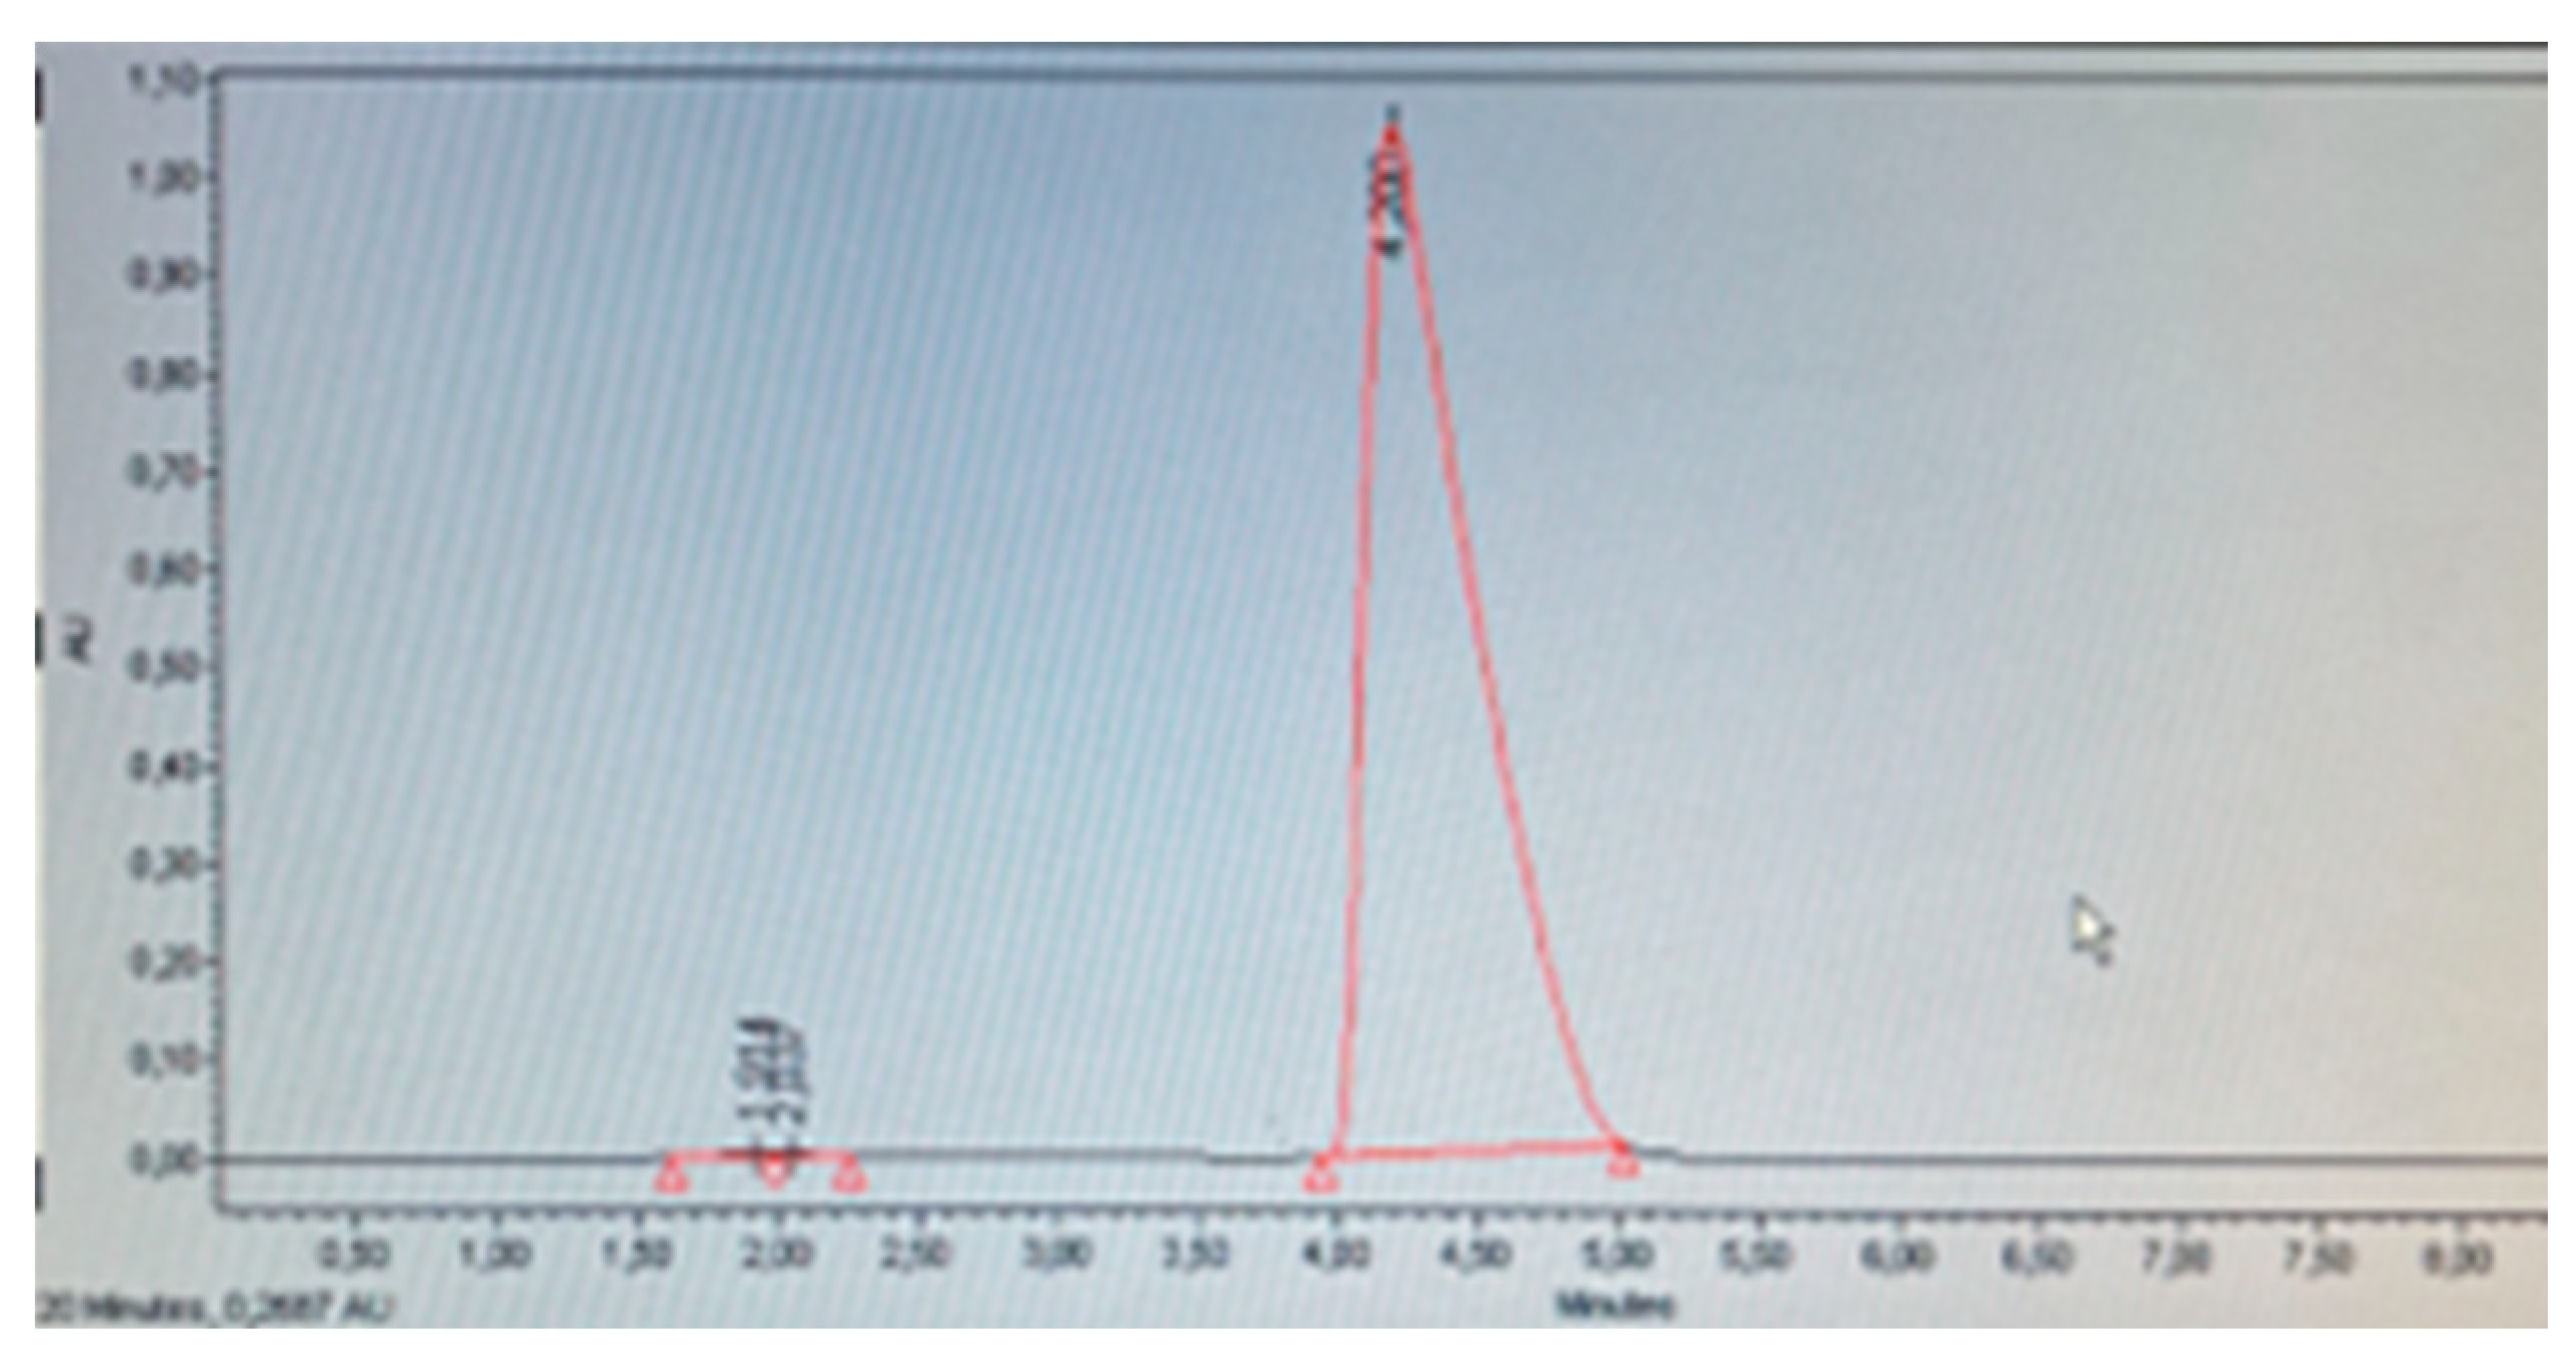
It was determined that the placebo spiked with the analyte at a concentration of 0.25 mg/mL did not present interferences in the detection and quantification of minoxidil, allowing the real recovery of the analyte (98.56 %), with a retention time (RT) for minoxidil of 3.803 according to the standard, showing that despite being within the matrix, there was no matrix effect that significantly increased or decreased the recovery of the analyte (
Figure 3). In this sense, Park HN et al. (2018) [
11] demonstrated the selectivity of their analytical method in a similar manner by comparing the matrix before and after adding the analyte of interest to identify potential interferences present in the sample. The results showed that there were no interference peaks at the target retention time (RT).
3.1.2. Linearity
Linear regression allows evaluating the fit to the proposed linear model through the correlation coefficient (R) indicated at the top of
Table 3. In this case, considering products with a matrix composed of a large number of different ingredients, the obtained R value is adequate, indicating the data's non-variability and their accommodation to the defined acceptance criteria. Using least squares, the equation of the straight-line y = 135270081.5x – 737205.57 was obtained, which proportionally relates the instrumental response 'y' (area) to the analyte concentration 'x', as observed in
Figure 4.
Another key statistical measure derived from linear regression is the coefficient of determination (R^2), which reflects the goodness of fit of a model to the variable being explained. The obtained value of R^2 demonstrates that there is a direct relationship between the analyte concentration and the instrumental response obtained. Additionally, an analysis of variance (ANOVA) was conducted to statistically demonstrate the existence of a non-zero slope and the linear relationship of the results obtained. This was confirmed, as observed in
Table 3, where the calculated F1 is greater than the tabulated F, thus rejecting the null hypothesis representing a slope equal to zero. On the other hand, the calculated F2 is less than the tabulated F, confirming the null hypothesis, which, in this case, represents the existence of a linear relationship in the data. The t-test was also employed to demonstrate that the method responds to changes in concentration, meaning that the slope is different from zero (calculated t > tabulated t for the slope) and that the confidence interval of the slope does not include zero. Additionally, it was observed that the method is proportional, as the confidence interval of the intercept includes zero and the calculated t is less than the tabulated t for the intercept. It is concluded that the method is linear within the evaluated concentration range.
3.1.3. Accuracy
To evaluate accuracy, a criterion of acceptance was established for the recovery percentage of 95-105 %.
Table 4 shows mean of the results obtained for the 5 levels evaluated, standard deviations, coefficients of variation, and variances for each of the measurements, meeting the established parameters and showing better recoveries (between 100.3 and 104.3%) than those reported in the literature. In this regard, Park HN et al. (2018) [
11] developed and validated a method for the determination of 12 hair growth compounds in adulterated products by UHPLC-MS/MS, and in the assessment of the accuracy parameter, they observed recoveries between 81-117 % for minoxidil, values that were defined as acceptable for method validation. Comparing our method with the one mentioned in the present study, it can be said that ours has greater reliability. Additionally, in the present study, the Cochran's G test was applied to evaluate the variances at the five concentration levels, concluding that the concentration factor does not influence the variability of the results; therefore, the method is accurate.
3.1.4. Precision—Repeatability
The repeatability parameter was evaluated at 50, 75, and 100 %, and a global coefficient of variation equal to or less than 3% was established as the acceptance criterion. The obtained global coefficient of variation (2.6%) for this parameter falls within the established range, as observed in
Table 5. Therefore, it is concluded that the percentages found in the repetitions of the samples analyzed did not exhibit significant variability.
3.1.5. Intermediate Precision
In the current study, intermediate precision was assessed considering two variables: the analyst and the day. The acceptance criterion for the evaluation of intermediate precision was defined as a global coefficient of variation less than or equal to twice the coefficient of variation for repeatability, that is, 5.2 %, and the coefficient of variation for each subgroup less than or equal to 3%. In
Table 6, it is observed that analysts 1 and 3 obtained a similarly low coefficient of variation between them; however, analyst 2 had higher inter-day variations. Despite this, the average global coefficient of variation is below the established acceptance criterion. Therefore, the variability that occurs when conducting the assay on different days and with different analysts is low, which does not significantly impact the results. Based on the results obtained in this parameter, it is concluded that the method is precise.
In the previously mentioned study for the validation of a method for the determination of non-permitted compounds using UHPLC-MS/MS, precision was measured considering inter-day parameters, evaluating on three different days, and intra-day parameters that were determined from repeated measurements on a single day. The results obtained show that the intra-day precision was below 4%, and for the inter-day case, it was at 11%. Both values were considered suitable to determine that the method is precise 11, however, both results are higher than those obtained in our study. Moreover, Patterson SC et al. (2005)15 found in a method they developed for determining Minoxidil, CV% values similar to those we found (Intra-day: 0.0114-0.0133 and inter-day: 0.0243-0.0329).
3.1.6. Detection and Quantification Limits
According to equation 1, a detection limit of 8.03x10⁻⁶ mg/mL (0.00803 ppm) and a quantification limit of 0.000027 mg/mL (0.027 ppm) were obtained. Therefore, the method allows for the detection and quantification of small amounts of the analyte under study.
3.1.7. Robustness
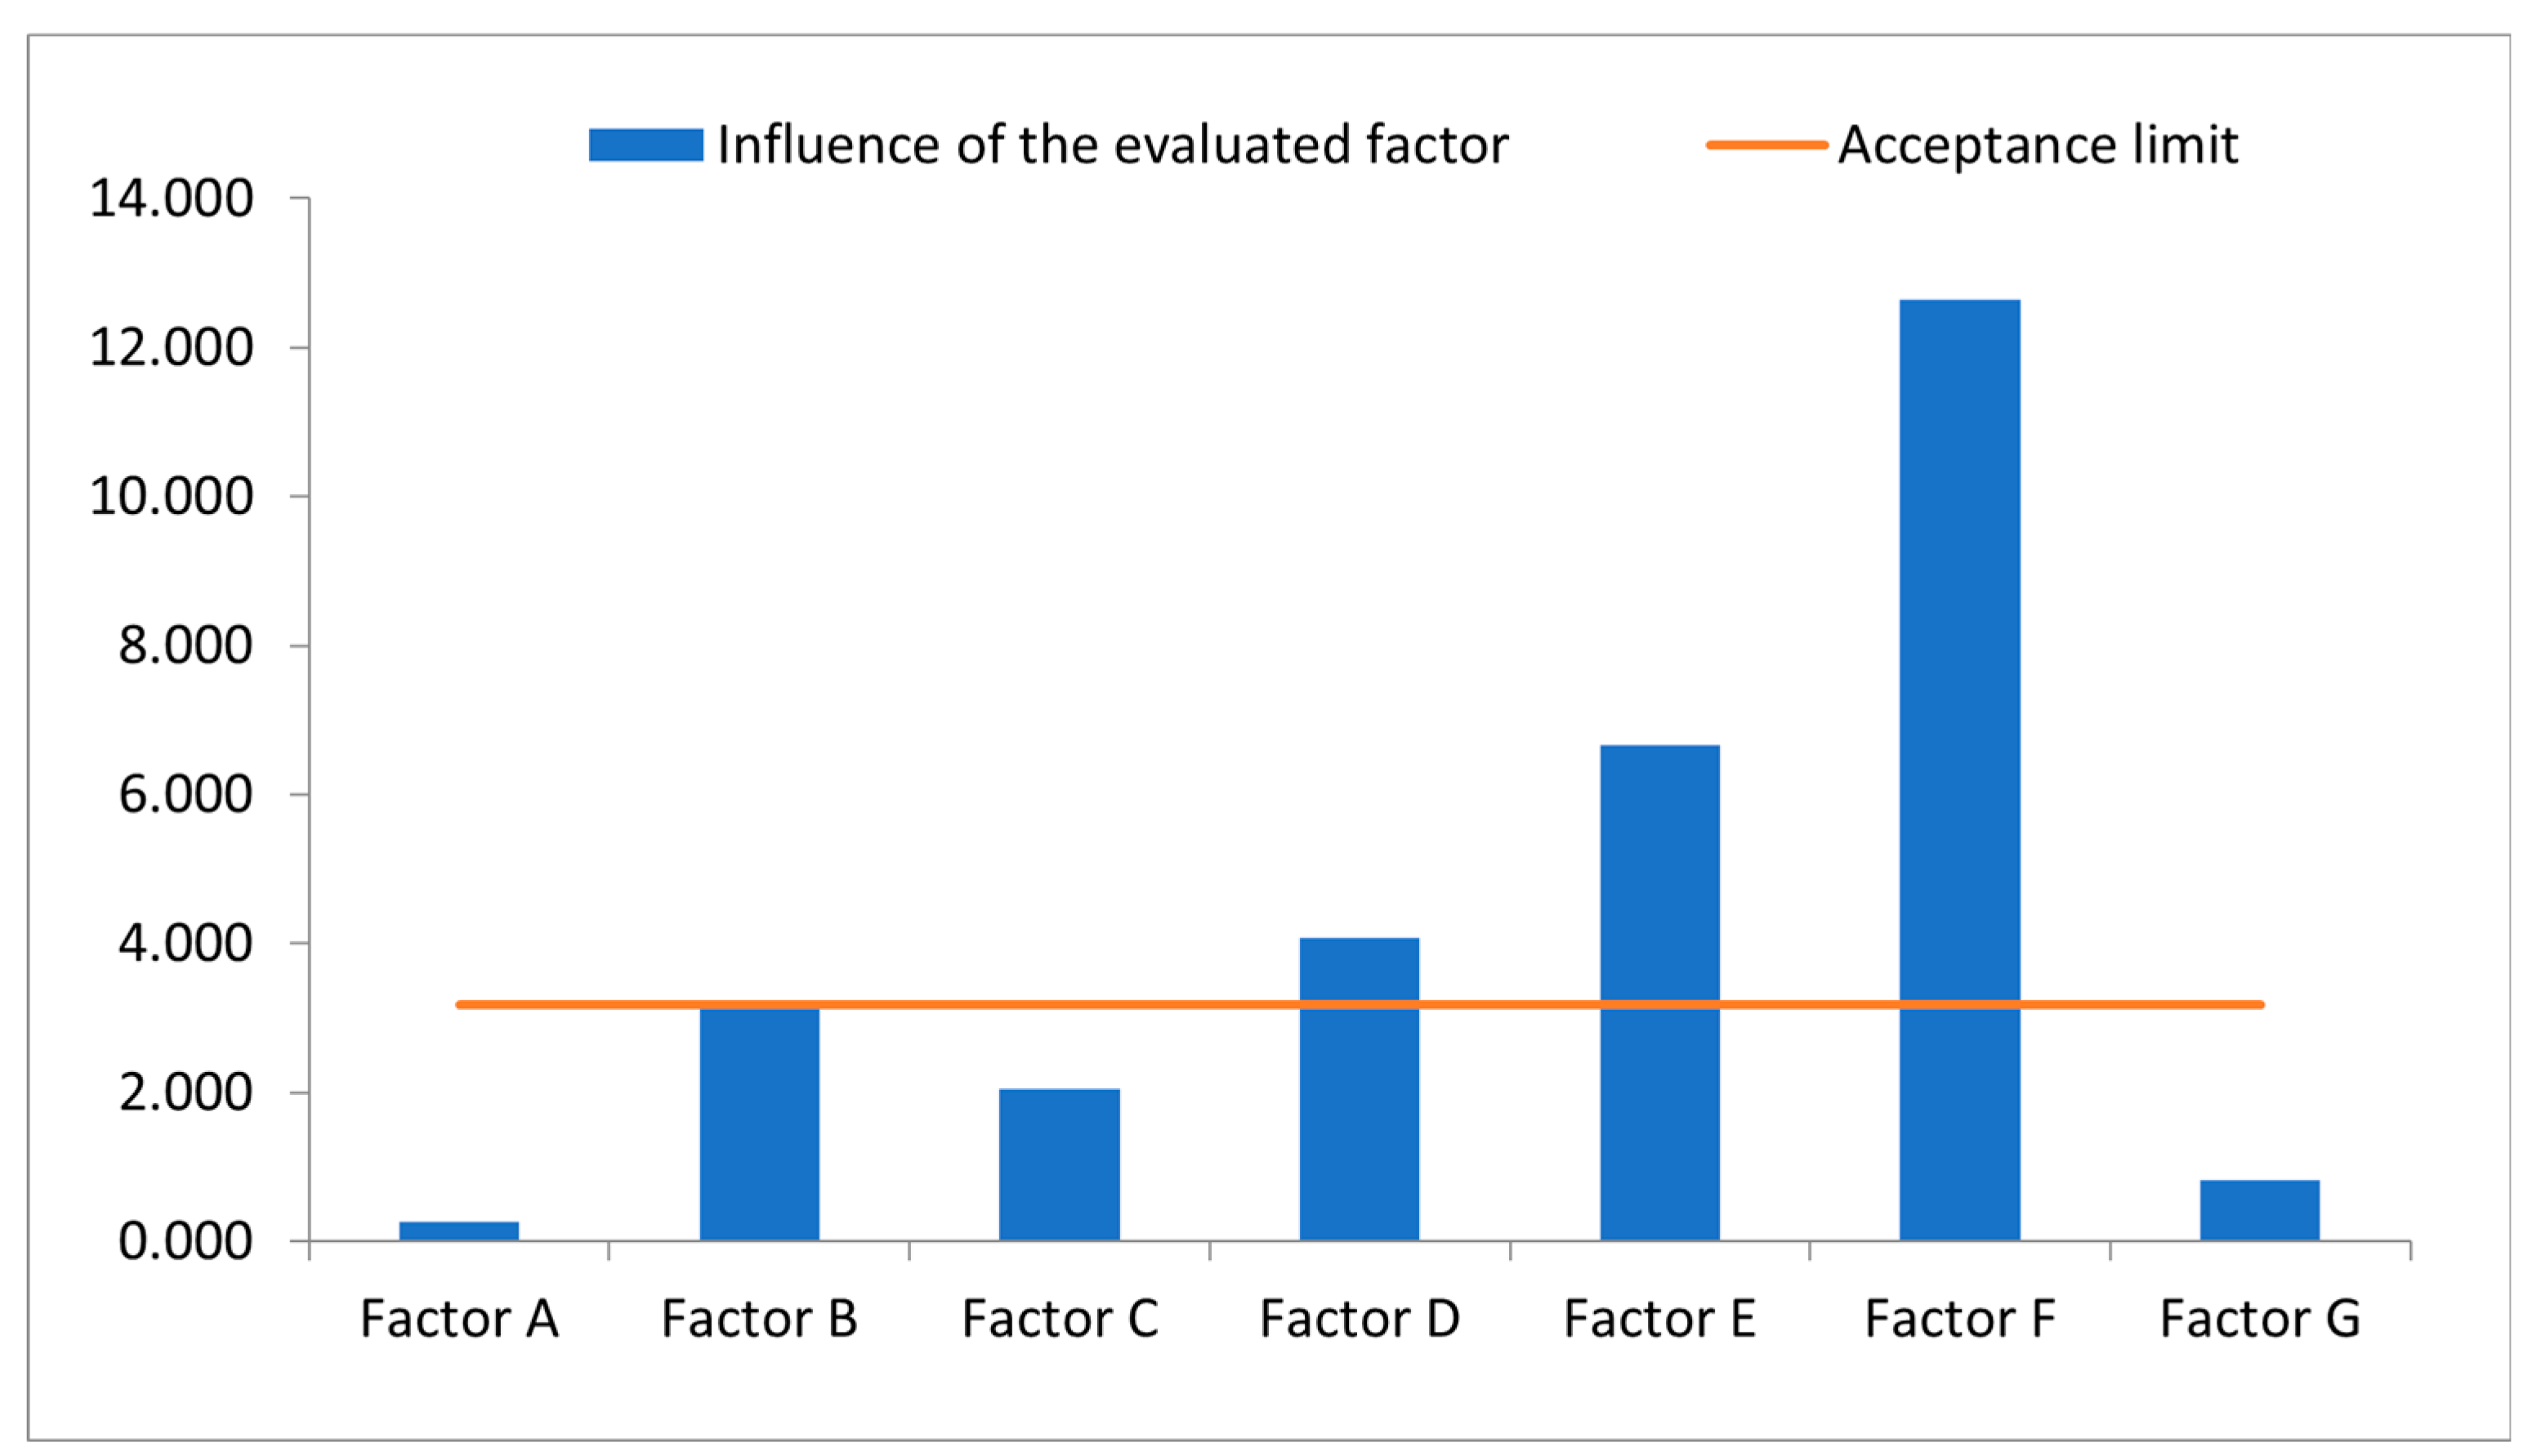
The objective of the robustness test was to determine which processes or steps of the method are critical and may affect the recovery of the analyte, and thus the accuracy of the measurement. For this parameter, a reduced Youden-Steiner factorial design was used, evaluating 7 variables in 8 assays, and the % recovery was determined as the response variable (
Table 7). Furthermore, as an acceptance criterion, it was defined that the influence of a factor is relevant and considered significant if, when comparing the value of the effect with the expression s√2, where s is the standard deviation of repeatability, the differences exceed in absolute value the result of this expression. With this evaluation, it was observed that the relevant factors in the method application were reducing the time in ultrasound (Factor B), pre-dissolving minoxidil in methanol before weighing or adding the placebo (Factor D), injection volume (Factor E), and flow change (Factor F) (
Figure 5). For this reason, especially these parameters must be kept unchanged as they significantly influence the results obtained, while other factors such as: modification of the aliquot (Factor A), control of temperature in ultrasound (Factor C), and the use of new or used filters (Factor G), do not significantly influence. In this sense, for the method to be reliable, the significant factors must be rigorously followed when performing quantification (
Table 7 and
Figure 5).
3.2. Determination of Minoxidil in Hair Growth Products
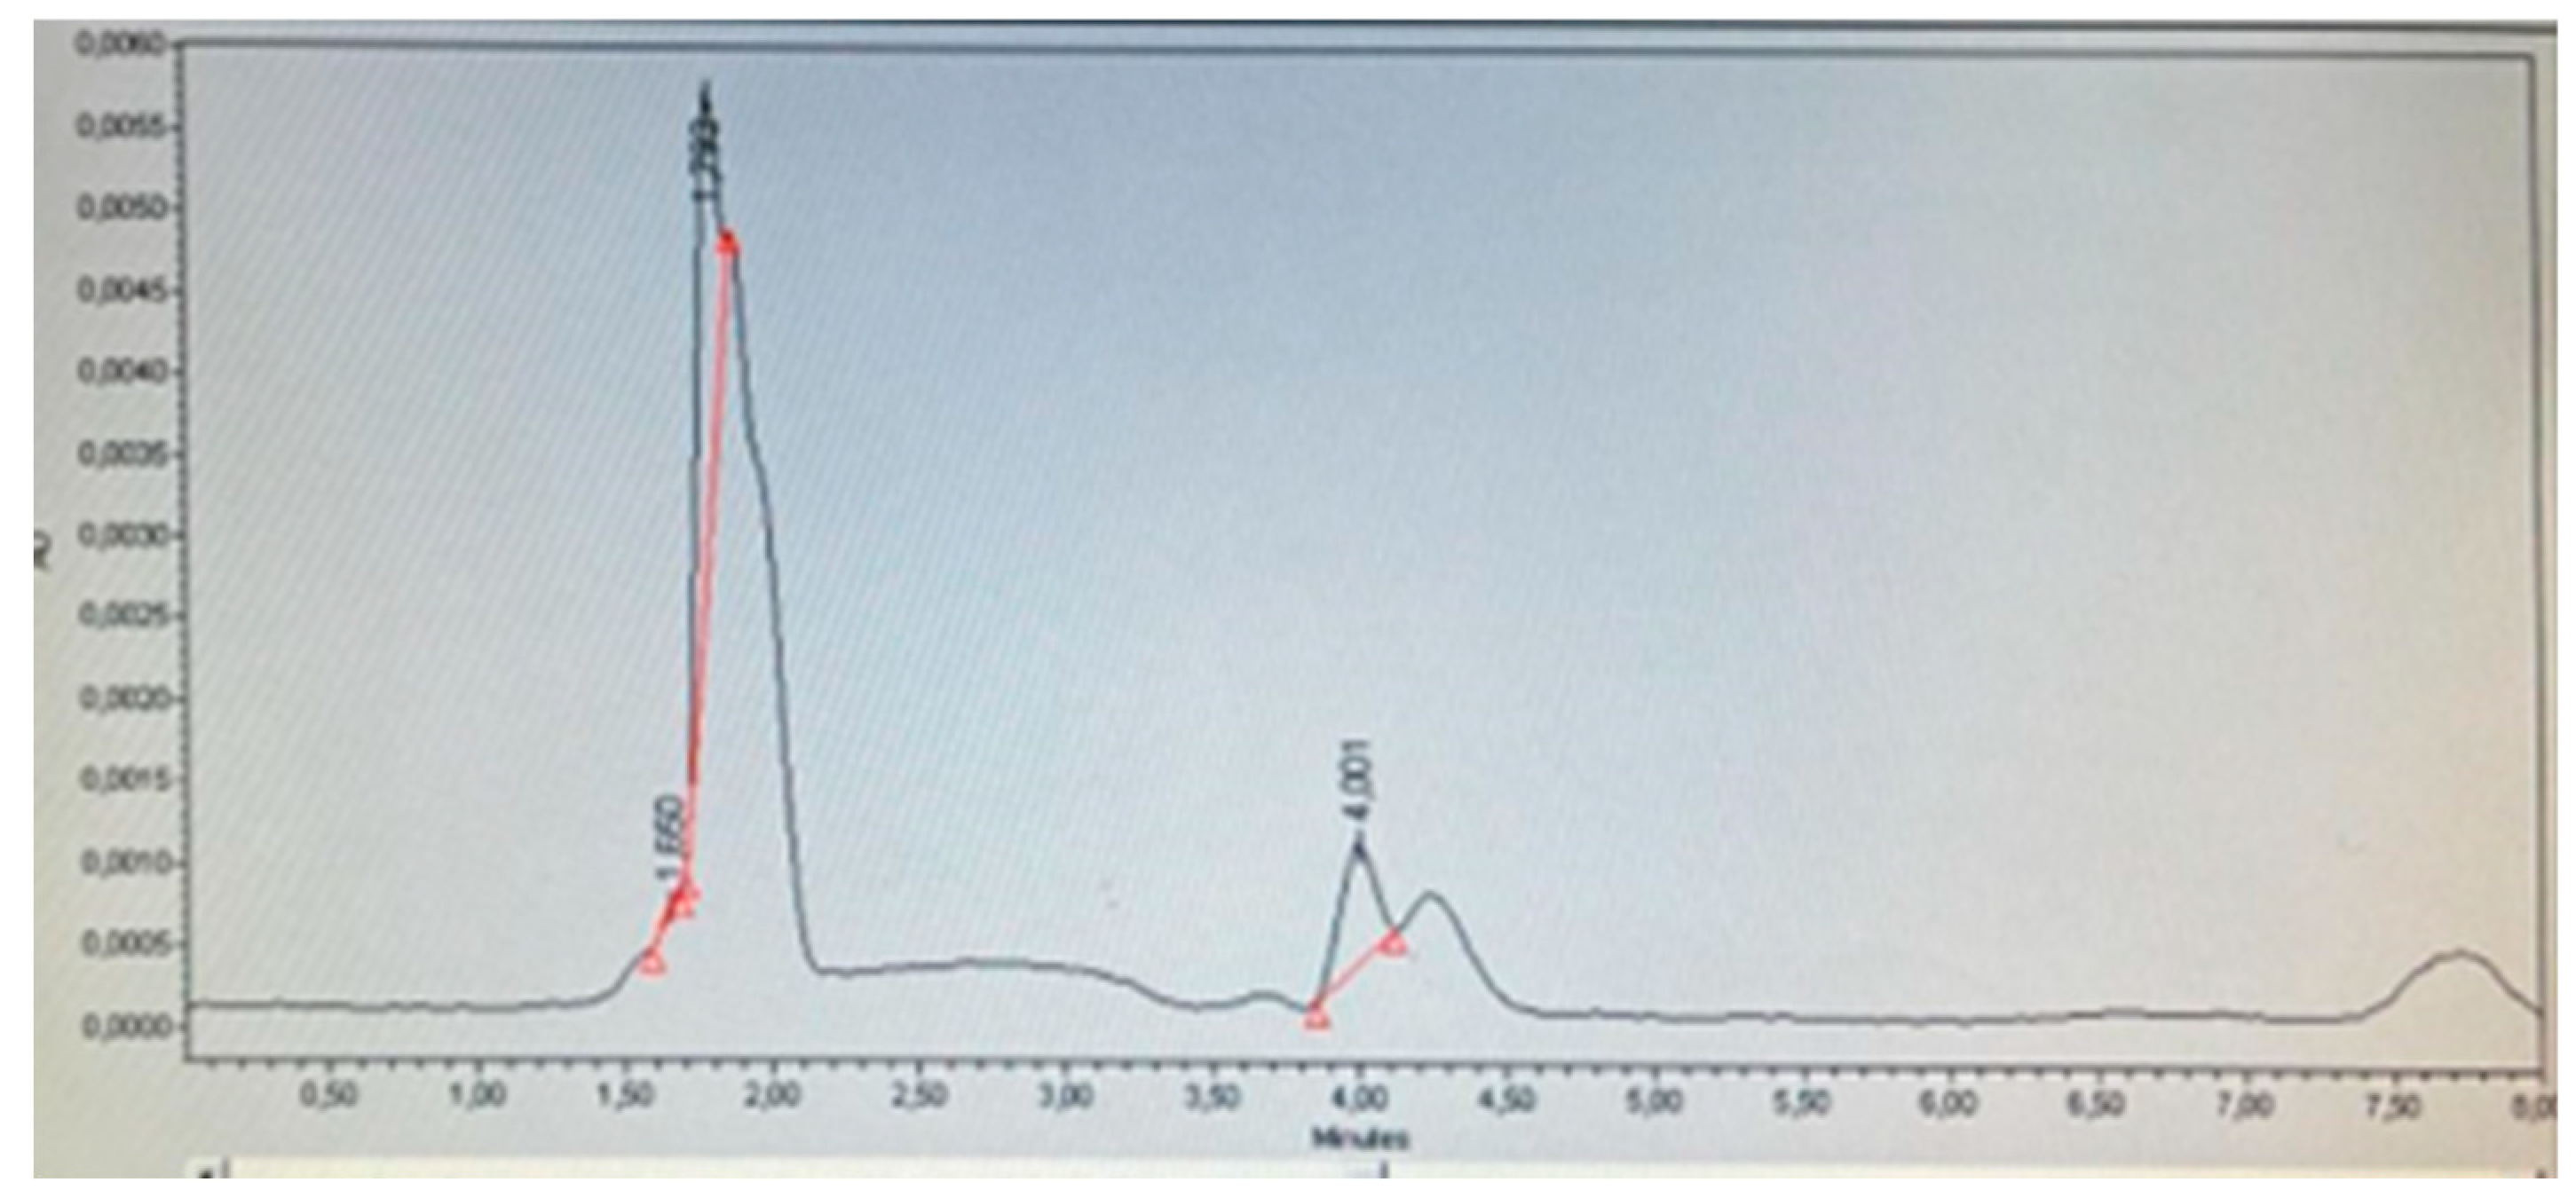
Eleven products were selected from market: two medications declaring to contain 5 % Minoxidil and nine cosmetic hair growth products with different matrices. All products were purchased from websites, beauty stores, hair salons, and barber shops. As selection criteria, products suspected to contain Minoxidil and cosmetic hair growth products declaring Minoxidil were considered, even if it was not specified in the ingredient list whether it is a derivative of Minoxidil or corresponds to the base Minoxidil. According to the method validation, it was found that the base minoxidil had an approximate retention time (tR) of 3.8, while minoxidil oxothiazolidinecarboxylate, in addition to this peak, presented another peak of lower intensity at a tR of 2.5-3.0. This latter peak helped differentiate whether the products contained base minoxidil or minoxidil oxothiazolidinecarboxylate (
Figure 6 and
Figure 7).
Table 8 shows the results of the determination of Minoxidil and its derivative Minoxidil oxothiazolidinecarboxylate. It was identified that products A, E, F, G, and K do not contain Minoxidil, which corresponds to what is declared on their respective labels. Products C and H (
Figure 8) declare on their label to contain Minoxidil oxothiazolidinecarboxylate, and through identification and quantification, it was corroborated that this compound was present and not the base Minoxidil (
Table 8). However, product D did not present the characteristic peak at tR 2.5-3.0 indicative of the derivative Minoxidil oxothiazolidinecarboxylate, therefore, it is presumed that this cosmetic product contains base Minoxidil (
Figure 7). This adverse analytical result is compounded by the fact that this product showed appearance problems, presenting a large amount of precipitated white crystals, which were separated by filtration, washed, and dried in an oven at 60°C. Subsequently, a solution was prepared with these crystals and injected using the same chromatographic system, presenting a retention time corresponding to base Minoxidil. These findings suggest that this product does not comply with international standards for cosmetic ingredients, as discussed, this substance is prohibited for use in cosmetics [
6,
7].
Figure 8.
Product D chromatogram.
Figure 8.
Product D chromatogram.
Figure 9.
Product H chromatogram.
Figure 9.
Product H chromatogram.
Product B declares to contain minoxidil; however, its ingredient list does not specify whether it is minoxidil oxothiazolidinecarboxylate or another approved derivative. Upon verification on the website of INVIMA (Instituto Nacional de Vigilancia de Medicamentos y Alimentos de Colombia), its Mandatory Health Notification (NSO), the search yielded no results, which raises suspicions of possible regulatory non-compliance. Additionally, the analysis of this product showed the specific peak for base Minoxidil, indicating that this product likely contains the prohibited form of minoxidil in cosmetics.
Two medications, topical solutions of minoxidil, products I and J, were also analyzed. These were evaluated as reference products for the identification of minoxidil. Indeed, it was confirmed that these products, being medications rather than cosmetics, contain declared base minoxidil at a concentration of 5 %. Drug product I, which is illegally imported into the country as it lacks a sanitary registration, had a found percentage of Minoxidil of 1.10±0.02%, while medication J, a domestically manufactured product with sanitary registration, had a found percentage of 5.29±0.10 %. According to the individual USP monograph, these medications should have between 90 – 110% of the labeled quantity, meaning between 4.5 – 5.5% of Minoxidil per formulation. Therefore, product I, illegally imported into the country, does not meet the quality characteristics for the assay according to the USP 18.
In the results obtained in this research, it was found that presumably 2 out of the 9 cosmetic products analyzed contained the prohibited analyte base minoxidil, i.e., 22.22 % of the analyzed products, which is consistent with what has been reported in other studies [
11,
13,
16,
17].
In this regard, De Orsi et al. (2008) determined the presence of seven prohibited substances in cosmetic products, including the substances evaluated: minoxidil, hydrocortisone, spironolactone, estrone, canrenone, triamcinolone acetonide, and progesterone, found that of the six products evaluated, minoxidil was present in four of them, and concomitantly with spironolactone in two product [
17]. Not only did these products demonstrate the presence of different prohibited substances, but also the percentages of these substances were extremely high. Finally, another study conducted in 2018 analyzed 76 samples of products claimed to be hair growth treatments. Once again, the results demonstrated the presence of unapproved compounds in cosmetics. It was found that around 10 % of the samples were adulterated with five prohibited ingredients, including minoxidil [
11]. Finally, with this work we hope to contribute to the inspection, surveillance, and post-market control activities of cosmetic products, with the aim of reducing regulatory non-compliance due to the use of prohibited ingredients, leading to reducing the trend of the number of fraudulent products in the international markets.