Submitted:
27 January 2025
Posted:
28 January 2025
You are already at the latest version
Abstract
The increase in carbon dioxide (CO2) in the air necessitates using Carbon Capture and Storage (CCS)
to reduce emissions. However, concerns persist regarding how CCS may affect groundwater, especially if CO2
leaks and interacts with aquifer systems. This study evaluated the impact of Carbon Capture and Storage
(CCS) activities on groundwater quality near the Barnett Zero CCS project in Wise County, North Texas.
We analyzed groundwater samples from four monitoring wells within a one-mile radius of the CCS site and
two control wells beyond this radius to assess changes in major ion concentrations, organic carbon levels, and
heavy metals and organic contaminants. The results showed the importance of ongoing groundwater quality
assessment in CCS-affected regions. While no immediate contamination risks were identified, the observed
variations in ion concentrations and organic carbon levels suggested potential geochemical interactions that
merit further study. The elevated levels of certain ions in monitoring wells compared to control wells indicated
the possible mobilization of dissolved species, which could be influenced by CO2 injection and subsurface
geochemical reactions. Additionally, the isolated occurrence of arsenic in one monitoring well, though not
widespread, underscored the need for further investigation to determine whether it was a natural anomaly or
a result of CCS-related processes. Long-term monitoring remains necessary to distinguish between natural
underground changes and any effects of CCS. This will help protect groundwater while ensuring that CCS
continues to be a safe and sustainable solution for reducing CO2 emissions.
Keywords:
Carbon capture and storage (CCS)
; groundwater quality
; CO2 leakage
; environmental impact assessment
; sustainability
1. Introduction
The rise in atmospheric concentrations of greenhouse gases, especially carbon dioxide (), has become a critical environmental challenge, leading to the urgent need for effective mitigation strategies [1]. Carbon Capture and Storage (CCS) technologies have gained significant attention as a promising approach to reduce emissions from industrial and energy-related sources [2,3]. Estimates suggest that CCS technologies could contribute to 25–67% of emissions reductions in heavy industries [4]. The CCS process entails the capture of from industrial emissions, its transport to an underground storage reservoir, and its injection into deep geological formations, where it is expected to remain securely stored within the pore spaces of the rock [5]. However, the potential impact of CCS activities has raised concerns such as leakage, induced fractures, and groundwater contamination (Figure 1) [4].
When dissolves in groundwater, it forms carbonic acid, lowering the pH and altering hydrogeochemical processes, which could mobilize various ions and contaminants [6]. This can contaminate groundwater, jeopardizing its suitability for essential uses such as drinking water, agriculture, and industrial applications [7]. -based contaminants in groundwater can cause adverse health effects for water populations, including gastrointestinal diseases, neurological disorders, and reproductive problems [8]. Additionally, the contaminated groundwater can impair crop growth and quality in agricultural applications, reducing food security and causing economic losses for farmers [9]. Industrial processes that rely on clean water may also suffer, as contaminants can interfere with manufacturing processes, reduce product quality, and increase operational costs due to the need for additional water treatment measures [10].
The potential risks of groundwater contamination from hazardous waste, nonhazardous industrial waste, municipal solid waste, and special waste have been recognized by several studies [11,12,13,14]. However, there is still a need for comprehensive field investigations and experimental analyses to assess the real-world impacts of CCS activities on groundwater quality. This is important for the CCS projects, where proximity to populated areas and groundwater resources increases the potential for environmental and public health concerns. In this context, the present study aims to evaluate the impact of CCS activities on groundwater quality near the Barnett Zero CCS project, an onshore storage site in Wise County, North Texas. Despite the significance of this project, the potential impact on groundwater resources in the surrounding area has not yet been explored. This research aims to establish a baseline for groundwater quality parameters and monitor potential changes resulting from CCS operations by conducting a field study and experimental investigation. We collect groundwater samples from monitoring wells near the CCS site and control sites estimated to be unaffected by storage activities due to the early stages of injections and distance. We then use laboratory analyses, including the analysis of major ions, heavy metals, and organic contaminants, to assess the potential impacts of the Barnett Zero CCS project on groundwater quality. We compare areas near the CCS site with control sites to isolate the specific effects of CCS activities, understand potential risks, and develop effective monitoring and mitigation strategies to protect groundwater resources. By addressing the critical issue of groundwater protection, this study will support the broader goal of mitigating greenhouse gas emissions while ensuring the preservation of essential groundwater resources for current and future generations.
The rest of this paper is organized as follows: Section 2 provides a detailed overview of the study area and the Barnett Zero CCS project. Section 3 outlines the research methodology, including field sampling techniques, laboratory analytical methods, and data analysis approaches. Section 4 presents the results and discussion, including the characterization of groundwater quality parameters and assessing potential impacts from CCS activities, highlighting possible risks and mitigation strategies for protecting groundwater resources in the context of CCS operations. Section 5 examines the limitations of the study and proposes future research directions. Section 6 discusses the broader implications of the findings and outlines future research needs. Section 7 concludes the study, summarizing the key findings and contributions and suggesting future research directions.
2. Study Area
The Barnett Zero project in Wise County, Texas, is a commercial CCS initiative by the BKV Corporation and EnLink Midstream [15]. As shown in Figure 2a, Wise County is located in north-central Texas. Due to the region’s favorable geological conditions for carbon storage, the county has been proposed for the CCS project. The target injection zone in Wise County is the Ellenburger Group formation, which is a porous and permeable carbonate reservoir suitable for storage [16]. As shown in Figure 2b, the overlying Barnett Shale acts as a thick, low-permeability caprock, providing an effective seal to prevent upward migration of .
The Barnett Zero project represents reducing emissions associated with natural gas production in the Barnett Shale region. The project is forecast to achieve an average storage rate of up to 210,000 metric tons of e annually over its lifetime [19]. EnLink transports natural gas produced by BKV in the Barnett Shale to its natural gas processing plant in Bridgeport, Texas. At the Bridgeport plant, the waste stream is captured and transported to a BKV facility. The captured is then compressed at the BKV facility. Finally, the compressed is sequestered via BKV’s nearby underground injection control well, which is a Class II commercial carbon sequestration well [19,20]. Figure 3 shows the gas processing plant, pipeline route, and one injection well. The Railroad Commission (RRC) of Texas granted a permit for injection into the Ellenburger Group formation, specifying a maximum allowable surface pressure of 4,500 pounds per square inch gauge (psig) for this project. The authorized injection well also has a permitted depth interval ranging from 9,350 to 10,250 feet within the Ellenburger Group formation [21].
The initial injection into the Barnett Zero facility commenced operations safely and on schedule in November 2023 [20]. Figure 4 shows the monthly injection volumes in thousand cubic feet (MCF) for the Barnett Zero facility during the late months of 2023 and the initial months of 2024 [22]. The data shows a gradual increase in injection volumes throughout 2024, starting from 112,473 MCF in January and peaking at 327,261 MCF in August 2024. Notably, injection operations began in November 2023 with an initial volume of 29,150 MCF and subsequently increased to 130,049 MCF in December 2023. This progression highlights the ramp-up phase of injection activities as the facility moved toward full-scale operation. The injection zone is well below and isolated from any major aquifers in the area; however, faults and undetected fractures within the formation still pose some risk of leakage into groundwater [4]. These faults and fractures could potentially serve as pathways for the migration of or other operational by-products and contaminants, highlighting the importance of ongoing monitoring and risk management strategies to ensure the safety and integrity of the storage site and to avoid groundwater contamination.
3. Methodology
The methodology employed in this study includes field sampling and laboratory analysis steps to assess the potential impact of the Barnett Zero CCS project on groundwater quality in Wise County, North Texas.
3.1. Field Sampling
We perform field sampling to collect groundwater samples from existing monitoring and control wells in the study area. We select four (Wells#01, Wells#02, Wells#03, and Wells#05) monitoring wells within one mile of the Barnett Zero site. In addition, we identify two control wells (Wells#04 and Wells#06) located between one and two miles from the site and not affected by CCS activities to establish baseline groundwater quality data. We chose the control wells within a reasonable distance from the CCS site to ensure similar geological formations, as significant variations could affect the reactions between water and rock types, compromising the fairness of the comparison between groundwater samples from the monitoring and control wells.
Additionally, we measure field parameters such as pH, temperature, conductivity, and dissolved oxygen (DO) on-site using calibrated portable instruments to obtain real-time information about groundwater chemistry and identify potential anomalies or changes in the aquifer system. We record these field measurements and detailed notes on sampling conditions, well characteristics, and relevant observations. To maintain sample integrity and ensure accurate analytical results, we follow proper sample container guidelines, preservation techniques (e.g., acidification, cooling), and holding times. Groundwater samples are collected following standard protocols established by the United States Environmental Protection Agency (EPA) to ensure data quality and minimize the risk of contamination [23]. Stringent quality assurance and quality control (QA/QC) measures are implemented at every stage of the sampling process. To prevent cross-contamination between sampling locations, we use clean sampling equipment, including a YSI 6920 datasonde, a 10-liter carboy, and new sample bottles (glass and Nalgene) with the appropriate preservative based on the analyte. All sampling equipment is thoroughly decontaminated before and after each use by triple-rinsing with laboratory-grade deionized water.
3.2. Laboratory Analyses
The groundwater samples undergo a comprehensive suite of laboratory tests designed to detect any chemical and physical changes that could arise due to potential leakage or other impacts from CCS activities. These analyses are crucial for identifying possible contamination or geochemical changes in groundwater quality. The laboratory analyses are categorized into four main areas: major ion analyses, organic carbon analyses, heavy metal analyses, and organic contaminant analyses. The rationale for the selected analyses is to detect key indicators of leakage or other geochemical changes that could affect groundwater quality. Table 1 summarizes the types of tests conducted in each category along with their respective descriptions.
3.2.1. Major Ion Analyses
Major ion concentrations are assessed to determine changes in groundwater chemistry that might indicate interaction with the aquifer matrix [24]. Key ions measured include calcium (), magnesium (), and sodium (), which are typically mobilized when dissolves in groundwater, forming carbonic acid that reacts with carbonate minerals, leading to the dissolution of calcium and magnesium ions. Chloride () and sulfate () are also measured as anions that provide insights into groundwater salinity and help detect potential contamination from industrial sources. Alkalinity, which measures the buffering capacity of groundwater and its ability to neutralize acids, is monitored, as a decrease in alkalinity suggests acidification due to dissolution [25]. The analyses use EPA-standard methods such as SM2340B-2011 for hardness (as ) and SW9056A for anion analysis [26].
3.2.2. Organic Carbon Analyses
Organic carbon analyses are essential for evaluating groundwater quality, as fluctuations in organic carbon levels can indicate contamination from hydrocarbons or organic waste products [27]. Two key parameters measured are Dissolved Organic Carbon (DOC) and Total Organic Carbon (TOC). DOC represents the fraction of organic carbon that passes through a 0.45 µm filter, typically comprising various organic molecules, while TOC encompasses all organic carbon in the sample, including both dissolved and particulate forms [28]. These analyses are conducted using standardized methods to ensure accuracy and comparability. SW9060A method is employed to determine the concentration of organic carbon in groundwater, surface water, and wastewater; it involves the oxidation of organic carbon to , which is then quantified [26]. Additionally, the E415.1 method utilizes combustion or oxidation techniques to measure organic carbon levels in water samples; the sample is processed to convert organic carbon to , which is subsequently measured to determine the TOC concentration [26]. Maintaining consistent organic carbon levels is crucial for preserving groundwater quality and ensuring the safety of water resources.
3.2.3. Heavy Metal Analyses
The potential mobilization of heavy metals from the subsurface due to CCS activities is a key focus of the laboratory analysis [29]. -induced changes in groundwater pH can enhance the solubility of certain metals, potentially leading to elevated concentrations that pose health risks [24]. The following heavy metals are analyzed for total recoverable results (not dissolved): mercury (Hg), using the SW7470A method [26], to measure mercury levels and assess any release of this toxic element, which can be a major concern for groundwater quality due to its detrimental health effects even at low concentrations; and lead (Pb), arsenic (As), cadmium (Cd), and other trace metals, which are detected through Inductively Coupled Plasma Mass Spectrometry (ICP-MS) by the SW6020A method, allowing for highly sensitive quantification of trace elements [26]. Lead and arsenic are particularly concerning, as they can leach into groundwater when interacts with certain mineral formations [30]. By analyzing the concentration of these heavy metals, the study aims to identify any increases that could indicate geochemical changes or contamination triggered by leakage.
3.2.4. Organic Contaminant Analyses
Organic contaminants, including volatile and semi-volatile compounds, are analyzed to assess the impact of CCS activities on groundwater quality [31]. These contaminants can originate from various sources, such as industrial operations, and could potentially migrate into groundwater if pathways like fractures or faults exist within the storage formation. Total Petroleum Hydrocarbons (TPH) levels are measured using the Texas TPH Method TX1005, indicating whether hydrocarbons, typically associated with oil and gas operations, are present in groundwater [32]. Since CCS sites are often near industrial activities, this test monitors potential contamination. Volatile Organic Compounds (VOCs), such as benzene, toluene, ethylbenzene, and xylene (BTEX compounds), are detected using EPA Method SW8260C [26]. These compounds are particularly important to monitor due to their high mobility in groundwater and potential health risks. Semi-Volatile Organic Compounds (SVOCs) are analyzed using EPA Method 8270D, which detects compounds such as polycyclic aromatic hydrocarbons (PAHs), phthalates, and phenols [33]. These compounds can originate from industrial processes and are often persistent in the environment, posing long-term risks to groundwater quality. In addition to these specific contaminant analyses, low-level screening techniques are employed to detect trace amounts of various organic compounds, providing a more complete understanding of groundwater contamination.
4. Results and Discussion
We collected groundwater samples from monitoring wells to establish baseline groundwater quality data. The locations of the wells are highlighted in Figure 5a. In each well, we measured pH, temperature, conductivity, and DO to assess initial groundwater conditions, following protocols for sample collection, preservation, and handling to ensure accurate results (Figure 5b).
Figure 6 shows the relationship between well depth and the distance of each well from the injection well (IW). The monitoring wells (Well #1, Well #2, Well #3, and Well #5) are located within a one-mile radius of the Barnett Zero CCS injection well, while the control wells (Well #4 and Well #6) are located beyond a one-mile radius, unaffected by the CCS operations. Wells that are closer to the injection well do not follow a clear pattern of depth variation; for instance, Well#01, which is the closest to the IW, has a shallower depth compared to other wells such as Well#03 and Well#05, which are deeper. Control wells show greater depths than some of the monitoring wells. The monitoring and control wells have depths ranging from 75 ft to 180 ft, while the significantly deeper injection well reaches a depth of 9,350 ft, corresponding to the target geological formation (Ellenburger Group) for storage.
Figure 7 shows the pH, temperature, conductivity, and DO for each well. The pH values for the monitoring and control wells indicate that the groundwater is slightly alkaline, with pH values ranging from 7.16 to 7.88. The temperatures in these wells also vary more widely than initially stated, from in Well #2 to 30.39°C in Well #4. This temperature variability might suggest localized thermal anomalies or differences in well depth, tank storage, and geological formation. Conductivity values range from 843 to , with Well #1 displaying the highest conductivity, showing a higher ion concentration than the other wells. DO levels also show significant variation, with the highest saturation observed in Well #2 (99.4%) and the lowest in Well #6 (42.3%), indicating differences in oxidation-reduction conditions among the wells. Wells closer to the injection well do not show a consistent trend in DO levels, which may be influenced by factors such as local hydrogeology, well depth, and proximity to the CCS operations.
Figure 8 presents an analysis of major ions in groundwater samples. The results show variations in ion concentrations between monitoring wells located near the CCS site and control wells situated further away. Notably, calcium and sodium are the predominant cations detected, with concentrations in monitoring wells showing increases of up to 20% for calcium and 15% for sodium compared to control wells. Specifically, Well#1 showed the highest calcium concentration at 312 mg/L, while sodium levels reached 373 mg/L, indicating a potential influence of CCS activities on groundwater chemistry. Magnesium and potassium concentrations also varied across the wells, with monitoring wells generally exhibiting higher levels than control wells. For instance, Well#1 reported magnesium levels of 134 mg/L, significantly higher than the control well’s maximum of 33.7 mg/L. The presence of elevated ion concentrations in monitoring wells suggests that CO2 interactions with groundwater may be mobilizing these ions, potentially altering the hydrogeochemical balance in the aquifer system. The observed increases in ion concentrations highlight the importance of ongoing monitoring to assess long-term trends and potential risks associated with CCS operations. Although these values are below harmful thresholds, continued research is essential to establish a more robust understanding of how CCS activities may impact groundwater chemistry over time.
Figure 9 shows the notable variability in DOC and TOC levels across the six sampled wells. DOC levels ranged from 1.09 mg/L to 1.88 mg/L, with Well#6 recording the highest value at 1.88 mg/L and Well#2 the lowest at 1.09 mg/L. The average DOC across all wells was 1.51 mg/L. TOC concentrations exhibited a broader range, spanning from 1.15 mg/L to 3.10 mg/L. Well#1 showed the highest TOC at 3.10 mg/L, while Well#2 again recorded the lowest at 1.15 mg/L, with an overall average of 2.21 mg/L. These findings highlight heterogeneity in organic carbon content across the wells.
Monitoring wells and control wells displayed distinct characteristics in terms of organic carbon composition. Well#1, a monitoring well, exhibited the highest TOC (3.10 mg/L) but only moderate DOC (1.76 mg/L), suggesting the presence of particulate organic carbon. In contrast, Well#2, another monitoring well, consistently showed the lowest organic carbon content for both DOC (1.09 mg/L) and TOC (1.15 mg/L), indicating minimal organic matter contributions. These variations suggest that monitoring wells may reflect localized influences, possibly linked to CCS activities or natural geochemical processes. Control wells, on the other hand, presented contrasting patterns. Well#4 had the second-highest TOC (3.02 mg/L) but relatively low DOC (1.22 mg/L), pointing to the proportion of particulate organic matter. Conversely, Well#6 recorded the highest DOC (1.88 mg/L) but moderate TOC (1.99 mg/L), indicating a predominance of dissolved organic compounds. These findings suggest that control wells might be influenced by local geological features or external factors, such as land use practices, rather than direct CCS impacts.
The difference between TOC and DOC values across all wells ranged from 0.06 mg/L in Well#2 to 1.80 mg/L in Well#4, underscoring the variability in particulate organic carbon. However, no clear distinction emerged between monitoring and control wells regarding overall organic carbon patterns. This heterogeneity likely reflects a combination of natural geological variability and localized influences rather than a direct impact of CCS activities. The observed variability highlights the importance of continued monitoring to identify potential long-term trends or changes related to CCS operations. Further analysis over time will be essential to understand whether CCS activities contribute to shifts in organic carbon content or whether these differences are primarily driven by natural and anthropogenic factors in the region.
Figure 10 presents heavy metal concentrations across six wells. Barium (Ba) was the most prevalent heavy metal, detected in all wells at varying concentrations. Well #6 had the highest barium level (0.209 mg/L), while Well #1 had the lowest (0.0140 mg/L). The consistent presence of barium suggests its natural occurrence in local geological formations, with variations likely influenced by differences in aquifer characteristics or water sources. Arsenic (As) was detected only in Well #3 at 0.00236 mg/L, exceeding the method detection limit (MDL) of 0.0004 mg/L. The MDL represents the lowest concentration a laboratory can confidently detect and report with 99% certainty that the value is above zero [34]. This isolated occurrence warrants further investigation to determine whether it results from natural geological variations or potential CCS activities. The absence of arsenic in other wells suggests its presence in Well #3 may be localized. Trace elements such as Ba and As can occur naturally in groundwater, particularly in aquifer systems where geochemical conditions cause the dissolution of these elements from rock and mineral formations, including sulfide ore deposits, igneous rocks, sandstone, and limestone [35]. Mercury (Hg), cadmium (Cd), and lead (Pb) were not detected in any wells, with all measurements falling below their respective MDLs (0.00003 mg/L for mercury, 0.0002 mg/L for cadmium, and 0.0006 mg/L for lead). While these results are positive from a water quality perspective, ongoing monitoring remains essential for the early detection of potential future contamination.
The analysis of organic contaminants, including TPH and VOCs, did not reveal any detectable levels of contamination in the groundwater samples collected from the monitoring wells. TPH levels were consistently reported as non-detect, with all results below the MDL of 0.19 mg/L. This indicates the absence of hydrocarbons typically associated with oil and gas operations. Similarly, VOCs such as BTEX compounds (benzene, ethylbenzene, toluene, and xylene) were reported as non-detect, with all results below the MDL of 0.3 g/L. Although these VOCs are of particular concern due to their high mobility in groundwater and potential health risks, the absence of detectable concentrations suggests they are not currently impacting groundwater quality in the study area.
SVOCs were also analyzed, with a particular focus on phenol, to assess potential contamination. Anthracene, chrysene, naphthalene, and phenol—compounds often associated with industrial processes and known for their environmental persistence—were all reported as non-detect, with concentrations below their respective MDLs (0.014 g/L for anthracene, 0.021 g/L for chrysene, 0.02 g/L for naphthalene, and 0.035 g/L for phenol) across all monitoring and control wells. These findings indicate that these and other SVOC contaminants were not present in the groundwater during the sampling period. While SVOCs can pose long-term risks to groundwater quality because of their persistence, the lack of detectable levels suggests that the groundwater has not been impacted by nearby industrial activities or CCS operations. Continued monitoring will be crucial to ensure that ongoing CCS activities do not introduce hydrocarbons or other volatile and semi-volatile organic compounds into the groundwater system.
The findings represent the importance of ongoing groundwater quality assessment in CCS-affected regions. While no immediate contamination risks were identified, the observed variations in ion concentrations and organic carbon levels suggest potential geochemical interactions that merit further study. The elevated levels of certain ions in monitoring wells compared to control wells indicate possible mobilization of dissolved species, which could be influenced by injection and subsurface geochemical reactions. Additionally, the isolated occurrence of arsenic in Well #3, though not widespread, underscores the need for further investigation to determine whether it is a natural anomaly or a result of CCS-related processes. Hence, long-term monitoring will be essential to distinguish between natural hydrogeochemical processes and possible CCS-induced changes, ensuring the continued protection of groundwater resources.
5. Limitations and Future Directions
This study identifies several inherent limitations and uncertainties that influence our understanding of the long-term effects of injection on groundwater quality. Temporal limitations are evident, as the short duration of the study prevents a comprehensive capture of slow geochemical reactions between and aquifer materials, which are crucial for detecting delayed impacts like the mobilization of heavy metals and organic compounds. Spatial variability also presents significant challenges due to the complex geology and insufficient monitoring infrastructure, which might not adequately represent the area’s groundwater conditions. Addressing these spatial and temporal limitations requires a more extensive network of monitoring wells across varied geological settings and prolonged observation periods.
The study’s reliance on a limited baseline of groundwater quality and the complex chemical interactions under varying conditions adds layers of uncertainty in attributing changes directly to storage. External factors such as industrial activities, agricultural runoff, and seasonal variations further complicate the isolation of CCS impacts. To refine our understanding and regulatory approaches, it is imperative to establish a robust baseline of historical data and expand both the spatial coverage and the analytical sensitivity of monitoring efforts.
Future work should focus on enhancing geochemical models to simulate potential interactions under diverse conditions, providing predictive insights into contaminant mobilization. Advanced analytical techniques with lower detection limits are essential for identifying trace contaminants that signal early pollution stages. Additionally, incorporating geophysical methods like seismic surveys can help identify and monitor migration pathways in storage formations, crucial for mitigating leakage risks and optimizing site selection.
6. Conclusions
The increasing concentration of atmospheric carbon dioxide () necessitates the development of Carbon Capture and Storage (CCS) technologies as a viable strategy to mitigate greenhouse gas emissions. However, concerns persist regarding the potential environmental risks associated with CCS, particularly its impact on groundwater quality. This study addressed these concerns by evaluating groundwater quality near the Barnett Zero CCS project in Wise County, Texas, and assessing the potential hydrogeochemical effects of injection. The results showed both immediate observations and implications for long-term environmental monitoring. While our analyses indicated increases in certain ion concentrations, specifically calcium and sodium, by up to 20% and 15%, respectively, in monitoring wells closer to the CCS site compared to control wells, these findings highlighted the necessity of regular monitoring in the vicinity of CCS operations. Total Organic Carbon (TOC) levels, which varied from 1.15 mg/L to 3.10 mg/L with the highest near the CCS operations, suggested ongoing geochemical interactions that could pose risks if not continuously assessed. Furthermore, the detection of arsenic in one monitoring well, albeit at low concentrations, underscored the potential for CCS activities to mobilize trace heavy metals. Importantly, the absence of significant levels of heavy metals and hydrocarbons provided initial reassurance about the safety of CCS as currently managed. However, the detection of barium across all wells and the specific presence of arsenic highlighted the complex nature of subsurface geochemistry once influenced by injected . These results advocated for the implementation of comprehensive risk management strategies, including robust baseline data collection, ongoing environmental monitoring, and adaptive management practices capable of responding to any signs of groundwater contamination.
This study confirmed that while CCS technologies hold considerable promise for reducing atmospheric emissions, their deployment must be managed carefully to mitigate any unintended consequences on groundwater resources. Continuous research and monitoring remain essential to ensure that CCS can be implemented safely and effectively as part of broader efforts to combat climate change. Future work should focus on extending the monitoring network, increasing the frequency of sampling, and enhancing analytical methods to capture more detailed data on potential contaminants. These efforts will be crucial in developing a more thorough understanding of the long-term impacts of CCS on groundwater systems and ensuring the environmental integrity of this important climate technology.
Acknowledgments
S.K.M. would like to acknowledge the support provided by the Texas Institute for Applied Environment Research (TIAER), Tarleton State University, and the Presidential Excellence in Research Scholars (PERS) program, under award number 208680-24.
Conflicts of Interest
The authors declare no conflict of interest.
References
- Raihan, A.; Tuspekova, A. Dynamic impacts of economic growth, energy use, urbanization, tourism, agricultural value-added, and forested area on carbon dioxide emissions in Brazil. Journal of Environmental Studies and Sciences 2022, 12, 794–814. [Google Scholar] [CrossRef]
- Cavaliere, P.; Cavaliere, P. Carbon Capture and Storage: Most Efficient Technologies for Greenhouse Emissions Abatement. Clean Ironmaking and Steelmaking Processes: Efficient Technologies for Greenhouse Emissions Abatement 2019, pp. 485–553.
- Mahjour, S.K.; Badhan, J.H.; Faroughi, S.A. Uncertainty Quantification in CO2 Trapping Mechanisms: A Case Study of PUNQ-S3 Reservoir Model Using Representative Geological Realizations and Unsupervised Machine Learning. Energies 2024, 17, 1180. [Google Scholar] [CrossRef]
- Mahjour, S.K.; Faroughi, S.A. Risks and uncertainties in carbon capture, transport, and storage projects: A comprehensive review. Gas Science and Engineering 2023, p. 205117.
- Mahjour, S.K.; Faroughi, S.A. Selecting representative geological realizations to model subsurface CO2 storage under uncertainty. International Journal of Greenhouse Gas Control 2023, 127, 103920. [Google Scholar] [CrossRef]
- Gupta, P.K.; Yadav, B. Leakage of CO2 from geological storage and its impacts on fresh soil–water systems: a review. Environmental Science and Pollution Research 2020, 27, 12995–13018. [Google Scholar] [CrossRef] [PubMed]
- Thomas, L.; Schneider, M.; Winkler, A. Threats to the quality of water resources by geological CO 2 storage: hydrogeochemical and other methods of investigation: a review. Threats to the quality of groundwater resources: prevention and control 2016, pp. 31–51.
- Egbueri, J.C. A multi-model study for understanding the contamination mechanisms, toxicity and health risks of hardness, sulfate, and nitrate in natural water resources. Environmental Science and Pollution Research 2023, 30, 61626–61658. [Google Scholar] [CrossRef]
- Lu, Y.; Song, S.; Wang, R.; Liu, Z.; Meng, J.; Sweetman, A.J.; Jenkins, A.; Ferrier, R.C.; Li, H.; Luo, W.; et al. Impacts of soil and water pollution on food safety and health risks in China. Environment international 2015, 77, 5–15. [Google Scholar] [CrossRef]
- Wang, Q.; Yang, Z. Industrial water pollution, water environment treatment, and health risks in China. Environmental pollution 2016, 218, 358–365. [Google Scholar] [CrossRef] [PubMed]
- Ezeala, H.; Okeke, O.; Amadi, C.; Irefin, M.; Okeukwu, E.; Dikeogu, T.; Akoma, C. INDUSTRIAL WASTES: REVIEW OF SOURCES, HAZARDS AND MITIGATION. Engineering Research journal 2023, 3, 1–26. [Google Scholar]
- Pradhan, B.; Chand, S.; Chand, S.; Rout, P.R.; Naik, S.K. Emerging groundwater contaminants: A comprehensive review on their health hazards and remediation technologies. Groundwater for Sustainable Development 2023, 20, 100868. [Google Scholar] [CrossRef]
- El Fadili, H.; Ali, M.B.; El Mahi, M.; Cooray, A.T.; et al. A comprehensive health risk assessment and groundwater quality for irrigation and drinking purposes around municipal solid waste sanitary landfill: A case study in Morocco. Environmental Nanotechnology, Monitoring & Management 2022, 18, 100698. [Google Scholar]
- Mahjour, S.K.; Soltanmohammadi, R.; Heidaryan, E.; Faroughi, S.A. Geosystems risk and uncertainty: The application of ChatGPT with targeted prompting. Geoenergy Science and Engineering 2024, 238, 212889. [Google Scholar] [CrossRef]
- BKV.; Midstream, E. BKV and Enlink Midstream Commence First Carbon Capture and Sequestration Project in the Barnett Shale, 2024. Accessed: Jan. 18, 2024.
- Loucks, R.; Kerans, C. Review of the lower Ordovician Ellenburger group of the Permian basin, West Texas and southeast New Mexico. Anatomy of a Paleozoic basin: The Permian Basin, USA: AAPG Memoir 2019, 124. [Google Scholar]
- Dai, J.; Dong, D.; Ni, Y.; Hong, F.; Zhang, S.; Zhang, Y.; Ding, L. Several essential geological and geochemical issues regarding shale gas research in China. Journal of Natural Gas Geoscience 2020, 5, 169–184. [Google Scholar] [CrossRef]
- Pollastro, R.M.; Jarvie, D.M.; Hill, R.J.; Adams, C.W. Geologic framework of the Mississippian Barnett shale, Barnett-paleozoic total petroleum system, Bend arch–Fort Worth basin, Texas. AAPG bulletin 2007, 91, 405–436. [Google Scholar] [CrossRef]
- BKV Corporation. BKV and Enlink Midstream Announce First Carbon Sequestration Project in the Barnett Shale – Barnett Zero, 2024. Accessed: Jan. 18, 2024.
- BKV and Enlink Midstream. BKV and Enlink Midstream Commence First Carbon Capture and Sequestration Project in the Barnett Shale, 2024. Accessed: Jan. 18, 2024.
- U.S. Environmental Protection Agency. Monitoring, Reporting, and Verification (MRV) Plan for the Barnett Zero Project, 2023. Accessed: Jan. 18, 2024.
- Railroad Commission of Texas. Production Data Query, 2024. Accessed: Jan. 18, 2024.
- Region, V. US Environmental Protection Agency. Washington, DC 1986.
- Qafoku, N.P.; Lawter, A.R.; Bacon, D.H.; Zheng, L.; Kyle, J.; Brown, C.F. Review of the impacts of leaking CO2 gas and brine on groundwater quality. Earth-Science Reviews 2017, 169, 69–84. [Google Scholar] [CrossRef]
- Middelburg, J.J.; Soetaert, K.; Hagens, M. Ocean alkalinity, buffering and biogeochemical processes. Reviews of Geophysics 2020, 58, e2019RG000681. [Google Scholar] [CrossRef]
- National Environmental Methods Index (NEMI). EPA Method 300.0: Determination of Inorganic Anions by Ion Chromatography, 2024. Accessed: Jan. 18, 2024.
- Koda, E.; Miszkowska, A.; Sieczka, A. Levels of organic pollution indicators in groundwater at the old landfill and waste management site. Applied Sciences 2017, 7, 638. [Google Scholar] [CrossRef]
- Shetty, A.; Goyal, A. Total organic carbon analysis in water–A review of current methods. Materials Today: Proceedings 2022, 65, 3881–3886. [Google Scholar] [CrossRef]
- Zheng, L.; Nico, P.; Spycher, N.; Domen, J.; Credoz, A. Potential impacts of CO2 leakage on groundwater quality of overlying aquifer at geological carbon sequestration sites: A review and a proposed assessment procedure. Greenhouse Gases: Science and Technology 2021, 11, 1134–1166. [Google Scholar] [CrossRef]
- Kar, S. Geochemical characteristics of mineral elements: Arsenic, fluorine, lead, nitrogen, and carbon. In Structure and functions of pedosphere; Springer, 2022; pp. 209–254.
- Grindedal, K.J. Water quality in closed-containment aquaculture systems (CCS) for Atlantic salmon post-smolt-Non-target screening of organic substances using UPLC-MS/MS. Master’s thesis, NTNU, 2018.
- Texas Commission on Environmental Quality (TCEQ). Method 1005: Analytical Method for Determining Total Petroleum Hydrocarbons (TPH) in Environmental Media, 2024. Accessed: Jan. 18, 2024.
- Liu, B.; Li, Y.; Ma, J.; Huang, L.; Chen, L. Detection of semi-volatile organic compounds (SVOCs) in surface water, soil, and groundwater in a chemical industrial park in Eastern China. Water Science and Technology 2016, 73, 1175–1189. [Google Scholar] [CrossRef]
- U.S. Environmental Protection Agency. Definition and Procedure for the Determination of the Method Detection Limit – Revision 2, 2016. Accessed: Jan. 18, 2024.
- Nwankwo, C.B.; Hoque, M.A.; Islam, M.A.; Dewan, A. Groundwater constituents and trace elements in the basement aquifers of Africa and sedimentary aquifers of Asia: medical hydrogeology of drinking water minerals and toxicants. Earth Systems and Environment 2020, 4, 369–384. [Google Scholar] [CrossRef]
Figure 1.
Main potential risks associated with CCS activities including leakage, induced fractures, and groundwater contamination.
Figure 1.
Main potential risks associated with CCS activities including leakage, induced fractures, and groundwater contamination.
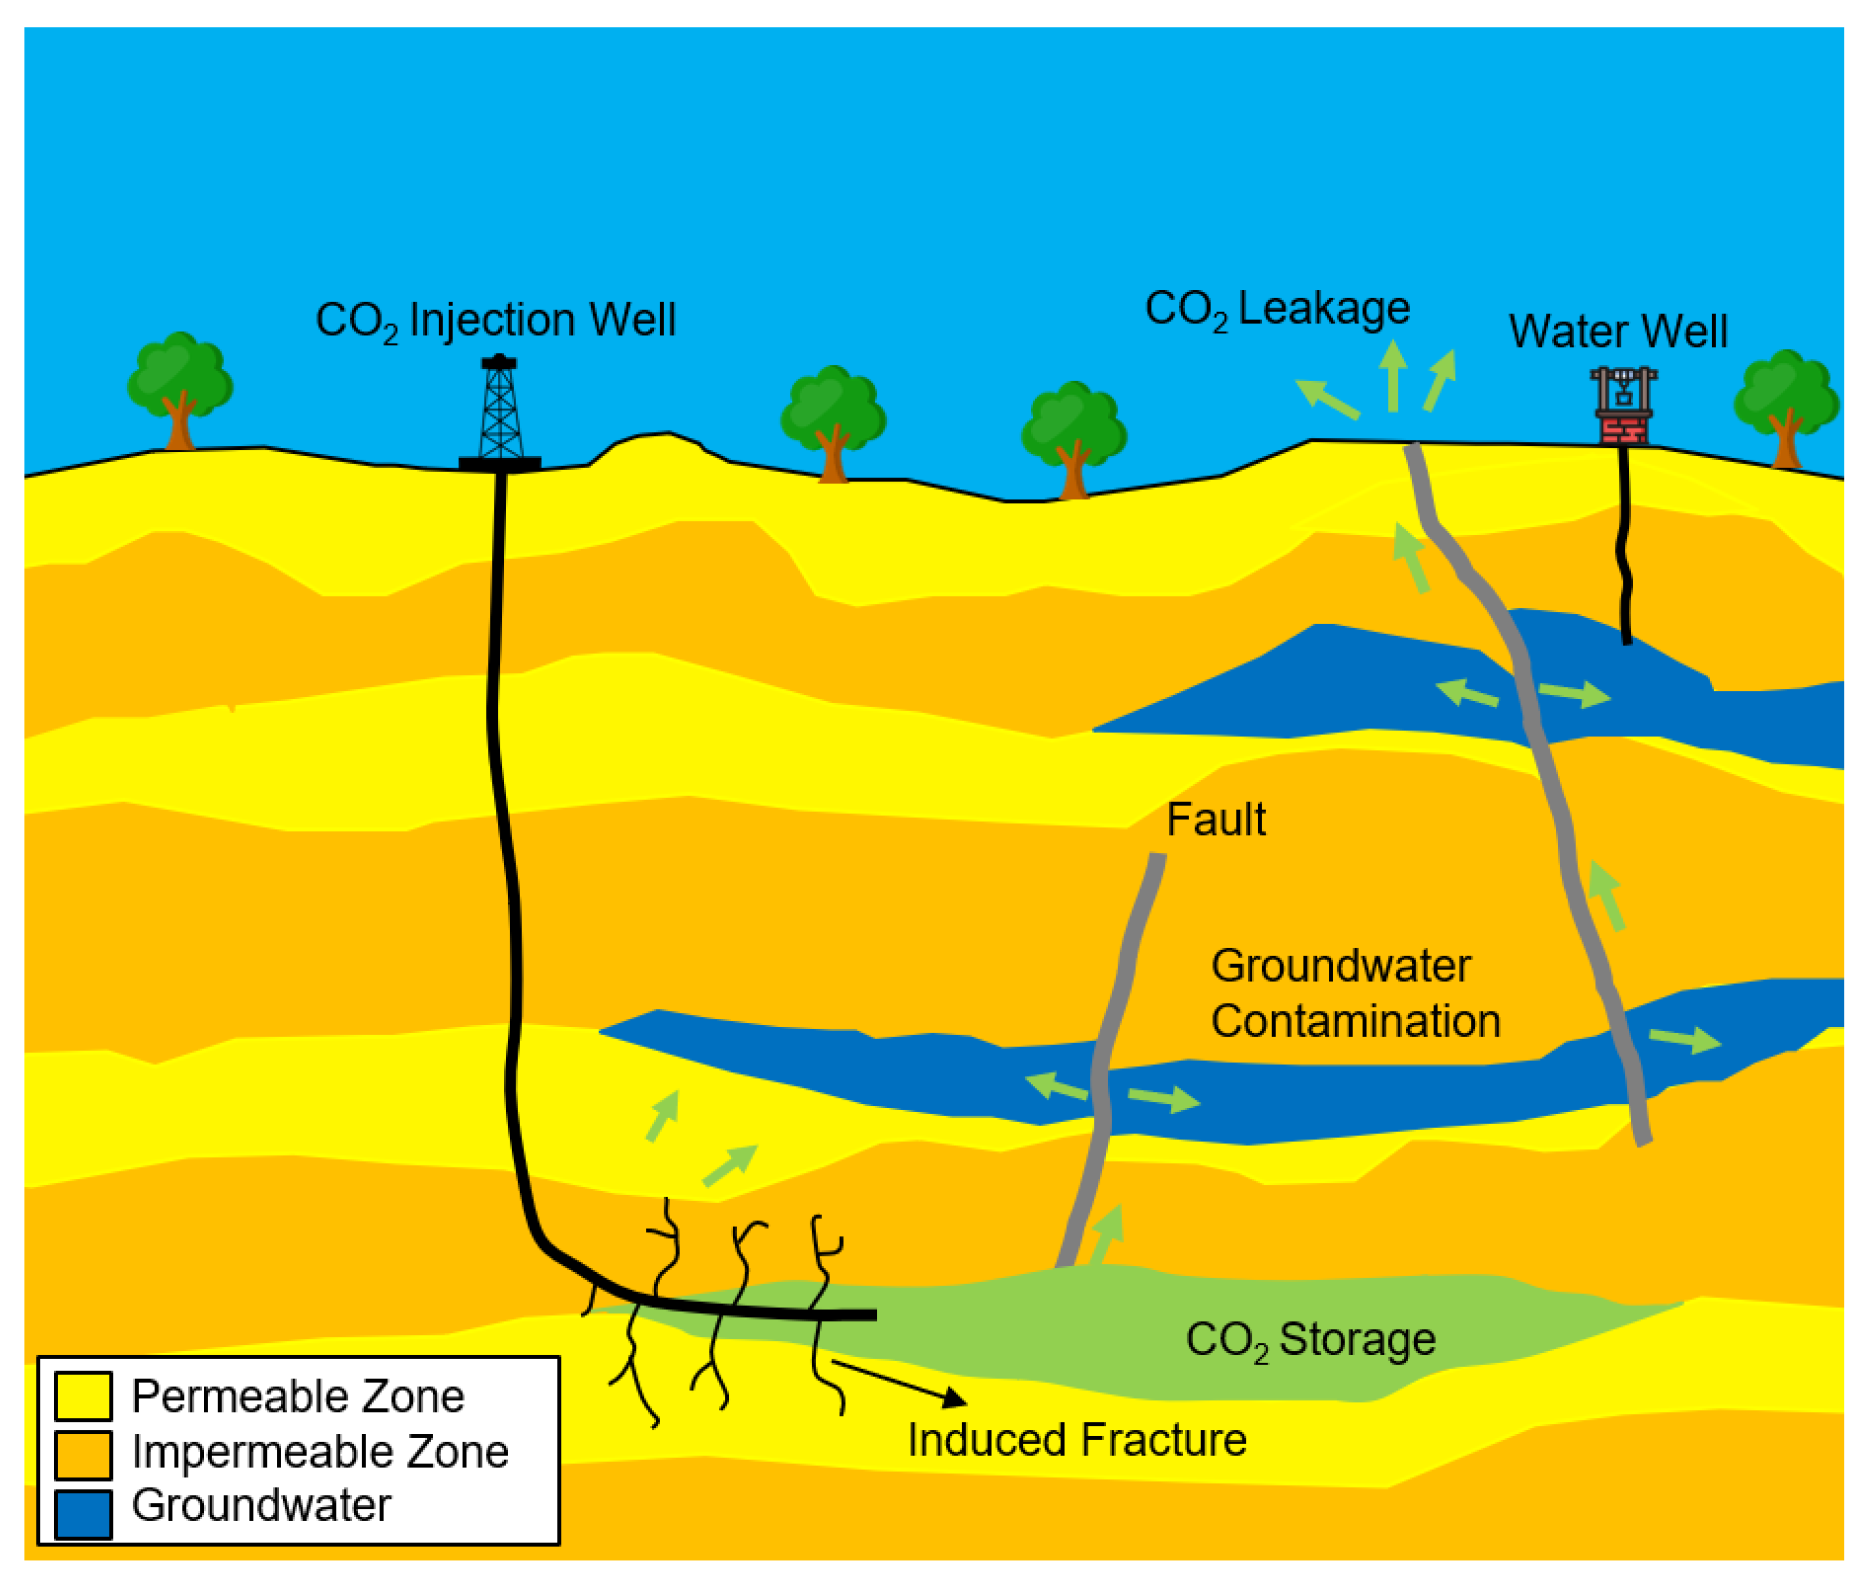
Figure 2.
(a) Wise County, located in north-central Texas; (b) Cross sections E-W and N-S Ellenburger Group formation. The Ellenburger Group formation serves as the target injection zone due to its porous and permeable carbonate reservoir properties, with the Barnett Shale acting as a low-permeability caprock to securely contain the stored [17,18].
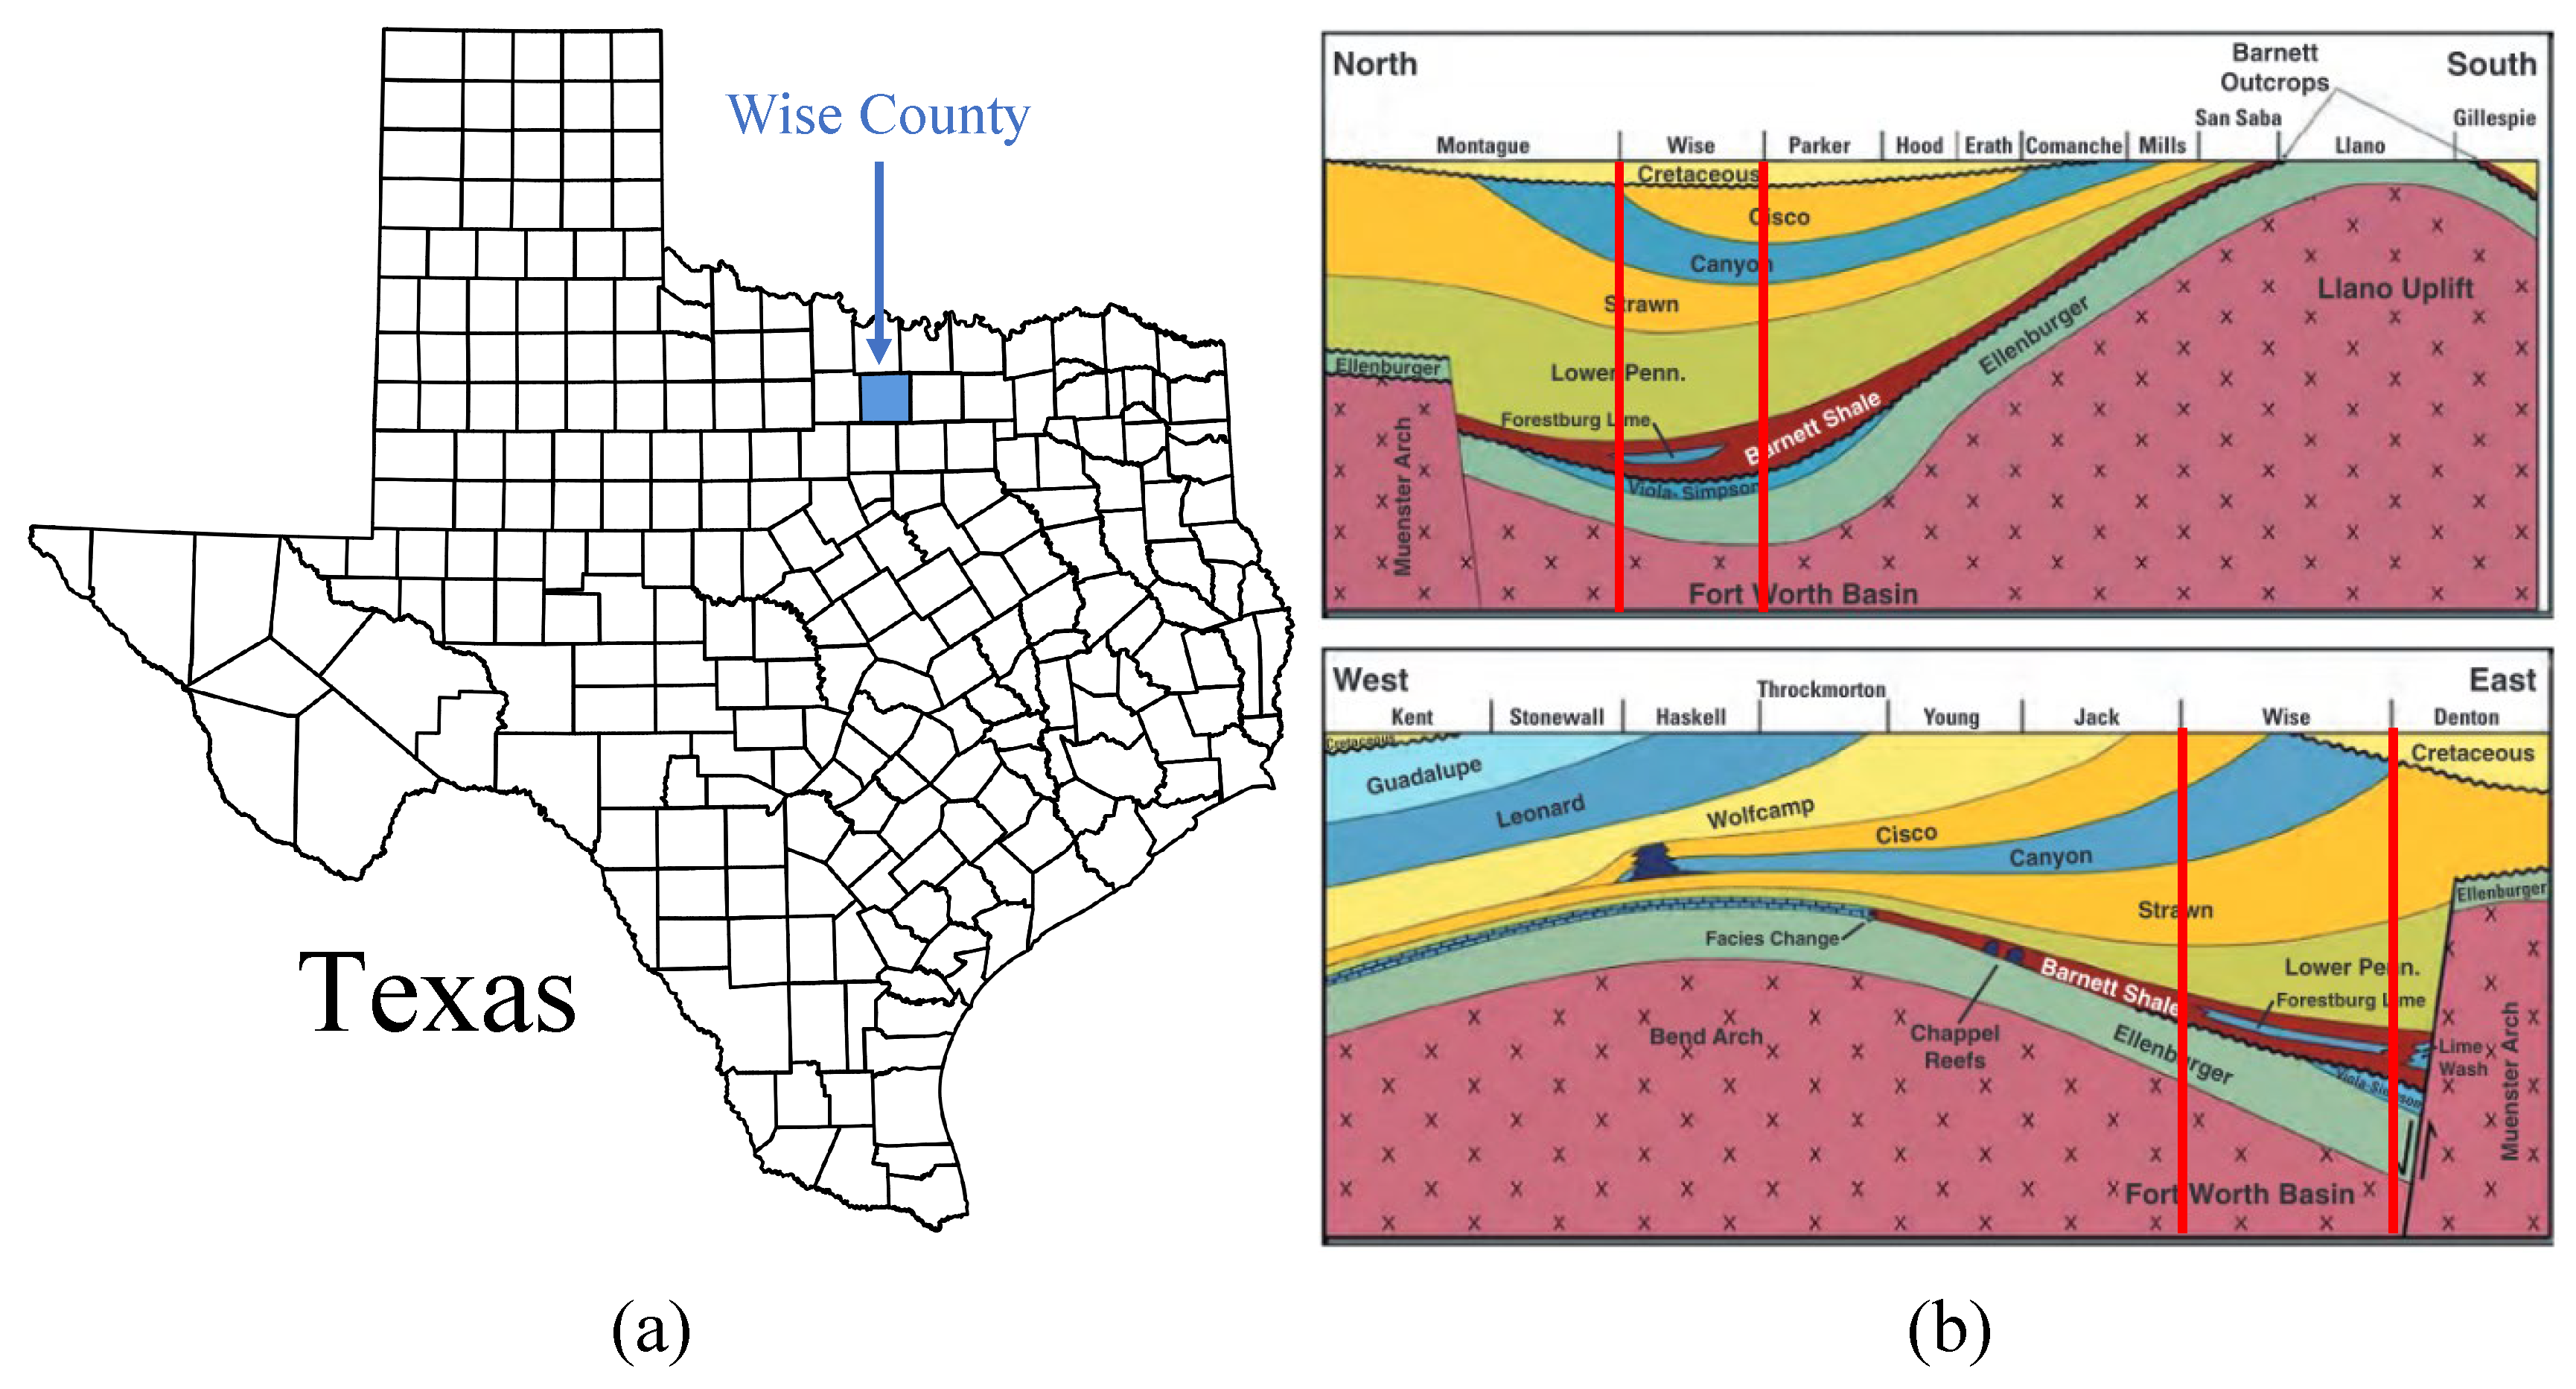
Figure 3.
Map showing the location of the injection well and gas processing plant involved in the Barnett Zero project in Wise County, Texas. This commercial CCS initiative by BKV Corporation and EnLink Midstream aims to reduce emissions from natural gas production in the Barnett Shale region. waste captured from EnLink’s Bridgeport plant is stored underground via one injection well.
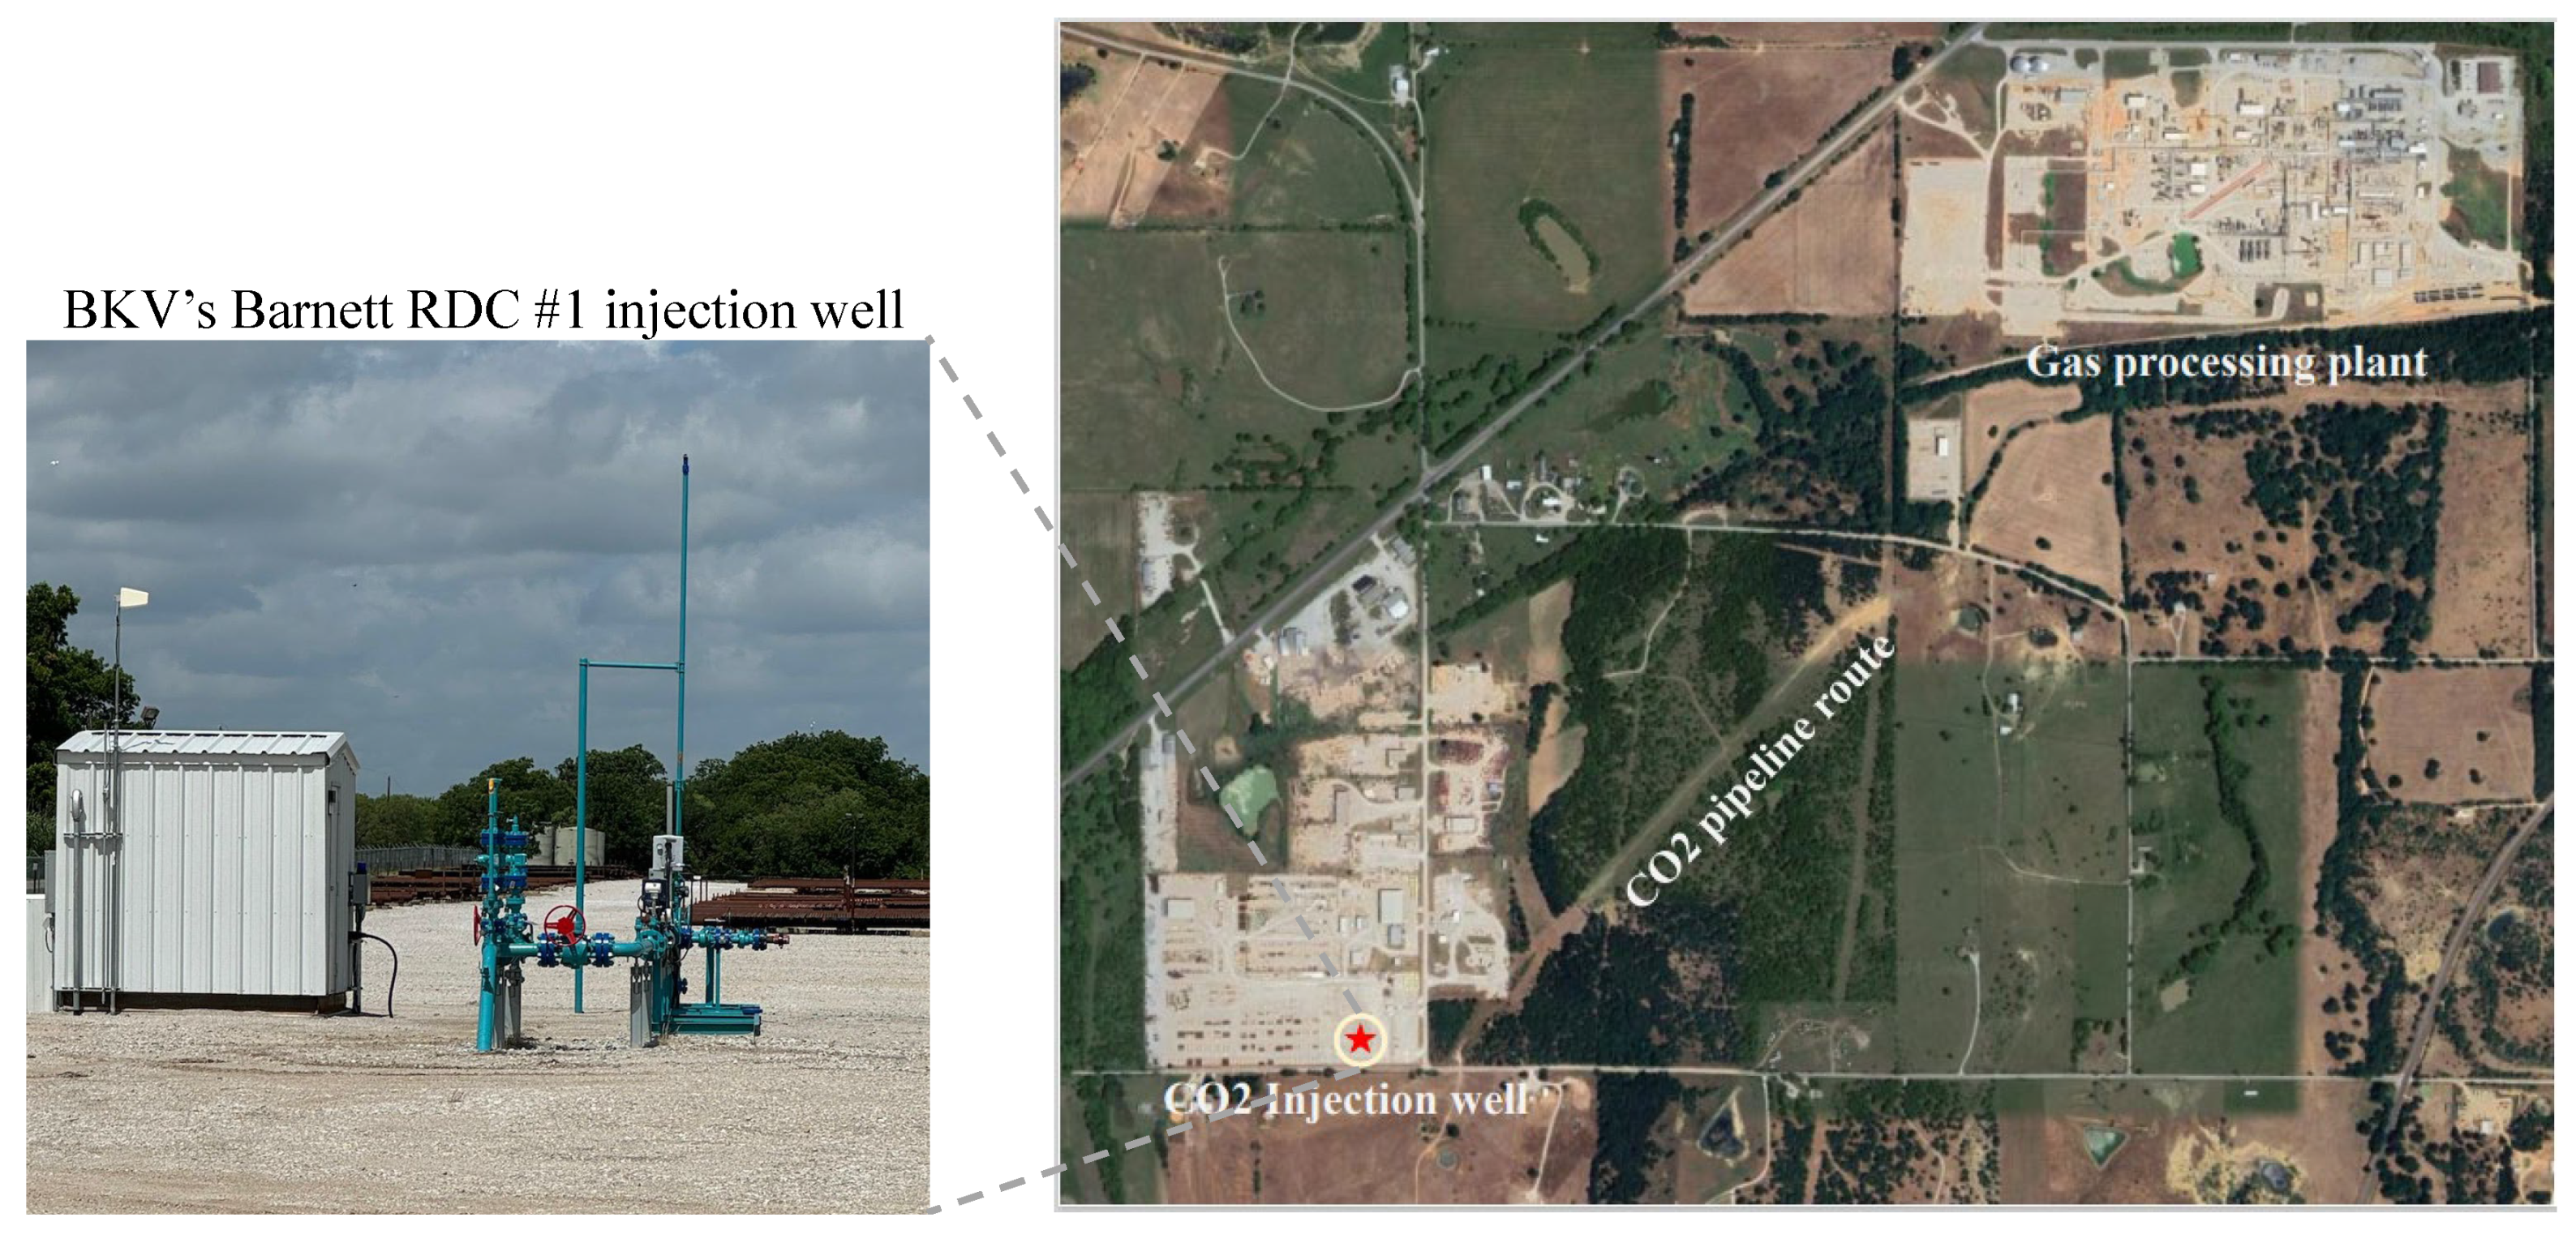
Figure 4.
Monthly injection volumes (in thousand cubic feet, MCF) for the Barnett Zero facility during late 2023 and early 2024. Injection operations commenced in November 2023, with a gradual increase in volumes observed through 2024 as the facility transitioned to full-scale operation.
Figure 4.
Monthly injection volumes (in thousand cubic feet, MCF) for the Barnett Zero facility during late 2023 and early 2024. Injection operations commenced in November 2023, with a gradual increase in volumes observed through 2024 as the facility transitioned to full-scale operation.
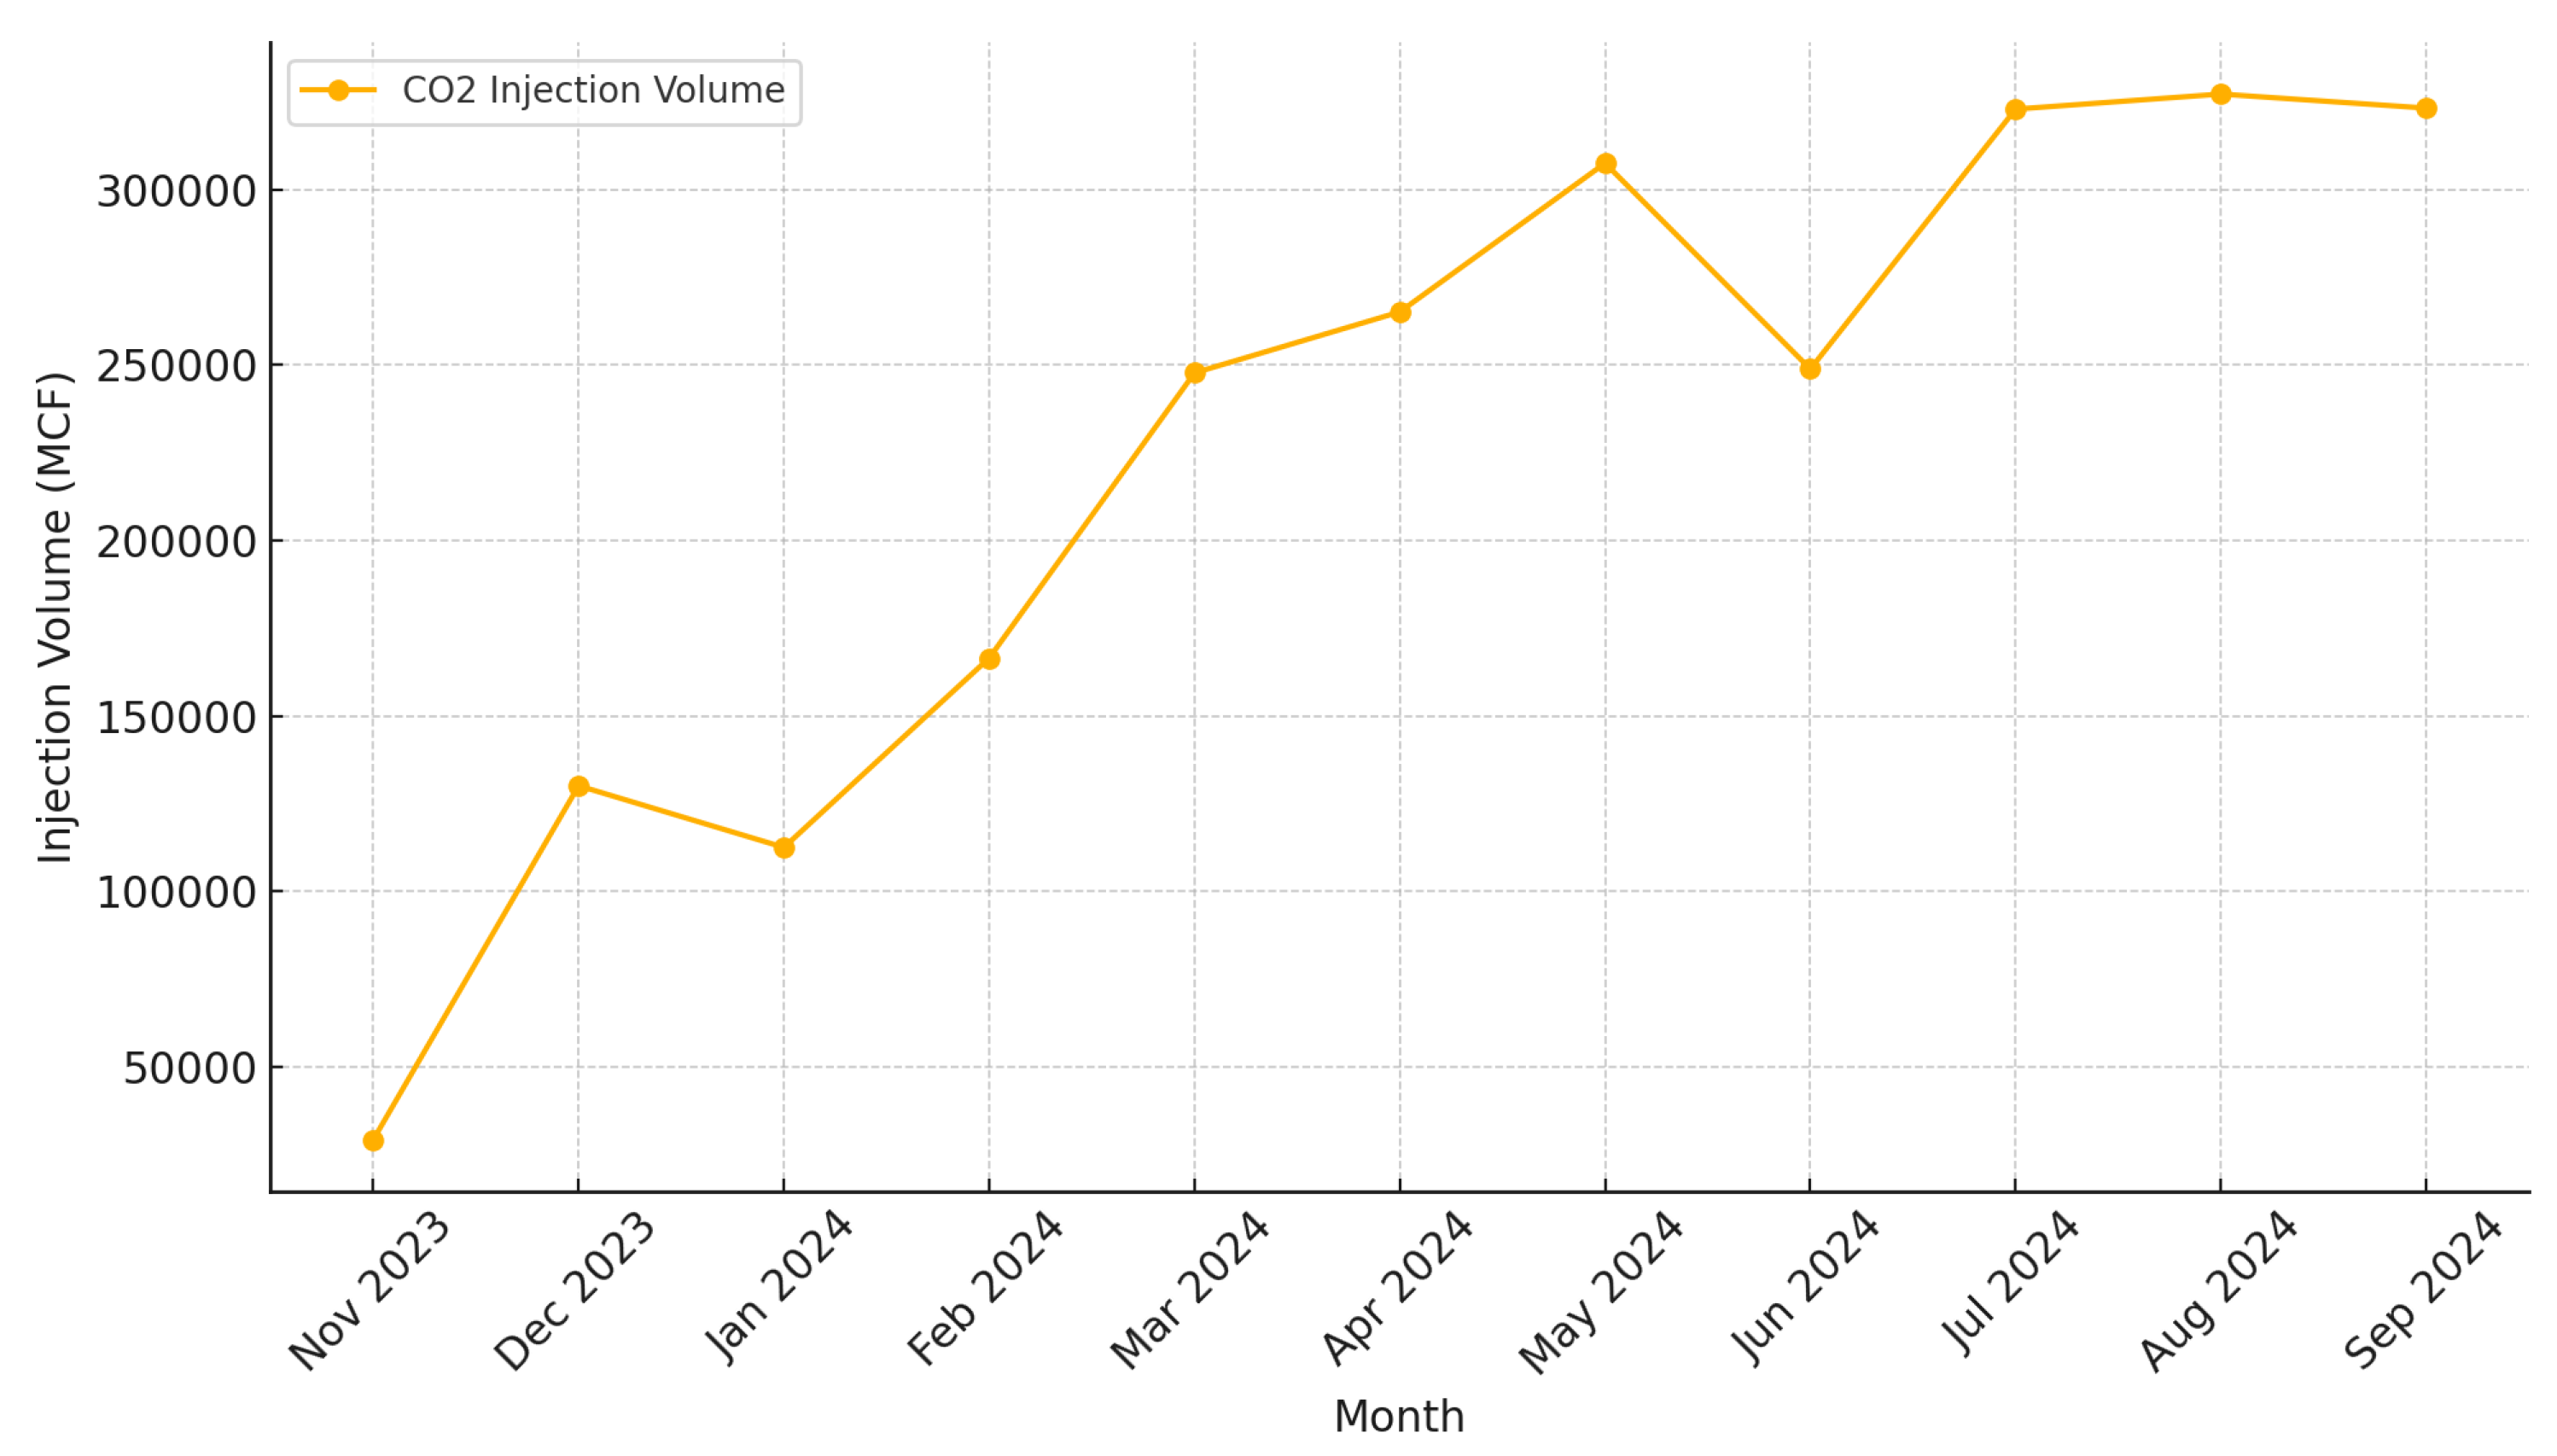
Figure 5.
(a) Locations of monitoring (blue markers) and control (green markers) wells for baseline groundwater quality assessment near the Barnett Zero CCS site; (b) Field parameters measured included pH, temperature, conductivity, and dissolved oxygen (DO) to evaluate initial groundwater conditions, following strict sample collection and handling protocols.
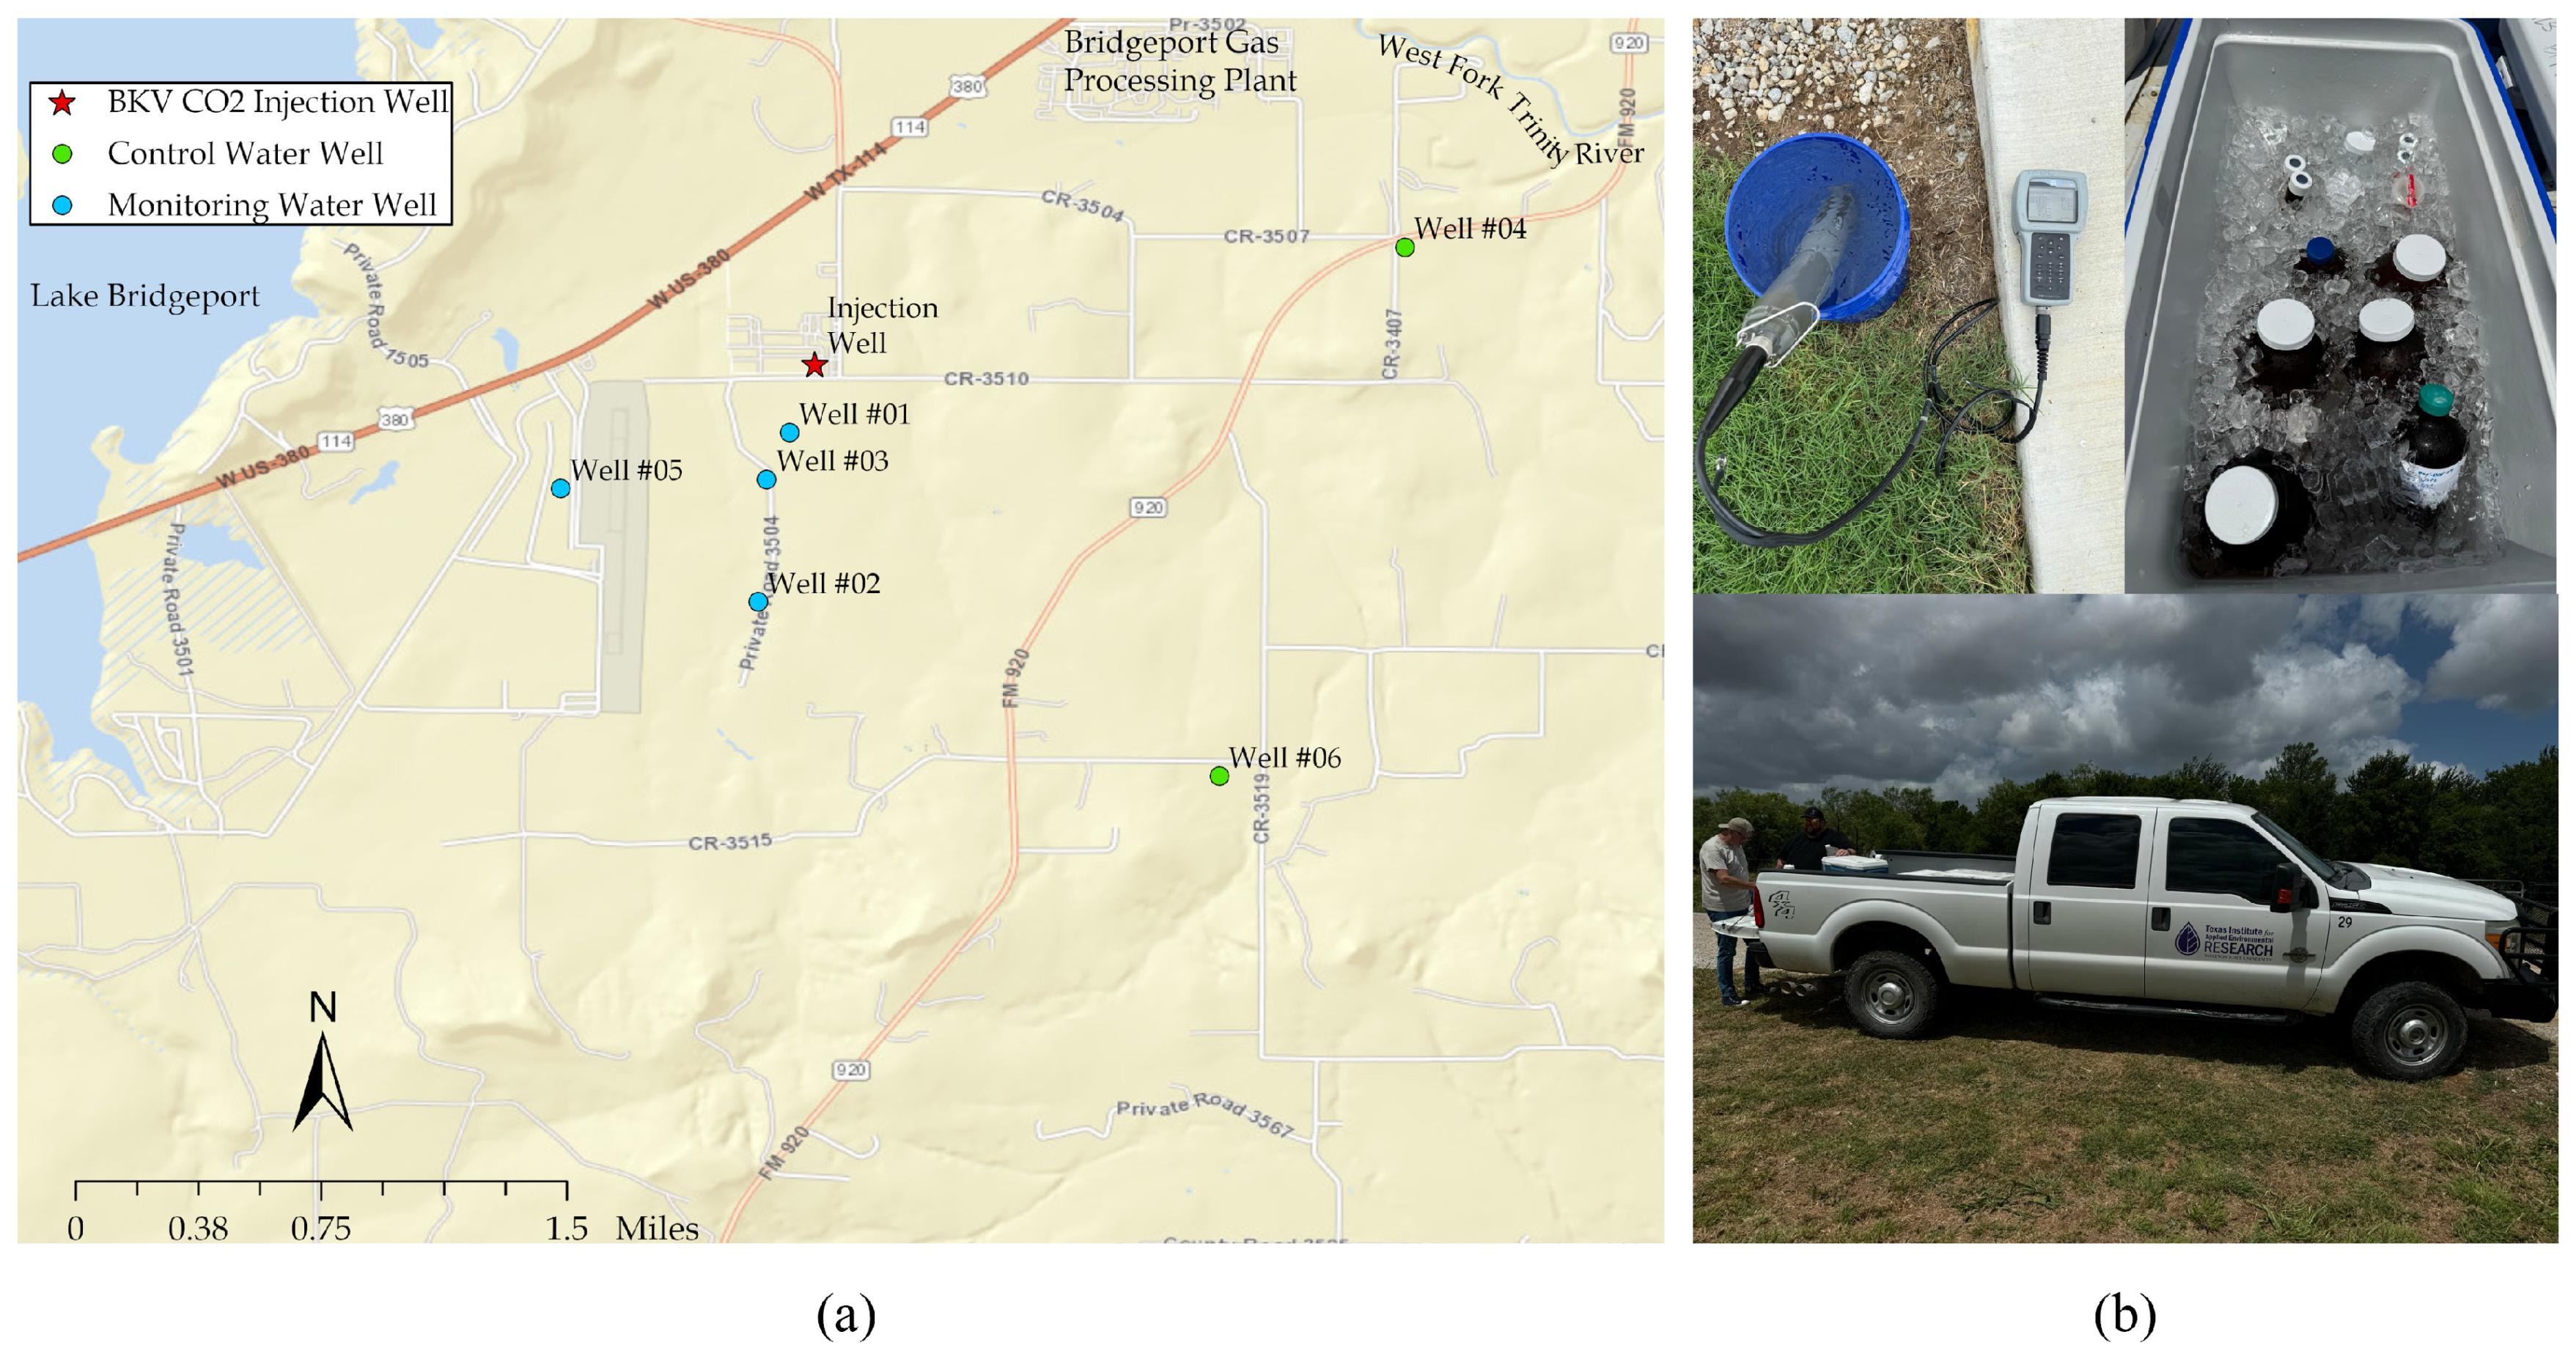
Figure 6.
Scatter plot showing the relationship between well depth (in feet) and the distance to the injection well (in miles). Each well is labeled with its corresponding Well ID.
Figure 6.
Scatter plot showing the relationship between well depth (in feet) and the distance to the injection well (in miles). Each well is labeled with its corresponding Well ID.
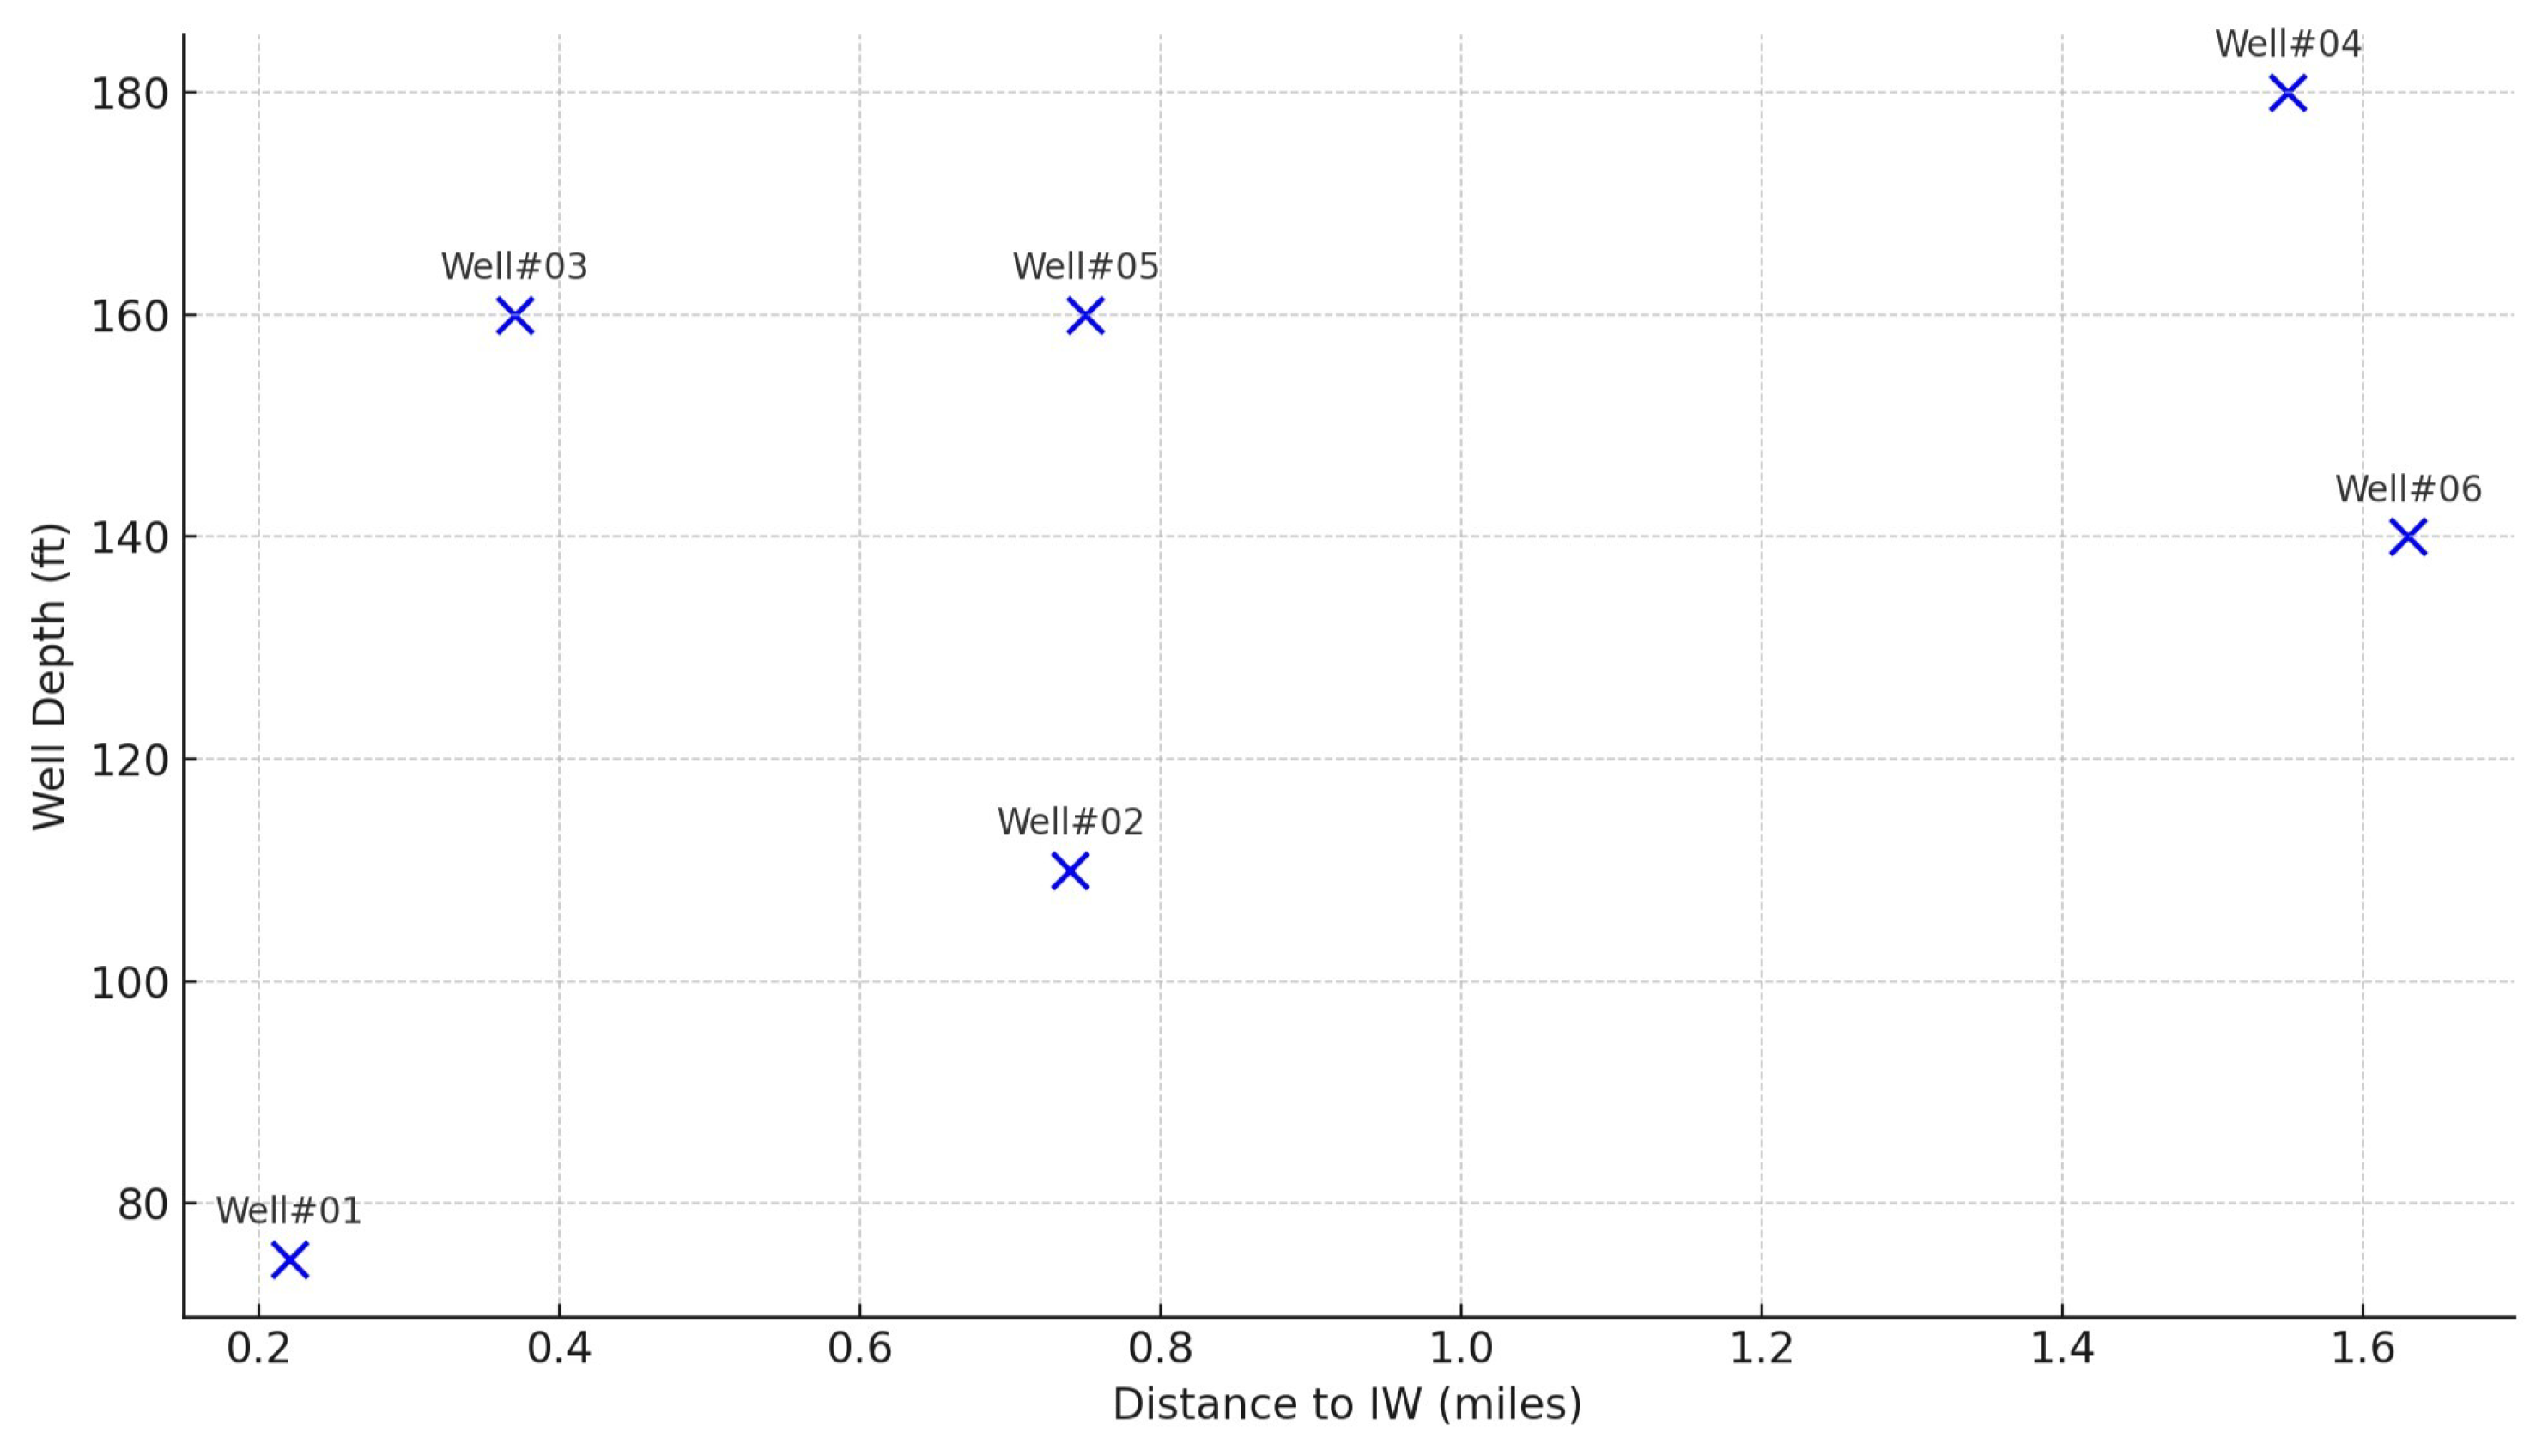
Figure 7.
Comparison of key water quality parameters (temperature, conductivity, dissolved oxygen, pH) across six wells (Well#1 to Well#6.
Figure 7.
Comparison of key water quality parameters (temperature, conductivity, dissolved oxygen, pH) across six wells (Well#1 to Well#6.
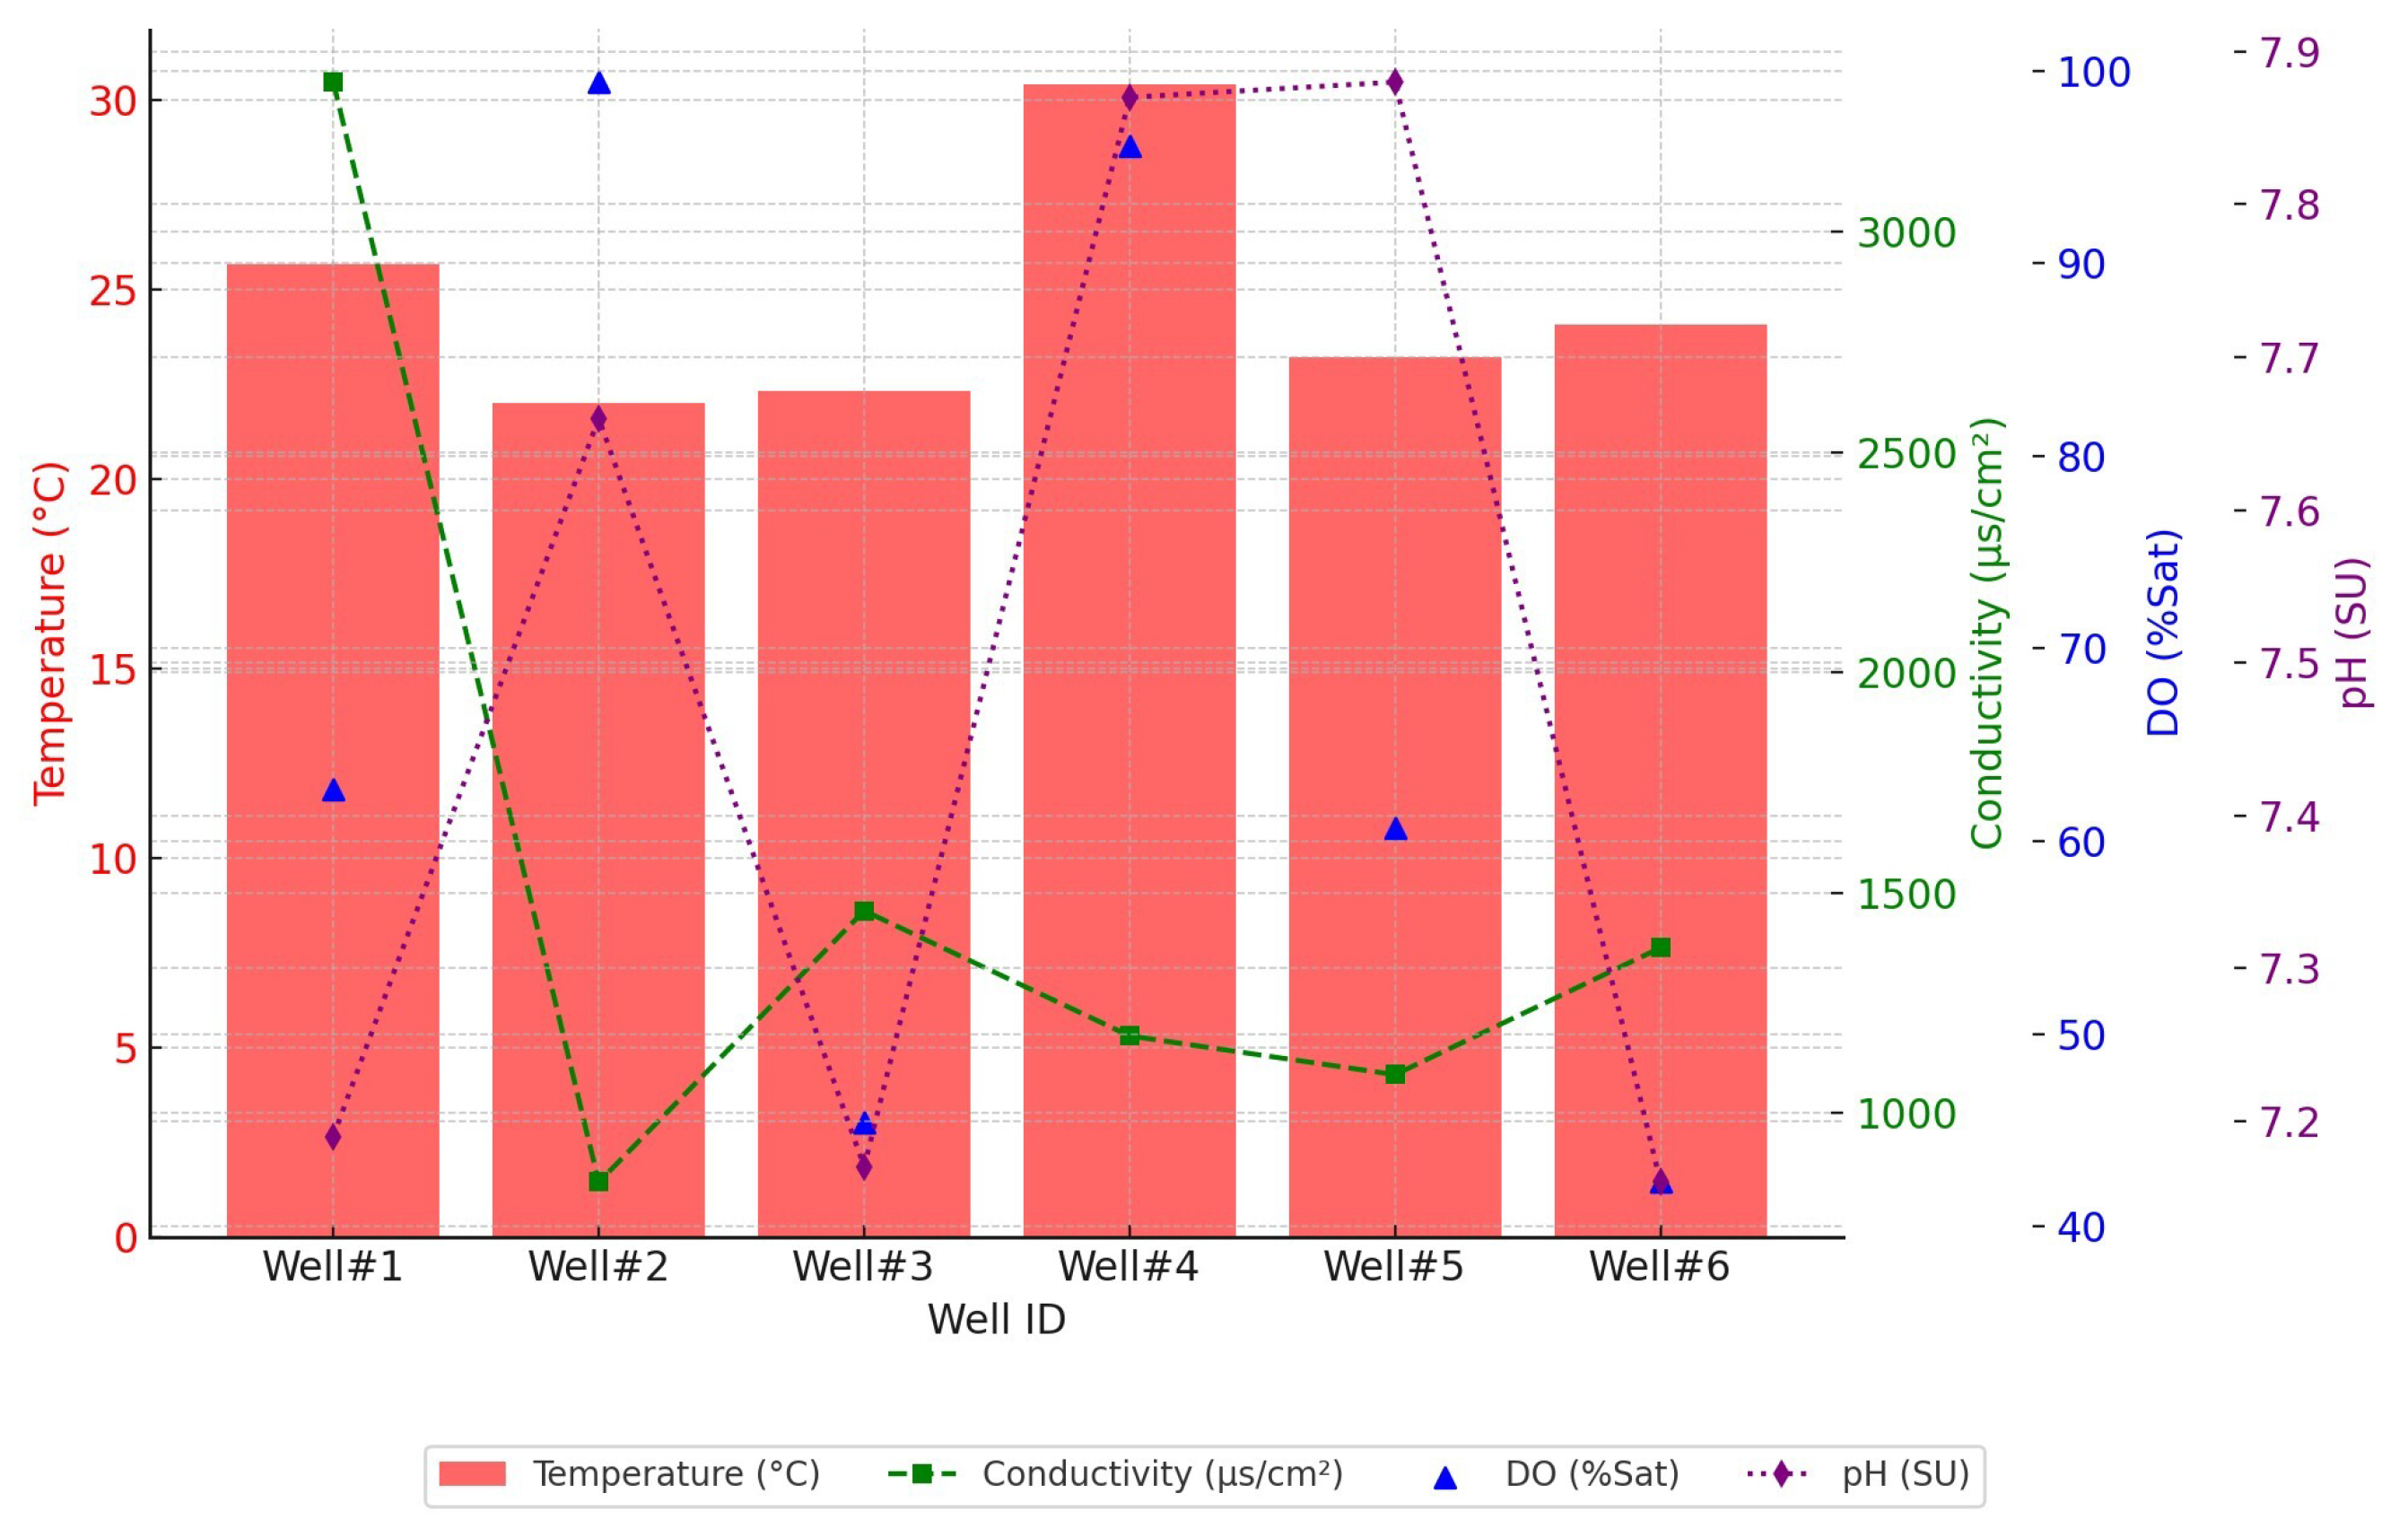
Figure 8.
Concentration of major ions across wells.
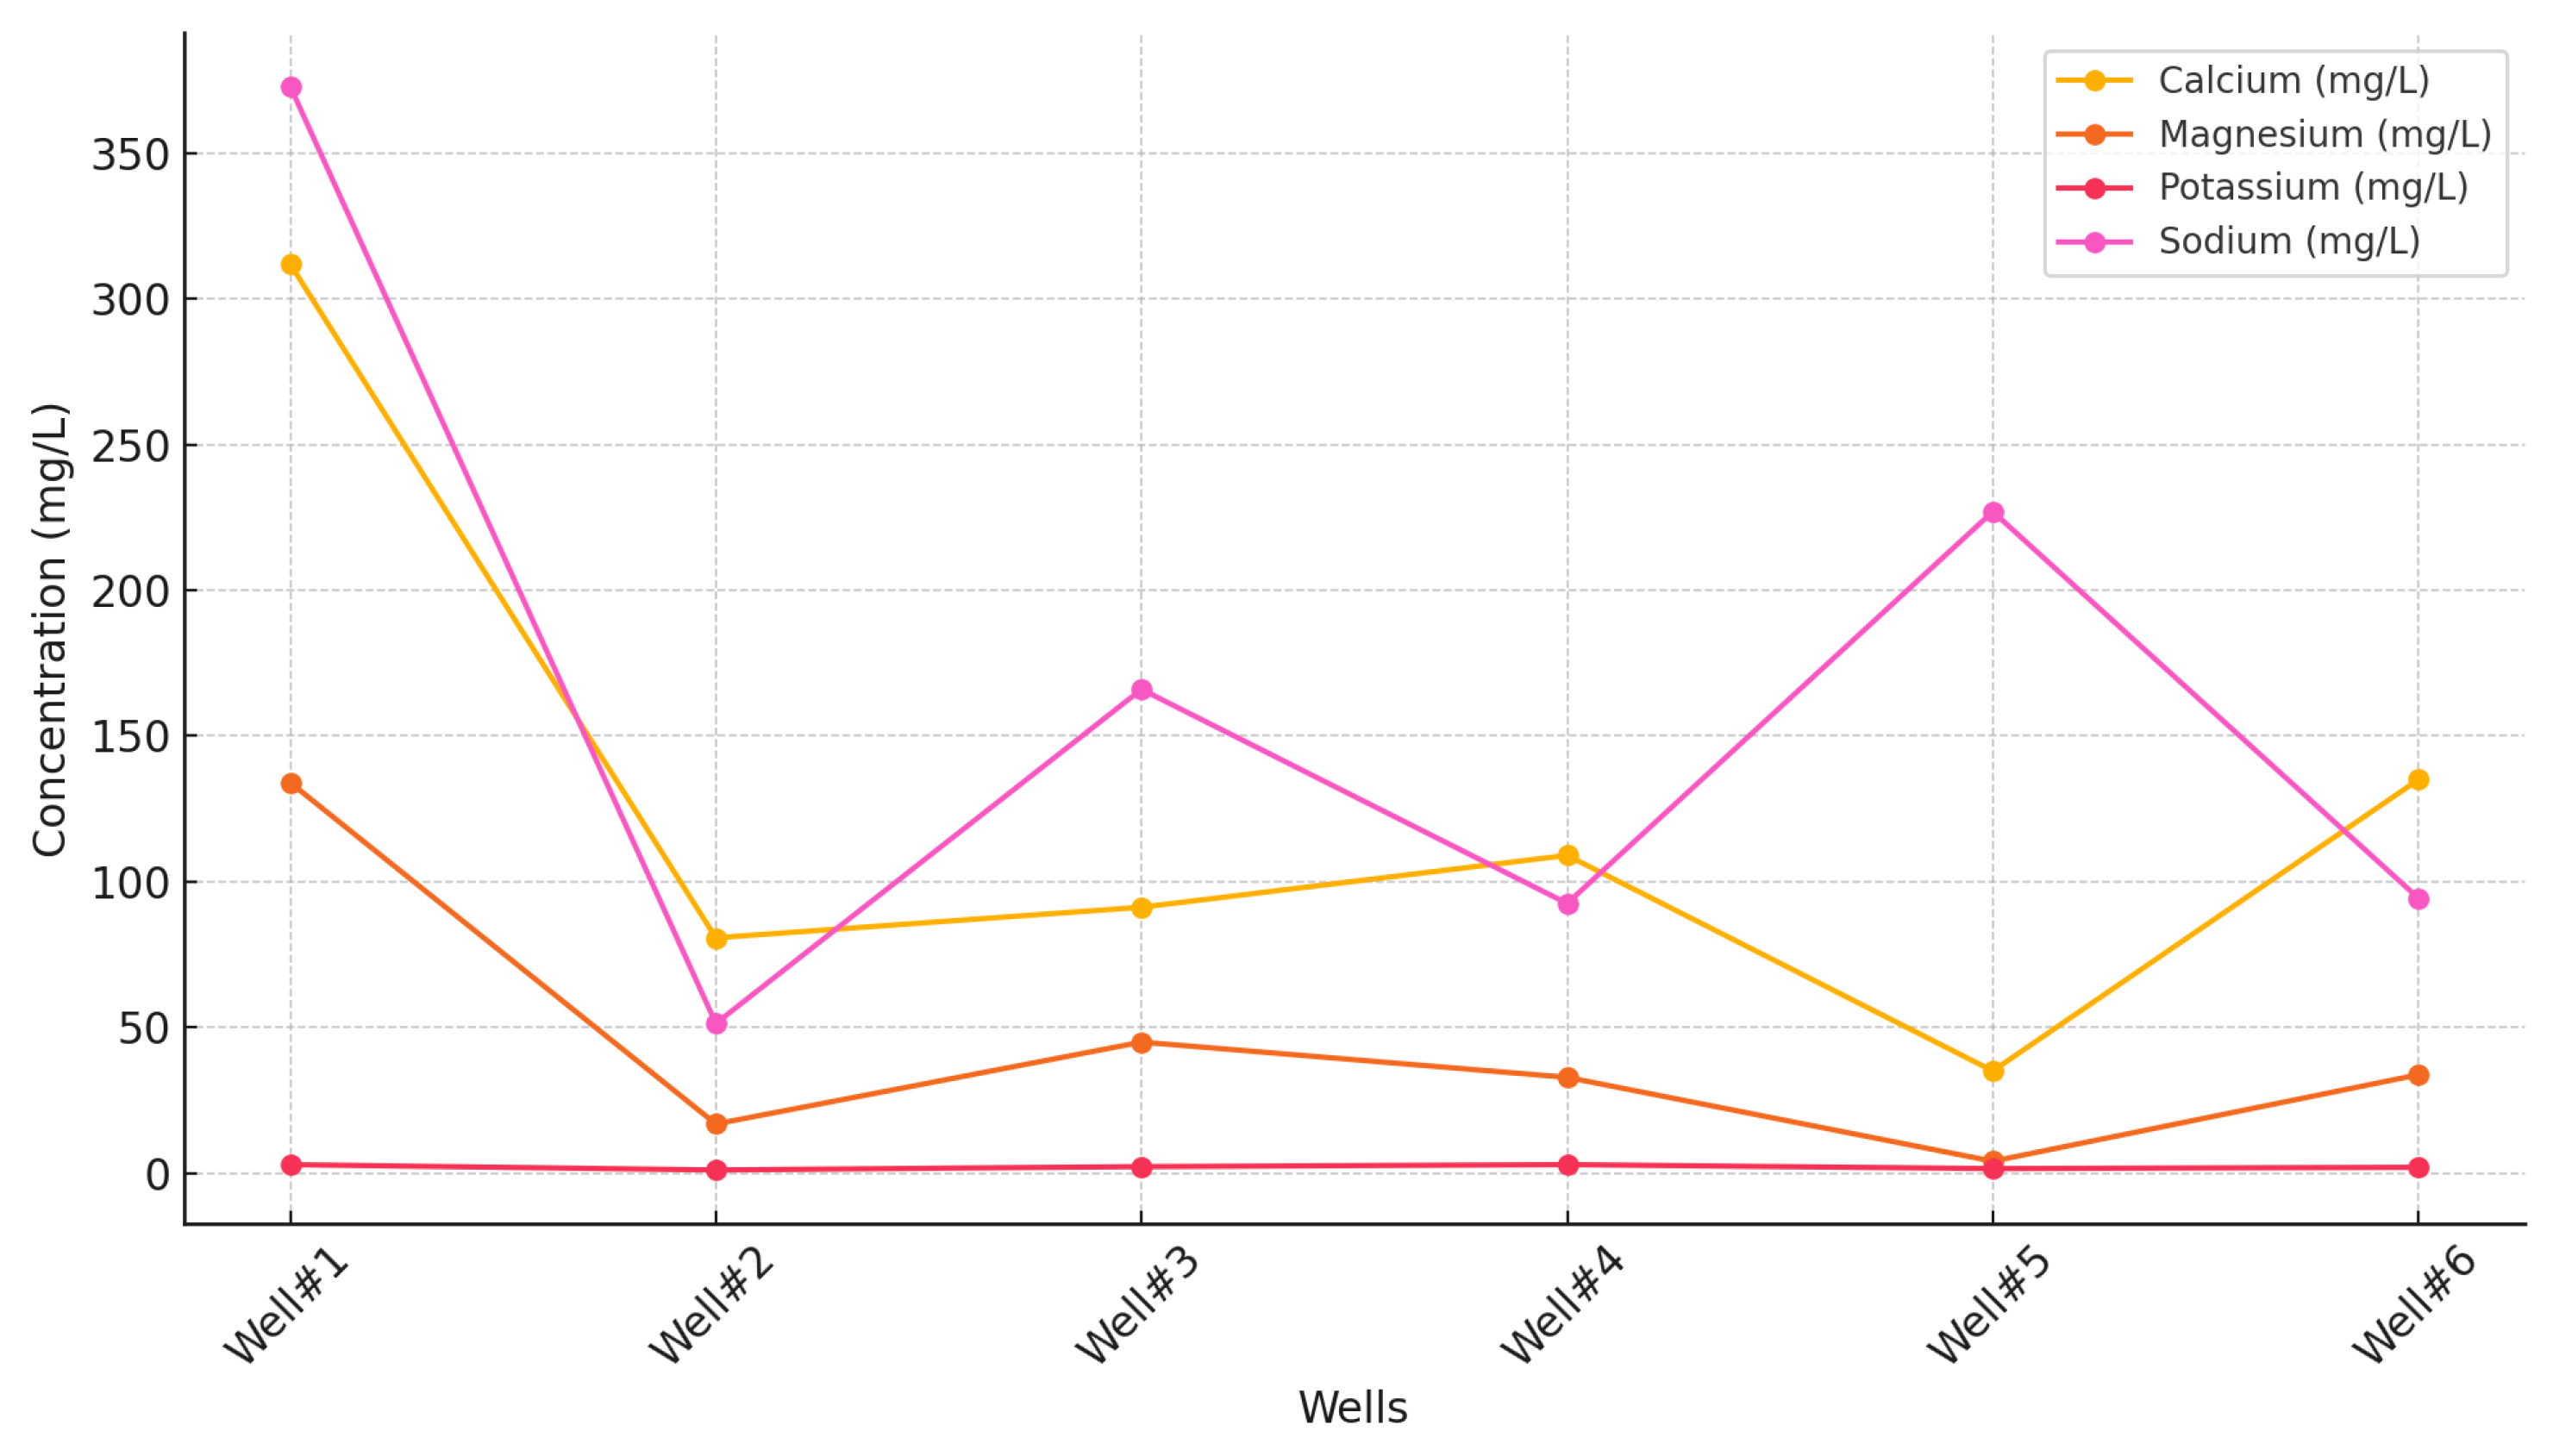
Figure 9.
Dissolved Organic Carbon (DOC) and Total Organic Carbon (TOC) levels across sampled wells.
Figure 9.
Dissolved Organic Carbon (DOC) and Total Organic Carbon (TOC) levels across sampled wells.
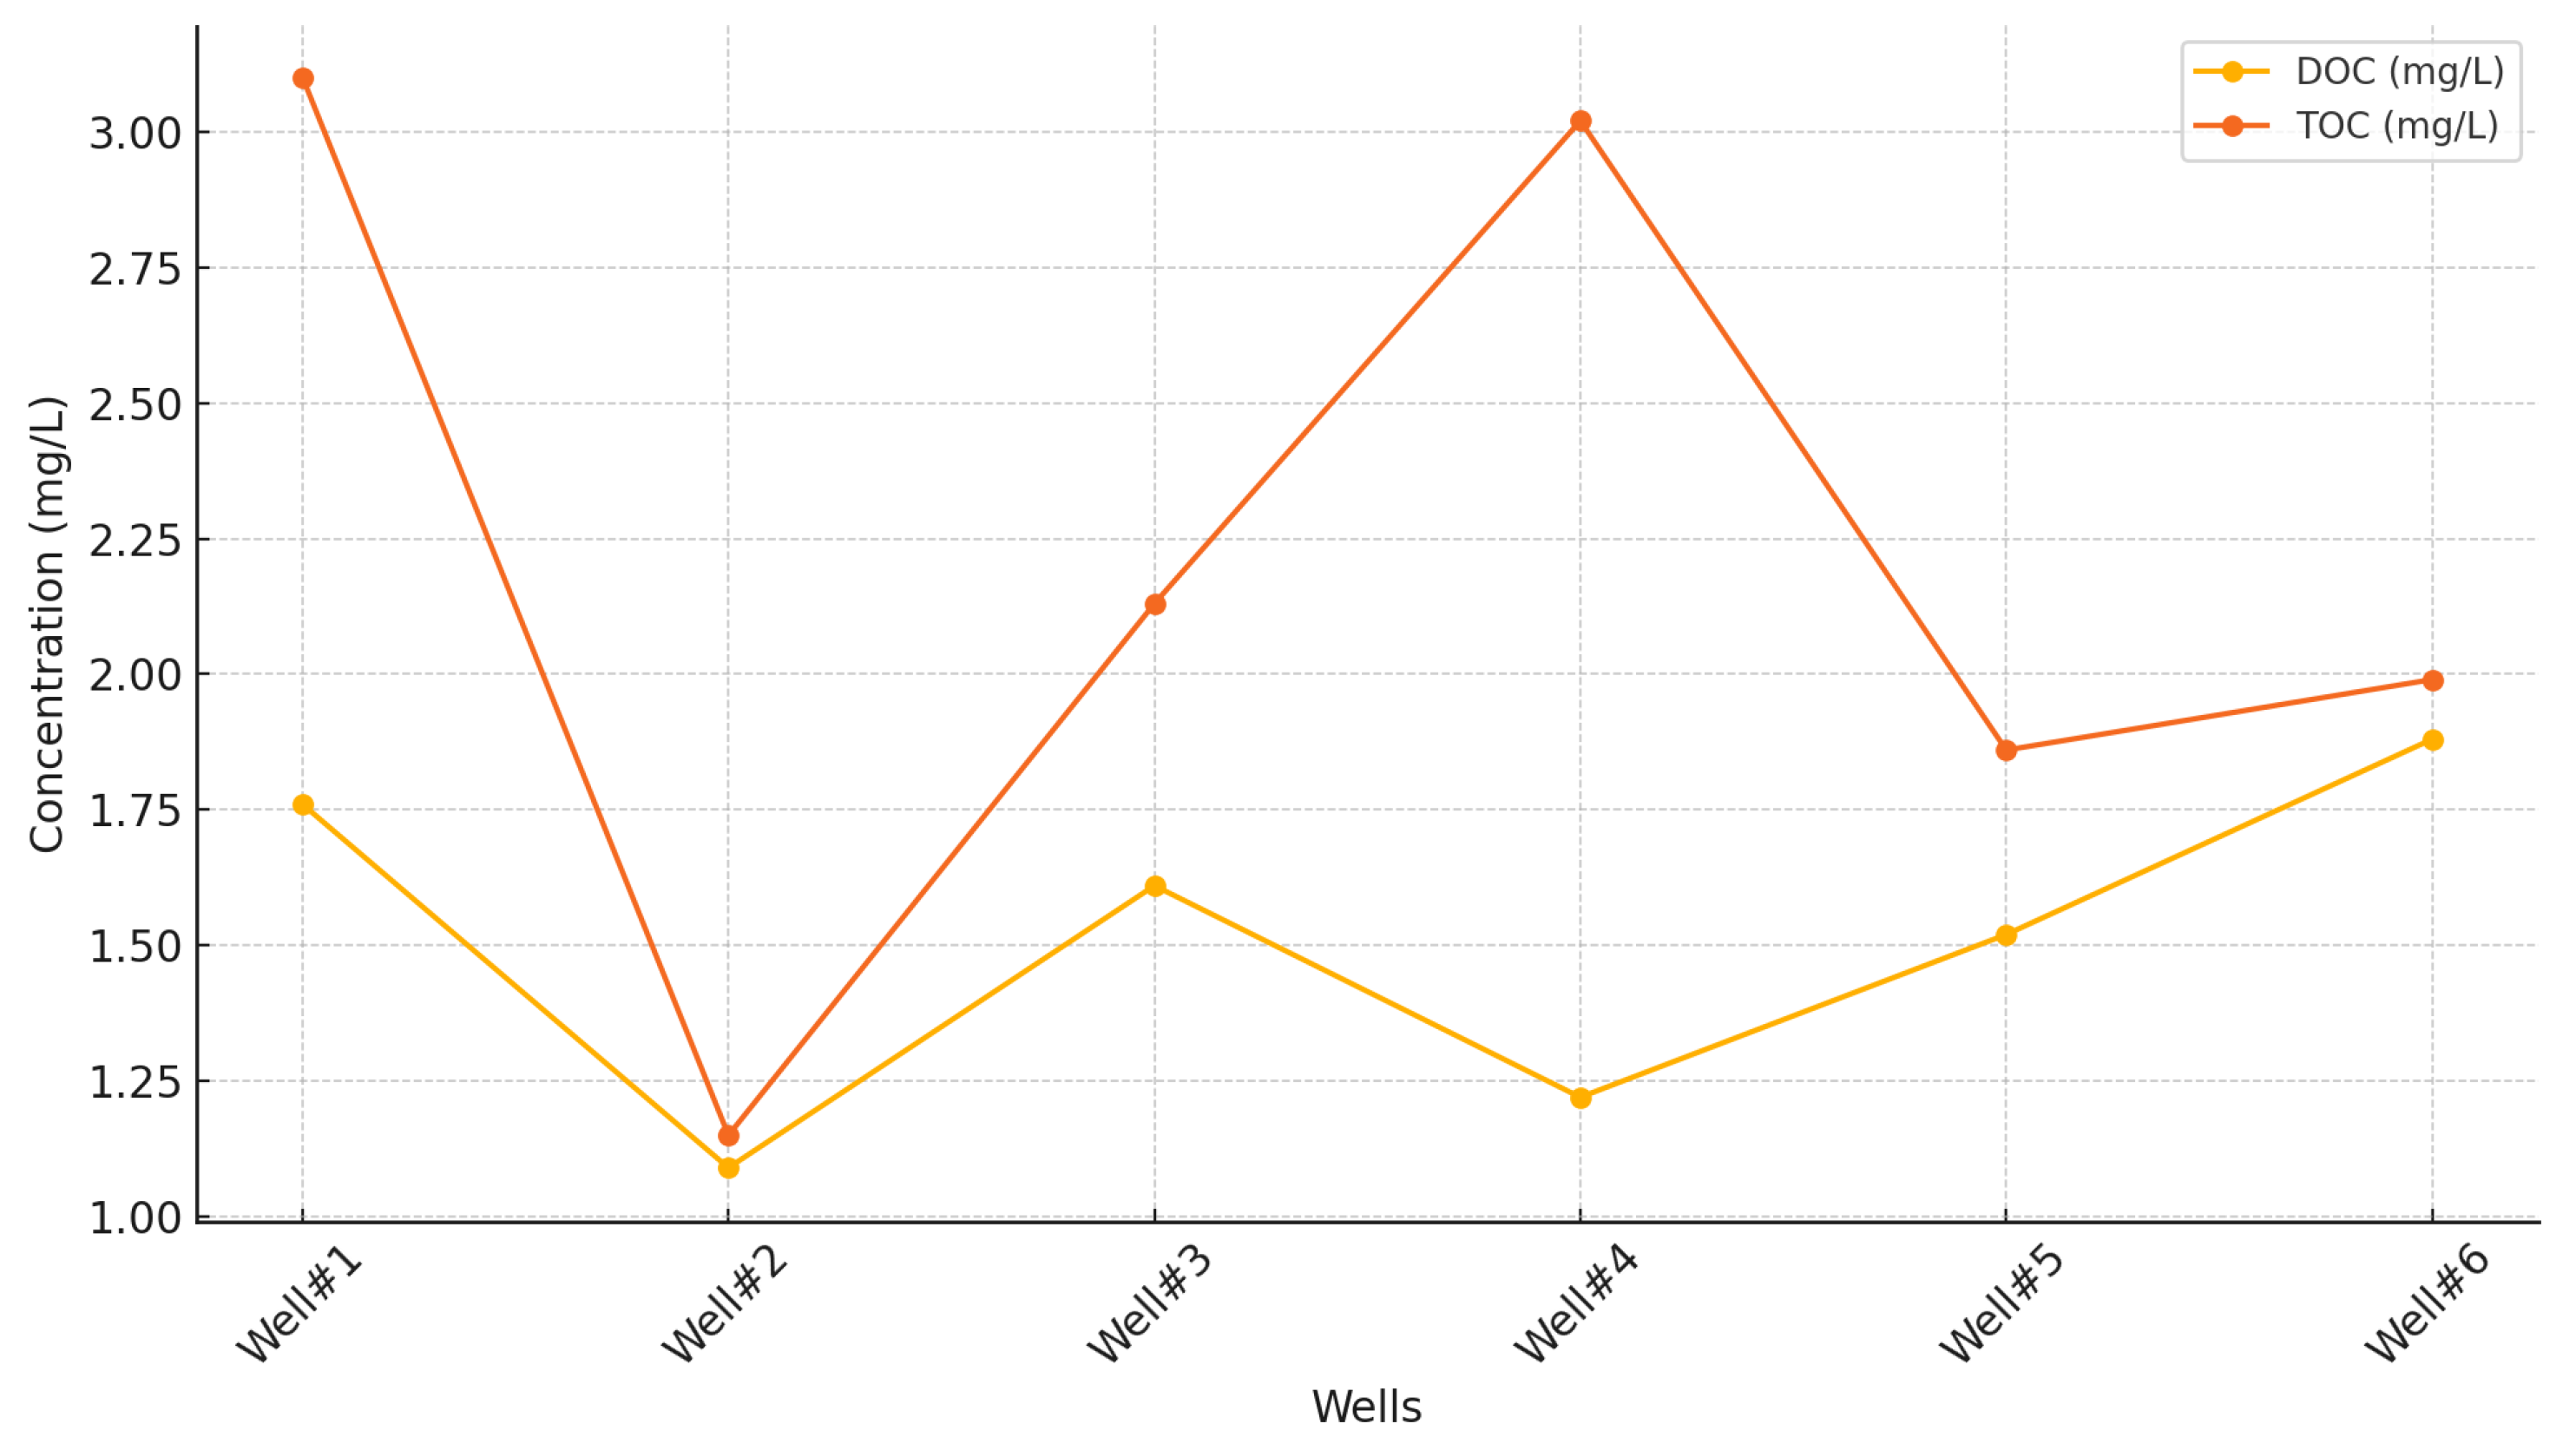
Figure 10.
Heavy metal concentrations across the wells.
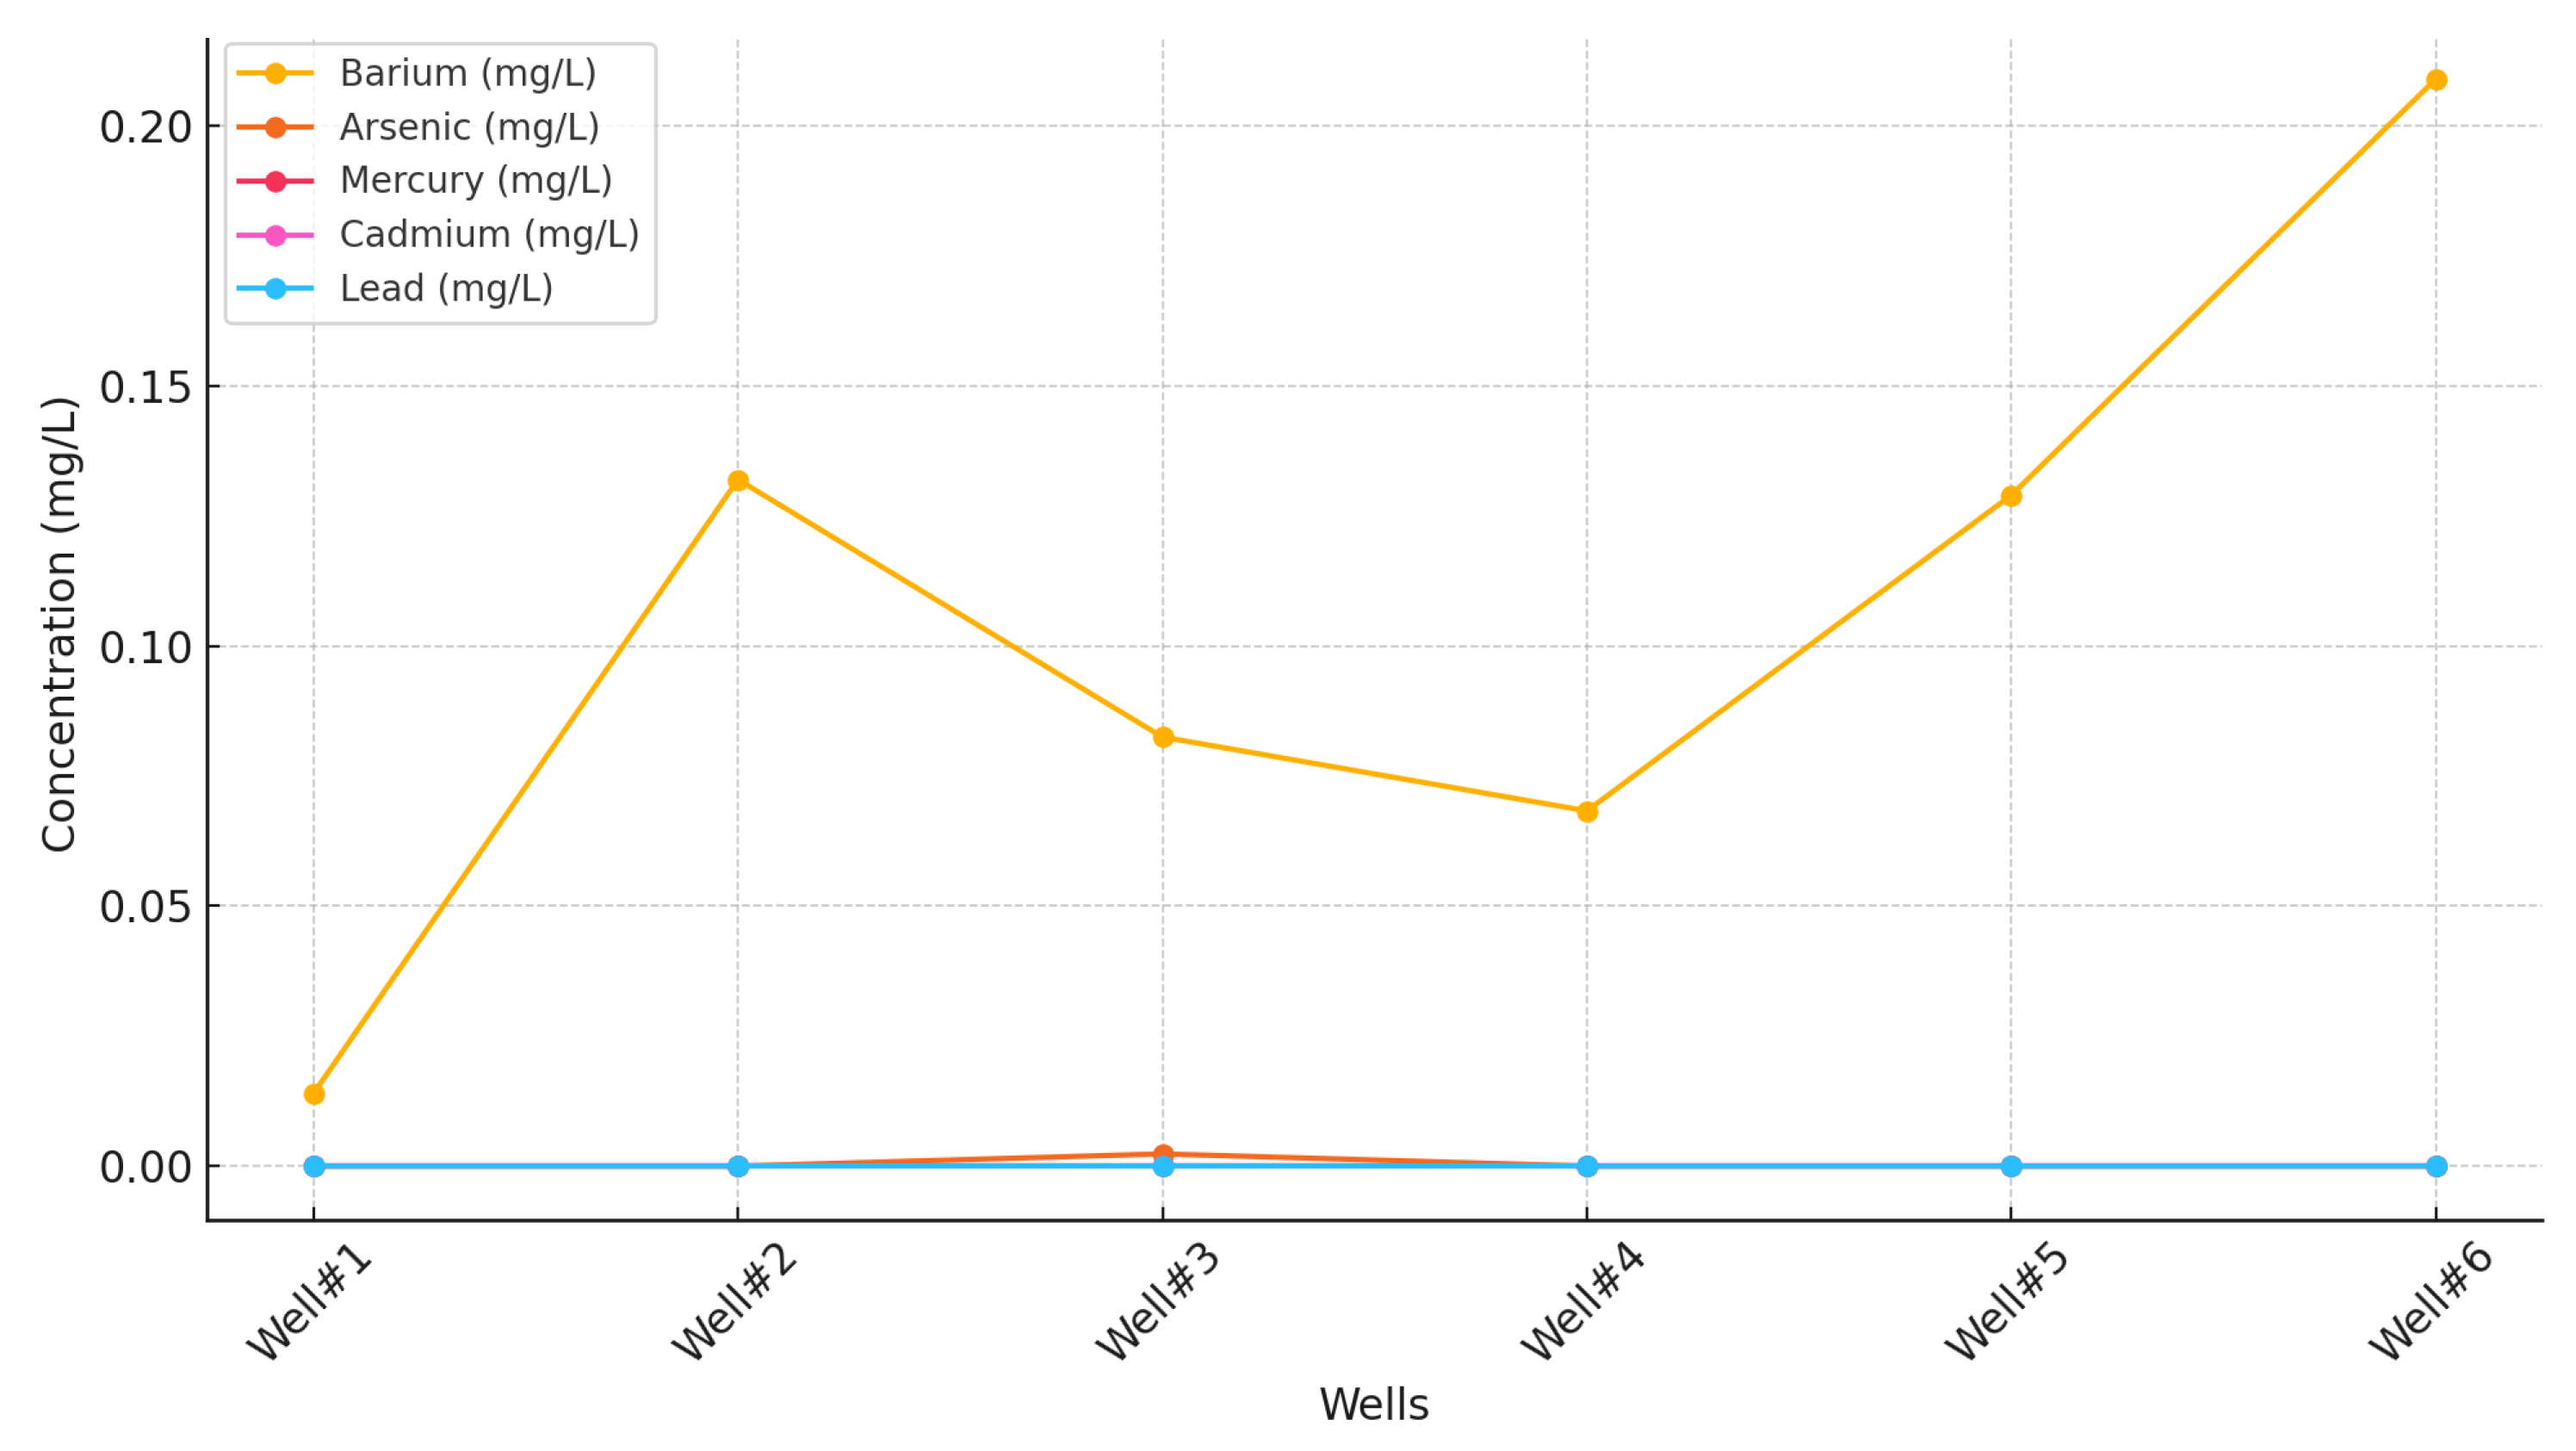

Table 1.
Summary of laboratory tests performed on groundwater samples to monitor potential impacts from leakage or CCS activities. The analyses are categorized into major ion concentrations, organic carbon levels, heavy metal presence, and organic contaminant detection. Each test helps to detect contamination, geochemical shifts, or evidence of migration.
| Category | Test Name | Description |
|---|---|---|
| Major Ion Analyses | Hardness, Total SM2340B-2011 | Measures the total hardness of water, expressed as calcium carbonate (CaCO3). |
| Anions by SW9056A | Analyzes various anions, such as chloride and sulfate, in the water sample. | |
| Alkalinity by -2011 | Assesses the ability of water to neutralize acids, indicating buffering capacity. | |
| Organic Carbon Analyses | Dissolved Organic Carbon by SW9060A | Quantifies organic carbon present in dissolved form in the water sample. |
| Total Organic Carbon by E415.1 | Measures total organic carbon in both dissolved and particulate forms. | |
| Heavy Metal Analyses | Mercury by SW7470A | Detects mercury levels in the sample, important for assessing toxicity. |
| ICP-MS Metals by SW6020A | Utilizes Inductively Coupled Plasma Mass Spectrometry to analyze trace metals. | |
| Organic Contaminant Analyses | Low-level Texas TPH by TX1005 | Measures low concentrations of Total Petroleum Hydrocarbons (TPH) in water. |
| Low-Level Semivolatiles by 8270D | Detects low levels of semivolatile organic compounds (SVOCs) in the sample. | |
| Low-Level Volatiles by SW8260C | Analyzes low levels of volatile organic compounds (VOCs) in the sample. |
Disclaimer/Publisher’s Note: The statements, opinions and data contained in all publications are solely those of the individual author(s) and contributor(s) and not of MDPI and/or the editor(s). MDPI and/or the editor(s) disclaim responsibility for any injury to people or property resulting from any ideas, methods, instructions or products referred to in the content. |
© 2025 by the authors. Licensee MDPI, Basel, Switzerland. This article is an open access article distributed under the terms and conditions of the Creative Commons Attribution (CC BY) license (http://creativecommons.org/licenses/by/4.0/).
Copyright: This open access article is published under a Creative Commons CC BY 4.0 license, which permit the free download, distribution, and reuse, provided that the author and preprint are cited in any reuse.


