Submitted:
25 January 2025
Posted:
27 January 2025
You are already at the latest version
Abstract
The DNA damage response (DDR) is susceptible to occurrence during the reprogram-ming process induced by Yamanaka factors, which constrains the generation and ap-plication of induced pluripotent stem cells (iPSCs). The present study demonstrates that the knockdown (KD) of MBD3, a member of the nucleosome remodeling and deacetylase (NuRD) complex, reduced DDR during the early stages of bovine somatic cell re-programming, and enhanced pluripotency and in vitro differentiation ability of bovine iPSCs. MBD3 KD reduced the generation of reactive oxygen species (ROS) by upregulated of HIF1A expression, which mitigate DNA damage and apoptosis induced by oxidative stress in bovine iPSCs. Conversely, the overexpression of MBD3 increased DNA damage throughout the reprogramming process. In conclusion, our results demonstrate that the knockdown of MBD3 during reprogramming can reduce DNA damage and promote the generation of bovine iPSCs with enhanced pluripotency and in vitro differentiation ability.
Keywords:
bovine iPSCs
; MBD3
; pluripotency
; DNA damage
; in vitro differentiation
; ROS
; HIF1A
1. Introduction
In 2006, Takahashi and Yamanaka discovered that somatic cells could be reprogrammed to induced pluripotent stem cells (iPSCs) that exhibited the identical characteristics of embryonic stem cells (ESCs) by ectopic expression of four different transcription factors, originally Oct4, Sox2, Klf4 and Myc [1]. Understanding the molecular mechanisms that regulate the pluripotency and self-renewal of iPSCs is critical for regenerative medicine. Reprogramming requires major epigenetic modifications of DNA and chromatin remodeling, in which nucleosome remodeling and histone deacetylase (NuRD) complexes and MBD3 (Methyl-CpG binding domain protein) play an important roles [2]. MBD3 is ubiquitously expressed in all somatic cells and connect two subcomplexes including histone deacetylation and nucleosome remodeling into a whole [3]. The three isoforms of MBD3 (MBD3A/B/C) are all specifically expressed in ESCs, and the formed NuRD has a variety of subunit combinations that perform multiple functions in different cells or tissues [4]. MBD3−/− ESCs can maintain the expression of pluripotency genes, including Oct4 and Nanog. However, they are unable to form a stable NuRD complex and exhibit significant deficiencies in differentiation [5,6]. MBD3 also represents a critical rate-limiting barrier in the process of somatic cell reprogramming. The depletion of MBD3 has been observed to result in deterministic and synchronous reprogramming of iPSCs [7]. The complete deletion of the NuRD-specific subunit Gatad2a has been demonstrated to specifically disrupt the Mbd3/NuRD inhibitory activity on the pluripotency circuit during reprogramming, thereby facilitating deterministic iPSCs reprogramming [8]. Other studies have demonstrated that MBD3/NuRD plays an active role in reprogramming. The loss of MBD3 expression has been shown to result in a reduction in the efficiency of the reprogramming process. This may be attributed to disparate stoichiometric quantities of reprogramming factors, which provide varying intracellular environments [9]. Recent studies show that the NuRD complex converts mouse embryonic fibroblasts into pluripotency by cooperating with SALL4 [10,11].
A multitude of extrinsic and intrinsic factors can result in threats to the integrity of the genome, leading to the induction of DNA damage [12]. Among the various forms of DNA damage, double-strand breaks (DSBs) represent a significant threat to genome integrity [13]. It is imperative that damaged DNA be repaired in order to maintain genomic integrity. This is accomplished through the activation of checkpoint pathways [14,15]. ESCs exhibit a preference for homologous recombination (HR) over other DNA repair pathways, enabling them to repair DSBs with greater accuracy [16]. This may be contingent upon the high expression of RAD51 or transient expression of ZSCAN4, a transcription factor that has been demonstrated to promote telomere elongation in mice through an HR-dependent mechanism [17]. The activation of cell cycle checkpoints has been demonstrated to result in the recruitment of repair factors to the region of the DSBs. To illustrate, the ataxia telangiectasia mutated (ATM) protein, which activates the G1 checkpoint, can phosphorylate the histone variant H2AX, converting it to γH2AX [15], which plays a pivotal role in recruiting DNA repair proteins at the site of damage. These include RAD51, a crucial protein in the HR process, and 53BP1, a pivotal protein in the non-homologous end joining (NHEJ) process. Additionally, BRCA1 is instrumental in the activation of RAD51-mediated HR repair [18].
Hypoxia-inducible factor 1α (HIF1α) is necessary for the initiation of the switch from oxidative to glycolytic metabolism and for the acquisition of pluripotency. Stabilization of HIF1α during the initial stages of reprogramming is sufficient to induce the switch to glycolytic metabolism [19]. Primed stem cells (such as mouse epiblast stem cells (EpiSCs) and human ESCs are regarded as exhibiting a high glycolytic capacity, whereas naïve stem cells (such as mouse ESCs) are considered bivalent, demonstrating the ability to switch from glycolysis to mitochondrial respiration in response to changing metabolic demands. HIF1α is responsible for the transition of mouse ESCs towards a glycolysis-dependent stage that resembles mouse EpiSCs [20]. The upregulation of HIF1α target genes by hypoxia has also been demonstrated to drive differentiated cells to dedifferentiate and acquire pluripotency [21]. Additionally, HIF1α influences the metabolic pattern of mitochondria. Although the reduction of HIF1α has been demonstrated to stimulate the generation of reactive oxygen species (ROS), it has been shown that this process is unable to enhance the membrane potential of mitochondria. These findings suggest that HIF1α may facilitate the transition of cellular metabolism towards glycolysis, but may not be responsible for the activation of other related metabolic pathways [22]. ROS are a byproduct of mitochondrial oxidative phosphorylation (OXPHOS), which is the process by which adenosine triphosphate (ATP) is produced. Low levels of ROS are involved in certain physiological functions, but high levels of ROS may cause protein carbonylation, lipid peroxidation, and DNA damage, which have deleterious effects on cells [23,24].
In this study, we set out to determine the role of MBD3 in bovine somatic cell reprogramming. By examining the impact of MBD3 on DNA damage, ROS, mitochondrial membrane potential, and apoptosis during the reprogramming stages and in iPSCs cell lines, we determined that MBD3 KD could reduce DNA damage response (DDR) in the early stages of bovine somatic cell reprogramming and promote the pluripotency and in vitro differentiation ability of bovine iPSCs.
2. Materials and Methods
2.1. Animal Experiments
All animal procedures were conducted in accordance with the guidelines set forth by the Institute Animal Care and Use Committee, and were approved by the Animal Care and Use Committee of Inner Mongolia University (approval code: IMU-MOUSE-2021-047). The mice, of the CD1 (ICR) strain, were obtained from Beijing Vital River Laboratory Animal Technology. All mice were maintained in specific pathogen-free conditions with a 12-h dark/12-h light cycle.
2.2. Plasmids and Cloning
The PiggyBac plasmids, including CAG-bovine OCT3/4, CAG-bovine SOX2, CAG-bovine KLF4, and CAG-bovine c-MYC, were kindly provided by Xihe Li of Inner Mongolia University. The bovine PiggyBac-MBD3 was modified on the PiggyBac-CAG plasmid, which was purchased from Changsha Youze Biotechnology. The primers utilized for the amplification of the MBD3 coding sequence are presented in the Supplementary Table S1.
2.3. Generation of Bovine iPSCs
The BFFs were derived from the ear tips and tail tips of fetal cows at slaughterhouses. The BFFs medium is DMEM (Gibco) supplemented with 10% fetal bovine serum (50325, FBS; Bovoge) and 1% penicillin–streptomycin (Gibco). The BFFs were cultured in the 6 cm dishes under CO₂ at 38.5 °C, and the medium was changed every day. When the cell densities reached approximately 90%, the BFFs were passaged.
For reprogramming, PiggyBac plasmids, including CAG-bovine OCT3/4, CAG-bovine SOX2, CAG-bovine KLF4, and CAG-bovine c-MYC, were co-transfected into BFFs via electroporation, with approximately 10⁶ cells per electroporation. Approximately 5,000 transfected fibroblasts were plated into a 12-well culture plate with a feeder layer and Dulbecco's modified Eagle's medium supplemented with 10% fetal bovine serum. On the second day, the medium was replaced with the LCDM medium. The formation of colonies was observed to occur gradually between days 12 and 23 following transfection. The resulting colonies were selected and passaged using TrypLE Select [25].
2.4. Small Interfering RNA Sequencing
The cells were transfected with MBD3-specific small interfering RNA (siRNA) or with a non-targeting siRNA serving as a negative control using HiPerFect Transfection Reagent (301704, QIAGEN) transfection reagent. Subsequently, after a period of six hours, the transfection mixture was replaced with LCDM, and the cells were maintained in LCDM. The sequences of the siRNA utilized to target MBD3 are provided in Supplementary Table S2 and were generated by QIAGEN.
2.5. Culturing Bovine iPSCs
The bovine iPSCs were maintained on mitomycin C-treated mouse embryonic fibroblast feeder cells (MEFs) under 20% O₂ and 5% CO₂ at 38.5 °C, and enzymatically passaged every three days by treatment with TrypLE Select. The cells were cultured in LCDM medium. The LCDM medium comprises DMEM/F12 (Gibco) and Neurobasal (Gibco), augmented with 0.5% N2 supplement (Thermo Fisher Scientific), 1% B27 supplement (Thermo Fisher Scientific), 1% L-glutamine, and 1% nonessential amino acids. The medium was supplemented with 1 mM β-mercaptoethanol, penicillin/streptomycin, 5% knockout serum replacement (KSR; Gibco), 10 ng/mL recombinant human LIF (L; Millipore), 1 mM CHIR99021 (C; Tocris), 2 mM (S)-(+)-dimethindene maleate (D; Tocris), and 2 mM minocycline hydrochloride (M; MCE).
2.6. Alkaline Phosphatase Staining
Alkaline phosphatase (AP) activity was quantified using the BCIP/NBT Alkaline Phosphatase Chromogenic Kit, following the instructions provided by the manufacturer (C3206, Beyotime Biotechnology). The samples were then examined under a microscope (Nikon).
2.7. Quantitative Real-Time PCR (qRT-PCR) Analysis
Total RNA was extracted using the Eastep™ Super Total RNA Extraction Kit (LS1040, Promega), following the manufacturer's instructions. A PrimeScript RT Reagent Kit with gDNA Eraser (Takara, RR047A) was employed for the synthesis of complementary DNA. Reactions for reverse transcription-polymerase chain reaction (RT-PCR) were conducted on a 7500 Real-Time PCR System (ABI Biosystems) using GoTaq® qPCR Master Mix (A6002, Promega). Gene expression was calculated using the 2-ΔΔCT method and normalized to the housekeeping gene GAPDH. The data are presented as means and standard deviations. The sequences of the primers utilized are presented in the Supplementary Tables S3 and S4.
2.8. Immunofluorescence Staining
The bovine iPSCs and differentiated cells were washed once in DPBS and fixed in 4% paraformaldehyde (PFA; Solarbio) for 15 minutes. Subsequently, the cells were permeabilized for 30 minutes with 1% Triton X-100 (Solarbio), followed by a one-hour blockade at room temperature with 5% BSA. Subsequently, the samples were incubated at 4°C overnight. Following three washes, the samples were incubated for one hour at room temperature with the secondary antibodies. Following two washes, the samples were incubated for three minutes at room temperature with DAPI (0.5 mg/mL; Beyotime). Following two washes in DPBS, the samples were loaded onto slides with antifade solution (Solarbio). Fluorescent signals were visualized using Nikon confocal laser-scanning microscopes (Nikon, A1). The antibodies utilized in this study are listed in the Supplementary Tables S5 and S6.
2.9. Embryoid body (EB) Formation
Bovine iPSCs were subjected to enzymatic digestion to obtain single cells. These cells were subsequently cultured in IMDM (Gibco) medium supplemented with 15% FBS at 38.5 °C under 5% CO₂ conditions. On days 4-6, EBs gradual formed and were transferred onto gelatin-coated 4-well plates. The medium was replaced every two days with fresh IMDM containing 15% FBS. Subsequently, on days 26-30, the cells were utilized for immunofluorescence staining and real-time PCR analyses.
2.10. Teratoma Formation
Approximately 1×10⁷ cells in 200 μl DMEM (Gibco) were injected subcutaneously into a 5-week-old male NOD-SCID mice. The mice were euthanized, and teratomas were obtained when they were 1 cm in diameter (2–3 months). Then, the teratomas were embedded in paraffin, and H&E staining was performed.
2.11. Measurement of Reactive Oxygen Species
The cells were processed in accordance with the instructions provided in the ROS Assay Kit (Beyotime). The cells were incubated with 10 μM DCFH-DA in DMEM/F12 for 20 minutes at 38.5°C. Following this, the DCFH-DA probe was removed, and the cells were washed with DPBS. The samples were then analyzed on the Beckman CytoFlex LX machine.
2.12. Analysis of Mitochondrial Membrane Potential
The mitochondrial membrane potential was quantified using the cationic fluorescent dye tetramethylrhodamine methyl ester (TMRE; MCE). TMRE was added to DMEM/F12 containing Hoechst 33342 (final concentration of TMRE, 100 nM). The cells were rinsed with DPBS and then incubated with TMRE at 38.5°C for 30 minutes. Thereafter, the TMRE dye was removed and fresh LCDM medium was added. The visualization of mitochondrial membrane potential was conducted using Nikon confocal laser-scanning microscopes (Nikon, A1). Prior to staining with TMRE, the cells must be resuspended for flow cytometry to detect mitochondrial membrane potential. The samples were subsequently analyzed on the Beckman CytoFlex LX machine.
2.13. Western Blot
The cells were harvested and lysed with lysis buffer (Thermo Fisher Scientific) supplemented with phenylmethylsulfonyl fluoride (Beyotime) on ice for 30 minutes. Subsequently, the supernatant was collected following a centrifugation at 13,200 rpm for 5 minutes. The protein concentration was determined using the BCA colorimetric method. The samples were boiled for approximately 10 minutes. Subsequently, the proteins were subjected to SDS-PAGE on 10% Bis-Tris gels (Bio-Rad) and transferred to NC membranes. The membranes were blocked for 90 minutes in 5% skim milk, after which they were incubated with primary antibodies overnight at 4°C. Subsequently, the samples were incubated with secondary antibodies at room temperature for one hour. The target protein bands were then visualized by enhanced chemiluminescence (Thermo Fisher Scientific) and detected by an imaging analysis system (Bio-Rad). The antibodies utilized in this study can be found in the Supplementary Tables S7 and S8.
2.14. RNA-Seq Sample Collection and Library Preparation
RNA-seq experiments were conducted on iPSC-NC and iPSC-siMBD3 samples. A total of 1 µg of RNA was utilized as the input material for the RNA sample preparations. Sequencing libraries were generated using the NEBNext UltraTM RNA Library Prep Kit for Illumina (NEB, Ipswich, MA, USA), and index codes were added to attribute sequences to each sample. Each treatment was conducted in triplicate. The PCR products were purified, and the quality of the library was assessed using the Agilent Bioanalyzer 2100 system (Agilent, Palo Alto, California, USA). The resulting libraries were sequenced on an Illumina NovaSeq platform (Illumina, San Diego, California, USA), and 150 bp paired-end reads were generated.
2.15. ChIP-seq Sample Collection and Library Preparation
ChIP experiments were conducted using anti-MBD3 (Cell Signaling Technology) and the SimpleChIP® Enzymatic Chromatin IP Kit (Magnetic Beads) (Cell Signaling Technology). Following cross-linking and fixation of the cells with 16% formaldehyde (Cell Signaling Technology), the purified nuclei were subjected to sonication, resulting in the generation of chromatin fragments with a size range of 150 to 900 base pairs. Subsequently, the chromatin fragments were incubated overnight with anti-MBD3 antibodies. The antibody-bound DNA fragments were then pulled down using Protein G magnetic beads and subsequently purified for library construction. Following quality control of the DNA sample, the purified DNA was subjected to ChIP-seq library preparation using the NEBNext® Ultra™ II DNA Library Prep Kit (E7645L, NEB, USA). The qualified libraries were pooled and sequenced on Illumina platforms with a PE150 strategy at Novogene Bioinformatics Technology Co., Ltd. (Beijing, China), according to the effective library concentration and data amount required.
2.16. RNA-Seq and ChIP-Seq Data Analysis
For RNA-seq date analysis, clean reads were counted and generated with featureCounts v2.0.1. The clean reads were then mapped to the bovine genome using Hisat2 v2.2.1 software tools [26]. The read counts of each gene were calculated, and the expression of each gene was standardized with TPM. DEGs were computed with the edgeR package in R [27]. An adjusted p < 0.05 and | Log2 (fold change) | ≥ 1.5 difference expression were considered significantly enriched by DEGs. Pearson correlation analyses, heatmaps, PCA, and hierarchical clustering were performed in R (v4.0.4). The enrichment analyses of the DEGs in Gene Ontology (GO) and GSEA were implemented using the ClusterProfiler R package, which corrects for gene length bias [28]. A corrected p < 0.05 after calibration was considered significantly enriched by DEGs.
For ChIP-Seq data analysis, Illumina reads were first mapped to the UCSC bosTau9 reference using bwa-mem (version:0.7.17) with default parameters [29]. Next, we used macs2(v2.2.7.1, -nomodel-broad-broad-cutoff 0.1-shift 0-gsize 2.7e9-keep-dup auto) to call the peaks [30]. MBD3 signals were normalized using the MA norm (version: 1.1.4) method for the quantitative comparison of ChIP-seq data [31], and the significant differential peaks were determined as log10(p-value) < 0 and M-value > 1. Subsequently, the differential peaks were annotated to UCSC bosTau9 using the R package ChIP seeker (version: 1.28.3) [32] and TxDb.Btaurus.UCSC.bosTau9.refGene (version: 3.10.0).
2.17. Statistical Analysis
All experiments were performed with multiple biological and technical replicates. The graphical presentation and statistical analysis of the data were conducted using GraphPad Prism 8.0. The data are presented as the means ± standard deviations (SDs), and statistical significance was determined with Student's two-tailed t-test. * p < 0.05; ** p < 0.01; *** p < 0.001; **** p < 0.0001.
3. Results
3.1. MBD3 KD Promotes Reprogramming, Pluripotency, and Differentiation Potential of Bovine iPSCs
To ascertain the function of MBD3 in the reestablishment of pluripotency in bovine somatic cells, we transferred a piggyBac construct expressing OCT4, SOX2, KLF4, and C-MYC (OSKC) into bovine fetal fibroblasts (BFFs) to initiate reprogramming, then a small interfering RNA (siRNA) targeting MBD3 was transfected at 48 hours of reprogramming (Figure 1A). This is because somatic cells cannot proliferate in vitro after Mbd3 is completely depleted, resulting in the inability to reprogram [8,33]. Therefore, in this study, MBD3 siRNA was transfected at 48 hours after reprogramming was initiated [7]. The cell morphology began to change on the fifth day after transfection. The colonies were obvious on days 21 and showed a dome-shaped morphology with clear borders (Figure 1B). On the tenth day of the reprogramming process, cells were subjected to alkaline phosphatase (AP) staining for detection of the efficiency of the reprogramming. The number of AP-positive clones in the negative control group (iPSC-NC) was 307, 195, 209, and 272, respectively. In the knockdown group (iPSC-siMBD3), the number of AP-positive clones was 325, 276, 265, and 356, respectively. Compare with the control cells, the number of positive clones in the MBD3 knockdown group exhibited an approximate 30% increase (Figure 1C). The MBD3 knockdown efficiency was approximately 60% 96 h after siRNA transfection during the reprogramming process (Figure 1D). Following a 23-27 days period of reprogramming, colonies were picked and cell lines named iPSC-NC and iPSC-siMBD3 were obtained. However, the size of the iPSC-siMBD3 cells is markedly smaller. The iPSC-NC and iPSC-siMBD3 cells generated in LCDM can stably proliferate, be passaged every 2-3 days, can be maintained for more than 60 generations, and are positive for alkaline phosphatase (AP) staining (Figure 1E). The MBD3 protein expressed in the nucleus of iPSC-siMBD3 cells was significantly less than that of iPSC-NC cells, and chromatin immunoprecipitation-sequencing (ChIP-seq) showed that the genes bound by MBD3 were significantly reduced compared with those in iPSC-NC cells (Figure 1F-H and Supplementary Figure S1).
To further elucidate the function of MBD3 in somatic cell reprogramming, we conducted a MBD3 overexpression experiment at the 48-hour of the reprogramming. Compared with the cells transfected with the empty vector (PB-CAG), the number of AP-positive clones in MBD3 overexpression cells exhibited a decline from 318, 405, and 300 to 232, 261, and 200, respectively. At the same time, overexpression of MBD3 at 48 hours of reprogramming resulted in the inability of BFFs to complete reprogramming to form iPSCs. In addition, overexpression of MBD3 from the beginning of reprogramming resulted in a more significant decrease in reprogramming efficiency (Supplementary Figure S2).
To obtain a comprehensive assessment of cellular identity on a global transcription scale, we employed RNA sequencing (RNA-seq). The application of a heat map, Pearson correlation, and differential expression analysis revealed the existence of notable discrepancies in bovine iPSC-NC and iPSC-siMBD3 cells (Figure 2A and Supplementary Figure S3A, B). We identified 125 genes that were upregulated in iPSC-MBD3 cells compared with BFFs and iPSC-NC cells, with GO enrichment for “cell junction” and “ion transport” (Supplementary Figure S3). The Venn diagram demonstrated that among the 4,795 genes, iPSC-siMBD3 cells exhibited 3,929 genes in common with iPSC-NC cells, 400 genes exclusive to iPSC-siMBD3 cells, and 466 genes exclusive to iPSC-NC cells (Figure 2B). iPSC-siMBD3 and iPSC-NC cells were compared with iPSC-LXH [34], EPSC-LXH [35], EPSC-XJZ [25], and ESC-F7 [36] cells. Principal component analysis (PCA) demonstrated that reprogrammed iPSCs and iPSC-LXH, EPSC-LXH, EPSC-XJZ, and ESC-F7 cells grouped on the ordinate, while ESC-F7 cells distinguished from iPSCs on the abscissa (Figure 2C). To further explore the pluripotency of iPSC-NC and iPSC-siMBD3 cells, we detected pluripotency genes and performed immunofluorescence staining for pluripotency markers. We found that iPSC-NC and iPSC-siMBD3 cells not only turned on the expression of endogenous OCT4, SOX2, KLF4, and C-MYC and many other pluripotency genes (Figure 2D,E), but also expressed pluripotency markers such as NANOG, SSEA1, and SSEA3, and barely expressed SSEA4 (Figure 2F). Notably, iPSC-siMBD3 cells expressed many higher levels of naïve marker genes such as REX1, CD9, DPPA4, DNMT3L and higher levels of totipotent marker genes such as PLK2, MDM2, CTSB, ZSCAN4 (Figure 2D). In addition, we performed MBD3 knockdown in iPSC-NC cells and detected the mRNA expression of naïve and pluripotency-related markers. The qRT-PCR analysis showed that naïve marker genes such as STELLA, DPPA4, TET2, and DNMT3L were significantly upregulated in iPSC-NC cells with MBD3 knockdown, and pluripotent marker genes such as PDRG1, MAFK, RAB43, MDM2, and CTSB were also significantly upregulated in iPSC-NC cells with MBD3 knockdown (Supplementary Figure S4).
To analyze the differentiation potential of bovine iPSCs, we conducted teratoma formation in vivo, embryoid bodies (EBs) formation experiments in vitro and the differentiation of TE lineages in vitro. Hematoxylin and eosin (H&E) staining showed that teratomas have derivatives of three germ layers (Figure 2G). The EBs cells all expressed endoderm marker (GATA4 and FOXA1), mesoderm marker (PAX6), and ectoderm marker (MEF2C and GFAP). Immunofluorescence staining showed that both iPSCs could differentiate into three germ layers (GFAP, ectoderm; α-SMA, mesoderm; AFP, endoderm). However, under identical differentiation culture condition, iPSC-siMBD3 cells can form embryoid bodies faster with a elevate expression of ectoderm gene GBX2, mesoderm genes HNF4A, PAX6 and T, and endoderm genes SOX17 (Figure 2H,I). These results indicate that iPSC-NC and iPSC-siMBD3 have the ability to differentiate into three germ layers in vitro and in vivo. To investigate whether MBD3 affects the differentiation ability of established bovine iPSCs, we transferred MBD3 siRNA into iPSC-NC cells and then differentiated them into EBs in vitro. We detected the mRNA expression of three germ layer-related markers in EBs with MBD3 knockdown by qRT-PCR, and the results showed that compared with EBs without MBD3 knockdown, the endoderm marker gene SOX17 and the mesoderm marker gene HNF4A were significantly upregulated in EBs with MBD3 knockdown (Supplementary Figure S5). Moreover, the cells obtained through TE differentiation of iPSC-NC and iPSC-siMBD3 expressed the trophoblast markers, including KRT18, GATA3, ELF5, TEAD4, and ETS2 (Supplementary Figure S6A and B). The trophoblast marker proteins placental lactogen (PL) and TEAD4 were detected in cells obtained by EB differentiation, but cells differentiated from iPSC-siMBD3 expressed higher levels of PL and TEAD4 proteins (Supplementary Figure S6C). In summary, iPSCs generated by MBD3 KD exhibit superior pluripotency and developmental potential compared with iPSCs generated by the classical OSKC.
3.2. MBD3 KD Reduce DNA Damage Indicated by Reduction of γH2AX but Not RAD51 and BRCA1 During Bovine iPSCs Reprogramming
The genome stability of PSCs is of paramount importance with regard to their proliferation and pluripotency [37]. The generation of iPSCs through the forced expression of transcription factors (OSKC) is accompanied by oxidative stress and DNA damage. DNA repair mechanisms play a pivotal role in maintaining genomic stability and ensuring the efficacy of iPSCs reprogramming. The γH2AX is rapidly produced following the occurrence of DSBs, which is an indicator of DDR [38]. The presence of γH2AX during bovine iPSCs reprogramming was analyzed by immunofluorescence staining. The results showed that MBD3 KD reduced γH2AX protein levels in the early stages of reprogramming, and the effect is observed throughout the entire process of reprogramming and persists into established iPSCs (Figure 3A,C). In contrast, the overexpression of MBD3 resulted in elevated γH2AX protein expression during the initial stages of reprogramming (Figure 3F). Previous study showed that the introduction of Yamanaka factors into donor cells results in an increase in the DDR, which subsequently activates the p53 pathway. This p53 pathway then becomes an obstacle to reprogramming [39,40]. In our study, GSEA results showed that the gene set of “p53 signaling pathway” was enriched in iPSC-NC cells (Figure 3E), indicating that MBD3 KD can effectively reduce DNA damage during the initial stages of reprogramming. It is noteworthy that the impact of MBD3 on the DNA damage response was not conveyed through RAD51 and BRCA1. This was evidenced by the observation that the knockdown or overexpression of MBD3 did not influence the expression levels of RAD51 and BRCA1 during reprogramming and following the establishment of the cell line (Figure 3B,D,G).
3.3. ROS Level Was Reduced by MBD3 KD to Avoid DNA Damage in Bovine iPSCs
The maintenance of cellular redox homeostasis is contingent upon a meticulous synchronization between the production and elimination of ROS. Oxidative stress is defined as a condition in which the generation of ROS exceeds the capacity for their clearance, resulting in an imbalance in the redox state that exceeds the physiological range [41]. Oxidative stress has been demonstrated to result in the formation of DNA damage due to the action of reactive oxygen species [42]. To ascertain whether the diminished DNA damage in bovine iPSCs resulting from MBD3 knockdown was attributable to ROS, we quantified the ROS levels in iPSC-NC and iPSC-siMBD3 cells via flow cytometry using the fluorescent probe 2',7'-dichlorodihydrofluorescein diacetate (DCFH-DA). The results demonstrated a notable reduction in ROS levels in iPSC-siMBD3 cells when compared to iPSC-NC cells (Figure 4A,B). Furthermore, the mitochondrial membrane potential was assessed in iPSC-NC and iPSC-siMBD3 cells through flow cytometry utilizing tetramethylrhodamine ethyl ester perchlorate (TMRE). The results showed that the mitochondrial membrane potential levels in iPSC-NC and iPSC-siMBD3 cells were comparable, and fewer cells underwent apoptosis (Figure 4D–G). Moreover, the percentages of cells exhibiting a positive ROS signal in iPSC-NC and iPSC-siMBD3 cells were found to be comparable (Figure 4C). The data demonstrate that despite the considerable disparity in ROS levels between iPSC-NC and iPSC-siMBD3 cells, both populations exhibit a minimal apoptotic cell count. The GSEA results demonstrated that the gene set associated with the term "peroxisome" was enriched in iPSC-NC cells (Figure 4H), thereby validating our findings.
3.4. ROS Produced by Oxidative Stress in Bovine iPSCs Under Hypoxia Condition Was Reduced by MBD3 KD
Hypoxia is frequently accompanied by an elevated production of ROS, which in turn precipitates oxidative stress [43]. To ascertain the levels of ROS in response to oxidative stress, we subjected iPSC-NC and iPSC-siMBD3 cells to a hypoxic environment for up to 24 hours. Following a 24-hour period of hypoxia, the levels of ROS in iPSC-NC and iPSC-siMBD3 cells were found to be significantly elevated in comparison to the levels observed in cells cultured under normal conditions. Nevertheless, the ROS levels in iPSC-siMBD3 cells were found to be markedly diminished in comparison to those observed in iPSC-NC cells (Figure 5A–C). It is noteworthy that the proportion of TMRE signal-positive cells in iPSC-NC cells exhibited a decline after 24 hours of hypoxia. Specifically, the Hypoxia-iPSC-NC group demonstrated a TMRE signal-positive cell proportion of 85.04%, while the Hypoxia-iPSC-siMBD3 group exhibited a proportion of 92.51% (Figure 5D–G). Furthermore, the expression of the γH2AX protein was observed to be higher in iPSC-NC cells than in iPSC-siMBD3 cells after 24 hours of hypoxia (Figure 5H). The results indicate that when oxidative stress occurs, the level of ROS in iPSC-siMBD3 cells rises at a slower rate, resulting in a reduction in DNA damage and, consequently, a decrease in cell apoptosis.
3.5. HIF1A Expression Was Increased by MBD3 KD to Resist ROS Generated by Oxidative Stress in Bovine iPSCs
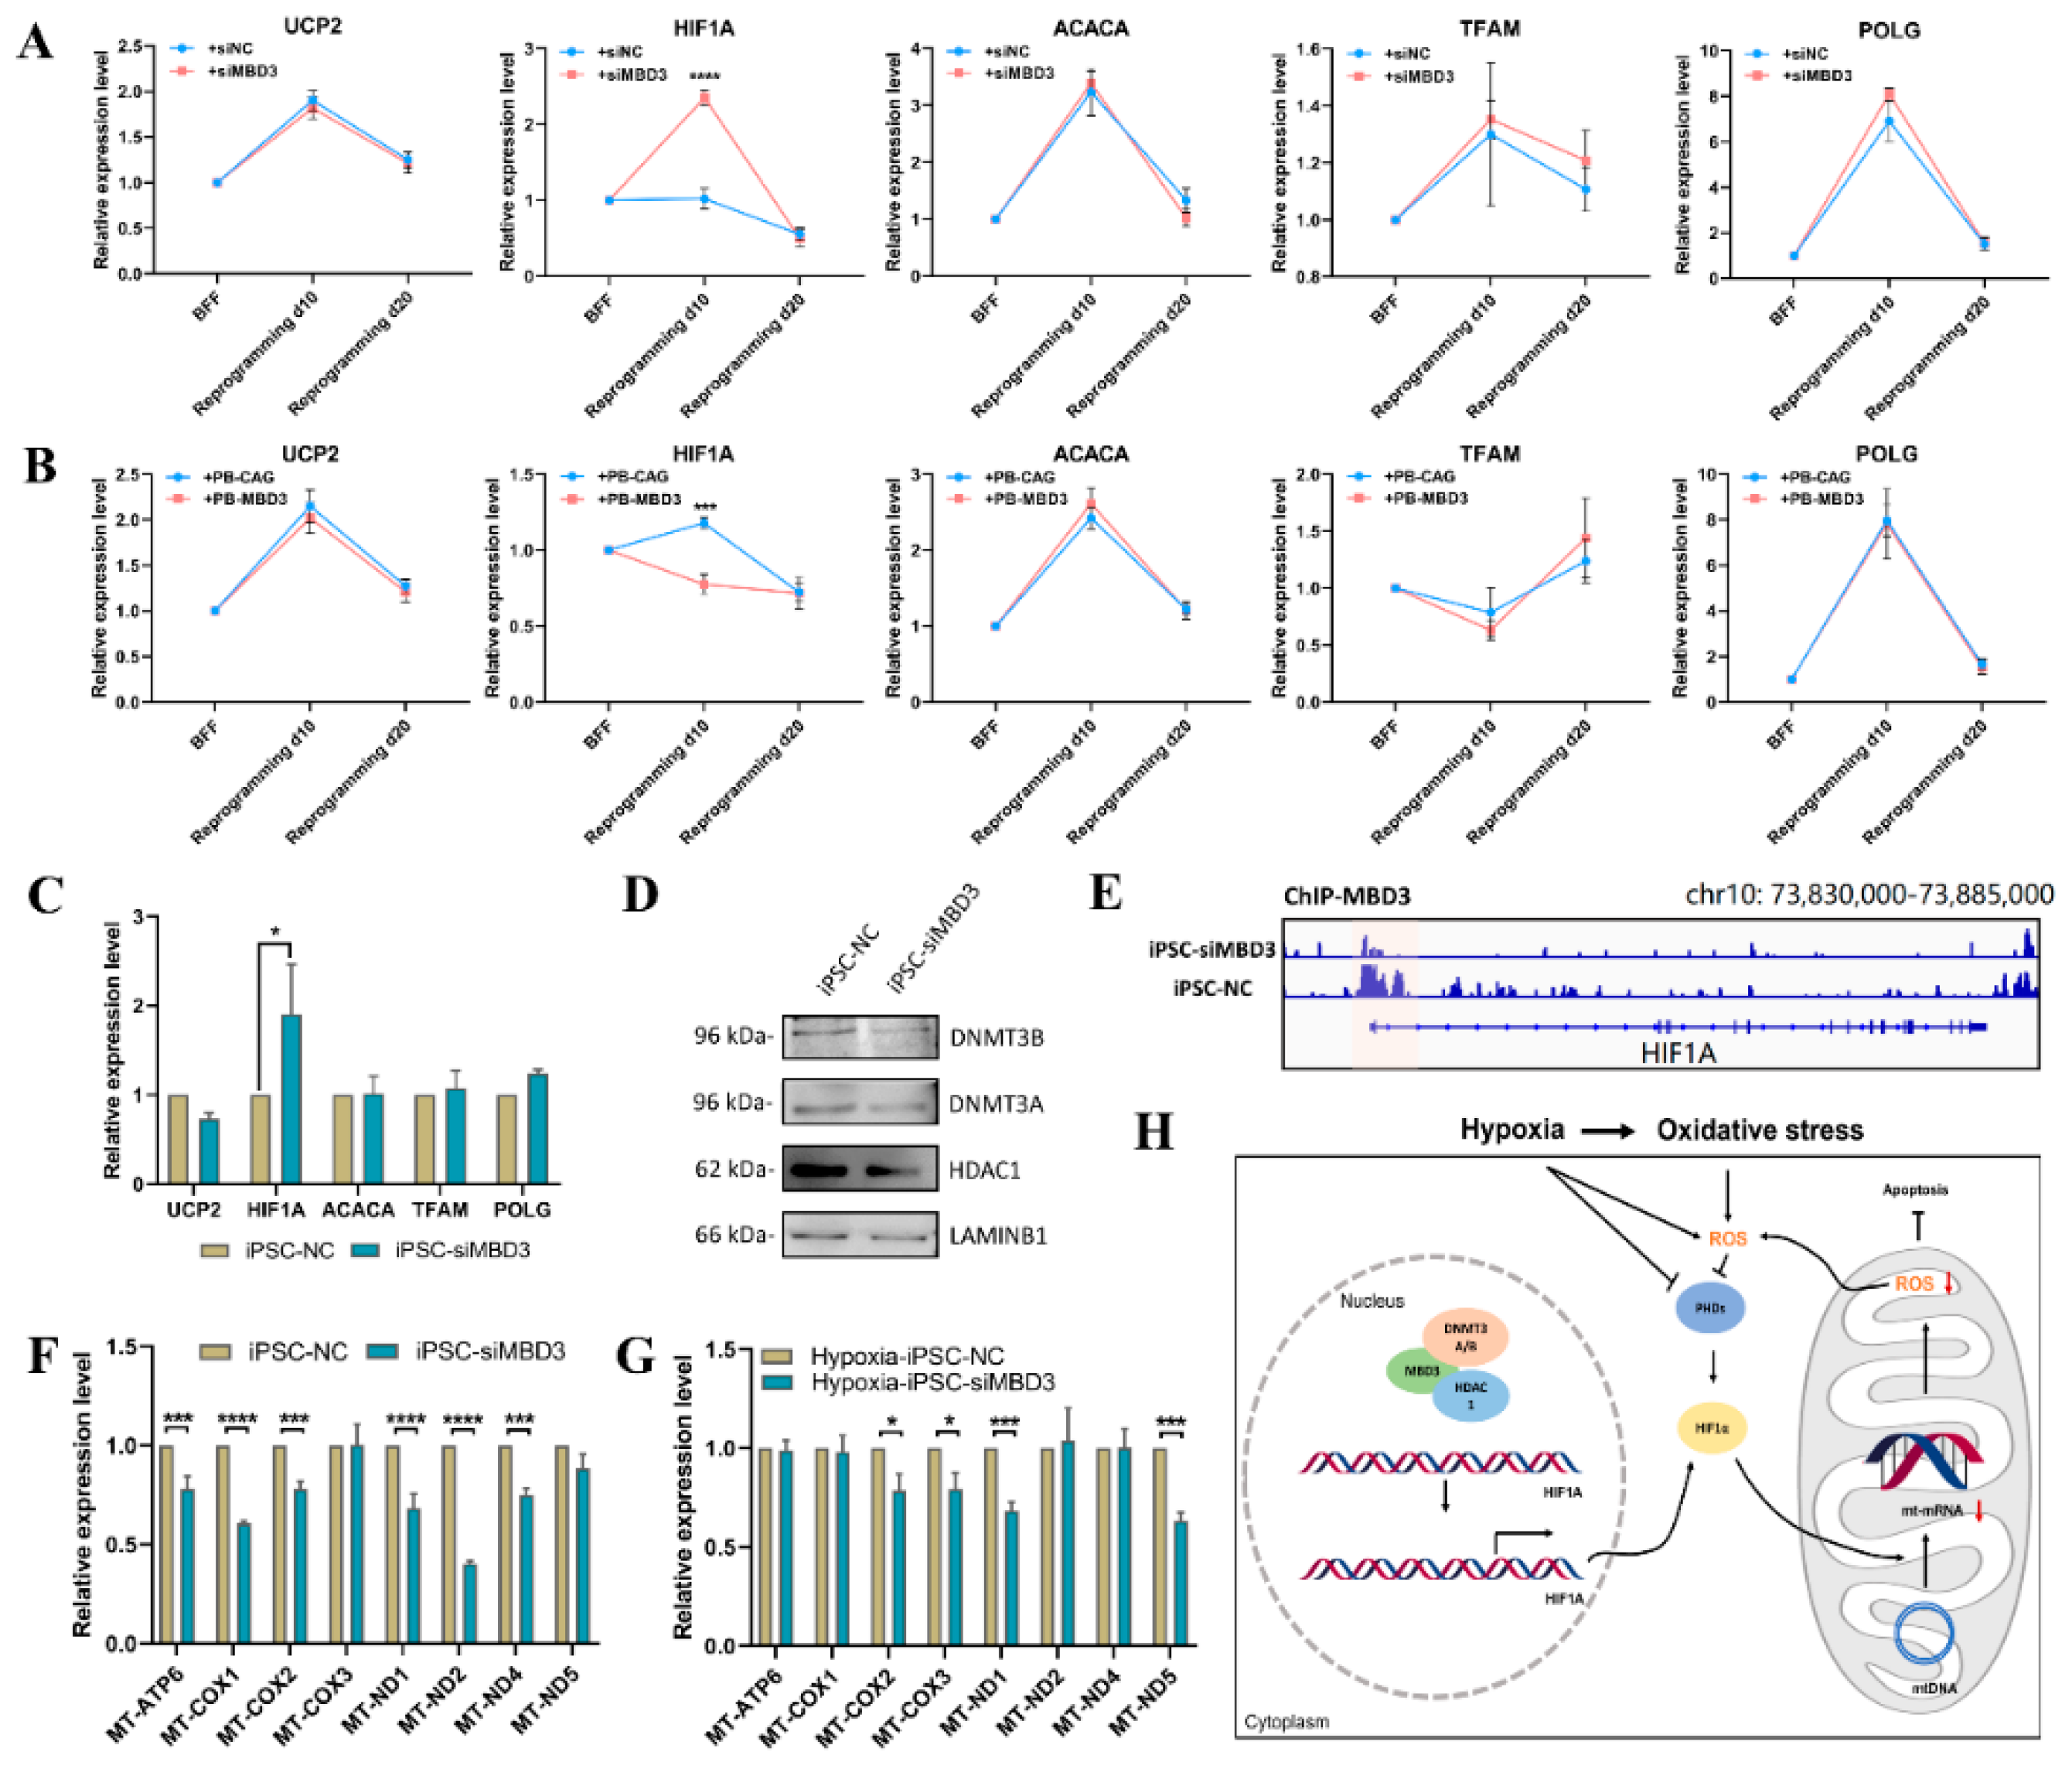
HIF-1α plays a role in ROS levels during hypoxia [44]. HIF-1α is recruited to mitochondria under conditions of oxidative stress, resulting in a reduction of ROS levels and the reversal of mitochondrial damage. This process may serve to prevent apoptosis, that is induced by oxidative stress [43].To investigate whether the markedly reduced ROS levels observed in iPSC-siMBD3 cells under hypoxic conditions were linked to HIF-1α, the expression of genes associated with mitochondrial function during the reprogramming process was analyzed. The results showed that knockdown of MBD3 during the early stages of somatic cell reprogramming resulted in a notable elevation in the expression of the HIF1A. Conversely, the overexpression of MBD3 was found to induce a substantial reduction in HIF1A expression (Figure 6A,B). Furthermore, the HIF1A gene exhibited a markedly elevated expression level in iPSC-siMBD3 cells relative to iPSC-NC cells (Figure 6C). The ChIP-seq results demonstrated that the MBD3 protein exhibited binding to the HIF1A gene promoter exclusively in iPSC-NC cells, whereas no binding was observed in iPSC-siMBD3 cells (Figure 6E). This may be due to the fact that a reduction in MBD3 results in a diminished recruitment of HDAC1 or DNMT3A/B (Figure 6D), thereby activating the transcription of the HIF1A gene.
Targeting HIF-1α to mitochondria has been demonstrated to reduce ROS generation, collapse of mitochondrial membrane potential, and expression of mtDNA-encoded mRNA in response to hypoxia or H₂O₂; thus, it can be postulated that this process may prevent oxidative stress-induced apoptosis [43]. To test whether the elevated expression of the HIF1A gene in iPSC-siMBD3 cells result in an increase in HIF-1α protein targeting mitochondria, we examined the expression of HIF-1α protein in the nucleus and cytoplasm of iPSC-NC cells and iPSC-siMBD3 cells at the reprogramming stage (day 10). The results demonstrated that the expression of HIF-1α in the nucleus and cytoplasm was analogous between the early stages of reprogramming and both iPSC-NC cells and iPSC-siMBD3 cells (Supplementary Figure S8). This precludes the possibility of HIF-1α functioning as a transcription factor that affects ROS levels. To further elucidate the mechanism by which HIF1α inhibits ROS, we conducted an analysis of the mRNA levels of select mtDNA-encoding genes in iPSC-NC cells and iPSC-siMBD3 cells, as well as in iPSC-NC and iPSC-siMBD3 cells following a 24-hour exposure to hypoxia. The mRNA levels of most tested genes (MT-ATP6, MT-COX1, MT-COX2, MT-ND1, MT-ND2, MT-ND4) in iPSC-siMBD3 cells were observed to be lower than those in iPSC-NC cells (Figure 6F). Following a 24-hour period of hypoxia exposure, the mRNA levels of most tested genes (MT-COX2, MT-COX3, MT-ND1, MT-ND5) in iPSC-siMBD3 cells exhibited a reduction in comparison to those observed in iPSC-NC cells (Figure 6G). The results indicate that MBD3 KD increases HIF1α targeting of mitochondria by upregulating HIF1A expression, reduces mRNA production of mtDNA-encoding genes, and thus reduces the production of ROS (Figure 6H).
4. Discussion
During the initial stages of reprogramming induced by Yamanaka factors, cells experience DNA damage and genomic instability. The overexpression of Zscan4 during reprogramming has been demonstrated to significantly reduce the extent of DNA damage and maintain genomic stability by extending telomeres, thereby promoting the generation of high-quality iPSCs without genetic defects [38]. The addition of small molecule inhibitors during the reprogramming process has also been demonstrated to maintain the genomic stability of iPSCs. The transforming growth factor beta (TGF-β) inhibitor SB431542 has been demonstrated to inhibit DSBs by significantly increasing the expression levels of the Nanog, Zscan4, and E-cadherin during the generation of iPSCs. The ROCK inhibitor thiazolidinone has been demonstrated to rely on a significant increase in the expression level of the E-cadherin to effectively inhibit DSBs. The methyl ethyl ketone (MEK) inhibitor PD0325901 has been demonstrated to inhibit DSBs by significantly increasing the expression of Zscan4 [45].
The NuRD complex is a chromatin-modifying assembly that plays a pivotal role in regulating gene expression and DNA damage repair [46]. MBD3 is a member of the NuRD complex, which is a critical rate-limiting barrier in the process of somatic cell reprogramming. The depletion of MBD3 has been observed to result in deterministic and synchronous reprogramming of iPSCs [7]. In this study, we discovered that knockdown of MBD3 inhibit the formation of DNA damage, as evidenced by a notable elevation in the expression level of the HIF1A gene. Specifically, MBD3 knockdown was observed to reduce the generation of ROS, which was found to result from the upregulation of HIF1A expression. This resulted in a reduction in DNA damage during the reprogramming process, an improvement in reprogramming efficiency, and ultimately the generation of bovine iPSCs. Correspondingly, the overexpression of MBD3 resulted in augmented DNA damage throughout the reprogramming process, a diminished reprogramming efficacy, and ultimately, the inability to generate bovine iPSCs.
ROS are a group of short-lived, highly reactive, oxygen-containing molecules that have the potential to induce DNA damage and influence the DNA damage response [47]. ROS were initially considered detrimental byproducts of mitochondrial respiration. However, research has demonstrated that ROS can facilitate immune function and serve as signaling molecules within cells [48]. ROS production pathways encompass both endogenous processes occurring within mitochondria, peroxidase activity, NADPH oxidase-mediated reactions, and the involvement of endoplasmic reticulum, in addition to exogenous stress factors. It has been demonstrated that H2AX and ROS affect each other. The γH2AX-mediated Nox1-Rac1 complex serves as a regulator of ROS generation. The long-term elevation of ROS levels has been demonstrated to result in a reduction of γH2AX, which in turn facilitates the degradation of the H2AX protein. However, acute oxidative stress increases γH2AX activation and DDR signaling [47]. In this study, we found that MBD3 knockdown reduces DNA damage during bovine somatic cell reprogramming by reducing ROS levels, which results of MBD3 KD increased HIF1α targeted to mitochondria by upregulating the expression of HIF1A.
HIF1α is a pivotal regulator that facilitates the transition from oxidative to glycolytic metabolism during the initial stages of cellular reprogramming [19]. The induction of hypoxia, or the simulation of hypoxia through the exogenous addition of substances such as resveratrol, has been demonstrated to facilitate the reprogramming process [49]. Additionally, hypoxia has been demonstrated to facilitate the dedifferentiation of differentiated cells derived from ESCs or iPSCs, thereby reverting them to a stem cell-like state [21]. A few studies have demonstrated that HIF1α not only facilitates reprogramming but also plays a pivotal role in the differentiation of iPSCs. This may be attributed to the fact that a considerable number of adult stem cells are situated within hypoxic niches [50]. The overexpression of HIF1α in mesenchymal stem cells (MSCs) was observed to enhance proliferation capacity. Furthermore, the co-overexpression of HIF1α with Sema3A was demonstrated to promote the osteogenic differentiation of iPSC-derived MSCs (iPSC-MSCs) [51]. Retinoic acid (RA) has been demonstrated to enhance erythropoietin (EPO) production in iPSC-derived EPO-producing cells (hiPSC-EPO) through either hypoxia or the upregulation of hypoxia-inducible factor (HIF) signaling [52]. The HIF1A-mediated developmental hypoxia response has been demonstrated to exhibit a positive correlation with TGFB1 expression, thereby promoting the differentiation of hepatoblasts in iPSC-derived liver buds (hiPSC-LBs) [53]. Our findings align with those of previous studies in this field. Our results demonstrated that MBD3 KD elevated the expression of the HIF1A, thereby enhancing the differentiation capacity of bovine iPSCs. When differentiated under the same culture conditions, iPSC-siMBD3 cells form embryoid bodies faster and express higher levels of the ectoderm gene GBX2, the mesoderm genes HNF4A, PAX6 and T, the endoderm genes SOX17 , and the trophoblast marker proteins PL and TEAD4.Together, our present study describes MBD3 as an upstream regulator of HIF1A, and MBD3 knockdown increases HIF1α targeting to mitochondria, reduces ROS production, and thus reduces DNA damage, ultimately promoting the generation of bovine iPSCs with greater pluripotency and differentiation potential. This finding suggests that MBD3 plays a role in influencing DNA damage, rather than simply being a key inhibitor of cellular reprogramming.
5. Conclusions
In summary, our results indicate that knockdown of MBD3 during reprogramming reduces ROS generation by upregulating HIF1A expression, thereby alleviating oxidative stress-induced DNA damage and apoptosis in bovine iPSCs, ultimately promoting the generation of bovine iPSCs with enhanced pluripotency and in vitro differentiation capacity.
Supplementary Materials
The following supporting information can be downloaded at the website of this paper posted on Preprints.org. Figure S1: Analysis of MBD3 binding genes; Figure S2: The overexpression of MBD3 reduced the reprogramming efficiency of bovine iPSCs; Figure S3: Transcriptome analysis of iPSC-NC and iPSC-siMBD3 cells; Figure S4: The changes of naive pluripotent and totipotent genes after MBD3 knockdown were performed in iPSC-NC cells; Figure S5: Changes in in vitro EB differentiation capacity after MBD3 knockdown were performed in iPSC-NC cells; Figure S6: MBD3 KD promotes the differentiation of bovine iPSCs into the TE Lineage; Figure S7: MBD3 KD alters the cell cycle of bovine iPSCs; Figure S8: Expression of HIF1α during somatic cell reprogramming and oxidative stress; Table S1: The primers used for the MBD3 CDS amplification; Table S2: The siRNA sequences for MBD3; Table S3: Primer sequences for qRT‒PCR analysis; Table S4: Primer sequences for mitochondrial mRNA detection; Table S5: Primary antibodies used for immunostaining; Table S6: Secondary antibodies used for immunostaining; Table S7: Primary antibodies used for western blot; Table S8: Secondary antibodies used for western blot.
Author Contributions
Conceptualization, W.Y. and X.L.; Methodology, X.L.; Software, J.W.; Validation, W.Y. and J.W.; Formal analysis, W.Y., F.L., X.G., M.S., Y.W., C.L. and Y.Y.; Investigation, W.Y.; Data curation, W.Y., J.W. and S.L.; Writing—original draft preparation, W.Y.; Writing—review and editing, W.Y. and X.L.; Visualization, W.Y.; Supervision, X.L.; Project administration, X.L.; Funding acquisition, X.L. All authors have read and agreed to the published version of the manuscript.
Funding
This research was funded by the Key Science-Technology Project of Inner Mongolia (2023KYPT0010), STI 2030-Major Projects (2023ZD0407504) of China, the development plan for young scientific and technological talents in colleges and universities of Inner Mongolia Autonomous Region of China (NMGIRT2204), the National Natural Science Foundation of China (32160172), and the Science and Technology Major Project of the Inner Mongolia Autonomous Region of China to the State Key Laboratory of Reproductive Regulation (2021ZD0048).
Institutional Review Board Statement
Institutional Review Board Statement: The animal study protocol was approved by the Inner Mongolia University Committee (approval code: IMU-MOUSE-2021-047).
Informed Consent Statement
Not applicable.
Data Availability Statement
The datasets used and analyzed during the current study are available from the corresponding author upon reasonable request.
Acknowledgments
We thank Dr. Xihe Li of Inner Mongolia University for supplying the PiggyBac plasmids.
Conflicts of Interest
The authors declare no conflicts of interest.
Abbreviations
The following abbreviations are used in this manuscript:
| OSKC | OCT4, SOX2, KLF4, C-MYC |
| MBD3 | methyl-CpG binding domain protein |
| NuRD | nucleosome remodeling and deacetylase |
| HIF1A | hypoxia-inducible factor 1A |
| LCDM | recombinant human LIF, CHIR99021, (S)-(+)-dimethindene maleate, and minocycline hydrochloride |
| iPSCs | induced pluripotent stem cells |
| AP | alkaline phosphatase |
| ESCs | embryonic stem cells |
| EB | embryoid body |
| qRT-PCR | quantitative real-time PCR |
| PCA | principal component analysis |
| GO | Gene Ontology |
| GSEA | Gene Set Enrichment Analysis |
| PL | placental lactogen |
| EpiSCs | epiblast stem cells |
| FBS | fetal bovine serum |
| BFFs | bovine fetal fibroblast |
| ROS | reactive oxygen species |
| DDR | DNA damage response |
| DSBs | double-strand breaks |
| γH2AX | phosphorylated form of H2AX |
| TMRE | tetramethylrhodamine |
References
- Takahashi, K.; Yamanaka, S. Induction of pluripotent stem cells from mouse embryonic and adult fibroblast cultures by defined factors. Cell 2006, 126, 663–76. [Google Scholar] [CrossRef]
- Jaffer, S.; Goh, P.; Abbasian, M.; Nathwani, A. C. Mbd3 Promotes Reprogramming of Primary Human Fibroblasts. International journal of stem cells 2018, 11, 235–241. [Google Scholar] [CrossRef] [PubMed]
- Leighton, G.; Williams, D. C. The Methyl-CpG-Binding Domain 2 and 3 Proteins and Formation of the Nucleosome Remodeling and Deacetylase Complex. J Mol Biol 2020, 432, 1624–1639. [Google Scholar] [CrossRef] [PubMed]
- Ee, L. S.; McCannell, K. N.; Tang, Y.; Fernandes, N.; Hardy, W. R.; Green, M. R.; Chu, F.; Fazzio, T. G. An Embryonic Stem Cell-Specific NuRD Complex Functions through Interaction with WDR5. Stem Cell Reports 2017, 8, 1488–1496. [Google Scholar] [CrossRef] [PubMed]
- Kaji, K.; Nichols, J.; Hendrich, B. Mbd3, a component of the NuRD co-repressor complex, is required for development of pluripotent cells. Development 2007, 134, 1123–32. [Google Scholar] [CrossRef]
- Dai, Y.; Sun, J.; He, N.; An, L.; Hou, C.; Du, F. Nucleosome remodeling and deacetylation complex and MBD3 influence mouse embryonic stem cell naive pluripotency under inhibition of protein kinase C. Cell Death Discov 2022, 8, 344. [Google Scholar] [CrossRef] [PubMed]
- Rais, Y.; Zviran, A.; Geula, S.; Gafni, O.; Chomsky, E.; Viukov, S.; Mansour, A. A.; Caspi, I.; Krupalnik, V.; Zerbib, M.; Maza, I.; Mor, N.; Baran, D.; Weinberger, L.; Jaitin, D. A.; Lara-Astiaso, D.; Blecher-Gonen, R.; Shipony, Z.; Mukamel, Z.; Hagai, T.; Gilad, S.; Amann-Zalcenstein, D.; Tanay, A.; Amit, I.; Novershtern, N.; Hanna, J. H. Deterministic direct reprogramming of somatic cells to pluripotency. Nature 2013, 502, 65–70. [Google Scholar] [CrossRef] [PubMed]
- Mor, N.; Rais, Y.; Sheban, D.; Peles, S.; Aguilera-Castrejon, A.; Zviran, A.; Elinger, D.; Viukov, S.; Geula, S.; Krupalnik, V.; Zerbib, M.; Chomsky, E.; Lasman, L.; Shani, T.; Bayerl, J.; Gafni, O.; Hanna, S.; Buenrostro, J. D.; Hagai, T.; Masika, H.; Vainorius, G.; Bergman, Y.; Greenleaf, W. J.; Esteban, M. A.; Elling, U.; Levin, Y.; Massarwa, R.; Merbl, Y.; Novershtern, N.; Hanna, J. H. Neutralizing Gatad2a-Chd4-Mbd3/NuRD Complex Facilitates Deterministic Induction of Naive Pluripotency. Cell Stem Cell 2018, 23, 412–425.e10. [Google Scholar] [CrossRef] [PubMed]
- dos Santos, R. L.; Tosti, L.; Radzisheuskaya, A.; Caballero, I. M.; Kaji, K.; Hendrich, B.; Silva, J. C. MBD3/NuRD facilitates induction of pluripotency in a context-dependent manner. Cell Stem Cell 2014, 15, 102–10. [Google Scholar] [CrossRef]
- Ming, J.; Lin, L.; Li, J.; Wu, L.; Fang, S.; Huang, T.; Fu, Y.; Liu, D.; Zhang, W.; Li, C.; Yang, Y.; Huang, Y.; Qin, Y.; Kuang, J.; Huang, X.; Guo, L.; Zhang, X.; Liu, J.; Chen, J.; Zhao, C.; Wang, B.; Pei, D. Cell fate decision by a morphogen-transcription factor-chromatin modifier axis. Nature communications 2024, 15, 6365. [Google Scholar] [CrossRef]
- Wang, B.; Li, C.; Ming, J.; Wu, L.; Fang, S.; Huang, Y.; Lin, L.; Liu, H.; Kuang, J.; Zhao, C.; Huang, X.; Feng, H.; Guo, J.; Yang, X.; Guo, L.; Zhang, X.; Chen, J.; Liu, J.; Zhu, P.; Pei, D. The NuRD complex cooperates with SALL4 to orchestrate reprogramming. Nature communications 2023, 14, 2846. [Google Scholar] [CrossRef] [PubMed]
- Tubbs, A.; Nussenzweig, A. Endogenous DNA Damage as a Source of Genomic Instability in Cancer. Cell 2017, 168, 644–656. [Google Scholar] [CrossRef] [PubMed]
- Bouwman, B. A. M.; Crosetto, N. , Endogenous DNA Double-Strand Breaks during DNA Transactions: Emerging Insights and Methods for Genome-Wide Profiling. Genes (Basel) 2018, 9. [Google Scholar] [CrossRef]
- Jackson, S. P.; Bartek, J. , The DNA-damage response in human biology and disease. Nature 2009, 461, 1071–8. [Google Scholar] [CrossRef]
- Neganova, I.; Vilella, F.; Atkinson, S. P.; Lloret, M.; Passos, J. F.; von Zglinicki, T.; O'Connor, J. E.; Burks, D.; Jones, R.; Armstrong, L.; Lako, M. , An important role for CDK2 in G1 to S checkpoint activation and DNA damage response in human embryonic stem cells. Stem Cells 2011, 29, 651–9. [Google Scholar] [CrossRef]
- Choi, E. H.; Yoon, S.; Koh, Y. E.; Seo, Y. J.; Kim, K. P. , Maintenance of genome integrity and active homologous recombination in embryonic stem cells. Exp Mol Med 2020, 52, 1220–1229. [Google Scholar] [CrossRef]
- Zalzman, M.; Falco, G.; Sharova, L. V.; Nishiyama, A.; Thomas, M.; Lee, S. L.; Stagg, C. A.; Hoang, H. G.; Yang, H. T.; Indig, F. E.; Wersto, R. P.; Ko, M. S. , Zscan4 regulates telomere elongation and genomic stability in ES cells. Nature 2010, 464, 858–63. [Google Scholar] [CrossRef] [PubMed]
- Abd El-Hafeez, A. A.; Sun, N.; Chakraborty, A.; Ear, J.; Roy, S.; Chamarthi, P.; Rajapakse, N.; Das, S.; Luker, K. E.; Hazra, T. K.; Luker, G. D.; Ghosh, P. , Regulation of DNA damage response by trimeric G-proteins. iScience 2023, 26, 105973. [Google Scholar] [CrossRef] [PubMed]
- Mathieu, J.; Zhou, W.; Xing, Y.; Sperber, H.; Ferreccio, A.; Agoston, Z.; Kuppusamy, K. T.; Moon, R. T.; Ruohola-Baker, H. , Hypoxia-inducible factors have distinct and stage-specific roles during reprogramming of human cells to pluripotency. Cell Stem Cell 2014, 14, 592–605. [Google Scholar] [CrossRef]
- Zhou, W.; Choi, M.; Margineantu, D.; Margaretha, L.; Hesson, J.; Cavanaugh, C.; Blau, C. A.; Horwitz, M. S.; Hockenbery, D.; Ware, C.; Ruohola-Baker, H. , HIF1alpha induced switch from bivalent to exclusively glycolytic metabolism during ESC-to-EpiSC/hESC transition. EMBO J 2012, 31, 2103–16. [Google Scholar] [CrossRef] [PubMed]
- Mathieu, J.; Zhang, Z.; Nelson, A.; Lamba, D. A.; Reh, T. A.; Ware, C.; Ruohola-Baker, H. , Hypoxia induces re-entry of committed cells into pluripotency. Stem Cells 2013, 31, 1737–48. [Google Scholar] [CrossRef] [PubMed]
- Cui, P.; Zhang, P.; Zhang, Y.; Sun, L.; Cui, G.; Guo, X.; Wang, H.; Zhang, X.; Shi, Y.; Yu, Z. , HIF-1alpha/Actl6a/H3K9ac axis is critical for pluripotency and lineage differentiation of human induced pluripotent stem cells. FASEB J 2020, 34, 5740–5753. [Google Scholar] [CrossRef] [PubMed]
- Xu, X.; Duan, S.; Yi, F.; Ocampo, A.; Liu, G. H.; Izpisua Belmonte, J. C. , Mitochondrial regulation in pluripotent stem cells. Cell Metab 2013, 18, 325–32. [Google Scholar] [CrossRef] [PubMed]
- Sena, L. A.; Chandel, N. S. , Physiological roles of mitochondrial reactive oxygen species. Mol Cell 2012, 48, 158–67. [Google Scholar] [CrossRef] [PubMed]
- Xiang, J.; Wang, H.; Zhang, Y.; Wang, J.; Liu, F.; Han, X.; Lu, Z.; Li, C.; Li, Z.; Gao, Y.; Tian, Y.; Wang, Y.; Li, X. , LCDM medium supports the derivation of bovine extended pluripotent stem cells with embryonic and extraembryonic potency in bovine-mouse chimeras from iPSCs and bovine fetal fibroblasts. FEBS J 2021, 288, 4394–4411. [Google Scholar] [CrossRef] [PubMed]
- Kim, D.; Langmead, B.; Salzberg, S. L. , HISAT: a fast spliced aligner with low memory requirements. Nature methods 2015, 12, 357–60. [Google Scholar] [CrossRef] [PubMed]
- Robinson, M. D.; McCarthy, D. J.; Smyth, G. K. , edgeR: a Bioconductor package for differential expression analysis of digital gene expression data. Bioinformatics (Oxford, England) 2010, 26, 139–140. [Google Scholar] [CrossRef]
- Yu, G.; Wang, L. G.; Han, Y.; He, Q. Y. , clusterProfiler: an R package for comparing biological themes among gene clusters. Omics : a journal of integrative biology 2012, 16, 284–287. [Google Scholar] [CrossRef]
- Li, H.; Durbin, R. , Fast and accurate short read alignment with Burrows-Wheeler transform. Bioinformatics (Oxford, England) 2009, 25, 1754–1760. [Google Scholar] [CrossRef] [PubMed]
- Zhang, Y.; Liu, T.; Meyer, C. A.; Eeckhoute, J.; Johnson, D. S.; Bernstein, B. E.; Nusbaum, C.; Myers, R. M.; Brown, M.; Li, W.; Liu, X. S. , Model-based analysis of ChIP-Seq (MACS). Genome biology 2008, 9, R137. [Google Scholar] [CrossRef] [PubMed]
- Shao, Z.; Zhang, Y.; Yuan, G. C.; Orkin, S. H.; Waxman, D. J. , MAnorm: a robust model for quantitative comparison of ChIP-Seq data sets. Genome biology 2012, 13, R16. [Google Scholar] [CrossRef] [PubMed]
- Yu, G.; Wang, L. G.; He, Q. Y. , ChIPseeker: an R/Bioconductor package for ChIP peak annotation, comparison and visualization. Bioinformatics (Oxford, England) 2015, 31, 2382–2383. [Google Scholar] [CrossRef]
- Hanna, J.; Saha, K.; Pando, B.; van Zon, J.; Lengner, C. J.; Creyghton, M. P.; van Oudenaarden, A.; Jaenisch, R. , Direct cell reprogramming is a stochastic process amenable to acceleration. Nature 2009, 462, 595–601. [Google Scholar] [CrossRef]
- Zhao, L.; Wang, Z.; Zhang, J.; Yang, J.; Gao, X.; Wu, B.; Zhao, G.; Bao, S.; Hu, S.; Liu, P.; Li, X. , Characterization of the single-cell derived bovine induced pluripotent stem cells. Tissue & cell 2017, 49, 521–527. [Google Scholar]
- Zhao, L.; Gao, X.; Zheng, Y.; Wang, Z.; Zhao, G.; Ren, J.; Zhang, J.; Wu, J.; Wu, B.; Chen, Y.; Sun, W.; Li, Y.; Su, J.; Ding, Y.; Gao, Y.; Liu, M.; Bai, X.; Sun, L.; Cao, G.; Tang, F.; Bao, S.; Liu, P.; Li, X. , Establishment of bovine expanded potential stem cells. Proc Natl Acad Sci U S A 2021, 118. [Google Scholar] [CrossRef]
- Bogliotti, Y. S.; Wu, J.; Vilarino, M.; Okamura, D.; Soto, D. A.; Zhong, C.; Sakurai, M.; Sampaio, R. V.; Suzuki, K.; Izpisua Belmonte, J. C.; Ross, P. J. , Efficient derivation of stable primed pluripotent embryonic stem cells from bovine blastocysts. Proc Natl Acad Sci U S A 2018, 115, 2090–2095. [Google Scholar] [CrossRef] [PubMed]
- Chen, A. C. H.; Peng, Q.; Fong, S. W.; Lee, K. C.; Yeung, W. S. B.; Lee, Y. L. , DNA Damage Response and Cell Cycle Regulation in Pluripotent Stem Cells. Genes (Basel) 2021, 12. [Google Scholar] [CrossRef] [PubMed]
- Jiang, J.; Lv, W.; Ye, X.; Wang, L.; Zhang, M.; Yang, H.; Okuka, M.; Zhou, C.; Zhang, X.; Liu, L.; Li, J. , Zscan4 promotes genomic stability during reprogramming and dramatically improves the quality of iPS cells as demonstrated by tetraploid complementation. Cell Res 2013, 23, 92–106. [Google Scholar] [CrossRef] [PubMed]
- Kawamura, T.; Suzuki, J.; Wang, Y. V.; Menendez, S.; Morera, L. B.; Raya, A.; Wahl, G. M.; Izpisua Belmonte, J. C. , Linking the p53 tumour suppressor pathway to somatic cell reprogramming. Nature 2009, 460, 1140–4. [Google Scholar] [CrossRef] [PubMed]
- Marion, R. M.; Strati, K.; Li, H.; Murga, M.; Blanco, R.; Ortega, S.; Fernandez-Capetillo, O.; Serrano, M.; Blasco, M. A. , A p53-mediated DNA damage response limits reprogramming to ensure iPS cell genomic integrity. Nature 2009, 460, 1149–53. [Google Scholar] [CrossRef] [PubMed]
- Sies, H. , Oxidative stress: a concept in redox biology and medicine. Redox Biol 2015, 4, 180–3. [Google Scholar] [CrossRef] [PubMed]
- Zhang, H.; Gong, W.; Wu, S.; Perrett, S. , Hsp70 in Redox Homeostasis. Cells 2022, 11. [Google Scholar] [CrossRef]
- Li, H. S.; Zhou, Y. N.; Li, L.; Li, S. F.; Long, D.; Chen, X. L.; Zhang, J. B.; Feng, L.; Li, Y. P. , HIF-1alpha protects against oxidative stress by directly targeting mitochondria. Redox Biol 2019, 25, 101109. [Google Scholar] [CrossRef] [PubMed]
- Semenza, G. L. , Hypoxia-inducible factor 1: regulator of mitochondrial metabolism and mediator of ischemic preconditioning. Biochim Biophys Acta 2011, 1813, 1263–8. [Google Scholar] [CrossRef] [PubMed]
- Park, H. S.; Hwang, I.; Choi, K. A.; Jeong, H.; Lee, J. Y.; Hong, S. , Generation of induced pluripotent stem cells without genetic defects by small molecules. Biomaterials 2015, 39, 47–58. [Google Scholar] [CrossRef]
- Arvindekar, S.; Jackman, M. J.; Low, J. K. K.; Landsberg, M. J.; Mackay, J. P.; Viswanath, S. , Molecular architecture of nucleosome remodeling and deacetylase sub-complexes by integrative structure determination. Protein Sci 2022, 31, e4387. [Google Scholar] [CrossRef] [PubMed]
- Srinivas, U. S.; Tan, B. W. Q.; Vellayappan, B. A.; Jeyasekharan, A. D. , ROS and the DNA damage response in cancer. Redox Biol 2019, 25, 101084. [Google Scholar] [CrossRef]
- Zhang, J.; Wang, X.; Vikash, V.; Ye, Q.; Wu, D.; Liu, Y.; Dong, W. , ROS and ROS-Mediated Cellular Signaling. Oxid Med Cell Longev 2016, 2016, 4350965. [Google Scholar] [CrossRef]
- Ding, D. F.; Li, X. F.; Xu, H.; Wang, Z.; Liang, Q. Q.; Li, C. G.; Wang, Y. J. , Mechanism of resveratrol on the promotion of induced pluripotent stem cells. Journal of integrative medicine 2013, 11, 389–96. [Google Scholar] [CrossRef] [PubMed]
- Simsek, T.; Kocabas, F.; Zheng, J.; Deberardinis, R. J.; Mahmoud, A. I.; Olson, E. N.; Schneider, J. W.; Zhang, C. C.; Sadek, H. A. , The distinct metabolic profile of hematopoietic stem cells reflects their location in a hypoxic niche. Cell Stem Cell 2010, 7, 380–90. [Google Scholar] [CrossRef]
- Li, J. Y.; Wang, T. T.; Li, C.; Wang, Z. F.; Li, S.; Ma, L.; Zheng, L. L. , Semaphorin 3A-hypoxia inducible factor 1 subunit alpha co-overexpression enhances the osteogenic differentiation of induced pluripotent stem cells-derived mesenchymal stem cells in vitro. Chin Med J (Engl) 2020, 133, 301–309. [Google Scholar] [CrossRef] [PubMed]
- Katagiri, N.; Hitomi, H.; Mae, S. I.; Kotaka, M.; Lei, L.; Yamamoto, T.; Nishiyama, A.; Osafune, K. , Retinoic acid regulates erythropoietin production cooperatively with hypoxia-inducible factors in human iPSC-derived erythropoietin-producing cells. Sci Rep 2021, 11, 3936. [Google Scholar] [CrossRef] [PubMed]
- Ayabe, H.; Anada, T.; Kamoya, T.; Sato, T.; Kimura, M.; Yoshizawa, E.; Kikuchi, S.; Ueno, Y.; Sekine, K.; Camp, J. G.; Treutlein, B.; Ferguson, A.; Suzuki, O.; Takebe, T.; Taniguchi, H. , Optimal Hypoxia Regulates Human iPSC-Derived Liver Bud Differentiation through Intercellular TGFB Signaling. Stem Cell Reports 2018, 11, 306–316. [Google Scholar] [CrossRef]
Figure 1.
MBD3 KD improved the reprogramming efficiency of bovine iPSCs. (A) Schematic diagram of bovine iPSCs generation from bovine fetal fibroblasts (BFFs) by reprogramming. (B) Representative morphologies at different stages in the reprogramming process. Scale bars, 100 μm. (C) Analysis of reprogramming efficiency of transfected siMBD3 and non-targeting siRNA (serving as negative control). (D) MBD3 knockdown efficiency at 96 hours after siRNA transfection during reprogramming. (E) Clonal morphology and AP staining of bovine iPSCs. Scale bars, 100 μm. (F) Expression of MBD3 protein in the nucleus of iPSC-NC and iPSC-siMBD3 cells. (G) Distribution of MBD3-binding sites with respect to the TSS in bovine iPSCs is shown, and MBD3-recognized DNA motifs identified by MEME-ChIP in bovine iPSCs. MEME suite was used to determine E-value of motif. (H) MBD3-bound genes in iPSC-NC cells and iPSC-siMBD3 cells. Shown is a 3 kb window centered on the peak.
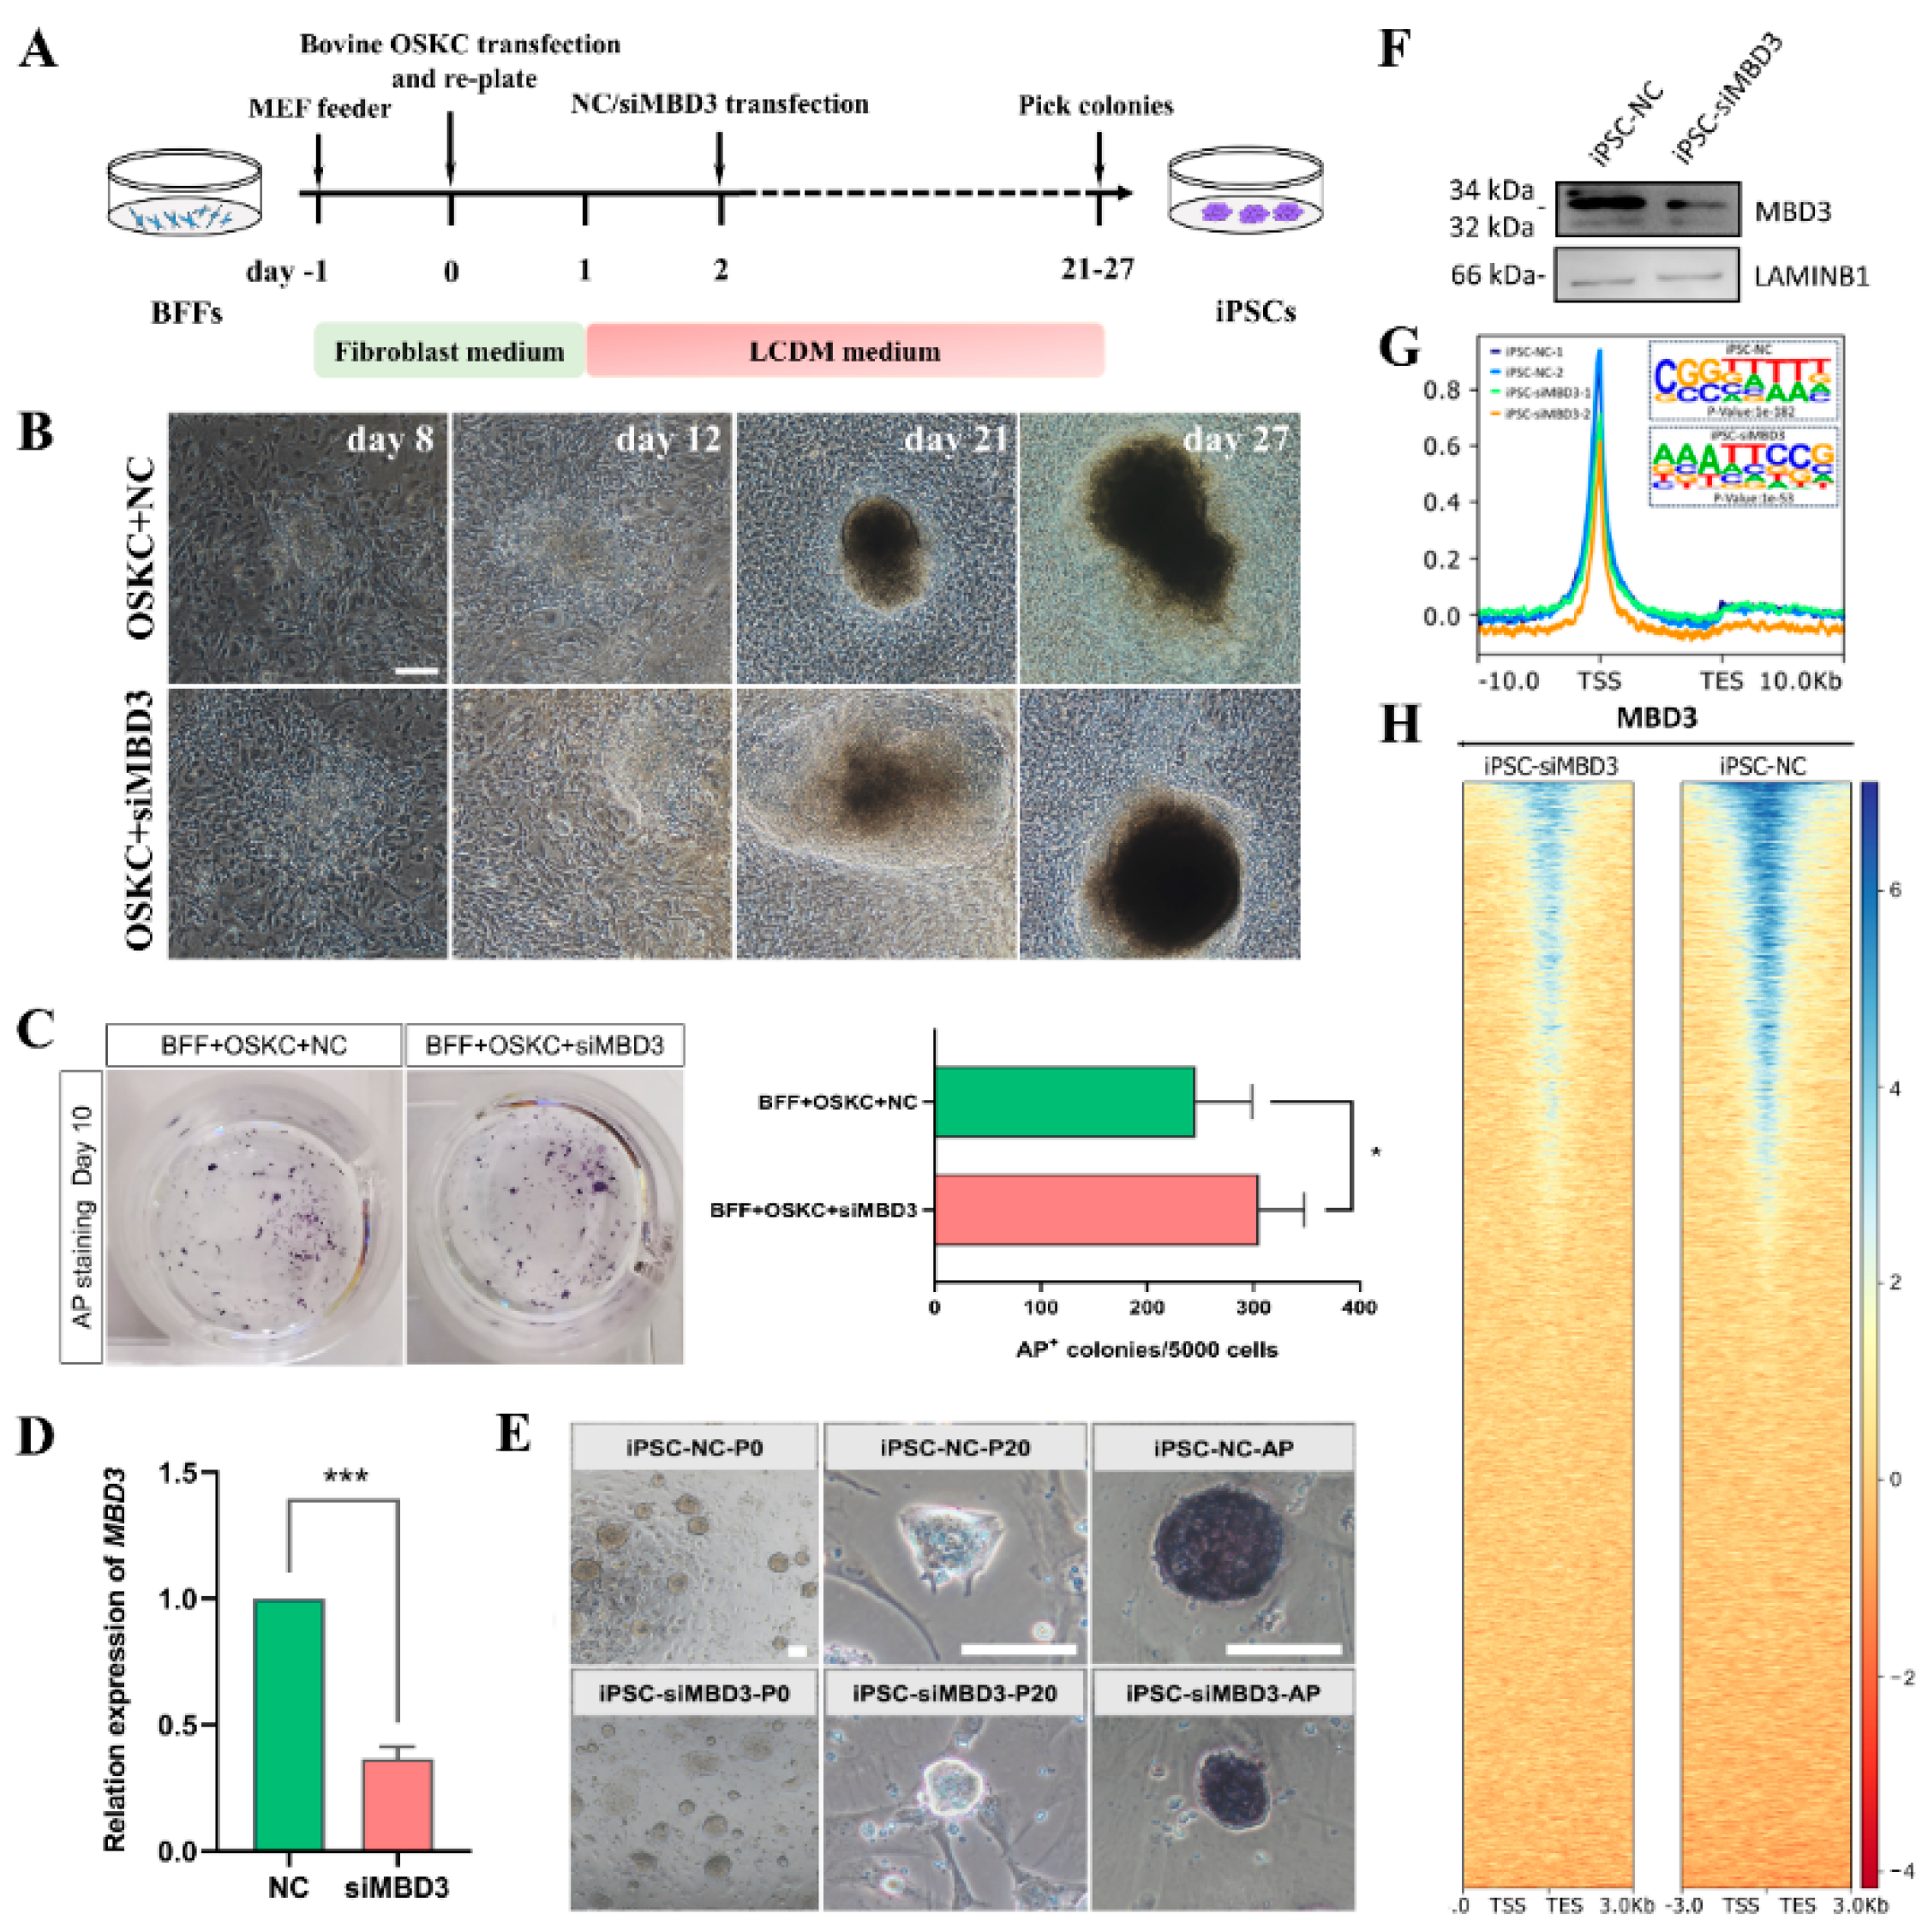
Figure 2.
MBD3 KD promotes pluripotency and differentiation potential of bovine iPSCs. (A) Heatmap clustering of bovine iPSCs and BFFs. (B) Venn Diagram in iPSC-NC and iPSC-siMBD3 cells. (C) PCA between bovine iPSC-NC, iPSC-siMBD3, EPSC-LXH, EPSC-XJZ, iPSCs-LXL and ESC-F7 cells. (D) Expression of pluripotency genes in iPSC-NC cells and iPSC-siMBD3 cells. (E) Expression of endogenous and exogenous OCT4, SOX2, KLF4 and C-MYC in iPSC-NC cells and iPSC-siMBD3 cells. (F) Immunofluorescence staining of pluripotent markers. Nuclei were stained with DAPI. Scale bars, 100 μm. (G) Teratoma derived from iPSC-NC and iPSC-siMBD3 (passage 30). HE staining analysis revealed the presence of the three germ layers (mesoderm, ectoderm, and endoderm). Scale bar, 50 μm. (H) The qRT-PCR analysis and immunofluorescence staining of EBs formed by bovine iPSC-NC cells. Nuclei were stained with DAPI. Scale bars, 100 μm. (I) The qRT-PCR analysis and immunofluorescence staining of EBs formed by bovine iPSC-siMBD3 cells. Nuclei were stained with DAPI. Scale bars, 100 μm.
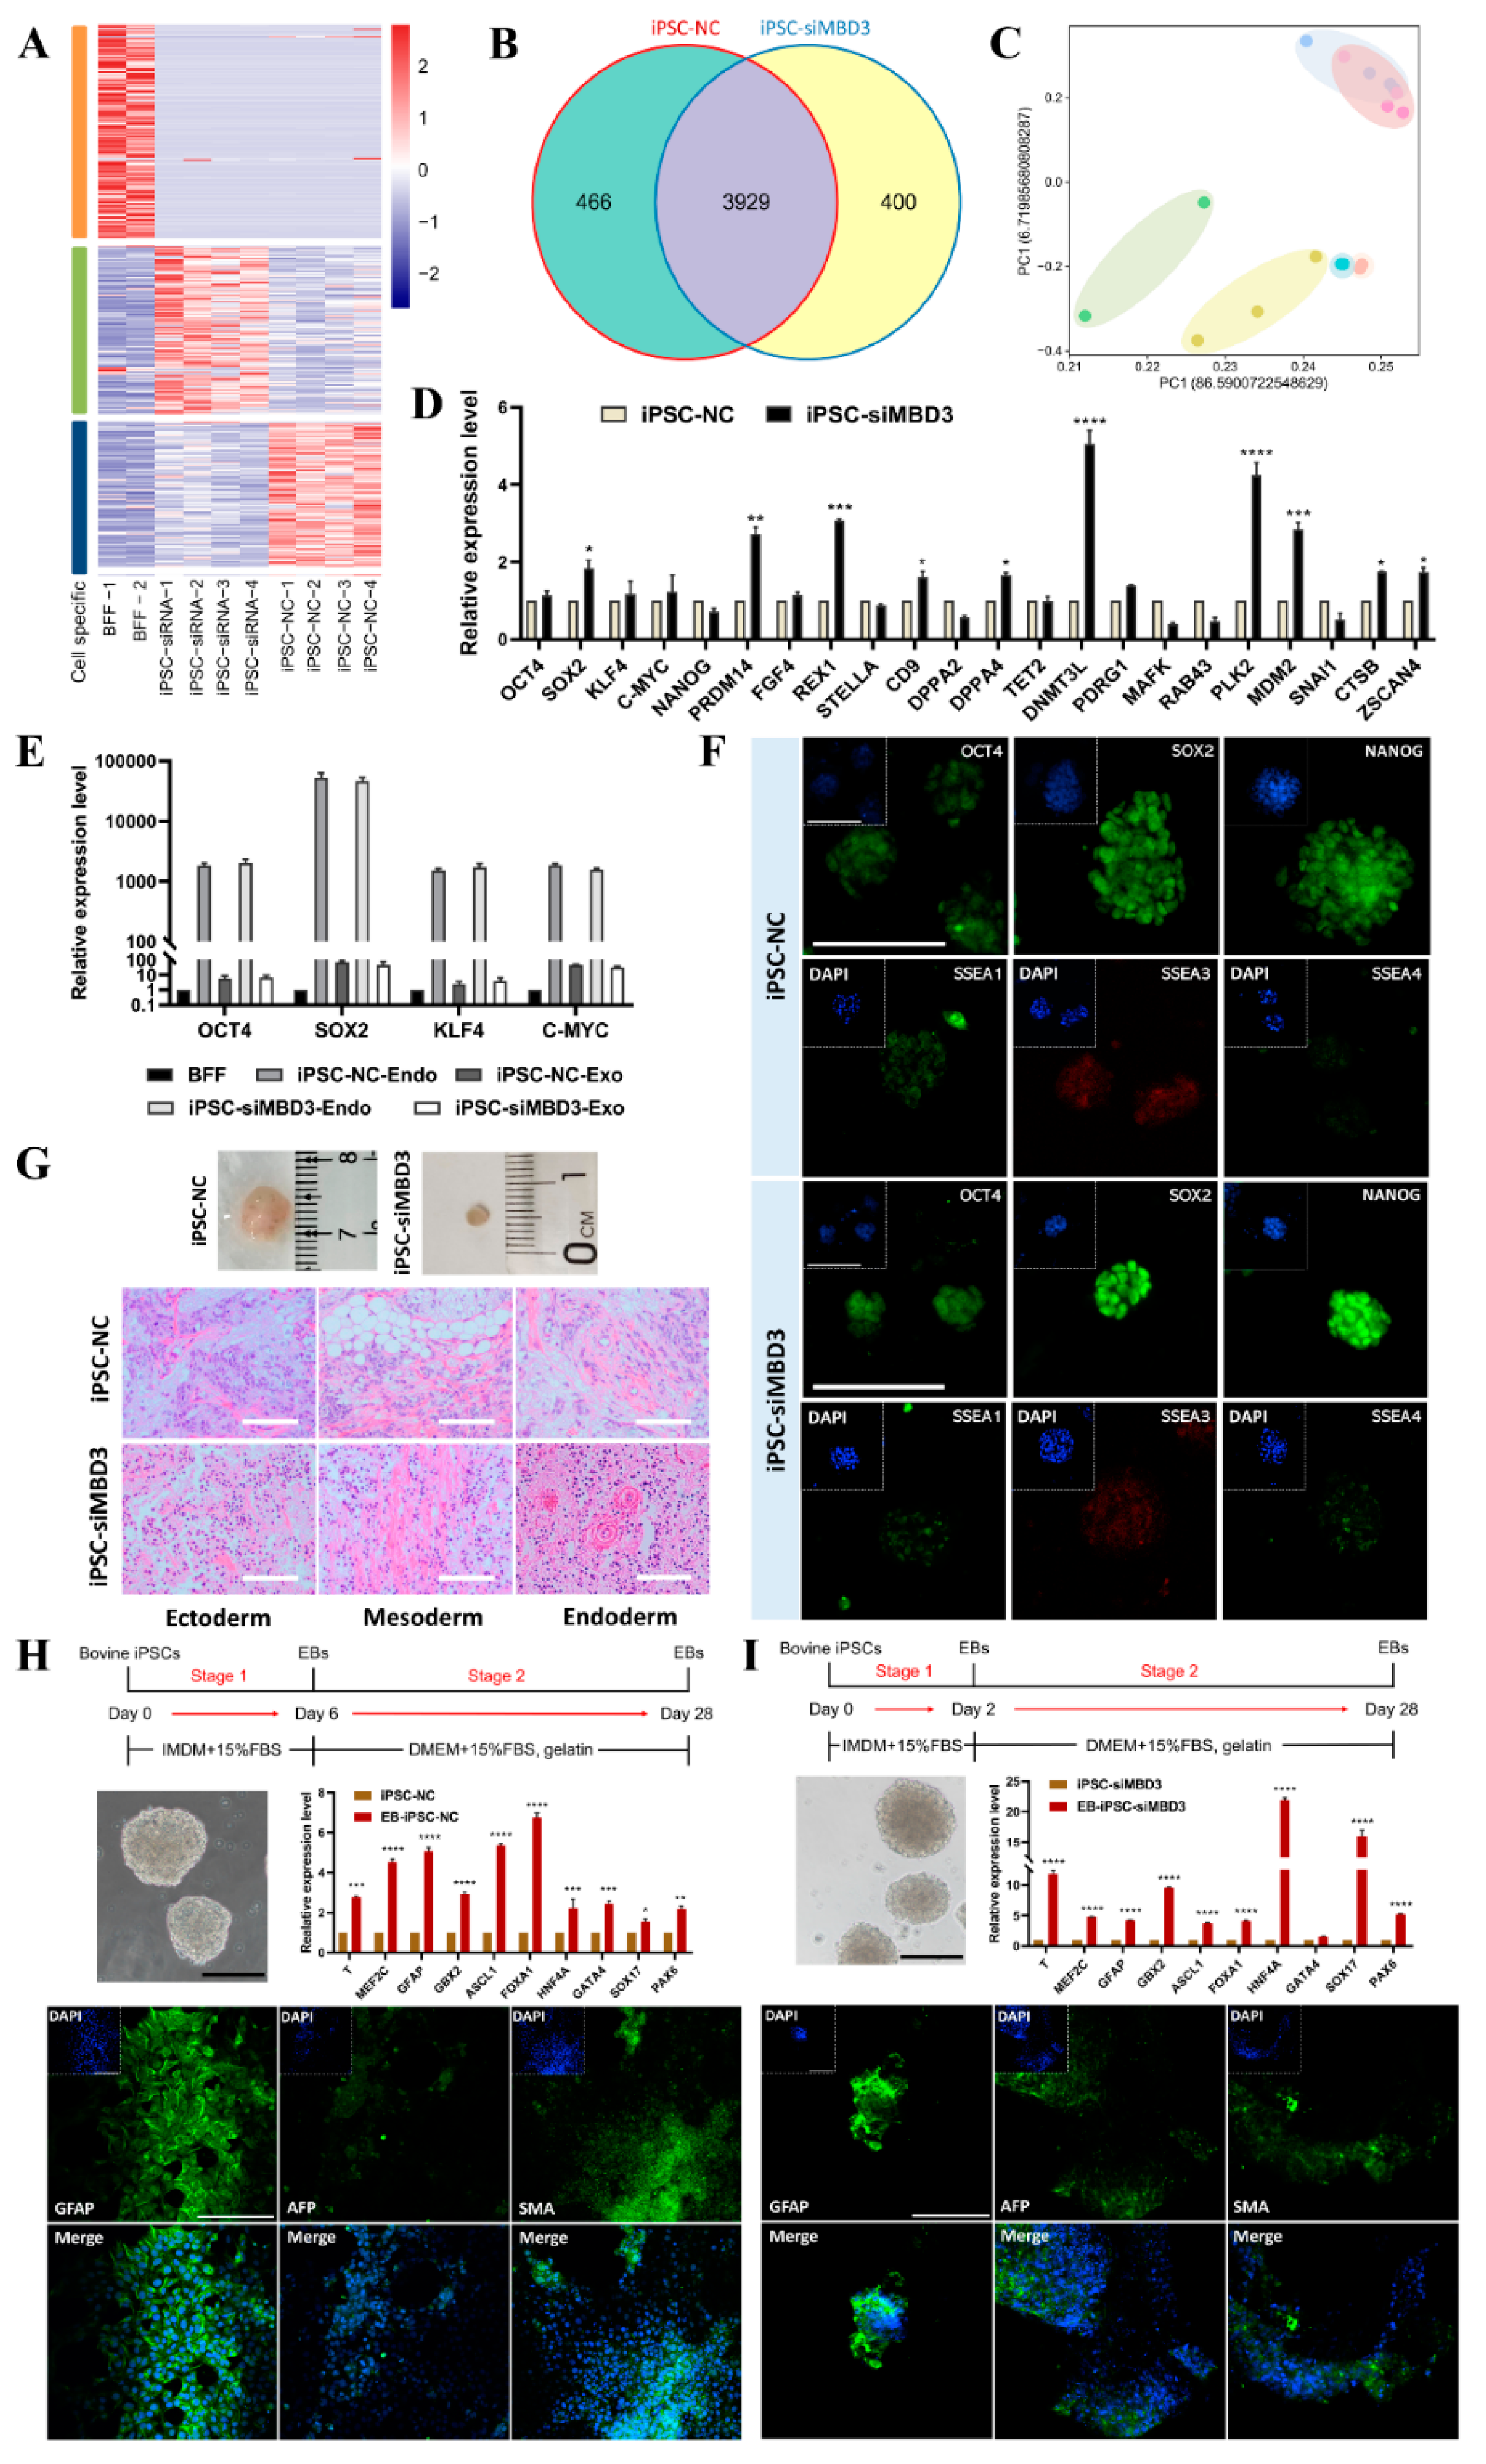
Figure 3.
MBD3 KD reduces DNA damage during promotes the generation of bovine iPSCs. (A) Immunofluorescence staining of γH2AX on day 10 of reprogramming after transfection of siMBD3 and NC. Nuclei were stained with DAPI. Scale bars, 50 μm. (B) Expression of RAD51 and BRCA1 during reprogramming after transfection of siMBD3 and NC. (C) Immunofluorescence staining of γH2AX, RAD51, and BRCA1 in iPSC-siMBD3 cells and iPSC-NC cells. Nuclei were stained with DAPI. Scale bars, 50 μm. (D) Expression of RAD51 and BRCA1 in iPSC-siMBD3 cells and iPSC-NC cells. (E) GSEA of iPSC-NC cells and iPSC-siMBD3 cells. (F) γH2AX staining on day 10 of reprogramming after transfection of PB-MBD3 and PB-CAG. Nuclei were stained with DAPI. Scale bars, 50 μm. (G) Expression of RAD51 and BRCA1 during reprogramming after transfection of PB-MBD3 and PB-CAG.
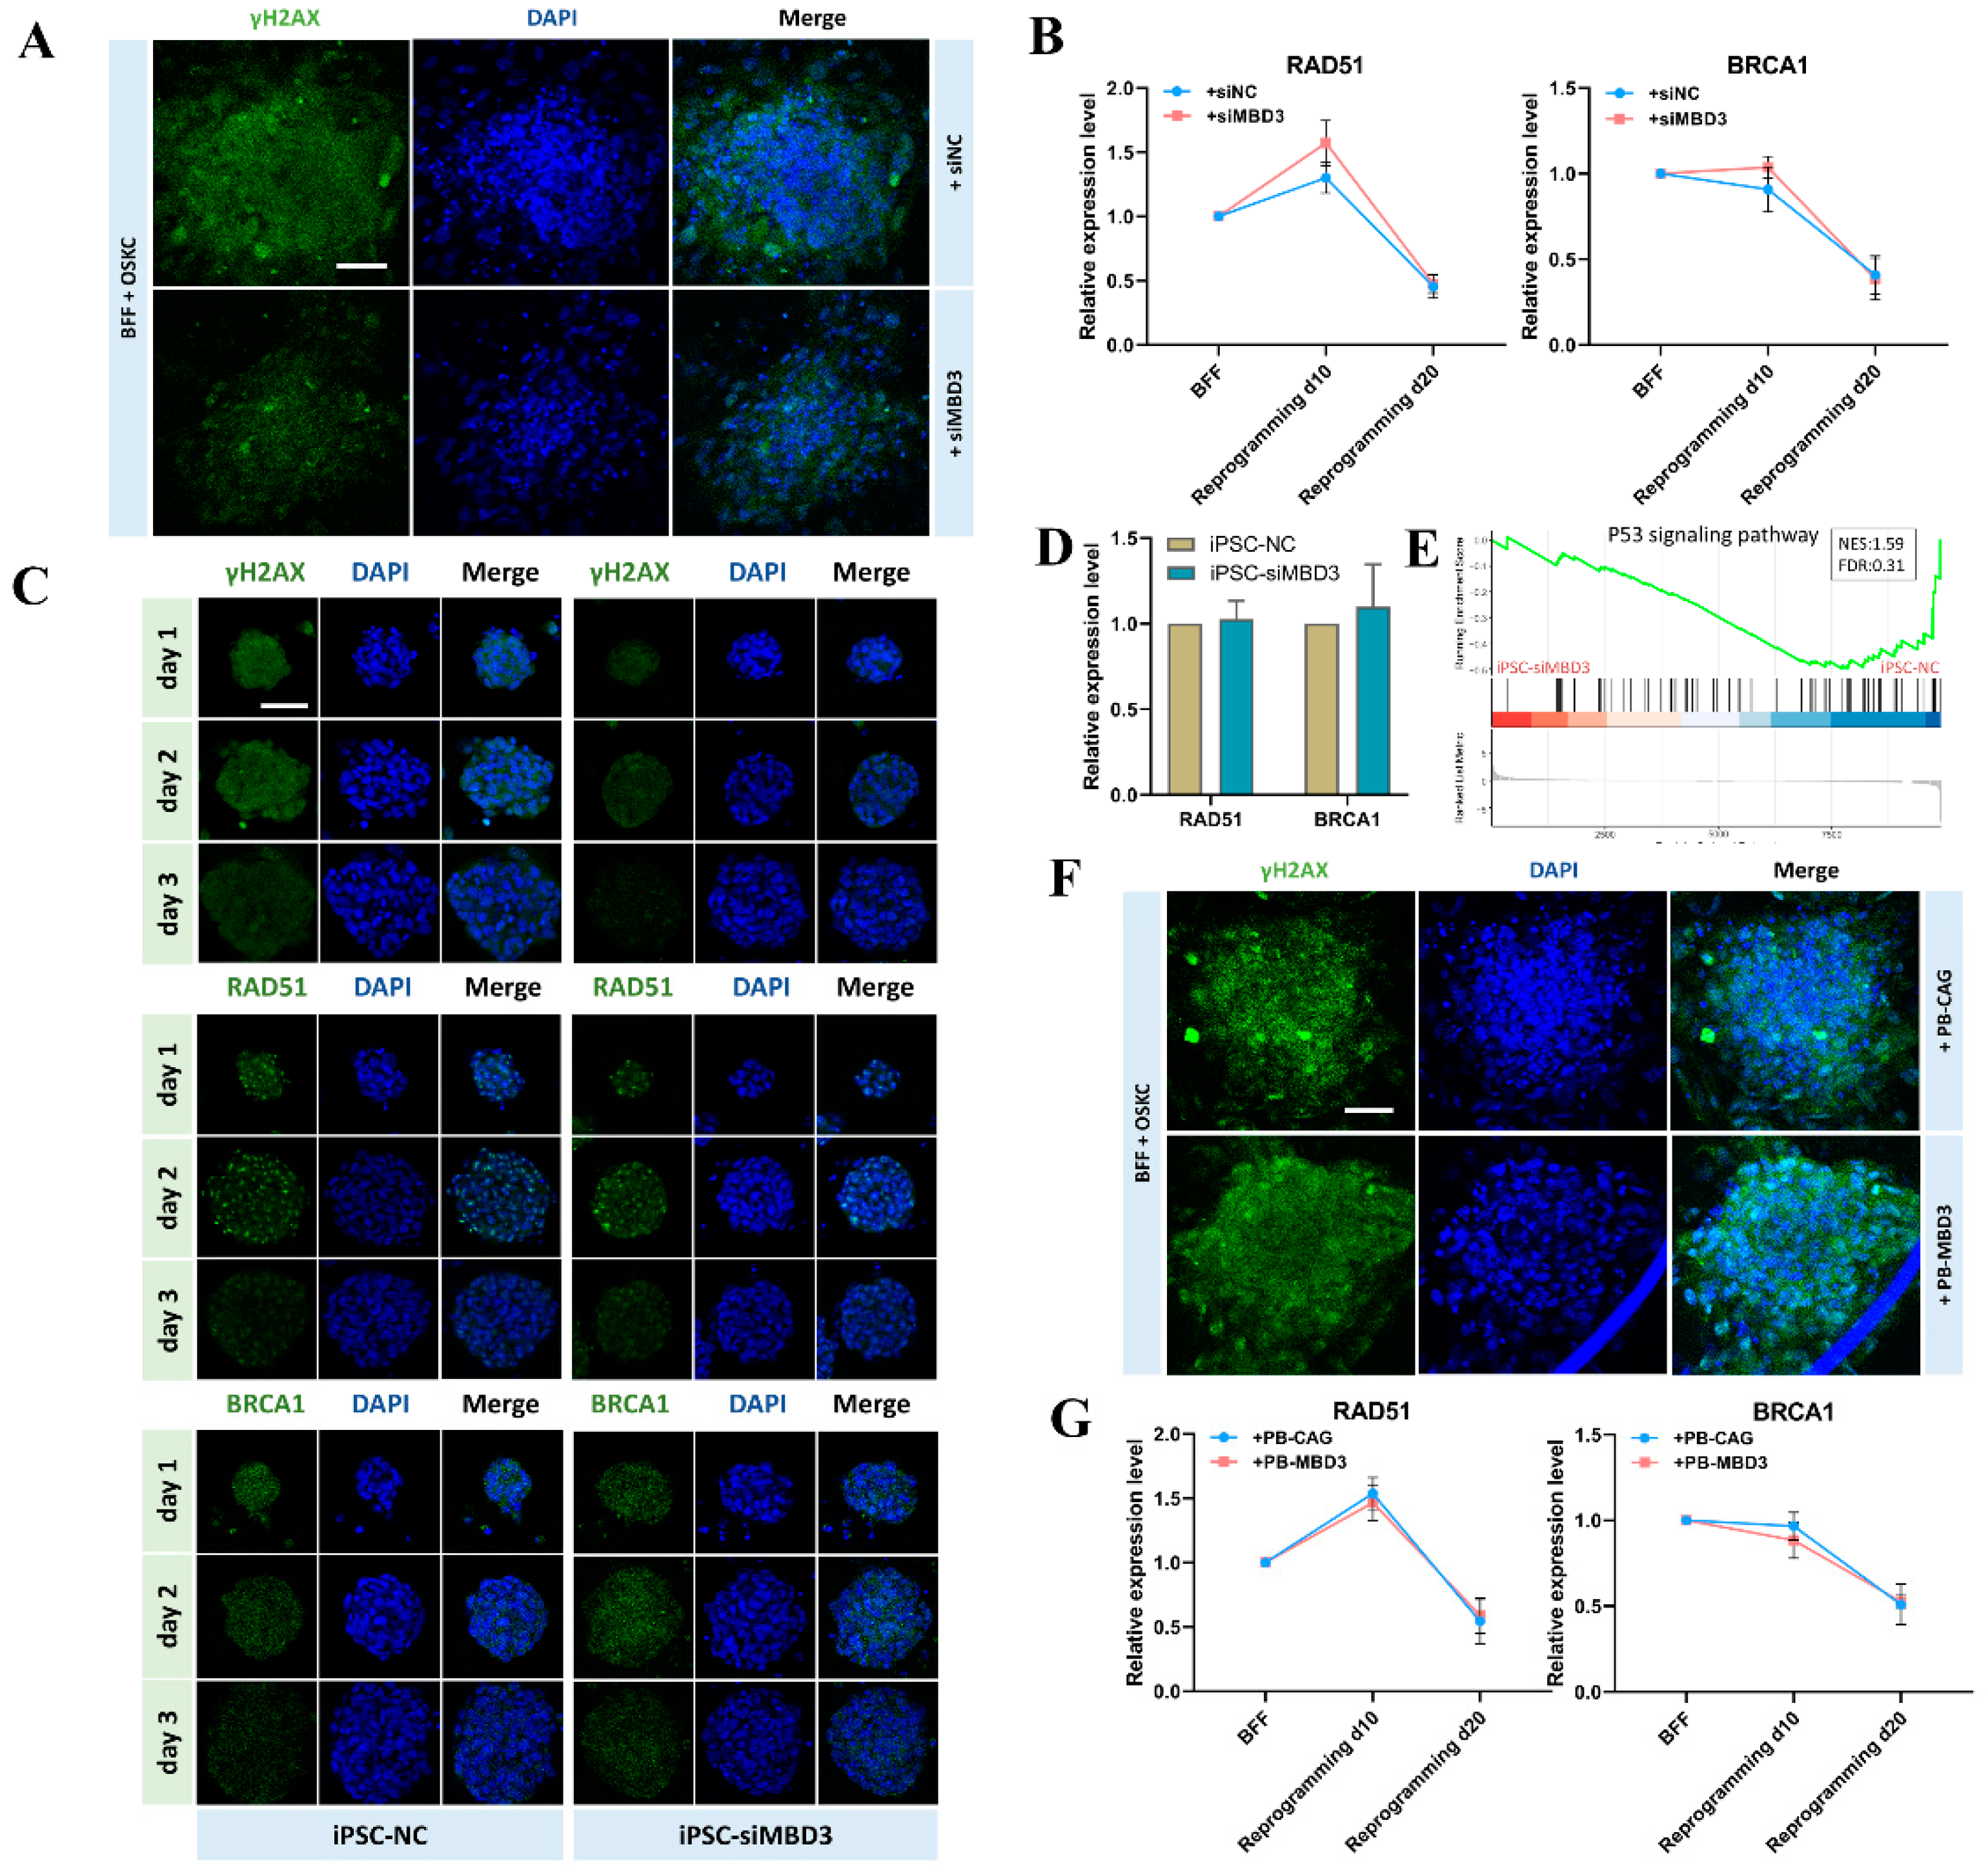
Figure 4.
MBD3 KD decreases ROS levels in bovine iPSCs to avoid DNA damage. (A) Flow cytometry to detect ROS levels in iPSC-NC cells and iPSC-siMBD3 cells. (B) Quantification of mean fluorescence intensity in A. (C) The proportion of DCFH-DA probe positive cells in A. (D) Flow cytometry to detect mitochondrial membrane potential (ΔΨm) in iPSC-NC cells and iPSC-siMBD3 cells. (E) Quantification of mean fluorescence intensity in D. (F) The proportion of TMRE positive cells in D. (G) TMRE staining is dependent on ΔΨm and Nuclei were stained with Hoechst 33342. Scale bars, 50 μm. (H) GSEA of iPSC-NC cells and iPSC-siMBD3 cells.
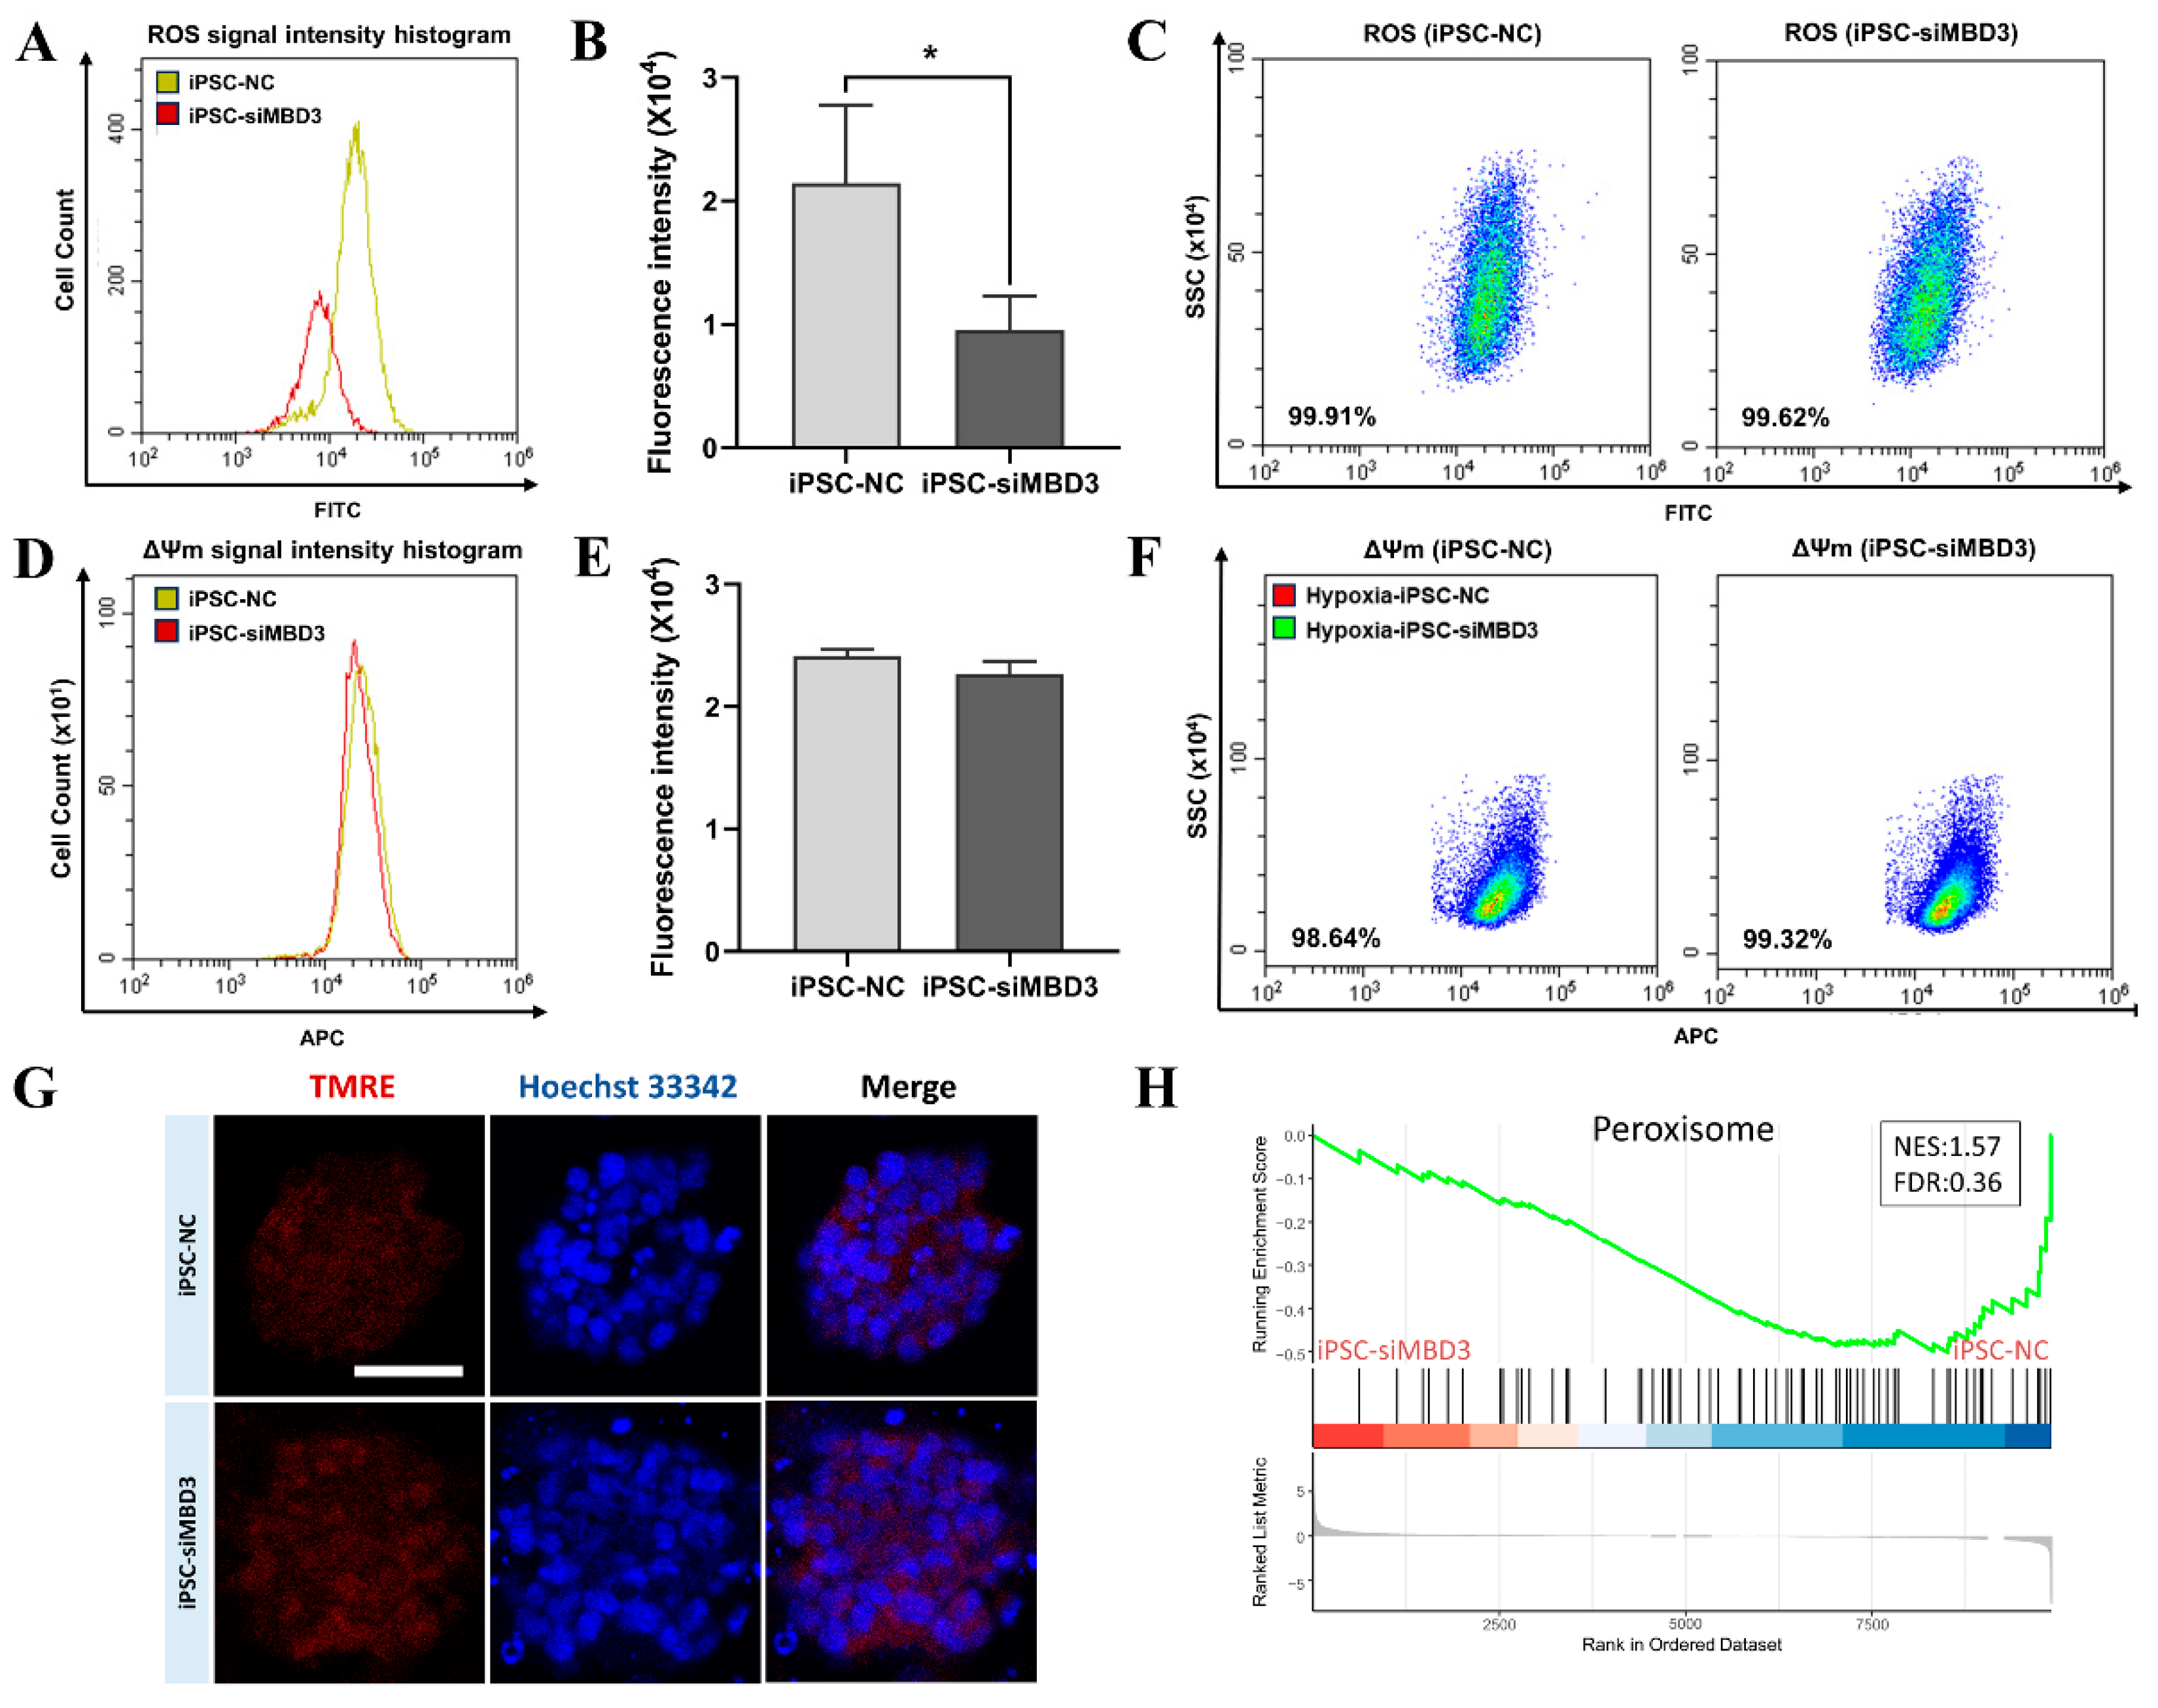
Figure 5.
MBD3 KD reduces ROS produced by oxidative stress in bovine iPSCs under hypoxia condition. (A) Flow cytometry was used to detect the ROS levels of iPSC-NC cells and iPSC-siMBD3 cells after 24 hours of hypoxia treatment. (B) Quantification of mean fluorescence intensity in A. (C) The proportion of DCFH-DA probe positive cells in A. (D) Flow cytometry to detect mitochondrial membrane potential (ΔΨm) in iPSC-NC cells and iPSC-siMBD3 cells after 24 hours of hypoxia treatment. (E) Quantification of mean fluorescence intensity in D. (F) The proportion of TMRE positive cells in D. (G) TMRE staining is dependent on ΔΨm and nuclei were stained with Hoechst 33342. Scale bars, 50 μm. (H) Immunofluorescence staining of γH2AX in iPSC-NC cells and iPSC-siMBD3 cells after 24 h of hypoxia treatment. Nuclei were stained with DAPI. Scale bars, 50 μm.
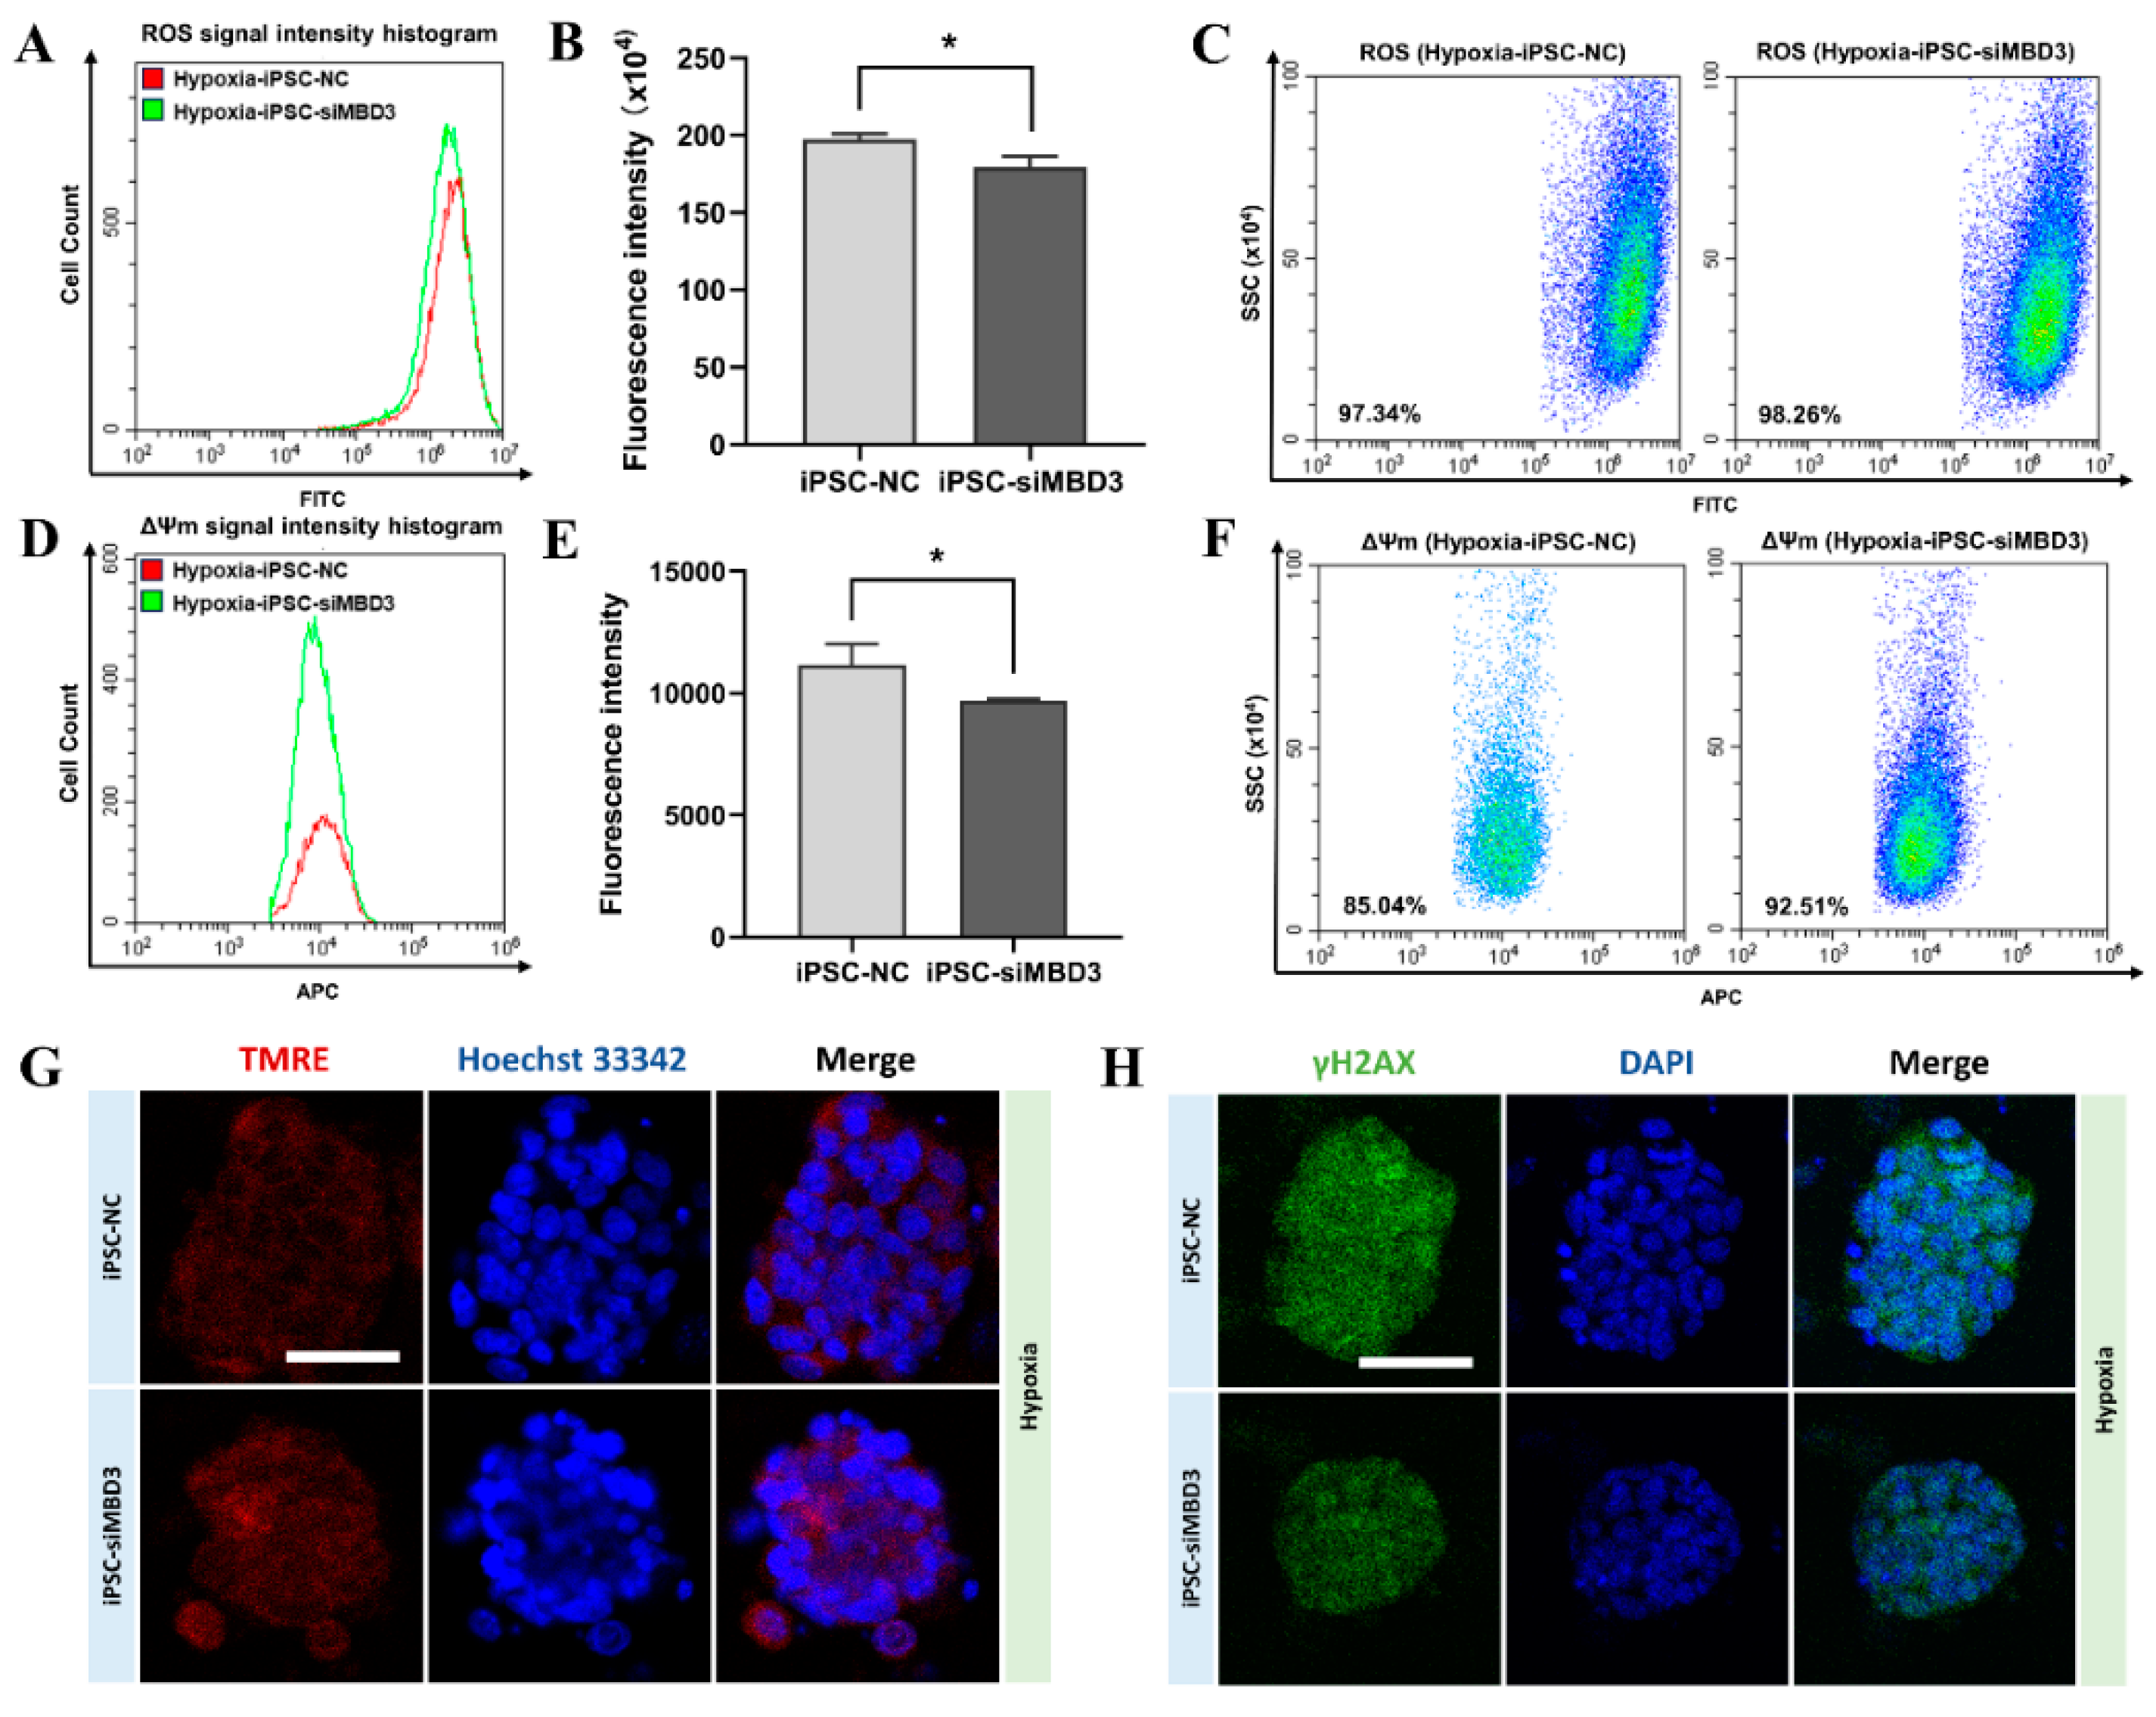
Figure 6.
MBD3 KD increases HIF1A expression to resist ROS generated by oxidative stress in bovine iPSCs. (A) Expression of UCP2, HIF1A, ACACA, TFAM and POLG during reprogramming after transfection of siMBD3 and NC. (B) Expression of UCP2, HIF1A, ACACA, TFAM and POLG during reprogramming after transfection of PB-MBD3 and PB-CAG. (C) Expression of UCP2, HIF1A, ACACA, TFAM and POLG in iPSC-siMBD3 cells and iPSC-NC cells. (D) Western blotting analysis of DNMT3A/B, HDAC1 and MBD3 protein. (E) ChIP-seq reveals MBD3 binding in a 20 kb region surrounding HIF1A. (F) The mRNA expression levels of mtDNA-encoded genes in bovine iPSCs. (G) The mRNA expression levels of mtDNA-encoded genes in bovine iPSCs after 24 h of hypoxia. (H) The pattern diagram of MBD3 KD reducing DNA damage through HIF1A.
Disclaimer/Publisher’s Note: The statements, opinions and data contained in all publications are solely those of the individual author(s) and contributor(s) and not of MDPI and/or the editor(s). MDPI and/or the editor(s) disclaim responsibility for any injury to people or property resulting from any ideas, methods, instructions or products referred to in the content. |
© 2025 by the authors. Licensee MDPI, Basel, Switzerland. This article is an open access article distributed under the terms and conditions of the Creative Commons Attribution (CC BY) license (http://creativecommons.org/licenses/by/4.0/).
Copyright: This open access article is published under a Creative Commons CC BY 4.0 license, which permit the free download, distribution, and reuse, provided that the author and preprint are cited in any reuse.


