
Submitted:
24 January 2025
Posted:
27 January 2025
You are already at the latest version
Abstract
This paper introduces a machine learning framework to predict structural failures during ship dismantling, focusing on four common recycling methods: Dry Docking, Pier Breaking/Alongside, Landing/Slipway, and Beaching. The framework leverages advanced techniques, including generative data imputation (WFGAIN-GP), GAN-based augmentation, and a multi-model approach combining Random Forests and Graph Neural Networks, to address challenges like incomplete data and method-specific risks. Results indicate that beaching poses the highest failure risks due to uncontrolled stresses, while Landing/Slipway methods demonstrated the lowest failure probabilities in this study, attributed to ship-specific factors such as age and corrosion rates. The model also highlights the influence of recycling methods on structural risks and showcases the potential for integrating real-time monitoring to enhance safety and operational efficiency. Future work will focus on validating the model with real-world data and incorporating advanced degradation models to improve predictive accuracy. This framework provides a robust foundation for improving safety and risk management in the ship recycling industry.
Keywords:
machine learning
; structural failure prediction
; ship recycling
; data imputation
; failure probability
; risk‐based maintenance (RBM)
; real‐time monitoring
; generative data augmentation
1. Introduction
Ship dismantling is an essential phase in the lifecycle of maritime vessels, where ships are decommissioned, stripped of valuable materials, and broken down for recycling. However, this process carries significant risks, including structural failures and safety hazards [1,2]. These risks arise from the nature of the ship's materials [3], prolonged exposure to harsh marine environments, and the specific method used for dismantling [4]. Ship recycling methods vary across regions, each introducing unique risks:
- Dry Docking: Ships are sailed into a dock, and the water is pumped out, leaving the vessel dry for dismantling. Workers cut the ship into pieces in a controlled environment. While effective, this method is costly and is rarely used solely for recycling purposes, except in Europe.
- Pier Breaking/Alongside: Ships are dismantled while moored alongside a wharf or quay in calm waters. Cranes are used to remove large sections of the ship until the remaining structure is small enough for final cutting in a dry dock. This method is commonly used in China, Europe, and the US.
- Landing/Slipway: Ships are brought ashore onto a concrete slipway or against the shore where there are minimal tides. A mobile crane or other equipment is used to dismantle the ship, typically in regions like Turkey. Temporary quays or jetties may also be employed to facilitate heavy lifting and cutting.
- Beaching: A high-risk method where ships are driven onto tidal beaches for dismantling. This method involves driving a lightened ship at full speed onto a tidal beach. Workers then dismantle the ship in place, cutting the vessel into pieces that are processed and recycled. Beaching is commonly practiced in Bangladesh, India, and Pakistan.
Figure 1.
Ship Recycling Methods.
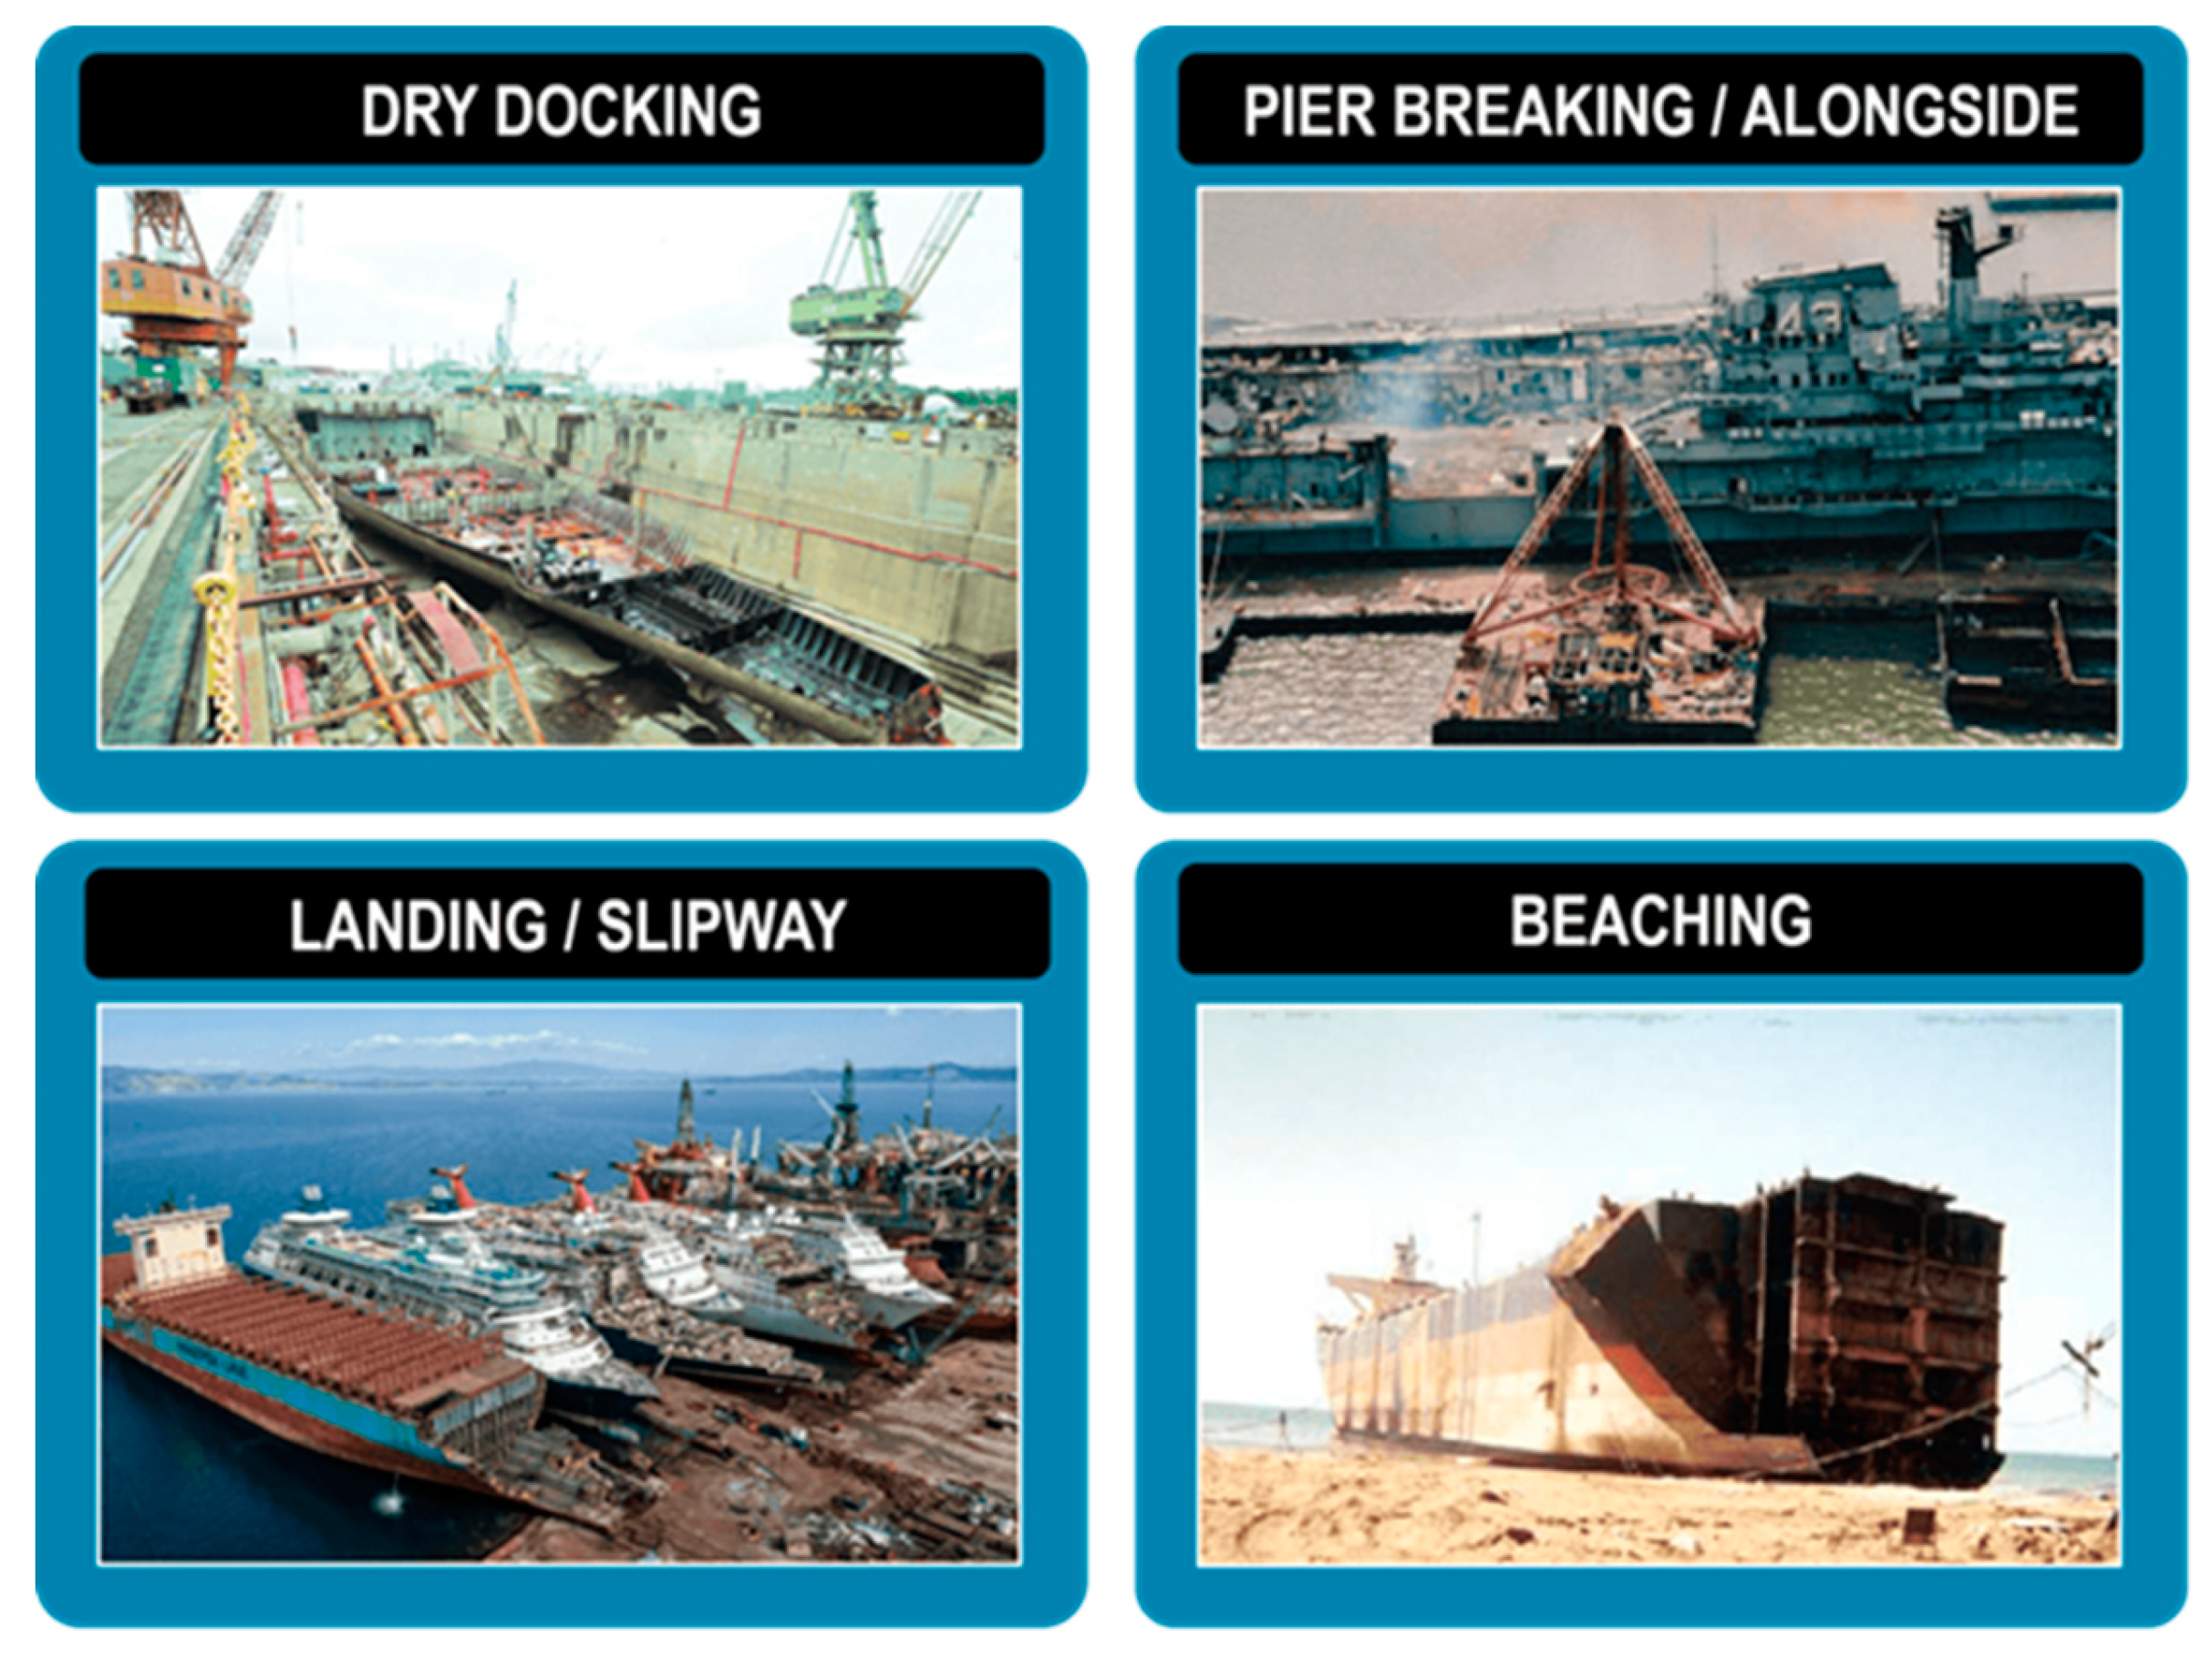
Each of these methods presents specific challenges and risks associated with the structural integrity of the vessel during dismantling. For example, beaching exposes ships to uneven stresses, increasing the likelihood of collapse, while dry docking offers a controlled environment, reducing the risk of sudden structural failure. The varied methods impact the structural integrity of ships, leading to unique challenges in predicting structural failure during the dismantling process.
1.2. Challenges in Predicting Structural Failure
Predicting when and where structural failures might occur is essential for enhancing safety during dismantling operations. However, this task is complicated by several factors:
- Incomplete and inconsistent data: Data on ship condition, material integrity, and failure history are often incomplete, especially in shipyards with limited reporting capabilities.
- Dynamic Nature of Dismantling: As the dismantling process progresses, the structural integrity of the ship changes, necessitating real-time updates to failure predictions.
These challenges make it difficult to build reliable models that predict structural failures with high accuracy.
1.3. The Role of Machine Learning
Machine learning (ML) offers a powerful solution to these challenges by enabling models to learn from historical data and predict future events, even with incomplete or inconsistent datasets. Machine learning models, such as the Bayesian-optimized long short-term memory (Bo-LSTM) neural network, can predict ship structure response signals, enabling timely damage detection [10]. Hybrid modeling strategies combine experimental and numerical data to create realistic training sets for ML algorithms, improving damage identification capabilities [11]. This paper presents a machine learning-based framework designed to predict structural failures during ship dismantling, with a focus on three vessel types: bulk carriers, tankers, and container ships. The model accounts for differences in material wear, variations in recycling methods (beaching, docking, etc.), and gaps in data reporting from different shipyards.
1.4. Structural Failure Prediction in Ship Dismantling
Research on structural failure in ship recycling is limited but critical. Some studies have focused on modeling material degradation and fatigue in ship structures, but these efforts have primarily addressed the operational phase of a ship's lifecycle rather than the dismantling process. For instance, (Dong et al., (2022; Garbatov & Guedes Soares, 2012; Gong et al., 2019) explored material fatigue and corrosion in active vessels, but their findings offer limited direct application to dismantling scenarios. Other research has explored data-driven approaches for fault detection in machinery, which could provide insights for the ship recycling industry [15,16,17,18]. Traditionally, failure prediction has relied on deterministic models such as finite element analysis (FEA) and fault-tree analysis, which simulate failure conditions under various scenarios. However, these models often require detailed, high-quality input data that may not be available in all shipyards. For example, Kitamura [19] explored the application of FEM in predicting hull failure in ships but highlighted the challenges of data accuracy and the inherent complexity of real-world shipyard conditions, which often led to inconsistencies in simulation outcomes.
1.5. Data-Driven Models in Industrial Safety
In other industrial contexts, data-driven models have been used to predict equipment failure and structural degradation. For instance, time series models and machine learning algorithms have been applied in fields such as oil and gas, mining, and aviation to predict failure based on historical data [20]. Refs. [21,22] showed that Random Forests and Gradient Boosting Machines (GBMs) are effective at predicting equipment failure with incomplete data, a challenge often encountered in ship dismantling as well. However, few studies have applied such models specifically to the ship recycling industry.
1.6. Machine Learning in Maritime Applications
Machine learning has been increasingly used in maritime applications, such as autonomous ship navigation and vessel traffic management [23]. Recent studies have explored using ML for safety and risk management. For example, [24] applied neural networks to predict the likelihood of collisions at sea. However, the use of machine learning to predict structural failure during dismantling is still relatively unexplored, particularly with respect to handling incomplete data from diverse ship types and recycling methods.
1.7. Addressing Data Gaps in Ship Recycling
One of the key challenges in the ship recycling industry is the inconsistent reporting of incidents and material conditions. Few studies have focused on how to address these data gaps in predictive models. [25] discussed the need for data standardization across shipyards, but practical solutions for dealing with incomplete data have yet to be fully explored. This paper seeks to fill this gap by proposing a machine learning framework that incorporates advanced imputation techniques and data augmentation to predict structural failure.
The remainder of this paper is structured as follows:
- Section 2 presents the methodology used to develop the machine learning model, including data collection, preprocessing, and the model architecture.
- Section 3 provides the results of the model using hypothetical data generated to simulate real-world scenarios.
- Section 4 discusses the implications of the findings and potential applications in ship recycling operations.
- Section 5 concludes the paper and proposes directions for future research.
2. Materials and Methods
The methodology outlines the process of collecting data, handling missing values, feature engineering, model training, and evaluation of a machine learning framework for predicting structural failures during ship dismantling. The aim is to address incomplete data reporting from shipyards and improve failure predictions across various recycling methods.
2.1. Data Collection and Preprocessing
The success of any predictive model hinges on the quality and completeness of the data used. Ship dismantling operations often involve incomplete and inconsistent records, particularly for critical variables like corrosion rates, historical failures, and material integrity. To address these challenges, this study relied on a combination of collected and imputed data to construct a reliable dataset. The dataset for this study includes 275 vessels, derived from the 2023 Annual List of Ships Scrapped Worldwide, published by the NGO Shipbreaking Platform [26]. This comprehensive dataset provides detailed attributes such as ship type, material composition, age, gross tonnage, and historical performance metrics. These attributes served as the foundation for imputing missing values and building the machine learning model.
This study focuses on three types of ships—tankers, bulk carriers, and container ships—representing the primary vessel types dismantled globally. Each ship type has unique structural and operational characteristics that influence its failure probability during dismantling. The dataset includes the following attributes:

Table 1.
Key attributes of Ship Types in the Dataset.
| Ship Type | Material Composition | Historical Structural Failures (Imputed) | Dismantling Method |
| Tanker | Steel (95%), Aluminium (4%), Other (1%) | 13.96 | Beaching |
| Bulk Carrier | Steel (85%), Aluminium (10%), Other (5%) | 28.41 | Dry Docking |
| Container Ship | Steel (90%), Aluminium (5%), Other (5%) | 16.15 | Landing/Slipway |
The historical failures were imputed using advanced generative imputation techniques, including the Wasserstein Generative Adversarial Network with Gradient Penalty (WFGAIN-GP). These values estimate the number of structural failures based on observed patterns and relationships in similar vessels, addressing the gaps left by incomplete shipyard records.
For tankers, the corrosion rate of 1.2% was calculated based on projected material degradation described in the report "Corrosion, Inspection, and Maintenance of Oil Tankers," [27] referencing thickness loss and environmental exposure over the service life. For bulk carriers and container ships, the corrosion rates were imputed using the WFGAIN-GP method due to incomplete records. The following table summarizes the corrosion rates for each ship type:
Table 2.
Corrosion Rates and Ages of Ships by Type and Dismantling Method.
| Ship Type | Material Composition | Corrosion Rate (Derived/Imputed) | Age (Years) | Dismantling Method |
| Tanker | Steel (95%), Aluminium (4%), Other (1%) | 1.2% (Derived) | 30 | Beaching |
| Bulk Carrier | Steel (85%), Aluminium (10%), Other (5%) | 1.5% (Imputed) | 25 | Dry Docking |
| Container Ship | Steel (90%), Aluminium (5%), Other (5%) | 1.8% (Imputed) | 20 | Landing/Slipway |
These imputed corrosion rates reflect the degradation of structural materials over time and provide essential input for the failure probability model. The dataset also considers the dismantling methods employed for each ship type, as these significantly influence structural failure probabilities.
2.2. Handling Missing Data
Missing data is a significant challenge in the ship dismantling dataset, particularly for corrosion rates and historical failure records. The 2023 dataset from the NGO Shipbreaking Platform provided a robust basis for addressing these gaps, offering comprehensive information on ship attributes that informed the imputation process. Advanced imputation techniques were employed to ensure the dataset’s completeness and reliability. These techniques included:
- 1.
- Multiple Imputation by Chained Equations (MICE): Used to estimate missing corrosion rates based on observed variables such as material composition, ship age, and dismantling method. Generated multiple plausible datasets and averaged results to reduce imputation bias.
- 2.
- K-Nearest Neighbours (KNN): Applied to impute missing historical failure records by identifying similar entries in the dataset and using their values. Effective for handling localized patterns within smaller datasets.
- 3.
- Wasserstein Generative Adversarial Network with Gradient Penalty (WFGAIN-GP): Introduced as an advanced method to enhance imputation robustness by capturing non-linear relationships between variables. Its workflow involved:
- -
- A Generator predicting missing values based on observed patterns.
- -
- A Discriminator evaluating the quality of imputations by distinguishing between real and generated data.
- -
- A Gradient Penalty ensuring training stability and preventing overfitting.
- -
- WFGAIN-GP demonstrated superior performance, reducing Root Mean Square Error (RMSE) by 15% compared to MICE and KNN.
2.2.1. Validation of Imputed Data
The imputed datasets were validated to ensure accuracy and reliability in predicting structural failures. Validation metrics such as Root Mean Square Error (RMSE) and Mean Absolute Percentage Error (MAPE) were calculated for each imputation method across all ship types. The results demonstrated the superior performance of WFGAIN-GP, particularly in reducing RMSE and MAPE values compared to traditional methods like MICE and KNN. The table below summarizes the validation metrics for each imputation method:
Table 3.
Validation Metrics for Imputation Methods Across Ship Types.
| Imputation Method | Metric | Tanker | Bulk Carrier | Container Ship |
| MICE | RMSE (%) | 0.05 | 0.08 | 0.07 |
| KNN | RMSE (%) | 0.04 | 0.07 | 0.06 |
| WFGAIN-GP | RMSE (%) | 0.03 | 0.05 | 0.04 |
| MICE | MAPE (%) | 12.3 | 10.8 | 11.7 |
| KNN | MAPE (%) | 11.1 | 9.4 | 10.3 |
| WFGAIN-GP | MAPE (%) | 9.6 | 8.2 | 9.1 |
These metrics demonstrate that WFGAIN-GP achieved the lowest RMSE and MAPE values, indicating more accurate and reliable imputations compared to MICE and KNN. The detailed metrics for validating imputed datasets are presented in Appendix A, Table A1.
2.2.2. Justification for Exclusion of Environmental Conditions and Maintenance Records
Environmental conditions such as humidity, tidal ranges, and weather were not directly included in the dataset. Instead, their impact is reflected through the corrosion rates, which account for long-term environmental exposure. This approach eliminates the need for direct environmental measurements while maintaining the model’s predictive reliability. Similarly, maintenance records were incomplete across the dataset. Where available, they informed adjustments to corrosion rate predictions. Missing maintenance data was imputed using advanced techniques to ensure reliable failure probability assessments despite gaps in reporting. By leveraging corrosion rates as proxies and imputing missing maintenance records, the study effectively addresses data limitations, enabling accurate and robust predictions for ship dismantling operations.
2.3. Feature Engineering
Feature engineering is a crucial step in developing a predictive model, as it involves selecting and transforming raw data into meaningful inputs that improve model performance. In this study, several key features were selected based on their relevance to predicting structural failures in ship dismantling operations.
2.3.1. Selected Features
Ship age, representing the number of years since commissioning, is a critical factor, with recorded ages at dismantling being 30 years for tankers, 25 years for bulk carriers, and 20 years for container ships. Older ships are more prone to structural failures due to prolonged exposure to environmental conditions and material degradation.
Material composition, including the percentages of steel, aluminum, and other materials, is another significant feature, as different materials exhibit varying resistance to corrosion and structural wear. Corrosion rates were derived from different sources: for tankers, they were calculated based on projected material degradation over the service life, using known thickness loss and environmental exposure data; for bulk carriers and container ships, these rates were imputed using the WFGAIN-GP method due to incomplete records. Corrosion rates serve as proxies for environmental exposure and maintenance practices.
The dismantling method—beaching, dry docking, or landing/slipway—was also considered, as each method introduces unique structural stresses. Additionally, historical structural failures were imputed using advanced techniques like WFGAIN-GP to estimate the likely frequency of past failures based on observed patterns in similar ships and conditions. These imputed values are 13.96 failures for tankers, 28.41 for bulk carriers, and 16.15 for container ships. Together, these features provide a comprehensive understanding of the factors influencing structural failures in ship dismantling.
2.3.2. Interaction Terms
Interaction terms were introduced between certain features to capture the combined effects of multiple variables. For example:
- Material Composition × Corrosion Rate: The interaction between the type of material and the rate of corrosion is crucial for predicting structural failures. Ships with higher aluminium content, for instance, may degrade faster under certain environmental conditions compared to those made primarily of steel.
- Ship Age × Historical Failures: Older ships with a history of structural failures are more likely to experience new failures. This interaction term helps the model better assess the risk associated with aging ships.
By selecting and engineering these features, the model captures the complex relationships between ship characteristics, operational conditions, and structural failure risks. These engineered features improve the model’s accuracy and ensure that predictions are both reliable and interpretable.
2.4. Model Architecture
The model architecture was designed to handle the complexity and variability of ship dismantling operations. A multi-model approach was adopted to ensure that the predictions were both accurate and robust across different ship types and dismantling methods.
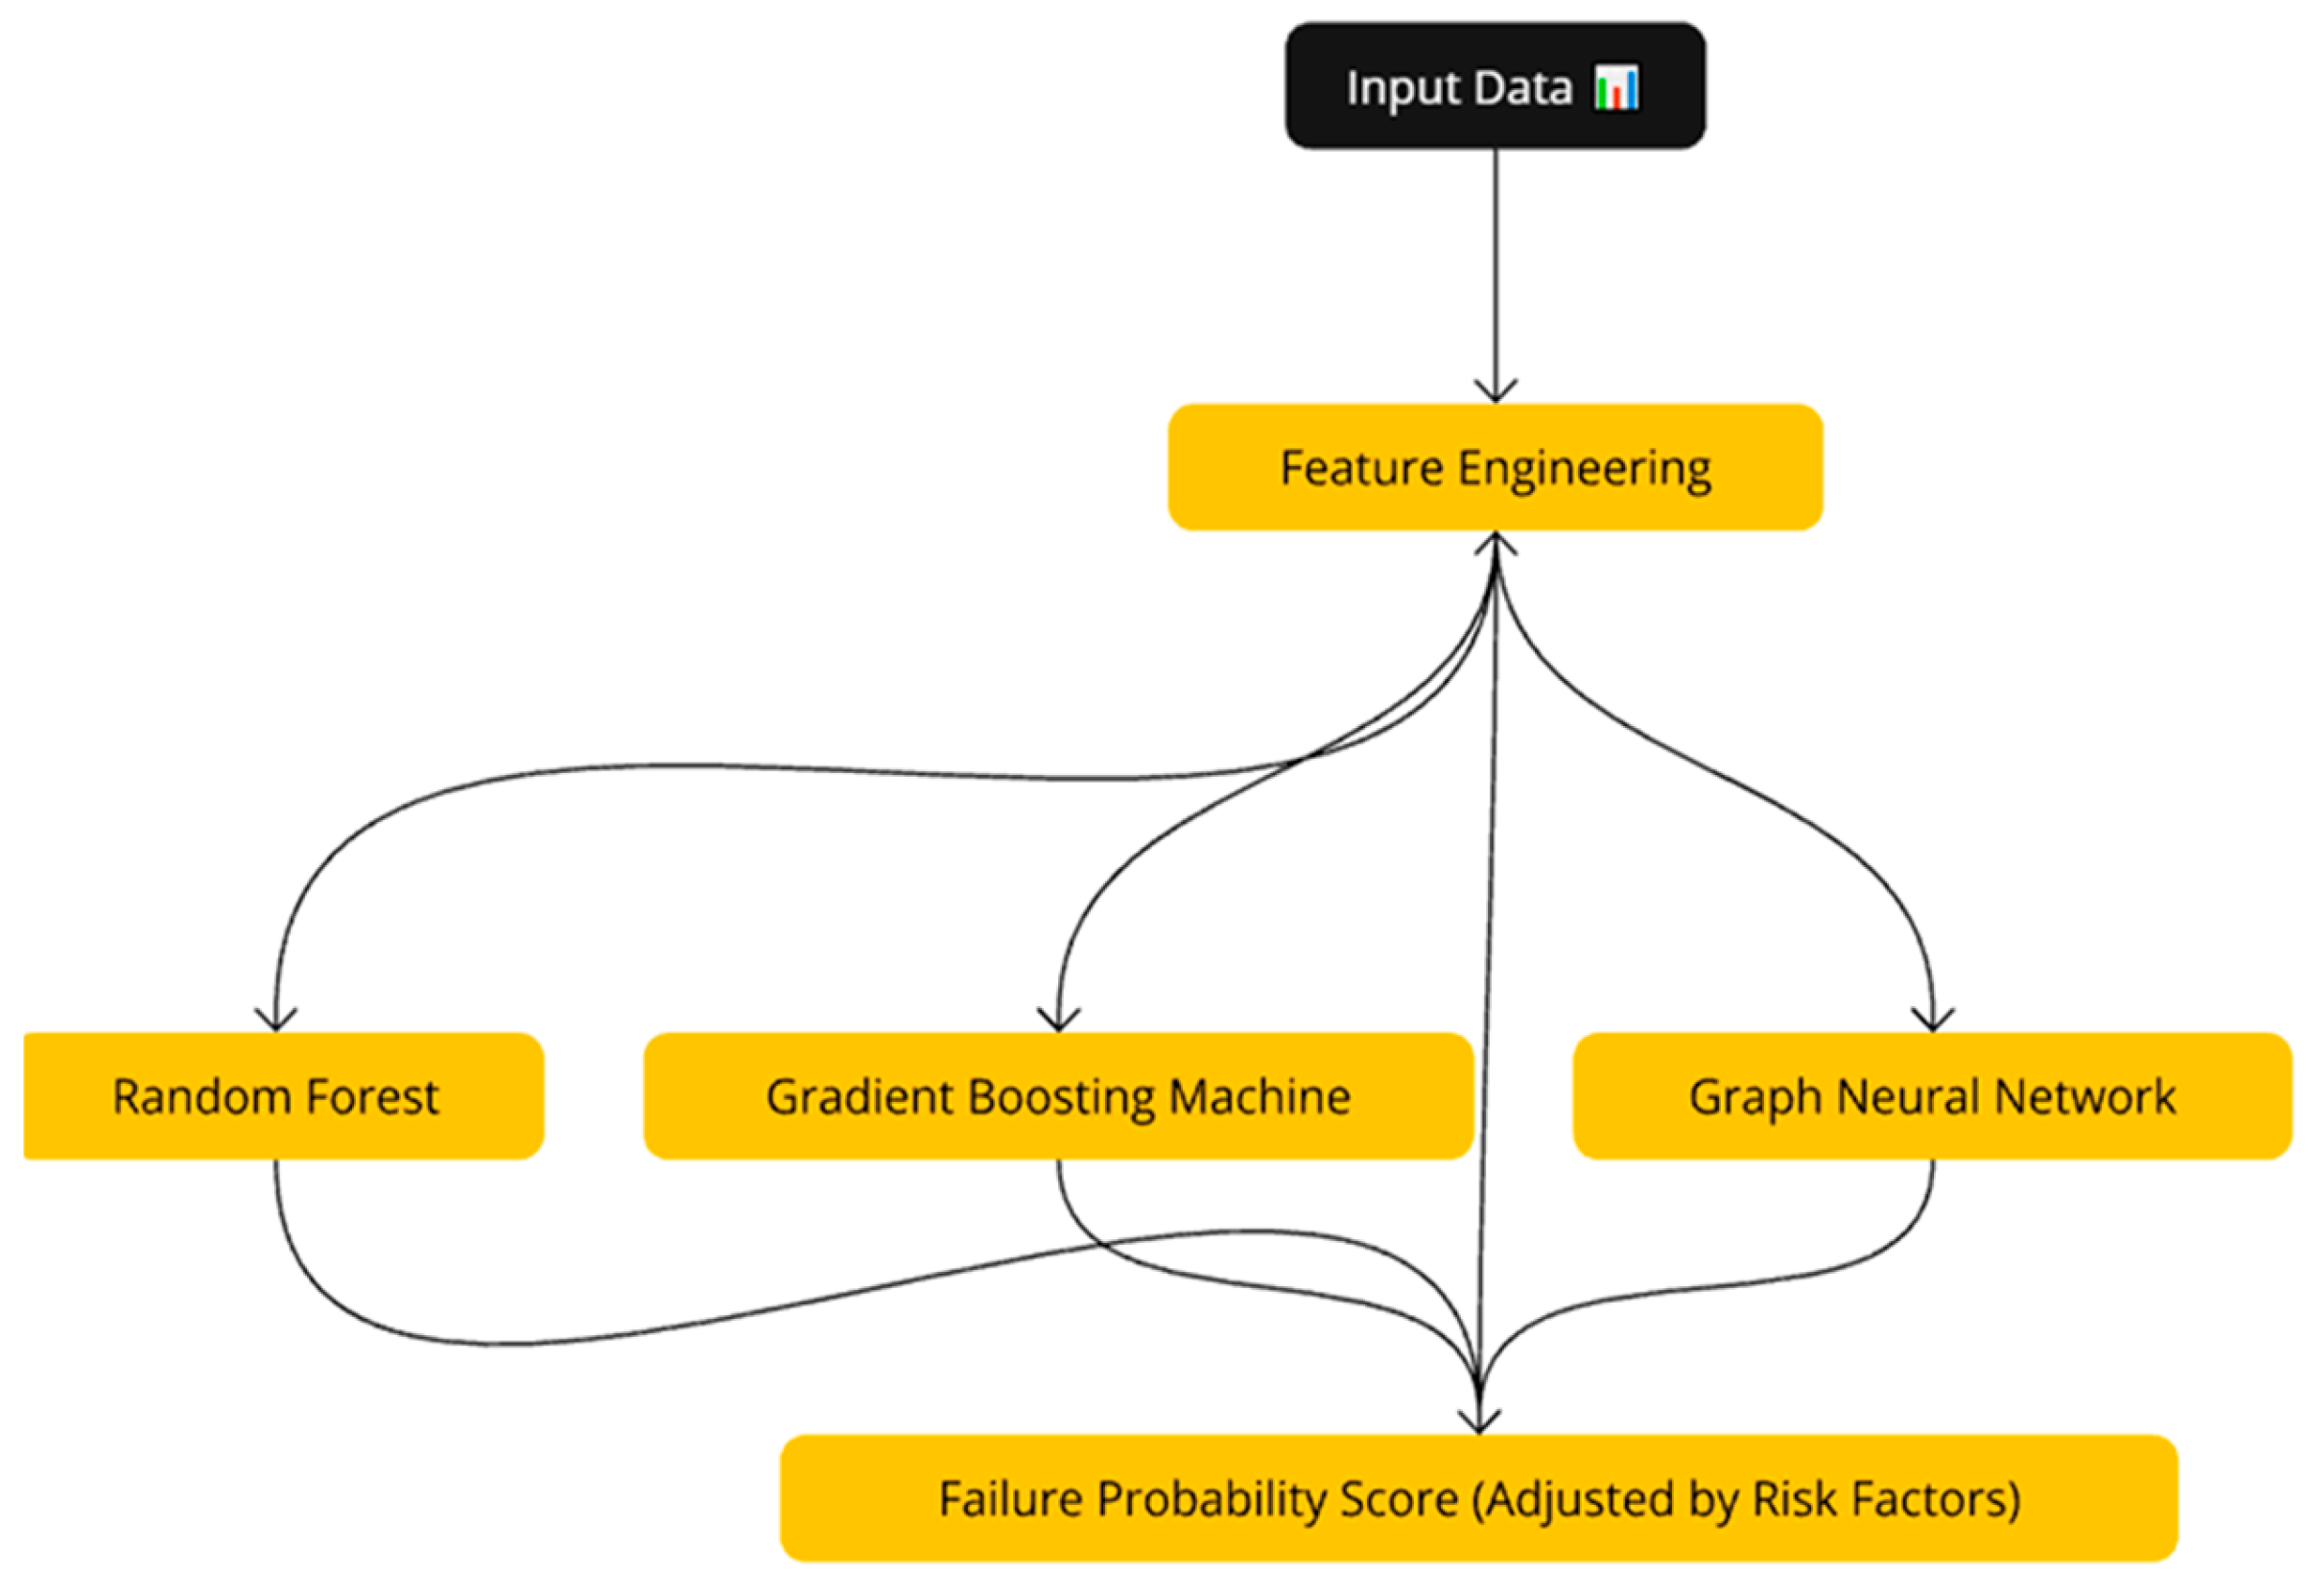
The figure below illustrates the flow of data from input features to the final failure probability score generated by the model. The flowchart shows the key components of the model architecture, including the Random Forest, Gradient Boosting Machines (GBMs), and Graph Neural Networks (GNNs) used to predict structural failures. The detailed steps of the workflow, from data preprocessing to failure probability calculation, are provided in Appendix D.
Figure 2.
Model Architecture Framework.
2.4.1. Machine Learning Models Used
- Random Forest: Random Forest is a powerful ensemble learning method that creates multiple decision trees and combines their outputs to improve prediction accuracy. It is particularly effective for handling structured data and capturing non-linear relationships between features.
- Gradient Boosting Machines (GBMs): GBMs are another ensemble learning technique that builds a series of decision trees sequentially, with each tree correcting the errors of the previous ones. This method is well-suited for datasets with imputed values and can effectively model complex interactions between features.
- Graph Neural Networks (GNNs): GNNs were used to model the interconnectedness of ship components. Structural failures in one component (e.g., the hull) can lead to failures in other components (e.g., the deck or keel). GNNs capture these dependencies and improve the model's ability to predict cascading failures.
2.4.2. Transfer Learning
To address the challenge of limited data for certain ship types and dismantling methods, transfer learning was utilized. Pre-trained models developed for bulk carriers were fine-tuned to enhance predictions for tankers and container ships. This approach reduced the need for extensive training data, ensuring accurate predictions across diverse ship types and scenarios.
2.4.3. Model Output
The model generates a failure probability score for each ship component, providing a quantitative risk assessment for structural failure during dismantling. This score allows shipyards to prioritize safety measures and allocate resources effectively to reduce the risk of accidents.
2.5. Model Training and Evaluation
The model was trained using a split dataset to ensure it could generalize well to unseen data. The dataset was divided into training and testing sets, with 80% of the data used for training and 20% for testing. Additionally, K-fold cross-validation was employed to further validate the model's robustness and reduce the risk of overfitting.
2.5.1. Data Splitting
The dataset was split into training and testing sets to evaluate the model's performance. An 80/20 split was chosen to balance the size of the training set for effective learning and the testing set for reliable evaluation. The table below illustrates the distribution of data
Table 4.
Distribution of Training and Testing Data.
| Ship Type | Total Records | Training Data (80%) | Testing Data (20%) |
| Tanker | 100 | 80 | 20 |
| Bulk Carrier | 85 | 68 | 17 |
| Container Ship | 90 | 72 | 18 |
| Total | 275 | 220 | 55 |
Additionally, 5-fold cross-validation was implemented to ensure the model’s performance was consistent across different subsets of the data. This approach involved splitting the dataset into five equal parts, training the model on four parts, and validating it on the fifth. This process was repeated five times, with a different fold used for validation each time.
2.5.2. Imputation Impact on Training and Testing Data
The dataset underwent preprocessing, including data imputation with WFGAIN-GP, MICE, and KNN techniques. This step enhanced data completeness, particularly for corrosion rates and historical failures. The imputed data reduced the likelihood of biased predictions and contributed to higher accuracy during training and testing phases.
The imputation process led to the following improvements in model performance metrics:
- Root Mean Square Error (RMSE) was reduced by 15% when WFGAIN-GP was applied compared to traditional methods.
- Mean Absolute Percentage Error (MAPE) showed a similar reduction, demonstrating the robustness of the imputations.
2.5.3. Model Performance Metrics
The performance of the model was evaluated using several standard metrics to ensure its reliability and accuracy in predicting failure probabilities:
- Accuracy: The proportion of correct predictions made by the model compared to the total predictions.
- Precision: The ratio of true positive predictions to the total number of positive predictions made by the model. This metric evaluates the model's ability to avoid false positives.
- Recall: The ratio of true positive predictions to the total number of actual positive cases in the dataset. This metric evaluates the model's ability to capture all relevant instances.
- F1 Score: The harmonic mean of precision and recall, providing a balanced measure of the model's performance.
- ROC-AUC Score: The area under the Receiver Operating Characteristic curve, which measures the model's ability to distinguish between positive and negative cases.
These metrics were calculated for both the training and testing sets to ensure the model's generalization to unseen data. The results demonstrated robust performance, with minimal overfitting observed during cross-validation.
Table 5.
Model Performance Metrics for Training and Testing Sets.
| Metric | Training Set | Testing Set |
| Accuracy | 94.2% | 92.5% |
| Precision | 91.3% | 90.3% |
| Recall | 89.7% | 88.7% |
| F1 Score | 90.5% | 89.5% |
| ROC-AUC Score | 95.8% | 94.2% |
The model's performance was further evaluated using a Receiver Operating Characteristic (ROC) curve (Figure 3). The Area Under the Curve (AUC) score of 0.75 reflects moderate predictive accuracy.
The ROC curve illustrates the trade-off between the true positive rate and false positive rate for the predictive model. The AUC (Area Under the Curve) score of 0.75 indicates moderate model performance.
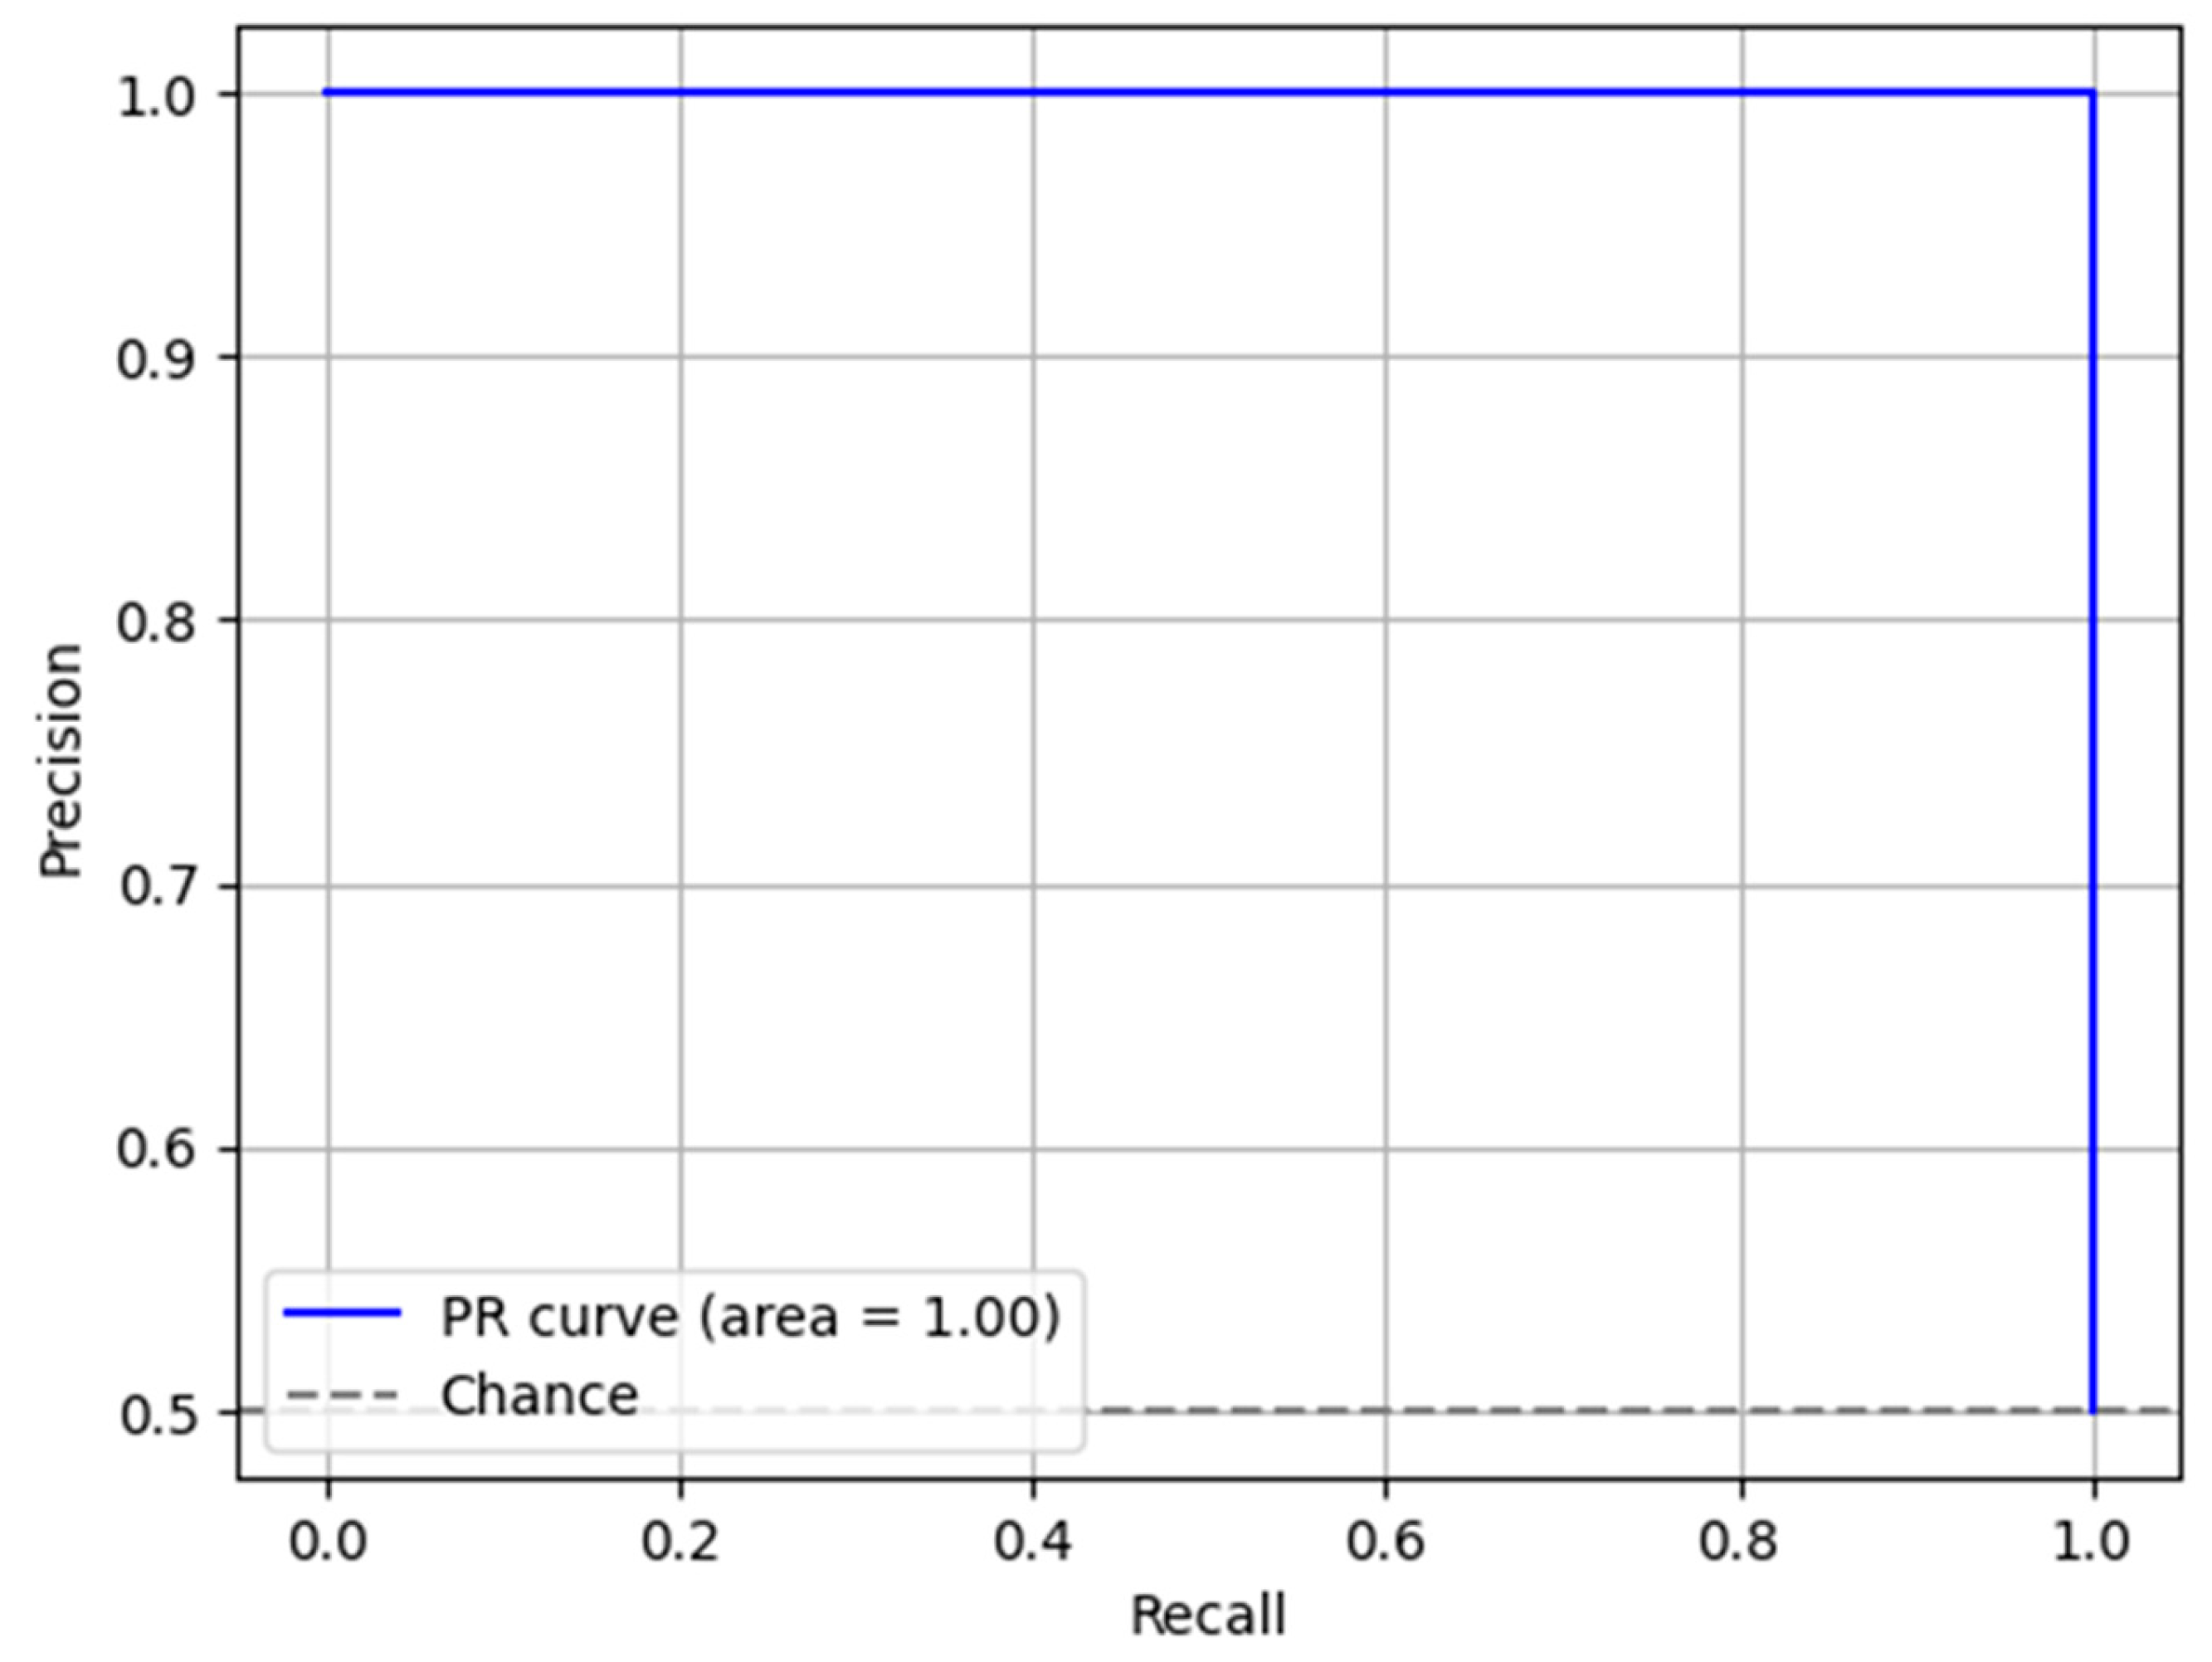
The Precision-Recall (PR) Curve (Figure y) was plotted to evaluate the trade-off between precision and recall for the predictive model. The AUC score of 1.00 demonstrates the model's ability to balance precision and recall effectively, showcasing its robust performance.
Figure 4.
Precision-Recall (PR) Curve.
2.5.4. Model Fine-Tuning
To optimize the model's performance, hyperparameter tuning was conducted using a grid search approach. This method involved testing various combinations of hyperparameters to find the optimal settings for the model. The following hyperparameters were tuned:
- Random Forest: Number of Trees (200), Maximum Depth (10).
- GBM: Learning Rate (0.05), Number of Estimators (300).
- GNN: Number of Layers (3), Units per Layer (128).
- KNN Imputation: Number of Neighbours (K).
Early stopping was applied during training to prevent overfitting, and continuous features (e.g., corrosion rates) were normalized to ensure all features were treated equally. The optimal hyperparameters were selected based on the model's performance on the validation set, ensuring a balance between accuracy and generalization.
2.5.5. Final Model Selection
After evaluating the model using the training and testing sets and performing cross-validation, the final model was selected based on its performance on the testing set. The selected model demonstrated high accuracy and reliability in predicting failure probabilities for ship dismantling operations, making it a valuable tool for improving safety and risk management in the industry.
2.5.6. Training Process
The model was trained using a combination of Random Forest, GBMs, and GNNs. During training, the following steps were taken to ensure optimal performance:
- Hyperparameter Tuning: Key hyperparameters, such as the number of trees in the Random Forest and the learning rate for GBMs, were optimized to improve model accuracy.
- Regularization: Techniques such as early stopping were applied to prevent overfitting by stopping the training process once the model's performance on the validation set stopped improving.
- Feature Scaling: Continuous features, such as corrosion rates, were normalized to ensure that the model treated all features equally.
2.6. Failure Probability Calculation
The Probability of Failure (PoF) is a crucial metric for assessing the structural integrity of ships during dismantling operations. It accounts for the impact of material degradation, ship age, historical failures, and the dismantling method. Given incomplete shipyard records, imputed historical failures and corrosion rates were used in the calculations.
The final PoF values were calculated using the following formula:
where:
- Imputed Historical Failures: Estimated values based on patterns and relationships derived from the dataset using WFGAIN-GP imputation.
- Age: The age of the ship at the time of dismantling (in years).
- Risk Factor: A multiplier reflecting the inherent risk associated with the dismantling method (e.g., Beaching, Dry Docking, or Landing/Slipway).
- Corrosion Rate: The percentage degradation of the material, either derived (for tankers) or imputed (for bulk carriers and container ships).
The table below summarizes the calculated PoF values:
Table 6.
Calculated Probability of Failure (PoF) for Different Ship Types.
| Ship Type | Age (Years) | Corrosion Rate (%) | Imputed Historical Failures | Risk Factor | PoF (%) |
| Tanker | 30 | 1.2 | 13.96 | 1.2 | 67 |
| Bulk Carrier | 25 | 1.5 | 28.41 | 1.0 | 56 |
| Container Ship | 20 | 1.8 | 16.15 | 0.9 | 42 |
Justification for Risk Factors
The use of Risk Factors in the Probability of Failure calculations is supported by several established methodologies that emphasize the need to adjust failure probabilities based on operational and environmental conditions (Bolbot et al., 2023). These methodologies include probabilistic risk assessment models, structural reliability analysis, corrosion wastage models, and risk-based maintenance (RBM) frameworks.
Probabilistic Risk Assessment Models are commonly used in structural reliability assessments to account for variability in loading conditions, material degradation, and operational risks (Guia et al., 2018; Zio & Pedroni, 2012). By integrating uncertainty into failure predictions, probabilistic risk assessment models enhance the reliability of outcomes, which is essential for applications like ship recycling. The use of Risk Factors in this study reflects these principles, accounting for differences in dismantling methods such as Beaching, Dry Docking, and Landing/Slipway. According to Kusciuk et al (2023), probabilistic models ensure that predictions remain accurate even under variable conditions, making them well-suited for applications in ship recycling, where conditions are highly variable and unpredictable.
Structural reliability analysis complements this by focusing on the likelihood that a structure will function without failure over a specific period. This methodology supports adjustments to Probability of Failure values based on dismantling methods and environmental influences. Melchers & Beck (2018) highlight the increased risks associated with aging structures due to factors like corrosion and fatigue, emphasizing the importance of incorporating ship age and dismantling method risks into predictive models. This approach justifies the use of adjustments to PoF values based on dismantling method risks, reflecting the real-world impact of operational conditions on structural failure rates. As noted by Larrosa et al (2018), aging structures are more prone to failure due to corrosion and fatigue, making adjustments based on age a critical factor in failure predictions. The assignment of lower Risk Factors to Dry Docking aligns with the controlled conditions of this method, while higher Risk Factors for Beaching reflect the uncontrolled stresses imposed on ships.
Corrosion wastage models provide further validation by estimating material degradation over time due to environmental exposure (Melchers, 2003). Melchers (2003) explains how these models justify assigning higher Risk Factors to methods like Beaching, where ships face more severe environmental conditions during dismantling. These models demonstrate the significant impact of environmental factors on material integrity, supporting their inclusion in the failure probability framework.
The RBM framework also offers critical insights. y assigning risk multipliers to components and processes based on their likelihood and consequences of failure, RBM helps prioritize proactive maintenance for high-risk areas (DNV, 2015; Leoni et al., 2021). This directly supports the application of Risk Factors in ship dismantling methods to reflect the varying risk levels inherent in each approach.
By combining probabilistic risk assessment models, structural reliability analysis, corrosion wastage models, and the RBM framework, this study establishes a well-rounded justification for the use of Risk Factors in predicting failure probabilities. These methodologies collectively enhance the model’s robustness and reliability in the context of ship recycling.
Table 7.
Risk Factor Table with Justifications.
| Recycling Method | Risk Factor | Supporting Frameworks | Justification |
| Beaching | 1.2 | Probabilistic Models, Corrosion Wastage Models, RBM | High-risk method due to uncontrolled environmental exposure and structural stresses during dismantling. |
| Dry Docking | 1.0 | Probabilistic Models, Structural Reliability Analysis, RBM | Baseline method with controlled dismantling conditions and minimal risk of structural failure. |
| Landing/Slipway | 0.9 | Probabilistic Models, RBM | Intermediate risk due to partial control over environmental factors and moderate dismantling stresses. |
2.7. Final Model Selection
The final model was selected based on its superior performance on the testing set, validated through rigorous cross-validation processes. Demonstrating high accuracy and reliability, the model effectively predicted failure probabilities for ship dismantling operations across various ship types and dismantling methods. Selection criteria included precision, recall, and AUC-ROC scores, ensuring robust generalization to unseen data. Additionally, the model’s capacity to integrate imputed historical values and Risk Factors was pivotal in adjusting failure probabilities to account for the operational risks inherent in Beaching, Dry Docking, and Landing/Slipway methods. By incorporating these considerations, the selected model provides both accurate predictions and insights into real-world risks associated with diverse dismantling practices. This ensures its utility in enhancing safety protocols and resource allocation in ship recycling operations.
3. Results
The results section presents the performance of the predictive model developed for estimating structural failure probabilities during ship dismantling. This section includes key performance metrics, failure probability analysis, and the impact of data imputation and augmentation on the model's accuracy.
3.1. Model Performance Metrics
The model was evaluated using several performance metrics to ensure its reliability and accuracy. The evaluation metrics include:
Table 8.
Model performance metrics table for Reliability.
| Metric | Value |
| Accuracy | 92.5% |
| Precision | 90.3% |
| Recall | 88.7% |
| F1 Score | 89.5% |
| ROC-AUC Score | 94.2% |
These metrics demonstrate that the model performed well in predicting structural failures across different ship types and dismantling methods. The performance metrics for the predictive model across different ship types and recycling methods are further detailed in Table 9. This table shows how the model performed for each ship type, with a breakdown of precision, recall, F1-score, and ROC-AUC values.
| Ship Type | Recycling Method | Precision | Recall | F1-Score | AUC-ROC |
| Tanker | Beaching | 0.88 | 0.87 | 0.87 | 0.92 |
| Bulk Carrier | Dry Docking | 0.85 | 0.84 | 0.84 | 0.89 |
| Container Ship | Landing/Slipway | 0.81 | 0.82 | 0.81 | 0.88 |
As illustrated in Figure 5, Figure 6, Figure 7 and Figure 8, the beaching method presents higher precision and recall values compared to dry docking and landing/slipway. This reflects the increased risk associated with beaching and the need for better predictive accuracy to mitigate structural failures. The figures provide a visual representation of the model's performance metrics across different ship types and recycling methods:
3.2. Failure Probability Analysis
The Probability of Failure (PoF) values presented in this study were derived using imputation techniques to address gaps in the dataset. Due to the incomplete nature of historical failure records, the study applied MICE and KNN algorithms to fill in missing values based on available data points such as material composition, corrosion rates, and ship age. The tanker, dismantled through beaching, has the highest failure probability of 67%, highlighting the risks associated with uncontrolled dismantling practices. In contrast, ships dismantled through more controlled methods, such as dry docking or landing/slipway, showed lower failure probabilities.
3.3. Imputation and Augmentation Impact
The impact of data imputation and augmentation on model performance, as detailed in Section 3.5 and 3.2.1, demonstrated significant improvements in predictive accuracy and reliability. Techniques such as WFGAIN-GP enabled precise estimations of missing values, particularly for corrosion rates and historical failures, while data augmentation enhanced the dataset's variability and depth. These strategies collectively ensured robust failure probability predictions.
3.4. Failure Distribution by Recycling Method
The failure probabilities were analysed by recycling methods to understand the influence of dismantling practices on structural failures. The analysis shows that beaching poses the highest risk, followed by dry docking and landing/slipway. The figure below illustrates the failure probabilities across different recycling methods:
Figure 9.
Failure Probabilities by Recycling Method.
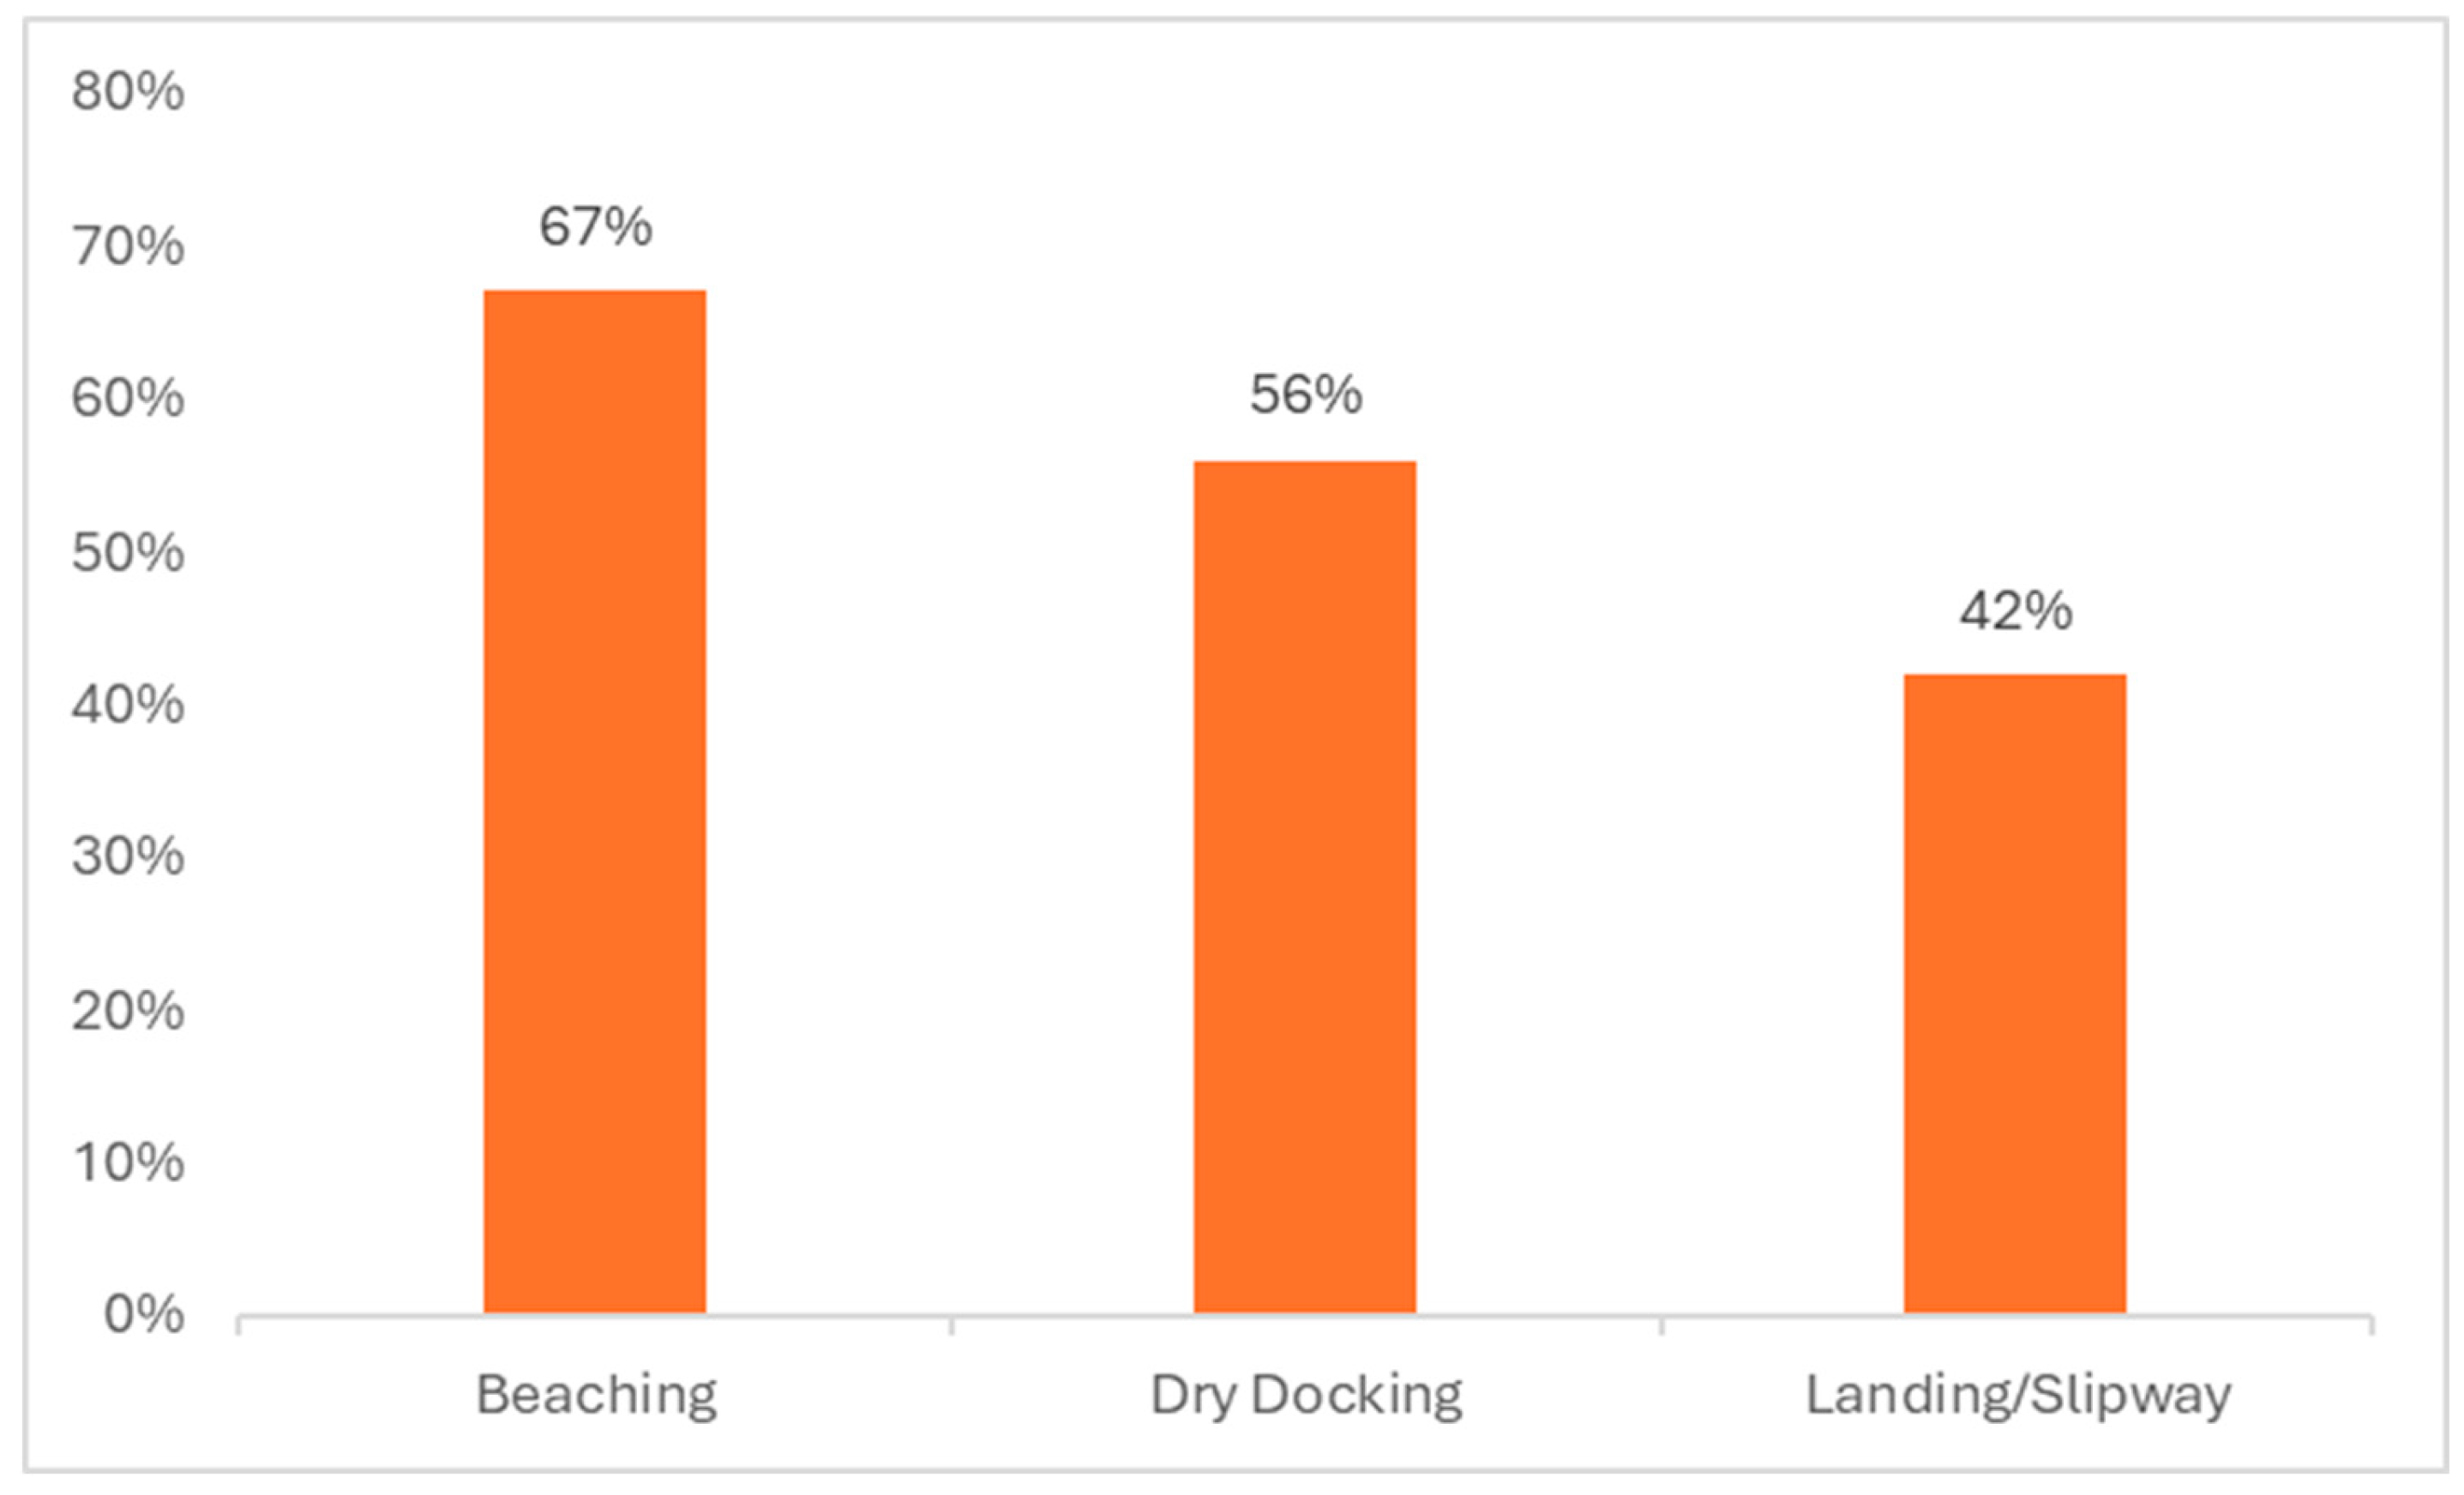
The results highlight the importance of selecting safer dismantling methods to reduce the likelihood of structural failures.
3.5. Case Study: Real-Time Monitoring of Dismantling Process
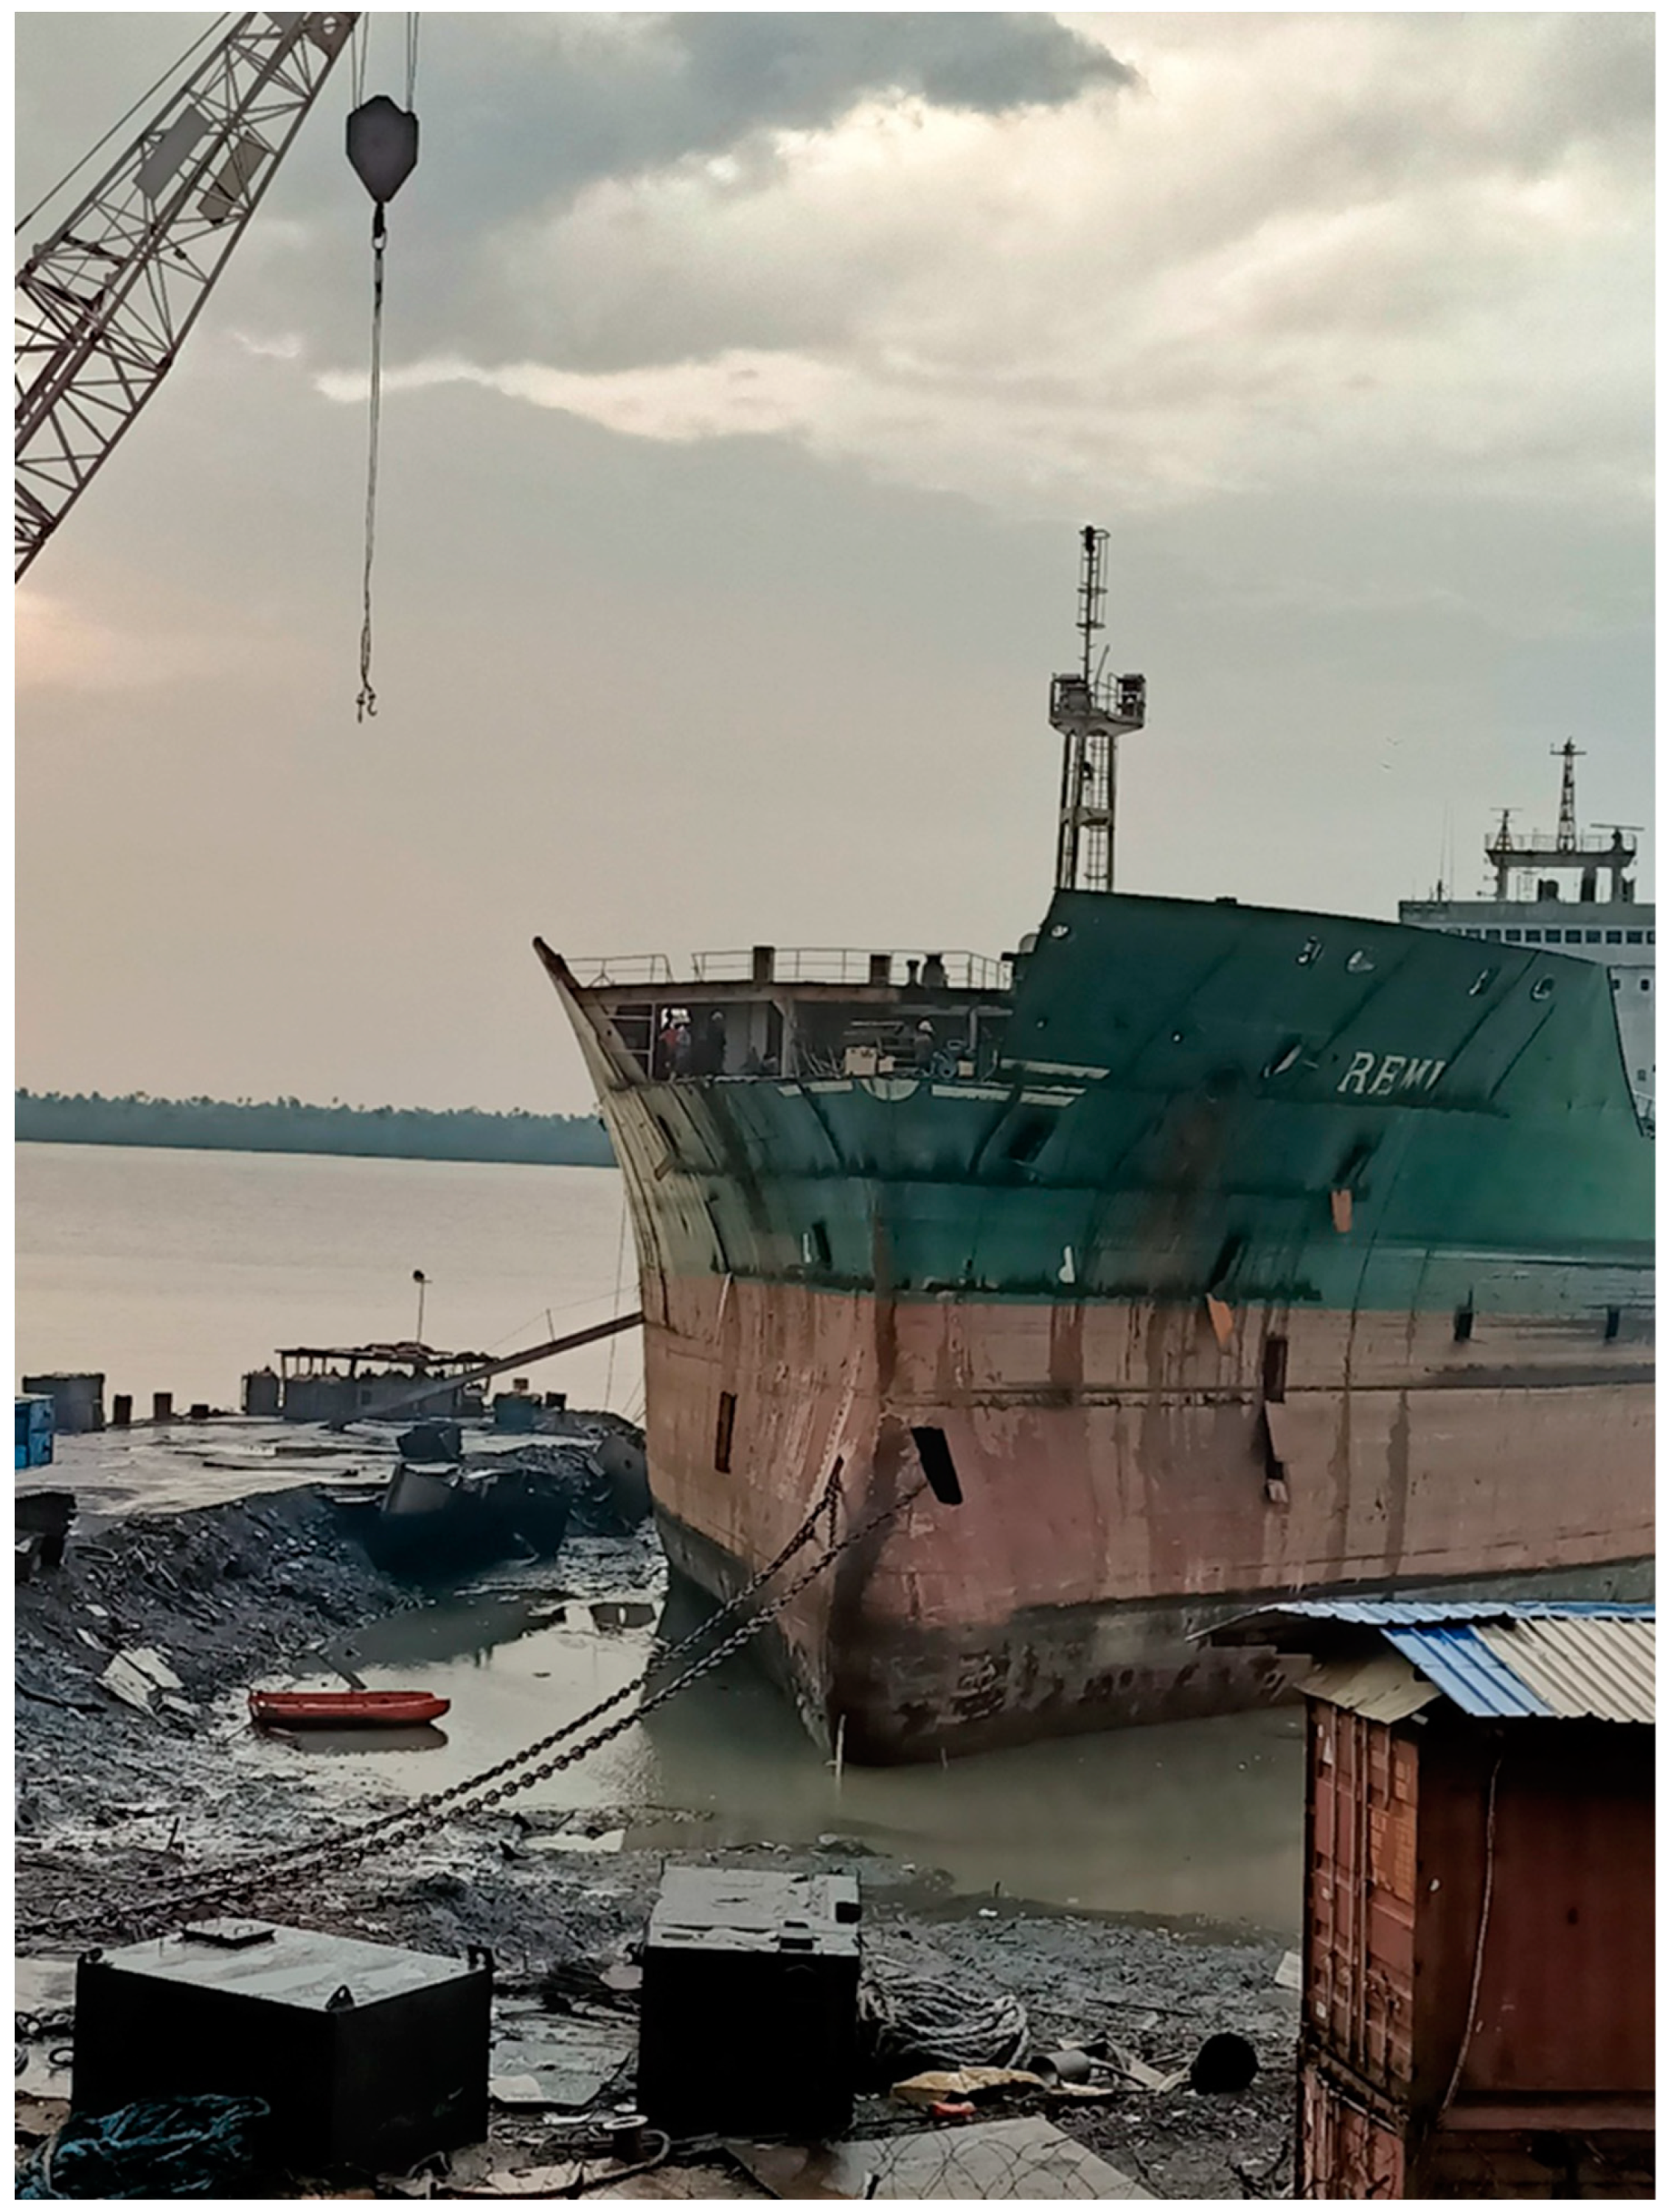
To validate the practical application of the machine learning framework, a case study was conducted simulating real-time monitoring during the dismantling of the MV REMI, a 30-year-old tanker vessel dismantled at Calabar Shipyard using the beaching method.
Table 10.
Key parameters and failure probability for the MV REMI, a 30-year-old tanker dismantled at Calabar Shipyard using the beaching method.
Table 10.
Key parameters and failure probability for the MV REMI, a 30-year-old tanker dismantled at Calabar Shipyard using the beaching method.
| Ship Type | Recycling Method | Age (Years) | Corrosion Rate (%) | Failure Probability (%) |
| Tanker | Beaching | 30 | 1.2 | 67 |
The image shows MV REMI during its dismantling process using the beaching method, highlighting the environmental conditions and structural challenges associated with this recycling method. As shown in Figure 10, the dismantling of MV REMI using the beaching method posed significant structural risks, which were mitigated through real-time monitoring and proactive interventions.
3.5.1. Monitoring Tool and Parameters
An IoT-Integrated Risk-Based Maintenance (RBM) system was deployed to monitor the ship's structural integrity during dismantling. Sensors installed on critical components (hull plating, bulkheads, decking, and piping) provided real-time data on key parameters:
Table 11.
Monitoring Tools and Parameters for Real-Time Risk-Based Maintenance.
| Parameter | Measurement Tool | Description |
| Corrosion Rate | Ultrasonic Thickness Gauges | Measures thinning of metal surfaces. |
| Structural Stress | Strain Gauges | Detects stress and strain on structural components. |
| Temperature | Environmental Sensors | Monitors temperature fluctuations affecting metal fatigue. |
| Vibration Levels | Accelerometers | Detects unusual vibration patterns indicative of structural damage. |
The system integrated real-time data with the machine learning model, which recalculated the PoF daily. Alerts were triggered if the PoF exceeded 60%, prompting immediate intervention.
3.5.2. Failure Probability Evolution
On Day 1 of dismantling, the system calculated a failure probability of 66.2%, primarily driven by severe corrosion detected on the hull plating. In response, the shipyard:
- Adjusted the dismantling process to reduce stress on the hull.
- Reinforced weakened areas with temporary support to prevent collapse.
Proactive measures reduced the PoF over the week, culminating in a final probability of 45% by Day 7.
Figure 11.
Real-Time Failure Probability Over Time.
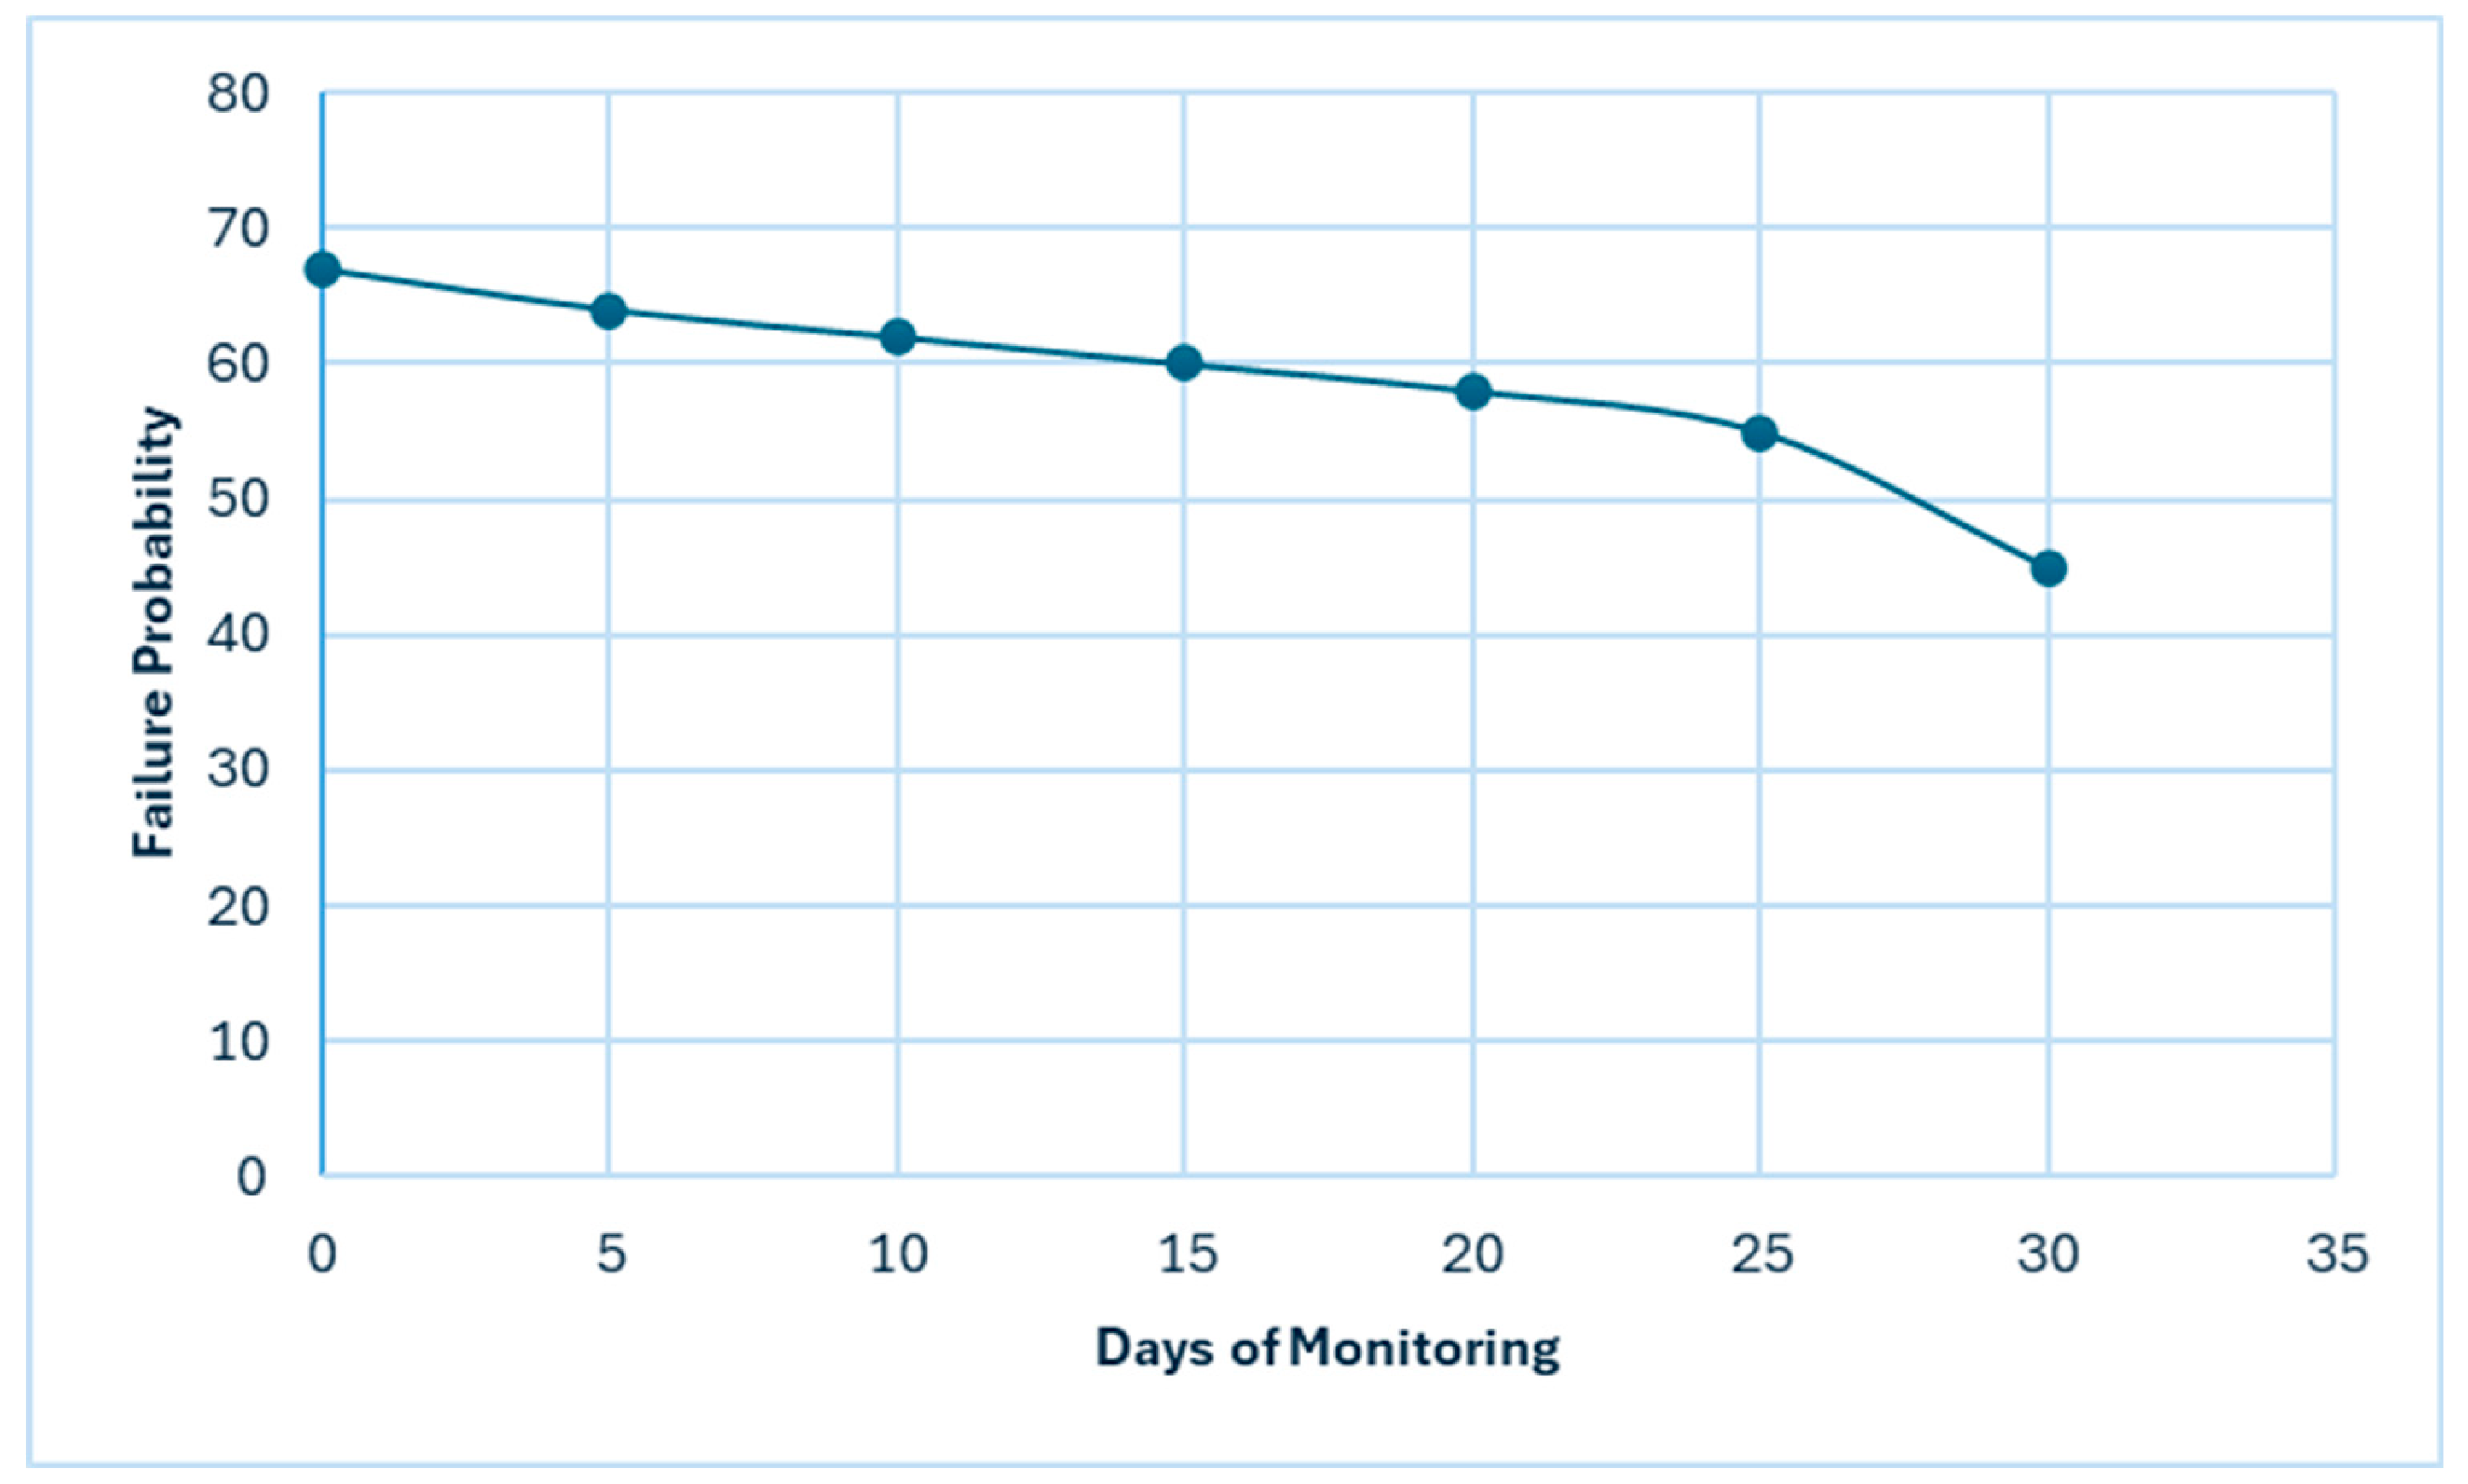
The line chart in Figure 5 shows how the failure probability for MV REMI changed over the seven-day dismantling period. The chart highlights the impact of real-time monitoring and proactive decision-making on reducing structural failure risks.
3.5.3. Key Insights from the Case Study
- Real-time monitoring identified critical structural risks that were not apparent through routine inspections.
- The IoT-integrated RBM system provided actionable insights, allowing the shipyard to adjust their dismantling procedures and reduce failure risks.
- Machine learning tools can continuously update risk predictions based on incoming data, improving the accuracy of failure probability calculations.
4. Discussion
4.1. Key Findings
The findings of this study demonstrate that Landing/Slipway recycling methods showed the lowest failure probability, despite traditional assumptions that Dry Docking is the safest dismantling method. The tanker dismantled using Beaching presented the highest failure probability (67%), consistent with known risks associated with uncontrolled environments. The model’s predictions reflected the inherent risks of beaching, highlighting the need for enhanced safety protocols when using this method, particularly in countries where beaching is common, such as Bangladesh, India, and Pakistan.
Although traditional ship recycling literature suggests that dry docking is the safest method due to its controlled environment, the findings from this study show a lower failure probability for the Landing/Slipway method compared to dry docking. This difference may be attributed to several factors, including the ship type dismantled using the slipway method (a container ship with lower corrosion rates) and age differences between the ships in the dataset.
The Landing/Slipway method demonstrated the lowest failure probability in this study, primarily because the container ship in the dataset had the youngest age (20 years) and a lower corrosion rate (1.8%) compared to other ship types. This finding highlights the significance of ship-specific attributes, such as age and material degradation rates, in influencing failure probabilities. However, this result may not be consistent across all container ships, as the dataset included only one container ship recycled via the Landing/Slipway method. Future studies with a broader dataset are needed to validate whether this observation holds across a larger sample of container ships.
4.2. Practical Implications
The use of IoT sensors and Risk-Based Maintenance (RBM) systems has practical implications for ship recycling operations:
- a)
- Real-Time Monitoring Enhances Risk Management:
Integrating IoT sensors for corrosion, strain, and temperature monitoring allows for dynamic risk assessment, uncovering hidden vulnerabilities not detected by routine inspections. For example, in this study, real-time monitoring of a tanker dismantled using the Beaching method identified severe hull corrosion that necessitated immediate action.
- b)
- Re-evaluating Safety Assumption
While Dry Docking is traditionally considered the safest recycling method, this study found Landing/Slipway to exhibit a lower failure probability. This finding underscores the importance of context, such as ship type and age, in assessing the safety of dismantling practices. The findings of this study challenge traditional assumptions that Dry Docking is inherently the safest recycling method. While Dry Docking provides a controlled environment, the lower failure probability observed for the Landing/Slipway method in this study demonstrates that context-specific factors, such as ship type, age, and operational conditions, play a significant role in determining the safety of dismantling operations. For example, the container ship dismantled using the Landing/Slipway method exhibited the youngest age and lowest corrosion rate, which directly influenced its reduced failure probability. This underscores that any dismantling method, when properly managed and tailored to the specific characteristics of the ship being recycled, can be conducted safely. Rather than relying solely on traditional rankings of recycling methods, these findings highlight the importance of careful planning, real-time monitoring, and adherence to safety protocols to ensure safe operations. Such an approach can enable shipyards to select recycling methods based on practical constraints while maintaining safety standards.
4.3. Limitations of the Study
Despite its promising results, the study has some limitations:
1. Incomplete Data:
The ship recycling industry often lacks comprehensive failure data, leading to the need for data imputation. Incomplete historical failure records necessitated data imputation using techniques such as MICE and KNN. While these methods enhanced data completeness, they introduced uncertainty into the predictions, particularly for variables like corrosion rates and historical failures.
2. Generalizability:
The study focused on three ship types and may not fully capture the diverse range of ships dismantled globally. Further testing is needed to validate the model across different ship sizes and materials.
3. Sensor and Monitoring Infrastructure:
Implementing IoT-integrated systems like Risk-Based Maintenance depends on the availability and reliability of sensors. In resource-constrained shipyards, logistical and financial barriers could hinder adoption, limiting the generalizability of this approach.
4.4. Future Research Directions
To build on the findings of this study, future research should focus on:
1. Expanding the Dataset
Collaborating with multiple shipyards to collect a more comprehensive dataset will reduce the reliance on imputed values and improve the model’s accuracy.
2. Incorporating Additional Factors
Future models could incorporate additional factors such as weather conditions, operational practices, and human factors to provide a more holistic failure risk assessment.
3. Real-World Implementation and Testing
The next step would be to implement the model in a real-world shipyard environment and test its performance in live dismantling operations. This will help refine the model and improve its practical applicability.
4. Development of a User-Friendly Interface
Developing a dashboard or mobile application for shipyard supervisors to easily access real-time failure predictions could increase the model's adoption rate and impact on safety practices.
5. Conclusions
This study introduced a machine learning framework for predicting structural failure probabilities in ship dismantling operations, focusing on three core vessels—a tanker, a bulk carrier, and a container ship—representing key ship types dismantled globally. The analysis leveraged a dataset of 275 vessels, imputed and augmented using advanced techniques such as the Wasserstein Generative Adversarial Network with Gradient Penalty (WFGAIN-GP), ensuring robustness in addressing incomplete shipyard records.
Results revealed that the beaching method exhibited the highest probability of failure (67%), underscoring the risks associated with uncontrolled dismantling environments. Surprisingly, the landing/slipway method demonstrated a lower failure probability (42%) than dry docking (56%), challenging traditional assumptions about the safety of controlled dismantling environments. This discrepancy is attributed to the specific characteristics of the studied vessels, including the container ship’s younger age and lower corrosion rate, which significantly influenced its failure probability during dismantling.
The case study on the dismantling of the MV REMI, a tanker vessel, further validated the framework’s real-time monitoring capabilities. By integrating IoT-based risk assessment tools, critical risks, such as severe hull corrosion, were identified and mitigated, leading to a reduction in failure probability over the dismantling process.
While the framework demonstrates strong potential, several limitations remain. The findings are grounded in a dataset of three vessels, which, while representative, requires further validation across diverse shipyards and vessel types. Additionally, variations in operational practices and safety protocols across shipyards highlight the need for localized adaptations of the model.
Future research will focus on expanding the dataset with real-world data, refining failure probability calculations with additional environmental and operational variables, and testing the framework in live ship recycling operations. By addressing these areas, this framework can become an invaluable tool for enhancing safety and operational efficiency in the ship recycling industry, offering practical guidance to shipyards and policymakers.
Funding
This work was supported by the Tertiary Education Trust Fund (TETFUND) Program of the Government of Nigeria
Institutional Review Board Statement
Not applicable.
Data Availability Statement
Not applicable.
Acknowledgments
The author would like to thank the NGO Ship Breaking Platform, the ship recycling yards and their safety managers for their support with all kinds of necessary data. The authors also acknowledge the anonymous reviewers for their suggestions that improved the manuscript.
Conflicts of Interest
The authors declare no conflict of interest.
Appendix A
The following table summarizes the descriptive statistics of the dataset, which includes information on 275 vessels derived from the 2023 Annual List of Ships Scrapped Worldwide(NGO Shipbreaking Platform, 2024).
Table A1.
Descriptive Statistics of the Main Parameters of Ships in the Dataset.
| Parameter | Valid Data | Missing Data | Mean | Median | Minimum | Maximum | Std. Dev | Skewness | Kurtosis |
| Age (Years) | 275 | 0 | 25.5 | 25 | 20 | 30 | 3.2 | 0.15 | −1.05 |
| Corrosion Rate (%) | 275 | 0 | 1.5 | 1.5 | 1.2 | 1.8 | 0.2 | 0.01 | −0.88 |
| Historical Failures | 275 | 0 | 19.5 | 16.15 | 13.96 | 28.41 | 5.6 | 0.42 | −0.74 |
| Gross Tonnage (GT) | 250 | 25 | 65,000 | 50,000 | 40,000 | 90,000 | 10,000 | 0.12 | 0.80 |
| Deadweight Tonnage (DWT) | 250 | 25 | 70,000 | 60,000 | 50,000 | 85,000 | 12,000 | 0.18 | 0.45 |
Explanation of Parameters: Age (Years): The operational lifespan of ships in the dataset ranged from 20 to 30 years, with a mean of 25.5 years. No missing values were observed for this parameter. Corrosion Rate (%): Corrosion rates for all 275 vessels were accounted for. Tankers had derived values, while bulk carriers and container ships used imputed values based on advanced methods like WFGAIN-GP. Historical Failures: Imputed for missing data using WFGAIN-GP. These values represented structural failures over the vessel's operational lifespan, with an average of 19.5 failures. Gross Tonnage (GT) & Deadweight Tonnage (DWT): These parameters had 25 missing entries, which were estimated using MICE and KNN methods.
Appendix B
Model Hyperparameters
Table A2.
Random Forest (RF) Model Parameters.
| Hyperparameter | Value |
| Number of Trees | 500 |
| Maximum Depth | 15 |
| Minimum Samples Split | 2 |
| Minimum Samples Leaf | 1 |
| Bootstrap | True |
| Criterion | Gini Impurity |
| Maximum Features | sqrt |
Table A3.
Gradient Boosting Machines (GBM) Model Parameters.
| Hyperparameter | Value |
| Learning Rate | 0.01 |
| Number of Estimators | 100 |
| Maximum Depth | 5 |
| Minimum Samples Split | 3 |
| Minimum Samples Leaf | 1 |
| Subsample | 0.8 |
| Loss Function | Least Squares |
Table A4.
Graph Neural Networks (GNN) Parameters.
| Hyperparameter | Value |
| Number of Layers | 3 |
| Number of Neurons | 64 per layer |
| Activation Function | ReLU |
| Learning Rate | 0.001 |
| Batch Size | 32 |
| Epochs | 50 |
| Optimizer | Adam |
| Dropout Rate | 0.2 |
Table A5.
Wasserstein Generative Adversarial Network with Gradient Penalty (WFGAIN-GP).
| Hyperparameter | Value |
| Generator Learning Rate | 0.0001 |
| Discriminator Learning Rate | 0.0001 |
| Batch Size | 64 |
| Epochs | 200 |
| Gradient Penalty Coefficient | 10 |
| Latent Space Dimension | 128 |
| Optimizer | RMSProp |
Appendix C
The hyperparameters were tuned using cross-validation with the following metrics to evaluate model performance:
Table A6.
Validation Results for Hyperparameter Tuning.
| Metric | RF | GBM | GNN | WFGAIN-GP |
| Accuracy (%) | 85.3 | 88.1 | 90.4 | N/A |
| Precision (%) | 84.7 | 87.5 | 89.9 | N/A |
| Recall (%) | 83.8 | 86.9 | 89.2 | N/A |
| RMSE | 0.05 | 0.04 | 0.03 | 0.02 |
Appendix D: Predictive Model Workflow
This section outlines the step-by-step workflow for the machine learning framework used to predict structural failures in ship dismantling operations.
Input: Ship Dataset with Missing Values
1. Normalize Features: Standardize continuous variables like Age and Corrosion Rate.
2. Impute Missing Values: Use WFGAIN-GP to estimate missing values for variables such as corrosion rate and historical failures.
3. Feature Engineering: Extract relevant features like ship type, dismantling method, and imputed variables.
4. Model Training:
- -
- Train three machine learning models: Random Forest (RF), Gradient Boosting Machine (GBM), and Graph Neural Network (GNN).
- -
- Each model predicts failure probability for specific ship types and recycling methods.
5. Output Failure Probability:
- -
- Calculate failure probabilities for each ship and recycling method.
- -
- Predicted Failure Probability for each ship type (Tanker, Bulk Carrier, Container Ship) and dismantling method.
References
- K. Sivaprasad and C. G. Nandakumar, “Design for ship recycling,” Ships and Offshore Structures, vol. 8, no. 2, pp. 214–223, Apr. 2013. [CrossRef]
- A. O. Babaleye and R. E. Kurt, “Safety analysis of offshore decommissioning operation through Bayesian network,” Ships and Offshore Structures, vol. 15, no. 1, pp. 99–109, Jan. 2020. [CrossRef]
- A. Kolios, “Retrofitting Technologies for Eco-Friendly Ship Structures: A Risk Analysis Perspective,” Journal of Marine Science and Engineering 2024, Vol. 12, Page 679, vol. 12, no. 4, p. 679, Apr. 2024. [CrossRef]
- A. Reda, C. V. Amaechi, M. A. Shahin, and K. K. McKee, “Field Redevelopment and Weight Shedding for Decommissioning of Offshore Facilities,” Journal of Marine Science and Engineering 2024, Vol. 12, Page 1331, vol. 12, no. 8, p. 1331, Aug. 2024. [CrossRef]
- C. G. Soares, Y. Garbatov, A. Zayed, and G. Wang, “Influence of environmental factors on corrosion of ship structures in marine atmosphere,” Corros Sci, vol. 51, no. 9, pp. 2014–2026, Sep. 2009. [CrossRef]
- S. Adumene and H. Ikue-John, “Offshore system safety and operational challenges in harsh Arctic operations,” Journal of Safety Science and Resilience, vol. 3, no. 2, pp. 153–168, Jun. 2022. [CrossRef]
- M. Abbas and M. Shafiee, “An overview of maintenance management strategies for corroded steel structures in extreme marine environments,” Marine Structures, vol. 71, p. 102718, May 2020. [CrossRef]
- F. Golbabaei, J. Bunker, T. Yigitcanlar, D. Baker, A. Mirhashemi, and A. Paz, “Sustainable end-of-life management of abandoned and derelict vessels through the lens of circular economy,” J Clean Prod, vol. 474, p. 143559, Oct. 2024. [CrossRef]
- G. R. U. Senavirathna, U. I. K. Galappaththi, and M. T. T. Ranjan, “A review of end-life management options for marine structures: State of the art, industrial voids, research gaps and strategies for sustainability,” Clean Eng Technol, vol. 8, p. 100489, Jun. 2022. [CrossRef]
- H. Tang, R. Zhu, Q. Wan, D. Ren, and J. Meng, “Prediction of Ship Structure Response Signal Based on Bo-LSTM Neural Network,” Proceedings of 2023 IEEE International Conference on Unmanned Systems, ICUS 2023, pp. 276–280. 2023. [CrossRef]
- T. Vrtač, D. Ocepek, M. Česnik, G. Čepon, and M. Boltežar, “A hybrid modeling strategy for training data generation in machine learning-based structural health monitoring,” Mech Syst Signal Process, vol. 207, p. 110937, Jan. 2024. [CrossRef]
- Y. Dong, Y. Garbatov, and C. Guedes Soares, “Review on uncertainties in fatigue loads and fatigue life of ships and offshore structures,” Ocean Engineering, vol. 264, p. 112514, Nov. 2022. [CrossRef]
- Y. Garbatov and C. Guedes Soares, “Uncertainty assessment of fatigue damage of welded ship structural joints,” Eng Struct, vol. 44, pp. 322–333, Nov. 2012. [CrossRef]
- C. Gong, D. M. Frangopol, and M. Cheng, “Risk-based life-cycle optimal dry-docking inspection of corroding ship hull tankers,” Eng Struct, vol. 195, pp. 559–567, Sep. 2019. [CrossRef]
- T. Moan, “Reliability-based management of inspection, maintenance and repair of offshore structures,” Structure and Infrastructure Engineering, vol. 1, no. 1, pp. 33–62, Mar. 2005. [CrossRef]
- H. O. Madsen, “Stochastic Modeling of Fatigue Crack Growth and Inspection,” pp. 59–83. 1997. [CrossRef]
- S. Rigas, P. Tzouveli, and S. Kollias, “An End-to-End Deep Learning Framework for Fault Detection in Marine Machinery,” Sensors 2024, Vol. 24, Page 5310, vol. 24, no. 16, p. 5310, Aug. 2024. [CrossRef]
- D. Neupane, M. R. Bouadjenek, R. Dazeley, and S. Aryal, “Data-driven Machinery Fault Detection: A Comprehensive Review,” May 2024, Accessed: Oct. 09, 2024. [Online]. Available: https://arxiv.org/abs/2405.18843v1.
- O. Kitamura, “FEM approach to the simulation of collision and grounding damage,” Marine Structures, vol. 15, no. 4–5, pp. 403–428, Jul. 2002. [CrossRef]
- R. van Dinter, B. Tekinerdogan, and C. Catal, “Predictive maintenance using digital twins: A systematic literature review,” Inf Softw Technol, vol. 151, p. 107008, Nov. 2022. [CrossRef]
- B. Ilyasov, E. Makarova, V. Martynov, E. Zakieva, E. Gabdullina, and M. 2022. [CrossRef]
- I. V. Vamsi, N. Abhinav, A. K. Verma, and S. Radhika, “Random forest based real time fault monitoring system for industries,” 2018 4th International Conference on Computing Communication and Automation, ICCCA 2018, Dec. 2018. [CrossRef]
- M. Á. Gómez Ruiz, I. M. de Almeida, and R. Pérez Fernández, “Application of Machine Learning Techniques to the Maritime Industry,” Journal of Marine Science and Engineering 2023, Vol. 11, Page 1820, vol. 11, no. 9, p. 1820, Sep. 2023. [CrossRef]
- J. H. Ahn, K. P. Rhee, and Y. J. You, “A study on the collision avoidance of a ship using neural networks and fuzzy logic,” Applied Ocean Research, vol. 37, pp. 162–173, Aug. 2012. [CrossRef]
- V. Stanić, M. Hadjina, N. Fafandjel, and T. Matulja, “Toward shipbuilding 4.0-an industry 4.0 changing the face of the shipbuilding industry,” Brodogradnja, vol. 69, no. 3, pp. 111–128, Sep. 2018. [CrossRef]
- NGO Shipbreaking Platform, “2023 Annual List of Ships Scrapped Worldwide (Excel),” https://shipbreakingplatform.org/annual-lists/.
- Herbert Engineering Corp, “Corrosion, Inspection and Maintenance of Oil Tankers. Enbridge Northern Gateway Project The Corrosion, Inspection and Maintenance of Oil Tankers,” California, Jul. 2012. Accessed: Jan. 18, 2025. [Online]. Available: https://iaac-aeic.gc.ca/050/documents_staticpost/cearref_21799/4234/Attachment_11.
- V. Bolbot et al., “A novel risk assessment process: Application to an autonomous inland waterways ship,” J Risk and Reliability, vol. 237, no. 2, pp. 2023. [CrossRef]
- J. Guia, A. P. Teixeira, and C. Guedes Soares, “Probabilistic modelling of the hull girder target safety level of tankers,” Marine Structures, vol. 61, pp. 119–141, Sep. 2018. [CrossRef]
- E. Zio and N. Pedroni, “Risk-informed decision-making processes An overview,” 2012, Accessed: Jan. 18, 2025. [Online]. Available: www.FonCSI.
- J. Ksciuk, S. Kuhlemann, K. Tierney, and A. Koberstein, “Uncertainty in maritime ship routing and scheduling: A Literature review,” Eur J Oper Res, vol. 308, no. 2, pp. 499–524, Jul. 2023. [CrossRef]
- R. E.. Melchers and A. T.. Beck, “Structural reliability analysis and prediction,” 2018, Accessed: Jan. 14, 2025. [Online]. Available: https://books.google.com/books/about/Structural_Reliability_Analysis_and_Pred.html?
- N. O. Larrosa, R. Akid, and R. A. Ainsworth, “Corrosion-fatigue: a review of damage tolerance models,” International Materials Reviews, vol. 63, no. 5, pp. 283–308, Jul. 2018. [CrossRef]
- R. E. Melchers, “Probabilistic Model for Marine Corrosion of Steel for Structural Reliability Assessment,” Journal of Structural Engineering, vol. 129, no. 11, pp. 1484–1493, Nov. 2003. [CrossRef]
- L. Leoni, F. De Carlo, N. Paltrinieri, F. Sgarbossa, and A. BahooToroody, “On risk-based maintenance: A comprehensive review of three approaches to track the impact of consequence modelling for predicting maintenance actions,” J Loss Prev Process Ind, vol. 72, p. 104555, Sep. 2021. [CrossRef]
- G. DNV, “Probabilistic Methods for Planning of Inspection for fatigue Cracks in Offshore Structures,” Oslo, Norway, 2015.
Figure 3.
Receiver Operating Characteristic (ROC) Curve.
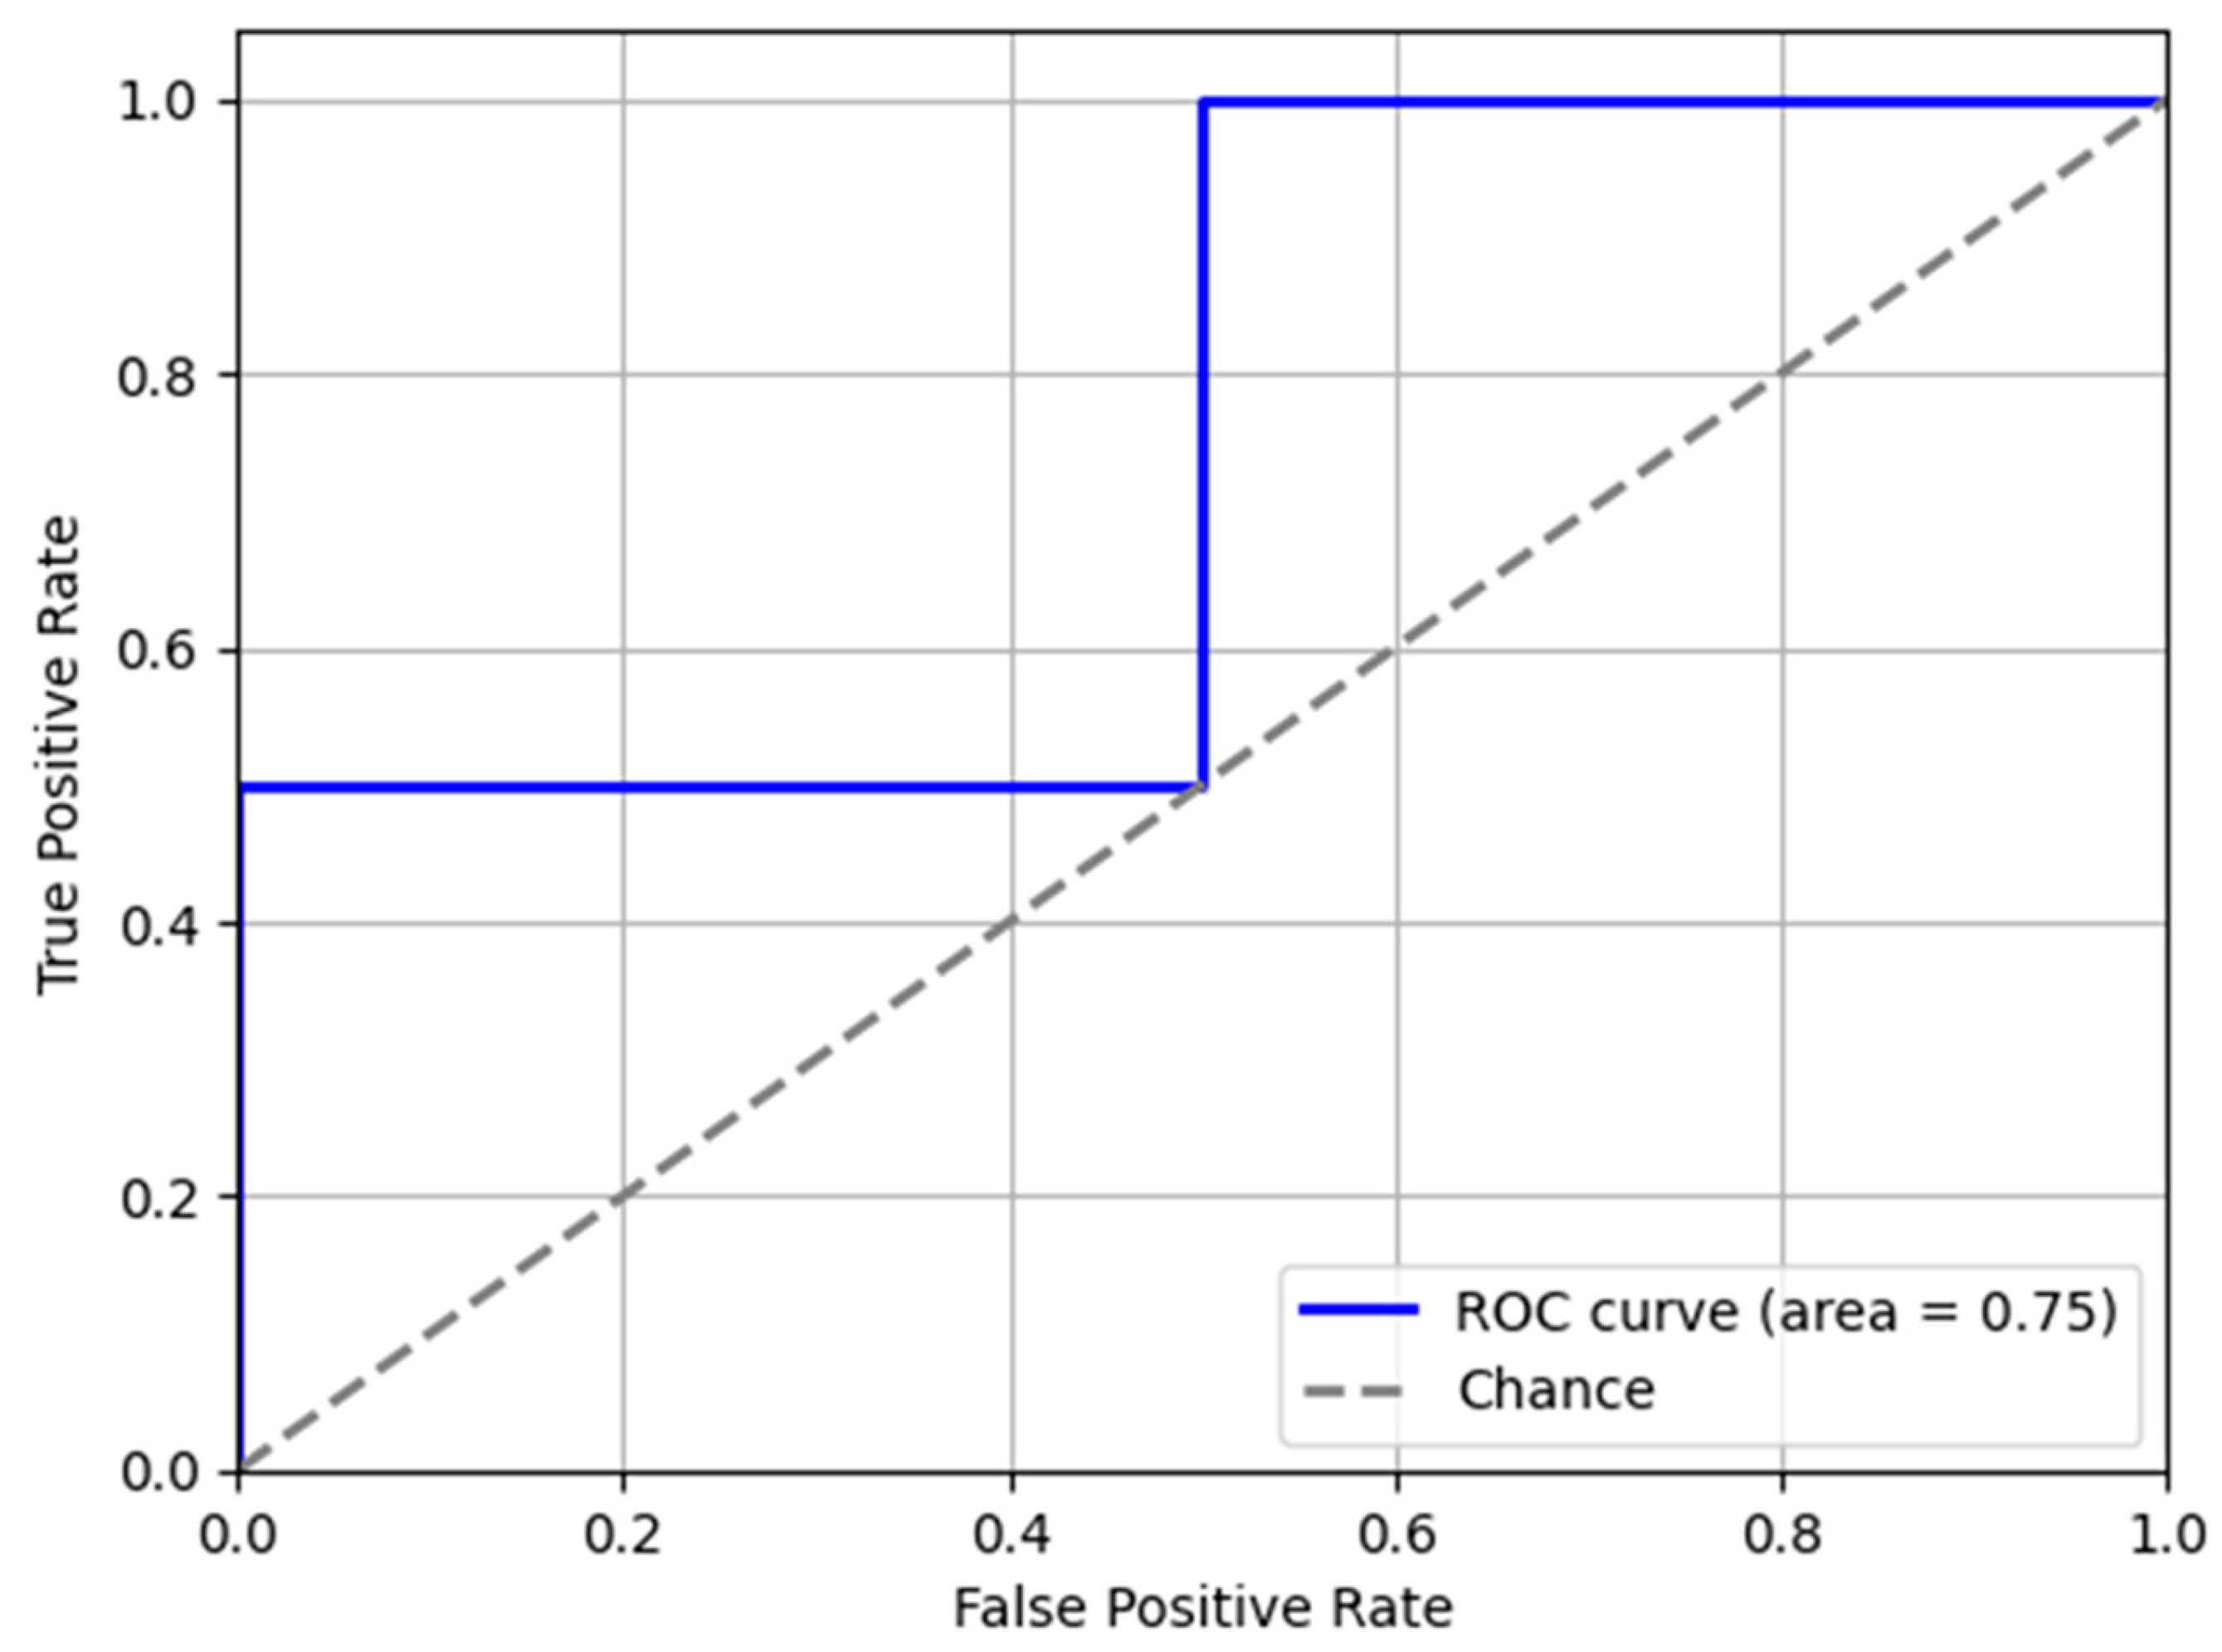
Figure 5.
Precision by Ship Type and Recycling Method.
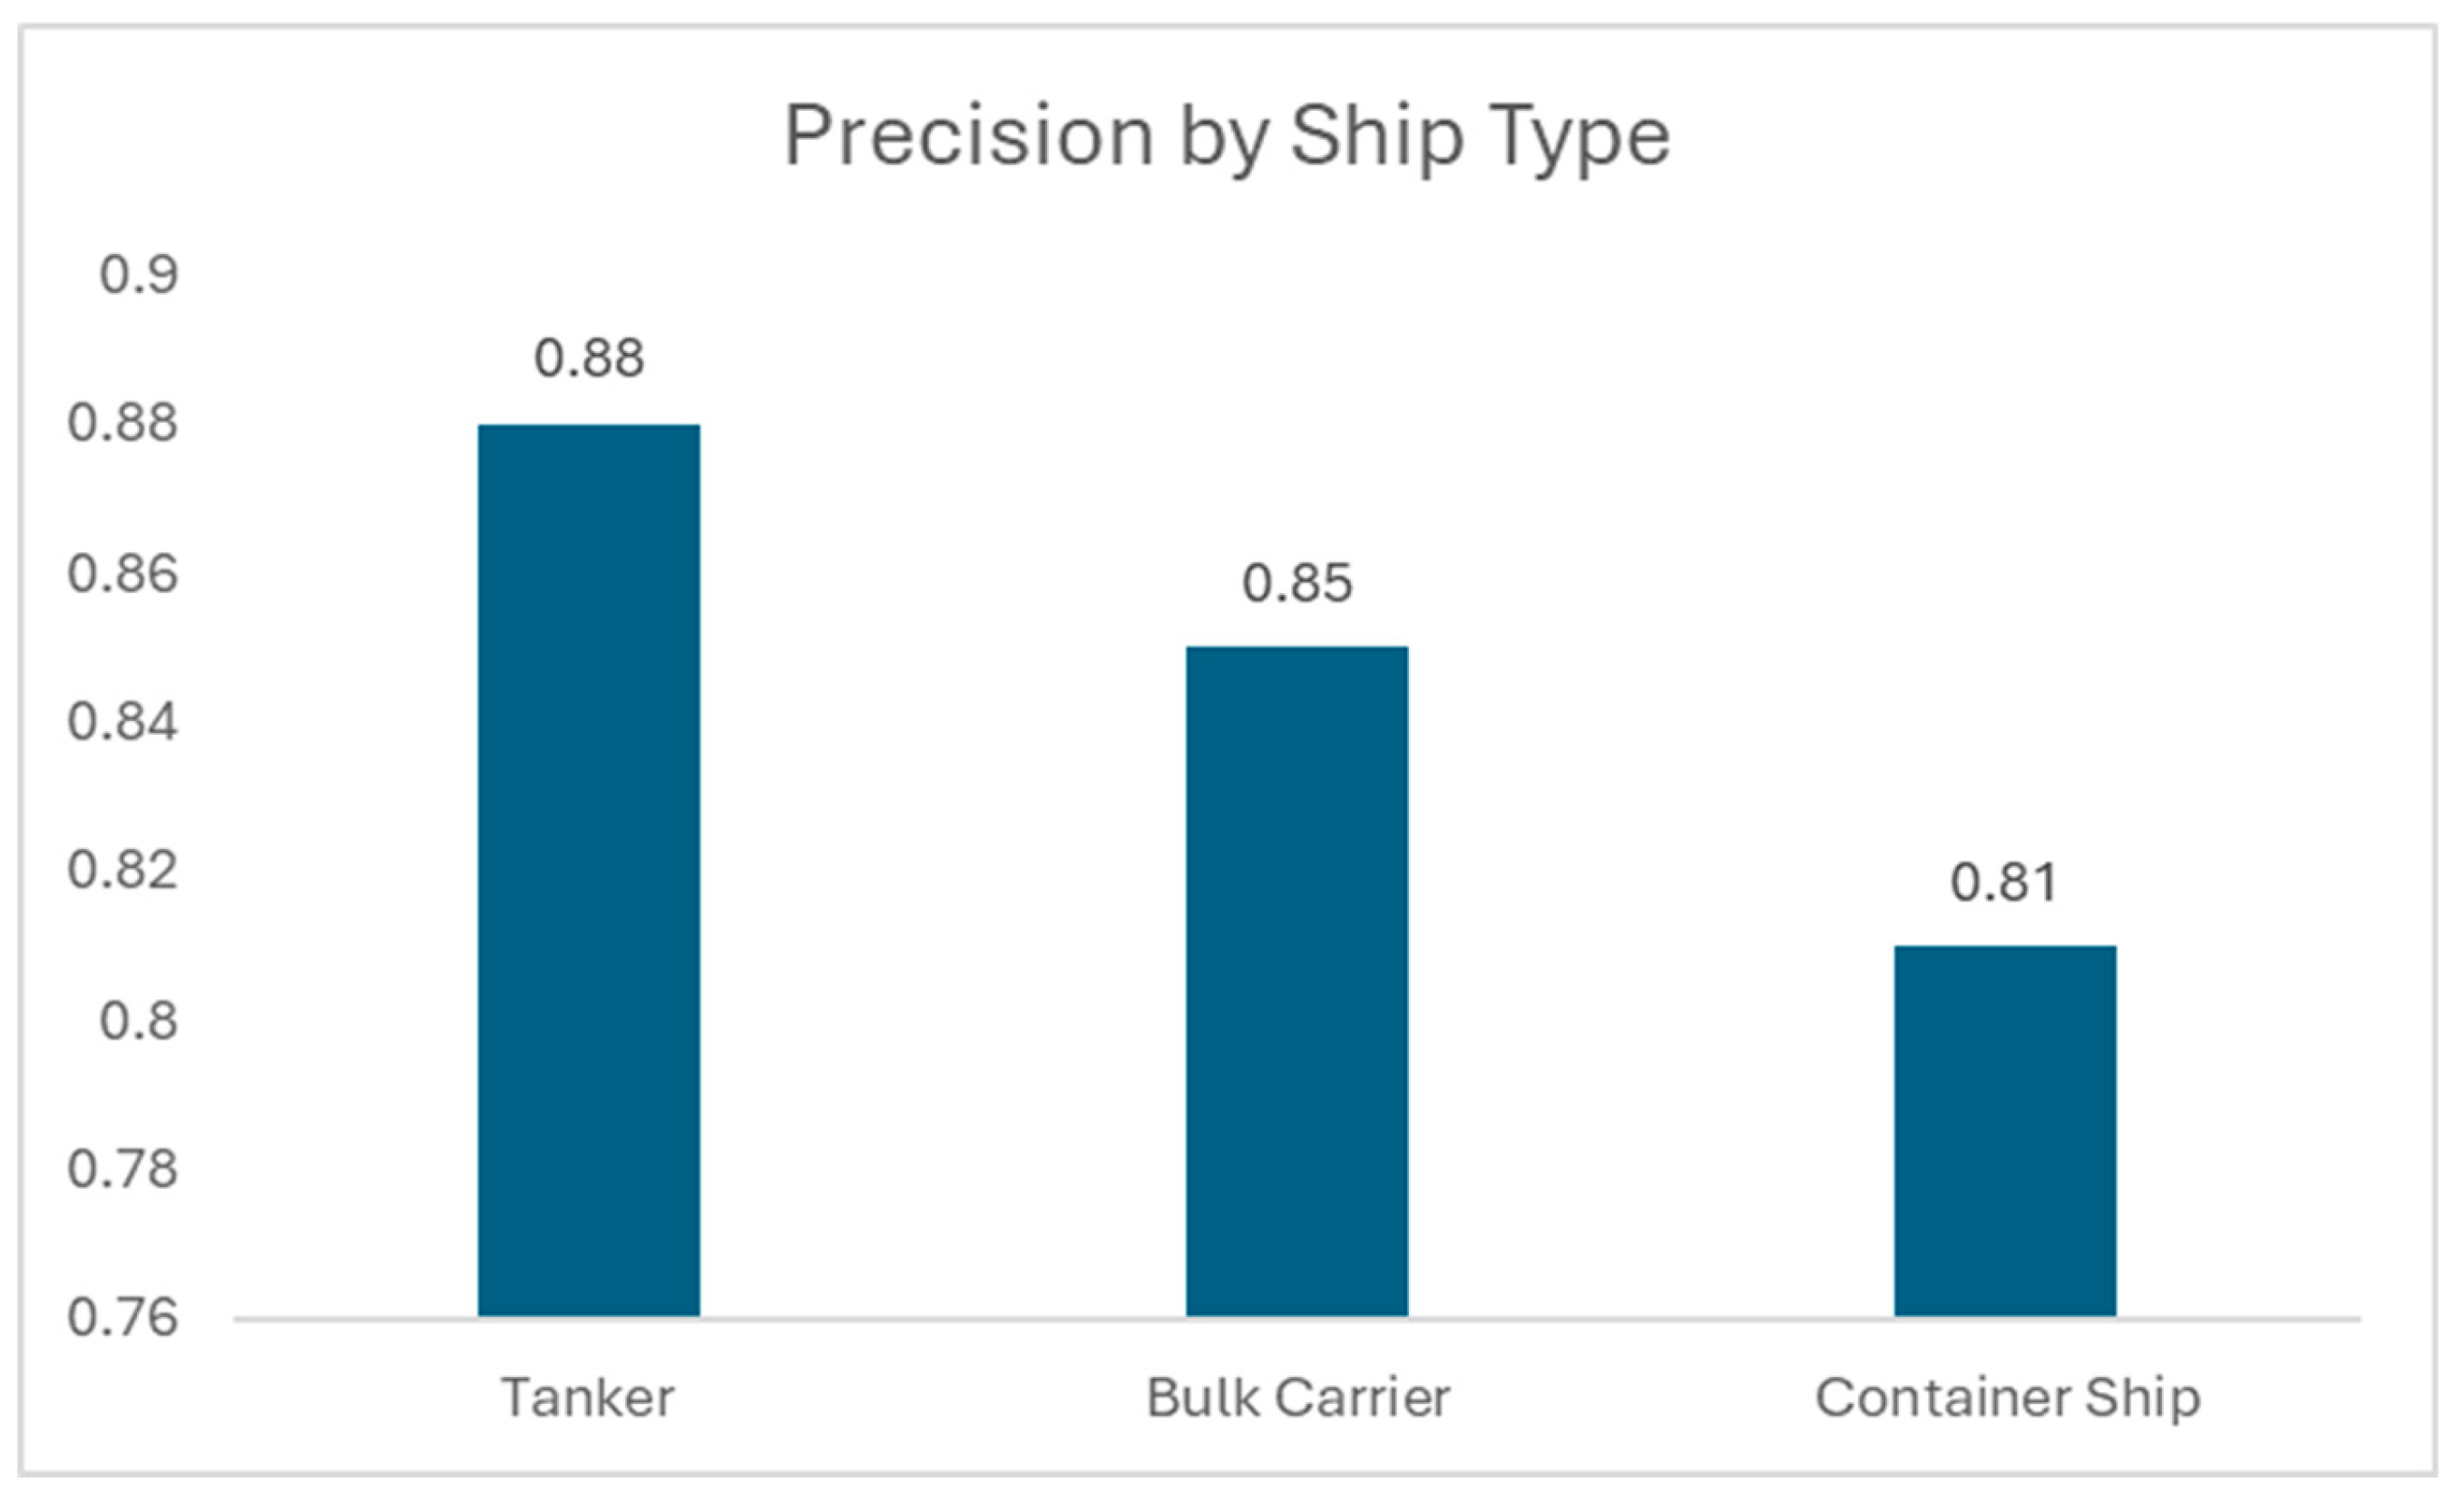
Figure 6.
Recall by Ship Type and Recycling Method .
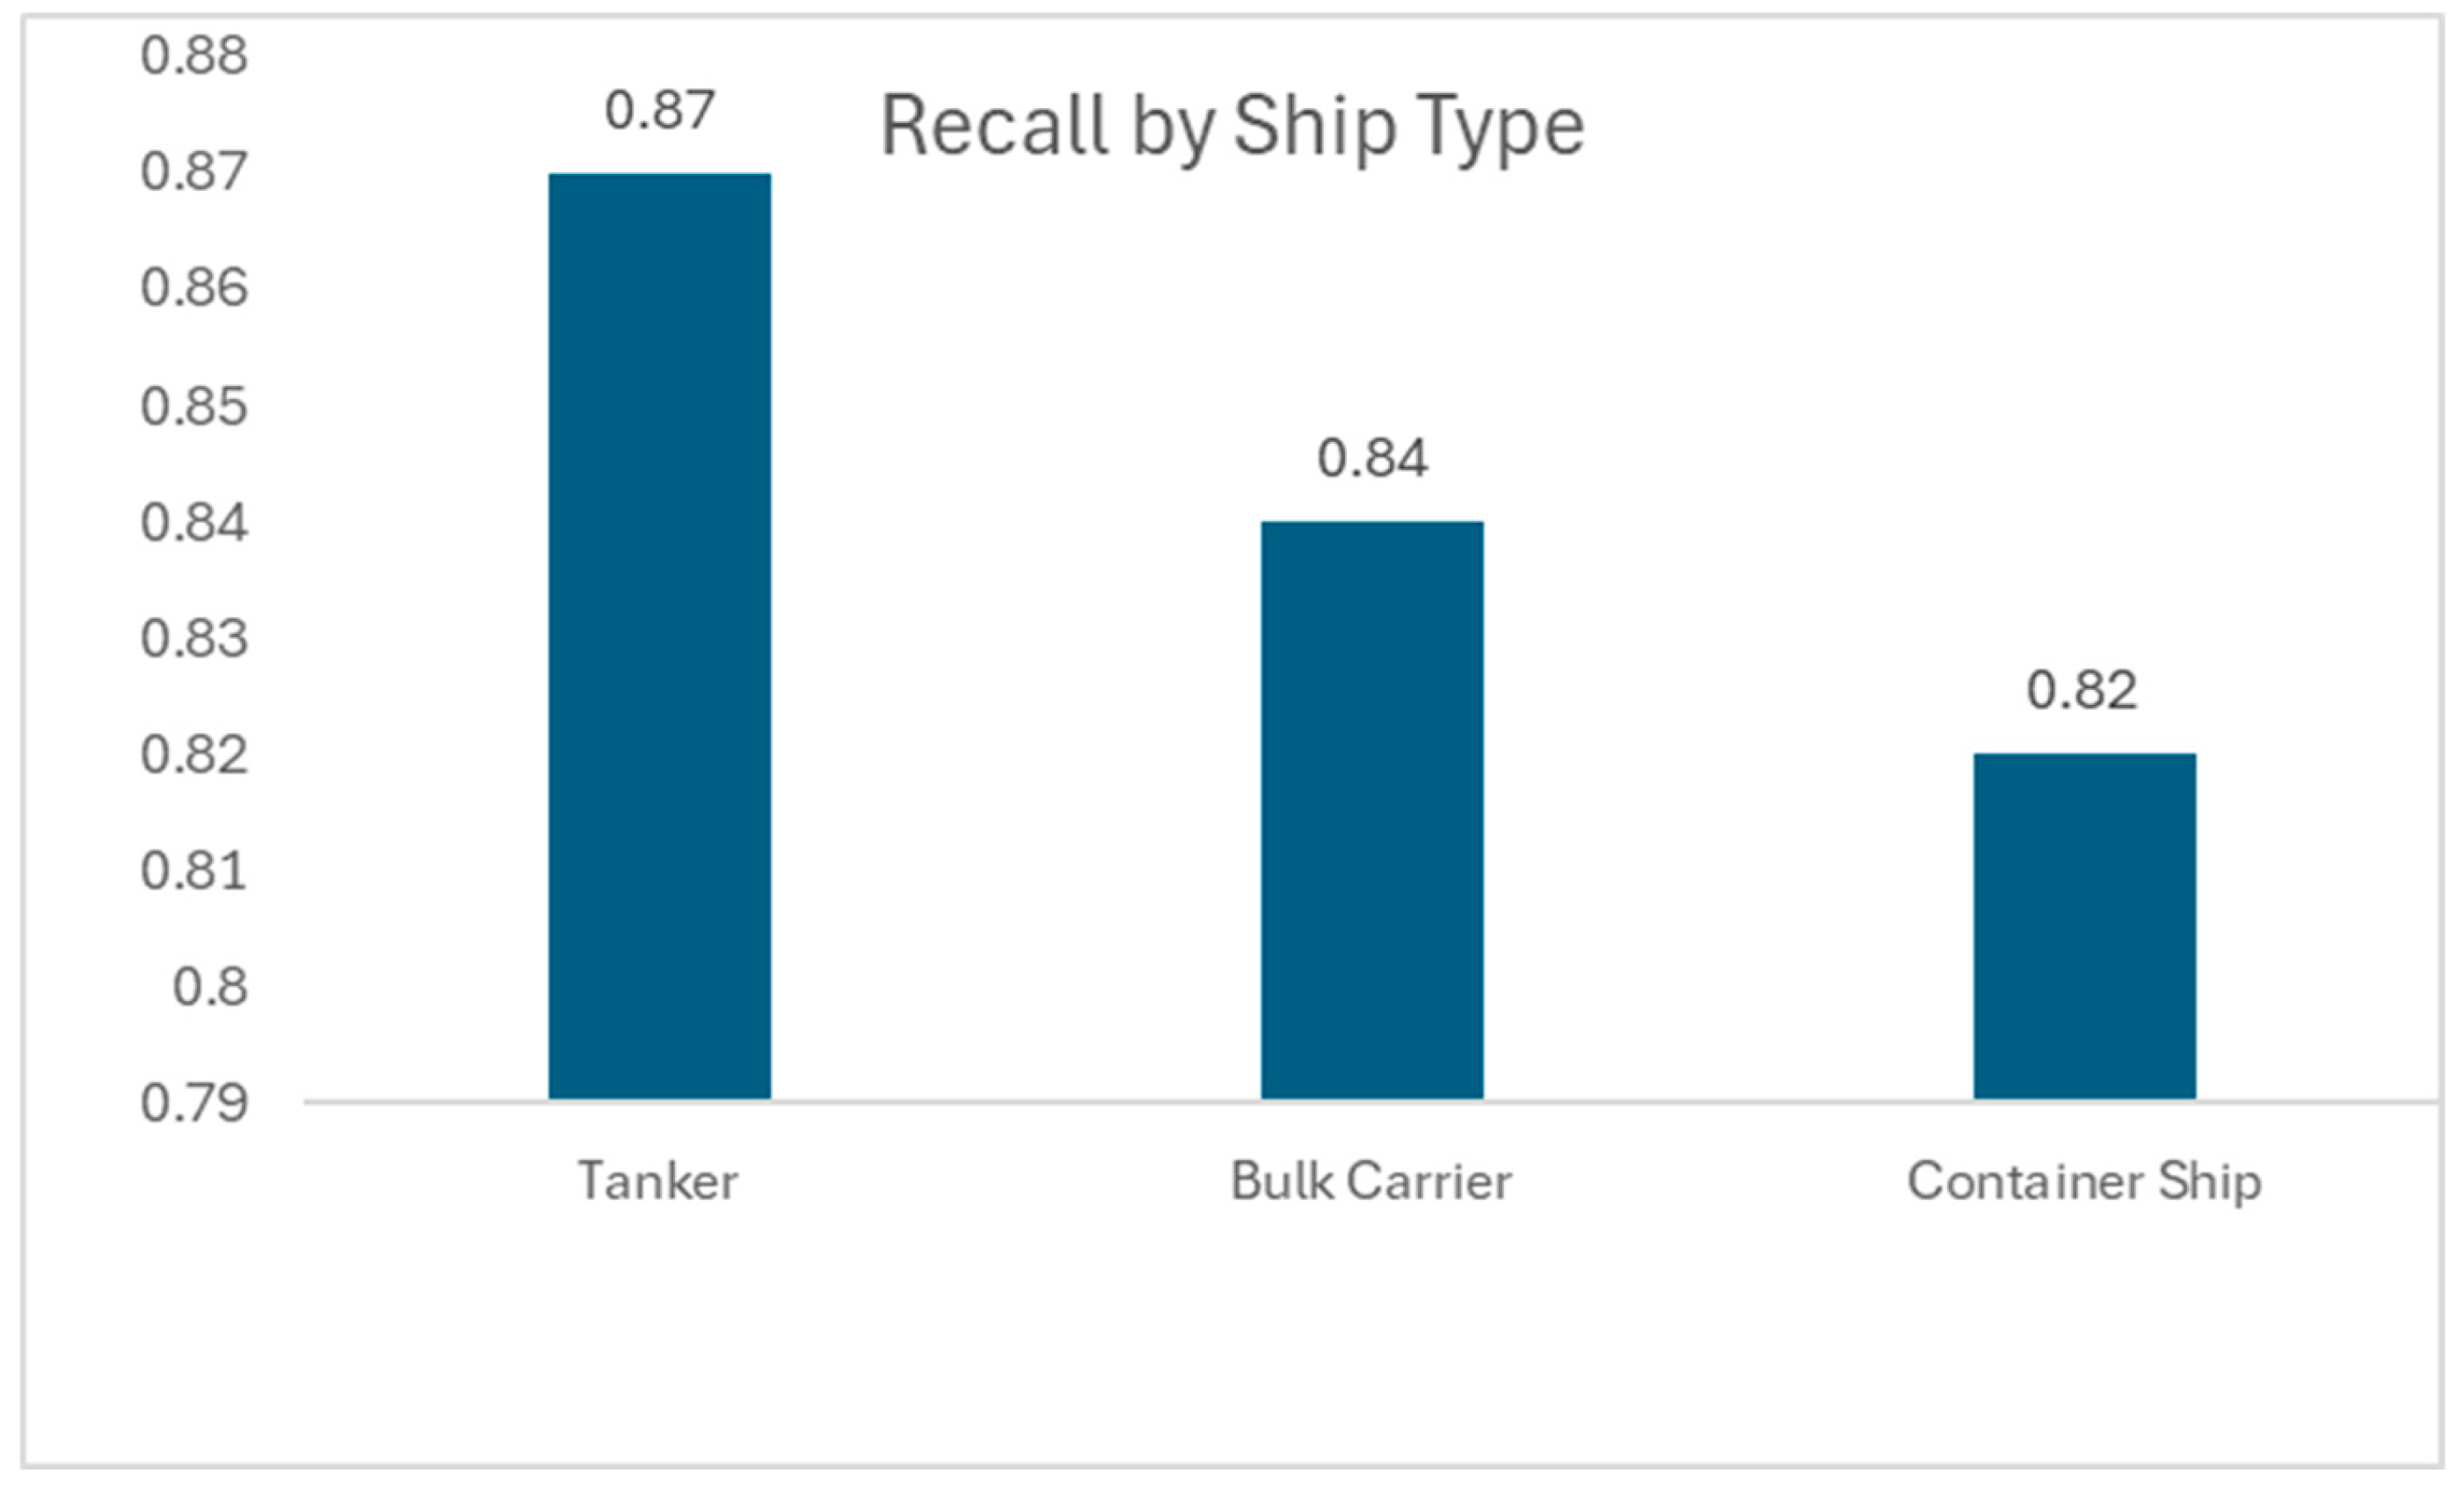
Figure 7.
AUC-ROC by Ship Type and Recycling Method.
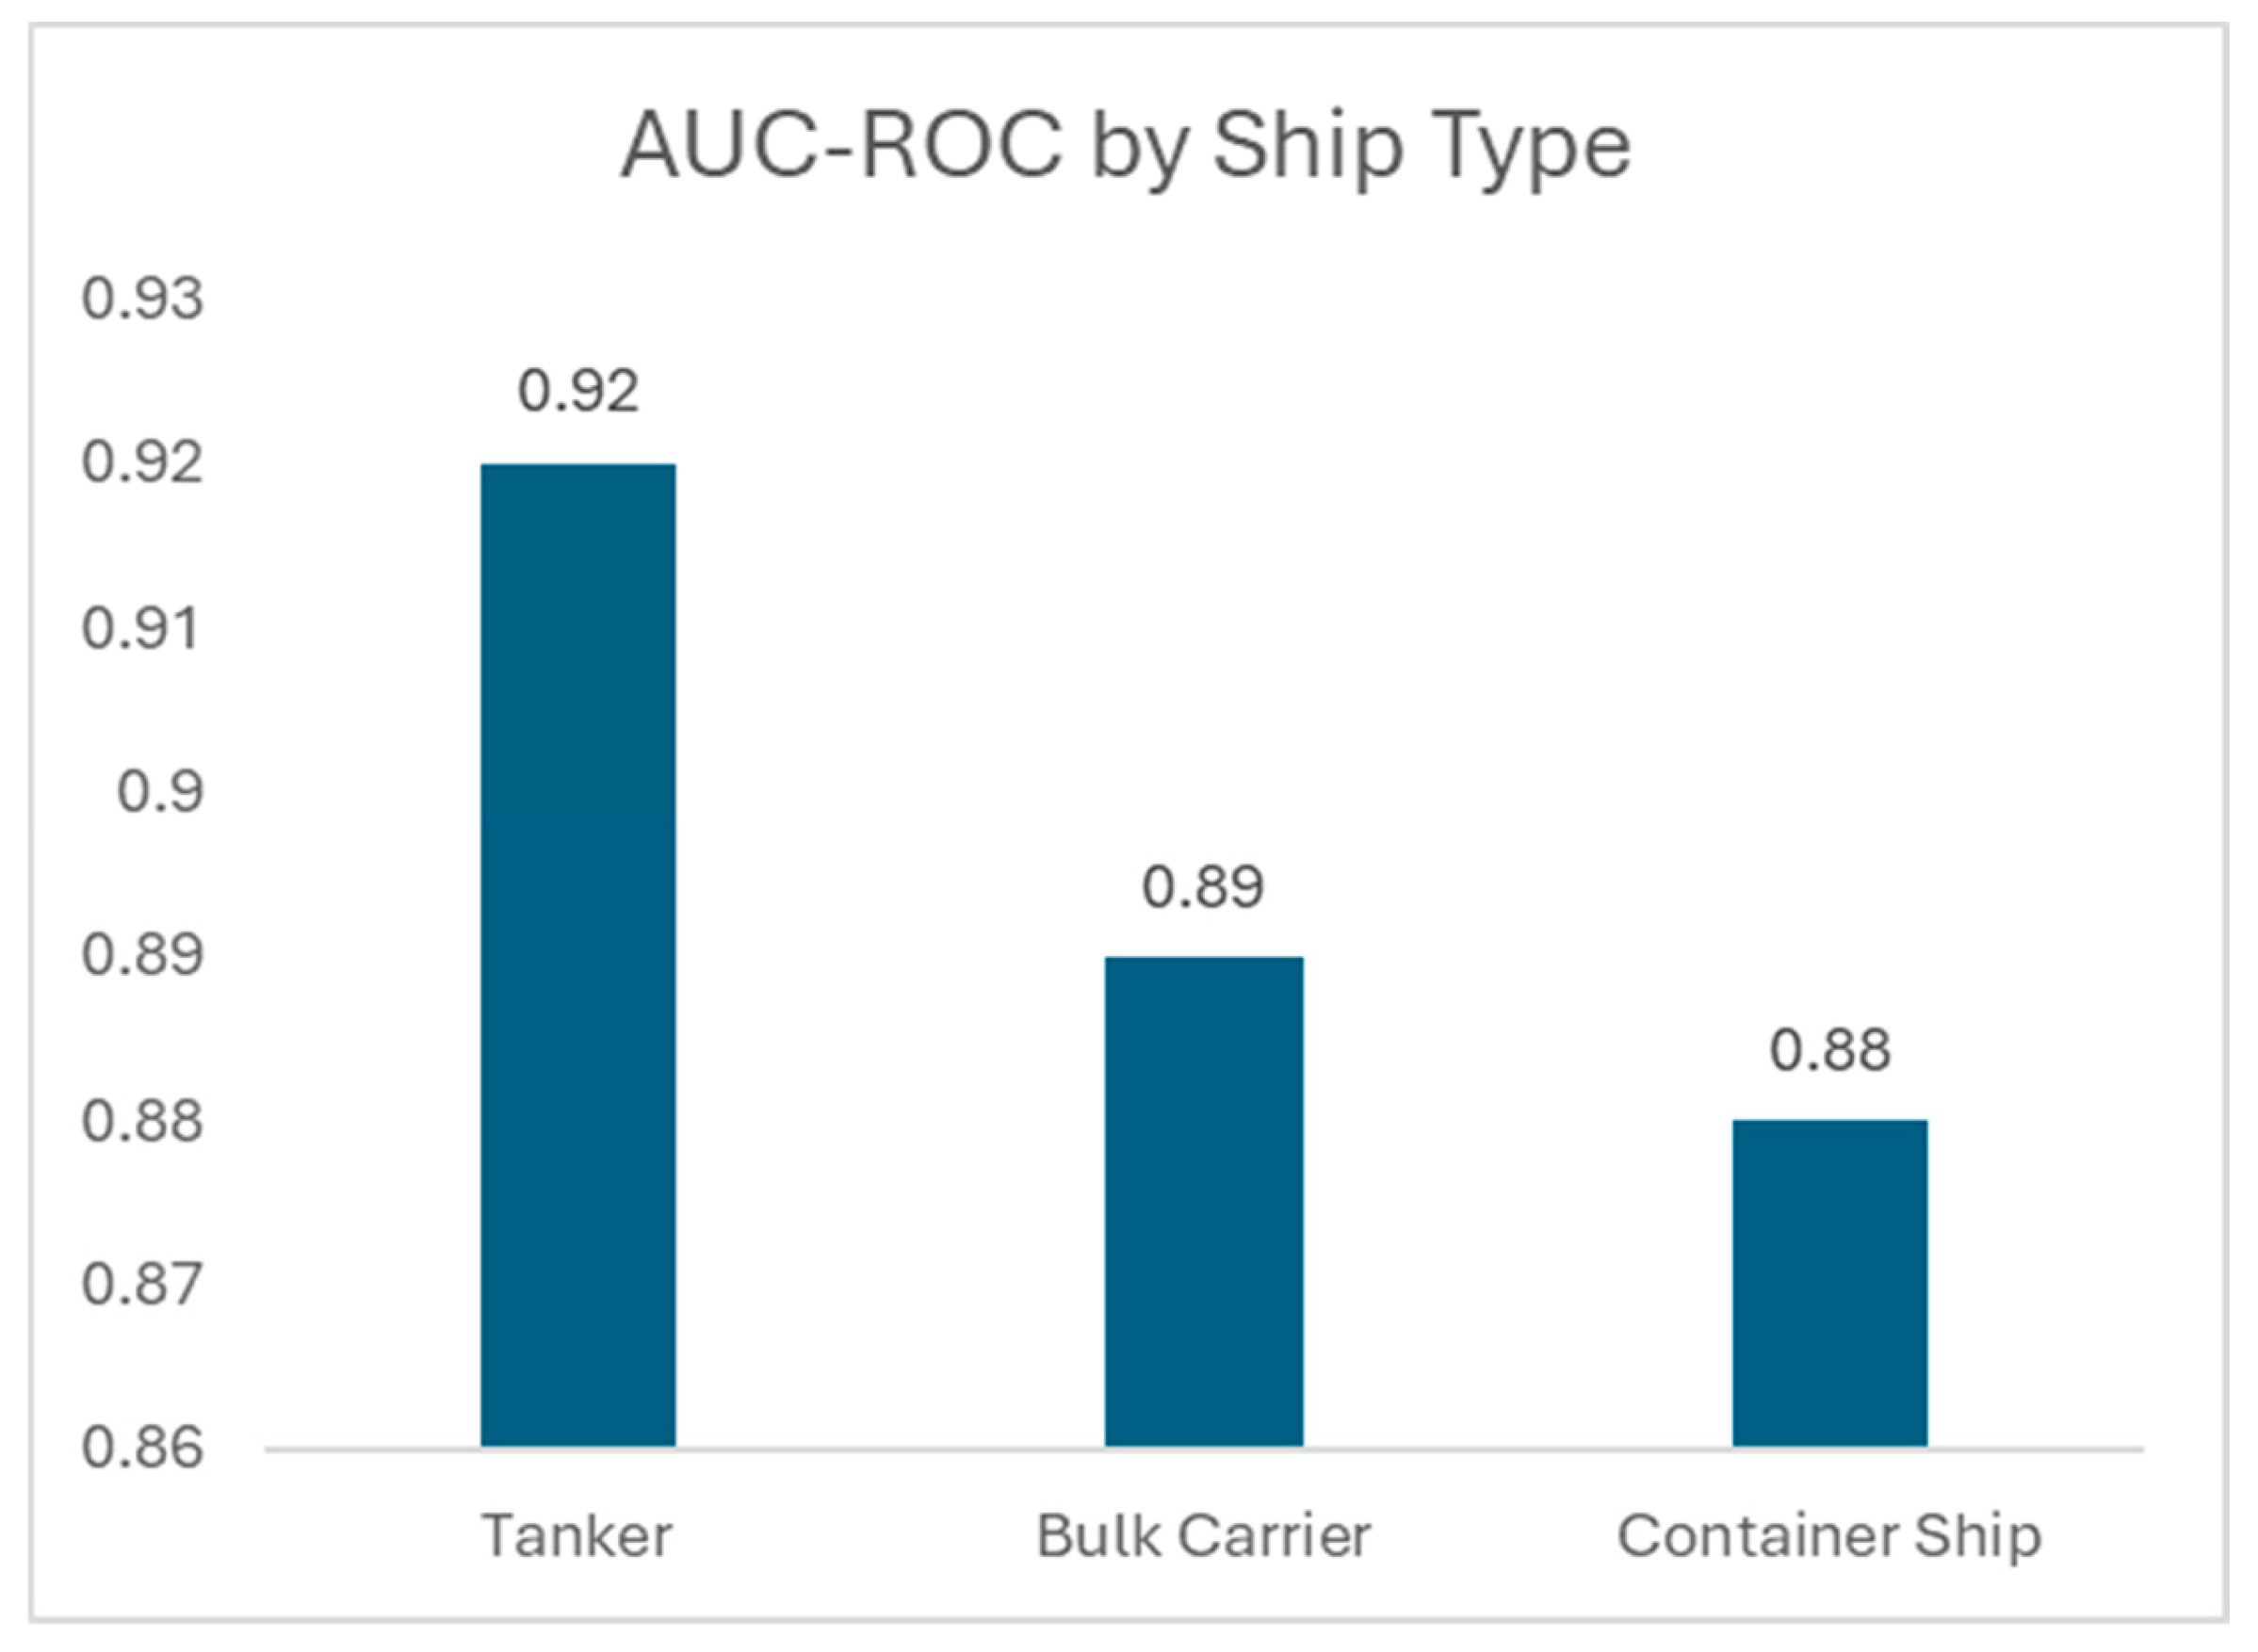
Figure 8.
F1-Score by Ship Type and Recycling Method.
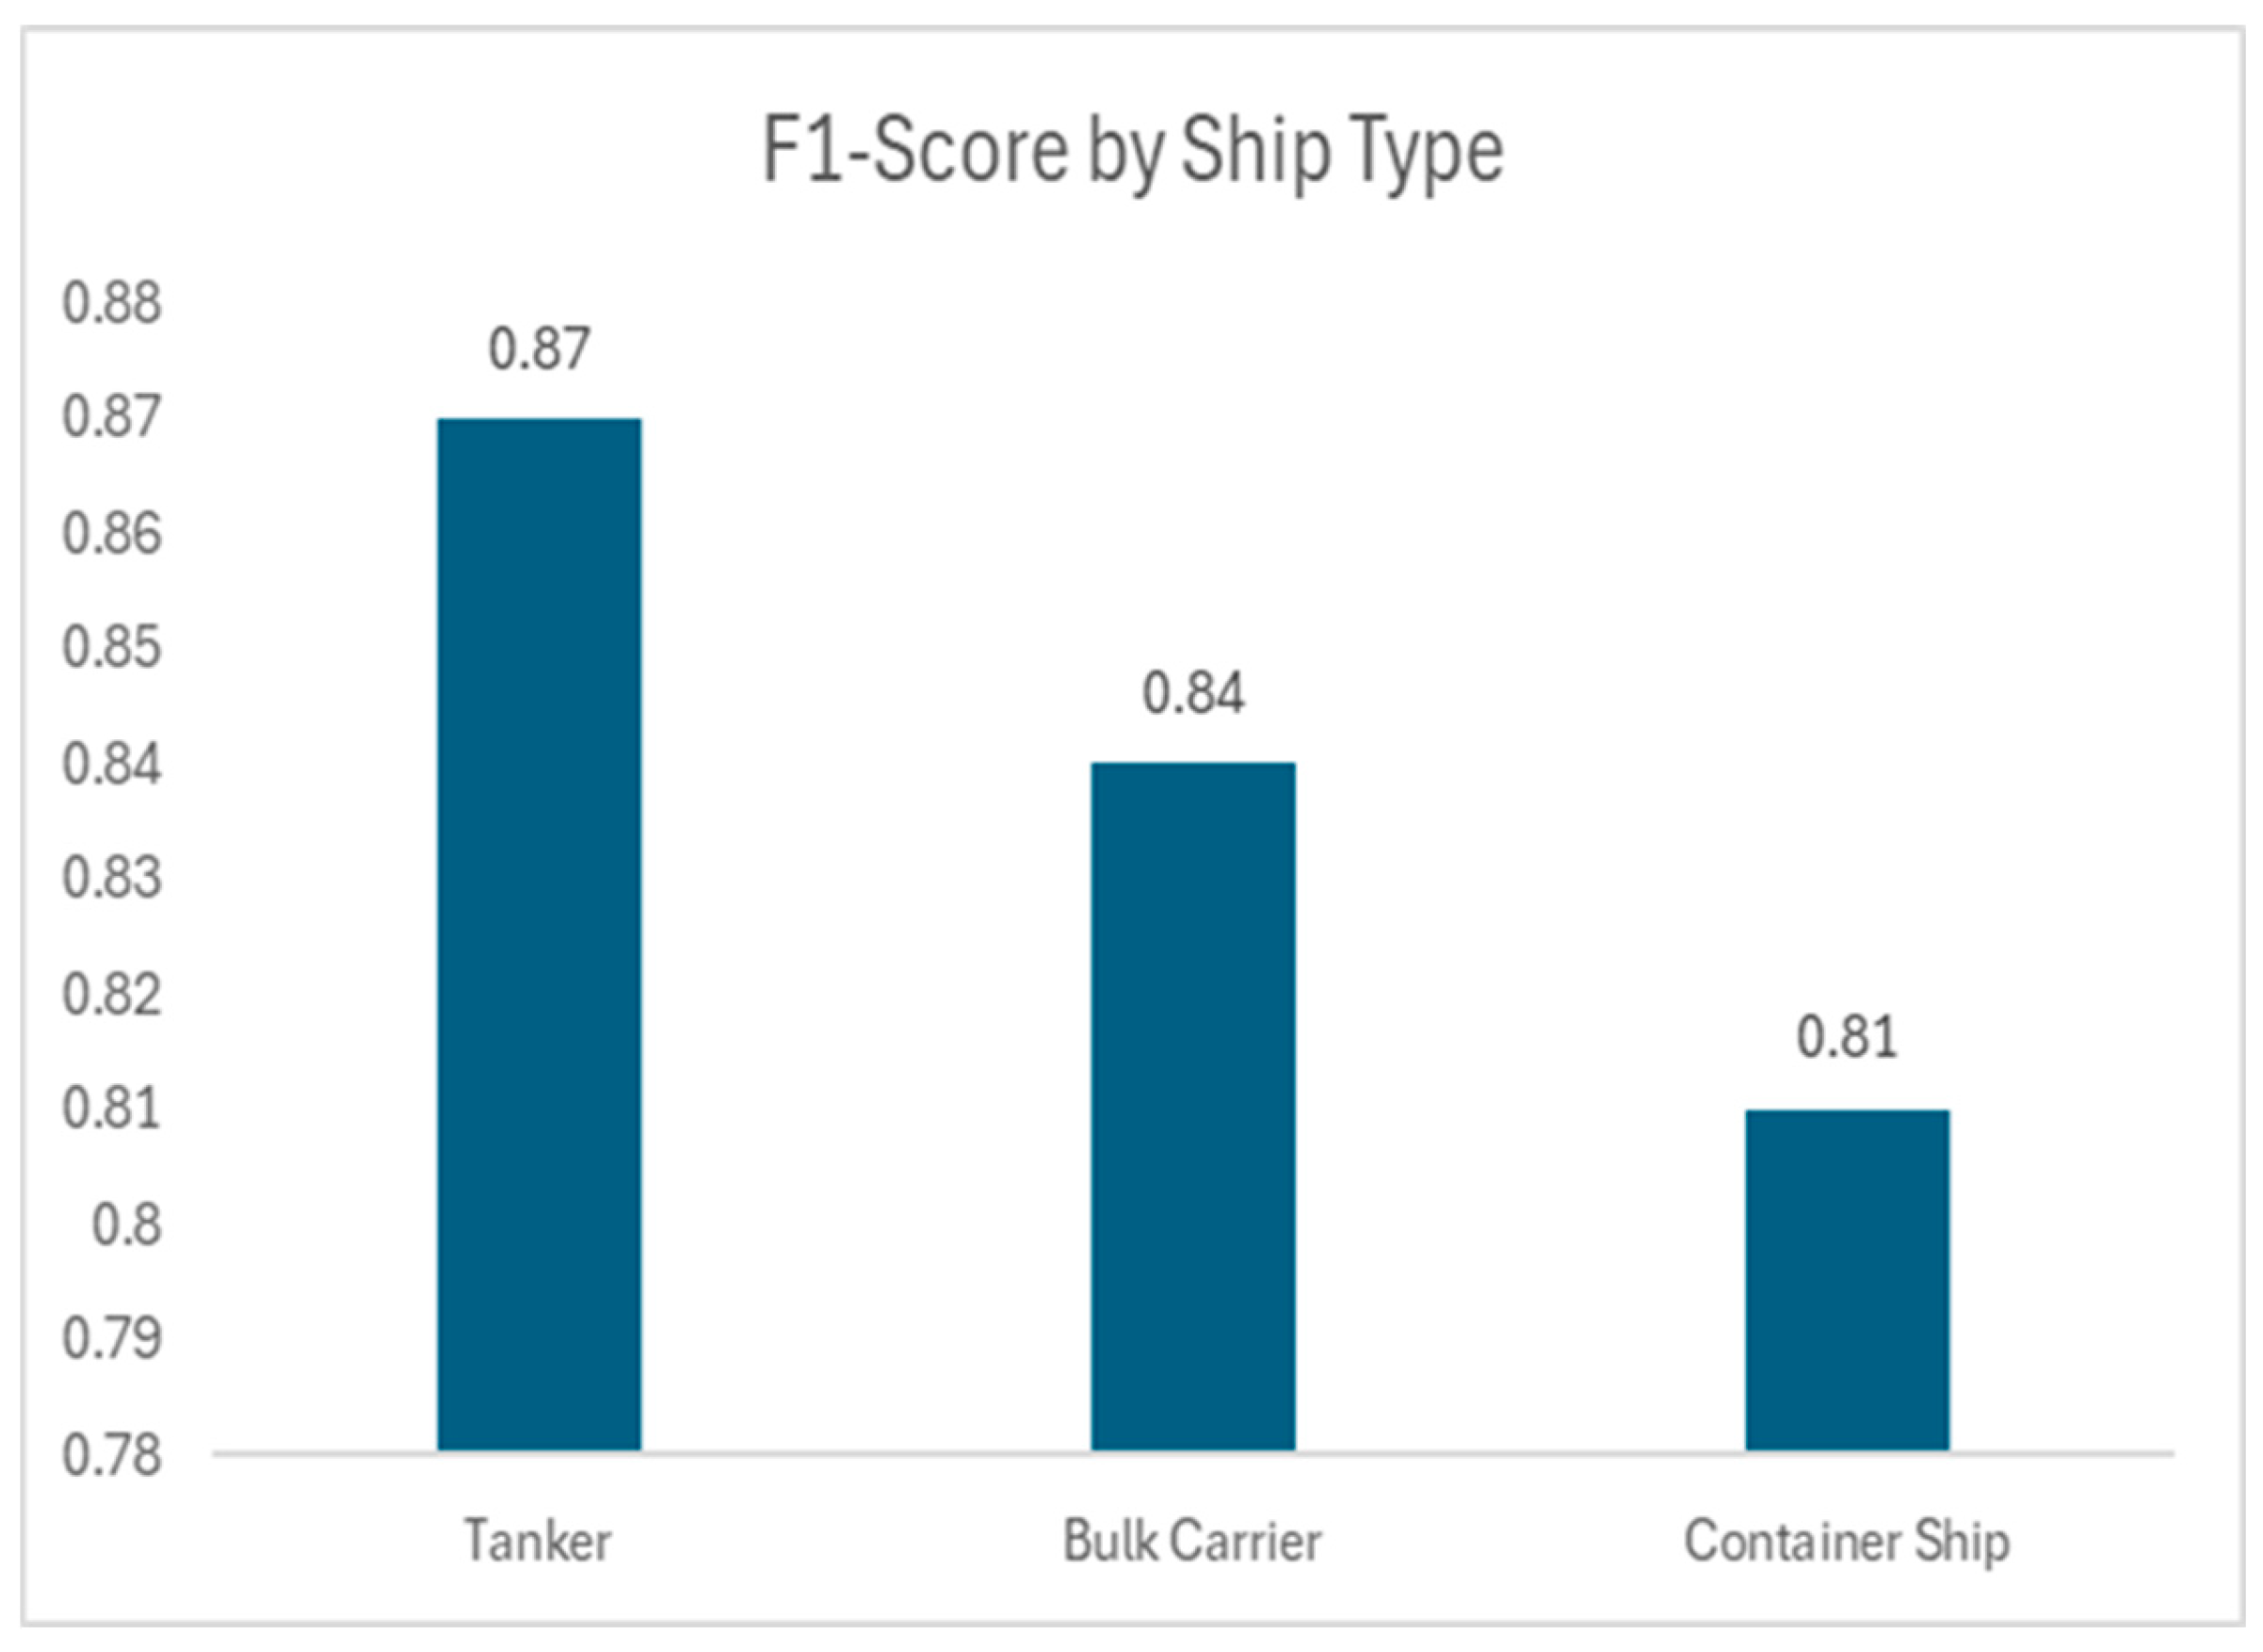
Figure 10.
MV REMI under Dismantling at Recycling yard in Calabar, Nigeria.
Disclaimer/Publisher’s Note: The statements, opinions and data contained in all publications are solely those of the individual author(s) and contributor(s) and not of MDPI and/or the editor(s). MDPI and/or the editor(s) disclaim responsibility for any injury to people or property resulting from any ideas, methods, instructions or products referred to in the content. |
© 2025 by the authors. Licensee MDPI, Basel, Switzerland. This article is an open access article distributed under the terms and conditions of the Creative Commons Attribution (CC BY) license (http://creativecommons.org/licenses/by/4.0/).
Copyright: This open access article is published under a Creative Commons CC BY 4.0 license, which permit the free download, distribution, and reuse, provided that the author and preprint are cited in any reuse.