Submitted:
25 January 2025
Posted:
27 January 2025
You are already at the latest version
Abstract
Drought is a natural phenomenon which occurs often unpredictably. It affects larger communities mainly who depends more on rainwater for their crop cultivation. It is a natural that it occurs at different magnitude over a year. The number of rainy days in each month usually have large variations among them as it depends on the seasons. Indian meteorological department (IMD) has provided a categorization of rainfall based on amount of daily rainfall amount. The number of rainy days in each categorization will have an impact in addressing varying intensity of dryness and wetness. As the number of rainy days in each categorization is important over the year apart from annual rainfall amount, the index based on this could help to understand the climate of the region in better way. In the present study, a new index for drought or wet year assessment is presented based on IMD’s rainfall categorization. The proposed index is applied to Thanjavur city rainfall data and drought categorization is carried out as per the new index. The results of the study indicate that the proposed index is found to be effective in assessing drought conditions by simple calculation.
Keywords:
Rainfall
; drought
; climate change
; meteorology
; water resources management
1. Introduction
Assessment of drought is very important for planning purpose and providing compensation for affected farmers and society in large. Declaring a region or place as a drought affected area for a particular year needs a through scientific approach. There are several indices are available based on hydrological, meteorological, availability of water in the surface water bodies and vegetation data. Few methods utilize a single type of data (eg. Rainfall) and others requires several types of data to quantify the drought. Non-availability of water to meet out various demand spatially and temporally comparing with normal year has made to declare as a drought period with varying degrees of severity. The same is applicable when there is excess rainfall to declare as a wet period with varying degrees of severity. The standardized precipitation index, effective drought index, rainfall departure, rainfall anomaly index, standardized anomaly index, rainfall decile-based drought index and percent of normal are the examples of indices where rainfall data alone considered to categorize the drought [1,2,3,4,5]. Standardized precipitation index (SPI) is widely used drought index as it transforms the rainfall time-series into a standard normal distribution (z-distribution). The transformation brings the mean of data as zero and standard deviation as one [6,7,8]. China Z index is another rainfall-based index which has been widely used in the China and other regions. This index adopts Pearson Type III distribution, and Wilson-Hilferty cube root transformation is used [9,10]. These rainfall-based drought indices consider amount of rainfall over a period but does not account the number of rainy day and its intensity per day. The rainfall anomaly index developed by Van-Rooy [11] is gaining important as it is easy to apply and categorize drought using mean rainfall, mean of top 10 maximum rainfall, and mean of least 10 minimum rainfalls of a selected period for analysis. Byun and Wilhite [12] presented effective drought index (EDI) which utilize the daily rainfall data that measures the daily water accumulation with a weighted rainfall over a defined preceding period computed using a time dependent reduction function. Recently, Hansel et al. [13] has modified the rainfall anomaly index with finer categorization of dry and wet to match in line with the SPI. It utilizes median rainfall from the series instead of mean and adopt mean of 10% extremities rather than mean of 10 extremities that is used in RAI. These changes have brought a better understanding of the drought of a region. Percent of normal (PN), Deciles index (DI) and Z-score index are simple rainfall based indices [14]. It is to be noted that some rainfall-based indices utilize the probability distribution functions. These indices make a difficulty to address the drought when the rainfall so sporadically occurred in the region. Especially the rainfall in arid and semi-arid regions is very erratic and have strong discrepancy [15]. Tayfur [15] developed a new index named discrepancy precipitation index (DPI) that utilizes the rainfall data to assess the intensity of the drought. The method was applied to arid climate (Mauritania), semi-arid climate (Afghanistan) and the Mediterranean climate (Turkey) and able to capture the historical drought of the regions. Singh et al. [16] proposed a new drought index designated as standardized net precipitation distribution index that includes the distribution characteristics of the daily net rainfall. This index accounts magnitude, duration, frequency and uniformity of excess and deficit periods within the span of rainfall considered for the analysis. The index can capture changing characteristics of the precipitation which could be useful to ascertain climate change apart from drought assessment. The method uses probability distribution function to quantity the drought characteristics. Samantaray et al. [17] developed a new drought index by modifying SPI using rainfall amount and number of rainy days through bivariate copula function and it can be utilized effectively to address drought condition especially region of erratic rainfall characteristics. Scaling of regional drought using diverse drought indices are very important on identification and monitoring of dry and wet conditions for effective use and planning of water resources management [18]. Though there are drought indices developed using number of rainy days into account, but it requires a probability density function. The present research aims to introduce a new drought index using the number of rainy days falling in the different categories of rainfall magnitude as per IMD rainfall categorization without adopting any probability distribution function and follows the drought classifications as per SPI.
2. New Drought Index
In India, rainfall is a major occurring type of precipitation. Indian Meteorological Department (IMD) has categorized rainfall based on magnitude to define the severity of daily rainfall [19]. Rainfall over the year may have all such categories. The number of days of occurrence in each type could vary year to year or season to season. The number of occurrences of each type to a station is very important to address the availability of water for various purposes. Different magnitudes of rainfall have strong influence with respect to soil moisture storage, water storage in the ponds and tank, and contributes to the stream flow. Drought and wet assessments based on magnitude and number of days of occurrence could be more appropriate. A proposed new drought index considers number of days of occurrence of each type of rainfall over a period. Table 1 provides the IMD categorization of daily rainfall. Total number of rainy days over a year or season in the historical year can vary. The same could be useful for categorizing rainfall. Hence, deviation of each category of rainfall type with respect to long term mean shall be given important in the categorization of drought. A proposed index uses average of cumulative of ratios of each category of rainfall with respect to long term mean. ‘No rain’ category is not considered in the index. The long-term mean shall be an average of minimum 30 years of rainfall data. According to the proposed index, the drought categorization is made as shown in Table 2. As this index is based on number of rainy days, herein it is designated as Categorized Rainy Days Index (CRDI). When number of occurrences of each category of rainfall is taken for ratio between number of occurrences in the selected period and mean of the occurrences of that category can result value in the range 0 to 20. The value of zero could be when no rain occurs for entire considered periods. The very high value is possible when the mean of such category is very low. For example, rainfall greater than 244.5 mm may occur at higher return period. Its average value over selected data period will be very small. When it is applied to the rainfall occurred period, the ratio could result very high value since its denominator is very low. The selection of 0.6 to 1.0 range is designated as normal considering that if a particular year rainfall in each category close to the mean of respective value, then it works out close to that range as there are seven categories of rainfall. Keeping this as base, the higher side value of 1 is fixed for wet and less than 0.6 is designated for dry. The equation for calculating CRDI is as follows:
where NRDi – number of rainy days in category i
MNRDi – average of number of rainy days in category i
n – number of rainfall categories (refer Table 1)
In a year, if the occurrence of rainfall in each category is same as that of mean, then the index value can be one. But it could be a rare incident in the history. Certain categories will be less than its mean value and a few could be greater than its mean. This aspects of occurrence of different categories of rainfall can bring index value closer to one and can be considered as a near normal. Fluctuation in the number of occurrences of rainfall in each category usually common and a key factor in deciding the degree of drought or wet period. If the fluctuation is highly erratic, then its effect needs to be counted in the index. Hence, the range of index value for near normal is fixed between 0.6 and 1.0.
3. Study area
Thanjavur city (Figure 1) is located at Cauvery Delta region of Tamil Nadu state of India. It is a rich cultural city of Tamil Nadu. Cauvery delta is considered as a rice bowl of Tamil Nadu. The predominant cultivation of this delta region is paddy. This region has 1850 years old dam constructed across river Cauvery during Chola kingdom. The city’s domestic water supply system relies on Cauvery River water and ground water. The major portion of rainfall occurs during North-East monsoon period. Rainfall during this period helps to built-up ground water storage and able to fill up irrigation tanks and ponds. Due to erratic nature of monsoon, the occurrence of drought is not uncommon. The annual average rainfall of the city is 958.8 mm [20]. Rainfall recorded in the month of November will be highest in most of the years. The rainfall data collected from Indian Meteorological department between year 1904 and 2016 was used to study the application of proposed drought index. Table 3 shows the statistics of number of rainy days for each month. It shows that almost each month can have no rainy days. October and November months are having maximum rainy days which falls in the North-East monsoon. Suribabu and Neelakantan [21] were applied SPI, China-Z-score and Statistical Z score indices to assess the dry and wet conditions and the same is used here for comparison of the result obtained in the proposed index.
4. Results and Discussion
The daily rainfall data of Thanjavur city (year 1904-2016) is used to categorize the drought using proposed index. Table 4 shows the mean value of occurrence of each category rainfall. It can be observed from Table 4 that moderate rainfall has more chance of occurrence over a year followed by light rain. Very heavy and extremely heavy rain are found to be a rare occurrence in the study area. When a greater number of extreme rainfalls occurs in a year, then there is a more chance that year being categorized extreme wet weather as its ratio will have higher value. The occurrence of each category is less than its long-term mean, then proposed index denotes as drought condition. Each category of rainfall will have equal influence in deciding the drought intensity since drought or wet shall be measured in absolute term. The average number of rainy days for the study area is found to be 61 days. It is to be noted that around 304 days falls on no rainy days. But there could be moisture in the soil due to antecedent rainfall. As the number of rainy days less, this area certainly requires surface and ground storage to make available of water during non-rainy days. As the number of rainy days place a role in creating moisture in the area, its important shall be accounted while quantifying the drought or wet season or year.
Table 5 shows the percentage occurrence of each drought category for the time scale 1904-2016. It can be seen from the Table 5 that occurrence of normal years is having higher percentage, and moderate wet is next to it. The percentage of severe dry year is relatively high comparing with other categories of dry. The influence of monsoons rainfall amount has significant effect in deciding the category of drought annually. Annual calculation indicates that extreme dry has lesser occurrence while comparing with monsoon wise calculation. It cannot be ignored the effect of pre-monsoon and winter periods in the annual calculation. Figure 2, Figure 3 and Figure 4 shows the drought index value for south-west, north-east monsoons and annual for the selected time scale. Two years have shown very high value in each monsoon as well as in annual calculation. It cannot be considered as the outliers. This happens due to occurrence of very heavy down pour in a particular year. Such a heavy rainfall would have been occurred only once or twice in the time scale considered. And its average value over the time scale leads to have very small value and ratio correspond to that category will have very high value for that particular year. Table 6 provides the comparison of present index value and other three indices value. It can be seen from other three indices that normal year is found to be higher percentage of occurrence and greater than the proposed index percentage for normal year. The proposed index is having a closer result with SPI for all the categories. While comparing proposed index value for normal year category, China Z index and Statistical Z-score has around 20 % of higher proportion. This higher proportion of normal year category significantly changes extremities.
The analysis was also carried out by taking three 30 years of data and applied proposed index to ascertain the drought level. Table 7 presents the percentage of occurrence for the years 1927-1956, 1957-1986 and 1987-2016. There is a decreasing proportion of occurrence of normal year and increasing occurrence of drought years and at the same time there is not much change in the total number of wet years according to annual data analysis. The first two 30 years, no extreme dry was reported as per this index and in the last 30 years, the occurrence of extreme dry is found to be quite high. There is a significant increase in the normal year during south-west monsoon and whereas increase in extreme and severe dry years are noticed during north-east monsoon. Since this index considers of both number of rainy days at different ranges of rainfall magnitude in analysing the drought category, the effect due to climate change cannot be ignored. In the case of south-west monsoon period, similar situation prevails that of annual pattern. But there is drastic increase in the dry period during north-east monsoon period and significant decrease of normal years in the recent years. This index is not only useful to understand the degree of dry and wet years, but also provide valuable information on the climate.
5. Conclusions
This paper presents a new rainfall-based index that considers number of rainy days with respect to IMD categorization of rainfall. This index is applied to Thanjavur City for 113 years long term daily rainfall data and applied 30 years’ time scale from recent 30 years to past two 30 years. The proposed index can categorize the drought and wet of various intensities. This index shows that there is a decreasing event of normal years, increasing trend of dry years and no significant changes in the wet years from the analysis of different 30 years of data beginning from recent past 30 years. This signifies that there is climate change effect on the recent weather conditions. Furthermore, according to drought categorization of both monsoon seasons of the study area, there is considerable increase of dry seasons during North-East monsoon season than South-West monsoon season and the same is reflected in the annual data analysis. As the proposed index does not depend on any probability distribution function, it can be applied easily to assess the drought and wet conditions of the study area.
Funding
No funding was received for this project.
References
- Jain, V.K., Pandey, R.P., and M.K. Jain. 2015, Hi-Ryong Byun Comparison of drought indices for appraisal of drought characteristics in the Ken River Basin, Weather and Climate Extremes, 8, 1-11.
- World Meteorological Organization (WMO) and Global Water Partnership (GWP), 2016. Handbook of Drought Indicators and Indices (M. Svoboda and B.A. Fuchs). Integrated Drought Management Programme (IDMP), Integrated Drought Management Tools and Guidelines Series 2. Geneva.
- Salehnia, N., Alizadeh, A., Sanaeinejad, H., Bannayan, M., Zarrin, A. & Hoogenboom, G. 2017. Estimation of meteorological drought indices based on AgMERRA precipitation data and station-observed precipitation data. Journal of Arid Land 9, 797–809. [CrossRef]
- Sundararajan, K., Garg, L., Srinivasan, K., Bashir, A. K., Kaliappan, J., Ganapathy, G. P., Selvaraj, S. K. & Meena, T. 2021 A contemporary review on drought modeling using machine learning approaches. CMES-Computer Modeling in Engineering and Sciences 128 (2), 447–487. [CrossRef]
- Singh, U., Agarwal, P. & Sharma, P. K. 2022. Meteorological drought analysis with different indices for the Betwa River basin, India. Theoretical and Applied Climatology. [CrossRef]
- Mckee, T.B., Doesken, N.J., and Kleist, J.,1993. “The relationship of drought frequency and duration to time scales.” Proceedings of the 8th Conference on Applied Climatology, Anaheim, CA, USA, 179–184.
- McKee, T.B., Doesken, N.J., and Kleist, J. 1995. “Drought monitoring with multiple time scales.” Proceeding of the Ninth Conference on Applied Climatology, American Meteorological Society, Dallas, TX, 233–236.
- Edwards, D.C., and McKee, T.B. 1997. Characteristics of 20th century drought in the United States at multiple scales, Climatology Report 97-2, Department of Atmospheric Science, Colarado state University, Fort Collins.
- Wu, H., Hayes, M.J., Weiss, A., and Hu, Q.I. 2001. An evaluation of the standardized precipitation index, the China Z-index and the statistical Z- score. Int.J. Clim., 21, 745–758. [CrossRef]
- Dogan, S., Berktay, A., and Singh, V.P. 2012. Comparison of multi-monthly rainfall-based drought severity indices, with application to semi-arid Konya closed basin, Turkey. J. Hydrol., 470–471, 255–268. [CrossRef]
- Van-Rooy, M.A. 1965. Rainfall Anomaly Index Independent of Time and Space. Weather Bur. S. Afr., 14, 43–48.
- Byun, H.R., and Wilhite, D.A. 1999. Objective quantification of drought severity and duration. J. Climatol. 12, 2747–2756.
- Hänsel. S., A. Schucknecht and J. Matschullat. 2016. The Modified Rainfall Anomaly Index (mRAI)— is this an alternative to the Standardised Precipitation Index (SPI) in evaluating future extreme precipitation characteristics?. Theor. Appl. Climatol. 123:827–844.
- Sa’adi. Z., Z. Yusop., N.E.Alias. 2022. Inter-comparisons on the suitability of rain-based meteorological drought in Johor River Basin, Malaysia., KSCE Journal of Civil Engineering, 26 (5); 2519-2537. [CrossRef]
- Tayfur. G. 2021. Discrepancy precipitation index for monitoring meteorological drought, Journal of Hydrology, 597, 126174. [CrossRef]
- Singh, G. R., Dhanya, C. T., and Chakravorty, A. 2021. A robust drought index accounting changing precipitation characteristics. Water Resources Research, 57, e2020WR029496. [CrossRef]
- Samantaray. A.K., M. Ramadas, and R. K. Panda. 2022. Changes in drought characteristics based on rainfall pattern drought index and the CMIP6 multi-model ensemble Agricultural Water Management, 266,107568.
- Faiza. M.A, Zhanga.Y, N.Ma, F.Baig, F. Naz and Y. Niaz. 2021. Drought indices: aggregation is necessary or is it only the researcher’s choice?, Water Supply Vol 21 No 8, 3987. [CrossRef]
- Bhatla, R., S. Verma, R. Pandey and A Tripathi. 2019. Evolution of extreme rainfall events over Indo-Gangetic plain in changing climate during 1901–2010, J. Earth Syst. Sci. (2019) 128:120. [CrossRef]
- Suribabu. C.R. 2021. An alternate method for finding Probable Maximum Precipitation (PMP) for Indian monsoon precipitation. ISH Journal of Hydraulic Engineering, 27 (Sup1), 371-375. [CrossRef]
- Suribabu. C.R. and T.R. Neelakantan. 2021. Assessment of dry and wet periods using selected rainfall-based drought indicators – a case study. ISH Journal of Hydraulic Engineering, 27:3, 301-308. [CrossRef]
Figure 1.
Location of Thanjavur city.

Figure 2.
Drought Index for South-West Monsoon period for time scale 1904-2016.
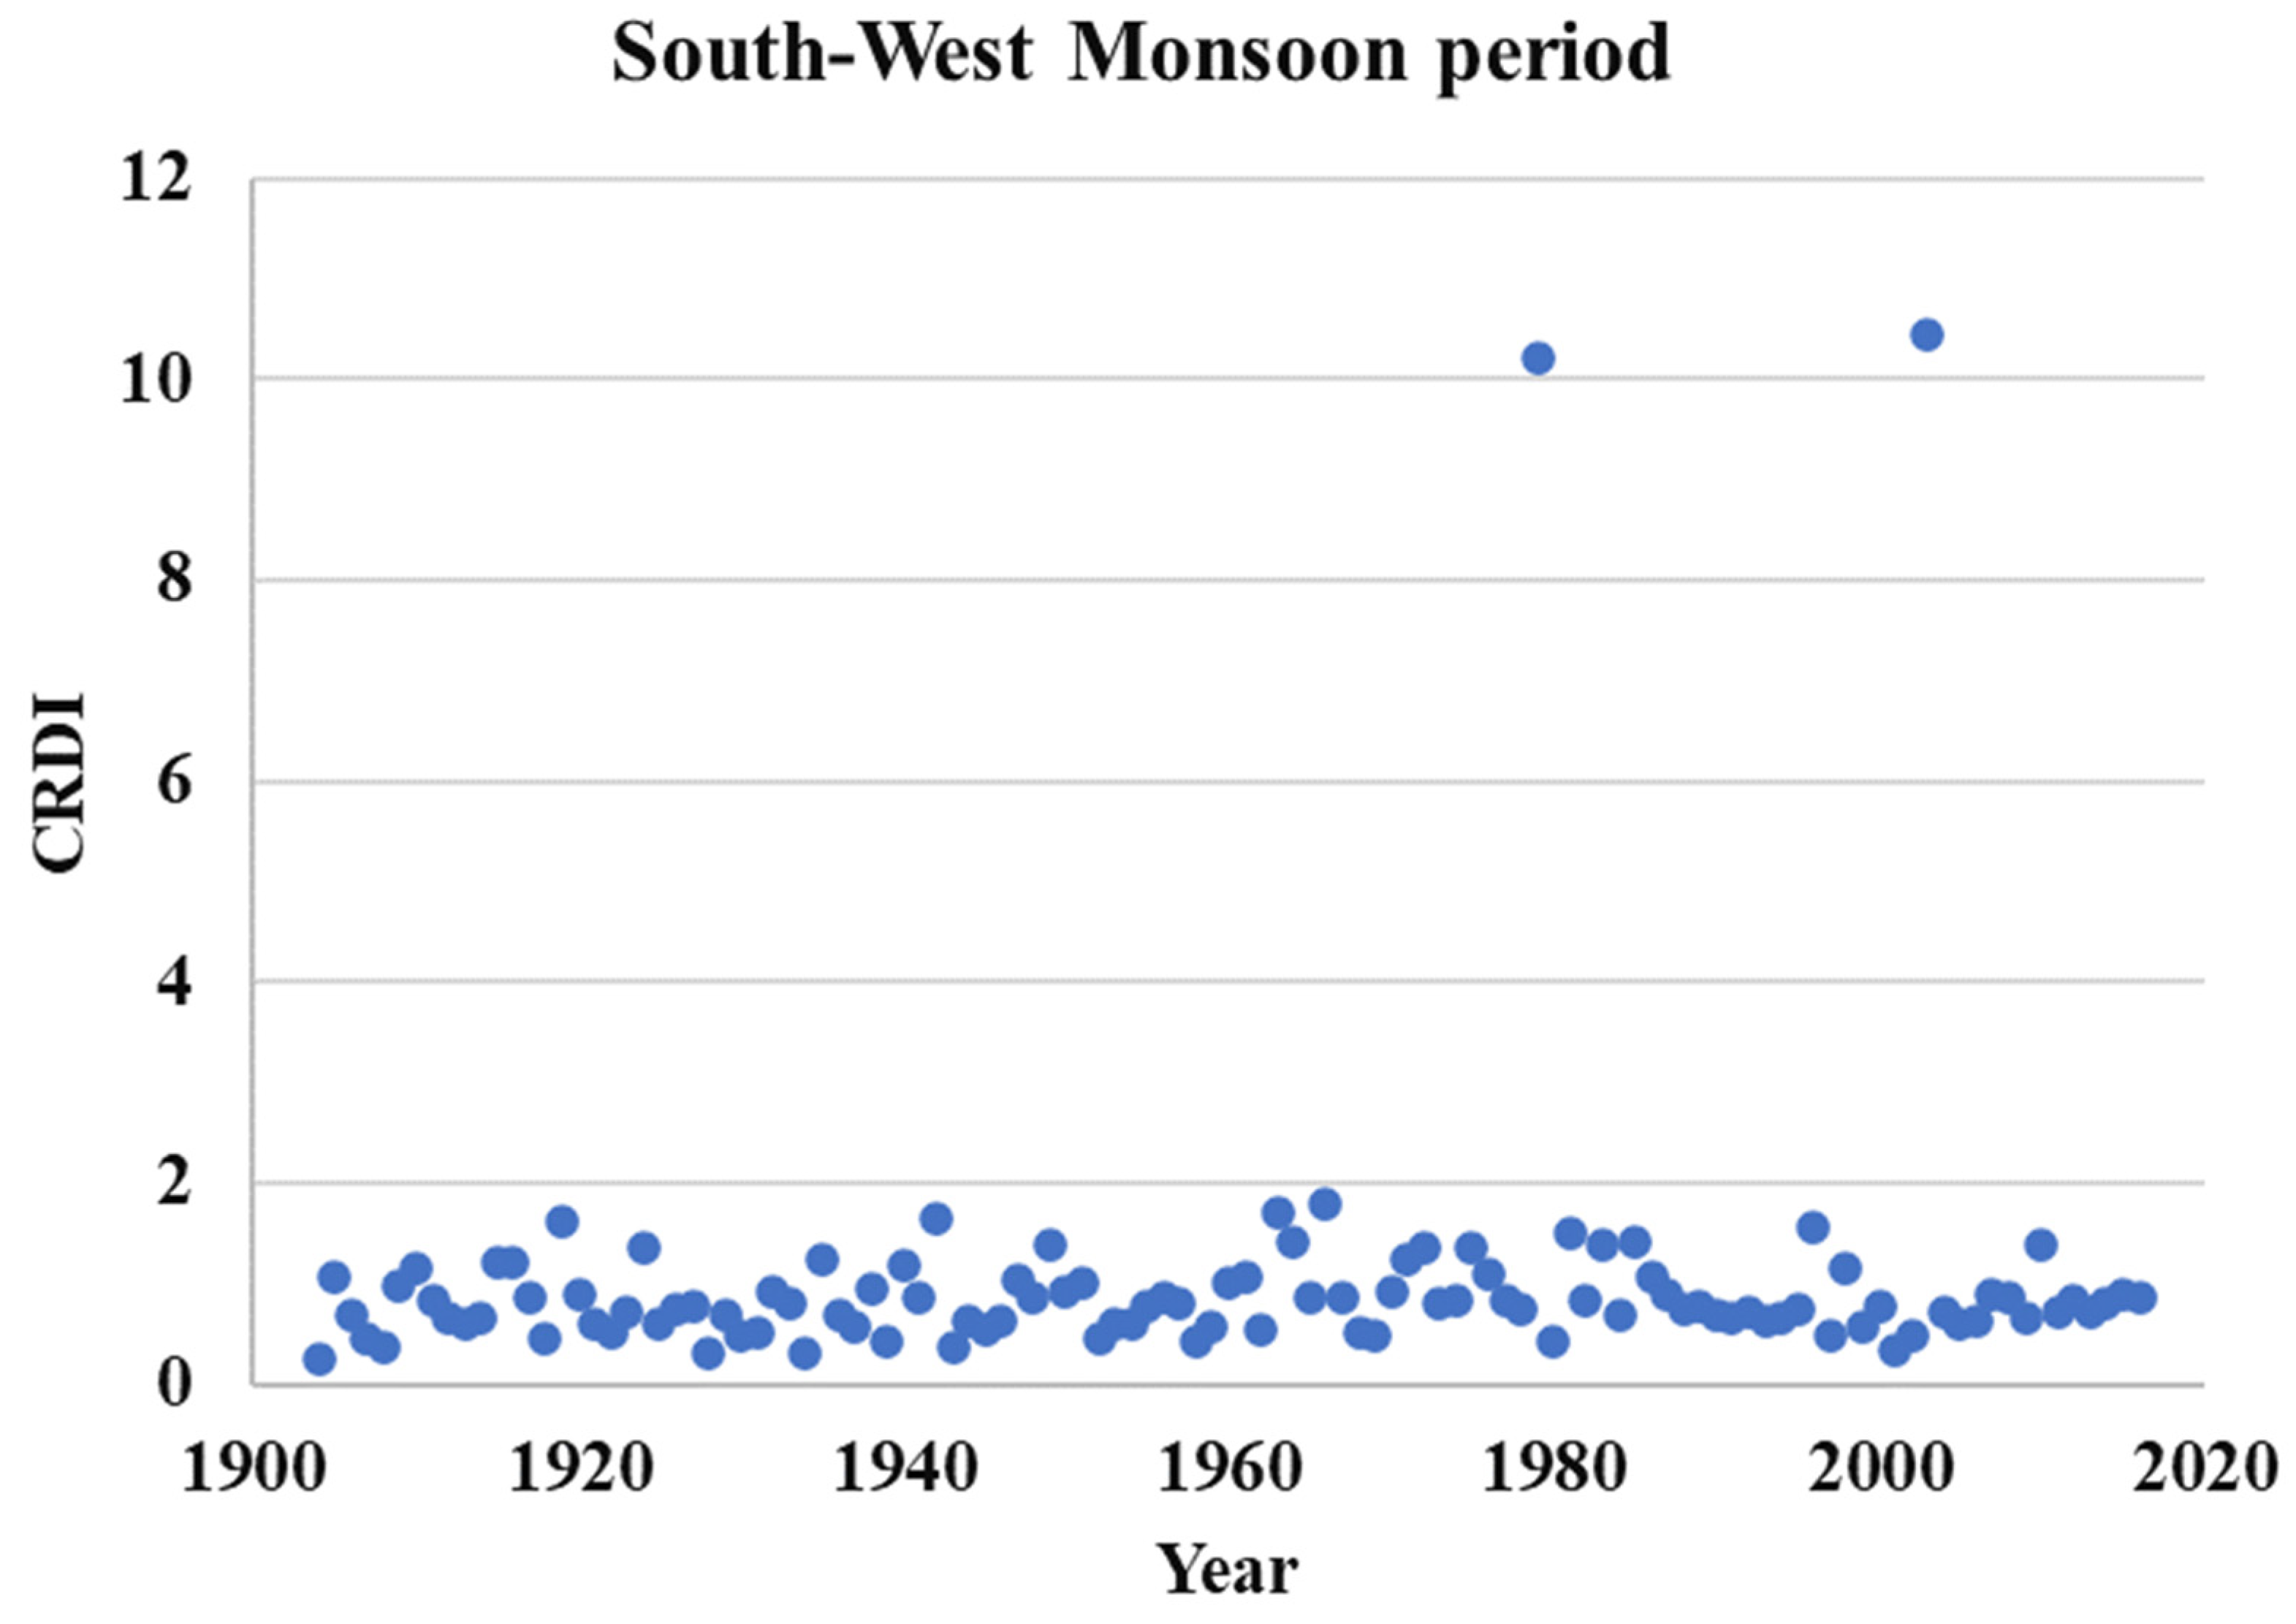
Figure 3.
Drought Index for Noth-East Monsoon period for time scale 1904-2016.
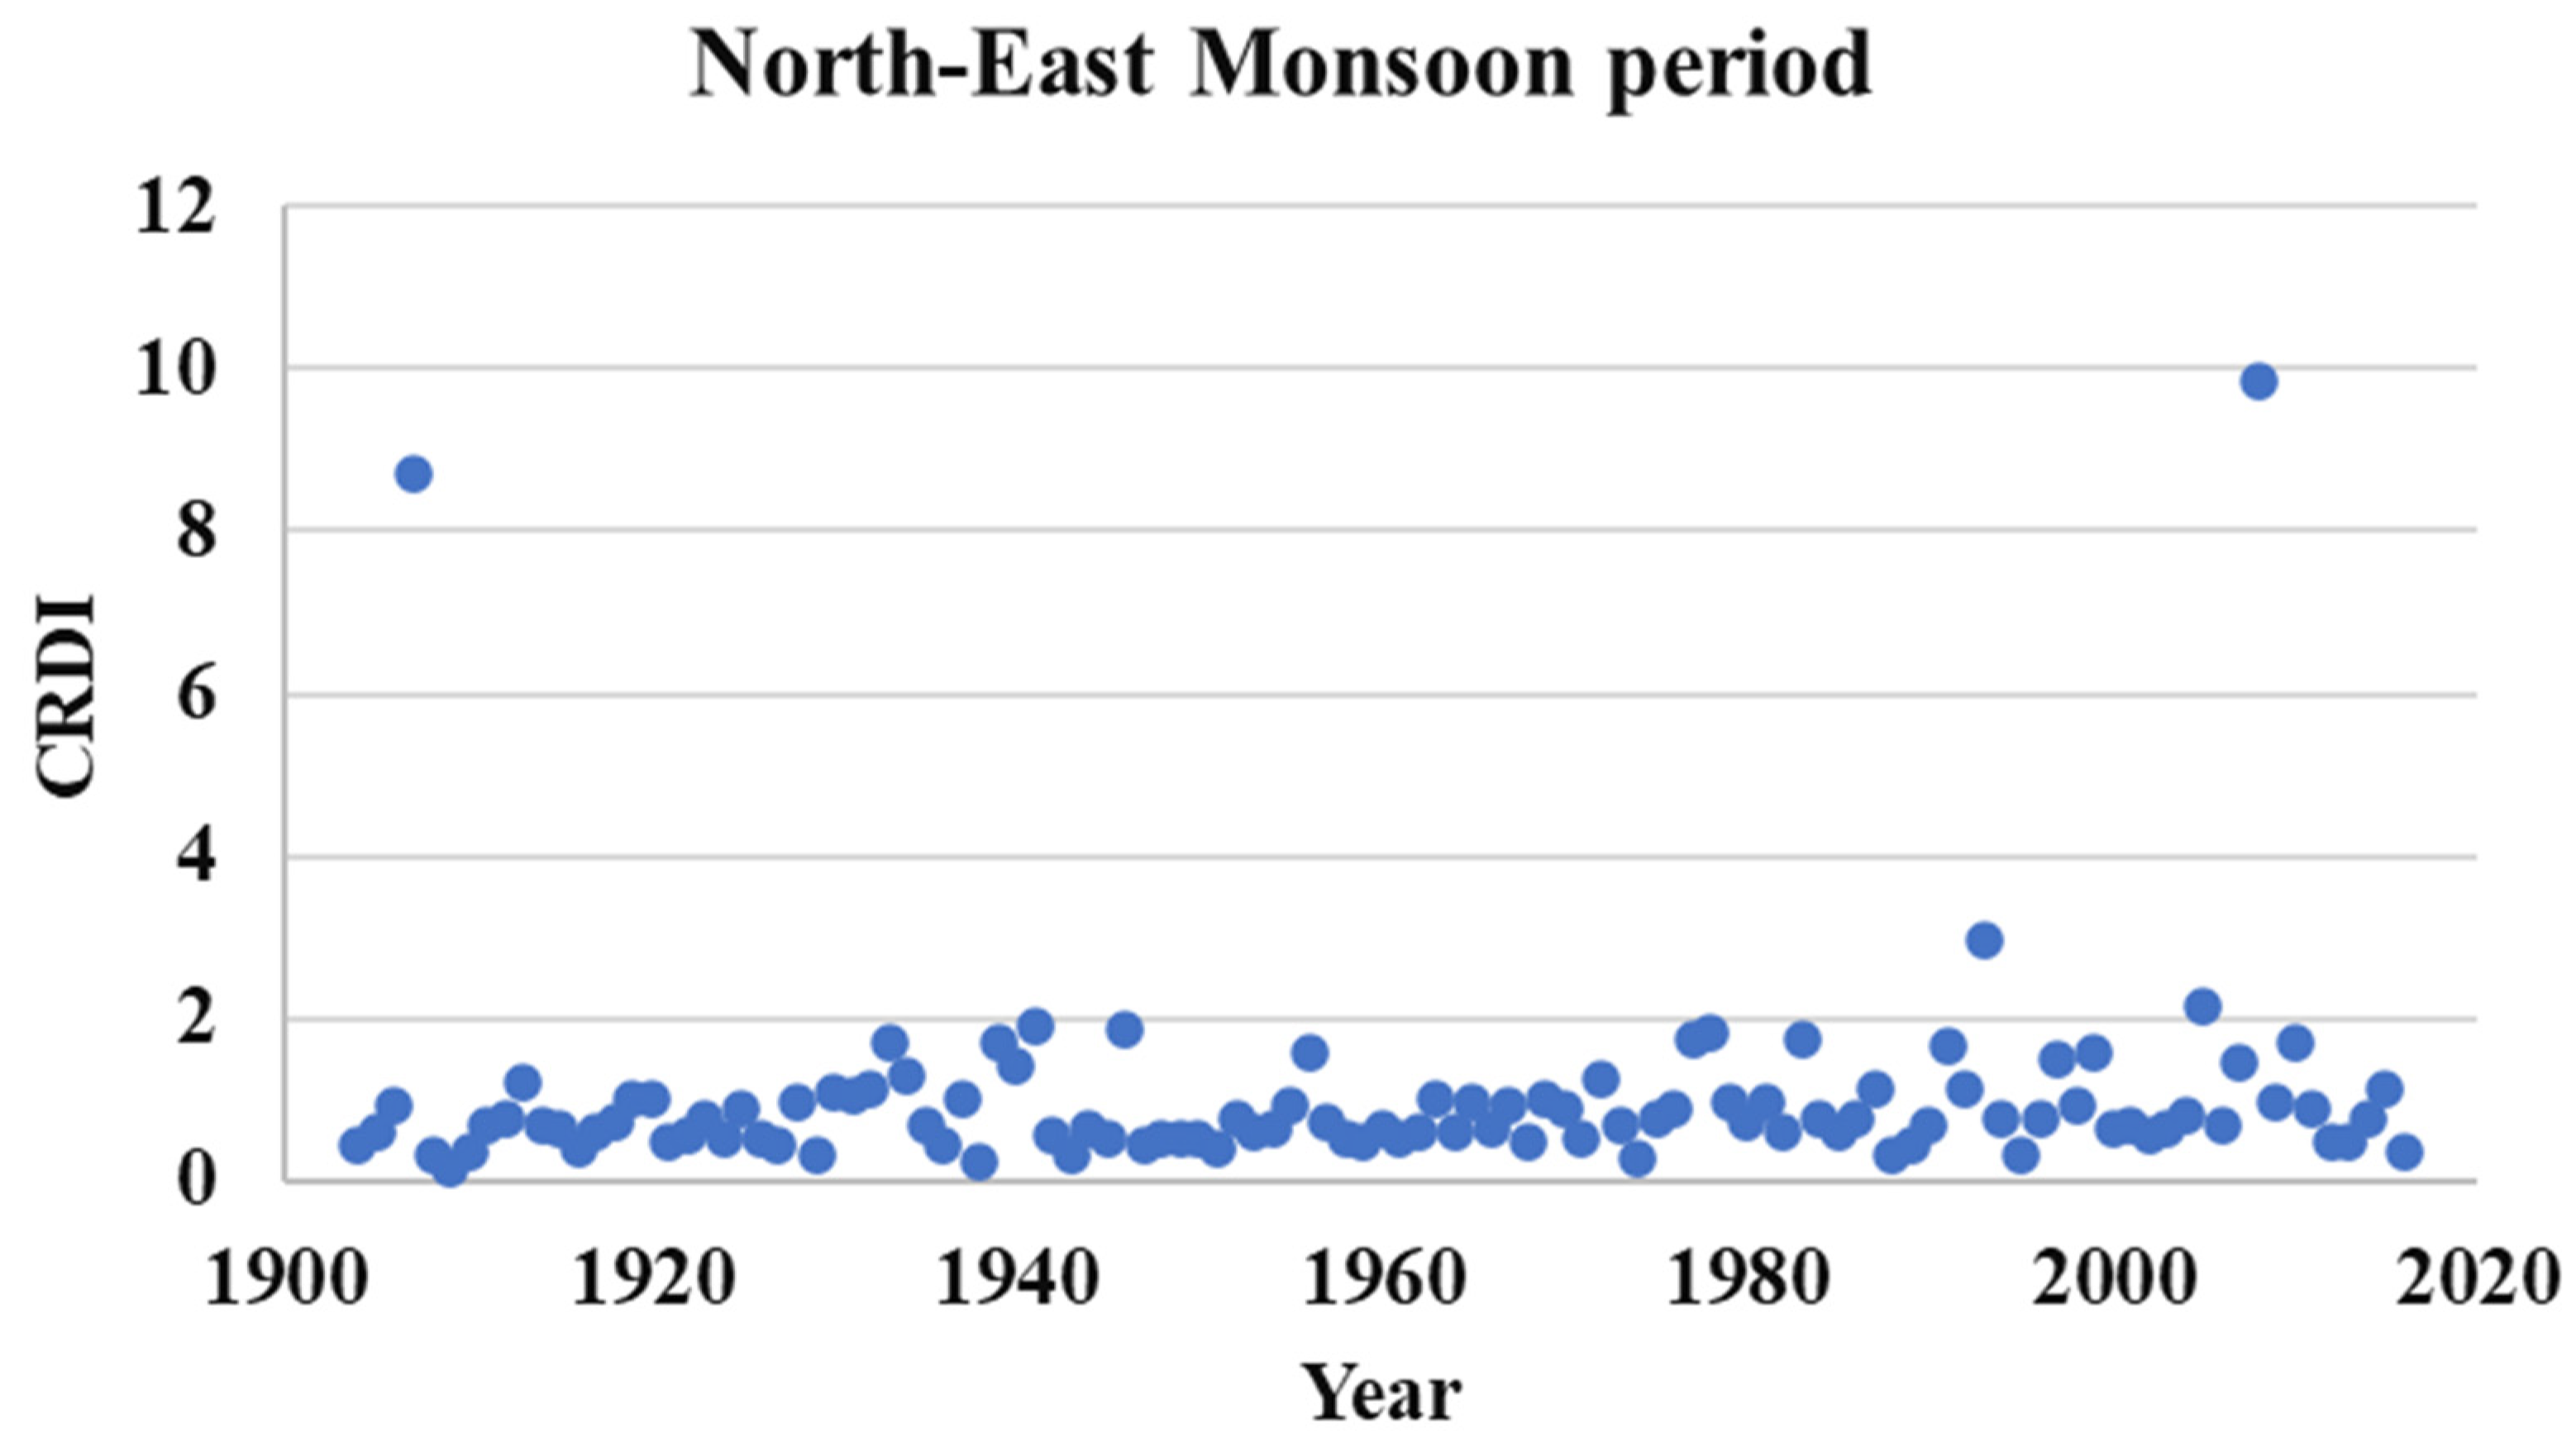
Figure 4.
Drought Index calculated for annual data for time scale 1904-2016.
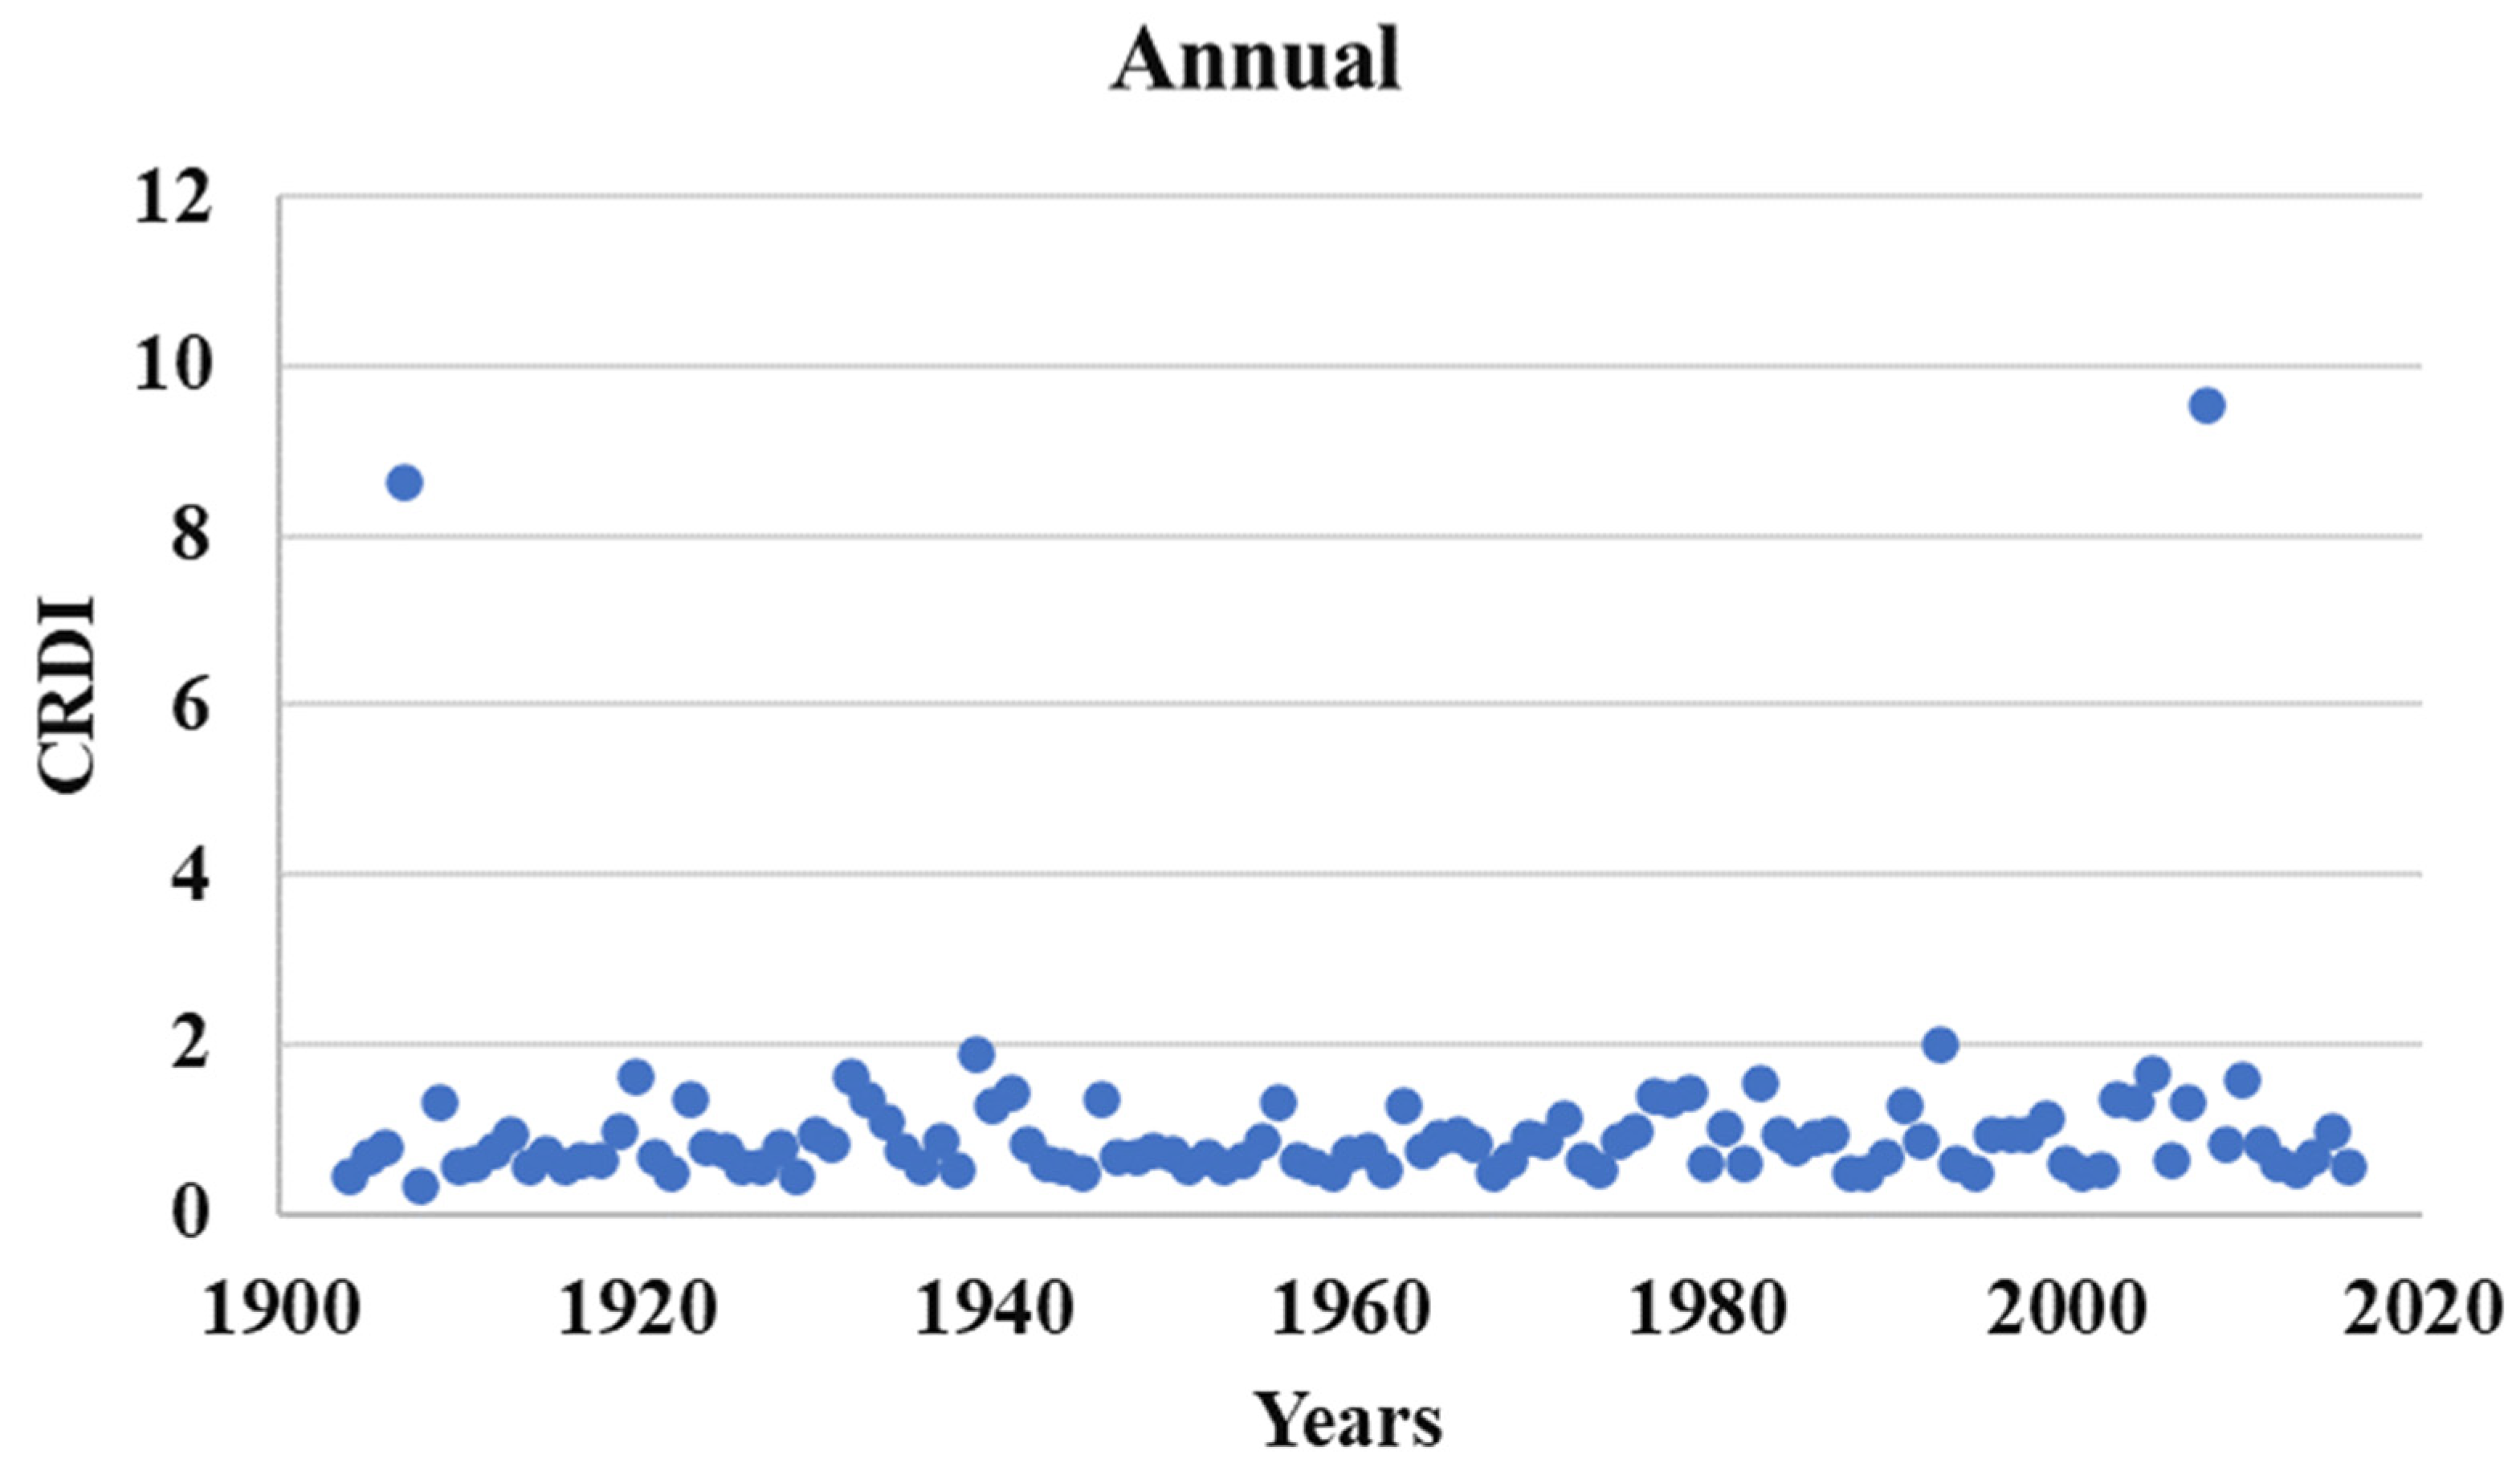

Table 1.
IMD Categorization of daily rainfall.
| Rainfall categorization | Code | Range in mm |
|---|---|---|
| No rain Very light rain Light rain Moderate rain Rather heavy rain Heavy rain Very heavy rain Extremely heavy rain |
- 1 2 3 4 5 6 7 |
0 0.1 to 2.4 2.5 to 7.5 7.6 to 35.5 35.6 to 64.4 64.5 to 124.4 124.5 to 244.5 ≥ 244.5 |
Table 2.
Drought severity classification.
| Category | Range |
|---|---|
| Extremely Dry (ED) Severely Dry (SD) Moderately Dry (MD) Near Normal (NN) Moderately Wet (MW) Severely Wet (SW) Extremely Wet (EW) |
≤ 0.45 0.55 ≥ SD > 0.45 0.6 ≥ SD > 0.55 1.0 ≥ SD > 0.6 1.5 ≥ SD > 1.0 1.75 ≥ SD > 1.5 EW>1.75 |
Table 3.
Month wise statistics of rainy days of Thanjavur City.
| Month | Minimum | Maximum | Average | Standard Deviation |
|---|---|---|---|---|
| Jan Feb Mar Apr May Jun Jul Aug Sep Oct Nov Dec |
0 0 0 0 0 0 0 1 0 1 2 0 |
10 11 13 08 12 08 13 16 20 23 23 19 |
2.18 1.07 1.12 2.04 3.57 3.20 4.02 6.89 7.45 10.58 11.19 6.93 |
2.40 1.79 1.92 1.98 2.45 2.15 2.72 3.55 3.35 4.14 4.79 4.44 |
Table 4.
Average number of days of occurrence in each category between 1904-2016.
| Rainfall categorization | No. of days |
|---|---|
| Very light rain Light rain Moderate rain Rather heavy rain Heavy rain Very heavy rain Extremely heavy rain |
11.973 15.912 25.389 5.371 1.700 0.230 0.017 |
Table 5.
Percentage of occurrence of each drought category for the time scale 1904-2016.
| Category | South-West Monsoon (Jun-Sep) | North-East monsoon (Oct- Dec) | Annual |
|---|---|---|---|
| Extremely Dry (ED) Severely Dry (SD) Moderately Dry (MD) Near Normal (NN) Moderately Wet (MW) Severely Wet (SW) Extremely Wet (EW) |
7.96 10.62 5.31 49.56 19.47 4.42 2.65 |
13.27 15.93 1.77 42.48 13.27 7.08 6.19 |
2.65 13.27 10.62 48.67 16.81 4.42 3.54 |
Table 6.
Comparative picture of proposed index in percentage of occurrence with three other drought indices.
Table 6.
Comparative picture of proposed index in percentage of occurrence with three other drought indices.
| Category | Suribabu and Neelakantan [21] | Present Index | ||
|---|---|---|---|---|
| SPI | China Z index | Statistical Z index | ||
| Extremely Dry (ED) Severely Dry (SD) Moderately Dry (MD) Near Normal (NN) Moderately Wet (MW) Severely Wet (SW) Extremely Wet (EW) |
1.87 8.41 10.28 57.94 10.28 7.40 3.74 |
0.93 3.74 9.34 68.22 9.34 3.74 0.93 |
1.87 3.74 8.41 71.10 11.21 2.80 0.93 |
2.65 13.27 10.62 48.67 16.81 4.42 3.54 |
Table 7.
Percentage of occurrence of each drought category for the different time scales.
| Category | Year 1927-56 | Year 1957-86 | Year 1987-2016 |
|---|---|---|---|
| Annual | |||
| Extremely Dry (ED) Severely Dry (SD) Moderately Dry (MD) Near Normal (NN) Moderately Wet (MW) Severely Wet (SW) Extremely Wet (EW) |
0.00 3.33 6.67 53.33 30.00 3.33 3.33 |
0.00 10.00 6.67 53.33 16.67 0.00 13.33 |
3.33 20.00 6.67 43.33 20.00 3.33 3.33 |
| South-West Monsoon | |||
| Extremely Dry (ED) Severely Dry (SD) Moderately Dry (MD) Near Normal (NN) Moderately Wet (MW) Severely Wet (SW) Extremely Wet (EW) |
6.67 3.33 3.33 36.67 36.67 6.67 6.67 |
16.67 6.67 3.33 43.33 20.00 6.67 3.33 |
6.67 3.33 3.33 63.33 13.33 3.33 6.67 |
| North-East Monsoon | |||
| Extremely Dry (ED) Severely Dry (SD) Moderately Dry (MD) Near Normal (NN) Moderately Wet (MW) Severely Wet (SW) Extremely Wet (EW) |
10.00 6.67 10.00 26.67 30.00 6.67 10.00 |
6.67 6.67 3.33 46.67 26.67 0 10.00 |
13.33 10.00 6.67 33.33 26.67 3.33 6.67 |
Disclaimer/Publisher’s Note: The statements, opinions and data contained in all publications are solely those of the individual author(s) and contributor(s) and not of MDPI and/or the editor(s). MDPI and/or the editor(s) disclaim responsibility for any injury to people or property resulting from any ideas, methods, instructions or products referred to in the content. |
© 2025 by the authors. Licensee MDPI, Basel, Switzerland. This article is an open access article distributed under the terms and conditions of the Creative Commons Attribution (CC BY) license (http://creativecommons.org/licenses/by/4.0/).
Copyright: This open access article is published under a Creative Commons CC BY 4.0 license, which permit the free download, distribution, and reuse, provided that the author and preprint are cited in any reuse.


