Submitted:
25 January 2025
Posted:
27 January 2025
You are already at the latest version
Abstract
Background: Electric vehicles (EVs) are at the heart of sustainable transportation, and the need for effective charging systems is steadily increasing. The difficulty is to optimize charging tactics that reduce charging time while retaining grid stability. To maximize performance and energy utilization, charging must be managed effectively using variables like battery levels, grid load, and environmental conditions.
Objectives: The objective of this research is to create a sophisticated machine-learning technique for predicting the optimal charging control for electric vehicles. Particularly, it aims to use a Dual-Level Voting Boost (DLVB) algorithm to determine whether an EV charging session will be optimized or not, using input features such as battery level, charging rate, ambient temperature, and charging mode.
Methodology: This paper proposes the Dual-Level Voting Boost (DLVB) algorithm, which is a two-stage ensemble learning method. The first level employs fundamental classifiers like Decision Trees, Logistic Regression, and K-Nearest Neighbors, whereas the second level employs more sophisticated models like Random Forest, Support Vector Machines, and Naive Bayes. This dual-layer structure enables a more precise classification of optimized and non-optimized charging sessions. The model's efficacy is assessed utilizing metrics like Accuracy, Precision, Recall, F1-Score, and the Matthews Correlation Coefficient (MCC).
Results: On the test dataset, the DLVB algorithm obtained 95% accuracy, 94% precision, 93% recall, 94% F1 score, and 92% MCC. These findings show the efficiency of the dual-level voting system in correctly predicting optimized charging sessions, substantially surpassing conventional single-model methods.
Conclusion: The DLVB algorithm has significant potential for improving EV charging control by correctly predicting optimization results. This approach provides a potential strategy for enhancing charging effectiveness, decreasing energy waste, and maintaining grid stability.
Keywords:
Electric vehicles
; grid stability
; ensemble learning
; classification and prediction
I Introduction
The rapid growth of electric vehicles (EVs) has raised the need for novel and effective charging solutions that strike a balance between charging speed and energy consumption optimization [1]. Conventional charging systems, while efficient to some extent, frequently face difficulties in maintaining a harmonious balance between rapid charging capacities and electrical grid stability [2]. This delicate balance is critical for avoiding overload, reducing energy waste, and guaranteeing dependability. As EV adoption boosts, tackling these problems has become progressively important to assist the increasing number of EV users and sustain the robustness of the energy infrastructure.
Machine learning (ML) has emerged as a strong and promising strategy for addressing these difficulties [3]. By evaluating massive amounts of data created during charging sessions, ML algorithms can detect trends and create predictive models that improve charging schedules, energy distribution, and total effectiveness. These predictive models enable the identification of peak request periods and the tactical adjustment of charging functions to avoid power surges or excessive energy consumption [4]. Furthermore, ML can enable real-time decision-making, enabling charging stations to dynamically adapt to changing grid conditions and user requirements.
Charging tactics can be fine-tuned using machine learning to provide quicker energy transmission while conserving resources and reducing the influence on grid stability [5]. This strategy allows for more intelligent load management, encourages sustainable energy consumption, and lowers the risk of grid disruptions. As a result, incorporating machine learning into EV charging infrastructure offers an important development in building a scalable, resilient, and energy-efficient charging ecosystem that helps the ongoing development of electric vehicle adoption.
Figure 1 shows the connection between an electric vehicle and a charging station that uses renewable energy sources like solar panels and wind power plants. This setup exemplifies a sustainable method of EV charging in which the energy utilized is partially or entirely supplied by renewable sources. This technique not only decreases the carbon footprint but also relieves the strain on traditional power grids. When the EV links to the charging station, data gathering begins, recording critical variables like the initial battery level, charging rate, and maximum charging power. Environmental variables such as ambient temperature and functional modes (manual or automated) are recorded, as well as grid load and charging priorities. These gathered data points are crucial for creating predictive models that classify charging sessions as optimized or not, allowing for improved charging control.
1.1. Important Elements in an Optimized Charging Control System
Optimal charging control entails combining a variety of factors that impact charging efficiency. The initial battery level determines the tactic, whereas the charging rate and maximum power capacity determine the speed and security of charging. The ambient temperature influences charging efficiency, whereas the mode of charging (automatic or manual) determines how the session is managed. Grid load conditions and charging priority are essential to balancing energy needs. Lastly, charging effectiveness assesses the efficiency of energy transfer, guaranteeing that the charging session is productive while conserving energy.
1.2. Research Objective
This research aims to create a sophisticated predictive algorithm that can determine whether or not EV charging sessions are optimized. The research introduces the Dual-Level Voting Boost (DLVB) algorithm, which enhances prediction accuracy by integrating numerous classifiers using a dual-voting mechanism. The goal is to improve charging session management, balance user needs with grid stability and maximize total energy effectiveness.
1.3. The Remainder of the Research
The rest of the paper is structured as follows: Section 2 covers related works. Section 3 describes the methodology used in the research. Section 4 describes the experimental setup, and the evaluation metrics utilized for performance evaluation, followed by a result evaluation and discussion of the algorithm's effectiveness. Section 5 concludes the study by summarizing the key results and proposing directions for future research.
II. Literature Review
The increasing adoption of electric vehicles (EVs) has highlighted the requirement for effective charging systems that not only reduce charging times but also guarantee grid stability. As the need for electric vehicles grows, it becomes progressively essential to optimize charging tactics that take into account elements like battery levels, grid load, and environmental circumstances. Several techniques have been proposed to enhance charging effectiveness, but there are still difficulties in tackling the dynamic interactions between these factors, which frequently result in suboptimal efficiency. This section examines existing research on EV charging enhancement, including machine learning techniques, hybrid models, and renewable energy incorporation.

Table 1.
Summary Table.
| Reference No | Objective | Methodology | Result | Limitations |
|---|---|---|---|---|
| [6] | Predict EV charging station selection behavior. | XGBoost with SHAP for 500 EVs in Japan | XGBoost had the greatest accuracy, and SHAP explained the feature's significance. | Data restricted to Japan, generalizability uncertain |
| [7] | Forecast EV charging period | ELM, FFNN, and SVR enhanced by GWO, PSO, GA on 500 EVs in Japan | GWO-based models surpassed others | The optimization method may require validation with other datasets |
| [8] | Forecast session duration and power utilization | RF, SVM, XGBoost, DNN with historical, traffic, weather, and event data | Ensemble learning attained 9.9% SMAPE for duration and 11.6% for energy | Findings may not generalize beyond the dataset. |
| [9] | Use ensemble machine learning to forecast the charging time. | RF, XGBoost, CatBoost, LightGBM with SHAP on 500 EVs in Japan | XGBoost demonstrated the highest accuracy, SHAP emphasized important variables | Outcomes particular to Japan, not broadly applicable |
| [10] | Allow dynamic wireless charging | Hybrid DWC system with Improved-DSDV protocol and magnetic coupling | Dependable DWC with enhanced throughput and latency | Scalability and deployment difficulties not tackled |
| [11] | Predict EV metrics utilizing ML in MPC | Hybrid ML predicts and MPC to reduce electricity expenses | Decreased peak load by 46.7% and expenses by 20.9% | Concentrated on controlled studies, real-world difficulties not discussed |
| [12] | Evaluate EV charging infrastructure dependability | ML classifiers on 10 years of multilingual customer reviews | Government-owned stations had higher failure rates | Constrained data-sharing and region-specific pertinency |
| [13] | Forecast EV charging time with metaheuristic optimization | RF, CatBoost, and XGBoost enhanced by Ant Colony Optimization | Attained R2 of 20.5% (training), 12.4% (testing) | Requires enhancement in accuracy and cross-validation |
| [14] | Enhance charging to decrease emissions | Heuristic algorithm for enhanced scheduling in Ontario | Decreased emissions by 97% compared to the base case | Findings may differ by regional creation profiles and emissions |
| [15] | Enhance EV charging stations with renewables | MOPSO and TOPSIS for design with wind, PV, and storing | Enhanced optimization and quicker calculation | Constrained to Inner Mongolia, generalizability uncertain |
While the current study has made important progress in enhancing EV charging mechanisms, numerous existing techniques fail to efficiently handle the charging procedure's complexity and dynamics. Conventional methods frequently oversimplify interactions between features or the absence of generalizability across circumstances. The Dual-Level Voting Boost (DLVB) algorithm introduced in this research offers a promising solution to these constraints. By integrating a dual-layer ensemble learning method, DLVB efficiently addresses the complexities of EV charging optimization, providing higher prediction accuracy and efficiency than conventional models. This method fills important gaps in existing techniques, paving the manner for more effective and trustworthy EV charging control mechanisms.
III. Methodology
The Dual-Level Voting Boost (DLVB) algorithm is a novel technique for improving electric vehicle (EV) charging that predicts whether a session will be effective depending on a variety of input features. The algorithm integrates numerous machine learning models organized into two levels, with each contributing to the entire prediction via majority voting. The primary level utilizes simpler models for rapid and comprehensive learning, whereas the second level utilizes intricate models for precise decision-making. This structured method, improved by weighted voting, enables superior predictive accuracy and resilience.
3.1. Data Collection
The dataset, namely "EV Charging Session Optimization Dataset," was created using real-world electric vehicle (EV) charging data collected from different charging stations and EV management mechanisms. Each entry in this dataset indicates a single charging session, with comprehensive data regarding the charging procedure and environment. Important features comprise Initial Battery Level (%), which denotes the initial level of charge; Charging Rate (kW), which details the power provided during charging; Max Charging Power (kW), which specifies the maximum power the EV can handle; and Ambient Temperature (°C), which highlights the impacts of outside temperature on effectiveness. The dataset also includes Charging Mode (Auto/Manual) to distinguish between automatic and manual controls, Vehicle Battery Capacity (kWh) for total energy storage, Grid Load (Low/High) to indicate grid request, and Charging Priority (High/Low) to indicate user or system choice. The Charging Efficiency (%) reflects the efficiency of the charging session, whereas the Target feature denotes whether the session was "Optimized" or "Not Optimized." The "EV Charging Session Optimization Dataset" was safely stored in CSV format for easy access during data preprocessing, evaluation, and machine learning model training. The data-gathering method highlighted accuracy and variety to offer a strong basis for machine learning growth. Figure 2 shows the flow diagram of the proposed DLVB algorithm.
3.2. Data Preprocessing Steps
3.2.1. Loading and Cleaning the Dataset
The first phase is to load the dataset, which contains important attributes like the beginning battery level, charging rate, maximum charging power, ambient temperature, and so on. This phase is critical for comprehending the structure and maintaining data integrity. The dataset is checked for missing or inconsistent data points that may skew the outcomes. Any such inconsistencies are addressed by either eliminating the impacted records or utilizing imputation methods.
3.2.2. Encoding Categorical Features
Certain features, like Charging Mode, Grid Load, and Charging Priority, are categorical and must be converted to numerical values for model compatibility. This conversion is carried out utilizing label encoding, which allocates a distinctive integer to each category:
Transforming these variables allows the models to manage them as numerical inputs, enabling superior learning.
3.2.3. Normalizing Numerical Features
Standardizing numerical features is critical for achieving consistent performance across multiple machine-learning models. StandardScaler is employed to scale the data so that each feature has a mean of 0 and a standard deviation of 1:
Where μ signifies the mean and σ the standard deviation of each feature. This normalization benefits models that are sensitive to the scale of input data, such as K-Nearest Neighbors (KNN) and Random Forest (RF).
3.2.4. Data Splitting
The data is divided into training and testing subsets, typically in an 80/20 ratio. The training set is employed to fit the models, and the testing set assesses the algorithm's effectiveness:
3.3. First-Level Ensemble of Classifiers
3.3.1. Selection of Basic Classifiers
The initial level of the DLVB algorithm uses simpler classifiers to gain an initial comprehension of the data. They comprise:
- Decision Tree (C1): Recognized for its clear interpretation and capacity to model intricate relationships.
- Logistic Regression (C2): Suitable for binary classification with probabilistic outcomes.
- K-Nearest Neighbors (KNN, C3): A non-parametric model generates predictions depending on the proximity of data points.
Each of these classifiers is trained on the training dataset and independently provides predictions
3.3.2. Majority Voting Mechanism
The initial result is determined by combining the predictions from the first-level classifiers through a majority voting system:
This method guarantees that the decision represents the consensus of the basic models, thus offering a dependable preliminary classification.
3.3.3. Calculating Importance Score α1
The importance score is computed to determine how well the first-level ensemble performs. This score is calculated using the ensemble's accuracy:
A higher α1 shows superior performance and therefore greater impact in the last combined prediction.
3.4. Weight Adjustment for Misclassified Examples
3.4.1. Adjusting Weights
Following the first-level ensemble's predictions, the weights of misclassified instances are adjusted to highlight their significance at the next level. This guarantees that the second-level models concentrate more on difficult cases. The weight update formula for an inaccurately classified example i is:
This mechanism aids in the training of second-level classifiers, improving total accuracy by tackling prior misclassified data.
3.5. Second-Level Ensemble of Classifiers
3.5.1. Selection of Complex Classifiers
The second-level ensemble consists of more advanced classifiers that improve the predictions further. They comprise:
- Random Forest (C4): A powerful ensemble technique that uses numerous decision trees to generate more reliable predictions.
- Support Vector Machine (C5): Efficient in high-dimensional spaces and situations where classes are separated by a hyperplane.
- Naive Bayes (C6): A probabilistic classifier depending on Bayes' theorem is renowned for its effectiveness and simplicity.
These classifiers are trained to utilize the training dataset and the updated weights, concentrating on the examples that were misclassified at the first level.
3.5.2. Second-Level Majority Voting
Similar to the initial level, the predictions from these classifiers are merged via majority voting to create a second-level prediction.
3.5.3. Computing Importance Score (α2)
The second-level ensemble's effectiveness is assessed utilizing a significance score α2, which is calculated similarly to the initial level.
3.6. Final Combined Predictions
3.6.1. Weighted Voting for Final Prediction
To generate a final prediction for a novel input, weighted voting is used to integrate the first- and second-level predictions. The weights are depending on the significance scores α1 and α2:
This combination guarantees that the final prediction draws on the advantages of both ensemble levels. The first level presents a wide, rapid evaluation, whereas the second level offers detailed knowledge depending on intricate models. The weighted voting mechanism guarantees that the most dependable predictions have the most impact, resulting in a reliable result that optimizes EV charging control dependent on input features. Pseudocode 1 outlines the step-by-step process of the Dual-Level Voting Boost (DLVB) technique.
| Pseudocode 1: Dual-Level Voting Boost (DLVB) |
| Handle missing data, encode categorical features, and normalize numerical values. Divide into training and testing sets. Train classifiers: Decision Tree (C1), Logistic Regression (C2), KNN (C3). Execute majority voting for predictions. Compute importance score α1. Rise weights of misclassified samples for the next level. Train classifiers: Random Forest (C4), SVM (C5), Naive Bayes (C6). Execute majority voting for predictions. Compute importance score α2. Utilize weighted voting depending on α1 and α2 for final prediction. |
IV. Performance Analysis
4.1. Experimental Setup
To assess the efficiency of the Dual-Level Voting Boost (DLVB) algorithm, experiments were carried out on a high-performance computing system. This configuration guarantees the capacity to manage huge amounts of data while also performing intricate functions effectively. Table 2 details the specifications, including the utilization of an Intel Core i7-1260P processor with a 12-core architecture able to efficiently handle parallel procedures. The system had 64 GB of RAM to accommodate data management and training procedures, as well as a clock speed of 2.1 GHz to allow for rapid computational functions. The experiments were carried out on a Windows 11 Home operating system, using Python 3.10 via Anaconda Spyder, which offers a reliable development context for scientific computing.
4.2. Comparative Analysis
To show the DLVB algorithm's efficiency, it was compared to four famous classifiers: K-Nearest Neighbors (KNN), Random Forest (RF), Support Vector Machine (SVM), and Naive Bayes. To offer a complete evaluation of predictive performance, the models were assessed utilizing five important performance metrics: accuracy, precision, recall, F1-score, and Matthew’s correlation coefficient (MCC).
The equation for these metrics is demonstrated below: Accuracy is the percentage of correct predictions among all predictions provided:
Where, TP represents True Positives, TN represents True Negatives, FP represents False Positives, and FN represents False Negatives. Precision denotes to the accuracy of positive predictions:
A higher precision recommends fewer false positives. Recall, represented as sensitivity, quantifies the model's capacity to compute all relevant cases (true positives):
A higher recall denotes fewer false negatives. The F1 score is the harmonic mean of precision and recall, offering a balance between the two:
The Matthews Correlation Coefficient (MCC) assesses the competence of binary classifications by considering all four confusion matrix categories:
MCC values range from -1 to 1, with 1 denoting perfect prediction. Table 2 compares the performance metrics of each classifier.
Table 3 shows the metrics for each model. The DLVB algorithm significantly excels across all metrics, demonstrating its capability to make precise, dependable, and well-balanced predictions when compared to its counterparts.
Table 3 shows how the DLVB algorithm outperforms the other classifiers. With an accuracy of 95%, DLVB outperforms models such as RF, SVM, and KNN. DLVB's precision, recall, and F1-score all fall between 93 and 94%, indicating a strong capacity to reduce both false positives and false negatives. The MCC score of 92% suggests an excellent balance between true and false results, further confirming its overall resilience and dependability in predicting enhanced EV charging sessions.
Figure 3 shows the DLVB algorithm's high accuracy, which can be attributed to its distinctive two-tier ensemble structure. DLVB captures various patterns and relationships in the data by combining simple classifiers (Decision Tree, Logistic Regression, KNN) and intricate classifiers (Random Forest, SVM, Naive Bayes). This extensive learning enables the algorithm to generalize effectively and make highly precise predictions.
Figure 4 demonstrates the DLVB algorithm's improved precision. The algorithm uses weighted voting to allocate importance scores (α1 and α2) to predictions depending on ensemble level efficiency, resulting in high precision. This mechanism guarantees that only the most dependable findings from each level contribute substantially to the final prediction, thereby decreasing false positive rates and enhancing total precision.
Figure 5 demonstrates how the DLVB algorithm produces a high recall. This finding is because of the step in which misclassified examples from the first-level ensemble are prioritized for the second-level training phase. By adjusting the weights of misclassified data, DLVB improves its capacity to accurately detect true positives, guaranteeing that instances that may have been overlooked by simpler models are correctly predicted at the second level.
Figure 6 shows an F1-score comparison that demonstrates DLVB's balanced performance in terms of precision and recall. The dual-level voting tactic optimizes both metrics by combining insights from simple and intricate classifiers. The final result is a higher F1-score, which indicates the algorithm's capacity to efficiently manage both false positives and false negatives, rendering it suitable for real-world applications where both errors are expensive.
In Figure 7, DLVB's high MCC score demonstrates its total predictive power and balanced method. MCC is a useful metric since it takes into account all outcomes—true positives, true negatives, false positives, and false negatives—to provide a single measure of classification excellence. DLVB's better MCC score suggests that its predictions are not biased and have strong correlations with the real findings, showing consistent and trustworthy performance.
Overall, the performance analysis shows that the DLVB algorithm surpasses conventional approaches like KNN, RF, SVM, and NB on all metrics. The dual-level ensemble structure, incorporated with weighted voting, allows DLVB to attain high accuracy, precision, recall, F1-score, and MCC. This makes it ideal for applications that need extremely precise predictions, like enhancing EV charging sessions. The thorough assessment confirms the efficiency of the DLVB algorithm, highlighting its resilience and flexibility.
V. Conclusions
The Dual-Level Voting Boost (DLVB) Algorithm was developed to tackle constraints in current predictive models for EV charging optimization. Conventional classification models frequently fail to capture intricate relationships in datasets with numerous interacting variables, like those encountered in EV charging settings. DLVB uses a two-tier ensemble technique to efficiently integrate simple and intricate classifiers, resulting in more extensive and precise forecasts. The technique's dual-level structure guarantees that the algorithm takes advantage of the quick-learning capacities of simpler models before refining these insights with more intricate algorithms, resulting in a balance of speed and accuracy. Experimental findings confirmed DLVB's superiority, surpassing common models including KNN, RF, SVM, and NB across important performance metrics, emphasizing its resilience and dependability in enhancing EV charging predictions.
Drawbacks and Future Scope
While the DLVB Algorithm has numerous benefits, it is important to note some constraints. The main disadvantage of DLVB is its high computational intricacy. The two-tier structure, incorporated with weighted voting, requires more training time and computational resources, rendering it inefficient for real-time or resource-constrained applications. Furthermore, the algorithm's dependence on parameter tuning for both ensemble levels and weight adjustments may add intricacy to execution. In the future, multiple improvements could be investigated to enhance the DLVB algorithm. Incorporating deep learning models into the second-level ensemble may improve predictive accuracy, especially for intricate and large-scale datasets with more pronounced nonlinear relationships. The use of distributed and parallel computing methods may reduce computational load, rendering the algorithm more appropriate for real-time deployment.
References
- adeghian, O., Oshnoei, A., Mohammadi-Ivatloo, B., Vahidinasab, V. and Anvari-Moghaddam, A., 2022. A comprehensive review on electric vehicles smart charging: Solutions, strategies, technologies, and challenges. Journal of Energy Storage, 54, p.105241. [CrossRef]
- Hemavathi, S. and Shinisha, A., 2022. A study on trends and developments in electric vehicle charging technologies. Journal of energy storage, 52, p.105013. [CrossRef]
- Shibl, M., Ismail, L. and Massoud, A., 2021. Electric vehicle charging management using machine learning considering fast charging and vehicle-to-grid operation. Energies, 14(19), p.6199. [CrossRef]
- Shibl, M., Ismail, L. and Massoud, A., 2020. Machine learning-based management of electric vehicles charging: Towards highly-dispersed fast chargers. Energies, 13(20), p.5429. [CrossRef]
- Mazhar, T., Asif, R.N., Malik, M.A., Nadeem, M.A., Haq, I., Iqbal, M., Kamran, M. and Ashraf, S., 2023. Electric vehicle charging system in the smart grid using different machine learning methods. Sustainability, 15(3), p.2603. [CrossRef]
- Ullah, I., Liu, K., Yamamoto, T., Zahid, M. and Jamal, A., 2023. Modeling of machine learning with SHAP approach for electric vehicle charging station choice behavior prediction. Travel Behaviour and Society, 31, pp.78-92. [CrossRef]
- Ullah, I., Liu, K., Yamamoto, T., Shafiullah, M. and Jamal, A., 2023. Grey wolf optimizer-based machine learning algorithm to predict electric vehicle charging duration time. Transportation Letters, 15(8), pp.889-906.
- Shahriar, S., Al-Ali, A.R., Osman, A.H., Dhou, S. and Nijim, M., 2021. Prediction of EV charging behavior using machine learning. Ieee Access, 9, pp.111576-111586. [CrossRef]
- Ullah, I., Liu, K., Yamamoto, T., Zahid, M. and Jamal, A., 2022. Prediction of electric vehicle charging duration time using ensemble machine learning algorithm and Shapley additive explanations. International Journal of Energy Research, 46(11), pp.15211-15230. [CrossRef]
- Adil, M., Ali, J., Ta, Q.T.H., Attique, M. and Chung, T.S., 2020. A reliable sensor network infrastructure for electric vehicles to enable dynamic wireless charging based on machine learning techniques. IEEE Access, 8, pp.187933-187947. [CrossRef]
- McClone, G., Ghosh, A., Khurram, A., Washom, B. and Kleissl, J., 2023. Hybrid Machine Learning Forecasting for Online MPC of Workplace Electric Vehicle Charging. IEEE Transactions on Smart Grid.
- Liu, Y., Francis, A., Hollauer, C., Lawson, M.C., Shaikh, O., Cotsman, A., Bhardwaj, K., Banboukian, A., Li, M., Webb, A. and Asensio, O.I., 2023. Reliability of electric vehicle charging infrastructure: A cross-lingual deep learning approach. Communications in Transportation Research, 3, p.100095. [CrossRef]
- Alshammari, A. and Chabaan, R.C., 2023. Metaheuristic optimization-based Ensemble machine learning model for designing Detection Coil with prediction of electric vehicle charging time. Sustainability, 15(8), p.6684.
- Tu, R., Gai, Y.J., Farooq, B., Posen, D. and Hatzopoulou, M., 2020. Electric vehicle charging optimization to minimize marginal greenhouse gas emissions from power generation. Applied Energy, 277, p.115517. [CrossRef]
- Sun, B., 2021. A multi-objective optimization model for fast electric vehicle charging stations with wind, PV power, and energy storage. Journal of Cleaner Production, 288, p.125564. [CrossRef]
Figure 1.
EV Charging.
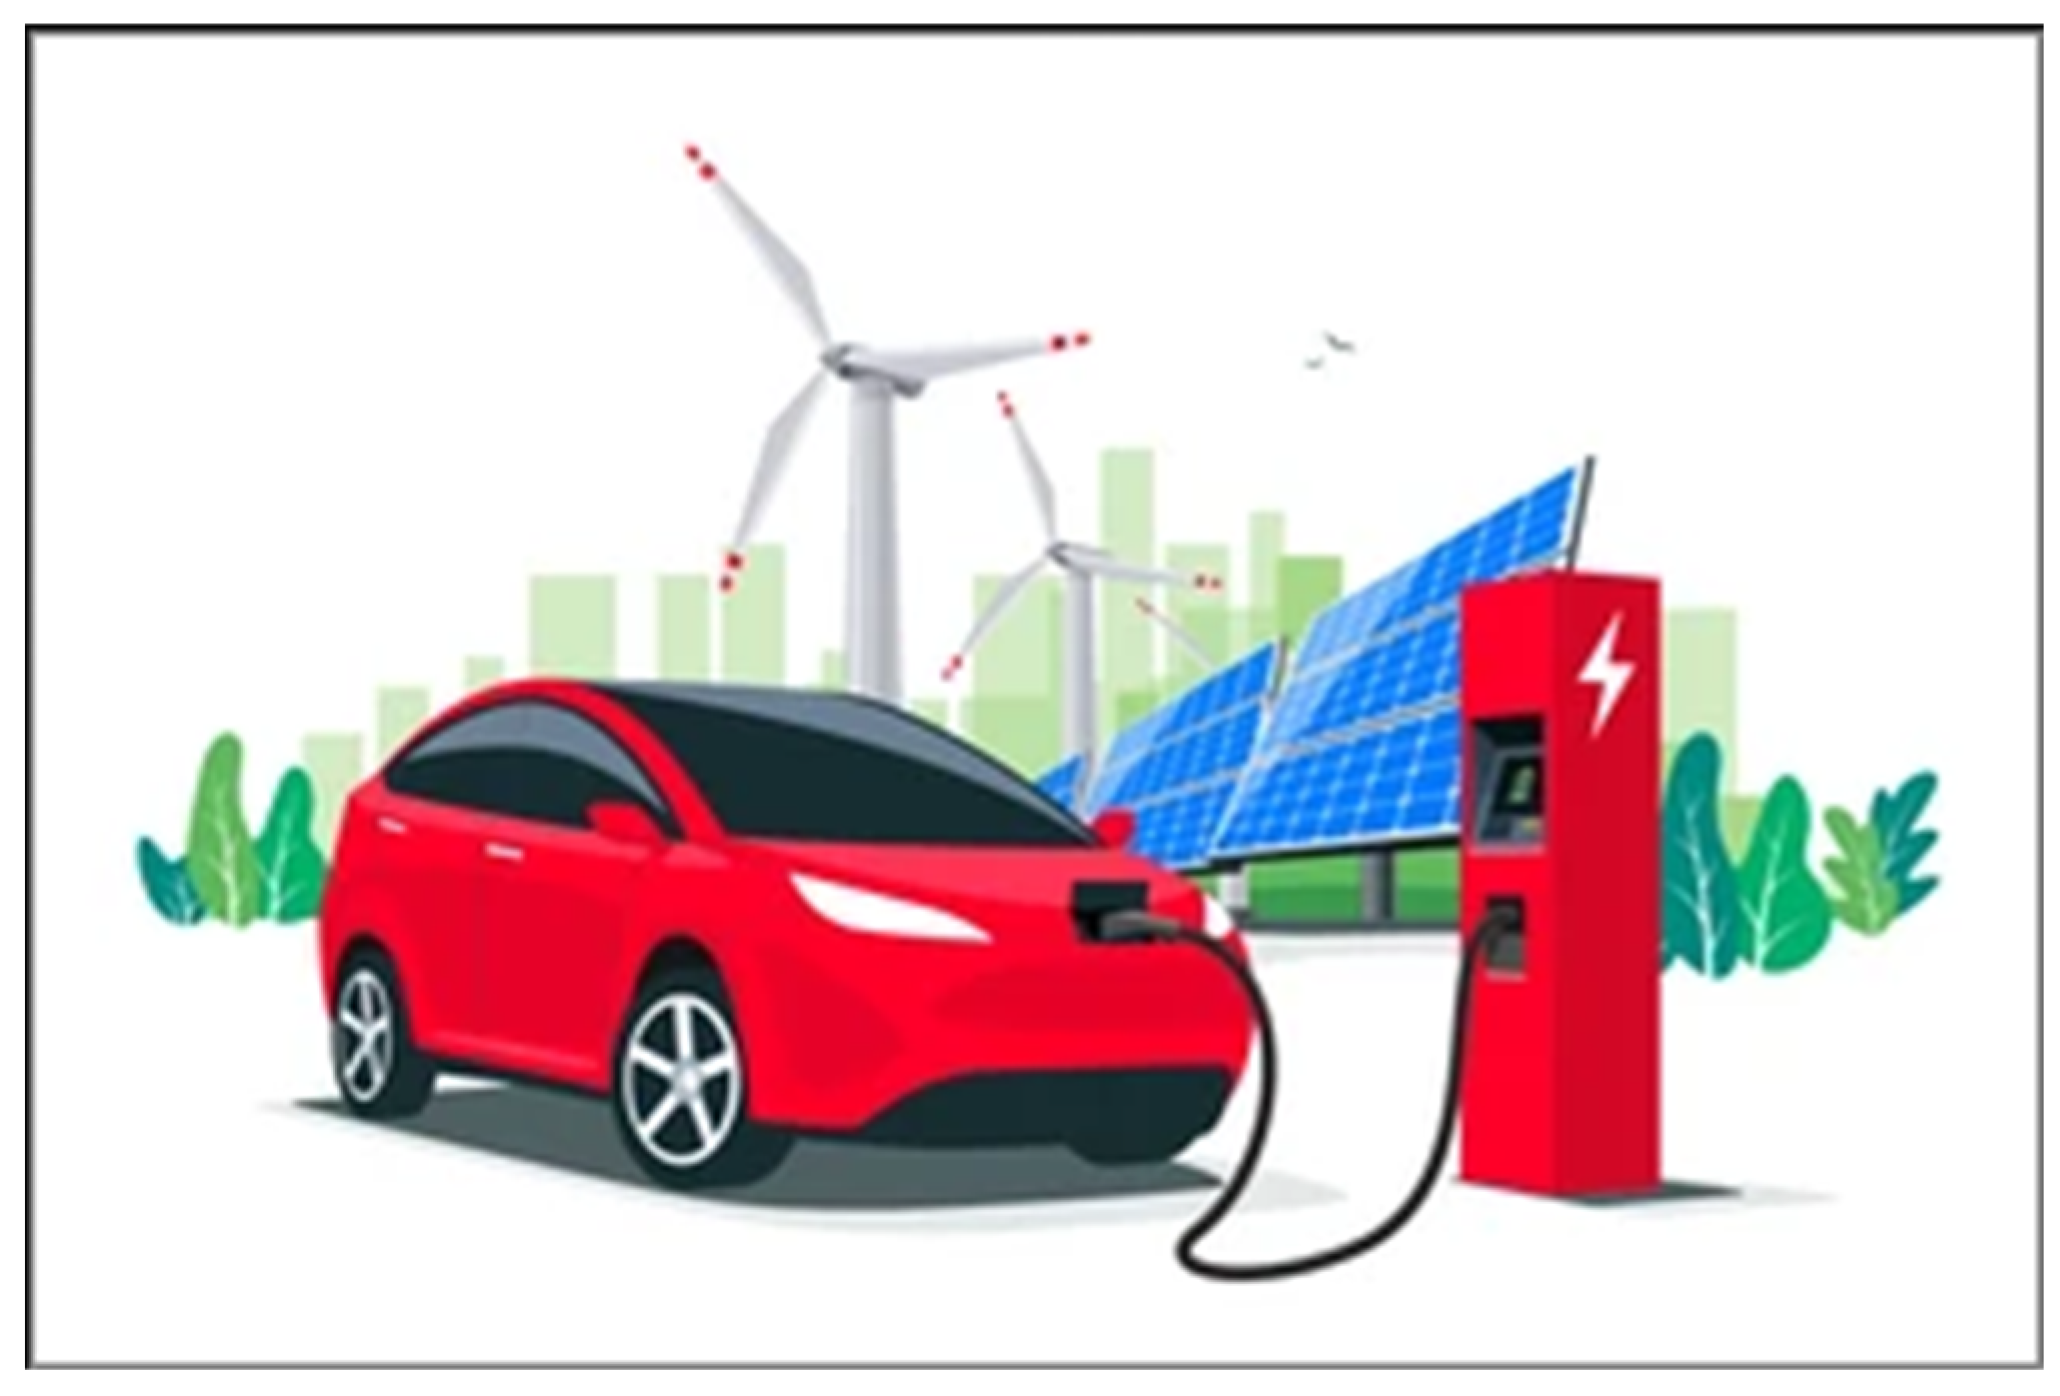
Figure 2.
Flow diagram of proposed DLVB algorithm.
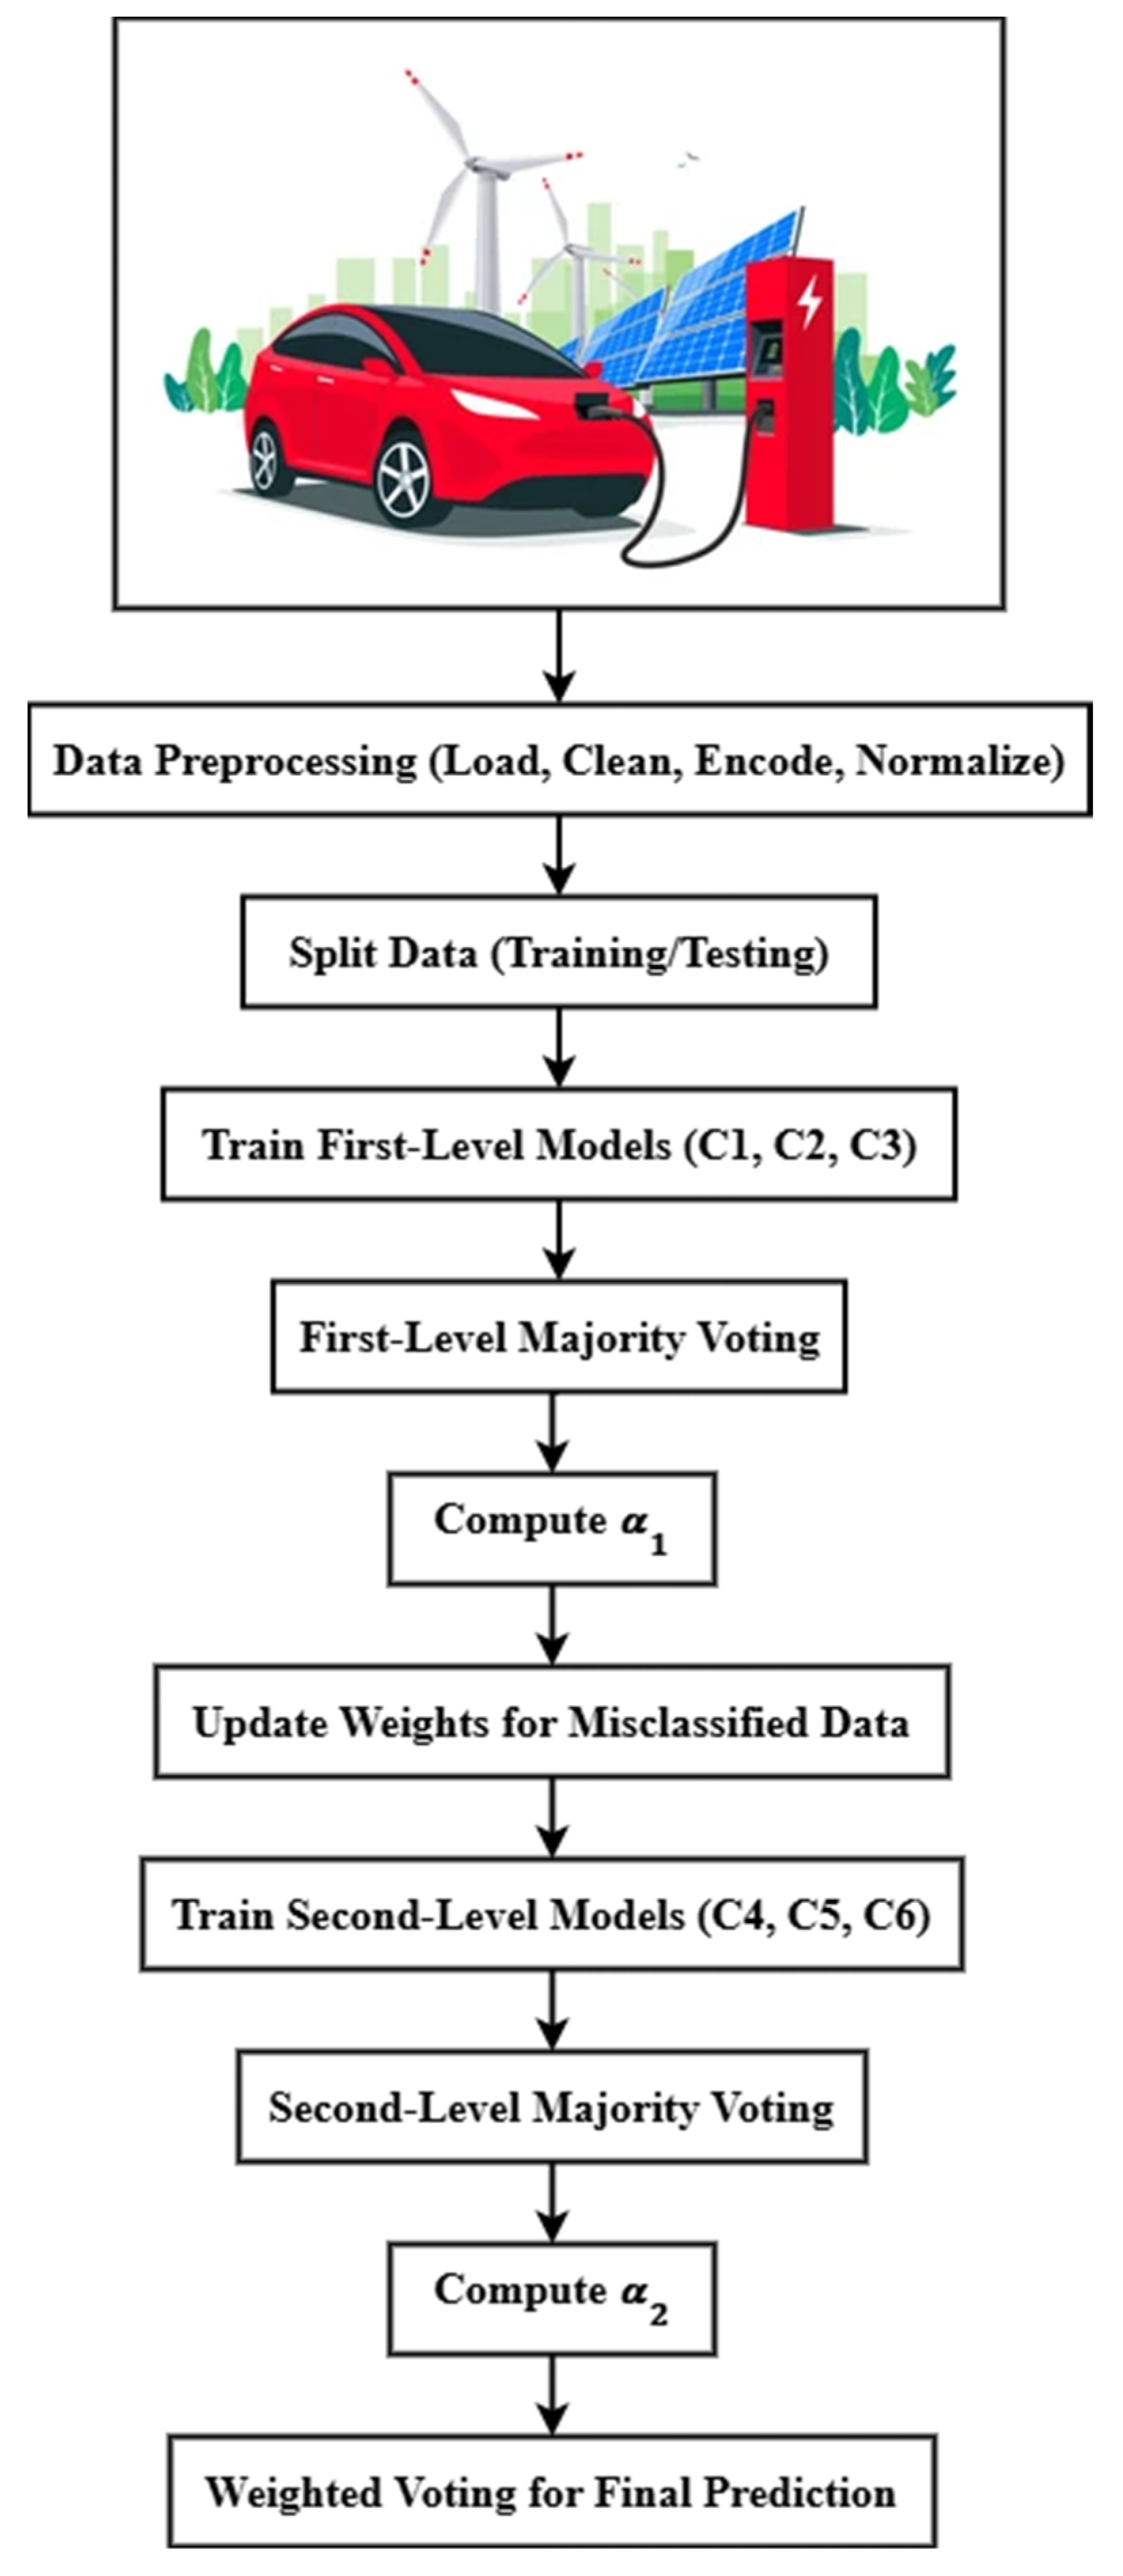
Figure 3.
Accuracy Comparison.
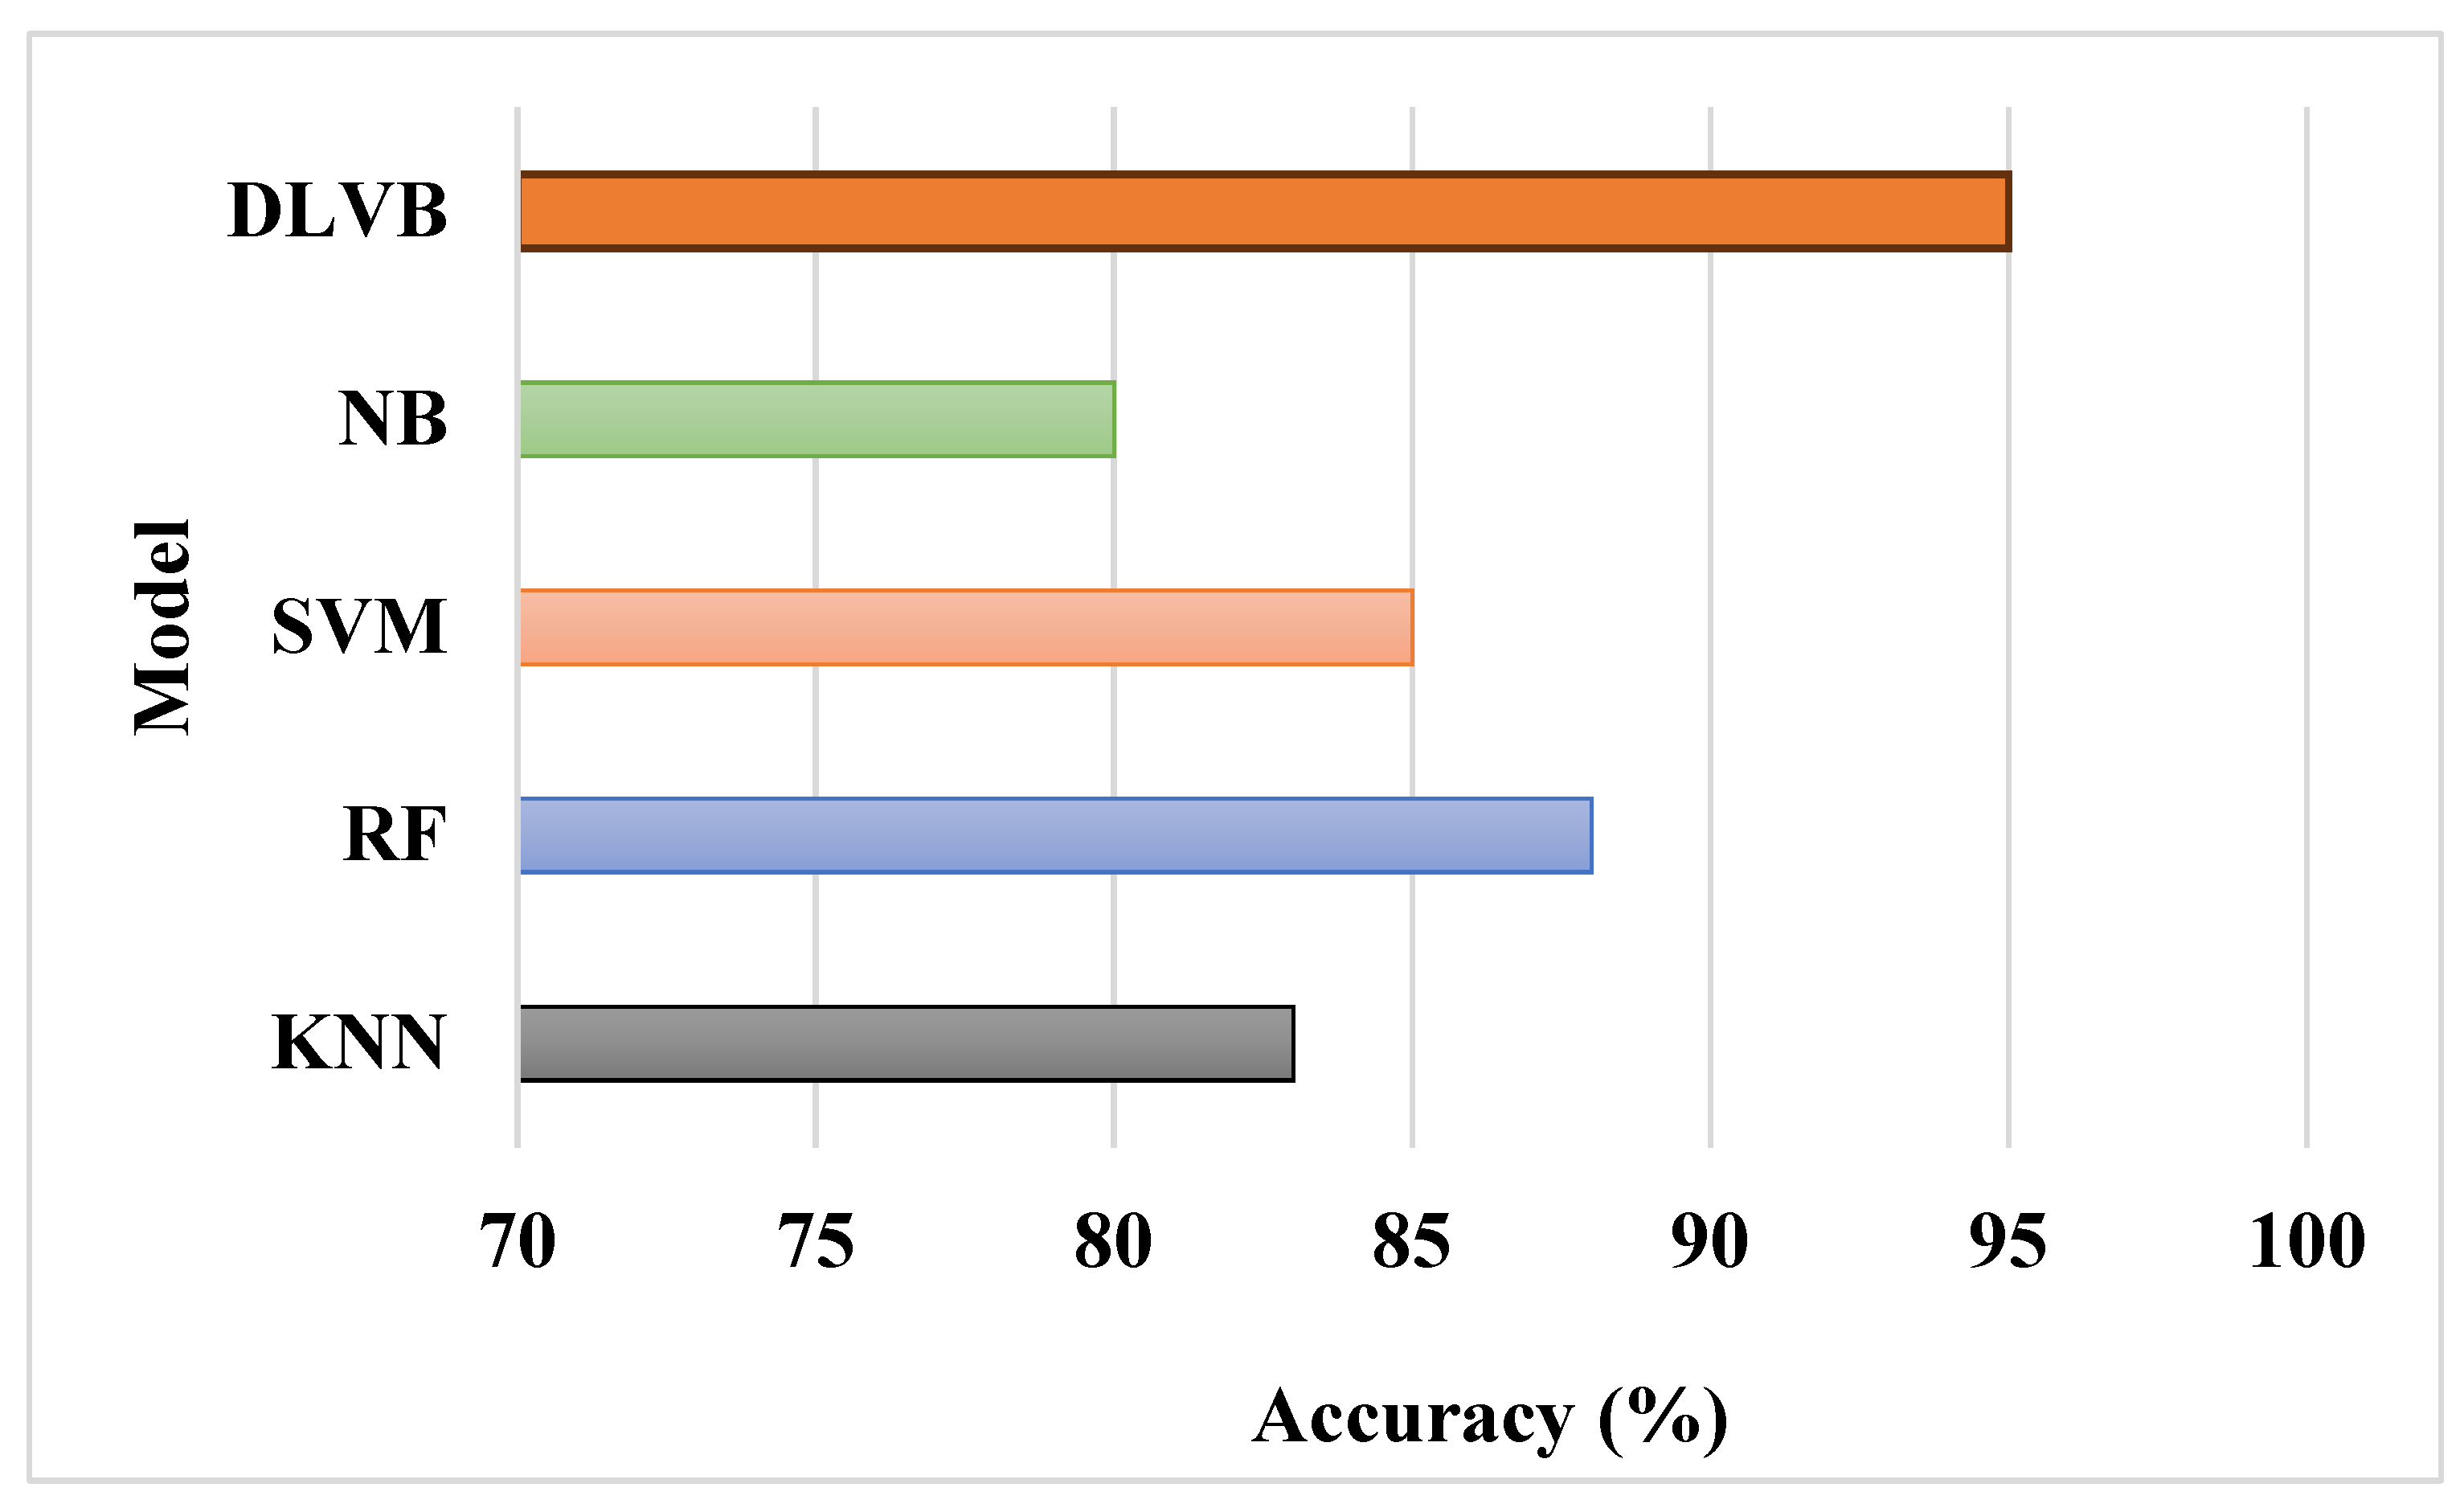
Figure 4.
Precision Comparison.
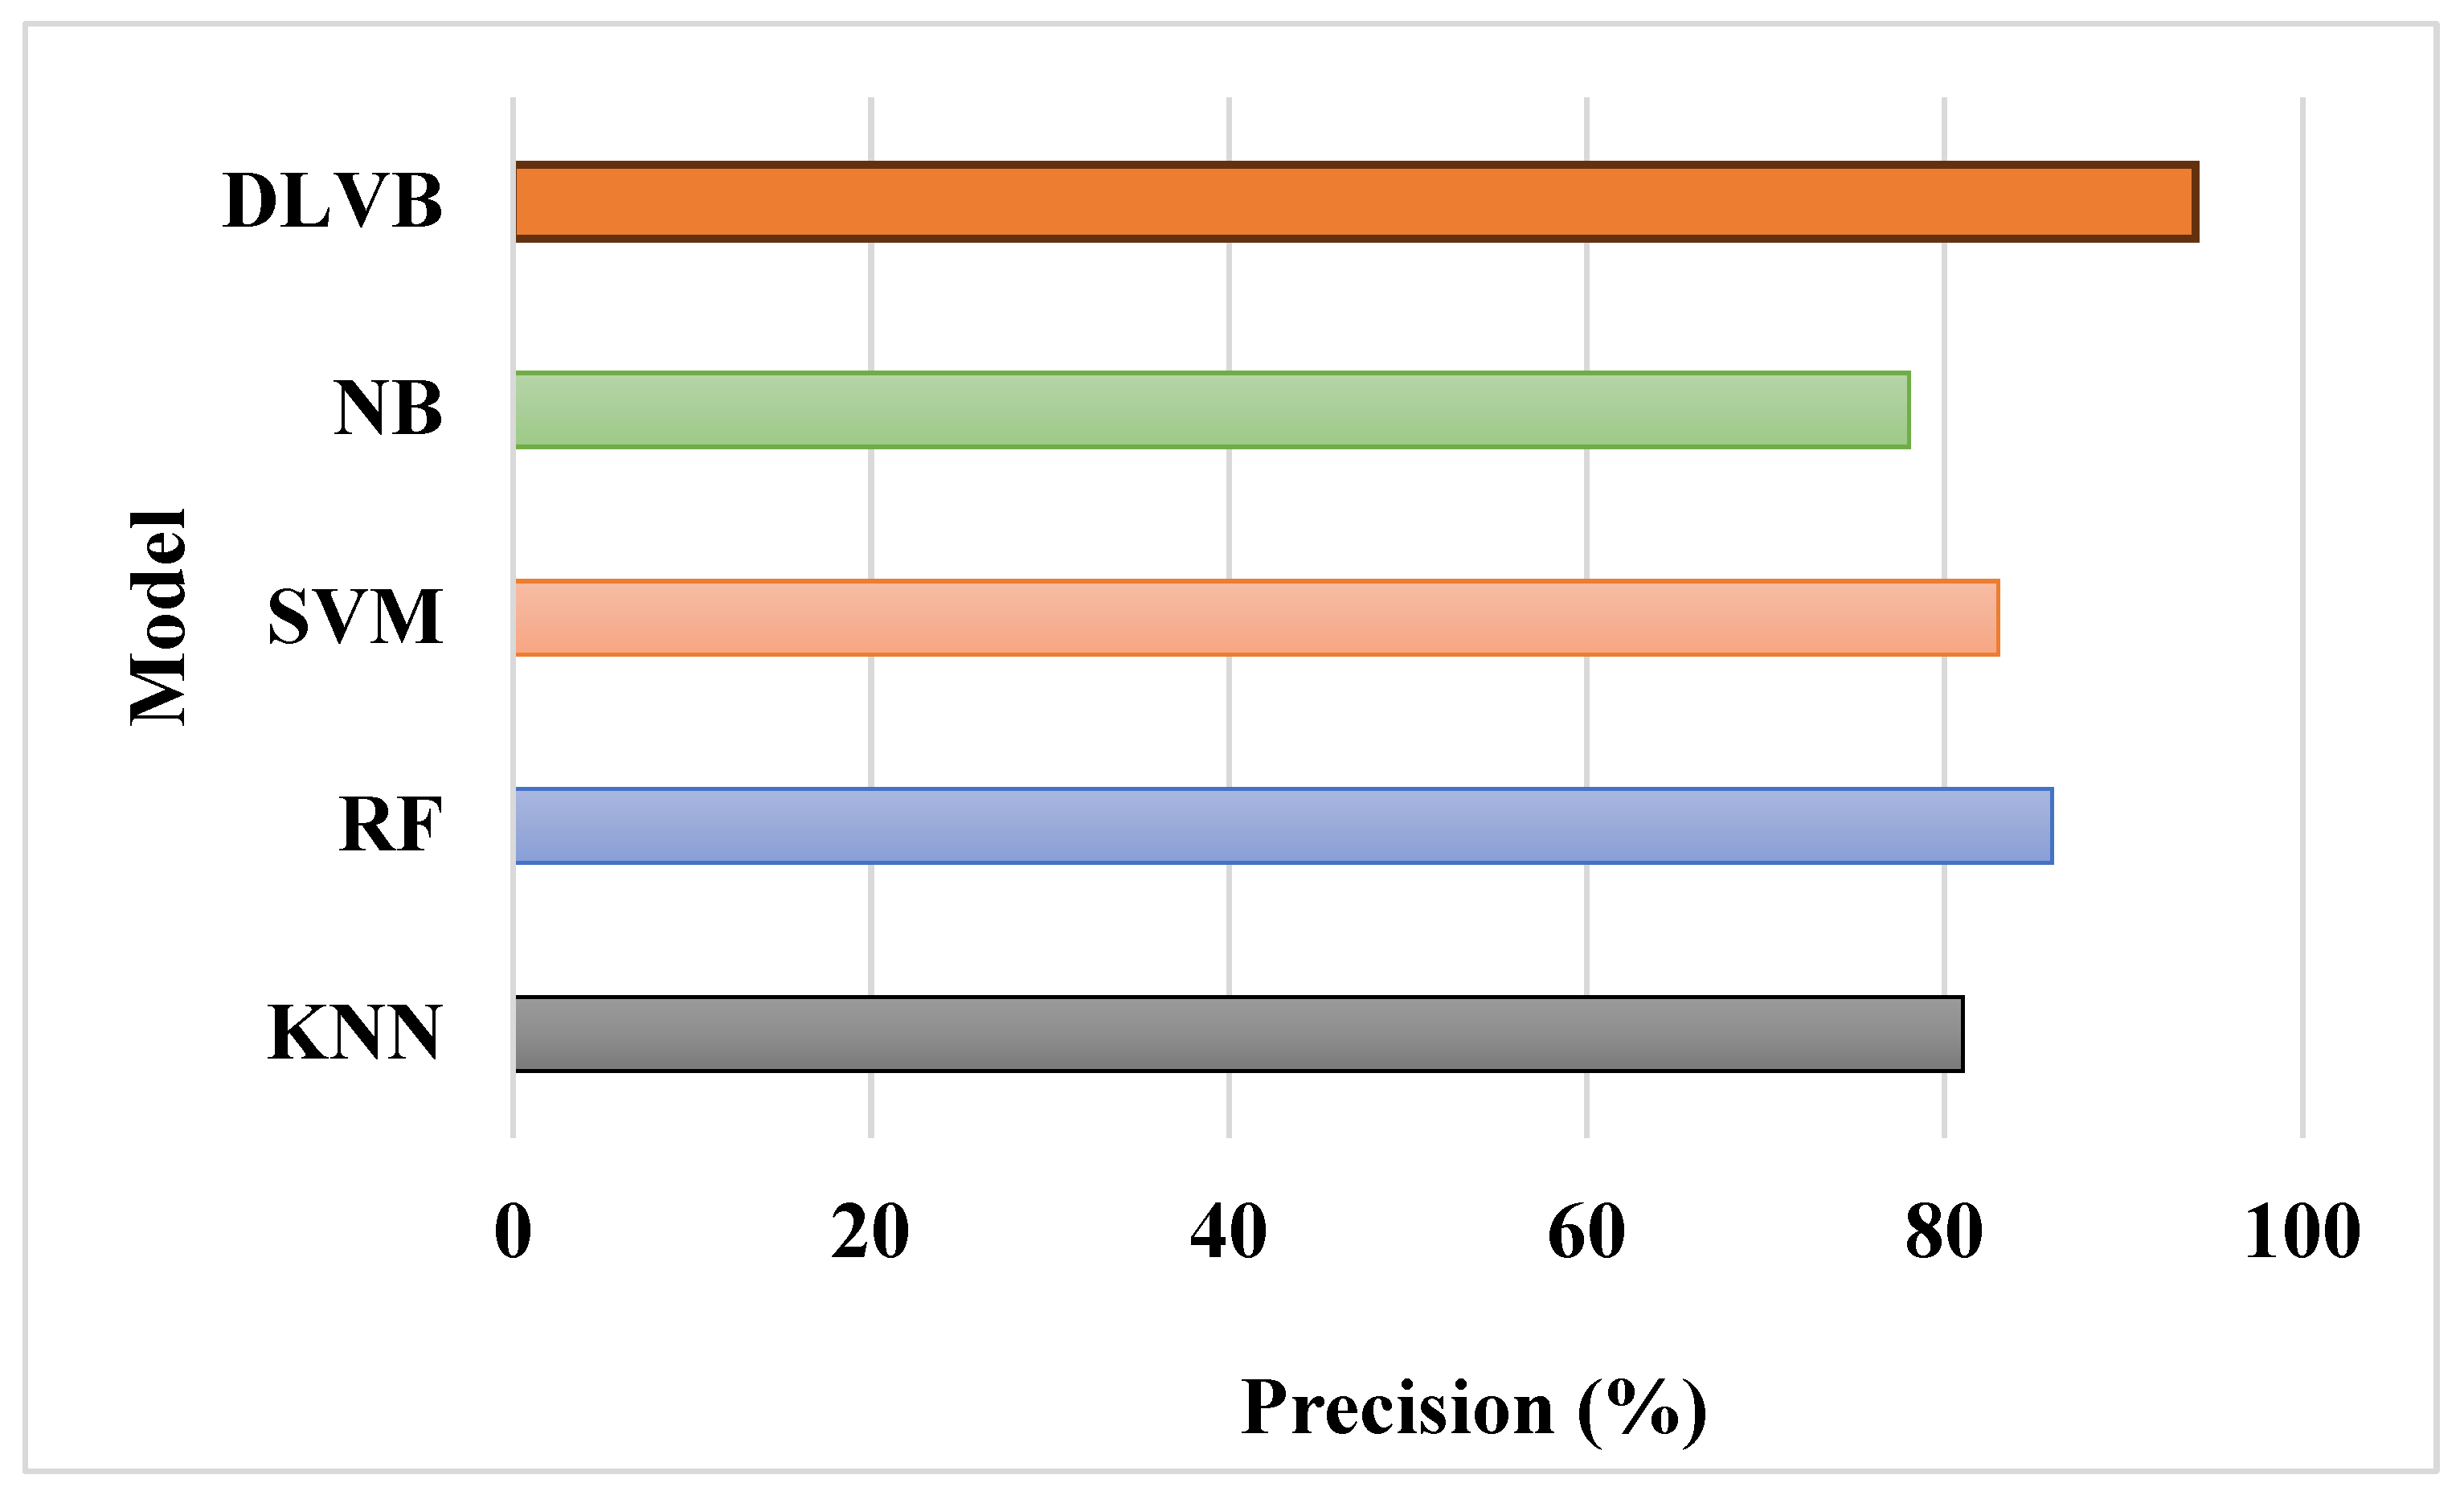
Figure 5.
Recall Comparison.
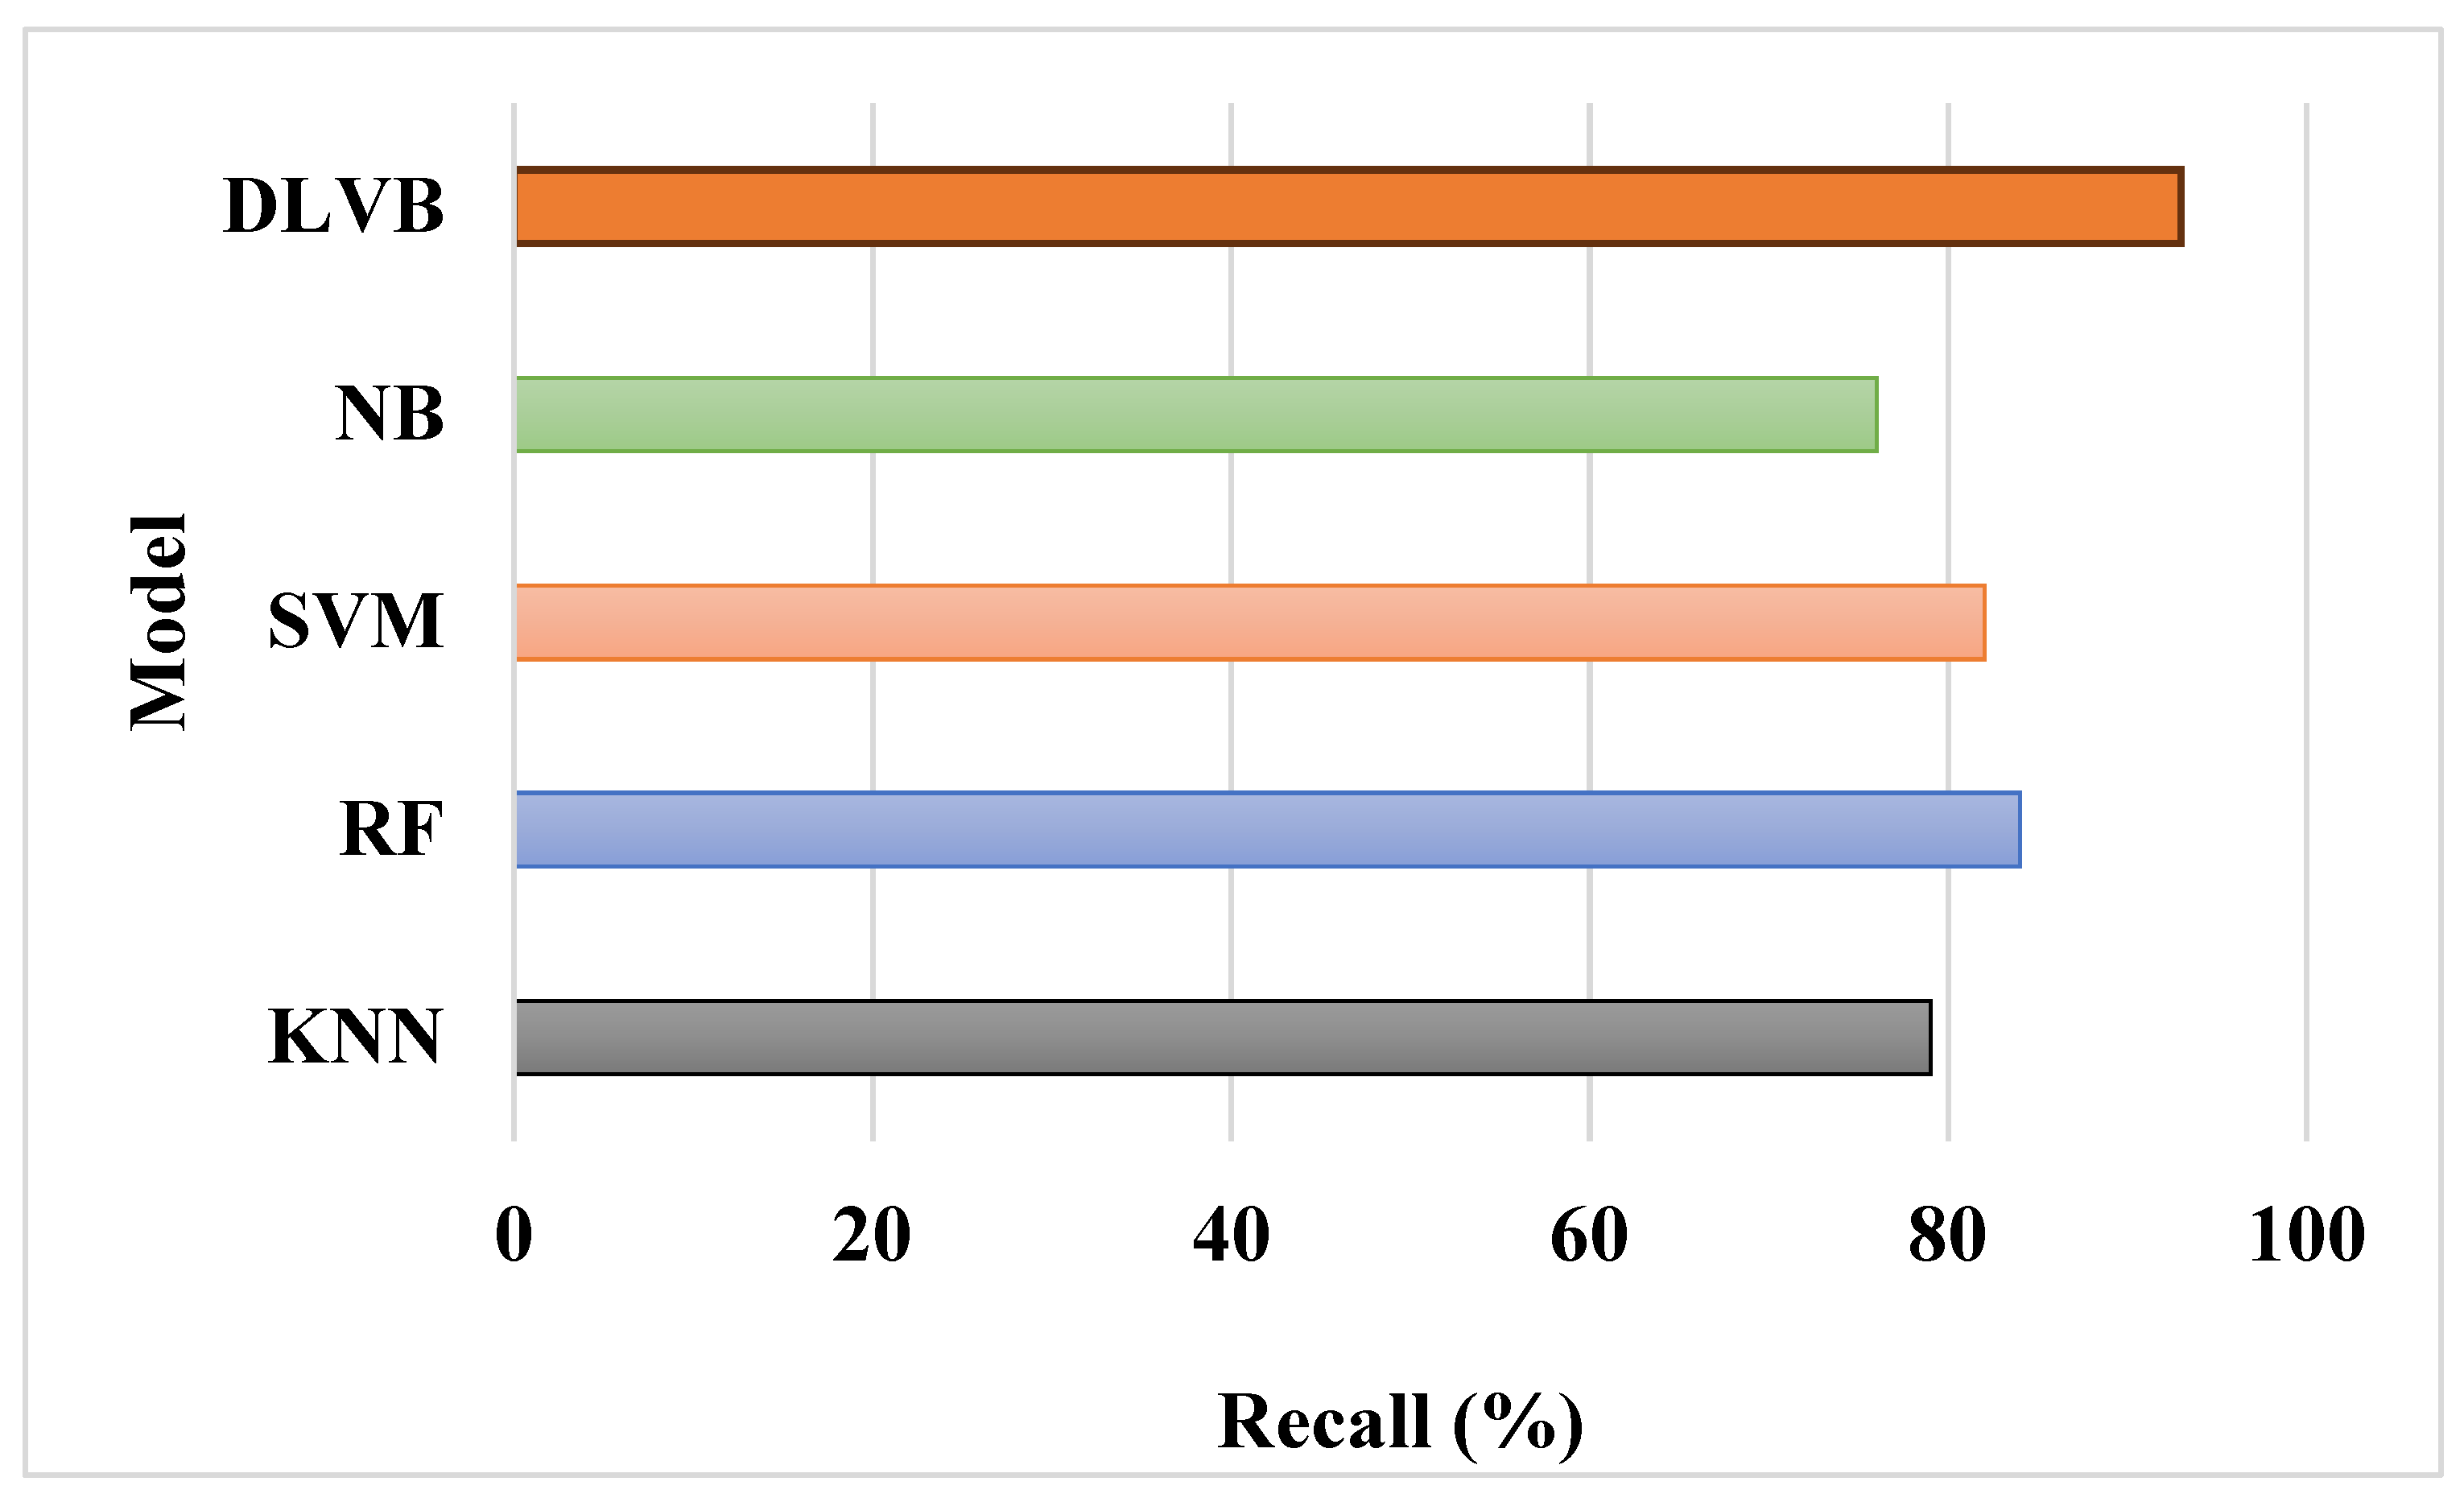
Figure 6.
F1-score Comparison.
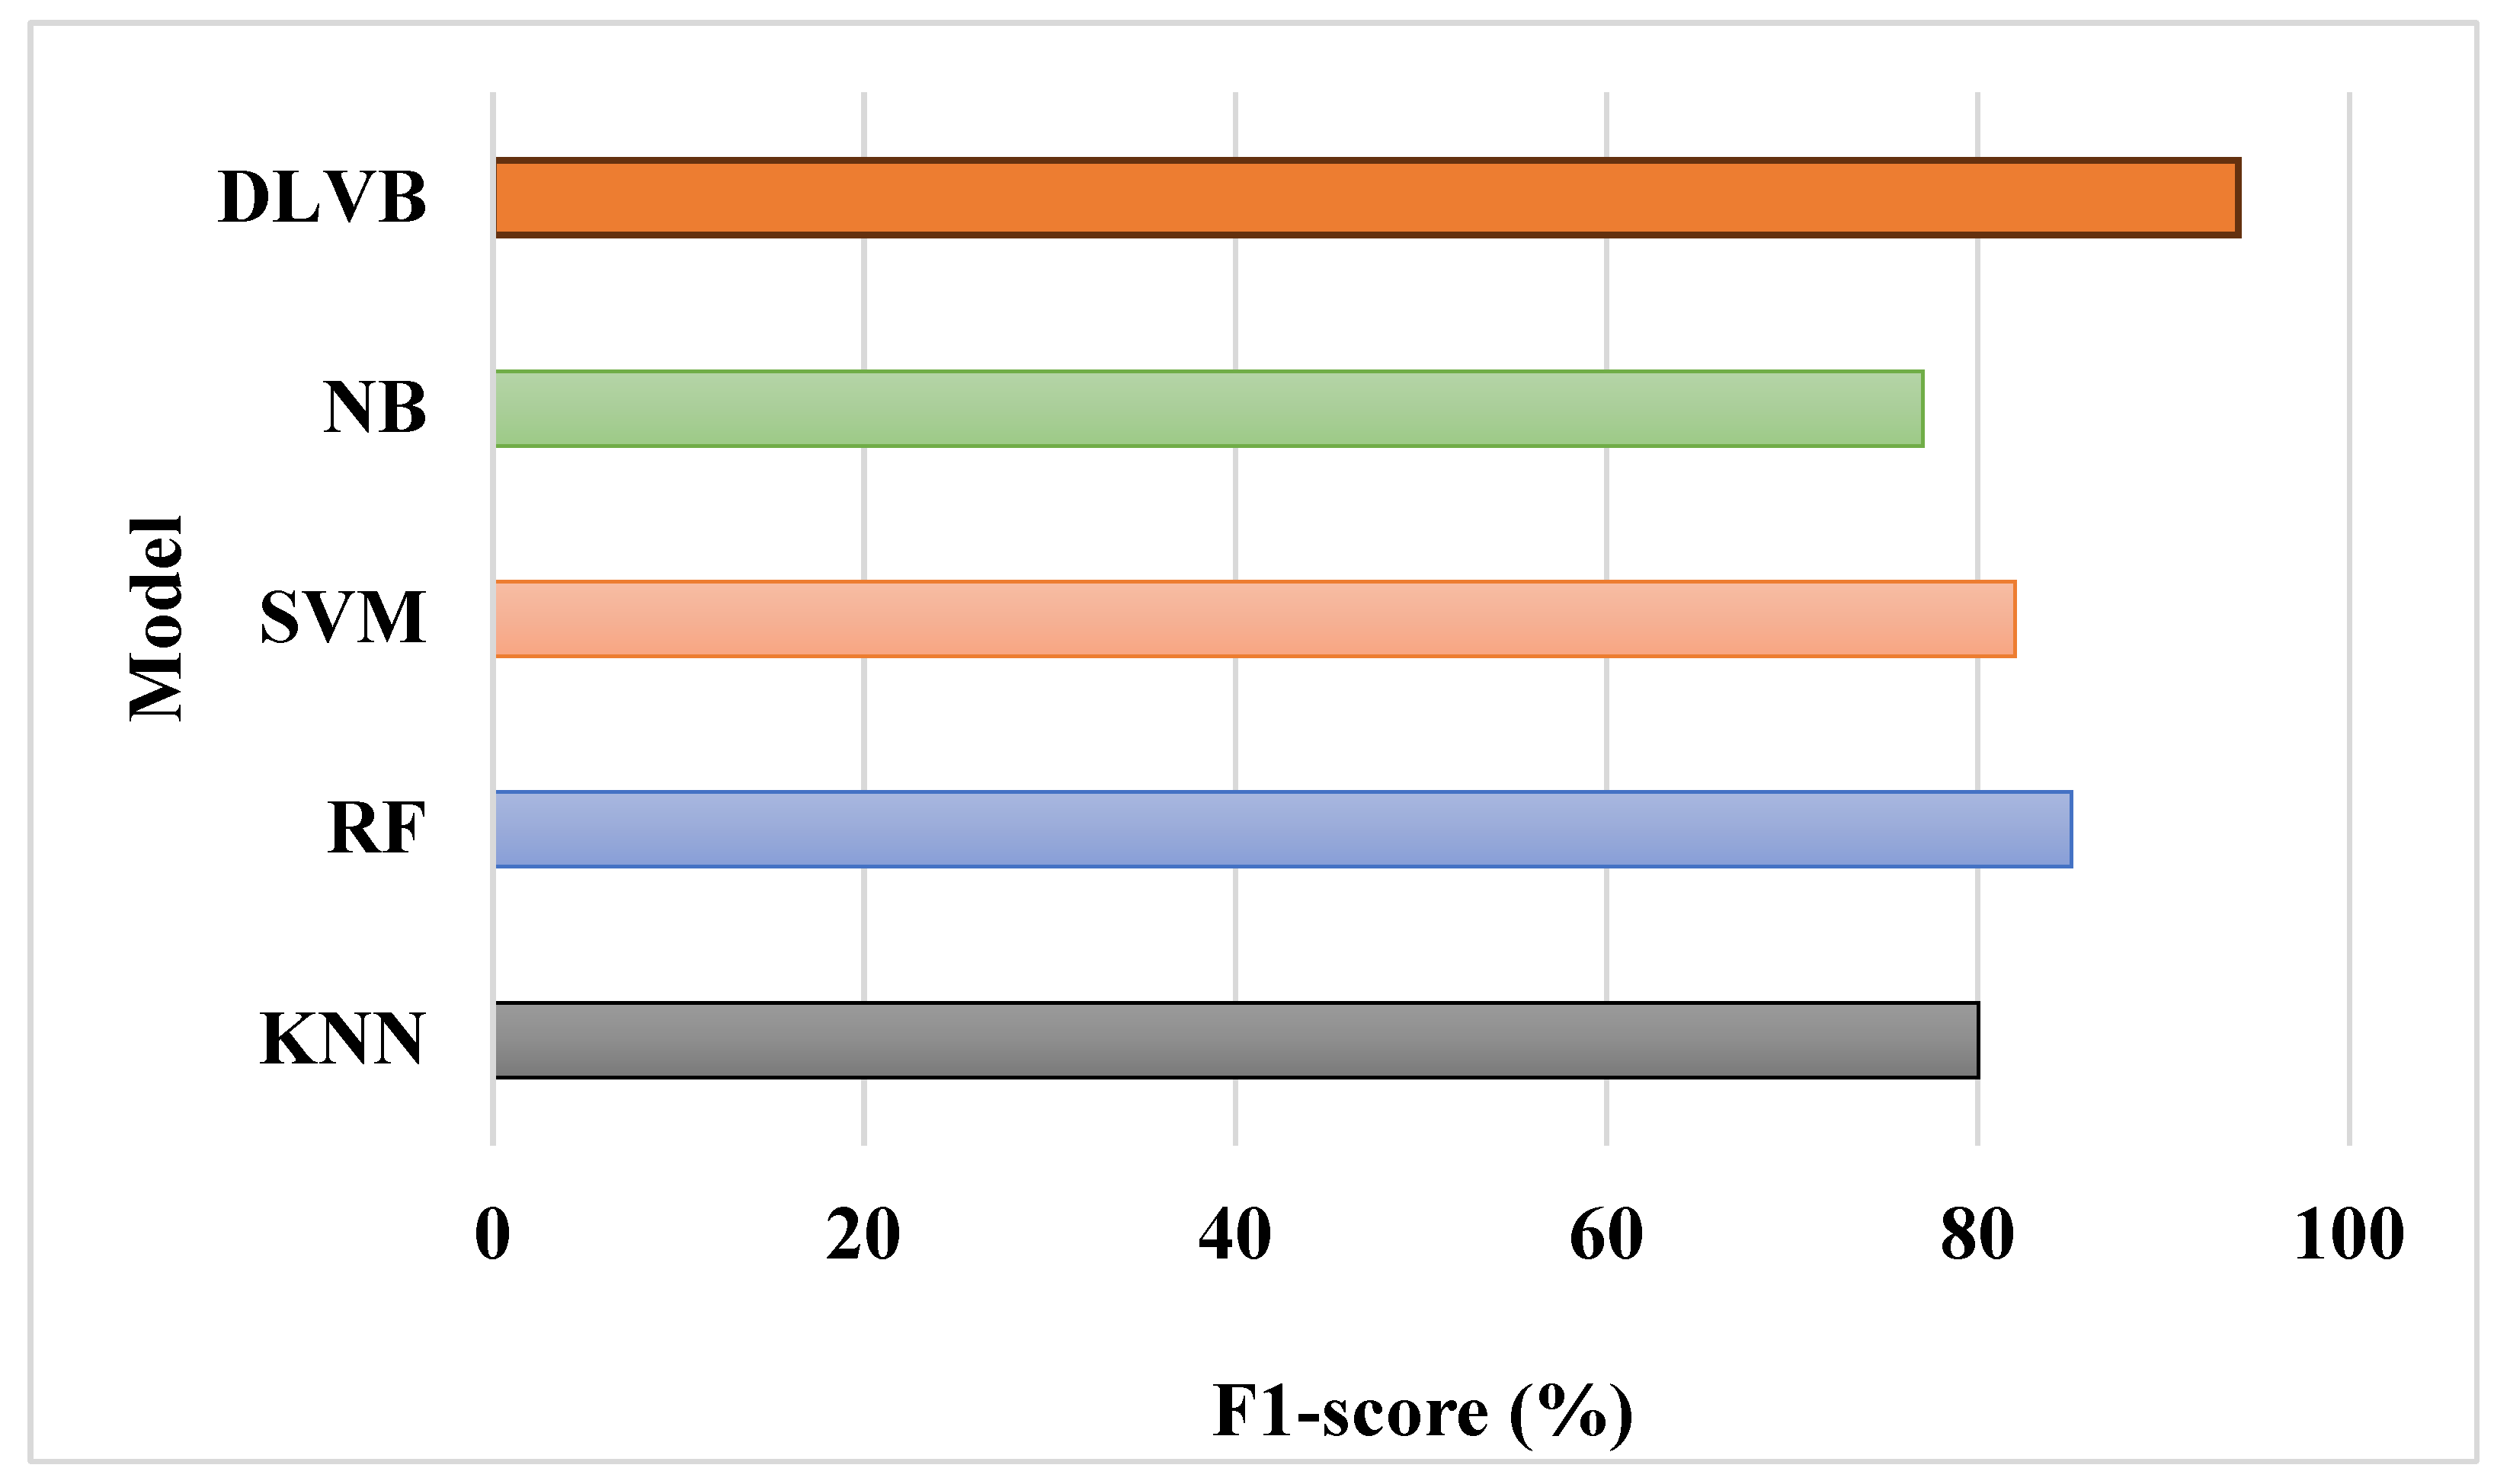
Figure 7.
MCC Comparison.
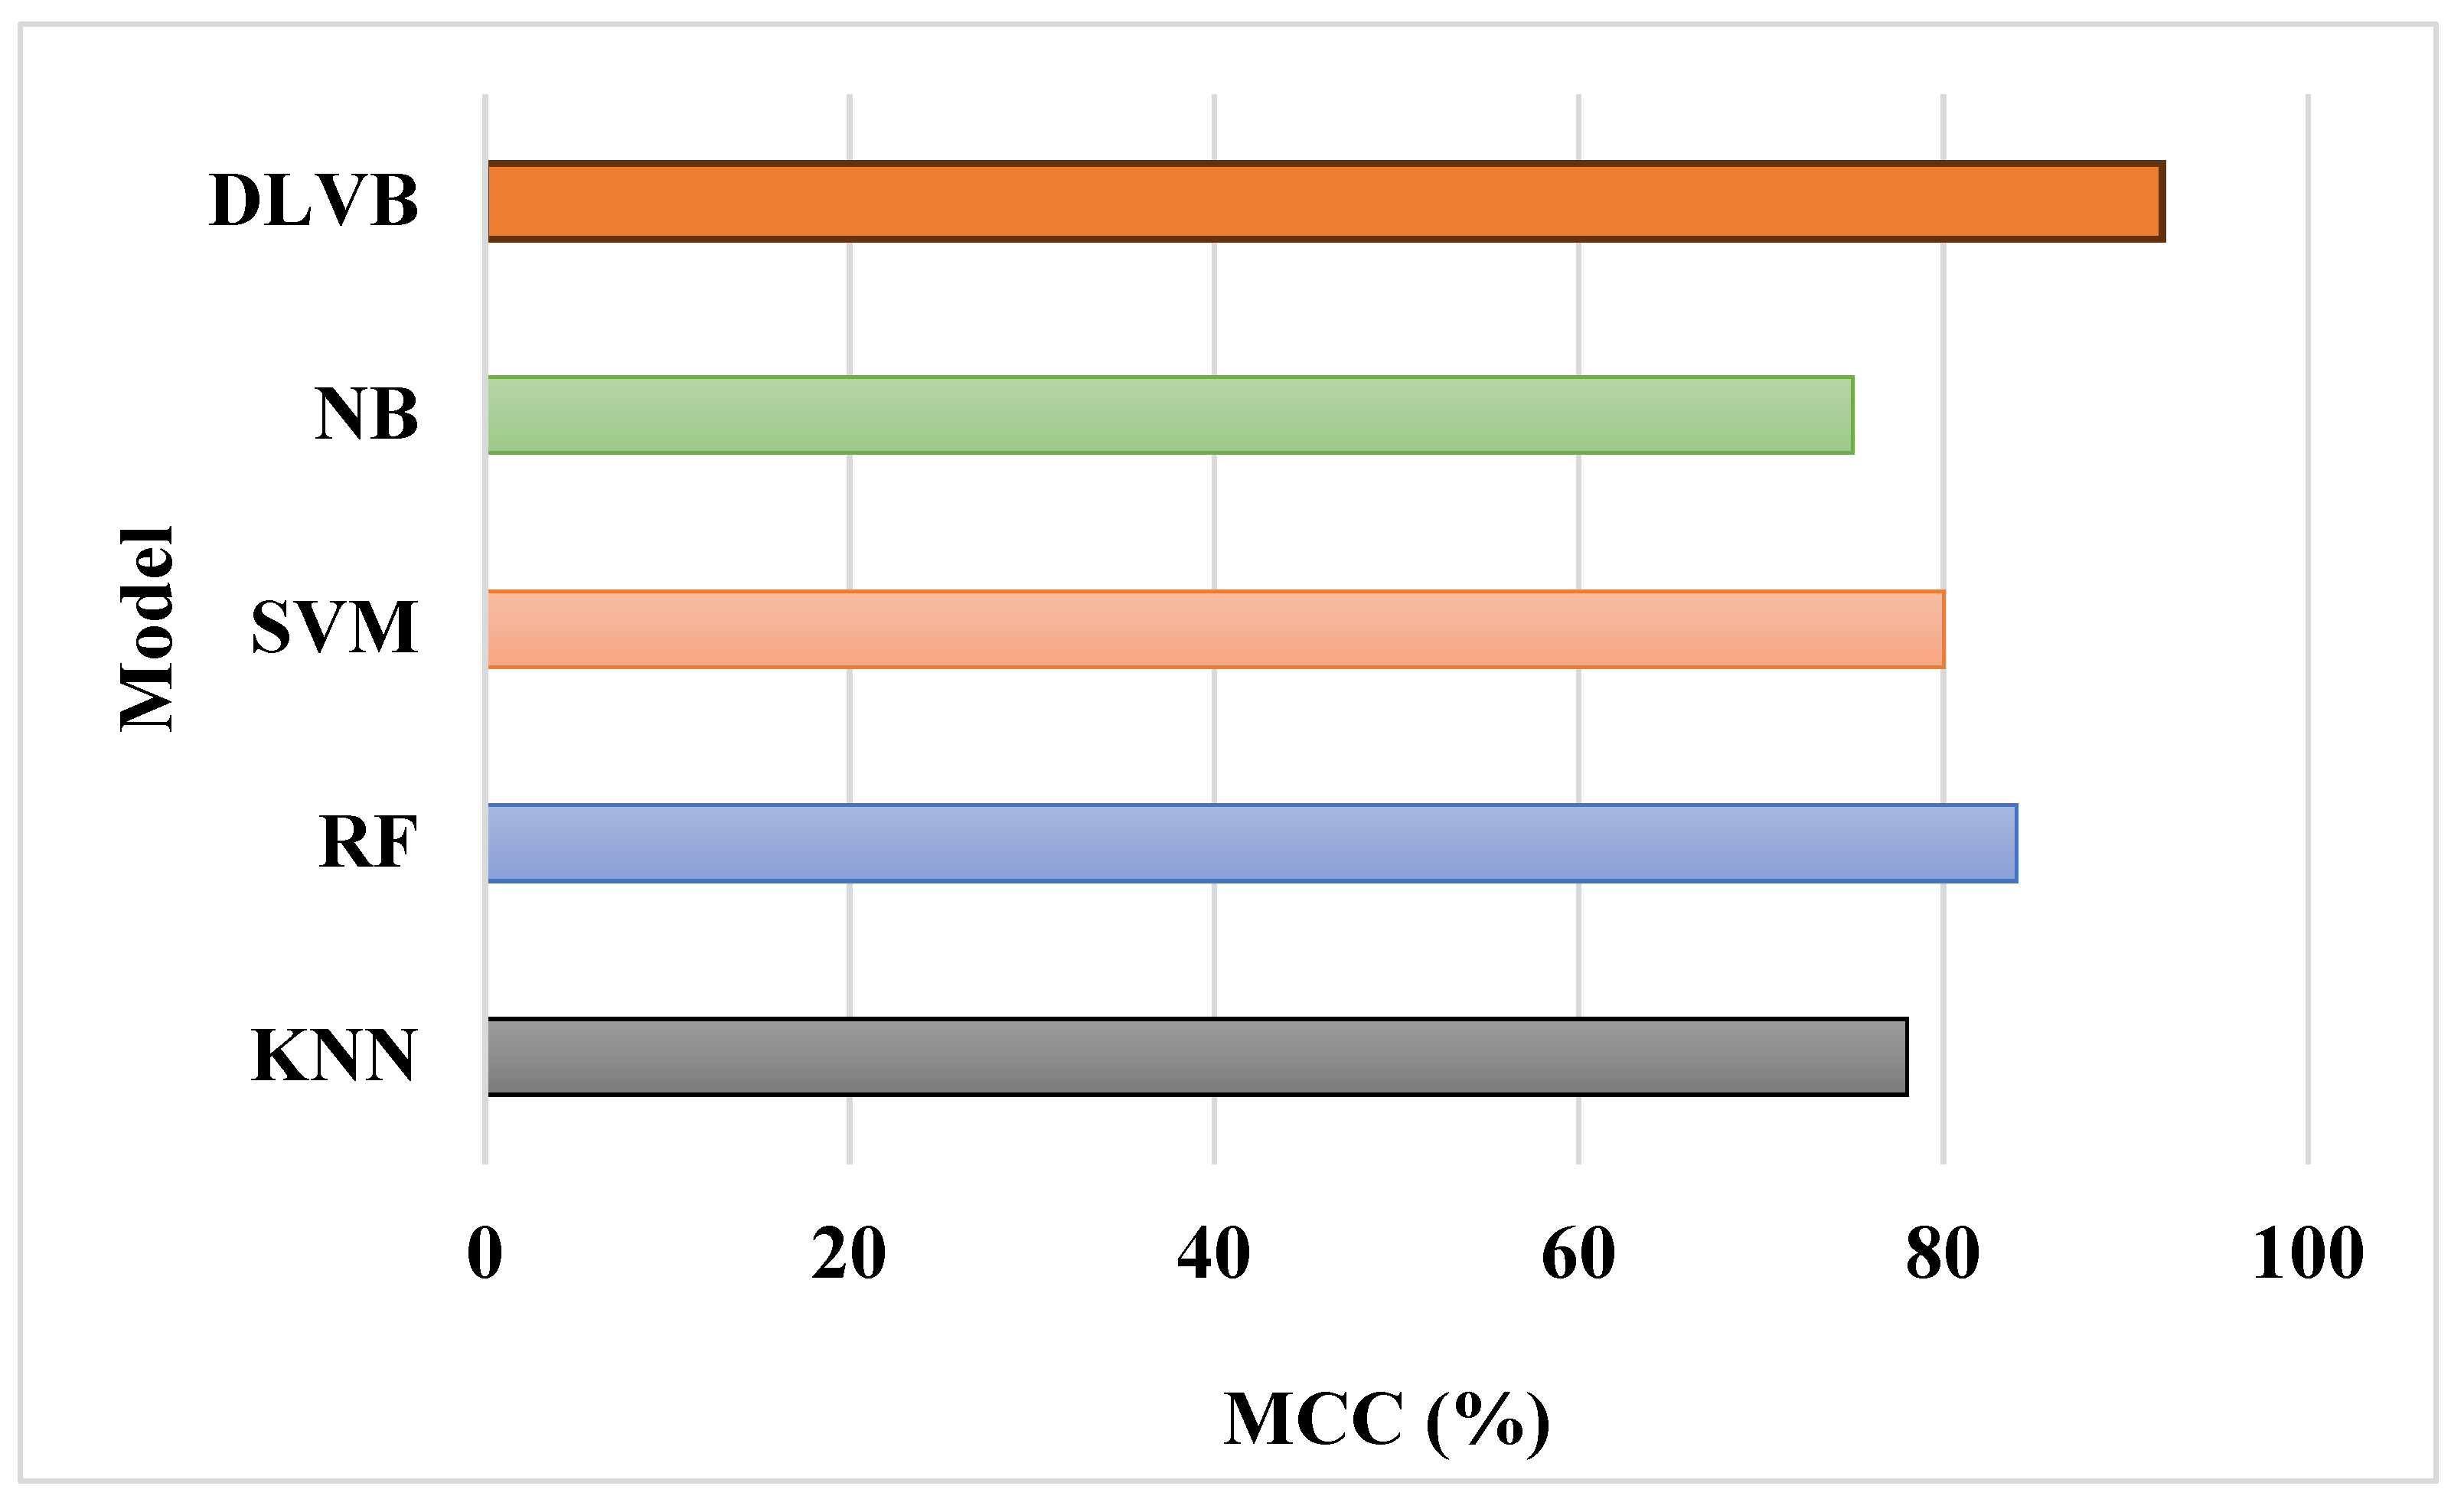
Table 2.
Experimental Setup.
| Component | Specification |
|---|---|
| Processor Model | Intel Core i7-1260P |
| CPU Type | 12-Core Architecture |
| Brand | Aspire 3 |
| Memory (RAM) | 64 GB |
| Clock Speed | 2.1 GHz |
| Operating System | Windows 11 Home |
| L3 Cache Size | 18 MB |
| Software | Python 3.10, Anaconda Spyder |
Table 3.
Performance Metrics Comparison.
| Model | Accuracy (%) | Precision (%) | Recall (%) | F1-score (%) | MCC (%) |
|---|---|---|---|---|---|
| KNN | 83 | 81 | 79 | 80 | 78 |
| RF | 88 | 86 | 84 | 85 | 84 |
| SVM | 85 | 83 | 82 | 82 | 80 |
| NB | 80 | 78 | 76 | 77 | 75 |
| DLVB | 95 | 94 | 93 | 94 | 92 |
Disclaimer/Publisher’s Note: The statements, opinions and data contained in all publications are solely those of the individual author(s) and contributor(s) and not of MDPI and/or the editor(s). MDPI and/or the editor(s) disclaim responsibility for any injury to people or property resulting from any ideas, methods, instructions or products referred to in the content. |
© 2025 by the authors. Licensee MDPI, Basel, Switzerland. This article is an open access article distributed under the terms and conditions of the Creative Commons Attribution (CC BY) license (http://creativecommons.org/licenses/by/4.0/).
Copyright: This open access article is published under a Creative Commons CC BY 4.0 license, which permit the free download, distribution, and reuse, provided that the author and preprint are cited in any reuse.


